Embed Size (px)
Citation preview

Abstract— In recent years artificial vision research has moved
from focusing on the use of only intensity images to include using depth images, or RGB-D combinations due to the recent development of low cost depth cameras. However, depth images require a lot of storage and processing requirements. In addition, it is challenging to extract relevant features from depth images in real-time. Researchers have sought inspiration from biology in order to overcome these challenges resulting in biologically inspired feature extraction methods. By taking inspiration from nature it may be possible to reduce redundancy, extract relevant features, and process an image efficiently by emulating biological visual processes. In this paper, we present a depth and intensity image feature extraction approach that has been inspired by biological vision systems. Through the use of biologically inspired spiking neural networks we emulate functional computational aspects of biological visual systems. Results demonstrate that the proposed bio-inspired artificial vision system has increased performance over existing computer vision feature extraction approaches.
Index Terms— depth image, spiking neural network, bio-inspired imaging
I. INTRODUCTION he widespread availability of low cost consumer devices such as the ASUS Wavi-Xtion or Microsoft Kinect has
seen their use go beyond the original gaming application areas; researchers have sought to take advantage of the capability of the camera to capture not only depth but also colour (RGB) and intensity images, making them a popular platform for many application areas. In previous research, depth sensing technologies have been used in areas as diverse as navigation, surveillance, robotics, object recognition and human interaction [1, 2, 3, 4]. Depth imaging is particularity important in these domains as it can be effectively used to obtain a reliable description of a 3-dimensional scene, an important benefit when considering the application areas. Depth sensing technology is not a recent innovation. Indeed, the idea of creating a depth image has been experimented with for quite a number of years, and different technologies are Submitted on 5 February 2016 for review. Revised versions submitted on 12 January 2018. The research leading to these results has received funding from the European Union Seventh Framework Programme (FP7-ICT-2011.9.11) under grant number [600954] (“VISUALISE").
D. Kerr and S. Coleman are with the Intelligent Systems Research Centre, School of Computing and Intelligent Systems, University of Ulster, UK. e-mail: [email protected]. T. M. McGinnity is with both the Intelligent Systems Research Centre, School of Computing and Intelligent Systems, University of Ulster and the School of Science and Technology, Nottingham Trent University, UK, email: [email protected].
used to obtain a depth description of a scene or object. The introduction of depth sensing technology in the games industry has provided researchers with a low-cost depth sensing technology to exploit.
Prior to the introduction of the term depth sensing technology, it was referred to as range imaging, as the image contained the distance (or range) from the camera (or imaging device) to the imaged point in the scene. Whilst the literature contains many references to both range imaging and depth imaging we will use the term depth imaging in line with the use of the modern depth image capture technologies. A depth image is simply a 2-D image where each pixel location contains a distance measurement rather that a pixel intensity. Distances are estimated from the imaging device to surface points or objects within the imaged scene [5]. The main advantage when using a device such as a Kinect to capture images, over the use of a traditional camera, is that it provides additional information in the form of depth measurements, allowing more information within the scene to be recovered [6]. A single depth image only contains information about the surfaces visible from the imaging device and is not capable of producing a 3-dimensional reconstruction of the scene [5].
Existing artificial vision techniques are the result of many years of development, not only for depth images, but also intensity, colour and many other image modalities. Current state-of-the-art artificial vision systems are capable of performing complex tasks like object recognition and face classification [7]. The development of these systems is based on many years of research, from the early work on edge and corner detection [8, 9, 10, 11], to the detection of interest points [12, 13], right through to the detection and classification of objects or faces [7] and image retrieval from huge databases. While artificial vision technologies have made impressive advances in the 70 years they have been in development, when compared with the capability of biological vision systems in processing visual information, they are extremely limited. Indeed, biological vision systems are much better at power consumption, speed of processing, and detection and recognition performance than current artificial vision systems. Based on the performance of biological vision systems, researchers have started to examine and learn from them in order to advance conventional artificial vision systems to the next level [14 - 22]. Most existing biologically inspired approaches to artificial vision are based on second generation neural networks [23]. For example, the well-known “Neocognitron” model is a multi-layered neural network (NN)
Biologically Inspired Intensity and Depth Image Edge Extraction
Dermot Kerr, Sonya Coleman, Member, IEEE, and T. Martin McGinnity Senior Member, IEEE
T

with hierarchical structure that has been used for various image processing tasks [24]. Similarly, the bio-inspired scene classification [25] uses a three-layer neural network to classify scenes based on visual features.
Spiking neural networks (SNN) are considered to be third generation (NNs) which can mimic the biological information processing more accurately than standard NNs within the human brain [26] using spiking neurons and synaptic models of such networks. SNNs could be used to emulate the processing of a biological vision system and for data intensive real-time processing applications [27]. Previous research has explored the application of SNN for artificial vision purposes. For example, segmentation, edge detection [28], contour detection [29], feature detection [14-21] and a depth from motion model [30] based on neuromorphic approaches. In [21] a hierarchical SNN is used for a visual attention system and in [30] for a categorisation system. In [31] image clustering, segmentation and edge detection applications and moving object recognition and EEG data recognition in [32]. A Spiking Deep Belief network is used for visual classification of handwritten digits in [33] and human gesture recognition for robot partners by SNN is investigated in [34]. In [14] we develop a SNN that can detect interest point type features for the purpose of describing local image patches. Other applications of SNN include vision based obstacle avoidance [35, 36], laser-based robot vision [37], robot control [38, 39], UAV control [40], sonar based control [41]. Although such techniques can be readily adapted for use with depth images, none make use of the complementary information available when depth and intensity image data are combined.
Building on the work in [15] where we used a standard SNN for edge detection, we present a feature detection approach which is more closely correlated with the biological visual system through the use of biological plausible receptive fields. The primary objective is biologically inspired simultaneous processing and feature extraction from registered intensity and depth images. The intensity and depth image modalities are combined to produce a single processed output thereby illustrating complementary information from both modalities. Section II presents RGB-D intensity and depth image capture and pre-processing. Section III presents the model of the spiking neuron and Section IV describes the SNN structure, its implementation and the underlaying biological origin of the method. Extracting edges from both RGB and depth images, requires careful consideration regarding thresholding and this is described in Section IV. Section V presents a visual comparison and experimental results, while the conclusion is presented in Section VI.
II. DEPTH PERCEPTION AND RGB-D IMAGE CAPTURE Biological visual perception is typically generated from
variation in depth cues that may be defined as either monocular or binocular cues. Even more interestingly some biological systems, such as the Mantis Shrimp [42], have developed alternative techniques for visual acquisition of depth information.
In artificial vision, RGB-D cameras are used as an effective
method of computing depth information. In Figure 1 we illustrate examples of intensity images and the corresponding depth images captured using an RGB-D camera. The intensity image is used in it’s standard grey-scale format and the depth image is converted to an intensity image where the darker regions represent measurements close to the RGB-D camera and the lighter regions represent those further away. Locations with missing measurements are visualised as black areas. Hence, we do not strictly use RGB-D data but instead the images are converted to standard greyscale intensity image
data.
III. SPIKING NETWORK STRUCTURE AND BIOLOGICAL BASIS Recent research discusses neuronal circuits which detect
characteristics that are present in all visual system stages such as orientation and motion, from the retina through to the visual cortex [43]. This section describes how we take inspiration from these findings, discussing the spiking neuron model and the SNN design.
A. SNN Design Hierarchical visual processing models are based on
networks of different types of cells [44] and used to describe biological vision systems. Photoreceptors detect light within the biological retina and corresponding signals are further processed within the various retinal layers onto the lateral geniculate nucleus (LGN) and ultimately the visual cortex. Receptive fields (RF) known as centre–surround that tend to strongly respond to changes in contrast are formed by some neurons within the retina and lateral geniculate nucleus. Combinations of these cells, result in orientation specific cells,
(a)
(b)
Fig. 1. Example (a) RGB image and (b) Depth image captured with RGB-D style camera (from [9]).
called simple cells, which may detect features of a specific orientation such as orientated lines, bars or edges. These are subsequently inputs to more complex cells that can detect more complex features.
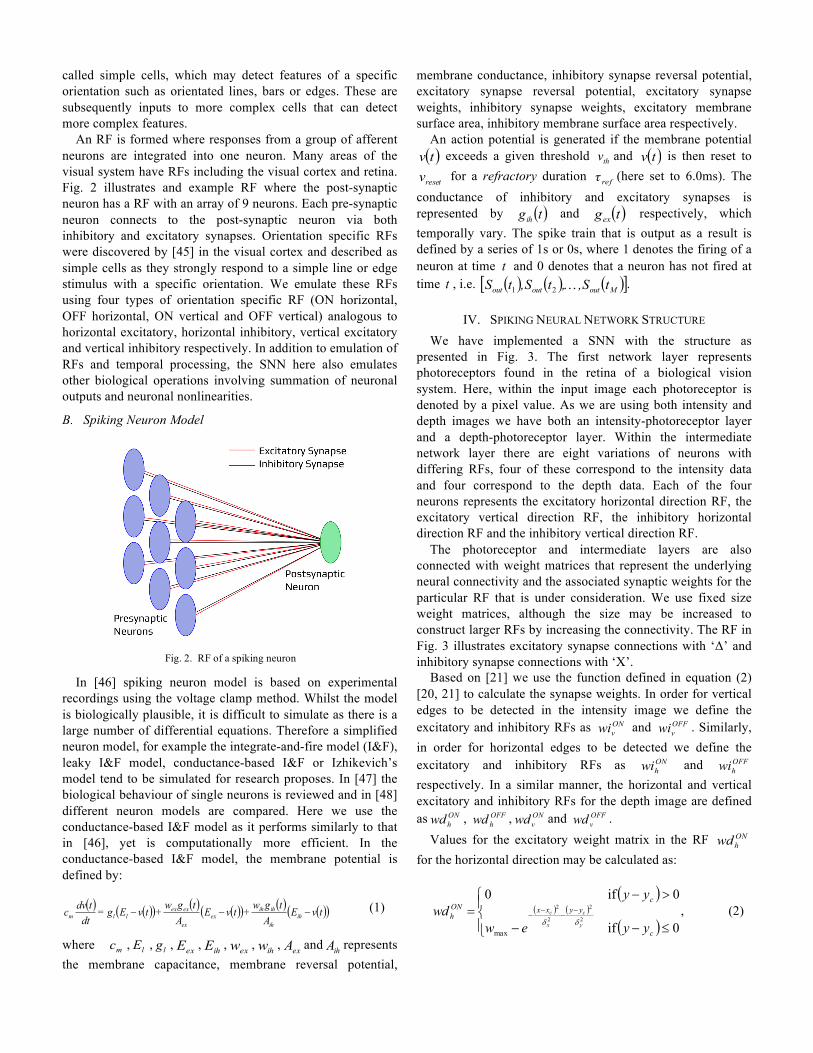
An RF is formed where responses from a group of afferent neurons are integrated into one neuron. Many areas of the visual system have RFs including the visual cortex and retina. Fig. 2 illustrates and example RF where the post-synaptic neuron has a RF with an array of 9 neurons. Each pre-synaptic neuron connects to the post-synaptic neuron via both inhibitory and excitatory synapses. Orientation specific RFs were discovered by [45] in the visual cortex and described as simple cells as they strongly respond to a simple line or edge stimulus with a specific orientation. We emulate these RFs using four types of orientation specific RF (ON horizontal, OFF horizontal, ON vertical and OFF vertical) analogous to horizontal excitatory, horizontal inhibitory, vertical excitatory and vertical inhibitory respectively. In addition to emulation of RFs and temporal processing, the SNN here also emulates other biological operations involving summation of neuronal outputs and neuronal nonlinearities.
B. Spiking Neuron Model
In [46] spiking neuron model is based on experimental recordings using the voltage clamp method. Whilst the model is biologically plausible, it is difficult to simulate as there is a large number of differential equations. Therefore a simplified neuron model, for example the integrate-and-fire model (I&F), leaky I&F model, conductance-based I&F or Izhikevich’s model tend to be simulated for research proposes. In [47] the biological behaviour of single neurons is reviewed and in [48] different neuron models are compared. Here we use the conductance-based I&F model as it performs similarly to that in [46], yet is computationally more efficient. In the conductance-based I&F model, the membrane potential is defined by:
( ) ( )( ) ( ) ( )( ) ( ) ( )( )tvEAtgw+tvE
Atgw+tvEg=
dttdvc ih
ih
ihihex
ex
exexllm ---
(1)
where mc , lE , lg , exE , ihE , exw , ihw , exA and ihA represents the membrane capacitance, membrane reversal potential,
membrane conductance, inhibitory synapse reversal potential, excitatory synapse reversal potential, excitatory synapse weights, inhibitory synapse weights, excitatory membrane surface area, inhibitory membrane surface area respectively.
An action potential is generated if the membrane potential ( )tv exceeds a given threshold thv and ( )tv is then reset to
resetv for a refractory duration refτ (here set to 6.0ms). The conductance of inhibitory and excitatory synapses is represented by ( )tgih and ( )tgex respectively, which temporally vary. The spike train that is output as a result is defined by a series of 1s or 0s, where 1 denotes the firing of a neuron at time t and 0 denotes that a neuron has not fired at time t , i.e. ( ) ( ) ( )[ ]Moutoutout tS,,tS,tS …21 .
IV. SPIKING NEURAL NETWORK STRUCTURE We have implemented a SNN with the structure as
presented in Fig. 3. The first network layer represents photoreceptors found in the retina of a biological vision system. Here, within the input image each photoreceptor is denoted by a pixel value. As we are using both intensity and depth images we have both an intensity-photoreceptor layer and a depth-photoreceptor layer. Within the intermediate network layer there are eight variations of neurons with differing RFs, four of these correspond to the intensity data and four correspond to the depth data. Each of the four neurons represents the excitatory horizontal direction RF, the excitatory vertical direction RF, the inhibitory horizontal direction RF and the inhibitory vertical direction RF.
The photoreceptor and intermediate layers are also connected with weight matrices that represent the underlying neural connectivity and the associated synaptic weights for the particular RF that is under consideration. We use fixed size weight matrices, although the size may be increased to construct larger RFs by increasing the connectivity. The RF in Fig. 3 illustrates excitatory synapse connections with ‘Δ’ and inhibitory synapse connections with ‘X’.
Based on [21] we use the function defined in equation (2) [20, 21] to calculate the synapse weights. In order for vertical edges to be detected in the intensity image we define the excitatory and inhibitory RFs as ON
vwi and OFFvwi . Similarly,
in order for horizontal edges to be detected we define the excitatory and inhibitory RFs as ON
hwi and OFFhwi
respectively. In a similar manner, the horizontal and vertical excitatory and inhibitory RFs for the depth image are defined as ON
hwd , OFFhwd , ON
vwd and OFFvwd .
Values for the excitatory weight matrix in the RF ONhwd
for the horizontal direction may be calculated as:
( )( ) ( )
( )ïî
ïíì
£--
>-= -
--
-
0if
0if0
2
2
2
2
max c
yyxxc
ONh
yyew
yywd
y
c
x
c
dd, (2)
Fig. 2. RF of a spiking neuron

where ( )cc yx , denotes the RF centre, the constants xd and
yd define the RF shape, and excitatory and inhibitory
synapses maximal weight is denoted as maxw . In Section V, 1=xd , 6=yd and 1max =w to ensure consistency with
previous work [20, 21]. When a 33´ ON
hwd RF is constructed using these parameters the following weight matrix is obtained,
úúú
û
ù
êêê
ë
é=
00000097.00.197.0
ONhwd . (3)
Similarly, inhibitory weights in OFFhwd are determined,
( )( ) ( )
( )ïî
ïíì
>--
£-= -
--
-
0if
0if0
2
2
2
2
max c
yyxxc
OFFh
yyew
yywd
y
c
x
c
dd. (4)
Using the parameters in (4) the following 33´ OFFhwd RF
weight matrix is generated:
úúú
û
ù
êêê
ë
é=
97.00.197.0000000
OFFhwd . (5)
The ONvwd and OFF
vwd RFs can be obtained by simply rotating the ON
hwd and OFFhwd weight matrices through 90°
clockwise. Similarly, intensity weight matrices ONvwi , OFF
vwi , ONhwi and OFF
hwi are generated using (2) and (4). The
Fig. 3. Spiking Neural Network Structure.

intensity weight matrices can be considered equivalent to the depth weight matrices when the RF size under consideration and associated parameters are identical.
The intermediate network layer contains eight parallel arrays of neurons, where each array has the same dimensions as the receptor layer. For clarity, we have only illustrated 1 neuron, xn for each intermediate layer array shown in Fig. 3. Additionally, some of the connections between the synapse matrices and photoreceptor layer have been omitted for visual clarity. Each of the parallel neuronal arrays in the intermediate layer correspond to a RF that can detect discontinuities in either edge or depth at different orientations thereby functioning as an orientation specific line detector.
In the output layer the integrator neurons’ role is to integrate each of the individual intermediate layer’s outputs, thus pooling the response from the orientation specific RFs. The resultant output generates a feature map corresponding to the combination of the original intensity and depth image data. In areas of either intensity changes or depth discontinuities, pooled responses contribute to the computed edge map. The edge map is thresholded by setting a firing rate threshold, T (empirically or scientifically), that corresponds to the desired output.
A. Network Implementation The network was implemented using the parameters:
mv60-=thv , mv70-=resetv , mv0=exE , mv75-=ihE ,
mv70-=lE , 2mm/s0.1 µ=lg , 2mm/nF10=mc , ms6=reft
, 23mm02895.0=ihA and 2mm014103.0=exA . The parameters have been selected to be consistent with biological neurons [20, 21]. The image data (intensity and depth) are normalised to the range [0…1]. Missing depth data are set equal to 0 to denote depth discontinuities. To enforce no neuron firing in uniform image areas within its RF the synaptic strengths are adjusted. Each RF is processed in a simultaneous manner in order to emulate the parallel processing of the biological vision system. From the output neuron, the membrane potential is determined through pooling the response from each RF.
V. EVALUATION For performance evaluation, we use Pratt’s Figure of Merit
(FOM) [49] on each of the intensity and depth images. FOM generate maximum performance for well localised, continuous edges and penalises for missing edge points and noise classified as edge pixels. Hence, the FOM is defined as:
å= +
=AI
iIA dIIR
121
1),max(
1a
(6)
where AI =number of actual detected edge points, II = the expected number of detected edge pixels, d = distance between detected and expected edge point, and α is a scalar typically chosen as 1/9. The FOM output is normalised such that R is in the range 0 and 1, where 1 represents an accurately detected and localised edge. For FOM, synthetic images are typically used as we require knowledge of the location of the
edge points. We completeness and robustness, we compare edge detection performance using a full range of edge orientations and signal-to-noise ratios (SNR), where
2
2
shSNR = , and the step edge height is h with 2s denoting
the noise variance.
A. FOM Evaluation using Intensity Images Pratt’s FOM was computed using a number synthetic
images containing a variety of ramp edge and SNR which were selected as 1, 5, 10, 20, 50 and 100 analogous to [49]. The FOM was calculate by summing the synaptic weight matrices (3) and (5) and then convolving with the synthetic ramp edge images. To provide a comparison with other well known techniques, we compute the FOM for the well-known Sobel [9] and Canny [50] gradient-based edge detectors and the Structured Forest (SF) machine learning approach proposed by [51]. The results for the horizontal ramp edge are shown in Fig.4 where the FOM is averaged over 5 images for each SNR.
Results illustrate the SNN with synaptic weight matrices (3) and (6), performs similar to the Sobel edge detector and in some cases when the SNR is within the range 5-20, the SNN results in an improved FOM. The Structured Forest approach fails to detect meaningful edges as this particular approach is designed to detect features in natural images rather than synthetic images. These FOM results are encouraging as it demonstrates that the novel bio-inspired approach can perform equally as well as these standard techniques. Whist results demonstrate the SNN does not perform as well as Canny, this method is computationally expensive and can only be applied to intensity images and not depth images whereas the focus of this work is a single biological inspired approach to processing both image modalities.
B. FigureofMeritEvaluationusingDepthImagesPerformance evaluation has also been conducted using a
number of synthetic depth images [52]. In this approach ten different types of edges are considered. Each of the edge types are defined as two planes equations; these are then used to create a regularly distributed depth image representing each potential edge available within a depth image. The FOM was computed by summing the synaptic weight matrices (3) and
Fig. 4. FOM results for horizontal ramp edge intensity image.

(5) and then convolving with the synthetic depth images. For comparison, we also compute the FOM with the well-known Scan-line edge detector [53, 54] for use with depth images and with the Structured Forest technique [51] which has been trained using the RGB-D image dataset suggested by the proposers.
Fig. 5 illustrates that the SNN outperforms the scan-line method for depth image edge detection over a range of SNR. In fact, it should be noted that a FOM value of 1 is never obtained using the scan line even when noise is not present, thus indicating that an edge can not be accurately localised under any circumstances. The Structured Forest approach again fails to detect meaningful edges as this particular approach is designed to detect features in natural RGB-D images rather than synthetic images used in the FOM evaluation. Although results for only the 33´ synaptic weight matrices (3) and (5) are illustrated, weight matrices of any size can be calculate using the proposed novel framework to detect features of different scales.
C. Visual Evaluation using Intensity and Depth Images
The SNN edge detector evaluation performance is compared with gradient based feature extraction algorithm presented in [52], the scan-line feature detector [53, 54] and a Structured Forest machine learning approach [51]. In Fig. 6, the corresponding intensity and depth images are presented in Fig. 6(a) and 6(b). As an example of the advantage provided by the pooling in the SNN output layer we can see although the SNN model has detected all the edges as illustrated in Fig. 6(d), that the edges from ketchup bottle are not identified using the Sobel edge detector in Fig. 6(c) but. The pooling of the information from both depth and intensity image modalities highlights the complementary information that can be obtained with this approach. Using only one image modality or not pooling the intermediate layer outputs would result in failure to detect the glass bottle. In Fig. 7 and Fig. 8 we present a visual comparison demonstrating detection of the features in each of the individual intensity and depth images. We have selected the gradient feature extraction algorithm from [52] to provide comparative results as it has been previously used with both intensity and depth images. It should also be noted that our proposed SNN network is a one-step approach combining the various inputs from the intensity and depth images with the pooling in the output layer. Note in Fig. 7c that some of the
finer details of the tissues coming out of the tissue box are missing. This missing information is observable in the intensity edges in Fig. 7(d).
Fig. 5. Figure of Merit results for horizontal step edge depth image.
(a) Intensity image
(b) Depth image
(c) Sobel edge detector output
(d) Bio-inspired edge feature output
Fig. 6. Depth and intensity images and associated edge feature output.

(a) Depth image
(b) Intensity image
(c) Scanline depth image edges
(d) Intensity image edges using [51]
(e) Structured Forest Depth edges
(f) Structured Forest intensity edges
(g) SNN edges
(h) Intensity image edges using [9]
Fig. 7 Sample images comparing SNN detector with standard intensity edge and depth edge detectors
(a) Depth image
(b) Intensity image
(c) Scanline depth image edges
(d) Intensity image edges using [51]
(e) Structured Forest Depth edges
(f) Structured Forests intensity edges
(g) SNN edges
(h) Intensity image edges using [9]
Fig. 8 Further sample images comparing SNN detector with standard intensity edge and depth edge detectors.
Notice that when the feature detector is applied to the depth data the difference in depth profile along the upper edge of the tissue box is not detected as the change in depth values is not sufficiently significant. However, the feature detector applied to the intensity data can easily distinguish between different intensity values. Equally, in the intensity image, the feature extraction algorithm does not detect change in intensity between the tissue paper and wall in the background in certain regions. However, when the feature extraction algorithm is applied to the depth data, we can clearly determine tissue box shape from the wall in the background as there is a significant depth change. This highlights the advantage of using the SNN with a pooled intensity and depth images, illustrating the complementary information available in the resulting output in Fig. 7(g). The SNN produces a feature map that’s does not require independent thresholding. An additional visual example is illustrated in Fig. 8. These initial results are promising as increasingly researchers aim to develop image processing algorithms based on biological systems as it is accepted that traditional algorithms are unable to process with
the effectiveness achieved by biological systems; this SNN model is a step closer to this goal.
D. Detailed Parameter Analysis We provide detailed parameter analysis of three tuneable parameters in the SNN implementation; these are simulation time t, refractory period refτ , and RF size 𝛿". The parameters relating to the conductance based the neuron model in [46] are based on biological recordings and these standard parameters are maintained. Similarly, the weights of the synapse matrices are based on the description of biological RFs limiting any analysis of these parameters. In addition, in every case the FOM is calculated over all possible thresholds selecting the best performing threshold. In Fig. 9 we present results for the SNN network when varying the simulation time. In this case we have chosen to run the network simulation for 50ms, 100ms, 200ms, 300ms and 1000ms. All other network parameters remain constant and as described in Section IV. The best threshold is automatically determined based on the maximum FOM value. Fig 9 demonstrates that the optimal simulation time t varies

between 200ms and 1000ms depending on the SNR of the image in question. In Fig 10 we present results for the SNN network when varying the refractory period refτ of the Hodgkin Huxley model. In this case it can be observed that a refractory period of 4ms is optimal for this implementation. Finally, in Fig 11 we present results for the SNN network using different sized RFs. In the example presented the RF varies in size from 3×3, 5×5 and 7×7. The analysis illustrates that that 7×7 is best in cases of very high noise, 5×5 is best with median noise and 3×3 is best with low noise.
Fig. 9. FOM results for Vertical Ramp edge varying simulation time
Fig. 10. FOM results for Vertical Ramp edge varying refractory period
Fig. 11. FOM results for Vertical Ramp edge varying RF size
VI. CONCLUSION We present an approach to feature extraction that is inspired
by the biological vision system. Based on this, we have developed a SNN that can concurrently process depth and intensity images were each image is presented to the SNN in the input layer. We construct the SNN using a hierarchical layered structure composed of spiking neurons with RFs,
similar to those found in different areas of biological visual systems such as the visual cortex, lateral geniculate nucleus or retina. We use various layers of orientated RFs in the intermediate layer. Each layer consists of excitatory or inhibitory synapses that can detect both changes in intensity or discontinuities in depth data at different orientations.
We use integrator neurons in the output layer of the SNN to pool the responses from all the intermediate layer neurons. The neurons in the output layer also have an integrated thresholding mechanism which produces an output spike in conditions when the intermediate layer provides sufficient spiking input. The resulting firing map then corresponds to pooled edges from each of the input depth and intensity data.
The proposed biologically realistic model demonstrates powerful functionality for integrating inputs and generating spikes. The SNN can perform multiple computations in parallel such as detecting discontinuities in depth data, detecting changes in intensity data, integrating neuronal outputs and finally thresholding with the use of inhibitory and excitatory synapses.
The Figure of Merit results presented illustrate that when using intensity data the SNN performs similar to the Sobel edge detector and in some cases is slightly improved. In the case of edge detection on depth images the SNN clearly demonstrates superior performance over the scan-line method. FOM results also demonstrate that the Structured Forest machine learning method of edge detection fails on synthetic images due to the specific training set on which the model was obtained demonstrating poor generalisation, however the SNN technique, which is based on temporal biological processing and uses a visual model based on biological visual processing demonstrates greater generalisation across all image types without specific training. Visual results also highlight the complementary information that is available using both intensity and depth images; an important advantage of the SNN approach is that the SNN is a one-step approach, naturally combining multiple input images from the intensity and depth images to detect different edge features and generates a single feature map as an output. The experiments illustrate that depth and intensity data can be used in many artificial vision applications including the creation of object models or combining depth and intensity data where appropriate for specific robotic tasks. We have demonstrated how a SNN can be used to detect pooled features from depth and intensity image inputs.
This paper presents an implementation of a hierarchical visual processing system that incorporates many aspects of biological vision systems and that is suitable for different image modalities. The SNN receptive layer cells respond strongly to edges in horizontal and vertical orientations (i.e. there is no isotropic response) and therefore the detector cannot be considered rotationally invariant. Future work will investigate the feasibility of embedding rotational invariance if the number of intermediate layer neurons is increased and corresponding RFs to improve network performance to different edge orientations. Additionally we will investigate
0
0.2
0.4
0.6
0.8
1
1 5 10 20 50 100 0
FOM
SNR
50ms100ms200ms300ms1000ms
0
0.2
0.4
0.6
0.8
1
1 5 10 20 50 100 0
FOM
SNR
0ms2ms4ms6ms8ms
0
0.2
0.4
0.6
0.8
1
1 5 10 20 50 100 0
FOM
SNR
3x35x57x7
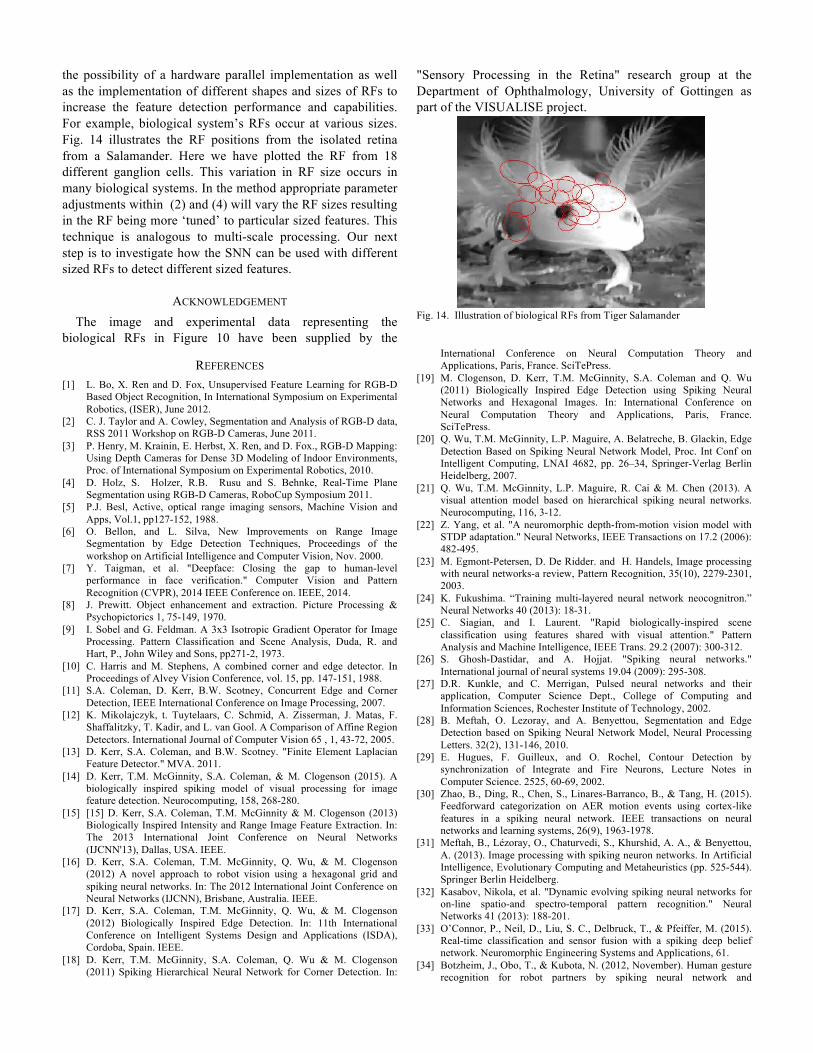
the possibility of a hardware parallel implementation as well as the implementation of different shapes and sizes of RFs to increase the feature detection performance and capabilities. For example, biological system’s RFs occur at various sizes. Fig. 14 illustrates the RF positions from the isolated retina from a Salamander. Here we have plotted the RF from 18 different ganglion cells. This variation in RF size occurs in many biological systems. In the method appropriate parameter adjustments within (2) and (4) will vary the RF sizes resulting in the RF being more ‘tuned’ to particular sized features. This technique is analogous to multi-scale processing. Our next step is to investigate how the SNN can be used with different sized RFs to detect different sized features.
ACKNOWLEDGEMENT The image and experimental data representing the
biological RFs in Figure 10 have been supplied by the
"Sensory Processing in the Retina" research group at the Department of Ophthalmology, University of Gottingen as part of the VISUALISE project.
REFERENCES [1] L. Bo, X. Ren and D. Fox, Unsupervised Feature Learning for RGB-D
Based Object Recognition, In International Symposium on Experimental Robotics, (ISER), June 2012.
[2] C. J. Taylor and A. Cowley, Segmentation and Analysis of RGB-D data, RSS 2011 Workshop on RGB-D Cameras, June 2011.
[3] P. Henry, M. Krainin, E. Herbst, X. Ren, and D. Fox., RGB-D Mapping: Using Depth Cameras for Dense 3D Modeling of Indoor Environments, Proc. of International Symposium on Experimental Robotics, 2010.
[4] D. Holz, S. Holzer, R.B. Rusu and S. Behnke, Real-Time Plane Segmentation using RGB-D Cameras, RoboCup Symposium 2011.
[5] P.J. Besl, Active, optical range imaging sensors, Machine Vision and Apps, Vol.1, pp127-152, 1988.
[6] O. Bellon, and L. Silva, New Improvements on Range Image Segmentation by Edge Detection Techniques, Proceedings of the workshop on Artificial Intelligence and Computer Vision, Nov. 2000.
[7] Y. Taigman, et al. "Deepface: Closing the gap to human-level performance in face verification." Computer Vision and Pattern Recognition (CVPR), 2014 IEEE Conference on. IEEE, 2014.
[8] J. Prewitt. Object enhancement and extraction. Picture Processing & Psychopictorics 1, 75-149, 1970.
[9] I. Sobel and G. Feldman. A 3x3 Isotropic Gradient Operator for Image Processing. Pattern Classification and Scene Analysis, Duda, R. and Hart, P., John Wiley and Sons, pp271-2, 1973.
[10] C. Harris and M. Stephens, A combined corner and edge detector. In Proceedings of Alvey Vision Conference, vol. 15, pp. 147-151, 1988.
[11] S.A. Coleman, D. Kerr, B.W. Scotney, Concurrent Edge and Corner Detection, IEEE International Conference on Image Processing, 2007.
[12] K. Mikolajczyk, t. Tuytelaars, C. Schmid, A. Zisserman, J. Matas, F. Shaffalitzky, T. Kadir, and L. van Gool. A Comparison of Affine Region Detectors. International Journal of Computer Vision 65 , 1, 43-72, 2005.
[13] D. Kerr, S.A. Coleman, and B.W. Scotney. "Finite Element Laplacian Feature Detector." MVA. 2011.
[14] D. Kerr, T.M. McGinnity, S.A. Coleman, & M. Clogenson (2015). A biologically inspired spiking model of visual processing for image feature detection. Neurocomputing, 158, 268-280.
[15] [15] D. Kerr, S.A. Coleman, T.M. McGinnity & M. Clogenson (2013) Biologically Inspired Intensity and Range Image Feature Extraction. In: The 2013 International Joint Conference on Neural Networks (IJCNN'13), Dallas, USA. IEEE.
[16] D. Kerr, S.A. Coleman, T.M. McGinnity, Q. Wu, & M. Clogenson (2012) A novel approach to robot vision using a hexagonal grid and spiking neural networks. In: The 2012 International Joint Conference on Neural Networks (IJCNN), Brisbane, Australia. IEEE.
[17] D. Kerr, S.A. Coleman, T.M. McGinnity, Q. Wu, & M. Clogenson (2012) Biologically Inspired Edge Detection. In: 11th International Conference on Intelligent Systems Design and Applications (ISDA), Cordoba, Spain. IEEE.
[18] D. Kerr, T.M. McGinnity, S.A. Coleman, Q. Wu & M. Clogenson (2011) Spiking Hierarchical Neural Network for Corner Detection. In:
International Conference on Neural Computation Theory and Applications, Paris, France. SciTePress.
[19] M. Clogenson, D. Kerr, T.M. McGinnity, S.A. Coleman and Q. Wu (2011) Biologically Inspired Edge Detection using Spiking Neural Networks and Hexagonal Images. In: International Conference on Neural Computation Theory and Applications, Paris, France. SciTePress.
[20] Q. Wu, T.M. McGinnity, L.P. Maguire, A. Belatreche, B. Glackin, Edge Detection Based on Spiking Neural Network Model, Proc. Int Conf on Intelligent Computing, LNAI 4682, pp. 26–34, Springer-Verlag Berlin Heidelberg, 2007.
[21] Q. Wu, T.M. McGinnity, L.P. Maguire, R. Cai & M. Chen (2013). A visual attention model based on hierarchical spiking neural networks. Neurocomputing, 116, 3-12.
[22] Z. Yang, et al. "A neuromorphic depth-from-motion vision model with STDP adaptation." Neural Networks, IEEE Transactions on 17.2 (2006): 482-495.
[23] M. Egmont-Petersen, D. De Ridder. and H. Handels, Image processing with neural networks-a review, Pattern Recognition, 35(10), 2279-2301, 2003.
[24] K. Fukushima. “Training multi-layered neural network neocognitron.” Neural Networks 40 (2013): 18-31.
[25] C. Siagian, and I. Laurent. "Rapid biologically-inspired scene classification using features shared with visual attention." Pattern Analysis and Machine Intelligence, IEEE Trans. 29.2 (2007): 300-312.
[26] S. Ghosh-Dastidar, and A. Hojjat. "Spiking neural networks." International journal of neural systems 19.04 (2009): 295-308.
[27] D.R. Kunkle, and C. Merrigan, Pulsed neural networks and their application, Computer Science Dept., College of Computing and Information Sciences, Rochester Institute of Technology, 2002.
[28] B. Meftah, O. Lezoray, and A. Benyettou, Segmentation and Edge Detection based on Spiking Neural Network Model, Neural Processing Letters. 32(2), 131-146, 2010.
[29] E. Hugues, F. Guilleux, and O. Rochel, Contour Detection by synchronization of Integrate and Fire Neurons, Lecture Notes in Computer Science. 2525, 60-69, 2002.
[30] Zhao, B., Ding, R., Chen, S., Linares-Barranco, B., & Tang, H. (2015). Feedforward categorization on AER motion events using cortex-like features in a spiking neural network. IEEE transactions on neural networks and learning systems, 26(9), 1963-1978.
[31] Meftah, B., Lézoray, O., Chaturvedi, S., Khurshid, A. A., & Benyettou, A. (2013). Image processing with spiking neuron networks. In Artificial Intelligence, Evolutionary Computing and Metaheuristics (pp. 525-544). Springer Berlin Heidelberg.
[32] Kasabov, Nikola, et al. "Dynamic evolving spiking neural networks for on-line spatio-and spectro-temporal pattern recognition." Neural Networks 41 (2013): 188-201.
[33] O’Connor, P., Neil, D., Liu, S. C., Delbruck, T., & Pfeiffer, M. (2015). Real-time classification and sensor fusion with a spiking deep belief network. Neuromorphic Engineering Systems and Applications, 61.
[34] Botzheim, J., Obo, T., & Kubota, N. (2012, November). Human gesture recognition for robot partners by spiking neural network and
Fig. 14. Illustration of biological RFs from Tiger Salamander

classification learning. In Soft Computing and Intelligent Systems (SCIS) and 13th International Symposium on Advanced Intelligent Systems (ISIS), 2012 Joint 6th International Conference on (pp. 1954-1958). IEEE.
[35] [35] D. Floreano and C. Mattiussi, Evolution of spiking neural controllers for autonomous vision-based robots, Evolutionary Robotics IV, pp 38–61. Springer-Verlag, Berlin, 2001.
[36] [36] D. Roggen, S. Hofmann, Y. Thoma, D. Floreano, Hardware spiking neural network with run-time reconfigurable connectivity in an autonomous robot, Proceedings. NASA/DoD Conference on Evolvable Hardware, 2003.
[37] [37] H. Masuta, N. Kubota, The perception for partner robot using spiking neural network in dynamic environment, SICE Annual Conference, 2008.
[38] [38] D. Gamez, SpikeStream: A Fast and Flexible Simulator of Spiking Neural Networks, Proceedings of ICANN. V.4668, pp. 370-379. Lecture Notes in Computer Science, Springer Verlag, 2007.
[39] [39] E. Lazdins, A. K. Fidjeland, D. Gamez, iSpike: A Spiking Neural Interface for the iCub Robot, Proceedings of the International workshop on bio-inspired robots. 2011.
[40] [40] D. Floreano, J.C. Zufferey, and J.D. Nicoud, From Wheels to Wings with Evolutionary Spiking Neurons, Artificial Life, 11(1-2) pp. 121-138, 2005.
[41] [41] H. Hagras, A. Pounds-Cornish, M. Colley, V.Callaghan, and G. Clarke, Evolving spiking neural network controllers for autonomous robots, Proceedings of IEEE International Conference on Robotics and Automation, (ICRA) 2004.
[42] [42] P.A. Ensminger, Life Under the Sun, Yale University Press, 2001.
[43] [43] T. Gollisch, M. Meister, Eye Smarter than Scientists Believed: Neural Computations in Circuits of the Retina, Neuron - 28 January 2010 (Vol. 65, Issue 2, pp. 150-164).
[44] [44] D.H. Hubel, T.N. Wiesel, Brain and Visual Perception: The Story of a 25-Year Collaboration, Oxford University Press, New York, NY (2005)
[45] D.H. Hubel, T.N. Wiesel, Ferrier lecture functional architecture of macaque visual cortex, Proc. R. Soc. Lond. B, 198 (1977), pp. 1–59
[46] A. Hodgkin, and A. Huxley, A quantitative description of membrane current and its application to conduction and excitation in nerve, Journal of Physiology, London, vol. 117, pp. 500-544, 1952.
[47] W. Gerstner, and W. Kistler, Spiking Neuron Models: Single Neurons, Populations, Plasticity, Cambridge University Press, 2002.
[48] E.M. Izhikevich, Which model to use for cortical spiking neurons?, IEEE Trans. on Neural Networks, vol. 15, no. 5, 2004.
[49] I.E. Abdou, and W.K. Pratt, Quantitative design and evaluation of enhancement/ thresholding edge detectors, Proceedings of the IEEE, Vol. 67, No. 5, pp. 753-763, 1979.
[50] J. Canny, A computational approach to edge detection, Pattern Analysis and Machine Intelligence, IEEE Transactions on 6 (1986): 679-698
[51] P. Dollár, C.L. Zitnick. "Fast edge detection using structured forests." IEEE Transactions on Pattern Analysis and Machine Intelligence 37.8 (2015): 1558-1570.
[52] S.A. Coleman, S. Suganthan,and B.W. Scotney, (2010) Gradient Operators for Feature Extraction and Characterisation in Range Images, Pattern Recognition Letters, 31 (9). pp. 1028-1040.
[53] X. Jiang, and H. Bunke, Edge Detection in Range Images Based on Scan Line Approximation, Computer Vision and Image Understanding, Vol.73, No.2, pp. 183-199, 1999.
[54] X.J. Jiang, and H. Bunke, Fast Segmentation of Range Images into Planar Regions by Scan Line Grouping, Machine Vision and Applications, 7(2), pp.115-11, 1994.
Dermot Kerr received a B.Sc. (Hons) in Computing Science from the University of Ulster, UK in 2005, and a Ph.D. in Computing and Engineering from the University of Ulster, UK in 2008. He is currently a lecturer in the School of Computing and Intelligent System at the University of Ulster, Magee. His current research interests are in biologically inspired
image processing, mathematical image processing, feature detection, omni-directional vision and robotics. Dr. Kerr is an officer and member of the Irish Pattern Recognition and Classification Society. He was involved in the EU FP7 funded project VISUALISE and SLANDAIL.
Sonya Coleman received a BSc(Hons) in Mathematics, Statistics and Computing from the University of Ulster, UK in 1999, and a PhD in Mathematics from the University of Ulster, UK in 2003. She is currently a Professor in the School of Computing and Intelligent System at the University of Ulster, Magee and Cognitive Robotics team leader within the Intelligent
Systems research centre. Prof Coleman has 150+ publications primarily in robotics, image processing and computational neuroscience. Her research has been supported by funding from various sources such as EPSRC, The Nuffield Foundation, The Leverhulme Trust and the EU. Previously she was involved in the EU FP7 funded project RUBICON, EU FP7 funded projects VISUALISE and SLANDAIL. In 2009 she was awarded the Distinguished Research Fellowship by
the University of Ulster in recognition of her contribution research.
Thomas Martin McGinnity received a First Class (Hons.) degree in Physics in 1975, and a Ph.D. degree from the University of Durham, UK in 1979. He is currently Pro Vice Chancellor and Head of the College of Science and Technology at Nottingham Trent University, UK and was formerly Professor of Intelligent Systems Engineering and Director of the
Intelligent Systems Research Centre within the Faculty of Computing and Engineering, University of Ulster. He has also been a Director of the University of Ulster׳s technology transfer company, Innovation Ulster, and a spin out company Flex Language Services. He is the author or coauthor of over 300 research papers and has attracted over £25 million in research funding. His research interests are focused on computational intelligence, and in particular on computational systems which explore and model biological signal processing, and on information processing in the healthy and unhealthy brain. His research interests span computation neuroscience and applications in cognitive robotics. He has been awarded both a Senior Distinguished Research Fellowship and a Distinguished Learning Support Fellowship by the University of Ulster in recognition of his contribution to teaching and research. Prof. McGinnity is a Fellow of the IET, SMIEEE and a Chartered Engineer.