Embed Size (px)
Citation preview

Number of text pages: 28 1
2
3
4
5
6
7
8
9
10
11
12
13
14
Number of tables: 3
Number of figures: 6
Biologically fixed N2 as a source for N2O production in a grass-clover mixture,
measured by 15N2
M.S. Carter1 and P. Ambus
Biosystems Department, Risø National Laboratory, P.O. Box 49, 4000 Roskilde, Denmark
1Corresponding author
Telephone No: +45 4677 4151
FAX No: +45 4677 4160
E-mail: mette.sustmann.carter[a]risoe.dk
1

Abstract 15
16
17
18
19
20
21
22
23
24
25
26
27
28
29
30
31
32
33
34
35
36
37
The contribution of biologically fixed dinitrogen (N2) to the nitrous oxide (N2O)
production in grasslands is unknown. To assess the contribution of recently fixed N2 as a
source of N2O and the transfer of fixed N from clover to companion grass, mixtures of
white clover and perennial ryegrass were incubated for 14 days in a growth cabinet with a
15N2-enriched atmosphere (0.4 atom% excess). Immediately after labelling, half of the
grass-clover pots were sampled for N2 fixation determination, whereas the remaining half
were examined for emission of 15N labelled N2O for another eight days using a static
chamber method. Biological N2 fixation measured in grass-clover shoots and roots as well
as in soil constituted 342, 38 and 67 mg N m-2 d-1 at 16, 26 and 36 weeks after emergence,
respectively. The drop in N2 fixation was most likely due to a severe aphid attack on the
clover component. Transfer of recently fixed N from clover to companion grass was
detected at 26 and 36 weeks after emergence and amounted to 0.7 ± 0.1 mg N m-2 d-1,
which represented 1.7 ± 0.3 % of the N accumulated in grass shoots during the labelling
period. Total N2O emission was 91, 416 and 259 μg N2O-N m-2 d-1 at 16, 26 and 36 weeks
after emergence, respectively. Only 3.2 ± 0.5 ppm of the recently fixed N2 was emitted as
N2O on a daily basis, which accounted for 2.1 ± 0.5 % of the total N2O-N emission. Thus,
recently fixed N released via easily degradable clover residues appears to be a minor
source of N2O.
Key words
emission factor, nitrogen fixation, nitrogen transfer, nitrous oxide, 15N2, white clover
2

Abbreviations 38
39
40
41
42
43
44
45
46
47
48
49
50
51
52
53
54
55
56
57
58
59
60
61
62
CONT – control
EMI – determination of N2O EMIssion
FIX – determination of N2 FIXation
START – sampled at the start of labelling
Introduction
In temperate organic farming, biological N2 fixation in grass-legume swards provides a
major N input to the system, but knowledge is sparse regarding the amount of fixed N2 lost
from the grasslands as N2O. Agricultural soils are known to be a considerable source of
N2O (Kroeze et al. 1999) and at present this source accounts for 5 % of the European
release of anthropogenic derived greenhouse gases (EEA 2002). Furthermore, N2O is
involved in ozone depletion of the stratosphere (Crutzen 1981). In soils, N2O is mainly
produced in the bacterial processes of nitrification and denitrification (Firestone and
Davidson 1989). Thus, legumes may give rise to N2O by supplying the microbial
community in the soil with N compounds. In addition, many strains of the symbiotic N2
fixing bacteria Rhizobium are able to denitrify nitrate that moves into the root nodules from
the soil (O'Hara and Daniel 1985). However, this ability was not found among the strains
that form symbiosis with white clover (de Klein et al. 2001).
According to the guidelines issued by the Intergovernmental Panel on Climate
Change, inventories for N2O emissions from agricultural soils should be based on the
assumption that 1.25 % of the total N supply is emitted as N2O (IPCC 1997). This emission
factor is used as a standard for all N inputs, although the factor relies on experiments with
fertilizer and manure only (Bouwman 1996). Input to the systems via biological N2 fixation
in grass-legume swards is currently not considered as a source of N2O in the IPCC
3

guidelines (IPCC 1997), partly due to uncertainties in quantifying the N2 fixation in
grasslands (Mosier et al. 1998). Hence, the agricultural greenhouse gas release may
presently be underestimated. As organic farming to a very large extent utilises grass-
legume mixtures as N source, the contribution from organic farming systems in particular
may be underestimated. However, countries are allowed to develop their own inventory
methodology based on local measurement data. Some countries, e.g. Denmark and
Switzerland, include the contribution from biological N
63
64
65
66
67
68
69
70
71
72
73
74
75
76
77
78
79
80
81
82
83
84
85
2 fixation in grasslands in the
national N2O inventory, using the standard emission factor of 1.25 % (Schmid et al. 2001;
Mikkelsen et al. 2005). This factor nonetheless seems to overestimate the contribution
from biologically fixed N2, as substituting fertilizer N with biological N2 fixation is often
found to reduce N2O emissions from grasslands (e.g. Garrett et al. 1992; Ruz-Jerez et al.
1994).
So far, the N2O emission factor for biologically fixed N2 in grass-legume swards
has only been estimated via modelling (e.g. Schmid et al. 2001) or determined indirectly
by relating total N2O emission to measured N2 fixation (e.g. Ruz-Jerez et al. 1994).
Therefore a 15N2-tracer-experiment was initiated on grass-clover to assess the contribution
of recently fixed N2 as a source of N2O and the transfer of fixed N from clover to
companion grass. The 15N2-labelling technique is the sole direct measure of N2 fixation,
and in many cases it is the only method to assess the fate of biologically fixed N2
(Warembourg 1993). To our knowledge the present study is the first where the 15N2-
labelling technique is used to determine the contribution of N2 fixation to the N2O
production.
4
Materials and methods 86
87
88
89
90
91
92
93
94
95
96
97
98
99
100
101
102
103
104
105
106
107
108
109
110
Establishment of grass-clover
Air-dried and sieved (1 cm) topsoil from an organic crop rotation was packed in 15 × 15
cm pots to a bulk density of 1.46 g cm-3. The soil was a loamy sand with total N content of
0.12 %, total C content of 1.4 %, pH in water of 7.6 and water-holding capacity of 0.23 g
water g-1 dry soil. Each pot was either sown with a mixture of white clover (Trifolium
repens L. cv. Klondike) and perennial ryegrass (Lolium perenne L. cv. Fanda) or with
perennial ryegrass only. All pots were placed in a glasshouse with a day/night regime of
16/8 h, minimum temperature 21/16 ºC and minimum light intensity of 120 μmol m-2 s-1
(PAR) provided by fluorescent tubes. Seedlings emerged around 21 March 2002, and after
three weeks the plant density was reduced to 14 seedlings per pot (grass:clover, 1:1).
Grazing was simulated by cutting to a height of 6 cm every second week. Six weeks after
emergence, the pots were transferred outdoors. Ammonium sulphate corresponding to 25
kg N ha-1 was added at 8, 14, 21 and 26 weeks after emergence. At 28 weeks, pots were
transferred to a growth chamber with a day/night regime of 16/8 h, temperature 20/15 ºC
and light intensity of 300 μmol m-2 s-1 (PAR). From 26 weeks after emergence, attempts
were made to control aphids on clover via smothering agents and biological pest control by
the Asian lady beetle (Harmonia axyridis), an aphid midge (Aphidoletes aphidimyza) and a
parasitic wasp (Aphidius colemani).
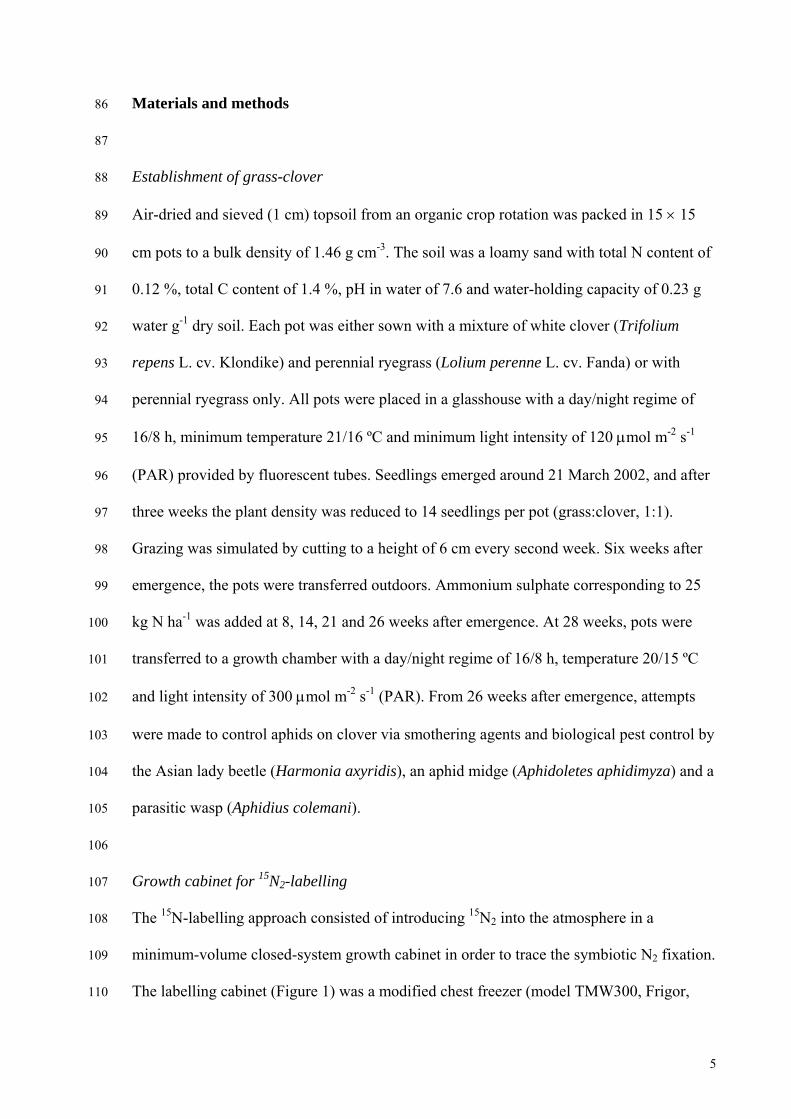
Growth cabinet for 15N2-labelling
The 15N-labelling approach consisted of introducing 15N2 into the atmosphere in a
minimum-volume closed-system growth cabinet in order to trace the symbiotic N2 fixation.
The labelling cabinet (Figure 1) was a modified chest freezer (model TMW300, Frigor,
5

Viborg, DK) in which the volume was reduced to 48 (width) × 86 (length) × 42 (depth) cm
by installing a raised floor (4 mm aluminium sheeting). The cabinet could host twelve 15 ×
15 cm pots, which were placed in plastic bags and elevated slightly above the floor to
hinder water exchange between pots. External growth lamps supplied light through a
transparent window of 12 mm plexiglas mounted above a 44 × 82 cm hole cut into the lid
of the freezer. To improve the seal between lid and casket, an EPDM rubber gasket was
fitted to the sealing edge of the freezer. Circulation of air within the cabinet was achieved
using a fan (60 × 60 mm) to blow air from the bottom to the top of the cabinet through a
7.5 cm diameter PVC Flex Pipe.
111
112
113
114
115
116
117
118
119
120
121
122
123
124
125
126
127
128
129
130
131
132
133
134
135
Temperature was maintained by a computer, which controlled the compressor of
the freezer. The computer also controlled light on/off as well as the supply of CO2 during
defined periods in order to keep CO2 near ambient levels. The concentration of CO2 in the
cabinet was monitored by an infra-red gas analyser (IRGA; EGM-2, PP Systems, Hitchin,
UK). The atmosphere of the system was circulated externally around a closed loop made
from copper tubing (1/8” OD) by a timer-controlled diaphragm pump. A CO2 scrub could
be integrated in the closed loop in order to remove excess CO2 produced during night. The
scrub consisted of 1 M potassium hydroxide (KOH) in a 0.5 litre screw capped serum
bottle, mounted with a rubber stopper pierced by two tubes. This scrub was later replaced
by a 0.6 litre solid-state soda lime scrub (75 % CaOH2, 3.5 % NaOH), as KOH foam had
started to corrode the rubber stopper. A 12 litres tedlar bag attached to the closed loop
prevented over-pressure in the system. The closed gas loop was equipped with a sampling
port for collecting gas samples and introducing 15N2 to the system. Water was provided
through a silicon tube to each pot connected to a valve on the outside. The irrigation was
adjusted to obtain a soil water content slightly below the water-holding capacity based on
initial transpiration measurements, experience from the former labelling event and water
6

status of control pots. Condensate that accumulated at the floor of the cabinet was sucked
out daily via a silicone tube connected to a valve on the outside.
136
137
138
139
140
141
142
143
144
145
146
147
148
149
150
151
152
153
154
155
156
157
158
15N2-labelling
Three 14-day incubations were conducted with grass-clover mixtures at 16, 26 and 36
weeks of age. At each labelling event, 16 grass-clover and 12 grass pots were cut to a
height of 6 cm. Eight grass-clover and eight grass pots were placed in an ordinary growth
chamber with a day/night regime of 16/8 h, temperature at 20/15 ºC and light intensity of
300 μmol m-2 s-1 (PAR). The remaining eight grass-clover and four grass pots were placed
in the labelling cabinet under similar conditions. The following day (Day 1), four grass-
clover and four grass pots from the growth chamber were sampled to establish the amount
of N in the plant material at the start of the labelling period (START pots - soil not
analysed). The remaining four grass-clover and four grass pots in the growth chamber were
controls and were sampled on day 14 (CONT pots). On day 1, two litres 98 atom% 15N2
were added to the labelling cabinet and on day 8, a volume of 0.7 litres was added,
resulting in a mean enrichment of the atmosphere over the 14-day incubation period of 0.4
atom% excess. To compensate for a leaky diaphragm pump during the incubation at 36
weeks after emergence, the 15N2 addition on day 8 was substituted by addition of about 0.5
litres on day 4, 7 and 11. A sample of the cabinet atmosphere was taken daily and stored in
an evacuated 120 ml serum bottle fitted with rubber stopper before analysis for 15N
abundance of N2, concentration of N2O, and sometimes (5/14 days) 15N abundance of N2O.
On day 14, four grass-clover and four grass pots from the labelling cabinet were sampled
to establish the N2 fixation during the labelling period (FIX pots).
7

159
160
161
162
163
164
165
166
167
168
169
170
171
172
173
174
175
176
177
178
179
180
181
182
183
Measurement of 15N2O emission
The remaining four grass-clover pots from the labelling cabinet (EMI pots) were
transferred to the ordinary growth chamber. During the following eight days, emission of
15N labelled N2O was measured daily from these pots using a static chamber method.
Beforehand, water-holding capacity was determined on a set of pots by removing plant
shoots and saturating the soil with water. The pots were covered by plastic to hinder
evaporation and were then allowed to drain for two days before weighing and
determination of gravimetric water content (oven drying at 105 °C for 24 h). At least one
hour before onset of gas measurements, the EMI pots were irrigated to reach 60-65 % of
the water-holding capacity. For analysis of initial N2O concentration and 15N abundance,
two evacuated 3.5 ml Venoject vials and two evacuated 120 ml serum bottles were filled
with samples of growth chamber atmosphere using 5 and 60 ml Plastipak syringes,
respectively. The same procedures were used when sampling headspace gas during the
following cover period. Each pot was placed on an 11.5 × 11.5 × 1.3 cm platform above a
shallow (1 cm) tray of water. The pot was then enclosed within an 18 × 18 × 29 cm plastic
cover fitted with a rubber stopper to allow sampling, and weighted down to ensure a
complete water-seal. After 45, 90, 135 and 180 minutes of cover period, a 3.5 ml sample of
the headspace gas was removed through the rubber stopper for analysis of N2O
concentration. At the end of the cover period (180 minutes), a 120 ml sample was taken for
analysis of 15N abundance of N2O. The EMI pots were harvested after eight days of gas
measurement. At 36 weeks after emergence, emission of N2O was also measured for
unlabelled grass pots. Once during each experiment, 15N abundance of emitted N2O was
determined on unlabelled grass-clover pots. The result was at natural abundance or slightly
below, thus 0.3663 atom% was used as the background value in the calculations.
8

The 3.5 ml gas samples were added 2 ml N2 before they were analysed for N2O in a
gas chromatograph (GC-14B, Shimadzu, Kyoto, JP) fitted with a HaySep Q column and an
electron capture detector (column and detector temperature were 30 °C and 300 °C,
respectively). Concentration of N
184
185
186
187
188
189
190
191
192
193
194
195
196
197
198
199
200
201
202
203
204
205
206
207
208
2O in gas samples from the labelling cabinet was
determined in the same way. Gas samples of 100 μl from the labelling cabinet and from the
120 ml samples taken during the cover periods at 16 weeks were analysed manually for
15N abundance of N2 using an elemental analyser (EA 1110, Carlo Erba, Milano, IT) fitted
with an injection port and coupled in continuous flow mode to an isotope-ratio mass
spectrometer (IRMS; Finnigan MAT Delta E or Finnigan MAT Delta Plus, Bremen, DE).
All 120 ml samples from the cover periods as well as selected samples from the labelling
cabinet were analysed for 15N abundance of N2O following removal of CO2 and cryogenic
focusing of N2O on a trace gas concentration unit (PreCon Finnigan MAT, Bremen, DE) in
continuous flow mode to an IRMS (Finnigan MAT Delta Plus, Bremen, DE).
Sampling of pots
Shoot material was harvested and sorted into clover and grass. At 26 and 36 weeks after
emergence, a dead shoot fraction was also determined for the grass-clover pots. Fresh
weight of shoot material from FIX pots was established in order to calculate needed
irrigation of EMI pots to reach 60-65 % of water-holding capacity. A root and a soil
fraction were obtained by sieving (6 mm), and the root fraction was subsequently cleaned
of soil by repeatedly being immersed in water then washed into a fine sieve.
Analyses of plants and soil
Dry matter of plant samples was determined (oven dried at 80 °C for 24 h). Plant samples
and samples of air-dried soil were finely ground and analysed for total N and 15N on the
9
elemental analyser and IRMS (Finnigan MAT Delta Plus, Bremen, DE). In addition, total
carbon was measured on soil from grass-clover CONT pots sampled at 16 weeks after
emergence. This treatment was also used to determine soil pH in a 10:25 (w:vol)
suspension of fresh soil in distilled water. Within eight hours of pot sampling, 10 g
portions of fresh soil were extracted in 2 M KCl (1:10, w:vol), stirred on a horizontal
shaker for one hour. The extracts were filtered through Whatman 40 filters and kept at -20
°C until NO
209
210
211
212
213
214
215
216
217
218
219
220
221
222
223
224
3- and NH4
+ were analysed colorimetrically on an autoanalyzer (Bran+Luebbe,
Norderstedt, DE). Nitrogen-15 abundance of inorganic N was determined in extracts by the
diffusion method, where NO3- and NH4
+ are converted into NH3, which is trapped on an
acidified filter paper (Sørensen and Jensen 1991). The filters were subsequently analysed
for 15N as described for plant and soil samples.
Calculations
When calculating the N2 fixation, the proportion of total N in plants derived from a 15N2-
enriched atmosphere (P) is determined as
P = NL*/NPP225
226
227
* (1)
where NL* is the 15N atom% excess enrichment of the legume after exposure to an
atmosphere with a 15N atom% excess enrichment of NPP228
229
230
231
232
233
* (Warembourg 1993). Wood and
McNeill (1993) show that this P value is independent of the plant N pool at the start of the
labelling period, which makes the equation suitable for calculating N fixation for the FIX
pots. However, by extending their argumentation it can be established that the P value is
also valid in cases where the plants accumulate N both before and after the labelling
period. This makes the equation suitable for calculating N fixation for the EMI pots as
2
2
10

well. The equation is based on the assumptions that N supplied by soil, fertilizer and non-
labelled atmosphere have the same
234
235
236
237
15N abundance and that no 15N remains during the last
period. The amount of N originating from fixation during the labelling period (N P) is
2
L
NLP = NLNL*/NPP238
239
240
241
242
243
244
245
246
247
248
249
250
251
252
253
254
255
256
257
258
* (2)
where NL is the N accumulated by the plants during their full growth. For the FIX pots, the
amount of N derived from fixation was calculated for each plant-soil fraction (viz. clover
shoot, grass shoot, dead shoot, root and soil total N), provided that 15N abundance of the
fraction increased significantly between CONT and FIX pots. Total N2 fixation was
determined in the same way for the EMI pots. Additionally, the amount of fixed N2 lost as
N2O during the eight days emission measurement was calculated, and included in the total
N2 fixation for the EMI pots.
Flux of N2O was calculated from the linear increase in N2O concentration in the
headspace during the cover period. Emission of N2O-N derived from biologically fixed N2
was calculated from the emission of 15N labelled N2O, which was determined in two ways.
If a significant N2O emission (R2 of N2O concentration vs. time ≥ 0.7) and increase in 15N
abundance of N2O (end-value ≥ 0.3689 atom%) were detected, then emission of 15N
labelled N2O (CC*) was calculated as
CC* = CtCt* - C0C0
* (3)
where C0 and Ct are the N2O concentration calculated from the regression equation for the
start and end of the cover period, respectively, and C0* and Ct
* are the atom% excess
enrichment of N2O at the start and end of the cover period, respectively. If only a
11

significant increase in 15N abundance of N2O was detected then the emission of 15N
labelled N
259
260
261
262
263
264
265
266
267
268
269
270
271
272
273
274
275
276
277
278
279
280
281
282
283
2O was calculated as
CC* = (Ct* - C0
*)C0 (4)
Emission of N2O-N derived from fixed N2 (CP) was then established as
CP = CC*/NP* (5)
which corresponds to equation 2. The estimates were subsequently converted from
concentration of N2O to amount of N. The fraction of fixed N, which was emitted as N2O
(FE) was calculated as
FE = EN2O/Ftot (6)
where EN2O is the amount of fixed N emitted as N2O per day and Ftot is the total N2 fixation
during the labelling period per day determined for the EMI pots.
Statistics
ANOVAs and Tukey’s multiple comparison tests (α = 0.05) were performed using SAS
General Linear Model procedure (SAS Institute 1997). Homogeneity of variance was not
obtained despite transformation when testing soil inorganic N for all grass-clover
treatments. Hence, differences between median inorganic N content for each experiment
were assessed using the Kruskal-Wallis test. The same constraint appeared for three
fractions when testing 15N abundance of grass-clover CONT pots against FIX and EMI
12

pots, viz. soil of EMI pots at 26 weeks after emergence and clover shoot of FIX and EMI
pots at 36 weeks after emergence. Thus, the medians were compared using the Mann-
Whitney U-test. In some cases variation was indicated as coefficient of variance (CV),
which is the standard deviation in percent of the mean.
284
285
286
287
288
289
290
291
292
293
294
295
296
297
298
299
300
301
302
303
304
305
306
307
308
Results
Labelling cabinet atmosphere
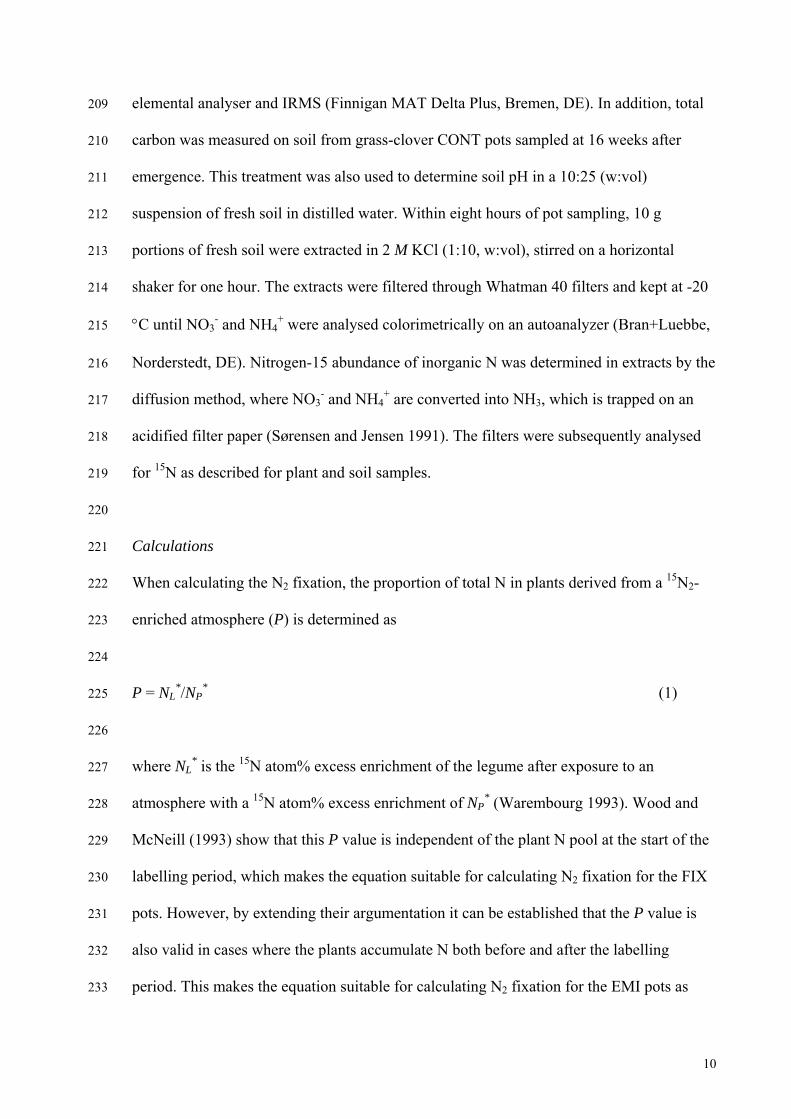
Nitrogen-15 abundance of N2 in the labelling cabinet declined in an apparent exponential
pattern (Figure 2), probably because of diffusion of N2 through the 12 mm plexiglas
window. This problem was also faced in other 15N2 incubation studies (McNeill et al. 1994;
Wood and McNeill 1993), and was compensated for by multiple additions of 15N2. Mean
15N2 enrichment over the labelling period was 0.4369, 0.4177 and 0.3724 atom% excess at
16, 26 and 36 weeks after emergence, respectively. Nitrogen-15 abundance of N2O in the
labelling cabinet gave no evidence for release of N2O derived from biologically fixed N2
during the labelling events (data not shown). During nighttime, the CO2 concentration in
the labelling cabinet increased to > 1200 ppm. After onset of light, the CO2 decreased
assisted by the CO2 scrub (3-5 hours) to near ambient concentrations with a mean of 344,
530 and 468 ppm at 16, 26 and 36 weeks after emergence, respectively.
Biomass in grass-clover FIX pots
At 16 weeks of age, the clover component made up a significantly larger proportion of the
living shoot biomass (82 %) than at 26 and 36 weeks after emergence (65 and 51 %).
However, total living biomass including roots did not differ significantly between labelling
events (P = 0.6523), and constituted 772 ± 38 g dry matter m-2 on average (Table 1).
13

Despite the increased CO2 level, conditions in the labelling cabinet had no significant
effect on the growth of plants measured as living shoot and root biomass compared to the
control (P = 0.1176) (Table 1).
309
310
311
312
313
314
315
316
317
318
319
320
321
322
323
324
325
326
327
328
329
330
331
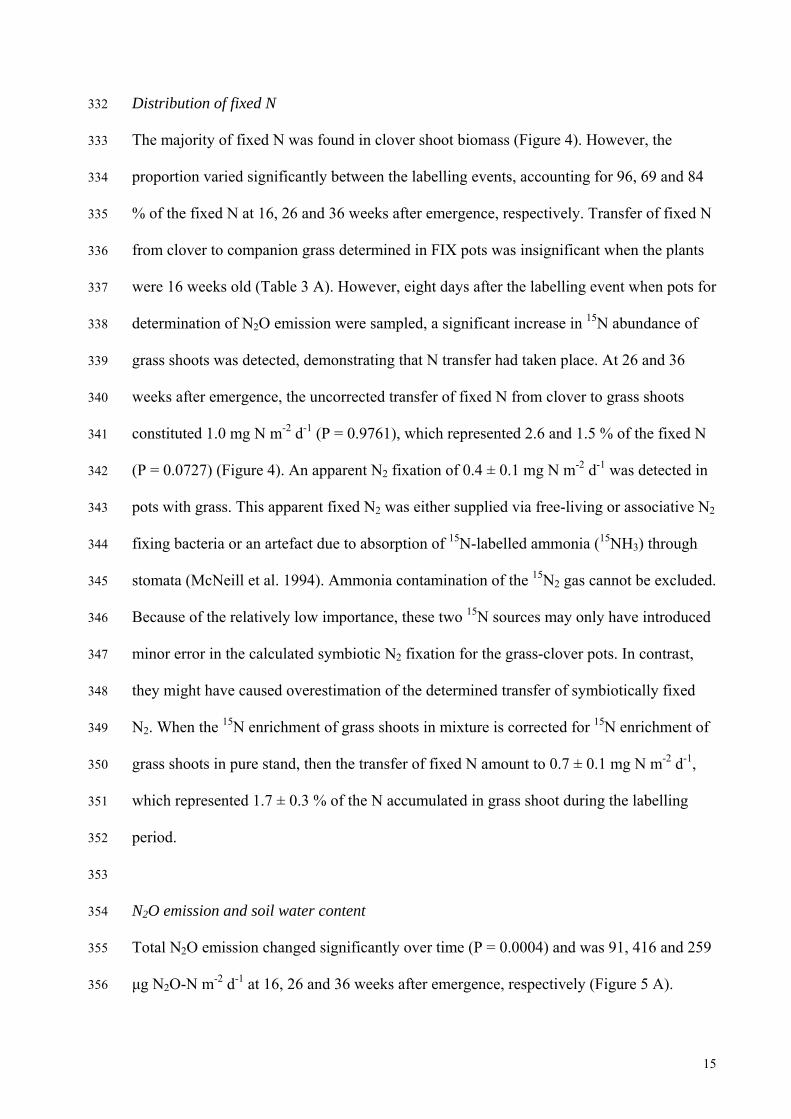
Nitrogen fixation
Amount of N and 15N abundance of the different plant-soil fractions appear in Table 2 and
3, respectively. The results on N2 fixation revealed a significant effect of time (P <
0.0001). Accordingly, at 16 weeks after emergence N2 fixation measured in grass-clover
FIX pots constituted 342 mg N m-2 d-1, which declined to 38 and 67 mg N m-2 d-1 at 26 and
36 weeks, respectively (Figure 3). Overall the N2 fixation differed between the FIX and the
EMI pots (P = 0.0171), which mainly resulted from the higher N2 fixation measured in the
EMI pots at 16 weeks after emergence (Figure 3). The difference was probably due to
variation in the clover biomass between pots randomly selected for the two treatments.
Also, at 16 weeks, N2 fixation calculated for the EMI pots includes fixed N found in the
grass shoot and soil fractions, which had not yet reached a significant 15N enrichment in
the FIX pots (Table 3). Therefore, the fraction of fixed N2 emitted as N2O (FE, equation 6)
was calculated using N2 fixation measured in EMI pots. Fixed N accounted for 90 and 63
% of the N, which accumulated in clover shoots during the labelling period at 16 and 36
weeks after emergence, respectively, but the difference was insignificant (P = 0.2465). A
percentage was not calculated for 26 week old plants because of negative N accumulation
between START and FIX pots due to a severe aphid attack on the clover component (Table
2 B).
14
Distribution of fixed N 332
333
334
335
336
337
338
339
340
341
342
343
344
345
346
347
348
349
350
351
352
353
354
355
356
The majority of fixed N was found in clover shoot biomass (Figure 4). However, the
proportion varied significantly between the labelling events, accounting for 96, 69 and 84
% of the fixed N at 16, 26 and 36 weeks after emergence, respectively. Transfer of fixed N
from clover to companion grass determined in FIX pots was insignificant when the plants
were 16 weeks old (Table 3 A). However, eight days after the labelling event when pots for
determination of N2O emission were sampled, a significant increase in 15N abundance of
grass shoots was detected, demonstrating that N transfer had taken place. At 26 and 36
weeks after emergence, the uncorrected transfer of fixed N from clover to grass shoots
constituted 1.0 mg N m-2 d-1 (P = 0.9761), which represented 2.6 and 1.5 % of the fixed N
(P = 0.0727) (Figure 4). An apparent N2 fixation of 0.4 ± 0.1 mg N m-2 d-1 was detected in
pots with grass. This apparent fixed N2 was either supplied via free-living or associative N2
fixing bacteria or an artefact due to absorption of 15N-labelled ammonia (15NH3) through
stomata (McNeill et al. 1994). Ammonia contamination of the 15N2 gas cannot be excluded.
Because of the relatively low importance, these two 15N sources may only have introduced
minor error in the calculated symbiotic N2 fixation for the grass-clover pots. In contrast,
they might have caused overestimation of the determined transfer of symbiotically fixed
N2. When the 15N enrichment of grass shoots in mixture is corrected for 15N enrichment of
grass shoots in pure stand, then the transfer of fixed N amount to 0.7 ± 0.1 mg N m-2 d-1,
which represented 1.7 ± 0.3 % of the N accumulated in grass shoot during the labelling
period.
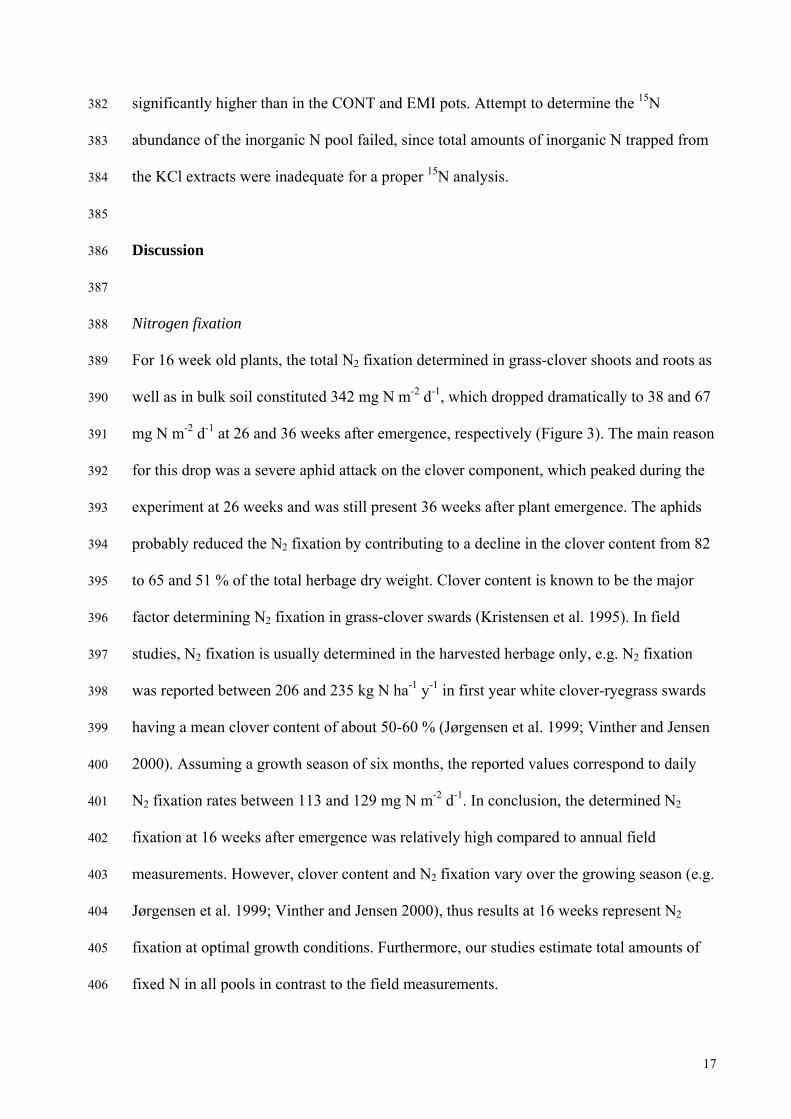
N2O emission and soil water content
Total N2O emission changed significantly over time (P = 0.0004) and was 91, 416 and 259
μg N2O-N m-2 d-1 at 16, 26 and 36 weeks after emergence, respectively (Figure 5 A).
15
Emission of 15N labelled N2O was detected at 16 weeks after emergence only and could
theoretically derive from 1) biological N
357
358
359
360
361
362
363
364
365
366
367
368
369
370
371
372
373
374
375
376
377
378
379
380
381
2 fixation in clover, 2) biological N2 fixation by
free-living or associative bacteria, or 3) 15NH3 contamination of the 15N2 gas. However, the
two latter sources appeared to be minor as no 15N labelled N2O was detected at 26 and 36
weeks after emergence. At 16 weeks, emission of N2O-N derived from biologically fixed
N2 constituted 1.6 ± 0.2 μg N2O-N m-2 d-1. Thus, 3.2 ± 0.5 ppm of the N2 fixed by 16 week
old clover was emitted as N2O, which accounted for 2.1 ± 0.5 % of the total N2O emission.
Loss of N2O from grass pots measured at 36 weeks after emergence was 22 μg N2O-N m-2
d-1 and did not differ significantly from the emission measured from grass-clover pots at 16
weeks. The advancement of the N2O emission was found to be similar to that of the soil
water content (Figure 5 A, B). The intention was to keep soil water content of the pots at
60-65 % of the water-holding capacity during N2O emission measurements. However,
because of excessive irrigation in the labelling cabinet prior to gas measurements, and low
transpiration rate at 26 and 36 weeks, the mean soil water content of grass-clover pots was
65, 90 and 80 % of the water-holding capacity at 16, 26 and 36 weeks after emergence,
respectively (P = 0.0031) (Figure 5 B). Soil water content of grass pots at 36 weeks was 64
%. Emission of 15N2 from the grass-clover pots was assessed at 16 weeks after emergence,
however it was found to be below the detection limit.
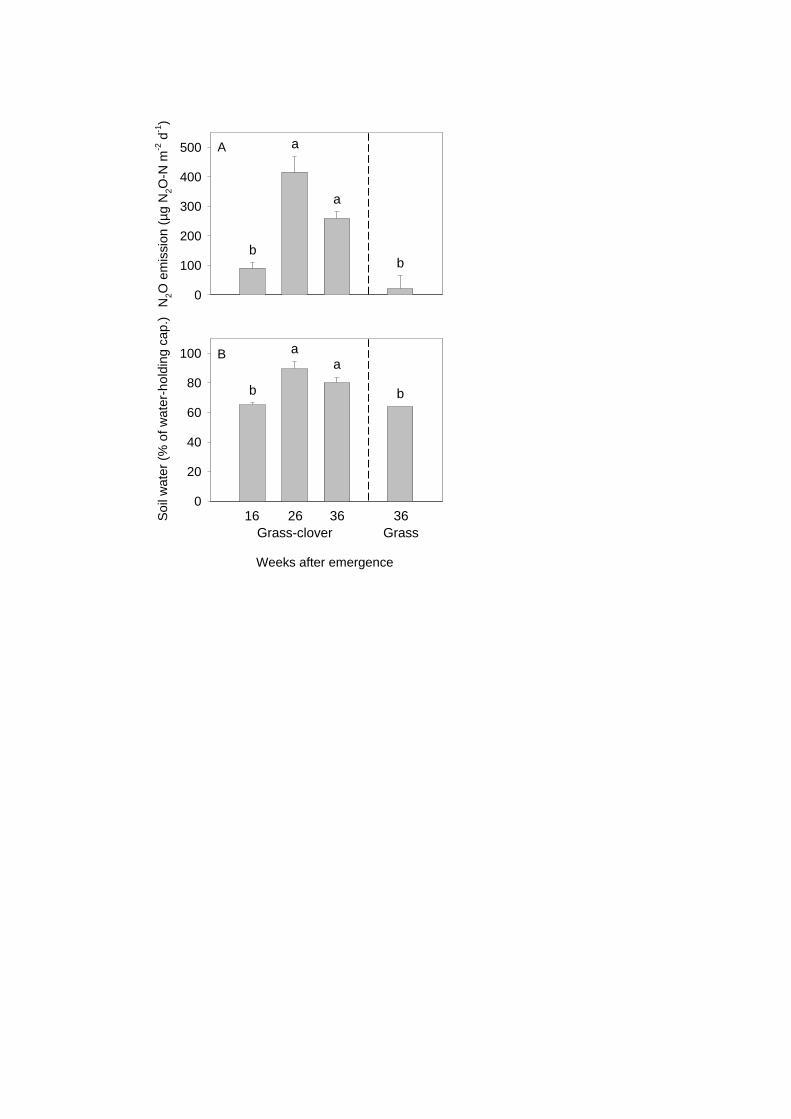
Soil inorganic nitrogen in grass-clover pots
The content of soil inorganic N varied between the experiments, i.e. the median of
inorganic N was significantly lower at 16 weeks after emergence than at 36 weeks (Figure
6). The change was mainly a result of increased ammonium content. Soil inorganic N in
the FIX pots corresponded to 75, 1582 and 327 mg N m-2 (0-17 cm soil layer) at 16, 26 and
36 weeks after emergence, respectively. At 26 weeks, the content in FIX pots was
16
significantly higher than in the CONT and EMI pots. Attempt to determine the 15N
abundance of the inorganic N pool failed, since total amounts of inorganic N trapped from
the KCl extracts were inadequate for a proper
382
383
384
385
386
387
388
389
390
391
392
393
394
395
396
397
398
399
400
401
402
403
404
405
406
15N analysis.
Discussion
Nitrogen fixation
For 16 week old plants, the total N2 fixation determined in grass-clover shoots and roots as
well as in bulk soil constituted 342 mg N m-2 d-1, which dropped dramatically to 38 and 67
mg N m-2 d-1 at 26 and 36 weeks after emergence, respectively (Figure 3). The main reason
for this drop was a severe aphid attack on the clover component, which peaked during the
experiment at 26 weeks and was still present 36 weeks after plant emergence. The aphids
probably reduced the N2 fixation by contributing to a decline in the clover content from 82
to 65 and 51 % of the total herbage dry weight. Clover content is known to be the major
factor determining N2 fixation in grass-clover swards (Kristensen et al. 1995). In field
studies, N2 fixation is usually determined in the harvested herbage only, e.g. N2 fixation
was reported between 206 and 235 kg N ha-1 y-1 in first year white clover-ryegrass swards
having a mean clover content of about 50-60 % (Jørgensen et al. 1999; Vinther and Jensen
2000). Assuming a growth season of six months, the reported values correspond to daily
N2 fixation rates between 113 and 129 mg N m-2 d-1. In conclusion, the determined N2
fixation at 16 weeks after emergence was relatively high compared to annual field
measurements. However, clover content and N2 fixation vary over the growing season (e.g.
Jørgensen et al. 1999; Vinther and Jensen 2000), thus results at 16 weeks represent N2
fixation at optimal growth conditions. Furthermore, our studies estimate total amounts of
fixed N in all pools in contrast to the field measurements.
17

407
408
409
410
411
412
413
414
415
416
417
418
419
420
421
422
423
424
425
426
427
428
429
430
431
N2O emission
Total N2O emission from the grass-clover pots was 91, 416 and 259 μg N2O-N m-2 d-1 at
16, 26 ad 36 weeks after emergence, respectively (Figure 5 A), which is in the same order
of magnitude as emissions determined for other extensively managed grasslands containing
legumes (e.g. Carran et al. 1995; Wang et al. 1997). The increase in N2O emission between
16 and 26 weeks after plant emergence might relate to the aphid-induced clover shoot
death. The reason is that shoot death leads to decay of roots and nodules (Butler et al.
1959), which may act as a carbon source for denitrifying bacteria. Also, Beck and
Christensen (1987) showed that N2O emission increased when all above-ground ryegrass
was removed or when grass leaves turned yellowish.
Soil inorganic N content tended to be higher at 26 and 36 weeks after emergence
than at 16 weeks (Figure 6), which was probably due to increased mineralisation of clover
tissues combined with decreased clover N uptake. In addition to this, the elevated soil
water content during the labelling at 26 weeks (Figure 5 B) may have caused the
remarkably high soil inorganic N content in the FIX pots. During the following N2O
measurements, the soil was allowed to dry slightly, which enabled nitrification in aerobic
microsites. In conclusion, at 26 and 36 weeks after plant emergence N2O loss via
denitrification was favoured by high availability of inorganic N, labile carbon compounds
and anaerobic microsites.
Soil water content is often found to be a key factor influencing N2O emissions (e.g.
Carran et al. 1995; Ruz-Jerez et al. 1994). Comparing N2O emission from grass and grass-
clover pots (Figure 5 A) having the same soil water content (Figure 5 B – grass-clover at
16 weeks, grass at 36 weeks) reveals a tendency for higher N2O emission from the grass-
clover pots. This conforms with results obtained by Duxbury et al. (1982) indicating that
18

legumes can increase N2O emissions by factor two to three compared to unfertilised grass
swards.
432
433
434
435
436
437
438
439
440
441
442
443
444
445
446
447
448
449
450
451
452
453
454
455
456
Transfer of fixed N
It is generally acknowledged that transfer of N from white clover to companion grass
mainly involves the long-term mineralisation of dead clover tissues taking place on a scale
of months (e.g. Goodman 1988; Ledgard 1991). In addition to the long-term N release, a
pool of relatively easily degradable clover residues (e.g. exudates, lysates, secretion and
decaying fine roots) may contribute to soil inorganic N on a short-term scale, viz. within
days or weeks after elimination from the clover plant. Consistent with this view, Laidlaw et
al. (1996) observed high release of inorganic N from clover indicating a total turnover of
clover root N within three months. In the present study, release of recently fixed N into the
soil probably took place through this latter pathway.
Transfer of recently fixed N from clover to companion grass was observed in the
FIX pots at 26 and 36 weeks after emergence only. However, at 16 weeks recently fixed N
was emitted as N2O, demonstrating that recently fixed N was released from the clover
component into the soil at that time. In line with this, an increase in 15N abundance of grass
shoots was detected eight days later in the EMI pots, indicating a slower transfer rate for
16 week old mixtures. The reason could be the high competition for light at 16 weeks
(clover content 82 %), which seemed to suppress ryegrass growth and thereby N uptake
(Table 2 A). On the other hand, the observed transfer at 26 and 36 weeks may be explained
by improved light conditions (clover content 65 and 51 %), which tended to stimulate
ryegrass growth and N uptake (Table 2 B, C). This conclusion is consistent with results
attained by Høgh-Jensen and Schjoerring (2000), showing highest N transfer in spring and
autumn, where white clover growth is low and the growth of ryegrass is high.
19

Fixed N transferred from clover to grass constituted 1.7 ± 0.3 % of the N
accumulated in grass shoots during the labelling period. In contrast, two other
457
458
459
460
461
462
463
464
465
466
467
468
469
470
471
472
473
474
475
476
477
478
479
480
481
15N2 studies
showed no transfer of fixed N from white clover to companion ryegrass in a 19 and 129
day experiment (McNeill et al. 1994; McNeill and Wood 1990). However, long-term field
studies using the 15N dilution technique have reported apparent transfer of fixed N from
white clover to companion ryegrass in the range 0 to 80 % of the grass N content (Boller
and Nösberger 1987; Ledgard 1991), with the percentage increasing over time after
labelling. The transfer of fixed N found in the present study is low compared to the
mentioned studies, which supports the general view that short-term N transfer via easily
degradable clover residues is less important than the long-term transfer through decay of
more recalcitrant clover tissues.
It is striking that recently fixed N was transferred to companion grass at 26 and 36
weeks after emergence, but was not detected in the emitted N2O. This could indicate that
ryegrass and the N2O producing bacteria utilized different pools of labile N in the soil. One
reason may be differences in the spatial distribution of grass roots and N2O producing
bacteria in relation to the zones of clover residue release. Another explanation may be that
the fixed N was less available for the nitrifiers and denitrifiers, either due to amino acid
uptake by the grass (Falkengren-Grerup et al. 2000) or because N was mostly transferred
directly through common mycorrhizal mycelium (Frey and Schüepp 1992).
N2O-N derived from fixed N2
Recently fixed N released via easily degradable clover residues may be important in the
flow from N2 fixation to N2O emission. However, the present study revealed that only 3.2
± 0.5 ppm of the recently fixed N was emitted as N2O on a daily basis. Furthermore,
recently fixed N accounted for 2.1 ± 0.5 % of the emitted N2O-N only. A large part of the
20

remaining N2O-N was most likely derived from previously fixed N2, which indicates that
long-term N release through decay of more recalcitrant clover tissues probably contributes
considerably to the flow from N
482
483
484
485
486
487
488
489
490
491
492
493
494
495
496
497
498
499
500
501
502
503
504
505
506
2 fixation to N2O emission.
The standard IPCC N2O emission factor of 1.25 % is criticised by some authors for
overestimating the N2O emission from mineral fertilizer (e.g. Lægreid and Aastveit 2002)
and by others for underestimating the long-term effect of manure and mineral fertilizer
application (e.g. Schmid et al. 2001). According to the methodology currently
recommended by IPCC, the national N2O inventories should not include the contribution
from biological N2 fixation in grasslands (IPCC 1997). Some countries, e.g. Denmark and
Switzerland, nonetheless include quantitative estimates of biological N2 fixation in
grasslands in their N2O inventory, using an emission factor of 1.25 % as for other N inputs
(Schmid et al. 2001; Mikkelsen et al. 2005).
However, the standard N2O emission factor of 1.25 % might be considerably
unrepresentative for biologically fixed N2 as only a part of the fixed N is mineralised
during the lifetime of the crop (Petersen and Olesen 2002), and because the mineralisation
occurs slowly (Velthof et al. 1998). The extent to which clover N released through
mineralisation will give rise to N2O emission from the sward depends on several factors.
First, it depends on the sinks for inorganic N, e.g. uptake by grass and clover,
immobilisation in microbial biomass and loss by leaching. Second, it depends on whether
the abiotic conditions favour N2O production, e.g. temperature, carbon source and O2 level,
mainly regulated by the soil water content. Goodman (1991) showed that white clover
primarily contributes to soil organic matter in autumn. In line with this, Garret et al. (1992)
found that under mild conditions, 70 % of the annual N2O emission from a white clover-
ryegrass pasture occurred during autumn and winter. In the present study, the N2O
emission was measured under temperature and soil water regimes representative of
21

summer conditions. However, even under conditions more favourable for N2O emission,
the contribution of recently fixed N to the N
507
508
509
510
511
512
513
514
515
516
517
518
519
520
521
522
523
524
525
526
527
528
529
530
531
2O emission would still be minor.
Via modelling, Schmid et al. (2001) estimated the N2O emission factor for
biologically fixed N2 in permanent grasslands to be 0.22 %. However, after steady state in
soil carbon and nitrogen was reached, the emission factor increased to 0.56 %. Obviously,
these emission factors are associated with extremely large uncertainties. Ruz-Jerez et al.
(1994) found that the annual N2O emission represented about 1 % of the N input by
legume fixation in grazed grass-clover swards. The N2O loss often increased following a
grazing period, mainly because of N return in animal excreta. Thus, the estimated emission
factor includes the contribution from N2 fixation as well as the effect of grazing. In
contrast, the effect of grazing animals is accounted for separately in the IPCC
methodology.
Biological N2 fixation in grass-legume swards should not be neglected as a source
of N2O in the national greenhouse gas inventories, especially not when considering the
large area of Europe covered by managed grasslands. However, based on the present study
and data from the literature we find it unlikely that the N2O emission factor for biologically
fixed N2 in grass-clover swards would reach the standard emission factor of 1.25 %.
Conclusions
Our results support the general view that recently fixed N contributes little to the N transfer
from white clover to companion grass. Moreover, only a tiny fraction of the biologically
fixed N2 was lost as N2O over the course of a few weeks, and this fraction represented
about 2 % of the total N2O-N emission. Thus, the long-term mineralisation of dead clover
tissues is probably more important than recently fixed N for the flow from N2 fixation to
N2O emission.
22

532
533
534
535
536
537
538
539
540
541
542
543
544
545
546
547
548
549
550
551
552
Acknowledgements
This work was funded by the Danish Research Centre for Organic Farming (DARCOF)
and the Danish Agricultural and Veterinary Research Council. We wish to thank Svend
Danbæk for creating the temperature-controle-programme for the labelling cabinet, Anja
Nielsen for her assistance with the isotopic analyses and Anders Priemé, Henning Høgh-
Jensen and Daniel Carter for their useful comments on the manuscript.
References
Beck H. and Christensen S. 1987. The effect of grass maturing and root decay on N2O
production in soil. Plant Soil 103: 269-273.
Boller B.C. and Nösberger J. 1987. Symbiotically fixed nitrogen from field-grown white
and red clover mixed with ryegrasses at low levels of 15N-fertilization. Plant Soil 104: 219-
226.
Bouwman A.F. 1996. Direct emission of nitrous oxide from agricultural soils. Nutr. Cycl.
Agroecosys. 46: 53-70.
Butler G.W., Greenwood R.M. and Soper K. 1959. Effects of shading and defoliation on
the turnover of root and nodule tissue of plants of Trifolium repens, Trifolium pratense,
and Lotus uliginosus. New Zeal. J. Agr. Res. 2: 415-426.
Carran R.A., Theobald P.W. and Evans J.P. 1995. Emission of nitrous oxide from some
grazed pasture soils in New Zealand. Aust. J. Soil Res. 33: 341-352.
23

Crutzen P.J. 1981. Atmospheric chemical processes of the oxides of nitrogen, including
nitrous oxide. In: Delwiche C.C. (Ed.) Denitrification, Nitrification and Atmospheric
Nitrous Oxide. John Wiley & Sons, Chichester, pp. 7-44.
553
554
555
556
557
558
559
560
561
562
563
564
565
566
567
568
569
570
571
572
573
574
de Klein C.A.M., Sherlock R.R., Cameron K.C. and van der Weerden T.J. 2001. Nitrous
oxide emissions from agricultural soils in New Zealand - a review of current knowledge
and directions for future research. J. Roy. Soc. New Zeal. 31: 543-574.
Duxbury J.M., Bouldin D.R., Terry R.E. and Tate III R.L. 1982. Emissions of nitrous
oxide from soils. Nature 298: 462-464.
EEA 2002. Greenhouse gas emission trends in Europe, 1999-2000. Topic report 7.
European Environment Agency, Copenhagen.
Falkengren-Grerup U., Månsson K.F. and Olsson M.O. 2000. Uptake capacity of amino
acids by ten grasses and forbs in relation to soil acidity and nitrogen availability. Environ.
Exp. Bot. 44: 207-219.
Firestone M.K. and Davidson E.A. 1989. Microbiological basis of NO and N2O production
and consumption in soil. In: Andreae M.O. and Schimel D.S. (Eds.) Exchange of Trace
Gases Between Terrestrial Ecosystems and the Atmosphere. John Wiley & Sons,
Chichester, pp 7-21.
Frey B. and Schüepp H. 1992. Transfer of symbiotically fixed nitrogen from berseem
(Trifolium alexandrinum L.) to maize via vesicular-arbuscular mycorrhizal hyphae. New
Phytol. 122: 447-454.
Garrett M.K., Watson C.J., Jordan C., Steen R.W.J. and Smith R.V. 1992. The nitrogen
economy of grazed grassland. Proceedings no. 326. The Fertiliser Society, London.
24

Goodman P.J. 1988. Nitrogen fixation, transfer and turnover in upland and lowland grass-
clover swards, using
575
576
577
578
579
580
581
582
583
584
585
586
587
588
589
590
591
592
593
594
595
596
15N isotope dilution. Plant Soil 112: 247-254.
Goodman P.J. 1991. Root turnover and nitrogen cycling in low input grass/clover
ecosystems. In: Atkinson D. (Ed.) Plant Root Growth. An Ecological Perspective.
Blackwell Scientific Publications, London, pp. 267-280.
Høgh-Jensen H. and Schjoerring J.K. 2000. Below-ground nitrogen transfer between
different grassland species: Direct quantification by 15N leaf feeding compared with
indirect dilution of soil 15N. Plant Soil 227: 171-183.
IPCC 1997. Reference manual (Vol. 3). In: Houghton J.T. et al. (Eds.) Revised 1996 IPCC
Guidelines for National Greenhouse Gas Inventories. UK Meteorological Office,
Bracknell.
Jørgensen F.V., Jensen E.S. and Schjoerring J.K. 1999. Dinitrogen fixation in white clover
grown in pure stand and mixture with ryegrass estimated by the immobilized 15N isotope
dilution method. Plant Soil 208: 293-305.
Kristensen E.S., Høgh-Jensen H. and Kristensen I.S. 1995. A simple model for estimation
of atmospherically-derived nitrogen in grass-clover systems. Biol. Agric. Hortic. 12: 263-
276.
Kroeze C., Mosier A. and Bouwman L. 1999. Closing the global N2O budget: A
retrospective analysis 1500 - 1994. Global Biogeochem. Cy. 13: 1-8.
Laidlaw A.S., Christie P. and Lee H.W. 1996. Effect of white clover cultivar on apparent
transfer of nitrogen from clover to grass and estimation of relative turnover rates of
nitrogen in roots. Plant Soil 179: 243-253.
25

Lægreid M. and Aastveit A.H. 2002. Nitrous oxide emissions from field-applied fertilizers.
In: Petersen S.O. and Olesen J.E. (Eds.) Greenhouse Gas Inventories for Agriculture in the
Nordic Countries. DIAS report, Plant Production no. 81. Danish Institute of Agricultural
Sciences, Tjele, pp. 122-134.
597
598
599
600
601
602
603
604
605
606
607
608
609
610
611
612
613
614
615
616
617
618
Ledgard S.F. 1991. Transfer of fixed nitrogen from white clover to associated grasses in
swards grazed by dairy cows, estimated using 15N methods. Plant Soil 131: 215-223.
McNeill A.M., Hood R.C. and Wood M. 1994. Direct measurement of nitrogen fixation by
Trifolium repens L. and Alnus glutinosa L. using 15N2. J. Exp. Bot. 45: 749-755.
McNeill A.M. and Wood M. 1990. Fixation and transfer of nitrogen by white clover to
ryegrass. Soil Use Manage. 6: 84-86.
Mikkelsen M.H., Gyldenkærne S., Olesen J.E. and Sommer S.G. 2005. Opgørelse og
beregningsmetode for landbrugets emissioner af ammoniak og drivhusgasser 1985 - 2002.
Arbejdsrapport fra DMU Nr. 204. National Environmental Research Institute, DK.
Mosier A., Kroeze C., Nevison C., Oenema O., Seitzinger S. and van Cleemput O. 1998.
Closing the global N2O budget: nitrous oxide emissions through the agricultural nitrogen
cycle - OECD/IPCC/IEA phase II development of IPCC guidelines for national greenhouse
gas inventory methodology. Nutr. Cycl. Agroecosys. 52: 225-248.
O'Hara G.W. and Daniel R.M. 1985. Rhizobial denitrification: a review. Soil Biol.
Biochem. 17: 1-9.
Petersen S.O. and Olesen J.E. 2002. Greenhouse Gas Inventories for Agriculture in the
Nordic Countries. DIAS report, Plant Production no. 81. Danish Institute of Agricultural
Sciences, Tjele.
26

Ruz-Jerez B.E., White R.E. and Ball P.R. 1994. Long-term measurement of denitrification
in three contrasting pastures grazed by sheep. Soil Biol. Biochem. 26: 29-39.
619
620
621
622
623
624
625
626
627
628
629
630
631
632
633
634
635
636
637
638
639
SAS Institute 1997. SAS/STAT User’s Guide, Release 6.12. Statistical Analysis Systems
Institute, Cary.
Schmid M., Neftel A., Riedo M. and Fuhrer J. 2001. Process-based modelling of nitrous
oxide emissions from different nitrogen sources in mown grassland. Nutr. Cycl.
Agroecosys. 60: 177-187.
Sørensen P. and Jensen E.S. 1991. Sequential diffusion of ammonium and nitrate from soil
extracts to a polytetrafluoroethylene trap for 15N determination. Anal. Chim. Acta 252:
201-203.
Velthof G.L., van Beusichem M.L. and Oenema O. 1998. Mitigation of nitrous oxide
emission from dairy farming systems. Environ. Pollut. 102, S1: 173-178.
Vinther F.P. and Jensen E.S. 2000. Estimating legume N2 fixation in grass-clover mixtures
of a grazed organic cropping system using two 15N methods. Agr. Ecosyst. Environ. 78:
139-147.
Wang Y.-P., Meyer C.P., Galbally I.E. and Smith C.J. 1997. Comparisons of field
measurements of carbon dioxide and nitrous oxide fluxes with model simulations for a
legume pasture in southeast Australia. J. Geophys. Res. 102: 28013-28024.
Warembourg F.R. 1993. Nitrogen fixation in soil and plant systems. In: Knowles R. and
Blackburn T.H. (Eds.) Nitrogen Isotope Techniques. Academic Press, London, pp 127-
156.
27

Wood M. and McNeill A.M. 1993. 15N2 measurement of nitrogen fixation by legumes and
actinorhizals: theory and practice. Plant Soil 155/156: 329-332.
640
641
28

CompressorGrowth lampsInfra-red gas analyserPotassium hydroxide scrubComputer RelaysSolenoid valve Soda lime scrub
CGLIRGAKOHPCRSSLS
TTPTB
Toggle valveTemperature probeTedlar bag to prevent over-pressureFanTube for irrigationTube for collection of condensatePipe or tubeWiring and signal direction
GL
C
TP
R
CO2
PC
STB
15N2
Pump
T
KOH/SLS
T
Timer
IRGA

Time (hours)0 50 100 150 200 250 300
15N
abu
ndan
ce o
f N2 (
atom
%)
0.0
0.5
1.0
1.5
2.0
2.516 weeks26 weeks36 weeks

Weeks after emergence16 26 36
N2 f
ixat
ion
(mg
N m
-2 d
-1)
0
100
200
300
400
500
600 FIX potsEMI pots
a b
c cc c

Clover shoot
RootDead shootGrass shoot
16 weeks
26 weeks
36 weeks
AN
2O e
mis
sion
(µg
N2O
-N m
-2 d
-1)
0
100
200
300
400
500
b
a
a
b
B
Weeks after emergence
Soil
wat
er (%
of w
ater
-hol
ding
cap
.)
0
20
40
60
80
100
16 36 3626 Grass-clover Grass
b a
a
b
16 weeks
Soi
l ino
rgan
ic N
(g N
m-2
)
0.0
0.3
0.6
0.9
1.2
1.5
1.8 NO3-N CV 7-61%NH4-N CV 8-36%
36 weeks
CONT FIX EMI
Soi
l ino
rgan
ic N
(g N
m-2
)
0.0
0.3
0.6
0.9
1.2
1.5
1.8
26 weeks
Soi
l ino
rgan
ic N
(g N
m-2
)
0.0
0.3
0.6
0.9
1.2
1.5
1.8
a ab b
a
c
b
b ab
a

Table 1. Biomass (g dry matter m-2) of the fractions clover shoot, dead shoot, grass shoot and root in grass-clover and grass pots at the start (START), for control (CONT), for determination of N2 fixation (FIX) and for determination of N2O emission (EMI), (A) 16 weeks, (B) 26 weeks and (C) 36 weeks after emergence; n = 4, means and SE (in brackets).
A. 16 weeks
Fraction
Clover shoot 402 (42) 548 (44) 493 (34) 645 (47)
Grass shoot 124 (8) 147 (10) 109 (5) 146 (4) 190 (13) 211 (8) 207 (3)
Root 431 (75) 322 (38) 221 (19) 257 (40) 235 (27) 190 (20) 218 (25)
Living biomass a 957 (116) 1017 (74) 823 (52) 1048 (78) 424 (34) 400 (23) 425 (25)
B. 26 weeks
Fraction
Clover shoot 392 (47) 341 (60) 302 (34) 271 (40)
Dead shoot 177 (16) 205 (25) 198 (16) 226 (20)
Grass shoot 127 (3) 183 (6) 158 (8) 193 (7) 312 (22) 293 (27) 266 (6)
Root 214 (11) 277 (29) 273 (13) 276 (36) 239 (29) 226 (30) 232 (22)
Living biomass a 734 (55) 802 (85) 733 (36) 740 (70) 551 (36) 518 (56) 499 (20)
C. 36 weeks
Fraction
Clover shoot 274 (27) 235 (62) 260 (75) 221 (55)
Dead shoot 334 (35) 327 (23) 330 (21) 424 (22)
Grass shoot 245 (16) 254 (5) 224 (9) 281 (14) 309 (8) 385 (12) 312 (14)
Root 238 (15) 314 (31) 275 (37) 207 (34) 194 (26) 245 (36) 184 (19)
Living biomass a 756 (23) 802 (86) 759 (102) 709 (100) 504 (26) 630 (40) 497 (15)
START CONT FIX EMI
Grass-clover pots
START CONT
Grass pots
FIX
Grass-clover pots Grass pots
– – –
START CONT FIX EMI
CONT FIX
– – –
START
– – –
Grass-clover pots Grass pots
START CONT FIX EMI
– – –
START CONT FIX
– – –
a Living biomass includes the fractions clover shoot, grass shoot and root.

Table 2. Amount of N (g N m-2) in the fractions clover shoot, dead shoot, grass shoot and root in grass-clover and grass pots at the start (START), for control (CONT), for determination of N2 fixation (FIX) and for determination of N2O emission (EMI), (A) 16 weeks, (B) 26 weeks and (C) 36 weeks after emergence; n = 4, means and SE (in brackets).
A. 16 weeks
Fraction
Clover shoot 10.9 (0.6) 16.0 (1.3) 15.4 (0.4) 21.7 (1.8)
Grass shoot 1.58 (0.06) 1.71 (0.06) 1.57 (0.07) 1.95 (0.09) 1.69 (0.15) 1.94 (0.10) 1.85 (0.08)
Root 4.60 (0.67) 3.88 (0.68) 2.25 (0.11) 4.16 (0.46) 1.49 (0.15) 1.01 (0.06) 1.21 (0.15)
Living biomass a 17.1 (1.1) 21.6 (1.9) 19.3 (0.5) 27.8 (2.3) 3.18 (0.29) 2.96 (0.14) 3.06 (0.22)
B. 26 weeks
Fraction
Clover shoot 9.55 (1.50) 6.76 (1.14) 6.44 (0.81) 5.57 (0.60)
Dead shoot 3.81 (0.39) 4.49 (0.57) 3.96 (0.28) 4.84 (0.44)
Grass shoot 1.66 (0.05) 2.02 (0.09) 1.90 (0.08) 2.29 (0.13) 2.73 (0.16) 2.64 (0.16) 2.44 (0.04)
Root 3.48 (0.28) 4.95 (0.61) 4.85 (0.49) 4.47 (0.59) 1.49 (0.16) 1.43 (0.14) 1.58 (0.20)
Living biomass a 14.7 (1.7) 13.7 (1.7) 13.2 (1.0) 12.3 (1.0) 4.23 (0.21) 4.07 (0.30) 4.02 (0.18)
C. 36 weeks
Fraction
Clover shoot 5.09 (0.64) 5.39 (1.42) 6.16 (1.45) 5.04 (1.25)
Dead shoot 6.52 (0.68) 7.12 (0.46) 7.84 (0.59) 9.56 (0.91)
Grass shoot 2.15 (0.11) 2.59 (0.10) 2.72 (0.07) 3.07 (0.09) 2.90 (0.04) 3.30 (0.13) 3.13 (0.11)
Root 3.52 (0.30) 4.45 (0.64) 3.50 (0.42) 2.82 (0.51) 1.19 (0.12) 1.56 (0.14) 1.39 (0.24)
Living biomass a 10.8 (0.7) 12.4 (2.1) 12.4 (1.8) 10.9 (1.8) 4.09 (0.11) 4.85 (0.27) 4.51 (0.33)
START CONT FIX EMI
Grass-clover pots
START CONT
Grass pots
FIX
Grass-clover pots Grass pots
– – –
START CONT FIX EMI
CONT FIX
– – –
START
– – –
Grass-clover pots Grass pots
START CONT FIX EMI
– – –
START CONT FIX
– – –
a Living biomass includes the fractions clover shoot, grass shoot and root.

Table 3. Nitrogen-15 abundance (atom%) of the fractions clover shoot, dead shoot, grass shoot, root and soil in pots for control (CONT), determination of N2 fixation (FIX) and determination of N2O emission (EMI) at 16, 26 and 36 weeks after emergence, (A) grass-clover pots, (B) grass pots; n = 4, means.a b
A. Grass-clover pots
Fraction CONT FIX EMI CONT FIX EMI CONT FIX EMI
Clover shoot 0.3661 0.4787 0.4754 0.3659 0.3857 0.3783 0.3660 0.4077 0.4185
Dead shoot – – – 0.3662 0.3697 0.3685 0.3661 0.3672 0.3669
Grass shoot 0.3669 0.3675 0.3689 0.3659 0.3683 0.3677 0.3660 0.3677 0.3672
Root 0.3667 0.3994 0.4054 0.3666 0.3742 0.3696 0.3666 0.3760 0.3771
Soil 0.3688 0.3692 0.3697 0.3692 0.3692 0.3689 0.3691 0.3691 0.3692
16 weeks 26 weeks 36 weeks
B. Grass pots
Fraction CONT FIX CONT FIX CONT FIX
Shoot 0.3673 0.3680 0.3667 0.3675 0.3667 0.3671
Root 0.3677 0.3684 0.3676 0.3677 0.3675 0.3676
Soil 0.3694 0.3691 0.3693 0.3692 0.3692 0.3692
16 weeks 26 weeks 36 weeks
a Bold indicates significant increase in 15N abundance from CONT pots to FIX and EMI pots. b Coefficient of variance (CV) of 15N abundance in the fractions clover shoot and root in grass-clover FIX and EMI pots was in the range 0.47-4.18 %. For all remaining fractions CV was in the range 0.01-0.36 %.


![Rhizobium leguminosarum bv. trifolii strain SRDI943 are major contributors of biologically fixed nitrogen (N. 2) to mixed farm- ing systems throughout the world [3,4]. In Aus-tralia,](https://img.pdfslide.us/doc/110x75/5aa1e3d47f8b9a84398c4d77/rhizobium-leguminosarum-bv-trifolii-strain-srdi943-are-major-contributors-of-biologically.jpg)