Embed Size (px)
Citation preview
Louisiana State UniversityLSU Digital Commons
LSU Master's Theses Graduate School
2004
Biological treatment of industrial wastewatercontaining high concentrations of linearalkylbenzene sulfonate (LAS)Luis Alberto EspinozaLouisiana State University and Agricultural and Mechanical College, [email protected]
Follow this and additional works at: https://digitalcommons.lsu.edu/gradschool_theses
Part of the Civil and Environmental Engineering Commons
This Thesis is brought to you for free and open access by the Graduate School at LSU Digital Commons. It has been accepted for inclusion in LSUMaster's Theses by an authorized graduate school editor of LSU Digital Commons. For more information, please contact [email protected].
Recommended CitationEspinoza, Luis Alberto, "Biological treatment of industrial wastewater containing high concentrations of linear alkylbenzene sulfonate(LAS)" (2004). LSU Master's Theses. 1448.https://digitalcommons.lsu.edu/gradschool_theses/1448
BIOLOGICAL TREATMENT OF INDUSTRIAL WASTEWATER CONTAINING HIGH CONCENTRATIONS OF LINEAR ALKYLBENZENE SULFONATE
(LAS)
A Thesis Submitted to the Graduate Faculty of the
Louisiana State University and Agricultural and Mechanical College
in partial fulfillment of the requirements for the degree of
Master of Science in Civil Engineering
in
The Department of Civil and Environmental Engineering
by Luis A. Espinoza Rodezno
B.S. Universidad Nacional Autónoma de Honduras, 1995 May, 2004
ii
TABLE OF CONTENTS LIST OF TABLES…………………………………………………………………….…v
LIST OF FIGURES…………………………….……………………………………….vi
ABSTRACT…………………………………………….……………………..…………ix CHAPTER 1 INTRODUCTION…………………………...…………………..1 1.1. Selection and Enrichment of Initial Microbial Populations……………………….2 1.2. Development and Refinement of Opening Strategies………………………..……2 1.3. Sorption Tests……………………………………………………………………..3 1.4. Anti-foaming Agents Testing………………………………………………..……3 1.5. Thesis Organization…………………………………………………………….....4 CHAPTER 2 LITERATURE REVIEW……………………………………….5 2.1. Overview of Linear Alkylbenzene Sulfonates (LAS) …………………………….5 2.2. Biodegradability of LAS………………………………………………..…………6 2.3. Biodegradation of LAS and Other Surfactants in Wastewater Treatment Plants..10 2.4. Sequencing Batch Reactor Technology………………………………………….14 CHAPTER 3 MATERIALS AND METHODS…………………..….……….18 3.1. Overview………………………………………………………………………....18 3.2. Development of LAS Degrading Microbial Population Using Respirometry..….18 3.3. Biomass Production……………………………………………………………...21 3.4. Comparison of Bioreactor Operating Strategies for LAS Biodegradation and Foam Production: SBR, ICEAS, SBBR....……………………………………...27 3.4.1. Reactor Set-Up………………….....…………………………..………………27 3.4.1.1. K1…………………………………………………………….………...27 3.4.1.2. K2……………………………………………………….………….…..28 3.4.1.3. K3………...……………….……………………………………….…...30 3.4.2. LAS Removal…………………………………………………………….........30 3.4.3. Foam Production………………………………………………………………31 3.4.4. Sorption of LAS on Sludge and Polyurethane Foam – Reactor Scale………...32 3.4.5. Special Tests…………………………………………………………………..33 3.4.5.1. Variation in Hydraulic retention Time (HRT) and the Effect on LAS Degradation and Foam Production……………………………………...33 3.4.5.2. ICEAS-Transient Loading Experiments………………………………...33 3.4.5.3. Testing Anti-Foaming Agents in Its Addition to SBR and SBBR……...34 3.4.5.4. Batch Sorption Experiments…………………………………………….36 3.4.5.5. Sludge Volume Index (SVI)…………………………………………….38 3.4.5.6. Chemical Oxygen Demand (COD) Balance in the SBR and ICEAS…...38 3.5. Analytical Techniques…………………………………………………………...38 3.5.1. Total Organic Carbon (TOC)………………………………………………….38 3.5.2. Methylene Blue Active Substances (MBAS)…………………………………39 3.5.3. Oxygen Uptake Rate (OUR)…………………………………………………..40
iii
3.5.4. Total Suspended Solids (TSS)………………………………………………...40 3.5.5. Chemical Oxygen Demand (COD)..…………………………………………..40 3.5.6. Sludge Volume Index (SVI)………..…………………………………………41 3.5.7. Ammonia, Nitrate, and Nitrite………………………………………………...41 CHAPTER 4 RESULTS AND DISCUSSION………………………………..42 4.1. Microbial Population Development……………………………………………...42 4.1.1. Respirometer Results Using Sodium Deodecyl Sulfate (LAS)………….…....42 4.1.2. Respirometer Results Using Sodium Deodecylbenzene Sulfonate (LAS)……49 4.2. Biomass Production……………………………………………………………...58 4.3. Comparison of Bioreactor Operating Strategies for LAS Biodegradation and Foam Production: SBR, ICEAS, SBBR…………………………………………62 4.3.1. LAS Removal .......................................................……………………………62 4.3.1.1. LAS Removal in K1-Sequencing Batch Reactor (SBR)………………..62 4.3.1.2. LAS Removal in K2- Intermittent Cycle Extended Aeration System (ICEAS)…………………………………………………………….…...70 4.3.1.3. LAS Removal in K3- Sequencing Batch Biofilm Reactor (SBBR)..…...77 4.3.2. Reactor Sorption Measurements………………………………………………86 4.3.2.1. Sorption of LAS in the SBR (K1)……………………………………….86 4.3.2.2. Sorption of LAS in the ICEAS (K2)…………………………………….88 4.3.2.3. Sorption of LAS in the SBBR (K3)……………………………………..88 4.3.3. Special Tests…………………………………………………………………..91 4.3.3.1. Variation in Hydraulic Retention Time (HRT) and the Effect on LAS Degradation and Foam Production……………………………………...91 4.3.3.2. Transient Loading Experiments in the ICEAS……………………….....92 4.3.3.3. Addition of Anti-Foaming Agents in the SBR (K1) and SBBR (K3)…..94 CHAPTER 5 OVERALL CONCLUSIONS AND RECOMMENDATIONS FOR FUTURE RESEARCH………………………………..…99 Conclusions…………………………………………………………………..…..99 REFERENCES………………………………………………………………………...104 APPENDIX
1. TESTING ANTI-FOAMING AGENTS..………………………………...….107 2. TOC CONCENTRATIONS AS FUNCTION OF TIME FOR
RESPIROMETER BOTTLES……………………………………………….113 3. SBR DATA………………………………………………………………….....116
4. ICEAS DATA…………………………………………………………….……118
5. SBBR DATA…………………………………………………………………...120
6. COD BALANCE……………………………………………………………....123
iv
7. FOAM HIGHT IN SBR………………………………………………………125
8. BATCH SORPTION DATA - SBR AND ICEAS………………………..….126
VITA……………………………………………...……………………………………127
LIST OF TABLES Table 3.1: Nutrients solutions concentrations…………………………………………19
Table 3.2: TOC and COD equivalents for SDS and LAS………………...…...………20 Table 3.3: Summary of experiments performed using the Comput-OX Respirometer.22
Table 3.4: R1, R2, and R3 Reactor operation…………………………………………26
Table 3.5: Amount of LAS degradation, foam production, and sorption tests performed in reactors………………………………………………………32 Table 3.6: Anti-foaming agents evaluated in this study……………………………….35
Table 3.7: Amounts of biomass from K1 and K2 used on batch sorption test………..37
Table 4.1: First order rate constants for SDS degradation in Experiments I,II, and III………………………………………………………………………44
Table 4.2: Total organic carbon (TOC) removal and oxygen consumption in Experiments I, II, and III using sodium dodecylsulfate ..………………….49
Table 4.3: Total organic carbon removal and oxygen consumption in Experiments IV, V ,and VI using sodium dodecylbenzene sulfonate (i.e., LAS)...……..53
Table 4.4: Summary of results from Experiments VII, VIII and IX using LAS………55
Table 4.5: First order rate constants for LAS degradation in Experiments IV to IX….57
Table 4.6: Sludge Volume Index values for the SBR (K1)……………………………68
Table 4.7: Sludge Volume Index values for the ICEAS (K2)…………………………76
Table 4.8: Cycle length description for the SBBR during the first 31 cycles…………79
Table 4.9: LAS sorption in the SBR…………………………………………………..87
Table 4.10: Percentages of LAS sorbed in the SBBR based on calculation on mass balance……………………………………………………………………..89 Table 4.11: Summary of Freundlich parameters for LAS (as TOC) sorption to polyurethane foam…………………………………………………………90
v
LIST OF FIGURES Figure 2.1: Structure of 3-(4-sulphophenyl) dodecane (3-C12-LAS)…………………………...6
Figure 2.2: Chemical structure of C8-DATS (left) and SDS (right)……………………………..7
Figure 2.3: Biodegradation pathway of LAS……………………………………………………9
Figure 3.1: Schematic diagram of laboratory-scale reactor configuration……………………..23
Figure 3.2: ICEAS laboratory scale schematic cycle diagram…………………………………29
Figure 4.1: Oxygen uptake rate (top) and TOC concentrations (bottom) as function of time for Experiment I using SDS. For SDS concentrations for which there were duplicate respirometer bottles, the data depicted are the average……………………………43
Figure 4.2: Oxygen uptake rate (top) and TOC concentrations (bottom) as function of time for Experiment II using SDS. …………………………………………………………45 Figure 4.3: Oxygen uptake rates (top) and TOC concentrations (bottom) as a function of time
during Experiment III using SDS………………………….……...……………….46 Figure 4.4: Results for 1000 mg/L SDS sample monitored for 40 days. Oxygen uptake rate
(top), and TOC consumption (bottom)…………………………………………….47 Figure 4.5: Oxygen uptake rate for Experiment IV using LAS (top), and TOC consumption
over time (bottom)………...…………………………………………………….…50 Figure 4.6: Oxygen uptake rate for Experiment V using LAS (top) and TOC consumption over time (bottom)……………………….………………………………………...51 Figure 4.7: Oxygen uptake rate for experiment VI using LAS (top) and TOC consumption over time (bottom)…………………...…………………………………….………52 Figure 4.8: Average oxygen uptake rate (OUR) from Experiments VII and VIII (top) and TOC
consumption (bottom). Error bars denote the range of concentrations measured…54 Figure 4.9: Average oxygen uptake rate (OUR) from Experiment IX (top) and TOC and MBAS
consumption (bottom)………………………...……………………….…………...56 Figure 4.10: Overall performance of R1 (doted line shows the transition of surfactant type in the
influent from SDS to LAS)………………..……………….………..……….…….59 Figure 4.11: Overall performance of R2 in terms of TOC removal………………………….….60
Figure 4.12: Overall performance of R1-NEW in terms of TOC removal………………....…...61
vi
Figure 4.13: Overall performance of R3 in terms of TOC removal………...………………..….61
Figure 4.14: TOC concentration in influent, within cycles, and effluent (top) and MBAS concentration in the influent and effluent (bottom) during K1 operation (SBR)….63
Figure 4.15: Average TOC values within the five-day cycle in the SBR (top), average MBAS
(middle), and OUR (bottom)...………………………..……………………………64 Figure 4.16: Foam production as a function of time during the REACT period in the SBR (K1).
Data shown are the average of measurements collected during cycles 15,16, 21, 22, and 36. Error bars represent the range of foam heights measured during the testing cycles………………………………………….….………………………….……..65
Figure 4.17: Foam height observed in K1 during the 10-minute interval between air supply to the
reactor (average data collected during cycles 15,16, 21, and 22). Time zero in the graph corresponds to the start of the 30-second interval when aeration was supplied)……………………………………………………………...…………….66
Figure 4.18: Mixed Liqueur Suspended Solids (MLSS) in the reactor measured at the end of
every cycle (top), and TSS of the clarified effluent from the SBR (K1)…...……...67 Figure 4.19: COD mass balance on cycle 37 for the SBR………………………………………69 Figure 4.20: Overall performance of K2. TOC concentrations in the influent, effluent, and within
cycles (top), and MBAS concentrations of the influent and effluent (bottom) during ICEAS operation………………………………………………..……………….…71
Figure 4.21: Performance of K2 within cycles. TOC (top), MBAS (middle), and OUR
(bottom)……………………………………………………………………....…….73 Figure 4.22: Foam production as a function of time in the ICEAS. Data shown are the average
measurements collected during cycles 3 to 8.……………….……………..…..…..74 Figure 4.23: Mixed Liqueur Suspended Solids (MLSS) in the reactor measured at the end of
every cycle (top), and TSS of the clarified effluent from the ICEAS (K2) (bottom)………………………………………………………………...……….….75
Figure 4.24: COD mass balance on cycle 22 for the ICEAS……………………………………77 Figure 4.25: Effluent Total Suspended Solids (TSS) for K3……………….…………….……...78 Figure 4.26: Performance of K3 during the first 31 cycles in terms of TOC (top) and MBAS
(bottom) concentrations…………………………….……………………………...79 Figure 4.27: Average pH values in a three-day cycle in the SBBR (data from cycles 9-11)…....81 Figure 4.28: TOC concentrations in the influent, effluent and within cycles (top) and influent- effluent MBAS concentrations (bottom) during the SBBR operation………....…..83
vii
Figure 4.29: Average TOC and MBAS values within two days in SBBR (top), three days (middle), and four days (bottom) cycles in the SBBR…………………....…….….84
Figure 4.30: Comparison of foam production during cycles 33-36 (top), and 52-56 (bottom) ...85 Figure 4.31: Freundlich adsorption isotherm for LAS (top) and Langmuir isotherm (bottom)
sorption onto K1 biomass (measured as TOC)……………………..……………...88 Figure 4.32: Freundlich adsorption isotherm for LAS (measured as TOC) sorption on to Zander
polyurethane foam…………………………………………………………………90 Figure 4.33: Overall behavior of ICEAS during transient loading experiments. Time zero is the
start of the React period during cycle 11…………….………………………..…...93 Figure 4.34: Average foam height measured during transient loading experiments in cycles 12
and 17 in the ICEAS……………………………………………..………………...94 Figure 4.35: Comparison between foam height measured during regular cycles and using
antifoaming agent Callaway 3142 at 25 mg/L in cycle 32……….…………..……95 Figure 4.36: TOC (top) and MBAS (bottom) concentrations from cycles 30 to 37 in the SBR.
Anti-foaming agent 3142 was tested in cycles 32 (25mg/L) and 33 (50 mg/L) in the SBR (K1)…………………………………………...…………………………...…97
Figure 4.37: TOC and MBAS concentrations from cycles 43 to 59 in the SBBR. Antifoaming
agent Callaway 3142 was tested in cycles 45 (25 mg/L), and 58 (50 mg/L)………98
viii
ABSTRACT
Lauryl Alkylbenzene Sulfonate (LAS) is the major anionic surfactant used worldwide in
detergent and household cleaning product formulations. Its biodegradation and removal has
been extensively studied in wastewater treatment facilities and laboratory-scale tests at low
concentrations (<10 mg/L) typical of those encountered in municipal wastewater treatment
plants. Less effort, however, has been expended investigating degradation of higher
concentrations of LAS representative of those expected in wastewater generated at LAS
manufacturing operations.
The research described in this thesis was conducted to study biological processes for
treating wastewaters containing high concentrations (e.g., 400 mg/L) of LAS. Initial
experiments were carried out using a respirometry technique, and subsequently, three different
laboratory-scale bioreactor systems. The three systems studied were a Sequencing Batch Reactor
(SBR), a Sequencing Batch Biofilm Reactor (SBBR), and an Intermittent Cycle Extension
Aeration System (ICEAS). The SBR and ICEAS were operated on a five-day cycle basis with a
hydraulic retention time of four days. The SBBR was operated mainly in a two-day cycle having
a hydraulic retention time of ten days as well, and polyurethane foam cubes were used as a
support medium for attached biomass growth.
The three systems were compared on their ability to remove LAS measured in terms of
total organic carbon (TOC) and methylene blue active substances (MBAS). The reactors were
also compared on the basis of foam production. The ICEAS showed the best performance in
terms of controllable foam production while exhibiting a capacity for effectively dealing with
transient periods of elevated loading. When a short Fill period was used, the SBR and SBBR had
the disadvantage of producing excessive foaming, and an intermittent aeration strategy was
required avoid overflow.
ix
CHAPTER 1 INTRODUCTION
Linear alkylbenzene sulfonates are widely used as surfactants in formulated detergent
products. Because of their use in household and industrial detergents, LAS is discharged into
wastewater collection systems worldwide. A substantial body of literature suggests that when
present at relatively low concentrations, LAS can be removed from wastewater by sorption to
biomass, or alternately, LAS can be biodegraded, in which case it loses its tensioactive
properties. Although many studies reported in the literature have examined the fate of LAS in
municipal wastewater treatment plants and the fate of LAS discharged to the environment, there
have been relatively few reports on biodegradation of LAS at high concentrations such as those
present in wastewaters generated from LAS manufacturing.
The goal of the research described was to investigate the removal of high concentrations
of LAS (400 mg/L) from synthetic industrial wastewater using biological processes. This
objective was inspired by the desire to effectively treat an industrial wastewater stream at a
manufacturing facility in Honduras that contains high concentrations of LAS. At the facility of
concern, wastewater with an average LAS concentration of approximately 350 mg/L is currently
treated through a dissolved air flotation system combined with the addition of cationic polymers
for the removal of LAS. At the facility where the wastewater is generated, there are currently
four aerated lagoons with a hydraulic residence time of five days according to the flow rate of
the wastewater produced in the facility. Operational costs may be reduced if the polymer usage
during the DAF stage could be reduced if the wastewater containing the LAS could be treated
using the available lagoon system. Thus, research described in this thesis was conducted to
investigate alternatives for biological treatment for wastewaters with high LAS concentrations.
Specifically, research was carried out to compare biodegradation, LAS removal efficiency,
1
foaming, and required hydraulic retention times in bioreactors subjected to three different
operating strategies. The reactor configurations tested included a sequencing batch reactor
(SBR), an Intermittent Cycle Extension Aeration System (ICEAS), and a Sequencing Batch
Biofilm Reactor (SBBR) fed with a synthetic wastewater inflow containing 400 mg/L of LAS.
To achieve the objective listed above, the research was broken down into several tasks,
which are summarized below.
1.1 Selection and Enrichment of Initial Microbial Populations
Laboratory studies employed a respirometry technique to enrich for a population of
microorganisms capable of biodegrading LAS. This action was undertaken for two main reasons:
1) to select for bacterial cultures capable of using it as a primary carbon source due to the similar
chemical structure to LAS, and 2) to verify if high surfactant concentration would have any
inhibitory or bactericide effect due to potential interactions with lipids in the cell wall. A
Comput-OX Respirometer (model OO-244SC from N-CON Systems) was used to develop the
LAS degrading culture. The Comput-OX Respirometer is generally used to assess the ability of
a bacterial population to remove substances from wastewater (treatability or biodegradability)
and to determine the effect of substances in the bacteria (e.g., inhibition or toxicity). Cultures
developed using the respirometer were used as an inoculum in subsequent bioreactor operation
experiments described in Section 3.3.
1.2 Development and Refinement of Operating Strategies
Experiments employed three laboratory-scale reactors. One of the reactors was operated
as a Sequencing Batch Reactor (SBR), the second reactor as an Intermittent Cycle Extension
Aeration System (ICEAS), and the third reactor as a Sequencing Batch Biofilm Reactor (SBBR).
All three reactors were inoculated with an identical mixture of the culture produced using the
2
respirometer technique described in Section 1.1, and all three reactors were fed with a synthetic
wastewater influent containing an LAS concentration of 400 mg/L. The length of the various
operating periods (i.e., feed, react, settle, draw, and idle), as well the fraction of the reactor
volume decanted per cycle were adjusted as necessary to achieve acceptable wastewater
treatment. Treatment performance was evaluated on the basis of surfactant removal (e.g.,
reduction in soluble Total Organic Carbon (TOC), and methylene blue active substances), foam
production, and settling capacity.
Based on its promising performance in terms of minimal foam production and higher
LAS removal, the ICEAS was selected for testing under additional loading conditions consisting
of even higher influent LAS concentrations (800 mg/L) to asses its performance under transient
loading conditions which may occur in a full-scale treatment system.
1.3 Sorption Tests
The overall removal of LAS from the systems was quantified, and sorption of LAS to
biomass was experimentally measured in an attempt to assess whether LAS removal from the
synthetic wastewater was due to biodegradation, sorption to biomass, or some combination of the
two. Also, batch sorption test were performed with biomass collected form the SBR and ICEAS
to obtain a more clear relationship between the mass of LAS that can be sorbed per mass of
biomass present.
1.4 Anti-foaming Agents Testing
A potential problem of great practical concern in aerobic biodegradation of surfactants is
that the aeration supply, whether surface aerators or bubble diffusers, can cause excessive foam
production. Excessive foam production is an aesthetic concern and it can also cause excessive
loss of biomass. To assess the potential for chemical addition to minimize foam production
3
should it be necessary in the biological treatment process, a screening study was conducted to
evaluate the potential for several different anti-foaming agents to minimize foaming in solutions
containing LAS. Based on the results of the screening study, one of the anti-foaming agents was
selected for further testing in the SBR and SBBR. The ICEAS was not submitted to anti-foam
addition due to the low and controllable quantities of foam produced during the operating cycles.
1.5 Thesis Organization
Chapter two of this thesis contains a literature review summarizing previous studies on
biodegradation of LAS, its fate in the environment, and biological waste treatment processes that
may be applicable for its removal. Chapter three contains a description of the materials and
methods used in experiments. Chapter four contains results and discussion. Chapter five
presents overall conclusions as well as recommendations for future research. References cited
throughout the thesis can be found in the reference section.
4
CHAPTER 2 LITERATURE REVIEW
2.1 Overview of Linear Alkylbenzene Sulfonate (LAS)
Linear alkylbenzene sulfonate (LAS) has become the major cleaning agent for laundry
detergents in most parts of the world (Leon et al., 1990). LAS surfactants were introduced in the
1960’s because they were found to be fully biodegradable, in contrast to the branched chain
products like tetrapropylbenzenesulfonates (Leon et al., 1990). About 2.5 million tons per year
of LAS are produced worldwide (Schulze, 1996), accounting for an estimated 28% of all
synthetic surfactants.
Due their high volume use in consumer products, detergent chemicals have the potential
for broad-scale release into aquatic and terrestrial environments. Following its widespread use as
a household product, LAS is typically disposed of in wastewater. Two primary routes exist for
LAS to enter the environment, (i) effluents from sewage treatment facilities which discharge to
rivers, lakes, and estuaries, and (ii) municipal sludge, which is applied to agricultural lands as a
soil conditioner. The concentration of LAS in municipal wastewater is variable depending on its
use in industrial processes in addition to domestic activities. Average influent concentrations of
1 – 10 mg/L have been reported for municipal wastewater treatment facilities receiving only
municipal wastewaters (Metcalf and Eddy, 1993).
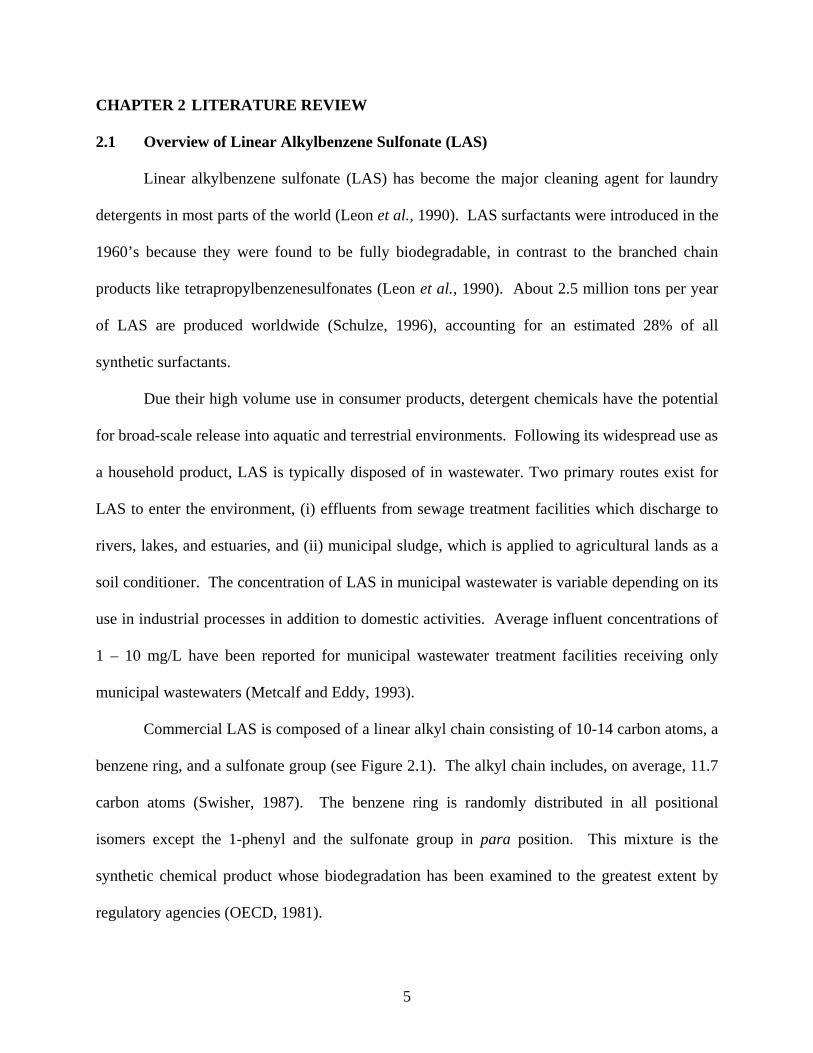
Commercial LAS is composed of a linear alkyl chain consisting of 10-14 carbon atoms, a
benzene ring, and a sulfonate group (see Figure 2.1). The alkyl chain includes, on average, 11.7
carbon atoms (Swisher, 1987). The benzene ring is randomly distributed in all positional
isomers except the 1-phenyl and the sulfonate group in para position. This mixture is the
synthetic chemical product whose biodegradation has been examined to the greatest extent by
regulatory agencies (OECD, 1981).
5
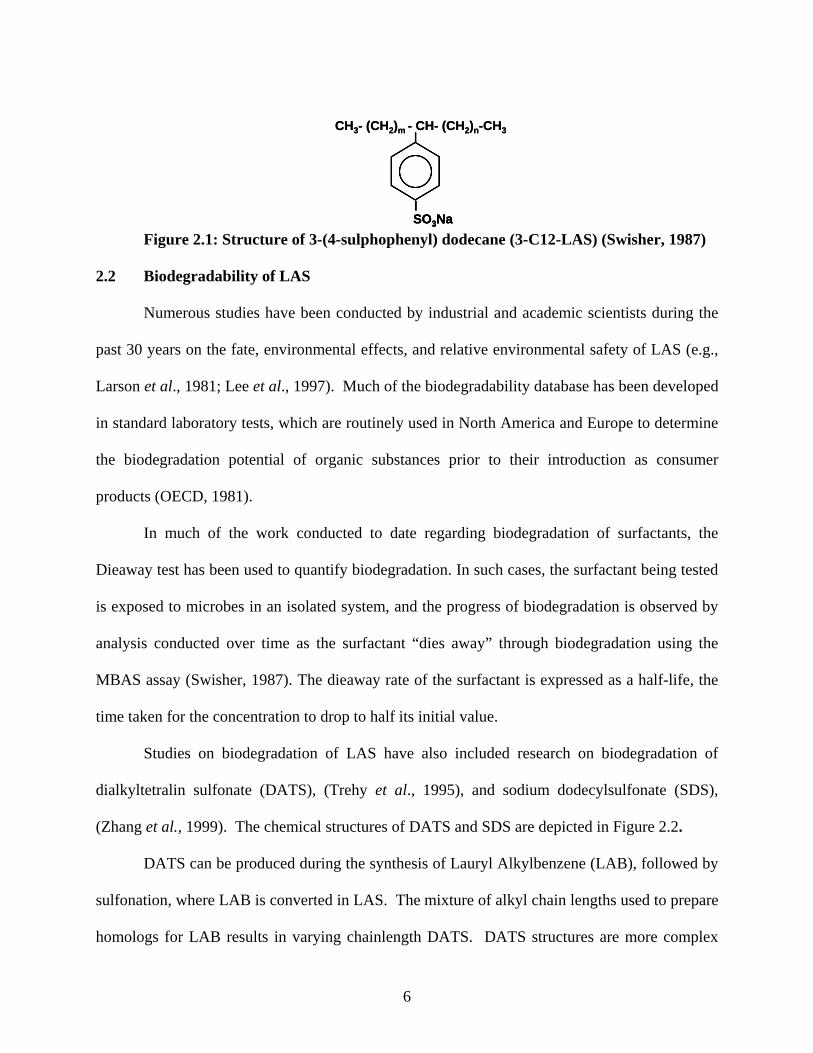
Figure 2.1: Structure of 3-(4-sulphophenyl) dodecane (3-C12-LAS) (Swisher, 1987) SO3Na
CH3- (CH2)m - CH- (CH2)n-CH3
SO3NaSO3Na
CH3- (CH2)m - CH- (CH2)n-CH3
2.2 Biodegradability of LAS
Numerous studies have been conducted by industrial and academic scientists during the
past 30 years on the fate, environmental effects, and relative environmental safety of LAS (e.g.,
Larson et al., 1981; Lee et al., 1997). Much of the biodegradability database has been developed
in standard laboratory tests, which are routinely used in North America and Europe to determine
the biodegradation potential of organic substances prior to their introduction as consumer
products (OECD, 1981).
In much of the work conducted to date regarding biodegradation of surfactants, the
Dieaway test has been used to quantify biodegradation. In such cases, the surfactant being tested
is exposed to microbes in an isolated system, and the progress of biodegradation is observed by
analysis conducted over time as the surfactant “dies away” through biodegradation using the
MBAS assay (Swisher, 1987). The dieaway rate of the surfactant is expressed as a half-life, the
time taken for the concentration to drop to half its initial value.
Studies on biodegradation of LAS have also included research on biodegradation of
dialkyltetralin sulfonate (DATS), (Trehy et al., 1995), and sodium dodecylsulfonate (SDS),
(Zhang et al., 1999). The chemical structures of DATS and SDS are depicted in Figure 2.2.
DATS can be produced during the synthesis of Lauryl Alkylbenzene (LAB), followed by
sulfonation, where LAB is converted in LAS. The mixture of alkyl chain lengths used to prepare
homologs for LAB results in varying chainlength DATS. DATS structures are more complex
6
than LAS due the formation of cis/trans isomers. DATS biodegrades to tetralinsulfonate
carboxylates intermediates (DATSI). Primary biodegradation of DATS and LAS has been
determinated by following the reduction of methylene blue active substances (MBAS) over time.
LAS levels are generally reduced more rapidly than DATS (Trehy et al., 1995). Testing of a 100
µg/L DATS blend for several weeks in a semi-continuous activated sludge system with natural
sewage sludge populations resulted in nearly complete (99%) primary biodegradation, based on
MBAS results under steady-state conditions (Trehy et al., 1995).
NaSO3 (CH2)3
CH3
(CH2)3
CH3
CH3- (CH2)m-CH2- NaSO3
Figure 2.2: Chemical structure of C8- DATS (left) and SDS (right) (Trehy et al., 1995)
SDS is comprised of straight carbon chains, usually 12 to 14, and is incorporated into
household products together with LAS. Due to its more simple structure (i.e., no benzene ring),
SDS can undergo rapid complete mineralization in wastewater treatment facilities within 48
hours (Fendinger et al., 1994). Experiments performed by Zhang et al. (1999) demonstrated that
for a mixed culture of activated sludge from a municipal wastewater treatment plant, incubation
with an SDS concentration between 500 -2500 mg/L increased microbial specific growth rates in
comparison to cultures incubated with lower SDS concentrations (in the range of 0.0379 to
0.0567 h-1), indicating not inhibitory effects.
Half-life values determined for LAS in natural environmental compartments have shown
that biodegradation is a significant removal mechanism for LAS (Larson et al., 1995).
7
According to Larson et al., for low concentrations of LAS (i.e., in the range of 1 to 100 µg/g),
half-lives in aquatic and benthic compartments, where the residence time can vary from days to
weeks, have been observe to be one day or less. Meanwhile, in terrestrial and subsurface
compartments where the residence time can vary from months to years, half-lives in the range
from less than one day to a few weeks have been observed (Takada et al., 1987).
Laboratory-scale tests showed that the rate of LAS removal is biphasic based on kinetic
analysis of radiolabeled LAS using acclimated sludge (Nielsen et al., 1997). Porous Pot
Biodegradation Test System, which asses biodegradation of the test compound simulating a
wastewater activated sludge treatment, showed that the first-order initial rates for LAS removal
were at least twice as fast as the apparent zero-order final rates. This study claims that the initial
rates correspond to both mineralization and incorporation of the radiolabeled LAS into cell
components. The slower, final rate reflects the turnover of the incorporated carbon, or just the
formation of more biologically stable metabolites. However, explanations on the mechanisms or
significance of the final rate are lacking. Overall results showed that 98.4% of the parent LAS
were removed after 45 days. From this, 86.1% suffered ultimate biodegradation conformed by
57.5% of mineralization, measured as %14CO2, and 28.6% incorporated into cell biomass. The
rest, 13.9%, remained as residual in the liquid portion. Half-life ranged between 3.4 and 4.6 days.
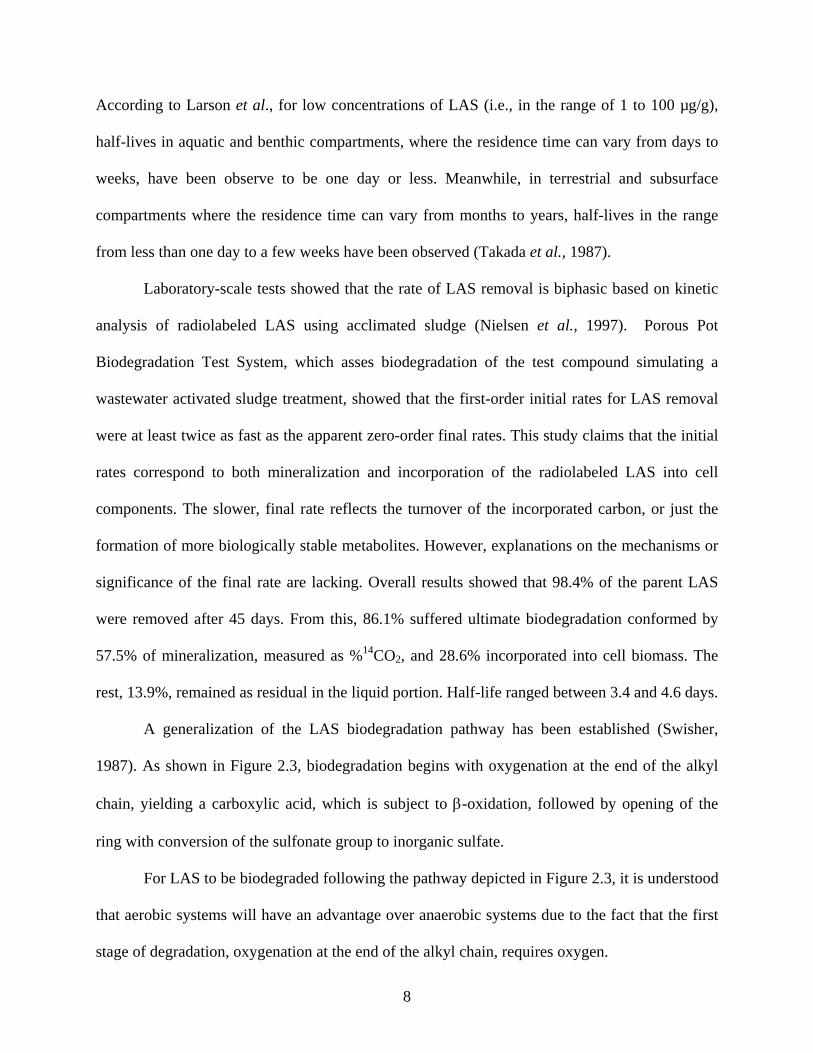
A generalization of the LAS biodegradation pathway has been established (Swisher,
1987). As shown in Figure 2.3, biodegradation begins with oxygenation at the end of the alkyl
chain, yielding a carboxylic acid, which is subject to β-oxidation, followed by opening of the
ring with conversion of the sulfonate group to inorganic sulfate.
For LAS to be biodegraded following the pathway depicted in Figure 2.3, it is understood
that aerobic systems will have an advantage over anaerobic systems due to the fact that the first
stage of degradation, oxygenation at the end of the alkyl chain, requires oxygen.
8
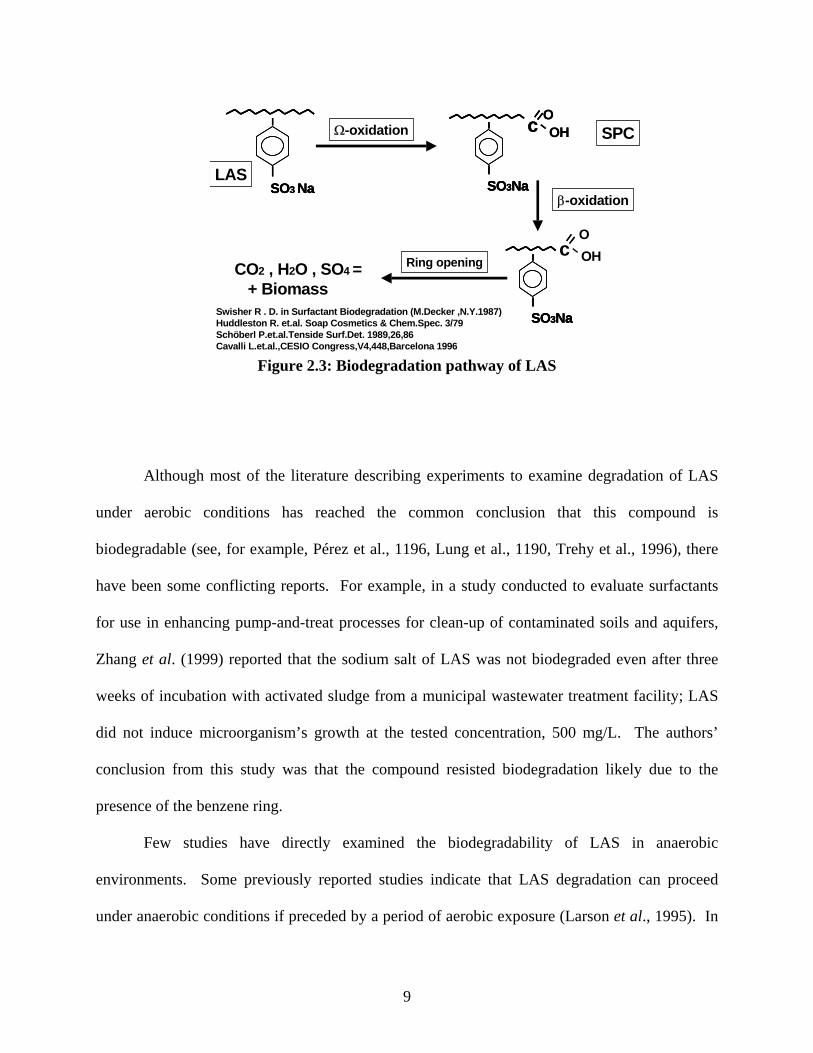
Figure 2.3: Biodegradation pathway of LAS
SO3 Na SO3 Na SO3 Na SO3Na
c OOH
SO3Na SO3Na
c OOHΩ-oxidation
LAS
SPC
SO3Na SO3Na SO3Na
cOOH
β-oxidation
Ring openingCO2 , H2O , SO4 =+ Biomass
Swisher R . D. in Surfactant Biodegradation (M.Decker ,N.Y.1987) Huddleston R. et.al. Soap Cosmetics & Chem.Spec. 3/79Schöberl P.et.al.Tenside Surf.Det. 1989,26,86Cavalli L.et.al.,CESIO Congress,V4,448,Barcelona 1996
Although most of the literature describing experiments to examine degradation of LAS
under aerobic conditions has reached the common conclusion that this compound is
biodegradable (see, for example, Pérez et al., 1196, Lung et al., 1190, Trehy et al., 1996), there
have been some conflicting reports. For example, in a study conducted to evaluate surfactants
for use in enhancing pump-and-treat processes for clean-up of contaminated soils and aquifers,
Zhang et al. (1999) reported that the sodium salt of LAS was not biodegraded even after three
weeks of incubation with activated sludge from a municipal wastewater treatment facility; LAS
did not induce microorganism’s growth at the tested concentration, 500 mg/L. The authors’
conclusion from this study was that the compound resisted biodegradation likely due to the
presence of the benzene ring.
Few studies have directly examined the biodegradability of LAS in anaerobic
environments. Some previously reported studies indicate that LAS degradation can proceed
under anaerobic conditions if preceded by a period of aerobic exposure (Larson et al., 1995). In
9
these studies, a series of 14C-LAS homologs (C10-C14) in concentrations of 100 µg/g were
incubated aerobically for 5-6 hours in activated sludge and then transferred to digester sludge
and incubated under strictly anaerobic (methanogenic) conditions. After a period of aerobic
exposure, mineralization of individual LAS homologs in anaerobic sludge was comparable to
that observed in aerobic sludge. Half-life values for anaerobic degradation ranged from 2.1 to
2.6 days and showed no significant difference as a function of alkyl chain length. The
researchers hypothesized that aerobic exposure allows ω-oxidation of the terminal carbon of the
alkyl side chain. The initial oxidative attack is the only step that requires molecular oxygen.
Once formed, the sulfophenyl carboxylates can be biodegraded via beta-oxidation and ring
hydroxylation/cleavage under strictly anaerobic conditions.
Indirect support for the lack of LAS degradation under anaerobic conditions comes
mainly from studies reporting that high concentrations of LAS are commonly found in anaerobic
digester sludges at municipal wastewater treatment facilities (McEvoy et al., 1986). Studies have
indicated that the inhibition of LAS degradation during anaerobic digestion is due to LAS
toxicity and the exposure time as a factor of influence (Mösche et al., 2002). However, anaerobic
transformation of LAS during digestion of sewage sludge in a CSTR has been achieved when the
surfactant concentration was below 200 mg/L (Angelidaki et al., 2000). It was found that 14-
25% of LAS fed to the anaerobic digester was transformed, and that the transformation was
limited by bioavailability due to sorption and toxic effects as the surfactant concentration
increased.
2.3 Biodegradation of LAS and Other Surfactants in Wastewater Treatment Plants
Although a number of studies (see previous section) have demonstrated that LAS is
biodegradable, that does not mean that it is necessarily biodegraded under conditions imposed in
10
wastewater treatment facilities. To address this latter issue, several studies have been conducted
to determine the fate of LAS during wastewater treatment. One such study encompassed a total
of 50 municipal wastewater sites and included 15 activated sludge systems, 12 trickling filters, 6
oxidation ditches, 8 lagoons, and 9 rotating biological contactor, (RBC), treatment facilities in
the United States (McAvoy et al., 1993). Influent concentrations of LAS for all treatment plants
showed a normal distribution with a mean of 5 mg/L. Average effluent LAS concentrations
ranged from 0.04 mg/L for activated sludge plants to about 1 mg/L for trickling filter plants. A
range of removal rates over 99% for activated sludge treatment and an average of 77% for
trickling filter plants were observed. Average removal of LAS in other treatment plant types
ranged from 96% to 98%.
Results from McAvoy et al., 1993 show close agreement to LAS concentrations
measured from 1973-1986 that were reported by Rapaport and Eckhoff (1990). There is close
agreement in the two studies supporting almost constant influents and effluents over the past 15-
20 years. The more recent study indicates improved activated sludge plant performance over the
1973-1986 results, where an average of only 0.7% versus 0.2% of influent LAS remaining in the
sewage effluent. Similar results were reported in a study performed in Torino, Italy (Cavalli et
al., 1992). The wastewater treatment plant presented a hydraulic retention time (HRT) of 4 days
with a sludge retention time of 12 days, and a MLSS concentration of 2500 mg/L. Although
these studies suggest that low concentrations of LAS can be readily removed from municipal
wastewater using biological processes, some difficulties related to foaming and long retention
times have been found in the treatment of wastewater with high (in the range of 20 to 50 mg/L)
LAS concentrations (McAvoy et al., 1993).
Although LAS has been successfully removed from wastewater by aerobic processes in
full-scale municipal wastewater treatment plants, much of the surfactant load into a treatment
11
facility may be removed by sorption to suspended solids (e.g., MLSS), rather than by direct
biodegradation by aerobic microorganisms. In such cases, at least of a portion of the LAS
removed from the influent wastewater is directed via primary or secondary sedimentation into
sludge management processes. Mösche et al. 2002, suggested that when surfactant-containing
wastewater is fed to a bioreactor, the surfactant concentration will decrease initially due to
adsorption by biomass. The theory postulated by Mösche is supported by studies reported by
Rittmann et al., (2001) where a nonsteady-state model was used to calculate the effects of
community adaptation and sorption kinetics on the fate of LAS in batch experiments with
activated sludge that was fed with different concentrations of LAS. They found that when LAS
stays in solution it will rapidly degrade, but slow desorption of LAS initially sorbed to the sludge
occurs may limit biodegradation rates due to limited bioavailability. Also, it has been found that
concentration of LAS in dewatered sludge ranged between 11 and 16,000 mg/Kg-total solids
depending on the way the sludge is stabilized (Madsen et al., 1999), giving more support to the
concept of sorption of LAS in systems where activated sludges are used.
Aerobic composting of anaerobic sludge, where the highest concentrations of LAS is
normally found in municipal wastewater treatment plants, helps to remove the LAS, but it is not
a common practice done by wastewater treatment facilities (Federle, et al., 1990). LAS has been
reported to be removed in large quantities (>97%) during composting of anaerobic sludge in a
very short period of time. Prats, et al. (2000), reported that the concentration of LAS was
reduced by 50 and 90% of the initial level after 3 and 9 hours, respectively, in the systems that
they studied. LAS removal occurred even during poor composting conditions like poor aeration
and sub-optimal temperatures. In cases where sludge is applied on agricultural soil, where the
nutrient content in utilized for plant growth, it will generally contain LAS. However, LAS is not
12
expected to accumulate in the top layers of the soil, which is supported by studies of vertical
distribution of microbial biomass, activity and biodegradation of LAS in the subsurface of two
soil profiles (Federle, et al., 1990), and biodegradation will occur in the upper soil layers once
the microorganisms present are previously exposed to LAS.
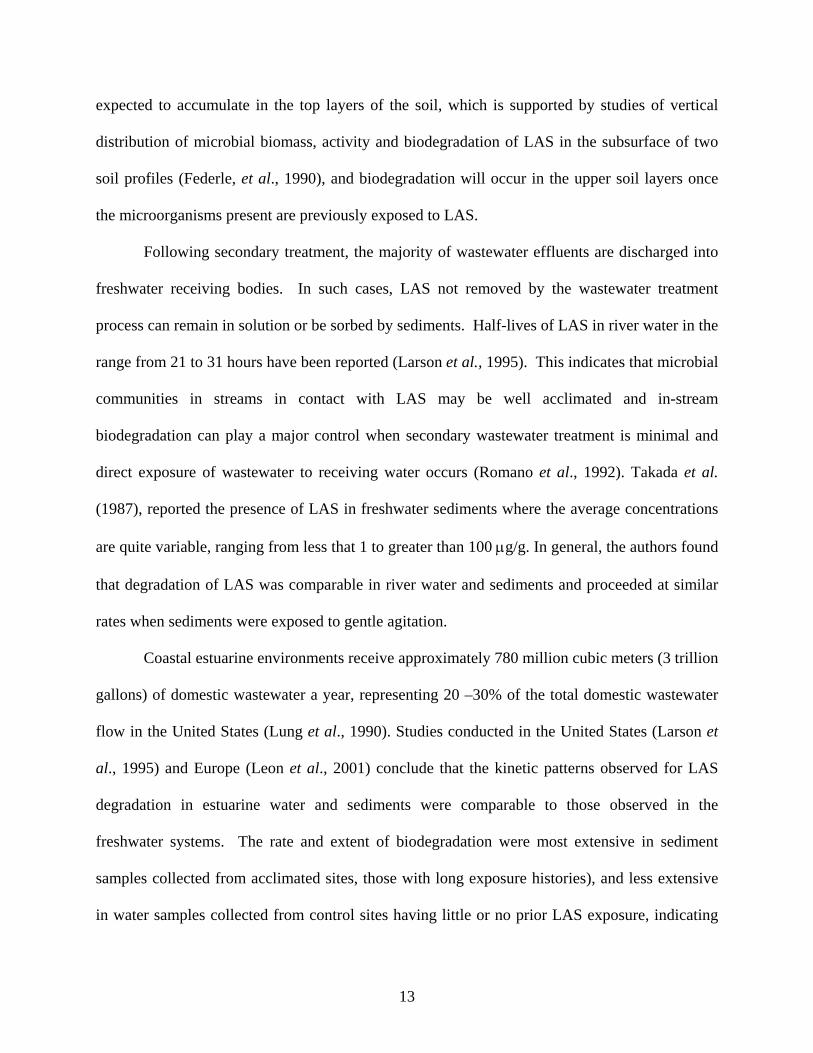
Following secondary treatment, the majority of wastewater effluents are discharged into
freshwater receiving bodies. In such cases, LAS not removed by the wastewater treatment
process can remain in solution or be sorbed by sediments. Half-lives of LAS in river water in the
range from 21 to 31 hours have been reported (Larson et al., 1995). This indicates that microbial
communities in streams in contact with LAS may be well acclimated and in-stream
biodegradation can play a major control when secondary wastewater treatment is minimal and
direct exposure of wastewater to receiving water occurs (Romano et al., 1992). Takada et al.
(1987), reported the presence of LAS in freshwater sediments where the average concentrations
are quite variable, ranging from less that 1 to greater than 100 µg/g. In general, the authors found
that degradation of LAS was comparable in river water and sediments and proceeded at similar
rates when sediments were exposed to gentle agitation.
Coastal estuarine environments receive approximately 780 million cubic meters (3 trillion
gallons) of domestic wastewater a year, representing 20 –30% of the total domestic wastewater
flow in the United States (Lung et al., 1990). Studies conducted in the United States (Larson et
al., 1995) and Europe (Leon et al., 2001) conclude that the kinetic patterns observed for LAS
degradation in estuarine water and sediments were comparable to those observed in the
freshwater systems. The rate and extent of biodegradation were most extensive in sediment
samples collected from acclimated sites, those with long exposure histories), and less extensive
in water samples collected from control sites having little or no prior LAS exposure, indicating
13
the importance of prior exposure on rapid degradation. Close work with bacterial communities
selected from coastal seawater continuously polluted by urban sewage showed that complete
surfactant biodegradation was achieved by the biodegradation pathway described by Swisher
(Sigoillot et al., 1992).
2.4 Sequencing Batch Reactor Technology
Sequencing batch reactor (SBR) systems have been used to remove specific organic
compounds present in industrial effluents (Irvine et al., 1989). SBRs are a specific fill-and-draw
version of the activated-sludge process. Metabolic reactions and solid-liquid separation are
carried out in one tank in a well-defined and continuously repeated time sequence (Wilderer et
al., 1993). Sequencing batch reactors have been used to manipulate both the organisms’
distribution established in the reactor and the physiological state of the organisms developed
(Morgenroth et al., 1998). Physically, the SBR system is a set of tanks that operate on a fill-and-
draw basis. Each tank is filled during a discrete period of time and then operated as a batch
reactor. After treatment of the target compounds, the mixed liquor is allowed to settle and
clarified supernatant is drawn from the tank.
The complete SBR cycle consist in four discrete steps: (1) reactor filling; (2) reaction; (3)
biomass settling; and (4) effluent decanting and discharge. During the fill period, the influent
wastewater containing the target compounds is added to biomass retained in the system after the
previous cycle. The influent volume added can be as little as 25% of the total volume of the
reservoir or as great as 70% of it (Irvine et al., 1989). Degradation of the target compounds,
which may be initiated during the fill period, is completed during the react stage. The duration
of this period is usually dictated by the time where the target compound reaches a desire
concentration. Time dedicated to react can vary from a low of zero to more than 50% of the total
cycle time (Irvine et al., 1989).
14
One of the advantages of sequencing batch reactors is that the same tank serves as
clarifier during quiescent settling conditions. Under these conditions the settle period takes place
and biomass separation is the desired result. After the settle period is complete, the treated
supernatant is removed and discharged during the draw period. The volume to be discharge is
the same as in the fill period, and the time to accomplish it can range from 5 to more than 30% of
the total cycle time. If no wastewater is available (e.g. on industrial application sites), the SBR
can rest in an idle phase. The sum of the phases make up a process cycle that is progressively
repeated. During each cycle, unsteady-state conditions prevail. In the long term, control and
periodic repetition of the short-term unsteady state allows the enhancement of certain effects
such as (a) enzymatic activity, (b) accumulation of metabolic products, and (c) selection and
enrichment of specific groups of microorganisms (Morgenroth et al., 1998).
In a study on biodegradation of alternate types of surfactants, the non-ionic surfactants
Neodol 91-8 and Makon 12, at concentrations between 100 and 500 mg/L, using sequencing
batch reactors (SBRs), Figueroa et al. (1997) demonstrated that biodegradation could be
achieved when acclimated microorganisms were present and an appropriate system operation
was employed. The total times for one SBR cycle were 2, 3, and 10 days for initial surfactant
concentrations of 100, 250, and 500 mg/L respectively. The authors used a mechanical mixer
instead of diffused air as an oxygen supply mechanism to avoid production of foam. Relatively
low (in the range of 5 to 35 mg/L measured as TOC) concentrations of the surfactants at the end
of the treatment where accomplished (Figueroa et al., 1997).
Although the term SBR was originally introduce to describe a specific type of activated
sludge periodic process characterized by continuous repetition of periods of fill, react, settle,
draw, and idle, it is also used to describe various alternate versions of variable volume systems.
15
Variants of the SBR include ICEAS (Intermittent Cycle Extension Aeration System) and SBBR
(Sequencing Batch Biofilm Reactor). The ICEAS process is a variant of an SBR system where
the processes of biological oxidation, nitrification, phosphorous removal and liquids/solids
separation can be achieved continuously in a single tank. What makes the ICEAS process
different is a continuous inflow, even during the settle and decant phases of the operating cycle
(Khararjian et al., 1990). In a conventional SBR, wastewater enters each tank during only a
portion of the operating cycle (i.e., the fill period). An ICEAS process combines activated sludge
and extended aeration principles in a fill-and-draw basis which accommodates continuous inflow
to the tank. The ICEAS relies on a timed sequence of events, whereas traditional SBR systems
may rely on liquid level controls to sequence events. A conventional SBR has required periods
to allow settling and decant, at least two tanks are needed to treat a continuos flow of
wastewater. In an ICEAS system, a single tank may be employed.
The SBBR (Sequencing Batch Biofilm Reactor) combines the benefit of attached growth
process and batch system. The organisms responsible for treatment are attached to the surfaces
of media such as rock, sand, plastic or other materials (Chemical Engineering World, 2001).
Biofilm processes maintain high cell densities and retain cultures of slow growing or poorly
settling microbes that would be washed out in suspended growth systems (Bryers and Characklis,
1990). An SBBR cycle usually consists of three phases: fill, react, and draw, no time for settling
is required. Suspended solids and detached biomass may be retained in the reactor during the
drain phase as a result of filtration processes or they may be discharged. During the fill period,
the flow conditions in the packaging may be laminar, plug-flow conditions; and mixing of
wastewater constituents in flow direction remains limited (Arnz et al., 2000). Periodic operation
of biofilm reactors and the length of the fill period can result in an even distribution of the
16

biomass throughout the reactor and as a result, the entire system is better able to treat large shock
loads compared to a continuous flow process (Wilderer et al., 1993).
17
CHAPTER 3 MATERIALS AND METHODS
3.1 Overview
Initial laboratory studies employed a respirometry technique to enrich for a population of
microorganisms capable of biodegrading LAS. The experimental procedures employed for these
initial experiments are described in Section 3.2. The cultures developed in the initial
respirometer studies were then used as a seed culture to inoculate a series of sequencing batch
reactors (SBRs) as described in Section 3.3. Next, the cultures developed in the initial SBR
experiments were used as a seed culture to inoculate subsequent SBR, ICEAS, and SBBR
experiments during which time a more detailed analysis of operational performance was
conducted, as described in Section 3.4. Analytical techniques employed in the experiments are
described in Section 3.5.
3.2 Development of LAS Degrading Microbial Population Using Respirometry
The respirometry technique for developing an LAS degrading culture employed a model
244SC Comput-OX Respirometer (N-CON Systems, Crawford, GA). The Comput-OX was
calibrated following the manufacturer’s recommended protocol, and two water baths were used
to hold four 500 mL borosilicate glass respirometer reactors each (total of eight reactors).
Temperature was maintained a constant 25ºC. The total liquid volume for each of the reactors
was 350 mL. Oxygen uptake rate readings were recorded at 15-minute intervals.
For initial tests, three different surfactants were used: Sodium Dodecylsulfate (SDS)
(Aldrich 43,614-3), Sodium Dodecylbenzene Sulphonic Acid (SDBS) (Aldrich D-2525), and
Alkylate 225 Sulphonic Acid (Huntsman). For the purposes of clarity, the acronym LAS is used
throughout the remainder of this thesis to refer to the Sodium Dodecylbenzene Suphonic Acid
(SDBS) obtained from Aldrich to clearly differentiate it from the SDS. Stock solutions of each
18
of the surfactants, each containing 10,000 mg/L surfactant, were prepared using deionized water.
Calculations accounted for the fact that the surfactants, as obtained from the vendors, were not
100% purity. For example, the LAS (Aldrich D-2525) was approximately 80% surfactant
including all homologues [main homologues are C10 - C13 with homologue C12 comprising
approximately 20%. The remainder is sodium sulfate and sodium chloride (approximately 17%)
and water (approximately 3%) – data provided by the manufacturer]. Thus, to make a 10,000
mg/L surfactant solution containing LAS, 12,500 mg of Aldrich D-2525 was added per 1.0 L of
solution.
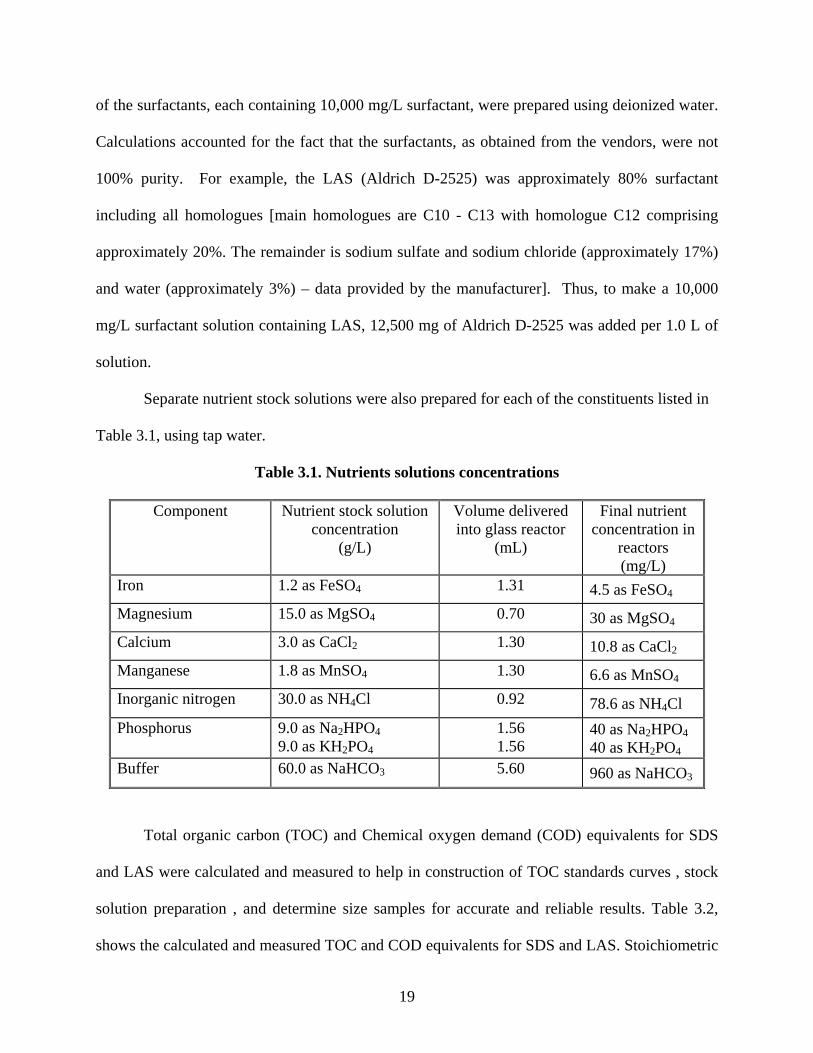
Separate nutrient stock solutions were also prepared for each of the constituents listed in
Table 3.1, using tap water.
Table 3.1. Nutrients solutions concentrations
Component Nutrient stock solution concentration
(g/L)
Volume delivered into glass reactor
(mL)
Final nutrient concentration in
reactors (mg/L)
Iron 1.2 as FeSO4 1.31 4.5 as FeSO4
Magnesium 15.0 as MgSO4 0.70 30 as MgSO4
Calcium 3.0 as CaCl2 1.30 10.8 as CaCl2
Manganese 1.8 as MnSO4 1.30 6.6 as MnSO4
Inorganic nitrogen 30.0 as NH4Cl 0.92 78.6 as NH4Cl Phosphorus 9.0 as Na2HPO4
9.0 as KH2PO4
1.56 1.56
40 as Na2HPO4 40 as KH2PO4
Buffer 60.0 as NaHCO3 5.60 960 as NaHCO3
Total organic carbon (TOC) and Chemical oxygen demand (COD) equivalents for SDS
and LAS were calculated and measured to help in construction of TOC standards curves , stock
solution preparation , and determine size samples for accurate and reliable results. Table 3.2,
shows the calculated and measured TOC and COD equivalents for SDS and LAS. Stoichiometric
19
20
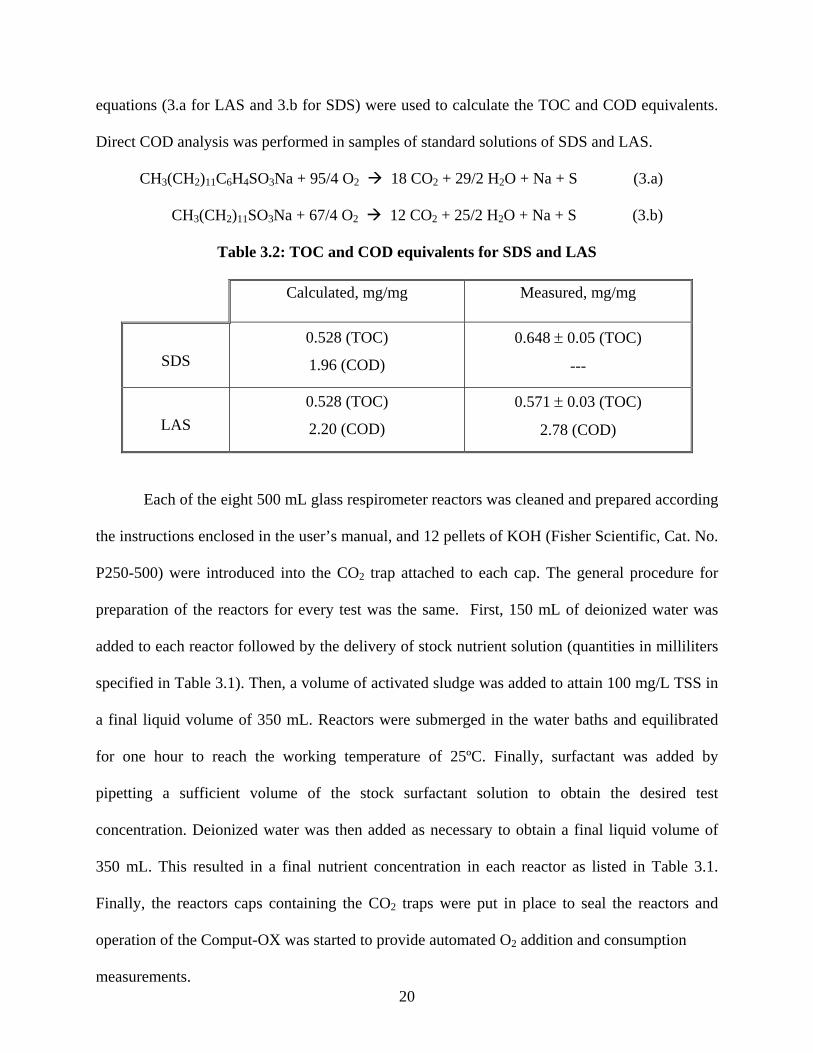
equations (3.a for LAS and 3.b for SDS) were used to calculate the TOC and COD equivalents.
Direct COD analysis was performed in samples of standard solutions of SDS and LAS.
CH3(CH2)11C6H4SO3Na + 95/4 O2 18 CO2 + 29/2 H2O + Na + S (3.a)
CH3(CH2)11SO3Na + 67/4 O2 12 CO2 + 25/2 H2O + Na + S (3.b)
Table 3.2: TOC and COD equivalents for SDS and LAS
Calculated, mg/mg Measured, mg/mg
SDS 0.528 (TOC)
1.96 (COD)
0.648 ± 0.05 (TOC)
---
LAS 0.528 (TOC)
2.20 (COD)
0.571 ± 0.03 (TOC)
2.78 (COD)
Each of the eight 500 mL glass respirometer reactors was cleaned and prepared according
the instructions enclosed in the user’s manual, and 12 pellets of KOH (Fisher Scientific, Cat. No.
P250-500) were introduced into the CO2 trap attached to each cap. The general procedure for
preparation of the reactors for every test was the same. First, 150 mL of deionized water was
added to each reactor followed by the delivery of stock nutrient solution (quantities in milliliters
specified in Table 3.1). Then, a volume of activated sludge was added to attain 100 mg/L TSS in
a final liquid volume of 350 mL. Reactors were submerged in the water baths and equilibrated
for one hour to reach the working temperature of 25ºC. Finally, surfactant was added by
pipetting a sufficient volume of the stock surfactant solution to obtain the desired test
concentration. Deionized water was then added as necessary to obtain a final liquid volume of
350 mL. This resulted in a final nutrient concentration in each reactor as listed in Table 3.1.
Finally, the reactors caps containing the CO2 traps were put in place to seal the reactors and
operation of the Comput-OX was started to provide automated O2 addition and consumption
measurements.
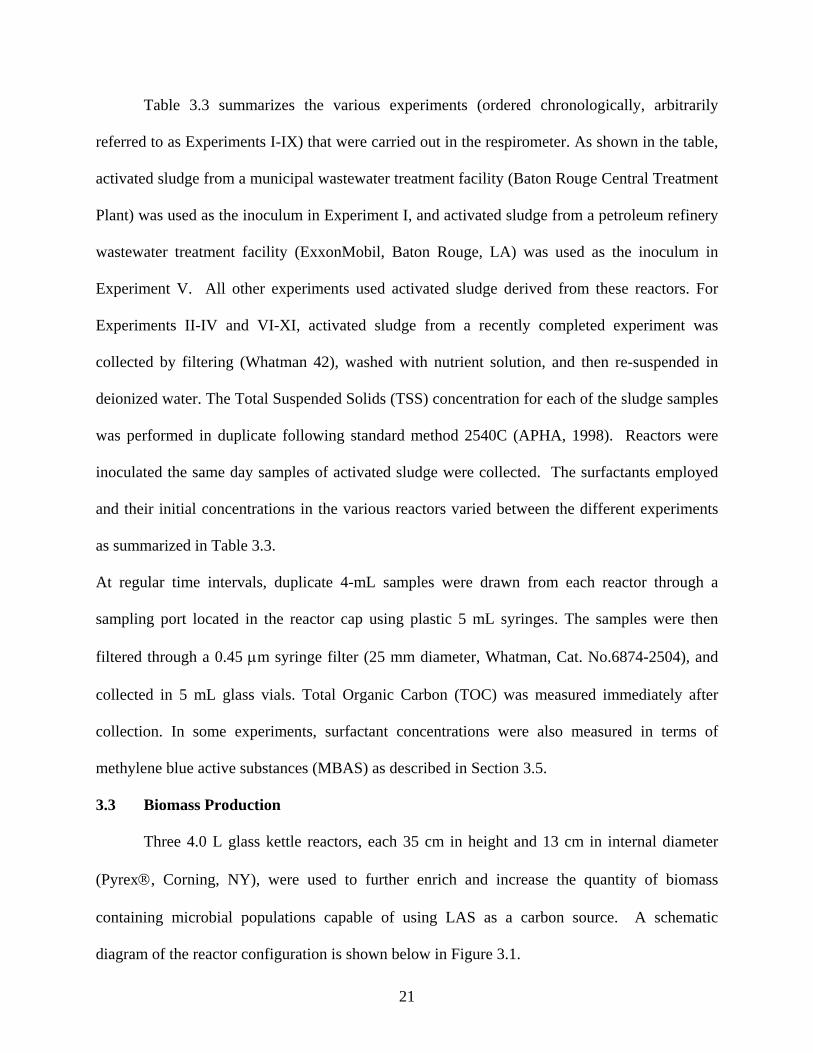
Table 3.3 summarizes the various experiments (ordered chronologically, arbitrarily
referred to as Experiments I-IX) that were carried out in the respirometer. As shown in the table,
activated sludge from a municipal wastewater treatment facility (Baton Rouge Central Treatment
Plant) was used as the inoculum in Experiment I, and activated sludge from a petroleum refinery
wastewater treatment facility (ExxonMobil, Baton Rouge, LA) was used as the inoculum in
Experiment V. All other experiments used activated sludge derived from these reactors. For
Experiments II-IV and VI-XI, activated sludge from a recently completed experiment was
collected by filtering (Whatman 42), washed with nutrient solution, and then re-suspended in
deionized water. The Total Suspended Solids (TSS) concentration for each of the sludge samples
was performed in duplicate following standard method 2540C (APHA, 1998). Reactors were
inoculated the same day samples of activated sludge were collected. The surfactants employed
and their initial concentrations in the various reactors varied between the different experiments
as summarized in Table 3.3.
At regular time intervals, duplicate 4-mL samples were drawn from each reactor through a
sampling port located in the reactor cap using plastic 5 mL syringes. The samples were then
filtered through a 0.45 µm syringe filter (25 mm diameter, Whatman, Cat. No.6874-2504), and
collected in 5 mL glass vials. Total Organic Carbon (TOC) was measured immediately after
collection. In some experiments, surfactant concentrations were also measured in terms of
methylene blue active substances (MBAS) as described in Section 3.5.
3.3 Biomass Production
Three 4.0 L glass kettle reactors, each 35 cm in height and 13 cm in internal diameter
(Pyrex®, Corning, NY), were used to further enrich and increase the quantity of biomass
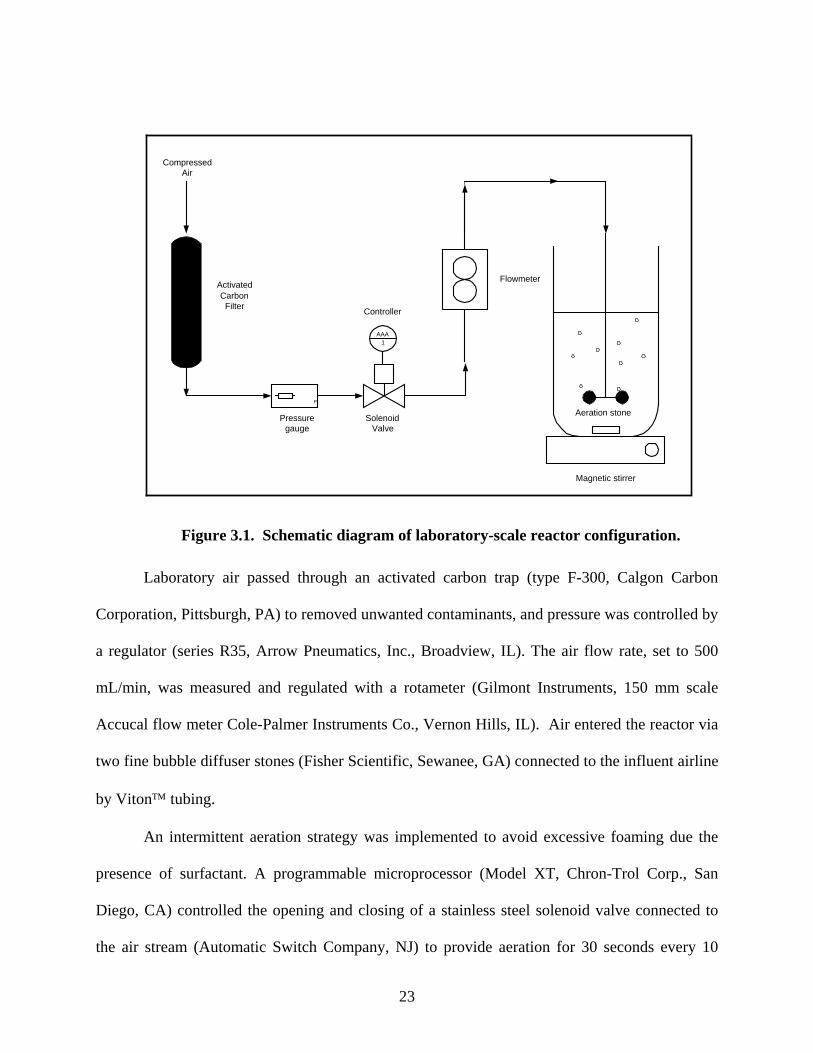
containing microbial populations capable of using LAS as a carbon source. A schematic
diagram of the reactor configuration is shown below in Figure 3.1.
21
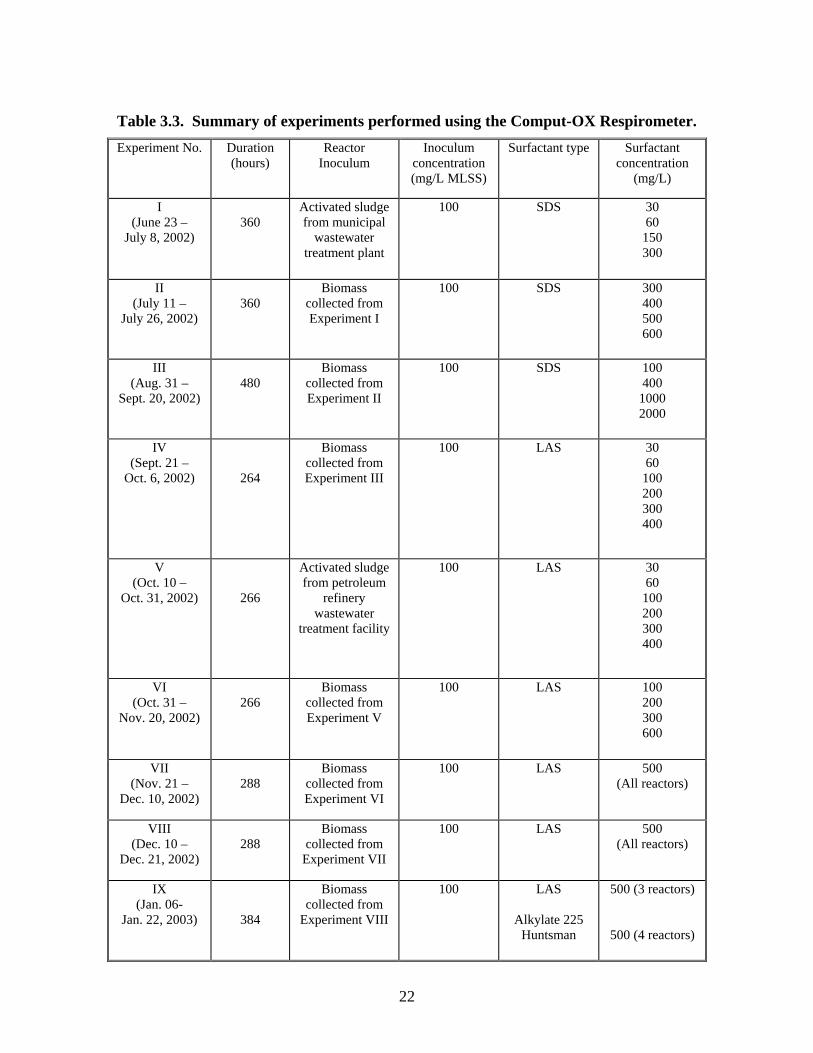
Table 3.3. Summary of experiments performed using the Comput-OX Respirometer. Experiment No. Duration
(hours) Reactor
Inoculum Inoculum
concentration (mg/L MLSS)
Surfactant type Surfactant concentration
(mg/L)
I (June 23 –
July 8, 2002)
360
Activated sludge from municipal
wastewater treatment plant
100 SDS 30 60
150 300
II (July 11 –
July 26, 2002)
360
Biomass collected from Experiment I
100 SDS 300 400 500 600
III (Aug. 31 –
Sept. 20, 2002)
480
Biomass collected from Experiment II
100 SDS 100 400
1000 2000
IV (Sept. 21 –
Oct. 6, 2002)
264
Biomass collected from Experiment III
100 LAS 30 60
100 200 300 400
V (Oct. 10 –
Oct. 31, 2002)
266
Activated sludge from petroleum
refinery wastewater
treatment facility
100 LAS 30 60
100 200 300 400
VI (Oct. 31 –
Nov. 20, 2002)
266
Biomass collected from Experiment V
100 LAS 100 200 300 600
VII (Nov. 21 –
Dec. 10, 2002)
288
Biomass collected from Experiment VI
100 LAS 500 (All reactors)
VIII (Dec. 10 –
Dec. 21, 2002)
288
Biomass collected from
Experiment VII
100 LAS 500 (All reactors)
IX (Jan. 06-
Jan. 22, 2003)
384
Biomass collected from
Experiment VIII
100 LAS
Alkylate 225 Huntsman
500 (3 reactors)
500 (4 reactors)
22
Flowmeter
CompressedAir
P
Magnetic stirrer
Aeration stone
ActivatedCarbon
Filter
AAA1
Controller
SolenoidValve
Pressuregauge
Figure 3.1. Schematic diagram of laboratory-scale reactor configuration.
Laboratory air passed through an activated carbon trap (type F-300, Calgon Carbon
Corporation, Pittsburgh, PA) to removed unwanted contaminants, and pressure was controlled by
a regulator (series R35, Arrow Pneumatics, Inc., Broadview, IL). The air flow rate, set to 500
mL/min, was measured and regulated with a rotameter (Gilmont Instruments, 150 mm scale
Accucal flow meter Cole-Palmer Instruments Co., Vernon Hills, IL). Air entered the reactor via
two fine bubble diffuser stones (Fisher Scientific, Sewanee, GA) connected to the influent airline
by Viton™ tubing.
An intermittent aeration strategy was implemented to avoid excessive foaming due the
presence of surfactant. A programmable microprocessor (Model XT, Chron-Trol Corp., San
Diego, CA) controlled the opening and closing of a stainless steel solenoid valve connected to
the air stream (Automatic Switch Company, NJ) to provide aeration for 30 seconds every 10
23
minutes. This aeration frequency was sufficient to maintain a dissolved oxygen concentration
between 3.5 and 6.5 mg/L during the reactors’ operation. Reactors were placed on magnetic stir
plates to allow mixing using a Teflon-coated stir bar.
The first reactor (arbitrarily named R1) was inoculated using activated sludge collected
from the eight respirometer reactors at the end of Experiment III (September 20, 2002 – see
Table 3.3). The second reactor, R2, used biomass collected from respirometer experiment VI
(November 23, 2002– see Table 3.3), and the third (R3) was inoculated with biomass collected
from respirometer Experiment IX (January 22, 2003 – see Table 3.3). To collect biomass from
the respirometer bottles to inoculate the reactors, the contents of the respirometer bottles were
filtered (Whatman 42) and then washed using a nutrient solution consisting of the following
compounds added to tap water: FeSO4 (4.5 mg/L), MgSO4 (30 mg/L), CaCl2 (10.8 mg/L),
MnSO4 (6.6 mg/L), NH4Cl (78.6 mg/L), Na2HPO4 (40 mg/L), KH2PO4 (40 mg/L), and NaHCO3
(960 mg/L). The washed sludge was then re-suspended in nutrient solution, and the TSS
concentration was measured in duplicate.
An identical start-up procedure was used for each reactor (R1, R2, and R3). The process
consisted of adding a sufficient volume of tap water to the washed activated sludge to result in a
mixed liqueur suspended solids (MLSS) concentration of 2000 mg/L in a volume of 1.25 L. The
reactor was then aerated continuously for 30 minutes before aeration was temporarily stopped
and 1.25 L of synthetic wastewater was added to bring the total reactor volume to 2.5 L with an
MLSS concentration of 1000 mg/L. The synthetic wastewater consisted of the surfactant type
and concentration listed in Table 3.3 along with the nutrient concentrations listed in Table 3.1
added to tap water. Once the reactors were filled, the intermittent aeration cycle was initiated
and controlled by the programmable microprocessor. Table 3.4 summarizes the characteristics,
operation times, and surfactant types to which each reactor was subjected.
24
R1 was operated using a sequencing batch strategy. The complete SBR cycle consisted of
four steps: (A) reactor filling, (B) reaction, (C) solids settling; and (D) decanting and discharge.
After decanting, the sequence was repeated. The reactor was filled to a total liquid volume of 2.5
L and were decanted to 1.25 L of liquid volume (i.e., the fill and draw volume was equal to one
half of the total working volume) using a Cole Palmer Materflex® console drive peristaltic pump
(model 7521-40, Bernant Co, Barrington; IL). The reactor was filled with a synthetic wastewater
influent containing 400 mg/L of surfactant and nutrients in composition and concentrations as
shown in Table 3.4. The first four SBR cycles were five days in length each and SDS was the
surfactant used. The following eight cycles were ten days in length each and the surfactant type
was changed from SDS to LAS.
Total organic carbon, methylene blue active substances, total suspended solids,
and oxygen uptake rate were measured. Two 5 mL samples were taken every day from each
reactor and total organic carbon (TOC) and methylene blue active substances (MBAS) were
measured. Oxygen uptake rate (OUR) was measured at regular intervals. Total suspended solids
(TSS) concentrations were measured in duplicate at the end of the reactor cycles.
R2 and R3 were intended to be an SBR but due to the poor settling quality of the biomass the
process of decanting was ceased. The proper amount of nutrients and LAS was added every five
days to maintain a concentration of 400 mg/L. Mixing of biomass from reactors R1 and R2 was
carried out in an attempt to improve the sludge’s settling characteristics and decrease time
needed for degradation of LAS. Before proceeding to mix the reactors, they were left to settle for
two hours at the end of their operation cycle and 1.875 L was pumped out of each one.
The remaining 0.625 L in reactor R1 were transferred to reactor R2 to get 1.25 L. The
reactor (named R1-NEW) was then filled with 1.25 L of synthetic wastewater to a total volume
25
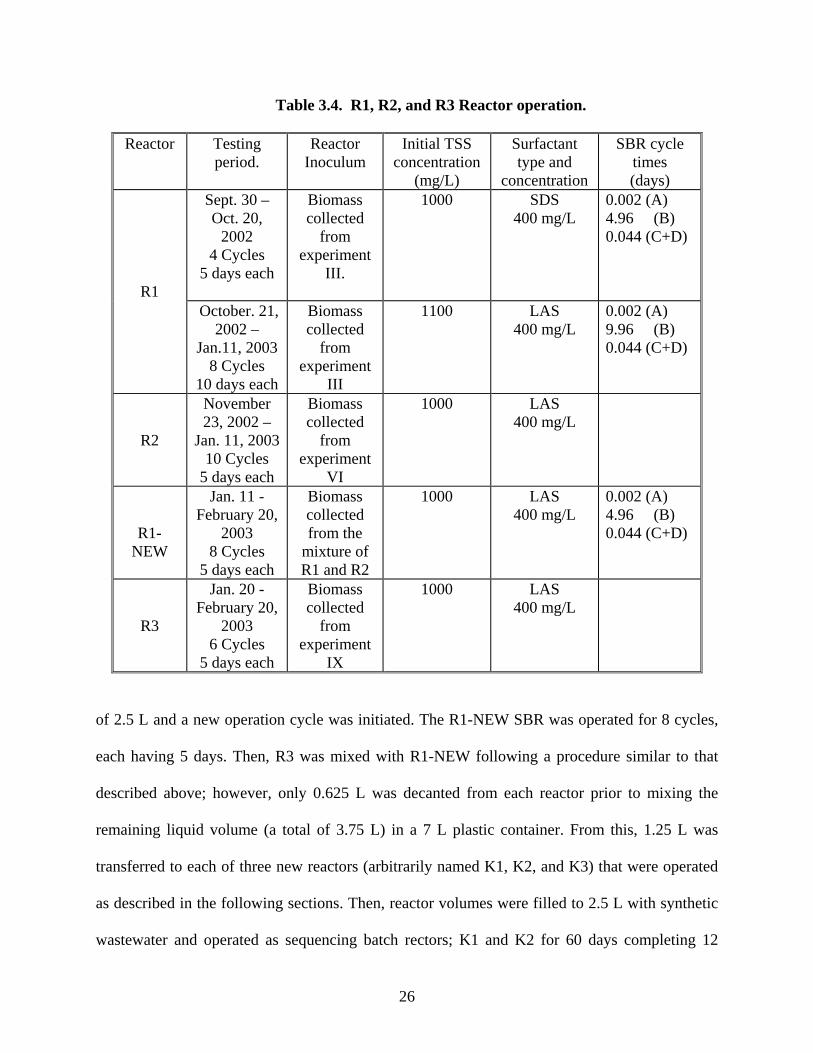
Table 3.4. R1, R2, and R3 Reactor operation.
Reactor Testing period.
Reactor Inoculum
Initial TSS concentration
(mg/L)
Surfactant type and
concentration
SBR cycle times (days)
Sept. 30 – Oct. 20,
2002 4 Cycles
5 days each
Biomass collected
from experiment
III.
1000 SDS 400 mg/L
0.002 (A) 4.96 (B) 0.044 (C+D)
R1 October. 21,
2002 – Jan.11, 2003
8 Cycles 10 days each
Biomass collected
from experiment
III
1100 LAS 400 mg/L
0.002 (A) 9.96 (B) 0.044 (C+D)
R2
November 23, 2002 –
Jan. 11, 2003 10 Cycles
5 days each
Biomass collected
from experiment
VI
1000 LAS 400 mg/L
R1-NEW
Jan. 11 - February 20,
2003 8 Cycles
5 days each
Biomass collected from the
mixture of R1 and R2
1000 LAS 400 mg/L
0.002 (A) 4.96 (B) 0.044 (C+D)
R3
Jan. 20 - February 20,
2003 6 Cycles
5 days each
Biomass collected
from experiment
IX
1000 LAS 400 mg/L
of 2.5 L and a new operation cycle was initiated. The R1-NEW SBR was operated for 8 cycles,
each having 5 days. Then, R3 was mixed with R1-NEW following a procedure similar to that
described above; however, only 0.625 L was decanted from each reactor prior to mixing the
remaining liquid volume (a total of 3.75 L) in a 7 L plastic container. From this, 1.25 L was
transferred to each of three new reactors (arbitrarily named K1, K2, and K3) that were operated
as described in the following sections. Then, reactor volumes were filled to 2.5 L with synthetic
wastewater and operated as sequencing batch rectors; K1 and K2 for 60 days completing 12
26
cycles of 5 days each, and K3 for 15 days (3 cycles of 5 days each). Upon completion, K1 was
continued as an SBR while K2 was transformed into an Intermittent Cycle Extension Aeration
System. K3 was set as a Sequencing Batch Biofilm Reactor with the introduction of
polyurethane foam cubes (Zander, Germany).
3.4 Comparison of Bioreactor Operating Strategies for LAS Biodegradation and Foam Production: SBR, ICEAS, and SBBR
3.4.1 Reactor Set-up
Once the enrichment cultures were developed using SBR operation as described in
Section 3.3, K1, K2, and K3, were operated using different control strategies. Reactor K1 was
operated as an SBR, reactor K2 was operated as an Intermittent Cycle Extension Aeration
System (ICEAS), and reactor K3 was operated as a Sequencing Batch Biofilm Reactor (SBBR).
3.4.1.1 K1
The SBR operation for K1 is the same as that described in Section 3.3. The cycle length
of 5 days, a hydraulic retention time of 10 days, and having a 400 mg/L LAS synthetic
wastewater as a feed. The reactor was filled to 2.5 L and decanted to 1.25 L of liquid volume
(i.e., the fill volume was one half of the total volume). The hydraulic retention time (HRT), is
defined as follows (Metcalf and Eddy, 1991).
HRT = V/Q (3.1)
Where:
V = volume of the reactor (L)
Q = influent flowrate (L/d , 1.25/5)
Operation times for fill, react, solid settling; and decanting and discharge stages were
0.002, 4.96, 0.042 and 0.002 days, respectively. No intentional biomass wasting was performed
during K1 operation other than sampling conducted for analysis of TSS. This decision was made
27
to increase the TSS concentration. Aeration was provided for 30 seconds every 10 minutes as
described in section 3.3.
3.4.1.2 K2
K2 was operated as a sequencing batch reactor for 30 days before its transition to become
an ICEAS. Once the reactor was started to operate as an ICEAS, the system had three distinct
phases in each operating cycle: fill/react, settle; and draw. Even when the system was in the
settling and draw phases, synthetic wastewater was continuously flowing into the bottom of the
reactor. The operation times where 4.956, 0.042, and 0.002 days for fill/react, settling, and draw,
respectively. Like the SBR, the ICEAS was filled to 2.5 L and decanted to 1.25 L of liquid
volume with an HRT of 10 days (i.e., the cycle length was 5 days).
During the operation period (June 28 – October 22, 2003), the reactor was fed
continuously using a Cole Palmer Materflex® L/S digital standard drive peristaltic pump (model
7523-40, Bernant Co, Barrington; IL) which pumped synthetic wastewater containing 400 mg/L
of LAS from a 1 L graduated glass reservoir. The influent was introduced at a flow rate of 0.175
mL/min at the bottom to the reactor by 1/16” Masterflex® tubing (Cole Palmer Cat. No.6412-
14). During the draw period, the treated wastewater was removed from the top of the liquid
volume through a 2-mL plastic pipette attached to a Masterflex® tubing, and a peristaltic pump.
The pipette was manipulated in a way that the tip was always at the surface of the liquid as the
level decreased. This procedure was utilized to minimize withdrawl of settled sludge and
minimize short-circuiting (i.e., removal of untreated influent wastewater), and mimicked
performance of a floating decanter in a full-scale system.
Intermittent aeration was employed during the first 30 days of operation, controlled by a
programmable microprocessor as described in section 3.3. During subsequent operation, the
28
system was aerated continuously. During the period when the system underwent continuous
aeration, a peristaltic pump was used to deliver 100 mL/min of air during the fill/react period.
The air flow rate was monitored by a rotameter. The reactor was placed on a magnetic stir plate
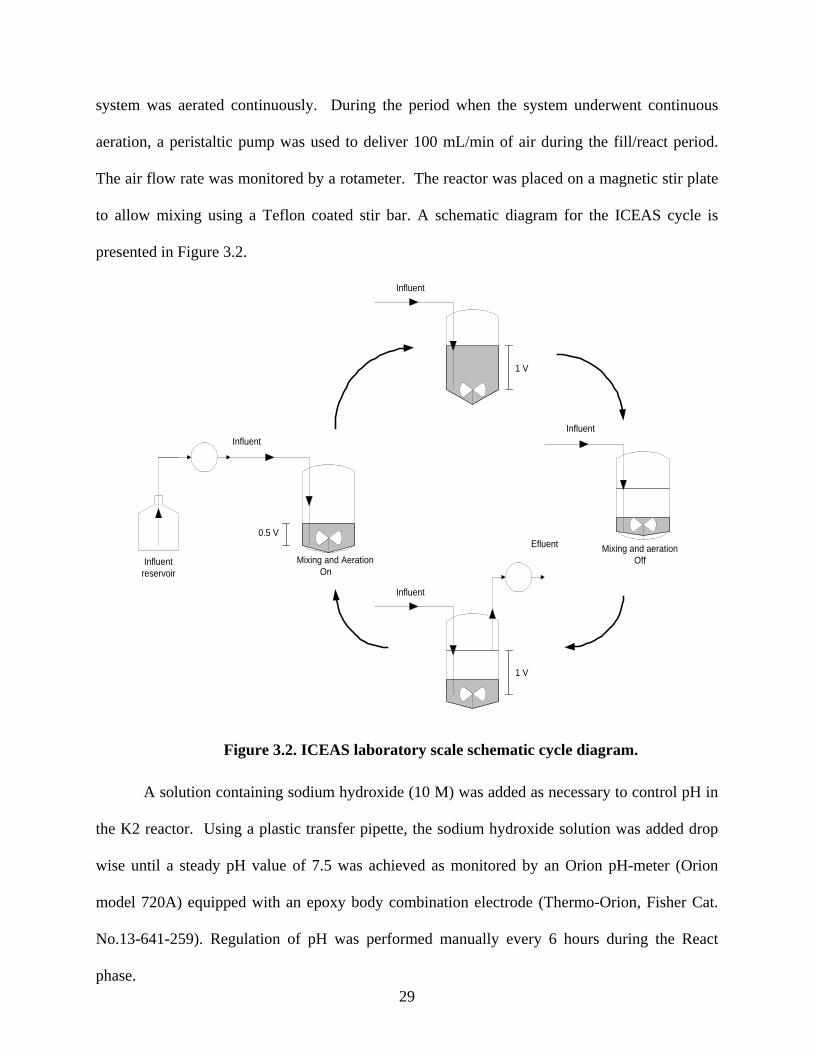
to allow mixing using a Teflon coated stir bar. A schematic diagram for the ICEAS cycle is
presented in Figure 3.2.
0.5 V
Mixing and AerationOn
Influent
1 V
Influent
1 V
Influent
Influentreservoir
Efluent Mixing and aerationOff
Influent
Figure 3.2. ICEAS laboratory scale schematic cycle diagram.
29
A solution containing sodium hydroxide (10 M) was added as necessary to control pH in
the K2 reactor. Using a plastic transfer pipette, the sodium hydroxide solution was added drop
wise until a steady pH value of 7.5 was achieved as monitored by an Orion pH-meter (Orion
model 720A) equipped with an epoxy body combination electrode (Thermo-Orion, Fisher Cat.
No.13-641-259). Regulation of pH was performed manually every 6 hours during the React
phase.
3.4.1.3 K3
To operate K3 as an SBBR, 12 g of 1.5-cm per side polyurethane foam cubes (Zander,
Germany) were introduced into the reactor. The foam cubes were held in a wire cage submerged
into the liquid volume of 2.5 L. Foam-free spaces of 2.0 cm were left between the cage and the
surface of the liquid, and 4 cm between the cage and the bottom of the reactor.
Influent and treated wastewaters were fed and drawn at the bottom of the reactor using a
2 mL plastic pipette attached to a Masterflex® tubing, and a Cole Palmer Materflex® console
drive peristaltic pump (model 7521-40, Bernant Co, Barrington; IL). To perform these activities,
the pipette was carefully inserted through the foam media in one of the sidewalls of the reactor
until the tip reached the bottom. Aeration was controlled to avoid excessive production of foam
during the reactor’s operation. Like the ICEAS, the SBBR needed constant pH regulation and the
same procedure was performed to maintain the pH between 6.5 and 7.5 during the React period.
The SBBR operative cycle consisted of three phases: (1) reactor filling, (2) reaction, and
(3) draw. After discharging the treated water, the sequence was repeated. The reactor was filled
to 2.5 L with synthetic wastewater containing 400 mg/L of LAS, and decanted to 1.25 L of liquid
volume using a Cole Palmer Materflex® console drive peristaltic pump (model 7521-40, Bernant
Co, Barrington; IL). Reactor’s fill and draw phases were 0.002 days each (2.88 minutes), while
three different reaction times 4.99, 2.99, and 1.99 days were tested. Aeration was provided for
30 seconds every 10 minutes as described in Section 3.3.
3.4.2 LAS Removal
The removal efficiency associated with each operating cycle was calculated using the
mass of each LAS measured as TOC entering the reactor, and the mass of LAS at the end of the
SETTLE period.
30
Percent Removal = C in – Cout x 100 (3.2)
Cin
Where:
C in = concentration of TOC of MBAS entering the reactor (mg/L).
C out= concentration of TOC of MBAS at the end of the settling cycle (mg).
To compare the LAS removal between the reactors, two 5 mL samples were taken every
day during the react phase from each reactor. A 5-mL plastic syringe was used to filter samples
through a syringe filter 25 mm diameter and 0.45 µm pore size (Whatman Cat. No.6874-2504).
Filtered samples were collected in 5 mL glass vials and sealed with paraffilm, and total organic
carbon (TOC) and methylene blue active substances (MBAS) were measured. TOC was
measured using a TOC analyzer model 5050A from Shimadzu, and MBAS was carried on
following Standard Methods for the Examination of Water and Wastewater (APHA 1998).
3.4.3 Foam Production
Foam height was measured in each of the reactors during their cycle operation. Readings
were averaged from 5 cycles in the SBR and ICEAS, and from 8 cycles in the SBBR. Using a
ruler, the foam was measured from the surface of the liquid. In the SBR and ICEAS, recordings
were made every 30 minutes during the first three hours, then every hour during the next 4 hours,
and finally every 12 hours until the end of the react period. For the SBBR, foam height was
measured and recorded at 30 minutes intervals during the first 4 hours, 90 minute intervals in the
next 6 hours, and then every 12 hours until completion of the cycle. Aeration conditions were
similar for the SBR and SBBR. The solenoid valve opened 30 seconds every 10 minutes and air
flowed at a rate of 500 mL/min through the aeration stones. Aeration in the ICEAS was
continuous at a flow rate of 100 mL/min.
31
3.4.4 Sorption of LAS on Sludge and Polyurethane Foam – Reactor Scale
Simple experiments were conducted to determine the sorption characteristics of LAS in
the activated sludge and the polyurethane foam under normal operation conditions in the
reactors. The mass of LAS sorbed was estimated by performing a mass balance on TOC using
equation 3.3 below.
TOC sorbed = [CrVr-meas+ CinVin] – Cfinal (Vr + Vin) (3.3)
Where: Vr-meas = measured volume of liquid remaining in the decanted reactor at end of previous
cycle (L); Vin = measured volume of liquid entering the reactor during the FILL period (L); Cr =
measured concentration of soluble TOC remaining in the reactor at the end of the previous cycle
(mg/L); Cin = measured concentration of TOC in the influent wastewater (mg/L); and, Cfinal =
measured concentration of TOC in the reactor after the end of the FILL period (mg/L).
After filling the reactors, samples were collected for measurement of TOC and MBAS to
perform the LAS mass balance and measure sorption under the assumption that the fill period
was sufficiently short so that no biodegradation occurred. The number of sorption tests
performed in each of the reactors is summarized in Table 3.5.
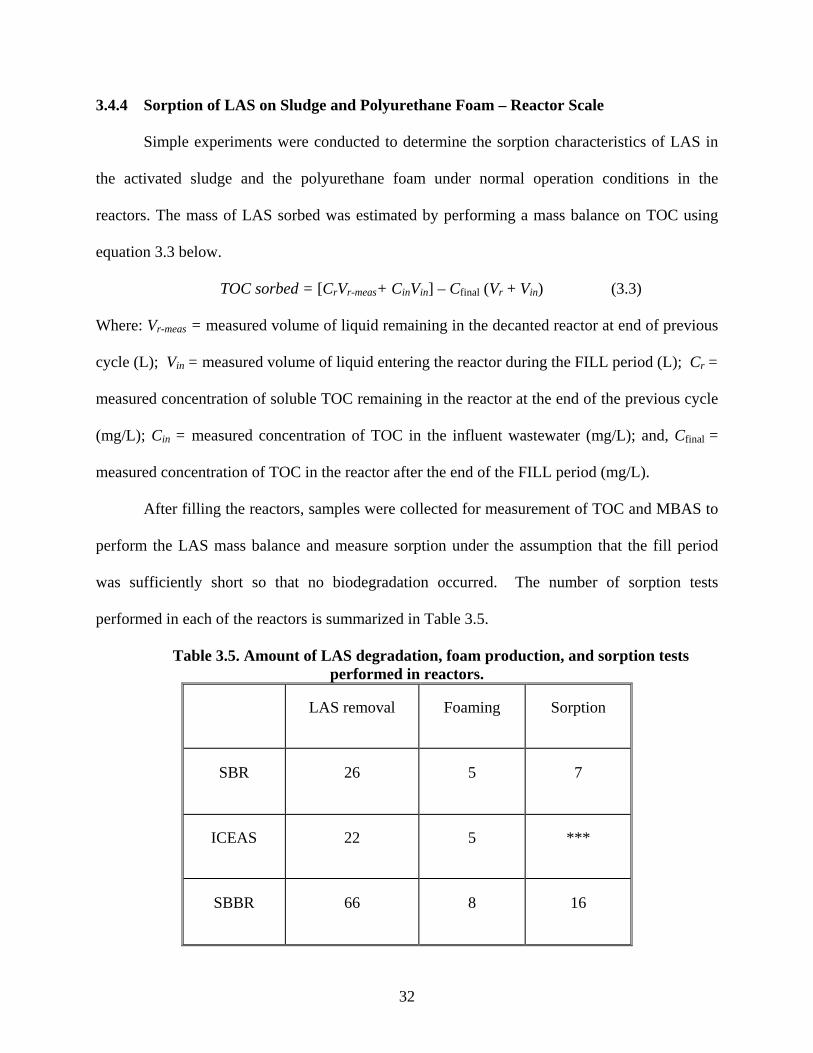
Table 3.5. Amount of LAS degradation, foam production, and sorption tests performed in reactors.
LAS removal Foaming Sorption
SBR 26 5 7
ICEAS 22 5 ***
SBBR 66 8 16
32
These experiments were done at the end of the operation cycles, after the draw phase
using the remaining liquid volume in the reactors. 1.28 L of mixture of settled sludge and treated
wastewater were measured using two glass cylinders (1000 mL and 500 mL). Two samples of 10
mL were taken (with a 10-mL plastic pipette) to measure total suspended solids, and other two
samples of 5 mL for TOC and MBAS. The remaining 1.25 L was returned to the reactor. The
same analyses were performed to 1.28 L of influent synthetic wastewater prior mixing.
3.4.5 Special Tests
3.4.5.1 Variation in Hydraulic Retention Time (HRT) and the Effect on LAS Degradation and Foam Production
LAS biodegradation and foam production were measure at values of hydraulic retention
times of 6.25, and 12.4 days. The length of the operation cycle was left to be 5 days for the SBR
and ICEAS, and 2 days for SBBR. With an HRT of 6.25 days, the volume decanted during the
draw period was 2.0 L, and 1.0 L for a hydraulic retention time of 12.4 days. Then the reactor
was filled to 2.5 L. Two samples of 5 mL were taken every day from each reactor to measure
TOC and MBAS.
Foam height in the reactors was measured following the same procedure performed
during the 10 days HRT.
3.4.5.2 ICEAS - Transient Loading Experiments
Three transient loading experiments were performed in the ICEAS to assess reactor
response to higher influent LAS concentrations. The reactor was subjected to a loading condition
during which the influent LAS concentration was increased to two times that of the normal.
During the first two experiments the system was fed with synthetic wastewater containing 800
mg/L of LAS (513 mg/L as TOC) during two 5-day cycles. The influent was pumped in at a flow
rate of 0.175 mL/min beginning at SETTLE and DRAW periods of the previous cycle.
33
A different approach was taken during the third transient loading experiment. Influent
wastewater containing the higher LAS concentration was started to entering the system during
the second day of the cycle. The feed continued until completion of the 5-day cycle.
During the transient loading experiments conducted in the ICEAS, airflow was set to 100
mL/min, and foam height, OUR, TOC, and MBAS were measured. Two samples of 5 mL were
taken every day for analysis, and foam height readings were recorded 10 minutes during the first
two hours of the react phase, and then every six hours until the completion of the cycle.
3.4.5.3 Testing Anti-foaming Agents in Its Addition to SBR and SBBR
Twelve anti-foaming agents (laboratory preparations from Vulcan Performance
Chemicals, Columbus, GA) were tested to be use in the SBR and SBBR systems. Different
concentrations of each of the anti-foaming agents ranging from 30 to 2000 mg/L were added to
synthetic wastewater containing 200 mg/L of LAS (113 mg/L as TOC). The principal
characteristics of the tested anti-foaming agents are presented in Table 3.6.
The testing procedure consisted of placing 100 mL of the wastewater containing the anti-
foaming agent in a 1000-mL glass cylinder. The cylinder was graduated in centimeter scale using
a ruler and masking tape. A peristaltic pump (Cole Palmer Materflex® console drive model
7521-40, Bernant Co, Barrington; IL) was used to provide a continuous flow of air at a flow rate
of 100 mL/min as measured by a Cole-Palmer Rotameter (Gilmont Instruments, 250 mL/min
scale Accucal flow meter Cole-Palmer Instruments Co., Vernon Hills, IL).
Air flow was delivered continuously through an aeration stone (Fisher Scientific,
Sewanee, GA) connected to ¼” Tygon tubing (Cole Palmer Cat. No. A-06408-47). Measurement
of the resulting height of foam in the graduated cylinder began as soon the stone reached the
bottom of the cylinder, and readings were recorded at 30 second intervals for duration of 10
minutes. Results from the anti-foaming agent test evaluations are shown in Appendix 1.
34
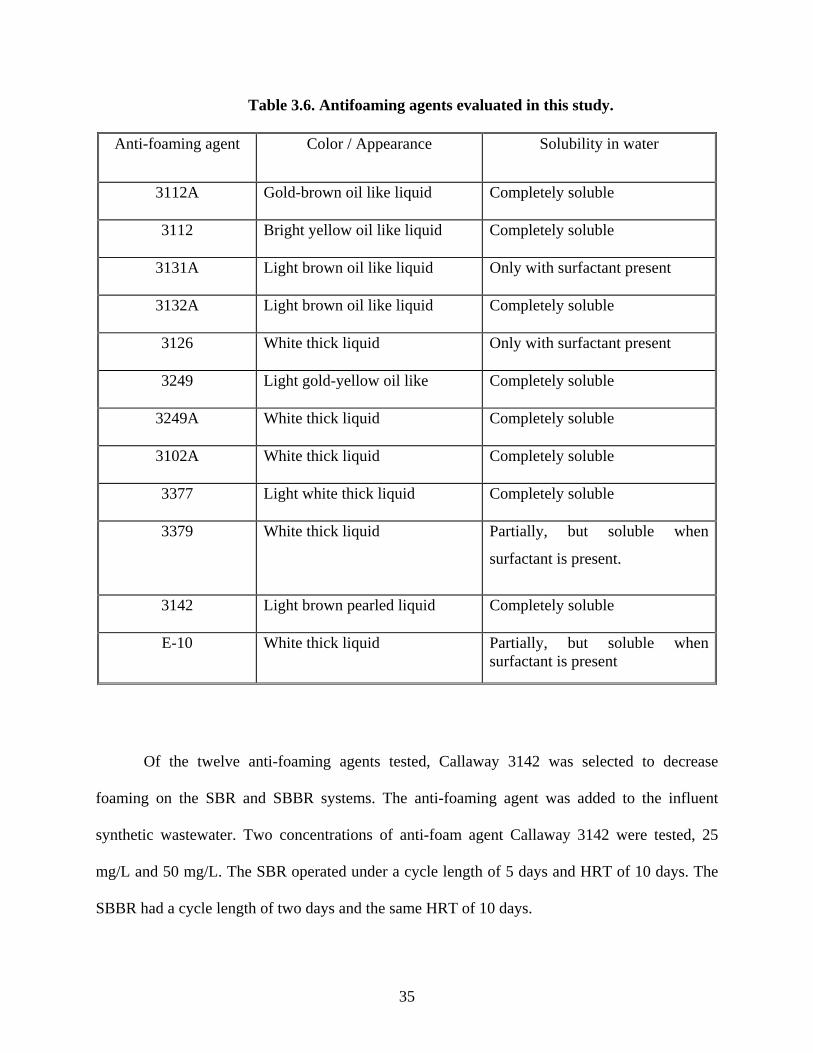
Table 3.6. Antifoaming agents evaluated in this study.
Anti-foaming agent Color / Appearance Solubility in water
3112A Gold-brown oil like liquid Completely soluble
3112 Bright yellow oil like liquid Completely soluble
3131A Light brown oil like liquid Only with surfactant present
3132A Light brown oil like liquid Completely soluble
3126 White thick liquid Only with surfactant present
3249 Light gold-yellow oil like Completely soluble
3249A White thick liquid Completely soluble
3102A White thick liquid Completely soluble
3377 Light white thick liquid Completely soluble
3379 White thick liquid Partially, but soluble when
surfactant is present.
3142 Light brown pearled liquid Completely soluble
E-10 White thick liquid Partially, but soluble when surfactant is present
Of the twelve anti-foaming agents tested, Callaway 3142 was selected to decrease
foaming on the SBR and SBBR systems. The anti-foaming agent was added to the influent
synthetic wastewater. Two concentrations of anti-foam agent Callaway 3142 were tested, 25
mg/L and 50 mg/L. The SBR operated under a cycle length of 5 days and HRT of 10 days. The
SBBR had a cycle length of two days and the same HRT of 10 days.
35
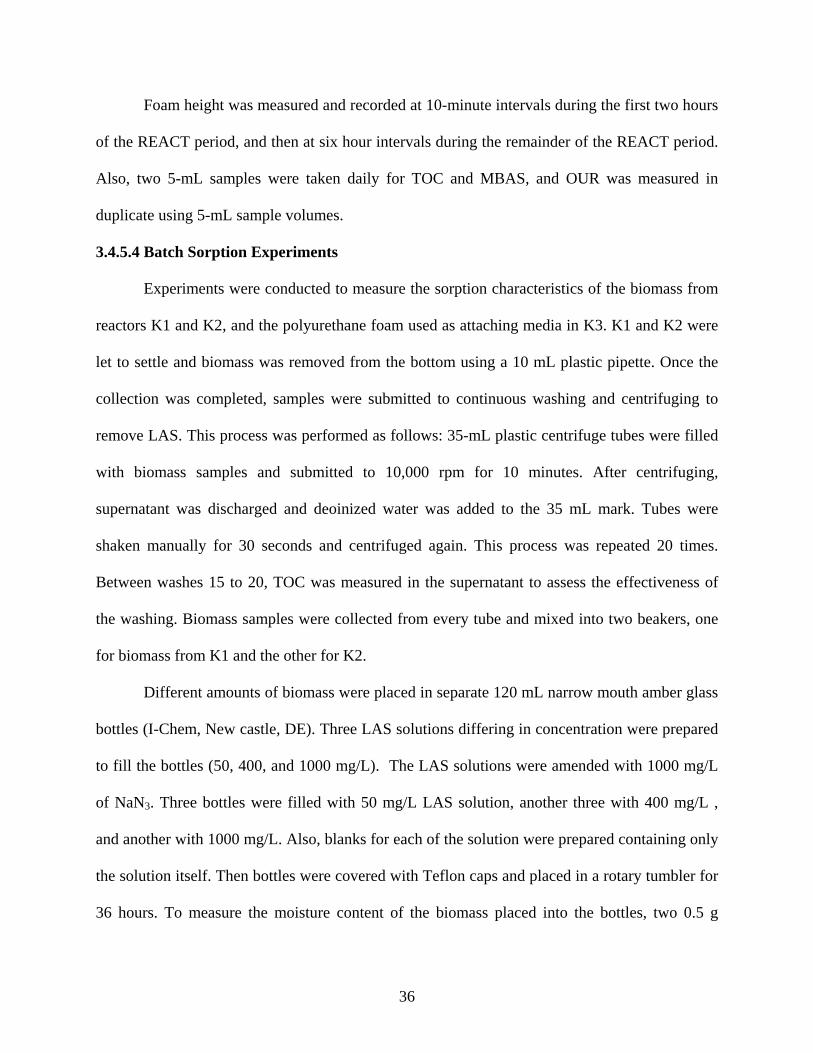
Foam height was measured and recorded at 10-minute intervals during the first two hours
of the REACT period, and then at six hour intervals during the remainder of the REACT period.
Also, two 5-mL samples were taken daily for TOC and MBAS, and OUR was measured in
duplicate using 5-mL sample volumes.
3.4.5.4 Batch Sorption Experiments
Experiments were conducted to measure the sorption characteristics of the biomass from
reactors K1 and K2, and the polyurethane foam used as attaching media in K3. K1 and K2 were
let to settle and biomass was removed from the bottom using a 10 mL plastic pipette. Once the
collection was completed, samples were submitted to continuous washing and centrifuging to
remove LAS. This process was performed as follows: 35-mL plastic centrifuge tubes were filled
with biomass samples and submitted to 10,000 rpm for 10 minutes. After centrifuging,
supernatant was discharged and deoinized water was added to the 35 mL mark. Tubes were
shaken manually for 30 seconds and centrifuged again. This process was repeated 20 times.
Between washes 15 to 20, TOC was measured in the supernatant to assess the effectiveness of
the washing. Biomass samples were collected from every tube and mixed into two beakers, one
for biomass from K1 and the other for K2.
Different amounts of biomass were placed in separate 120 mL narrow mouth amber glass
bottles (I-Chem, New castle, DE). Three LAS solutions differing in concentration were prepared
to fill the bottles (50, 400, and 1000 mg/L). The LAS solutions were amended with 1000 mg/L
of NaN3. Three bottles were filled with 50 mg/L LAS solution, another three with 400 mg/L ,
and another with 1000 mg/L. Also, blanks for each of the solution were prepared containing only
the solution itself. Then bottles were covered with Teflon caps and placed in a rotary tumbler for
36 hours. To measure the moisture content of the biomass placed into the bottles, two 0.5 g
36
samples of biomass from each reactor were dried at 105ºC for one hour. Amounts of biomass
placed into bottles and the average moisture content are showed in Table 3.7.
Table 3.7: Amounts of biomass from K1 and K2 used on batch sorption test.
Working LAS dry mass dry masssolution mass (mg) moisture,% ( mg ) mass (mg) moisture,% ( m , mg )
515.7 24.13 1.1721 64.0050 mg/L 1231.4 95.3 57.63 1.448 94.54 79.06
1387.9 64.95 1.6591 90.59477.8 22.36 1.448 79.06
500 mg/L 1145.6 95.3 53.61 1.4558 94.54 79.491448.4 67.79 2.8646 156.41651.8 30.50 1.2181 66.51
1000 mg/L 1313 95.3 61.45 1.7185 94.54 93.831216.8 56.95 1.8542 101.24
K1 K2
After the 36-hour equilibration period, aqueous samples were removed, filtered through
0.45 µm PTFE syringe filters, and analyzed for TOC to determine the equilibrium concentration
of LAS measured as total organic carbon. The sorption characteristics of the biomass samples
were modeled using Freundlich isotherms. The empirically derived Freundlich isotherm equation
is defined as follows (Metcalf and Eddy, 1991).
x/m = Kf Ce1/n (3.4)
Where;
x/m = mass of adsorbate adsorbed per unit mass of adsorbent (mg/mg)
Ce = equilibrium concentration of adsorbate in solution after adsorption (mg/L)
Kf and n = empirical constants.
The same procedure described above was used for measuring sorption of LAS to the
polyurethane foam used as a solid support in the K3 reactor. Different amounts of dry foam were
placed into the glass bottles instead of biomass. Two solutions of LAS were prepared for this
test, 50 and 400 mg/L. Three bottles for the 50mg/L solution and 11 for 400 mg/L were prepared.
37
3.4.5.5 Sludge Volume Index (SVI)
The settling capacity of the activated sludges from the SBR and ICEAS were measured in
terms of the sludge volume index (SVI) as described in Section 3.5.5. The SVI was determined
from each reactor at the end of the React period during three consecutive operation cycles.
3.4.5.6 Chemical Oxygen Demand (COD) Balance in the SBR and ICEAS
COD measurements were performed during 1 cycle on K1 and K2 to verify the overall
performance of the reactors. COD analysis was performed in samples collected every 24 hours
during the REACT period on each reactor. Also, COD was measured in the influent. OUR was
measured every 6 hours. The TSS from every reactor was measured at the end of the REACT
cycle.
3.5 Analytical Techniques
3.5.1 Total Organic Carbon (TOC)
Samples collected for measurement of total organic carbon (TOC) were analyzed the
same day they were collected. Samples were collected using a 5-mL plastic syringe to withdraw
samples from the reactor, and then the samples were filtered through a syringe filter 25 mm
diameter and 0.45 µm pore size (Whatman Cat. No.6874-2504). Filtered samples were collected
in 5 mL glass vials and sealed with parafilm prior to analysis.
TOC measurements were performed using a Shimadzu Scientific Instruments Inc. model
5050 TOC analyzer (Japan). The equipment was calibrated following standard method for water
and wastewater 5310B, two stock solutions were prepared following the same method, one for
organic carbon (1.0 mL = 1.0 mg carbon), and the second for inorganic carbon (1.0 mL = 1.0 mg
carbon).
One calibration curve was prepared for total carbon (TC) covering a range of 0 – 400
mg/L. Standard solutions of 0, 50, 100, 200, and 400 mg/L were prepared pipetting the
38
appropriate volumes of organic carbon stock solution into 100 mL volumetric flasks and then
filling with deionized water to create the various dilutions. The inorganic carbon (IC) calibration
curve covered a range of 0 – 200 mg/L. Standard solutions of 0, 25, 50, 100, and 200 mg/L were
prepared by pipetting the appropriate volumes of inorganic stock solution into 100 mL
volumetric flasks and then filling with deionized water to create the various dilutions. The values
of each point in the standard curves corresponded to the average of three injections, and the least
squares option in the 5050 TOC analyzer was selected for linear fit analysis.
The 5050 TOC analyzer was equipped with a 250 µL syringe, set to have a standard
injection speed, and perform four washes before sampling for measurement. The injection
volumes were set to 40 and 16 µL for total carbon and inorganic carbon analysis respectively.
Reported concentrations of total carbon and inorganic carbon obtained from the analysis
corresponded to the average of two injections from the same sample. Finally, the total organic
carbon value was calculated subtracting the inorganic carbon from the total carbon values (TOC
= TC - IC). Calibration curves were checked at least once per month using standard solutions
prepared from fresh stock solutions.
3.5.2 Methylene Blue Active Substances (MBAS)
Lauryl Alkylbenzene Sulfonate (LAS) was measured directly by methylene blue active
substances analysis (Standard Methods for the Examination of Water and Wastewater 5540C,
APHA, 1998). Samples were filtered through a syringe filter 25 mm diameter and 0.45 µm pore
size (Whatman Cat. No.6874-2504). MBAS analysis was performed in duplicate the same day
samples were collected or else samples were acidified and refrigerated until analysis.
A calibration curve covering a range from 0 to 1000 mg/L was constructed using Sodium
Dodecylsulfate (SDS, 99%, Aldrich 43,614-3). A sample size of 1 mL was used to perform the
39
analysis following method 5540C. Absorbance was measured at a wavelength of 652 nm using a
UV-VIS Spectrophotometer (model UV-1201, Shimadzu Scientific Instruments, Inc., Japan)
equipped with 10 mm rectangular UV quartz cells (Hach Cat. No. 48228-00, Hach Co.,
Loveland, CO).
3.5.3 Oxygen Uptake Rate (OUR)
For respirometer experiments, the oxygen uptake rate (OUR) was measured directly by
the model OO-244SC Comput-OX Respirometer (N-CON Systems, Crawford, GA). For other
experiments, OUR was measured using a YSI model 5300 Biological Oxygen Monitor (Yellow
Springs, OH). OUR measurements were conducted in duplicate using a 5 mL sample volume,
and dissolved oxygen concentrations were recorded every 30 seconds over a five minute period.
OUR values were calculated from a linear regression analysis of the dissolved oxygen
concentrations over time.
3.5.4 Total Suspended Solids (TSS)
Total Suspended Solids (TSS) concentrations were measured in duplicate following
standard method 2540C (APHA, 1998).
3.5.5 Chemical Oxygen Demand (COD)
Chemical Oxygen Demand was measured following the USEPA approved reactor
digestion method for reporting wastewater analysis (HACH method 8000, 0-1500 mg/L range).
This method is an adaptation of Standard Methods for the Examination of Water and Wastewater
5220D, APHA, 1998. Samples were filtered through a syringe filter 25 mm diameter and 0.45
µm pore size (Whatman Cat. No.6874-2504). From this, 1.0 mL was introduce into the COD vial
followed by 1.0 mL of deionized water to complete a total volume sample of 2.0 mL. Then were
put into the COD reactor and heated for two hours at 150ºC. COD concentrations were measured
40
in HACH spectrophotometer DR/4000 using the 435 COD High Range program. COD
concentrations in samples were then calculated using the appropriate dilution factor.
3.5.6 Sludge Volume Index (SVI)
The settling capacity of the activated sludges from the SBR and ICEAS were measured
using the Sludge Volume Index. A variation of Standard Method for the Examination of Water
and Wastewater 2710D (APHA 1998) was used to perform the analysis. An Imhoff settling cone
graduated from 0 to 1000 mL (Nalgene, Fisher Cat. No. 15-438) was used instead of the settling
vessel described in the method. Duplicate 10 mL samples were analyzed for total suspended
solids to complete the test.
3.5.7 Ammonia, Nitrate, and Nitrite Analysis
During the first operation cycles of K3 (cycles 3-8), ammonia, nitrite and nitrite analysis
were performed to determine if nitrification was taking place in the reactor. Samples were taken
at the beginning and end of the React cycle and diluted as necessary for the ammonia, nitrite and
nitrite to fall into the range of the analytical kit used. HACH tests kits (HACH Company ,
Loveland CO) were used to measure NH3-N , NO3-N, and NO2-N in the samples taken during
the operation of the reactor. Ammonia was measured using HACH method 8038 (EPA approved
Nessler method). Nitrate was measured using HACH method 8039 (NitraVer5 Nitrate AccuVac,
high range), and nitrite by HACH method 8192 (NitriVer3 Nitrite reagent AccuVac, low range).
Samples were analyzed following procedures specified in every kit’s booklet.
41
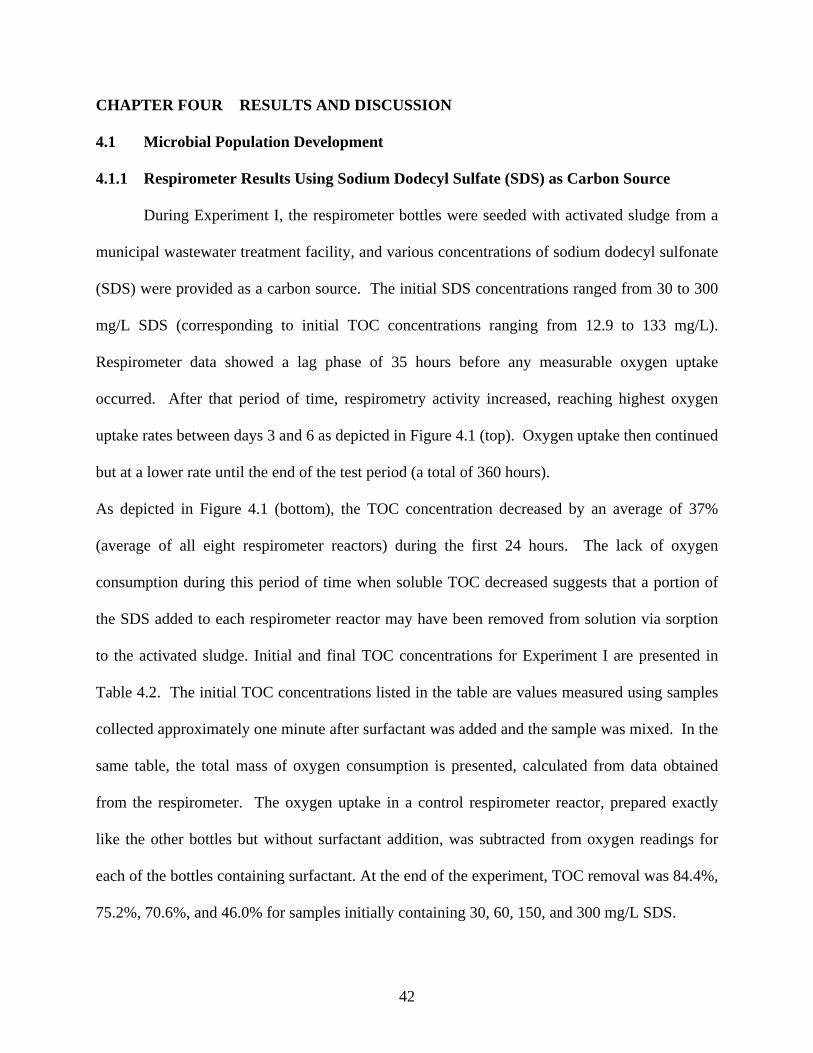
CHAPTER FOUR RESULTS AND DISCUSSION
4.1 Microbial Population Development
4.1.1 Respirometer Results Using Sodium Dodecyl Sulfate (SDS) as Carbon Source
During Experiment I, the respirometer bottles were seeded with activated sludge from a
municipal wastewater treatment facility, and various concentrations of sodium dodecyl sulfonate
(SDS) were provided as a carbon source. The initial SDS concentrations ranged from 30 to 300
mg/L SDS (corresponding to initial TOC concentrations ranging from 12.9 to 133 mg/L).
Respirometer data showed a lag phase of 35 hours before any measurable oxygen uptake
occurred. After that period of time, respirometry activity increased, reaching highest oxygen
uptake rates between days 3 and 6 as depicted in Figure 4.1 (top). Oxygen uptake then continued
but at a lower rate until the end of the test period (a total of 360 hours).
As depicted in Figure 4.1 (bottom), the TOC concentration decreased by an average of 37%
(average of all eight respirometer reactors) during the first 24 hours. The lack of oxygen
consumption during this period of time when soluble TOC decreased suggests that a portion of
the SDS added to each respirometer reactor may have been removed from solution via sorption
to the activated sludge. Initial and final TOC concentrations for Experiment I are presented in
Table 4.2. The initial TOC concentrations listed in the table are values measured using samples
collected approximately one minute after surfactant was added and the sample was mixed. In the
same table, the total mass of oxygen consumption is presented, calculated from data obtained
from the respirometer. The oxygen uptake in a control respirometer reactor, prepared exactly
like the other bottles but without surfactant addition, was subtracted from oxygen readings for
each of the bottles containing surfactant. At the end of the experiment, TOC removal was 84.4%,
75.2%, 70.6%, and 46.0% for samples initially containing 30, 60, 150, and 300 mg/L SDS.
42
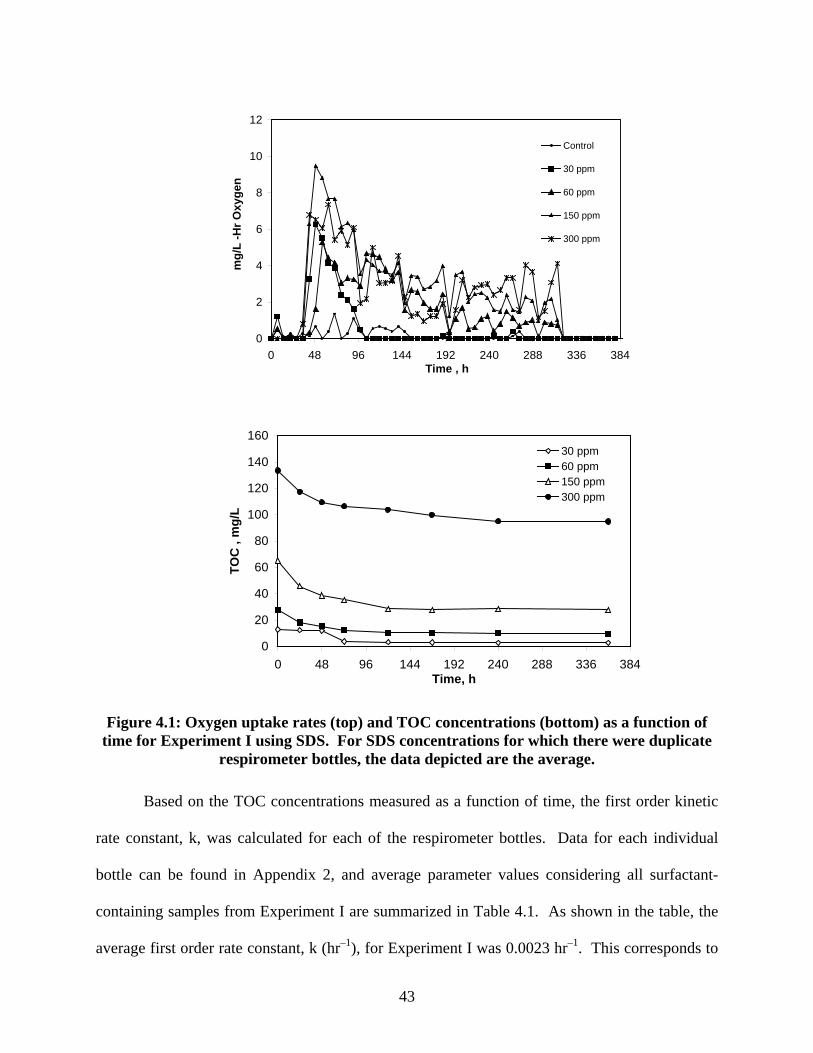
0
2
4
6
8
10
12
0 48 96 144 192 240 288 336 384Time , h
mg/
L -H
r Oxy
gen
Control
30 ppm
60 ppm
150 ppm
300 ppm
0
20
40
60
80
100
120
140
160
0 48 96 144 192 240 288 336 384Time, h
TOC
, m
g/L
30 ppm60 ppm150 ppm300 ppm
Figure 4.1: Oxygen uptake rates (top) and TOC concentrations (bottom) as a function of
time for Experiment I using SDS. For SDS concentrations for which there were duplicate respirometer bottles, the data depicted are the average.
Based on the TOC concentrations measured as a function of time, the first order kinetic
rate constant, k, was calculated for each of the respirometer bottles. Data for each individual
bottle can be found in Appendix 2, and average parameter values considering all surfactant-
containing samples from Experiment I are summarized in Table 4.1. As shown in the table, the
average first order rate constant, k (hr–1), for Experiment I was 0.0023 hr–1. This corresponds to
43
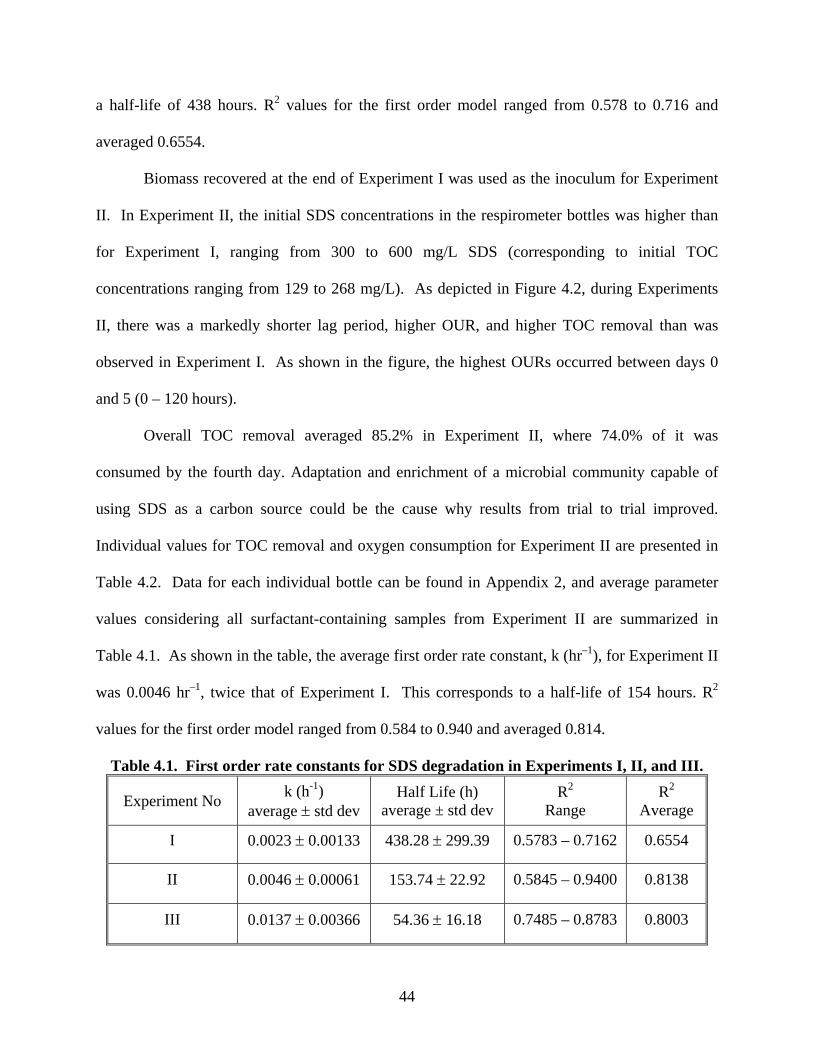
a half-life of 438 hours. R2 values for the first order model ranged from 0.578 to 0.716 and
averaged 0.6554.
Biomass recovered at the end of Experiment I was used as the inoculum for Experiment
II. In Experiment II, the initial SDS concentrations in the respirometer bottles was higher than
for Experiment I, ranging from 300 to 600 mg/L SDS (corresponding to initial TOC
concentrations ranging from 129 to 268 mg/L). As depicted in Figure 4.2, during Experiments
II, there was a markedly shorter lag period, higher OUR, and higher TOC removal than was
observed in Experiment I. As shown in the figure, the highest OURs occurred between days 0
and 5 (0 – 120 hours).
Overall TOC removal averaged 85.2% in Experiment II, where 74.0% of it was
consumed by the fourth day. Adaptation and enrichment of a microbial community capable of
using SDS as a carbon source could be the cause why results from trial to trial improved.
Individual values for TOC removal and oxygen consumption for Experiment II are presented in
Table 4.2. Data for each individual bottle can be found in Appendix 2, and average parameter
values considering all surfactant-containing samples from Experiment II are summarized in
Table 4.1. As shown in the table, the average first order rate constant, k (hr–1), for Experiment II
was 0.0046 hr–1, twice that of Experiment I. This corresponds to a half-life of 154 hours. R2
values for the first order model ranged from 0.584 to 0.940 and averaged 0.814.
Table 4.1. First order rate constants for SDS degradation in Experiments I, II, and III.
Experiment No k (h-1) average ± std dev
Half Life (h) average ± std dev
R2
Range R2
Average
I 0.0023 ± 0.00133 438.28 ± 299.39 0.5783 – 0.7162 0.6554
II 0.0046 ± 0.00061 153.74 ± 22.92 0.5845 – 0.9400 0.8138
III 0.0137 ± 0.00366 54.36 ± 16.18 0.7485 – 0.8783 0.8003
44
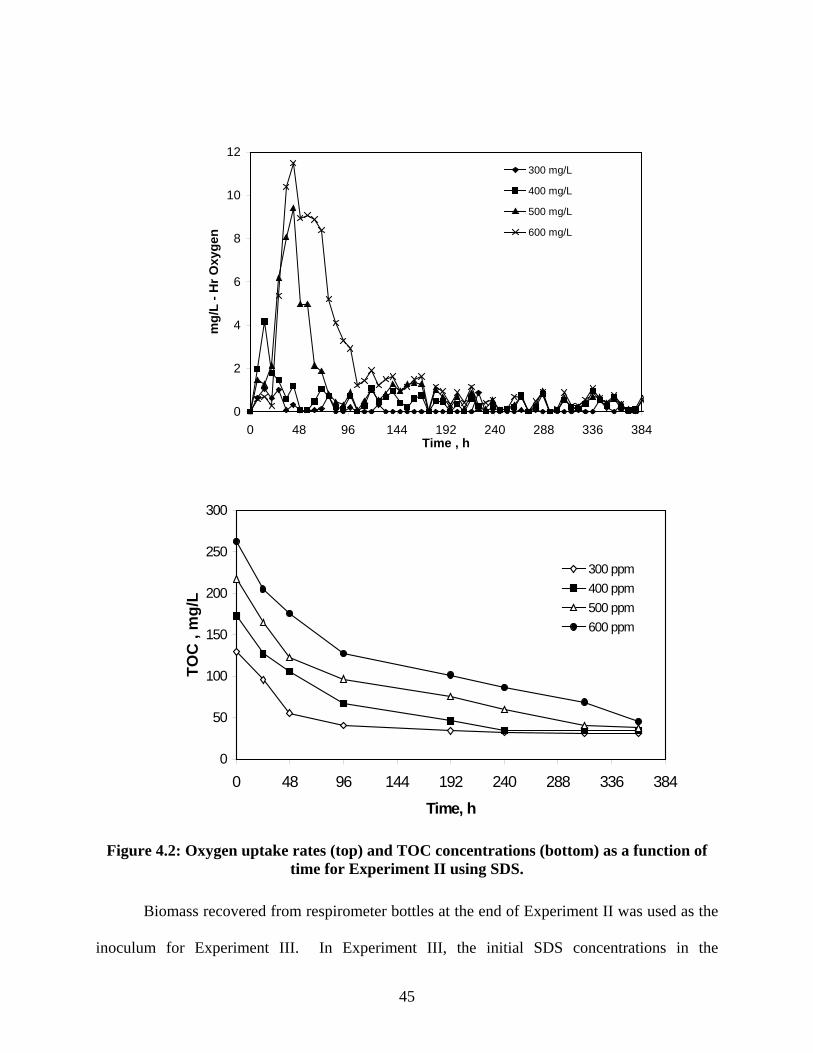
0
2
4
6
8
10
12
0 48 96 144 192 240 288 336 384Time , h
mg/
L - H
r Oxy
gen
300 mg/L
400 mg/L
500 mg/L
600 mg/L
0
50
100
150
200
250
300
0 48 96 144 192 240 288 336 384
Time, h
TOC
, m
g/L
300 ppm400 ppm500 ppm600 ppm
Figure 4.2: Oxygen uptake rates (top) and TOC concentrations (bottom) as a function of
time for Experiment II using SDS.
Biomass recovered from respirometer bottles at the end of Experiment II was used as the
inoculum for Experiment III. In Experiment III, the initial SDS concentrations in the
45
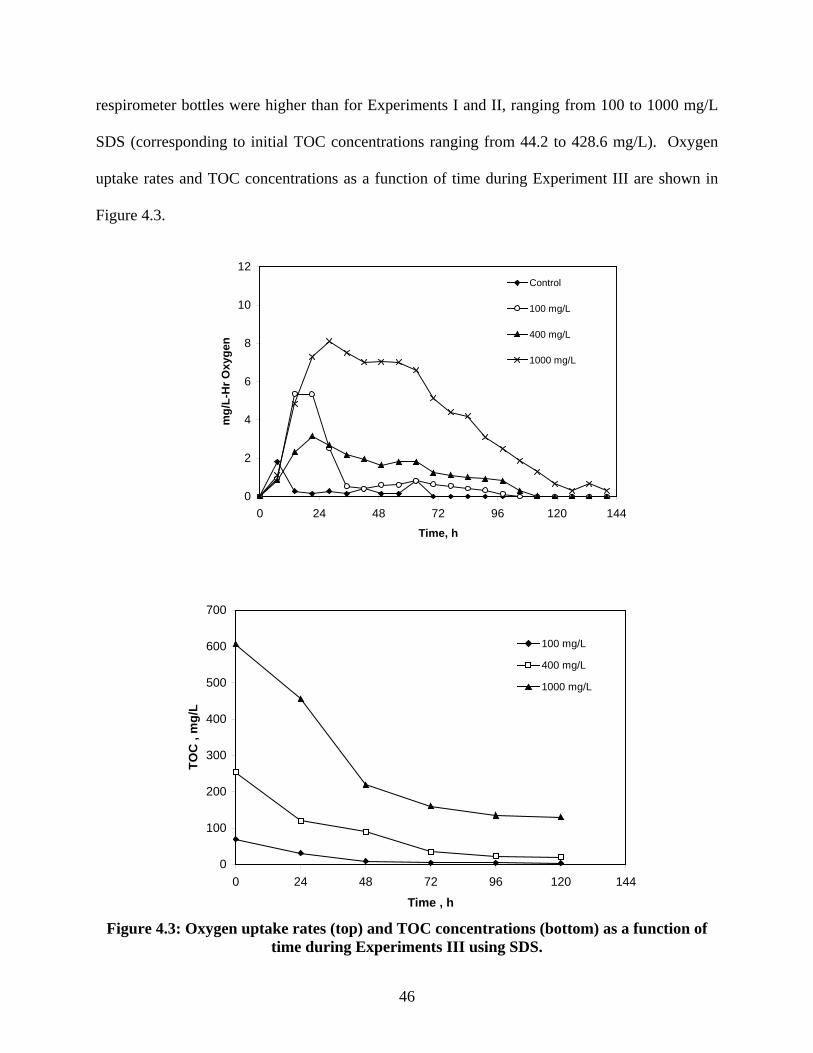
respirometer bottles were higher than for Experiments I and II, ranging from 100 to 1000 mg/L
SDS (corresponding to initial TOC concentrations ranging from 44.2 to 428.6 mg/L). Oxygen
uptake rates and TOC concentrations as a function of time during Experiment III are shown in
Figure 4.3.
0
2
4
6
8
10
12
0 24 48 72 96 120 144
Time, h
mg/
L-H
r Oxy
gen
Control
100 mg/L
400 mg/L
1000 mg/L
0
100
200
300
400
500
600
700
0 24 48 72 96 120 144
Time , h
TOC
, m
g/L
100 mg/L
400 mg/L
1000 mg/L
Figure 4.3: Oxygen uptake rates (top) and TOC concentrations (bottom) as a function of
time during Experiments III using SDS.
46
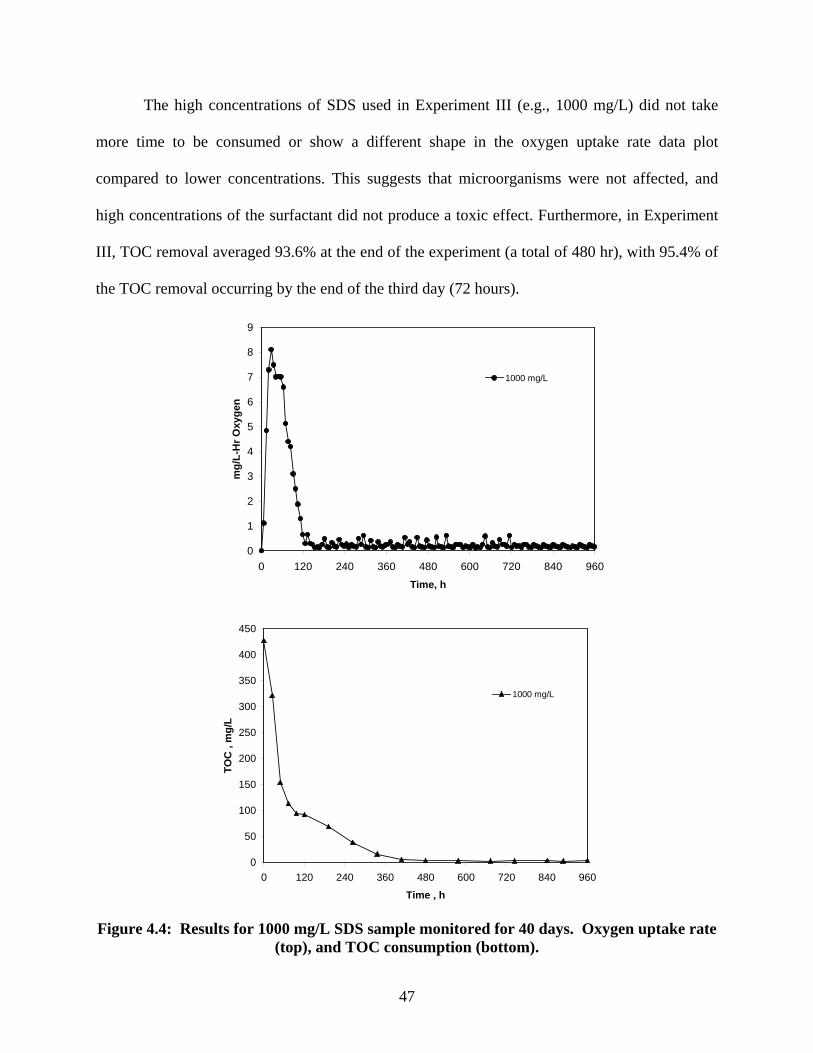
The high concentrations of SDS used in Experiment III (e.g., 1000 mg/L) did not take
more time to be consumed or show a different shape in the oxygen uptake rate data plot
compared to lower concentrations. This suggests that microorganisms were not affected, and
high concentrations of the surfactant did not produce a toxic effect. Furthermore, in Experiment
III, TOC removal averaged 93.6% at the end of the experiment (a total of 480 hr), with 95.4% of
the TOC removal occurring by the end of the third day (72 hours).
0
1
2
3
4
5
6
7
8
9
0 120 240 360 480 600 720 840 960
Time, h
mg/
L-H
r Oxy
gen
1000 mg/L
0
50
100
150
200
250
300
350
400
450
0 120 240 360 480 600 720 840 960
Time , h
TOC
, m
g/L
1000 mg/L
Figure 4.4: Results for 1000 mg/L SDS sample monitored for 40 days. Oxygen uptake rate
(top), and TOC consumption (bottom).
47
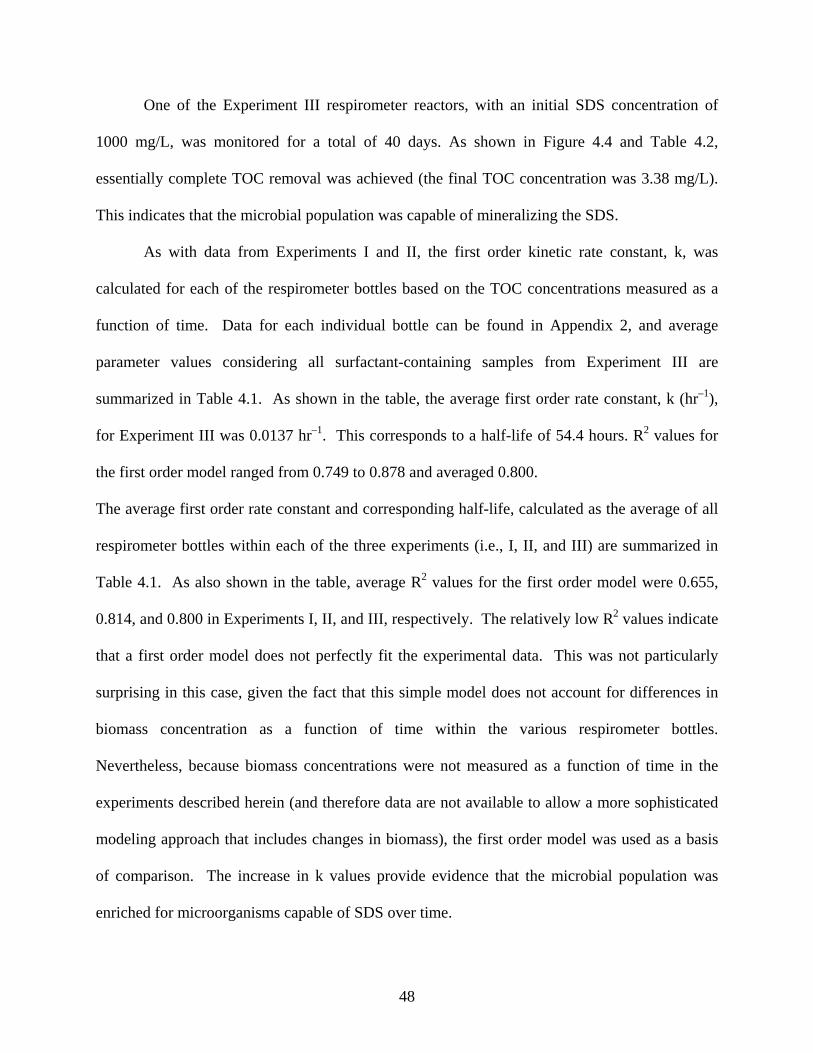
One of the Experiment III respirometer reactors, with an initial SDS concentration of
1000 mg/L, was monitored for a total of 40 days. As shown in Figure 4.4 and Table 4.2,
essentially complete TOC removal was achieved (the final TOC concentration was 3.38 mg/L).
This indicates that the microbial population was capable of mineralizing the SDS.
As with data from Experiments I and II, the first order kinetic rate constant, k, was
calculated for each of the respirometer bottles based on the TOC concentrations measured as a
function of time. Data for each individual bottle can be found in Appendix 2, and average
parameter values considering all surfactant-containing samples from Experiment III are
summarized in Table 4.1. As shown in the table, the average first order rate constant, k (hr–1),
for Experiment III was 0.0137 hr–1. This corresponds to a half-life of 54.4 hours. R2 values for
the first order model ranged from 0.749 to 0.878 and averaged 0.800.
The average first order rate constant and corresponding half-life, calculated as the average of all
respirometer bottles within each of the three experiments (i.e., I, II, and III) are summarized in
Table 4.1. As also shown in the table, average R2 values for the first order model were 0.655,
0.814, and 0.800 in Experiments I, II, and III, respectively. The relatively low R2 values indicate
that a first order model does not perfectly fit the experimental data. This was not particularly
surprising in this case, given the fact that this simple model does not account for differences in
biomass concentration as a function of time within the various respirometer bottles.
Nevertheless, because biomass concentrations were not measured as a function of time in the
experiments described herein (and therefore data are not available to allow a more sophisticated
modeling approach that includes changes in biomass), the first order model was used as a basis
of comparison. The increase in k values provide evidence that the microbial population was
enriched for microorganisms capable of SDS over time.
48
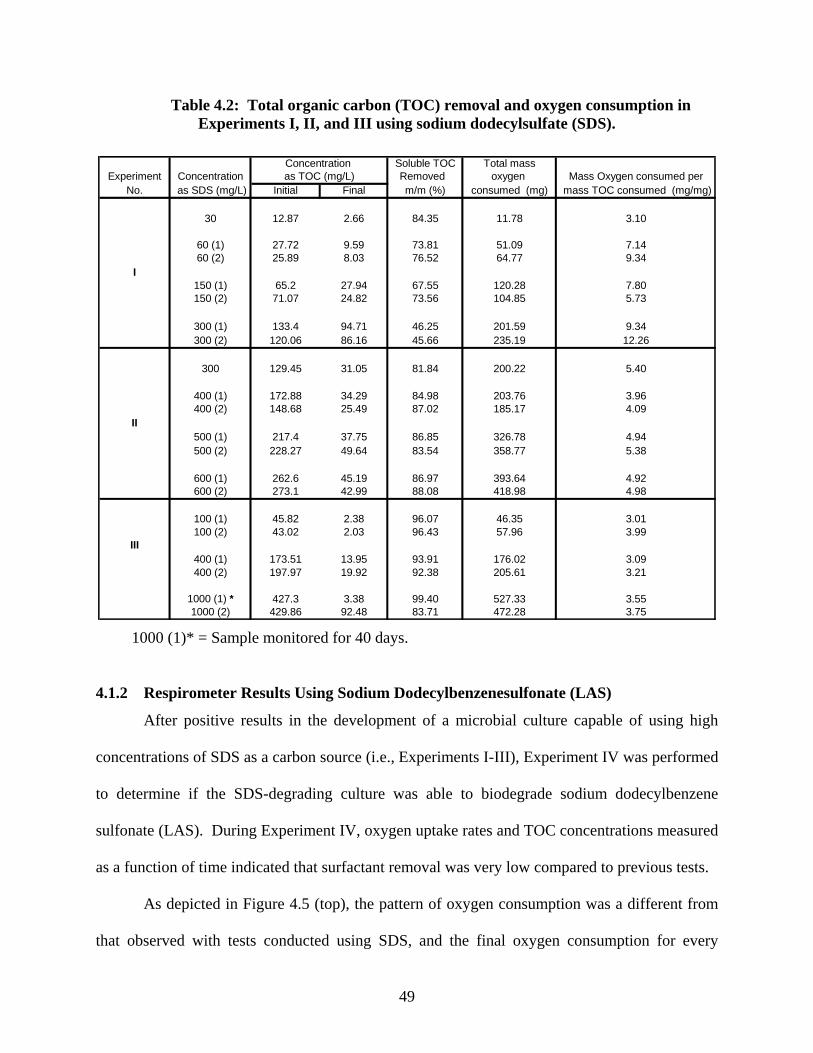
Table 4.2: Total organic carbon (TOC) removal and oxygen consumption in Experiments I, II, and III using sodium dodecylsulfate (SDS).
Soluble TOC Total massExperiment Concentration Removed oxygen Mass Oxygen consumed per
No. as SDS (mg/L) Initial Final m/m (%) consumed (mg) mass TOC consumed (mg/mg)
30 12.87 2.66 84.35 11.78 3.10
60 (1) 27.72 9.59 73.81 51.09 7.1460 (2) 25.89 8.03 76.52 64.77 9.34
I150 (1) 65.2 27.94 67.55 120.28 7.80150 (2) 71.07 24.82 73.56 104.85 5.73
300 (1) 133.4 94.71 46.25 201.59 9.34300 (2) 120.06 86.16 45.66 235.19 12.26
300 129.45 31.05 81.84 200.22 5.40
400 (1) 172.88 34.29 84.98 203.76 3.96400 (2) 148.68 25.49 87.02 185.17 4.09
II500 (1) 217.4 37.75 86.85 326.78 4.94500 (2) 228.27 49.64 83.54 358.77 5.38
600 (1) 262.6 45.19 86.97 393.64 4.92600 (2) 273.1 42.99 88.08 418.98 4.98
100 (1) 45.82 2.38 96.07 46.35 3.01100 (2) 43.02 2.03 96.43 57.96 3.99
III400 (1) 173.51 13.95 93.91 176.02 3.09400 (2) 197.97 19.92 92.38 205.61 3.21
1000 (1) * 427.3 3.38 99.40 527.33 3.551000 (2) 429.86 92.48 83.71 472.28 3.75
Concentration as TOC (mg/L)
1000 (1)* = Sample monitored for 40 days.
4.1.2 Respirometer Results Using Sodium Dodecylbenzenesulfonate (LAS)
After positive results in the development of a microbial culture capable of using high
concentrations of SDS as a carbon source (i.e., Experiments I-III), Experiment IV was performed
to determine if the SDS-degrading culture was able to biodegrade sodium dodecylbenzene
sulfonate (LAS). During Experiment IV, oxygen uptake rates and TOC concentrations measured
as a function of time indicated that surfactant removal was very low compared to previous tests.
As depicted in Figure 4.5 (top), the pattern of oxygen consumption was a different from
that observed with tests conducted using SDS, and the final oxygen consumption for every
49
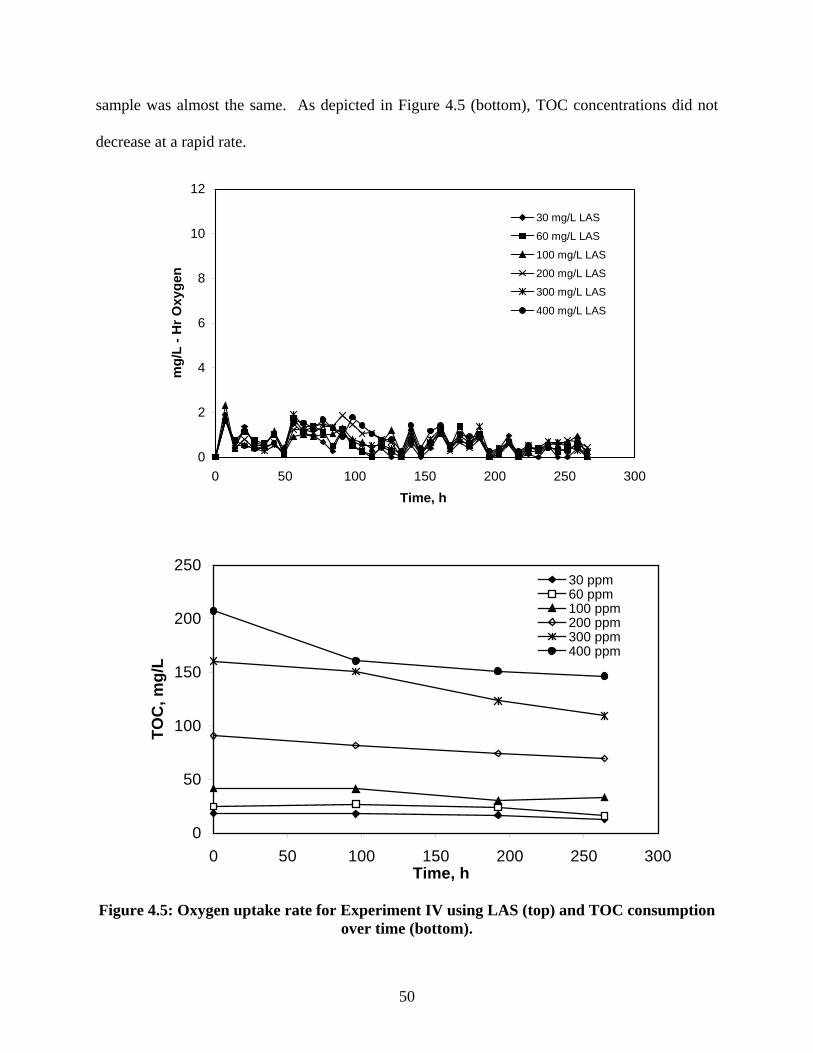
sample was almost the same. As depicted in Figure 4.5 (bottom), TOC concentrations did not
decrease at a rapid rate.
0
2
4
6
8
10
12
0 50 100 150 200 250 300Time, h
mg/
L - H
r Oxy
gen
30 mg/L LAS
60 mg/L LAS
100 mg/L LAS
200 mg/L LAS
300 mg/L LAS
400 mg/L LAS
0
50
100
150
200
250
0 50 100 150 200 250 300Time, h
TOC
, mg/
L
30 ppm60 ppm100 ppm200 ppm300 ppm400 ppm
Figure 4.5: Oxygen uptake rate for Experiment IV using LAS (top) and TOC consumption
over time (bottom).
50
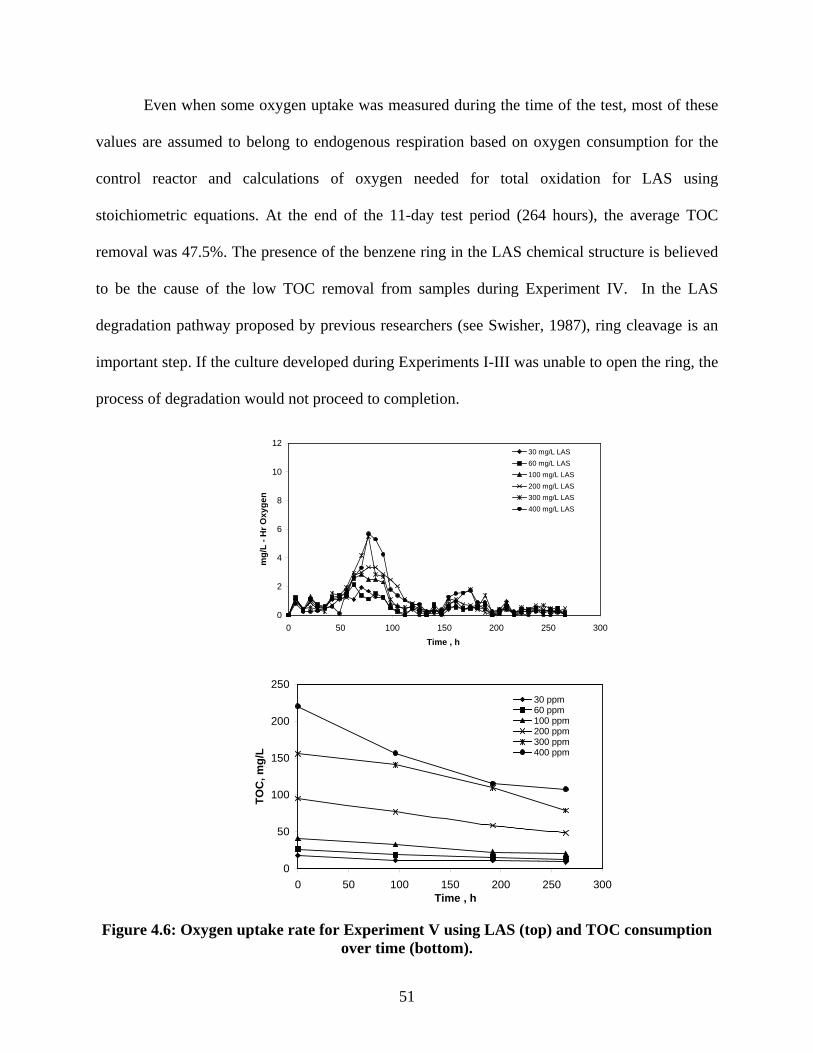
Even when some oxygen uptake was measured during the time of the test, most of these
values are assumed to belong to endogenous respiration based on oxygen consumption for the
control reactor and calculations of oxygen needed for total oxidation for LAS using
stoichiometric equations. At the end of the 11-day test period (264 hours), the average TOC
removal was 47.5%. The presence of the benzene ring in the LAS chemical structure is believed
to be the cause of the low TOC removal from samples during Experiment IV. In the LAS
degradation pathway proposed by previous researchers (see Swisher, 1987), ring cleavage is an
important step. If the culture developed during Experiments I-III was unable to open the ring, the
process of degradation would not proceed to completion.
0
2
4
6
8
10
12
0 50 100 150 200 250 300Time , h
mg/
L - H
r Oxy
gen
30 mg/L LAS60 mg/L LAS100 mg/L LAS200 mg/L LAS300 mg/L LAS400 mg/L LAS
0
50
100
150
200
250
0 50 100 150 200 250 300Time , h
TOC
, mg/
L
30 ppm60 ppm100 ppm200 ppm300 ppm400 ppm
Figure 4.6: Oxygen uptake rate for Experiment V using LAS (top) and TOC consumption
over time (bottom).
51
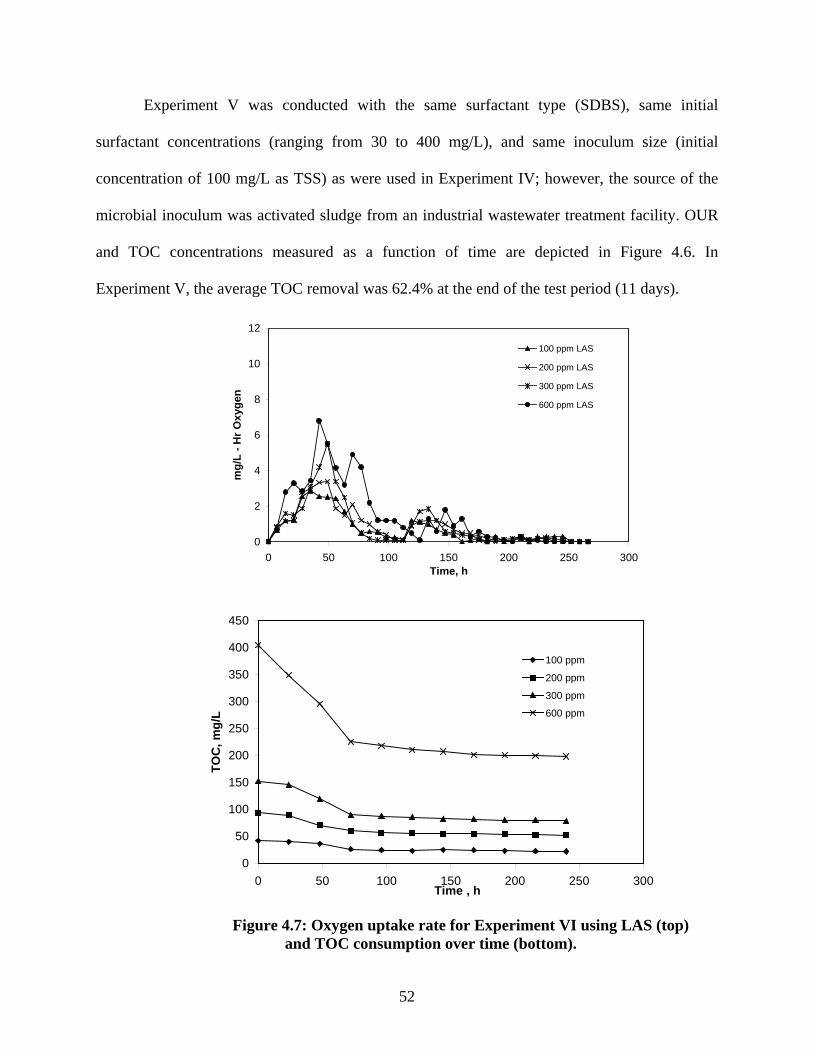
Experiment V was conducted with the same surfactant type (SDBS), same initial
surfactant concentrations (ranging from 30 to 400 mg/L), and same inoculum size (initial
concentration of 100 mg/L as TSS) as were used in Experiment IV; however, the source of the
microbial inoculum was activated sludge from an industrial wastewater treatment facility. OUR
and TOC concentrations measured as a function of time are depicted in Figure 4.6. In
Experiment V, the average TOC removal was 62.4% at the end of the test period (11 days).
0
2
4
6
8
10
12
0 50 100 150 200 250 300Time, h
mg/
L - H
r Oxy
gen
100 ppm LAS
200 ppm LAS
300 ppm LAS
600 ppm LAS
0
50
100
150
200
250
300
350
400
450
0 50 100 150 200 250 300Time , h
TOC
, mg/
L
100 ppm
200 ppm
300 ppm
600 ppm
Figure 4.7: Oxygen uptake rate for Experiment VI using LAS (top)
and TOC consumption over time (bottom).
52
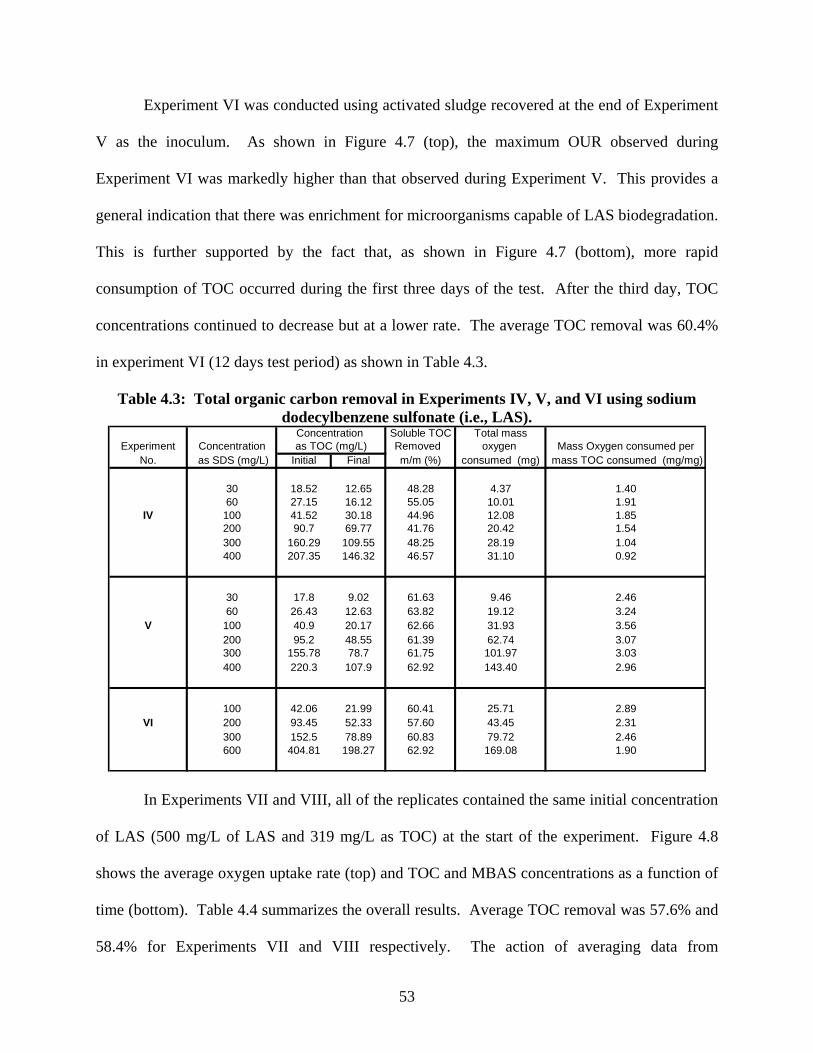
Experiment VI was conducted using activated sludge recovered at the end of Experiment
V as the inoculum. As shown in Figure 4.7 (top), the maximum OUR observed during
Experiment VI was markedly higher than that observed during Experiment V. This provides a
general indication that there was enrichment for microorganisms capable of LAS biodegradation.
This is further supported by the fact that, as shown in Figure 4.7 (bottom), more rapid
consumption of TOC occurred during the first three days of the test. After the third day, TOC
concentrations continued to decrease but at a lower rate. The average TOC removal was 60.4%
in experiment VI (12 days test period) as shown in Table 4.3.
Table 4.3: Total organic carbon removal in Experiments IV, V, and VI using sodium dodecylbenzene sulfonate (i.e., LAS).
Soluble TOC Total massExperiment Concentration Removed oxygen Mass Oxygen consumed per
No. as SDS (mg/L) Initial Final m/m (%) consumed (mg) mass TOC consumed (mg/mg)
30 18.52 12.65 48.28 4.37 1.4060 27.15 16.12 55.05 10.01 1.91
IV 100 41.52 30.18 44.96 12.08 1.85200 90.7 69.77 41.76 20.42 1.54300 160.29 109.55 48.25 28.19 1.04400 207.35 146.32 46.57 31.10 0.92
30 17.8 9.02 61.63 9.46 2.4660 26.43 12.63 63.82 19.12 3.24
V 100 40.9 20.17 62.66 31.93 3.56200 95.2 48.55 61.39 62.74 3.07300 155.78 78.7 61.75 101.97 3.03400 220.3 107.9 62.92 143.40 2.96
100 42.06 21.99 60.41 25.71 2.89VI 200 93.45 52.33 57.60 43.45 2.31
300 152.5 78.89 60.83 79.72 2.46600 404.81 198.27 62.92 169.08 1.90
Concentration as TOC (mg/L)
In Experiments VII and VIII, all of the replicates contained the same initial concentration
of LAS (500 mg/L of LAS and 319 mg/L as TOC) at the start of the experiment. Figure 4.8
shows the average oxygen uptake rate (top) and TOC and MBAS concentrations as a function of
time (bottom). Table 4.4 summarizes the overall results. Average TOC removal was 57.6% and
58.4% for Experiments VII and VIII respectively. The action of averaging data from
53
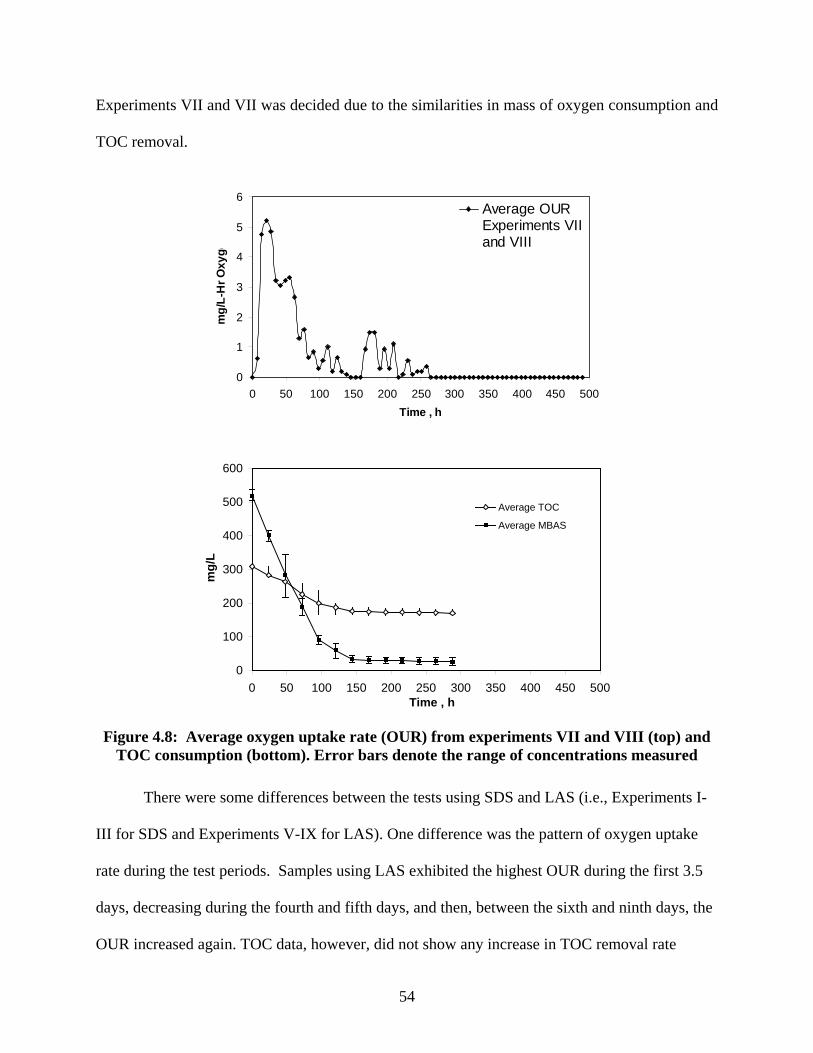
Experiments VII and VII was decided due to the similarities in mass of oxygen consumption and
TOC removal.
0
1
2
3
4
5
6
0 50 100 150 200 250 300 350 400 450 500Time , h
mg/
L-H
r Oxy
geAverage OURExperiments VIIand VIII
0
100
200
300
400
500
600
0 50 100 150 200 250 300 350 400 450 500Time , h
mg/
L
Average TOC
Average MBAS
Figure 4.8: Average oxygen uptake rate (OUR) from experiments VII and VIII (top) and
TOC consumption (bottom). Error bars denote the range of concentrations measured
There were some differences between the tests using SDS and LAS (i.e., Experiments I-
III for SDS and Experiments V-IX for LAS). One difference was the pattern of oxygen uptake
rate during the test periods. Samples using LAS exhibited the highest OUR during the first 3.5
days, decreasing during the fourth and fifth days, and then, between the sixth and ninth days, the
OUR increased again. TOC data, however, did not show any increase in TOC removal rate
54
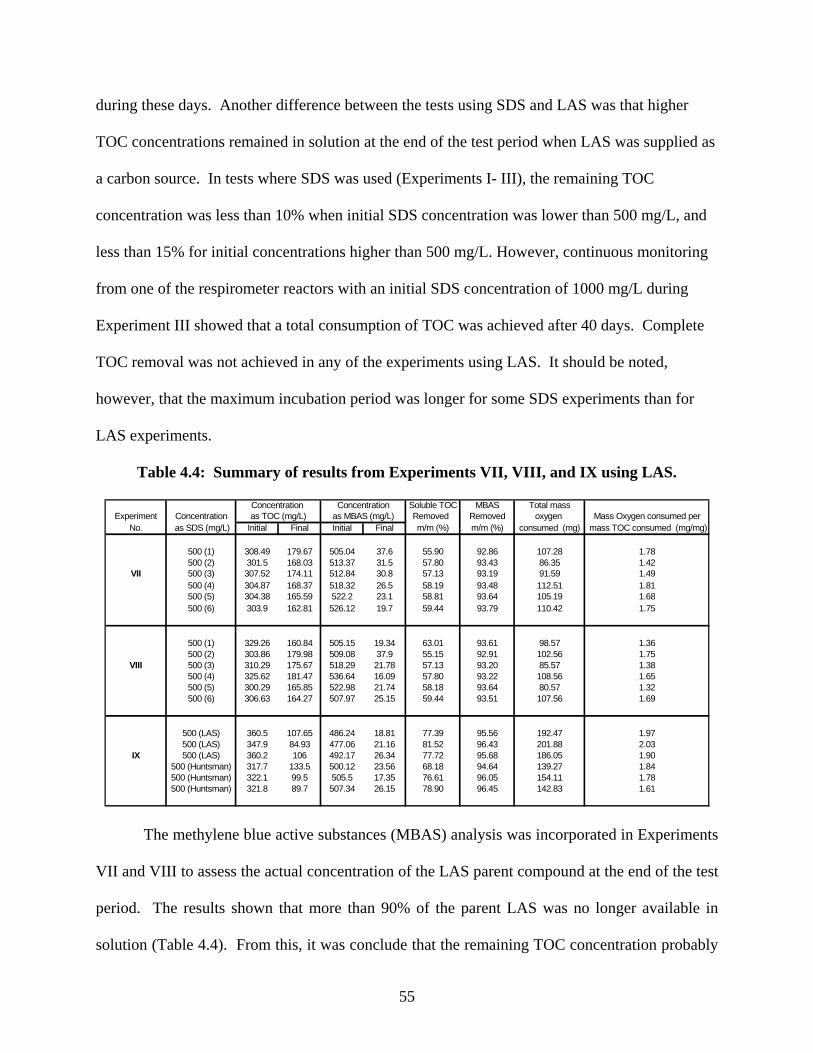
during these days. Another difference between the tests using SDS and LAS was that higher
TOC concentrations remained in solution at the end of the test period when LAS was supplied as
a carbon source. In tests where SDS was used (Experiments I- III), the remaining TOC
concentration was less than 10% when initial SDS concentration was lower than 500 mg/L, and
less than 15% for initial concentrations higher than 500 mg/L. However, continuous monitoring
from one of the respirometer reactors with an initial SDS concentration of 1000 mg/L during
Experiment III showed that a total consumption of TOC was achieved after 40 days. Complete
TOC removal was not achieved in any of the experiments using LAS. It should be noted,
however, that the maximum incubation period was longer for some SDS experiments than for
LAS experiments.
Table 4.4: Summary of results from Experiments VII, VIII, and IX using LAS.
Soluble TOC MBAS Total massExperiment Concentration Removed Removed oxygen Mass Oxygen consumed per
No. as SDS (mg/L) Initial Final Initial Final m/m (%) m/m (%) consumed (mg) mass TOC consumed (mg/mg)
500 (1) 308.49 179.67 505.04 37.6 55.90 92.86 107.28 1.78500 (2) 301.5 168.03 513.37 31.5 57.80 93.43 86.35 1.42
VII 500 (3) 307.52 174.11 512.84 30.8 57.13 93.19 91.59 1.49500 (4) 304.87 168.37 518.32 26.5 58.19 93.48 112.51 1.81500 (5) 304.38 165.59 522.2 23.1 58.81 93.64 105.19 1.68500 (6) 303.9 162.81 526.12 19.7 59.44 93.79 110.42 1.75
500 (1) 329.26 160.84 505.15 19.34 63.01 93.61 98.57 1.36500 (2) 303.86 179.98 509.08 37.9 55.15 92.91 102.56 1.75
VIII 500 (3) 310.29 175.67 518.29 21.78 57.13 93.20 85.57 1.38500 (4) 325.62 181.47 536.64 16.09 57.80 93.22 108.56 1.65500 (5) 300.29 165.85 522.98 21.74 58.18 93.64 80.57 1.32500 (6) 306.63 164.27 507.97 25.15 59.44 93.51 107.56 1.69
500 (LAS) 360.5 107.65 486.24 18.81 77.39 95.56 192.47 1.97500 (LAS) 347.9 84.93 477.06 21.16 81.52 96.43 201.88 2.03
IX 500 (LAS) 360.2 106 492.17 26.34 77.72 95.68 186.05 1.90500 (Huntsman) 317.7 133.5 500.12 23.56 68.18 94.64 139.27 1.84500 (Huntsman) 322.1 99.5 505.5 17.35 76.61 96.05 154.11 1.78500 (Huntsman) 321.8 89.7 507.34 26.15 78.90 96.45 142.83 1.61
as TOC (mg/L) as MBAS (mg/L)Concentration Concentration
The methylene blue active substances (MBAS) analysis was incorporated in Experiments
VII and VIII to assess the actual concentration of the LAS parent compound at the end of the test
period. The results shown that more than 90% of the parent LAS was no longer available in
solution (Table 4.4). From this, it was conclude that the remaining TOC concentration probably
55
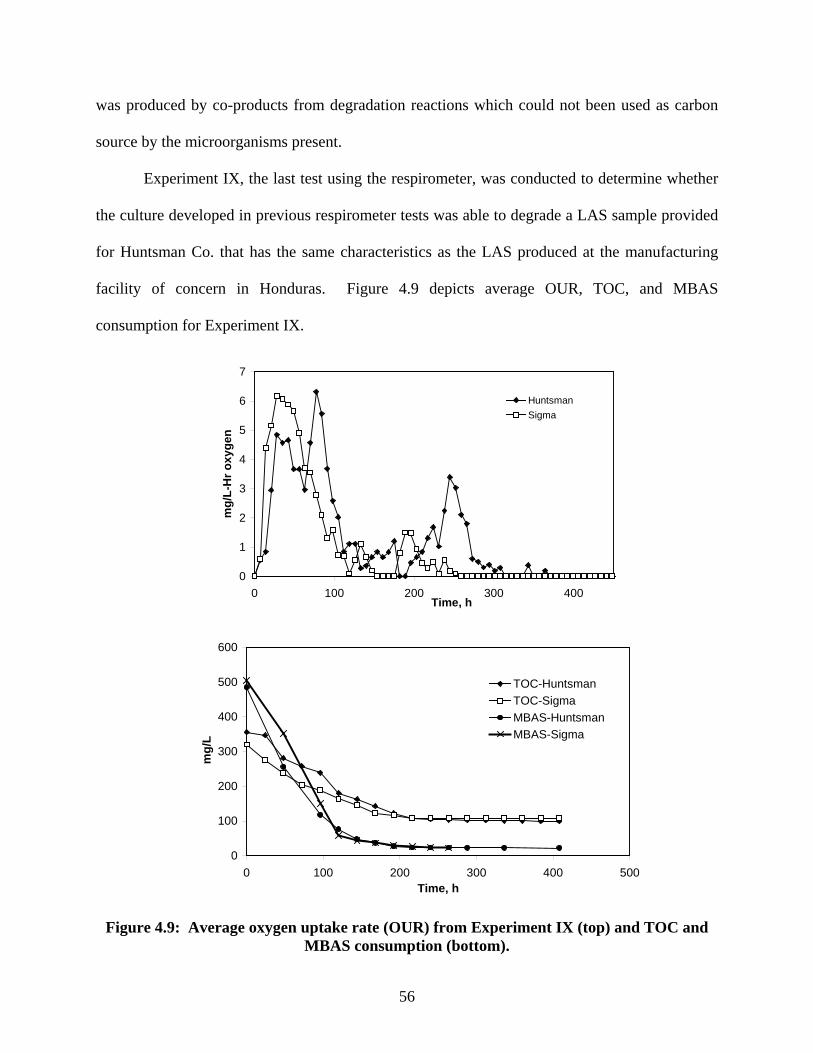
was produced by co-products from degradation reactions which could not been used as carbon
source by the microorganisms present.
Experiment IX, the last test using the respirometer, was conducted to determine whether
the culture developed in previous respirometer tests was able to degrade a LAS sample provided
for Huntsman Co. that has the same characteristics as the LAS produced at the manufacturing
facility of concern in Honduras. Figure 4.9 depicts average OUR, TOC, and MBAS
consumption for Experiment IX.
0
1
2
3
4
5
6
7
0 100 200 300 400Time, h
mg/
L-H
r oxy
gen
HuntsmanSigma
0
100
200
300
400
500
600
0 100 200 300 400 500Time, h
mg/
L
TOC-HuntsmanTOC-SigmaMBAS-HuntsmanMBAS-Sigma
Figure 4.9: Average oxygen uptake rate (OUR) from Experiment IX (top) and TOC and
MBAS consumption (bottom).
56
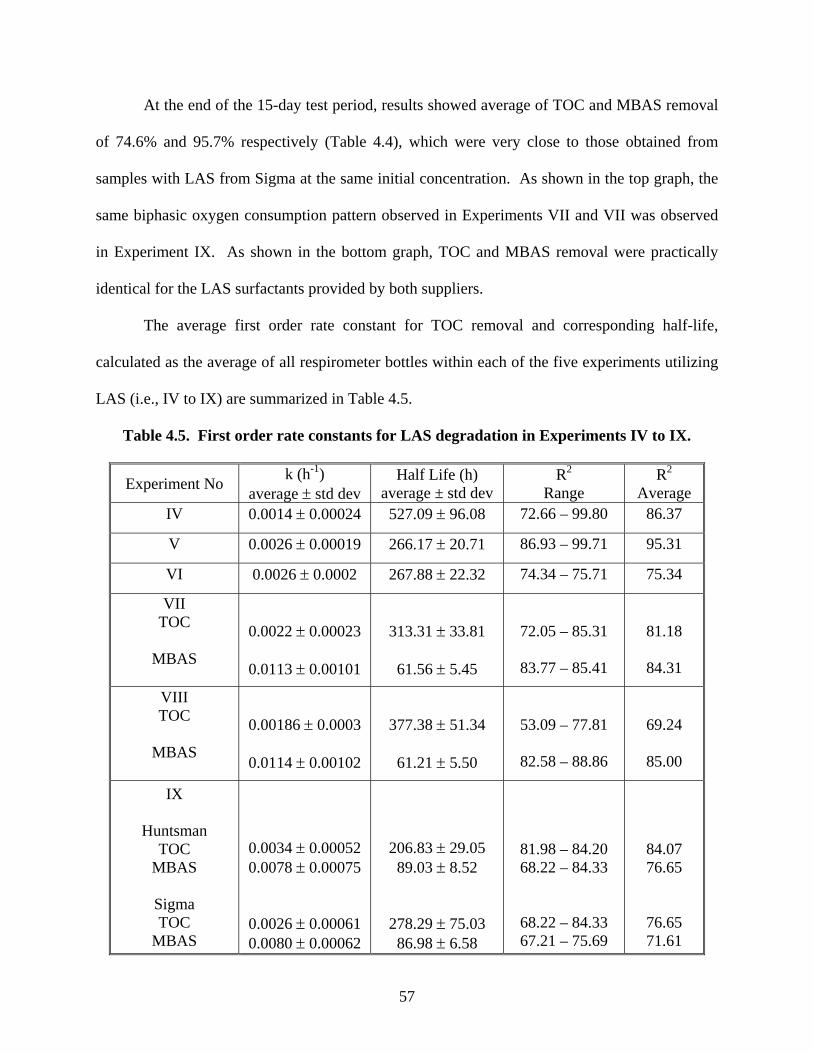
At the end of the 15-day test period, results showed average of TOC and MBAS removal
of 74.6% and 95.7% respectively (Table 4.4), which were very close to those obtained from
samples with LAS from Sigma at the same initial concentration. As shown in the top graph, the
same biphasic oxygen consumption pattern observed in Experiments VII and VII was observed
in Experiment IX. As shown in the bottom graph, TOC and MBAS removal were practically
identical for the LAS surfactants provided by both suppliers.
The average first order rate constant for TOC removal and corresponding half-life,
calculated as the average of all respirometer bottles within each of the five experiments utilizing
LAS (i.e., IV to IX) are summarized in Table 4.5.
Table 4.5. First order rate constants for LAS degradation in Experiments IV to IX.
Experiment No k (h-1) average ± std dev
Half Life (h) average ± std dev
R2
Range R2
Average IV 0.0014 ± 0.00024 527.09 ± 96.08 72.66 – 99.80 86.37
V 0.0026 ± 0.00019 266.17 ± 20.71 86.93 – 99.71 95.31
VI 0.0026 ± 0.0002 267.88 ± 22.32 74.34 – 75.71 75.34
VII TOC
MBAS
0.0022 ± 0.00023
0.0113 ± 0.00101
313.31 ± 33.81
61.56 ± 5.45
72.05 – 85.31
83.77 – 85.41
81.18
84.31
VIII TOC
MBAS
0.00186 ± 0.0003
0.0114 ± 0.00102
377.38 ± 51.34
61.21 ± 5.50
53.09 – 77.81
82.58 – 88.86
69.24
85.00
IX
Huntsman TOC
MBAS
Sigma TOC
MBAS
0.0034 ± 0.00052 0.0078 ± 0.00075
0.0026 ± 0.00061 0.0080 ± 0.00062
206.83 ± 29.05 89.03 ± 8.52
278.29 ± 75.03 86.98 ± 6.58
81.98 – 84.20 68.22 – 84.33
68.22 – 84.33 67.21 – 75.69
84.07 76.65
76.65 71.61
57
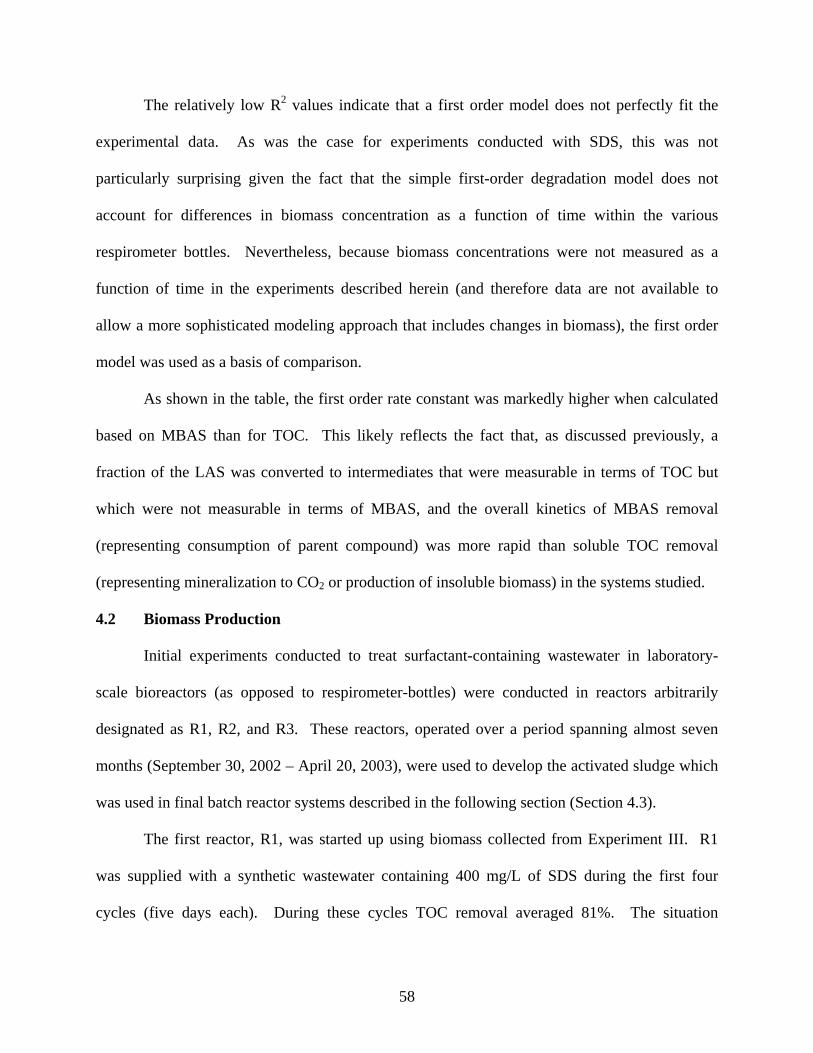
The relatively low R2 values indicate that a first order model does not perfectly fit the
experimental data. As was the case for experiments conducted with SDS, this was not
particularly surprising given the fact that the simple first-order degradation model does not
account for differences in biomass concentration as a function of time within the various
respirometer bottles. Nevertheless, because biomass concentrations were not measured as a
function of time in the experiments described herein (and therefore data are not available to
allow a more sophisticated modeling approach that includes changes in biomass), the first order
model was used as a basis of comparison.
As shown in the table, the first order rate constant was markedly higher when calculated
based on MBAS than for TOC. This likely reflects the fact that, as discussed previously, a
fraction of the LAS was converted to intermediates that were measurable in terms of TOC but
which were not measurable in terms of MBAS, and the overall kinetics of MBAS removal
(representing consumption of parent compound) was more rapid than soluble TOC removal
(representing mineralization to CO2 or production of insoluble biomass) in the systems studied.
4.2 Biomass Production
Initial experiments conducted to treat surfactant-containing wastewater in laboratory-
scale bioreactors (as opposed to respirometer-bottles) were conducted in reactors arbitrarily
designated as R1, R2, and R3. These reactors, operated over a period spanning almost seven
months (September 30, 2002 – April 20, 2003), were used to develop the activated sludge which
was used in final batch reactor systems described in the following section (Section 4.3).
The first reactor, R1, was started up using biomass collected from Experiment III. R1
was supplied with a synthetic wastewater containing 400 mg/L of SDS during the first four
cycles (five days each). During these cycles TOC removal averaged 81%. The situation
58
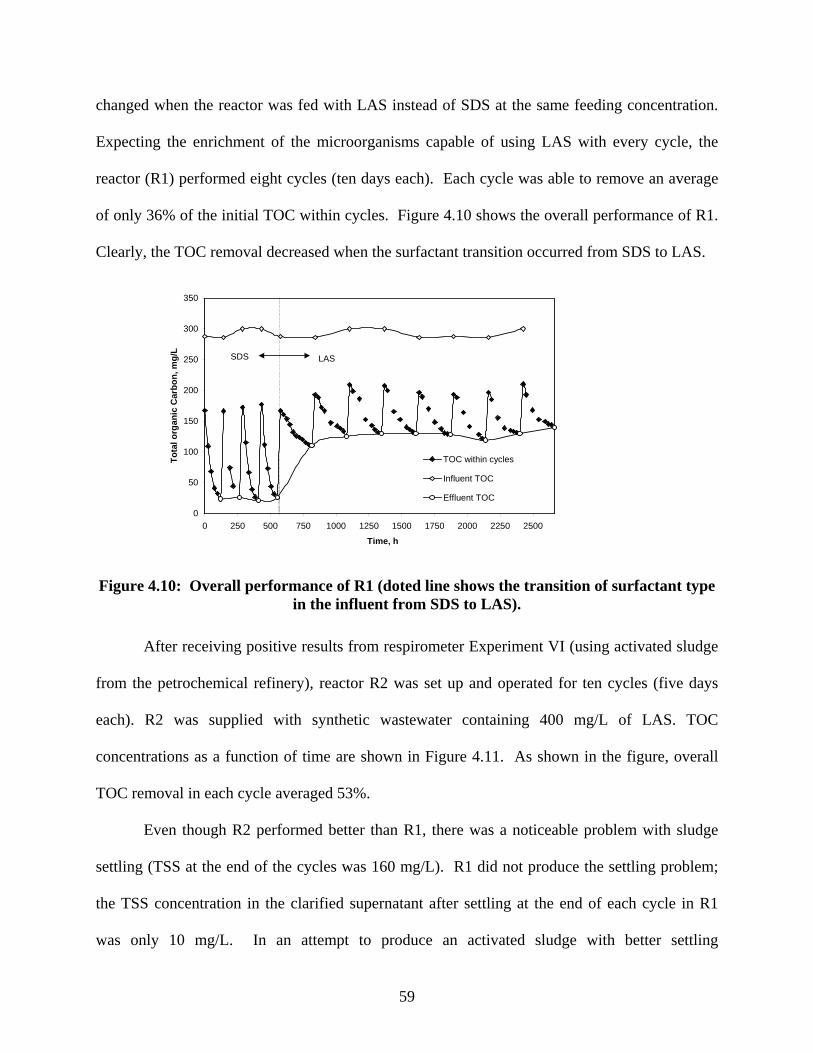
changed when the reactor was fed with LAS instead of SDS at the same feeding concentration.
Expecting the enrichment of the microorganisms capable of using LAS with every cycle, the
reactor (R1) performed eight cycles (ten days each). Each cycle was able to remove an average
of only 36% of the initial TOC within cycles. Figure 4.10 shows the overall performance of R1.
Clearly, the TOC removal decreased when the surfactant transition occurred from SDS to LAS.
0
50
100
150
200
250
300
350
0 250 500 750 1000 1250 1500 1750 2000 2250 2500
Time, h
Tota
l org
anic
Car
bon,
mg/
L
TOC within cycles
Influent TOC
Effluent TOC
SDS LAS
Figure 4.10: Overall performance of R1 (doted line shows the transition of surfactant type
in the influent from SDS to LAS).
After receiving positive results from respirometer Experiment VI (using activated sludge
from the petrochemical refinery), reactor R2 was set up and operated for ten cycles (five days
each). R2 was supplied with synthetic wastewater containing 400 mg/L of LAS. TOC
concentrations as a function of time are shown in Figure 4.11. As shown in the figure, overall
TOC removal in each cycle averaged 53%.
Even though R2 performed better than R1, there was a noticeable problem with sludge
settling (TSS at the end of the cycles was 160 mg/L). R1 did not produce the settling problem;
the TSS concentration in the clarified supernatant after settling at the end of each cycle in R1
was only 10 mg/L. In an attempt to produce an activated sludge with better settling
59
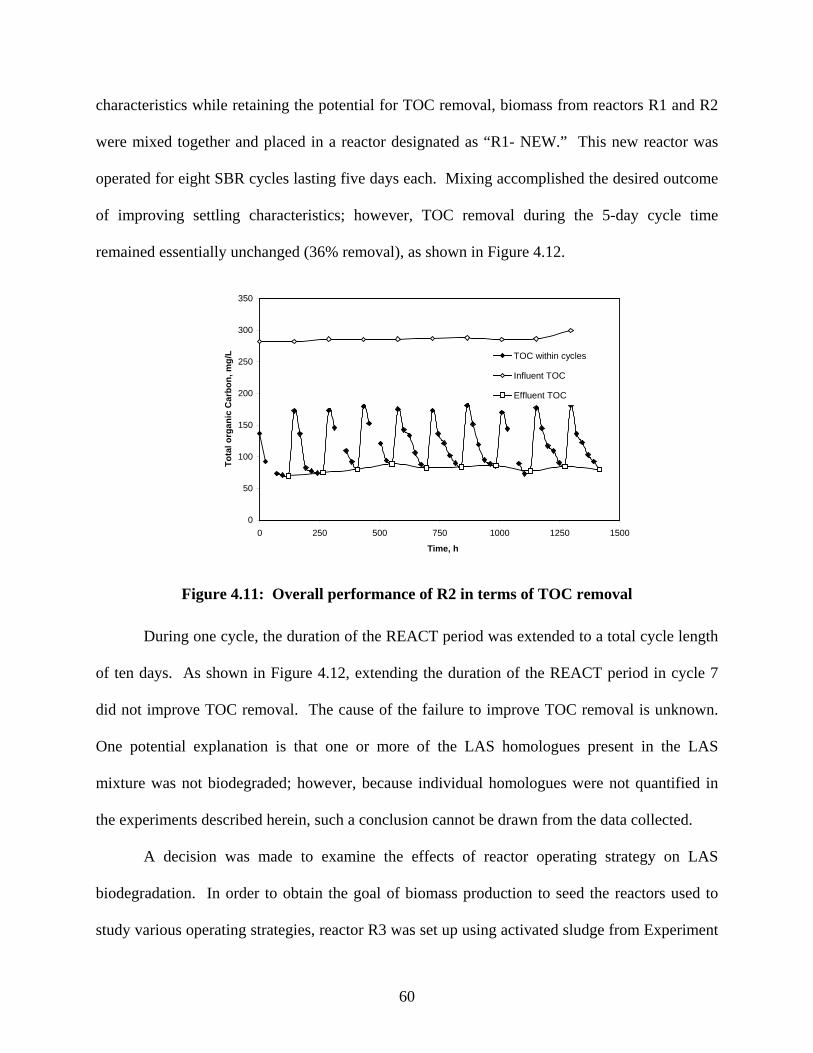
characteristics while retaining the potential for TOC removal, biomass from reactors R1 and R2
were mixed together and placed in a reactor designated as “R1- NEW.” This new reactor was
operated for eight SBR cycles lasting five days each. Mixing accomplished the desired outcome
of improving settling characteristics; however, TOC removal during the 5-day cycle time
remained essentially unchanged (36% removal), as shown in Figure 4.12.
0
50
100
150
200
250
300
350
0 250 500 750 1000 1250 1500
Time, h
Tota
l org
anic
Car
bon,
mg/
L TOC within cycles
Influent TOC
Effluent TOC
Figure 4.11: Overall performance of R2 in terms of TOC removal
During one cycle, the duration of the REACT period was extended to a total cycle length
of ten days. As shown in Figure 4.12, extending the duration of the REACT period in cycle 7
did not improve TOC removal. The cause of the failure to improve TOC removal is unknown.
One potential explanation is that one or more of the LAS homologues present in the LAS
mixture was not biodegraded; however, because individual homologues were not quantified in
the experiments described herein, such a conclusion cannot be drawn from the data collected.
A decision was made to examine the effects of reactor operating strategy on LAS
biodegradation. In order to obtain the goal of biomass production to seed the reactors used to
study various operating strategies, reactor R3 was set up using activated sludge from Experiment
60
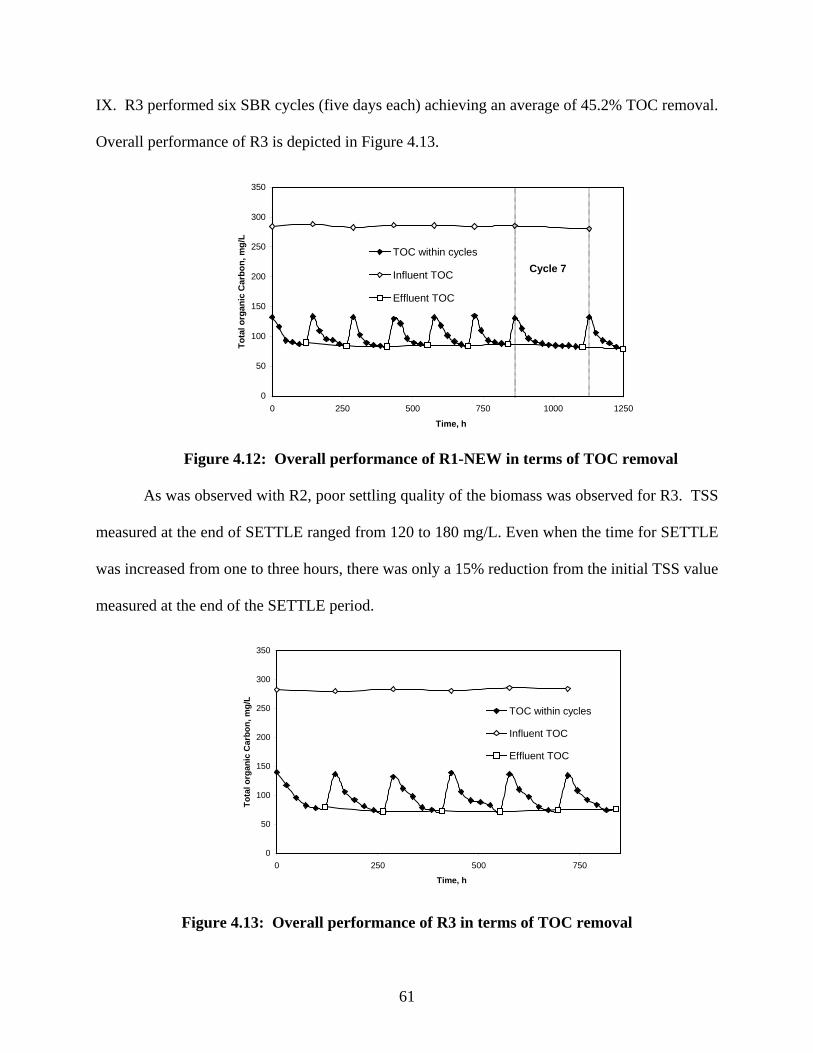
IX. R3 performed six SBR cycles (five days each) achieving an average of 45.2% TOC removal.
Overall performance of R3 is depicted in Figure 4.13.
0
50
100
150
200
250
300
350
0 250 500 750 1000 1250
Time, h
Tota
l org
anic
Car
bon,
mg/
LTOC within cycles
Influent TOC
Effluent TOC
Cycle 7
Figure 4.12: Overall performance of R1-NEW in terms of TOC removal
As was observed with R2, poor settling quality of the biomass was observed for R3. TSS
measured at the end of SETTLE ranged from 120 to 180 mg/L. Even when the time for SETTLE
was increased from one to three hours, there was only a 15% reduction from the initial TSS value
measured at the end of the SETTLE period.
0
50
100
150
200
250
300
350
0 250 500 750
Time, h
Tota
l org
anic
Car
bon,
mg/
L
TOC within cycles
Influent TOC
Effluent TOC
Figure 4.13: Overall performance of R3 in terms of TOC removal
61
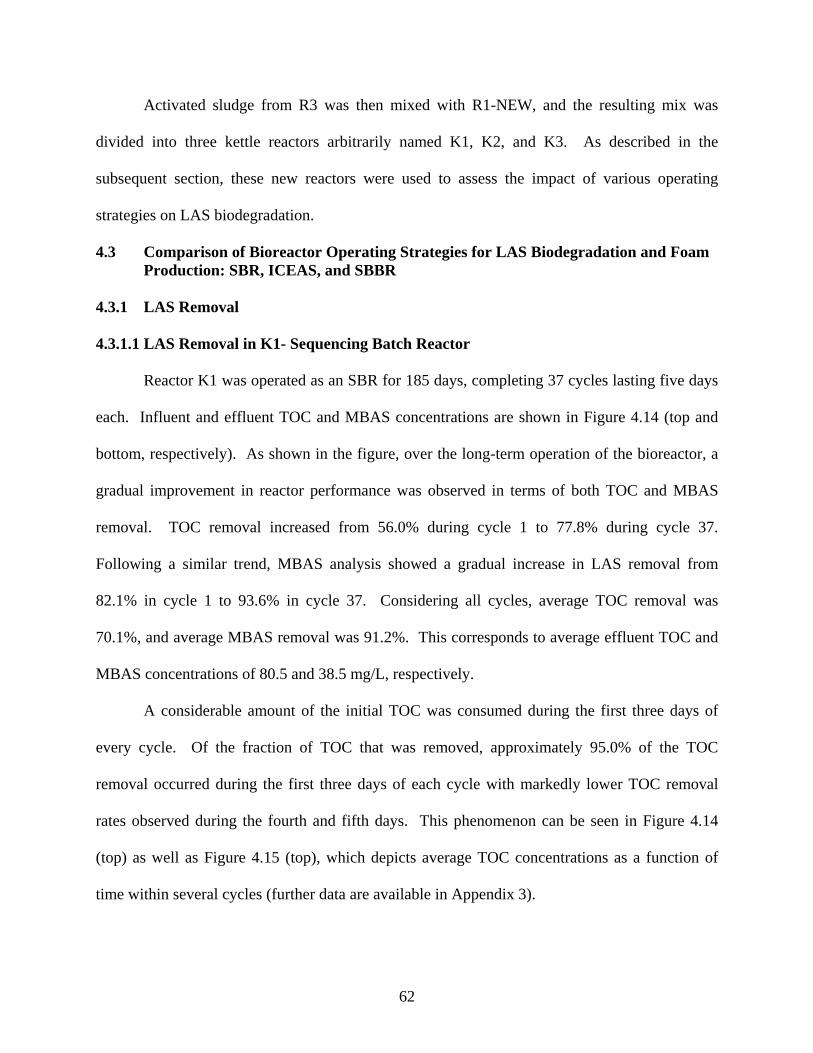
Activated sludge from R3 was then mixed with R1-NEW, and the resulting mix was
divided into three kettle reactors arbitrarily named K1, K2, and K3. As described in the
subsequent section, these new reactors were used to assess the impact of various operating
strategies on LAS biodegradation.
4.3 Comparison of Bioreactor Operating Strategies for LAS Biodegradation and Foam Production: SBR, ICEAS, and SBBR
4.3.1 LAS Removal
4.3.1.1 LAS Removal in K1- Sequencing Batch Reactor
Reactor K1 was operated as an SBR for 185 days, completing 37 cycles lasting five days
each. Influent and effluent TOC and MBAS concentrations are shown in Figure 4.14 (top and
bottom, respectively). As shown in the figure, over the long-term operation of the bioreactor, a
gradual improvement in reactor performance was observed in terms of both TOC and MBAS
removal. TOC removal increased from 56.0% during cycle 1 to 77.8% during cycle 37.
Following a similar trend, MBAS analysis showed a gradual increase in LAS removal from
82.1% in cycle 1 to 93.6% in cycle 37. Considering all cycles, average TOC removal was
70.1%, and average MBAS removal was 91.2%. This corresponds to average effluent TOC and
MBAS concentrations of 80.5 and 38.5 mg/L, respectively.
A considerable amount of the initial TOC was consumed during the first three days of
every cycle. Of the fraction of TOC that was removed, approximately 95.0% of the TOC
removal occurred during the first three days of each cycle with markedly lower TOC removal
rates observed during the fourth and fifth days. This phenomenon can be seen in Figure 4.14
(top) as well as Figure 4.15 (top), which depicts average TOC concentrations as a function of
time within several cycles (further data are available in Appendix 3).
62
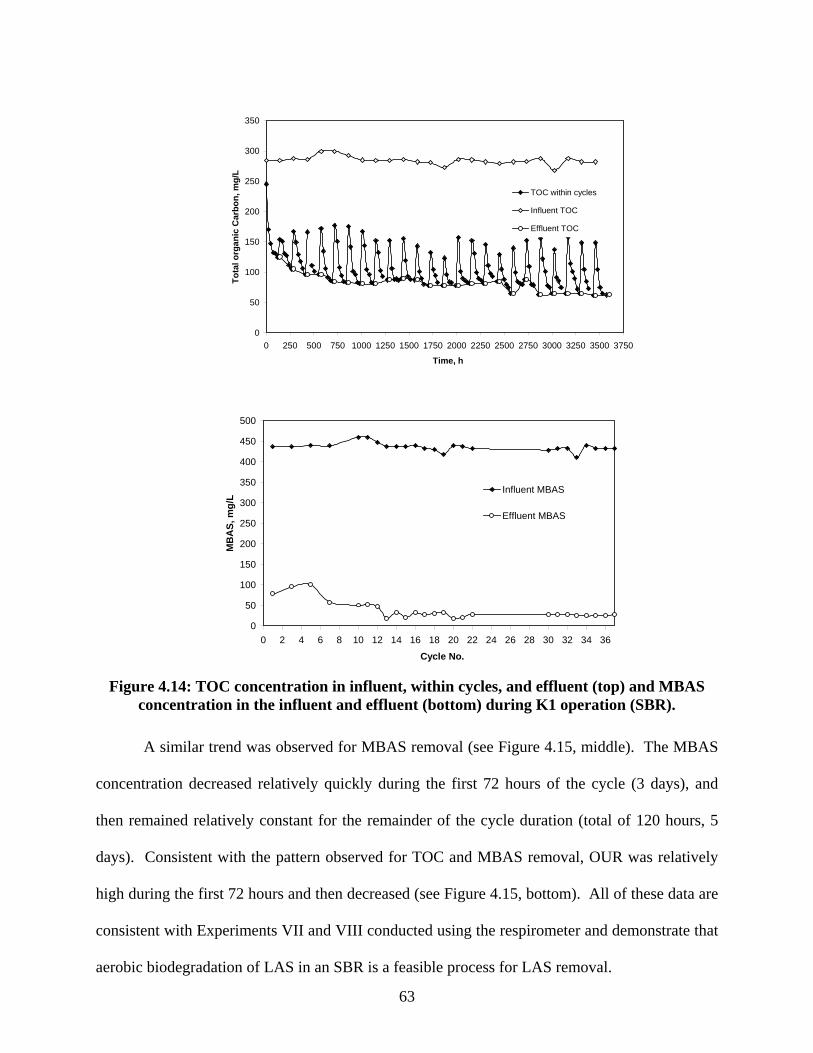
0
50
100
150
200
250
300
350
0 250 500 750 1000 1250 1500 1750 2000 2250 2500 2750 3000 3250 3500 3750
Time, h
Tota
l org
anic
Car
bon,
mg/
L
TOC within cycles
Influent TOC
Effluent TOC
0
50
100
150
200
250
300
350
400
450
500
0 2 4 6 8 10 12 14 16 18 20 22 24 26 28 30 32 34 36
Cycle No.
MB
AS,
mg/
L
Influent MBAS
Effluent MBAS
Figure 4.14: TOC concentration in influent, within cycles, and effluent (top) and MBAS
concentration in the influent and effluent (bottom) during K1 operation (SBR).
A similar trend was observed for MBAS removal (see Figure 4.15, middle). The MBAS
concentration decreased relatively quickly during the first 72 hours of the cycle (3 days), and
then remained relatively constant for the remainder of the cycle duration (total of 120 hours, 5
days). Consistent with the pattern observed for TOC and MBAS removal, OUR was relatively
high during the first 72 hours and then decreased (see Figure 4.15, bottom). All of these data are
consistent with Experiments VII and VIII conducted using the respirometer and demonstrate that
aerobic biodegradation of LAS in an SBR is a feasible process for LAS removal.
63
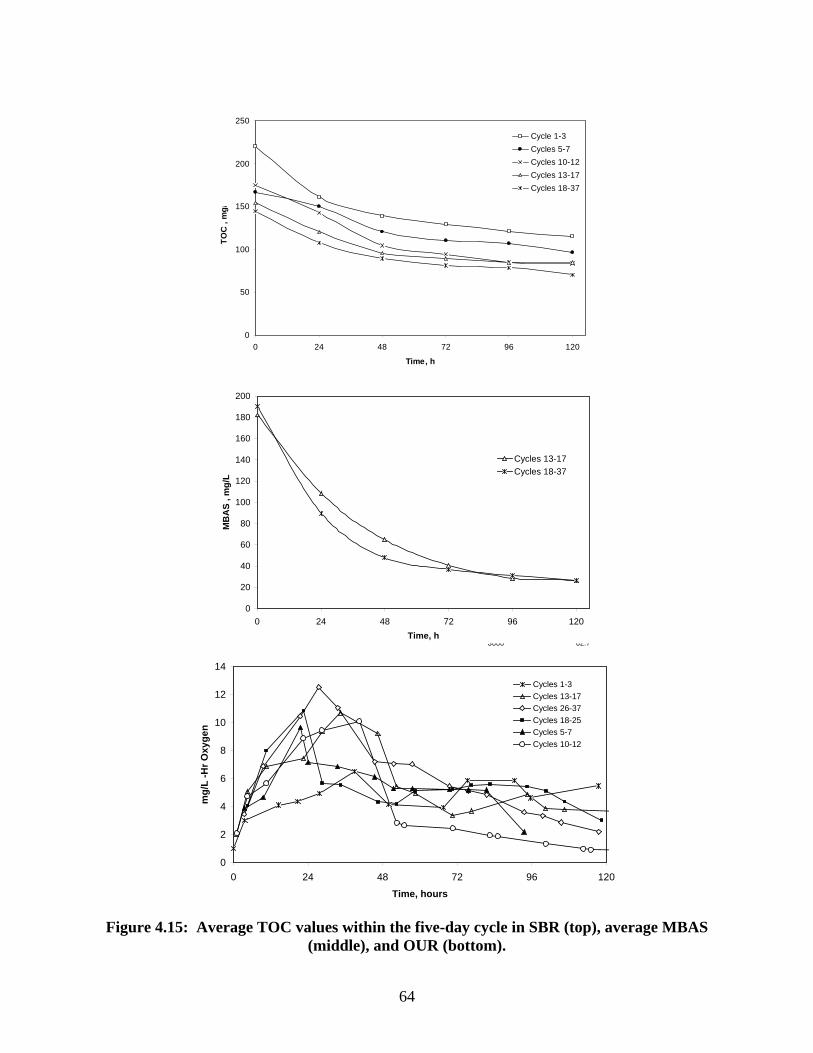
0
50
100
150
200
250
0 24 48 72 96 120
Time, h
TOC
, m
g/
Cycle 1-3Cycles 5-7Cycles 10-12Cycles 13-17Cycles 18-37
0 284.6144 284.6 125.1288 287.4 105.42432 286.3 95.85576 300 96.83720 300 84.91864 292.3 83.4
1008 285.2 80.91152 285.1 81.161296 285.1 87.41440 286.5 89.71584 282.1 87.51728 280.4 781872 272.9 78.52016 286.4 77.62160 285.4 81.122304 282.1 82.192448 279.6 84.822592 282.1 64.52736 282.7 88.152880 287.8 633024 268.1 64.63168 287.1 65.13312 282.1 65.163456 282.1 623600 62.7
0
20
40
60
80
100
120
140
160
180
200
0 24 48 72 96 120Time, h
MB
AS
, mg/
L
Cycles 13-17Cycles 18-37
0
2
4
6
8
10
12
14
0 24 48 72 96
Time, hours
mg/
L -H
r Oxy
gen
120
Cycles 1-3Cycles 13-17Cycles 26-37Cycles 18-25Cycles 5-7Cycles 10-12
Figure 4.15: Average TOC values within the five-day cycle in SBR (top), average MBAS
(middle), and OUR (bottom).
64
Because the K1 reactor utilized a short (2.88 minutes) un-aerated FILL period, the
surfactant concentration in the reactor at the start of the REACT period was relatively high,
averaging 158 mg/L considering all SBR cycles. Consequently, when air was supplied via the
diffuser stone at the start of the REACT period, foam was produced. The quantity of foam
produced in the system was measured and recorded during selected cycles. Foam production
followed almost the same trend from cycles 15 (the first cycle in which foam production was
measured) through 37 (the last cycle for which foam production was measured, see Appendix 7
for a complete listing of data). Figure 4.16 shows the typical foam height as a function of time
during an SBR cycle (average data from cycles 15, 16, 21, 22, and 36). Figure 4.17 depicts the
foam height observed in K1 during the 10-minute interval between air supply to the reactor
(average data collected during cycles 15, 16, 21, and 22). Time zero in the graph corresponds to
the start of the 30-second interval when aeration was supplied.
0123456789
10111213
0 10 20 30 40 50 60 70 80 90 100 110 120Time , h
Foam
Hei
ght,
cm
K1
Figure 4.16: Foam production as a function of time during the REACT period in the SBR (K1). Data shown are the average of measurements collected during cycles 15, 16, 21, 22,
and 36. Error bars represent the range of foam heights measured during the testing cycles.
As shown in Figure 4.17, the foam height did not change appreciably as a function of
time within the short-term (i.e., 9.5 minute) interval between when air was supplied. As shown in
Figure 4.16, however, there was a marked different in the amount of foaming over the longer-
65
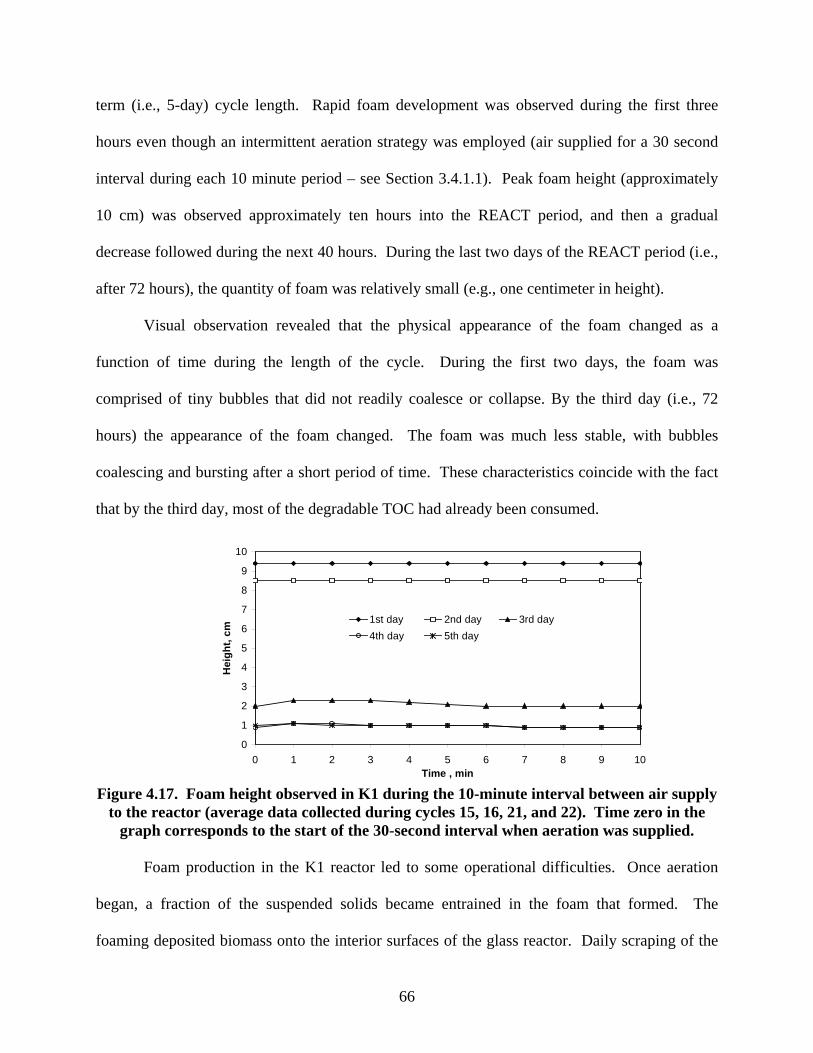
term (i.e., 5-day) cycle length. Rapid foam development was observed during the first three
hours even though an intermittent aeration strategy was employed (air supplied for a 30 second
interval during each 10 minute period – see Section 3.4.1.1). Peak foam height (approximately
10 cm) was observed approximately ten hours into the REACT period, and then a gradual
decrease followed during the next 40 hours. During the last two days of the REACT period (i.e.,
after 72 hours), the quantity of foam was relatively small (e.g., one centimeter in height).
Visual observation revealed that the physical appearance of the foam changed as a
function of time during the length of the cycle. During the first two days, the foam was
comprised of tiny bubbles that did not readily coalesce or collapse. By the third day (i.e., 72
hours) the appearance of the foam changed. The foam was much less stable, with bubbles
coalescing and bursting after a short period of time. These characteristics coincide with the fact
that by the third day, most of the degradable TOC had already been consumed.
0
1
2
3
4
5
6
7
8
9
10
0 1 2 3 4 5 6 7 8 9 1Time , min
Hei
ght,
cm
0
1st day 2nd day 3rd day4th day 5th day
Figure 4.17. Foam height observed in K1 during the 10-minute interval between air supply
to the reactor (average data collected during cycles 15, 16, 21, and 22). Time zero in the graph corresponds to the start of the 30-second interval when aeration was supplied.
Foam production in the K1 reactor led to some operational difficulties. Once aeration
began, a fraction of the suspended solids became entrained in the foam that formed. The
foaming deposited biomass onto the interior surfaces of the glass reactor. Daily scraping of the
66
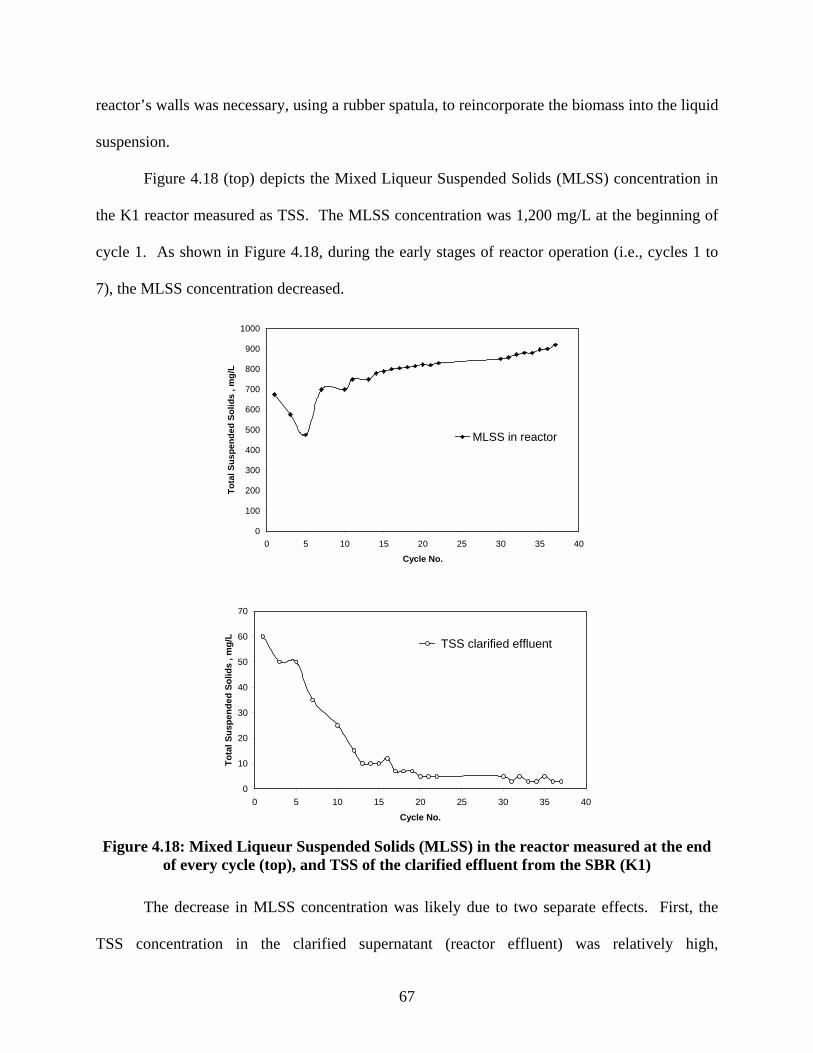
reactor’s walls was necessary, using a rubber spatula, to reincorporate the biomass into the liquid
suspension.
Figure 4.18 (top) depicts the Mixed Liqueur Suspended Solids (MLSS) concentration in
the K1 reactor measured as TSS. The MLSS concentration was 1,200 mg/L at the beginning of
cycle 1. As shown in Figure 4.18, during the early stages of reactor operation (i.e., cycles 1 to
7), the MLSS concentration decreased.
0
100
200
300
400
500
600
700
800
900
1000
0 5 10 15 20 25 30 35 40
Cycle No.
Tota
l Sus
pend
ed S
olid
s , m
g/L
MLSS in reactor
0
10
20
30
40
50
60
70
0 5 10 15 20 25 30 35 40
Cycle No.
Tota
l Sus
pend
ed S
olid
s , m
g/L
TSS clarified effluent
Figure 4.18: Mixed Liqueur Suspended Solids (MLSS) in the reactor measured at the end
of every cycle (top), and TSS of the clarified effluent from the SBR (K1)
The decrease in MLSS concentration was likely due to two separate effects. First, the
TSS concentration in the clarified supernatant (reactor effluent) was relatively high,
67
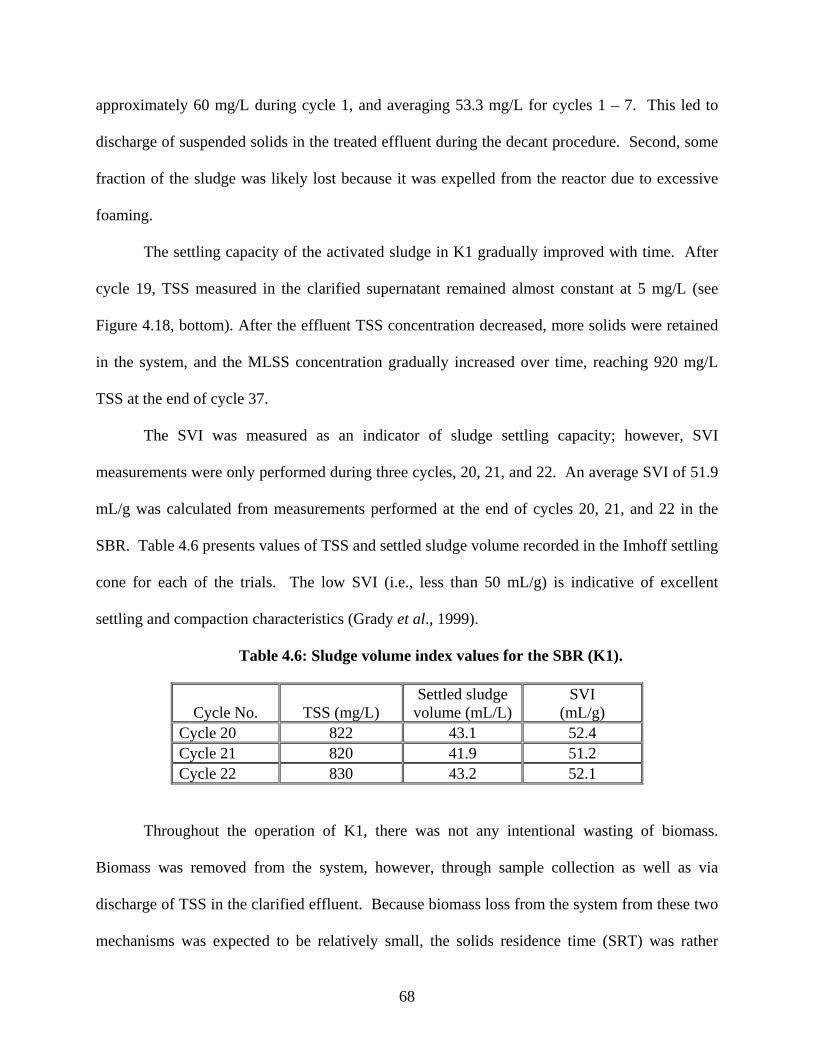
approximately 60 mg/L during cycle 1, and averaging 53.3 mg/L for cycles 1 – 7. This led to
discharge of suspended solids in the treated effluent during the decant procedure. Second, some
fraction of the sludge was likely lost because it was expelled from the reactor due to excessive
foaming.
The settling capacity of the activated sludge in K1 gradually improved with time. After
cycle 19, TSS measured in the clarified supernatant remained almost constant at 5 mg/L (see
Figure 4.18, bottom). After the effluent TSS concentration decreased, more solids were retained
in the system, and the MLSS concentration gradually increased over time, reaching 920 mg/L
TSS at the end of cycle 37.
The SVI was measured as an indicator of sludge settling capacity; however, SVI
measurements were only performed during three cycles, 20, 21, and 22. An average SVI of 51.9
mL/g was calculated from measurements performed at the end of cycles 20, 21, and 22 in the
SBR. Table 4.6 presents values of TSS and settled sludge volume recorded in the Imhoff settling
cone for each of the trials. The low SVI (i.e., less than 50 mL/g) is indicative of excellent
settling and compaction characteristics (Grady et al., 1999).
Table 4.6: Sludge volume index values for the SBR (K1).
Cycle No.
TSS (mg/L)
Settled sludge volume (mL/L)
SVI (mL/g)
Cycle 20 822 43.1 52.4 Cycle 21 820 41.9 51.2 Cycle 22 830 43.2 52.1
Throughout the operation of K1, there was not any intentional wasting of biomass.
Biomass was removed from the system, however, through sample collection as well as via
discharge of TSS in the clarified effluent. Because biomass loss from the system from these two
mechanisms was expected to be relatively small, the solids residence time (SRT) was rather
68
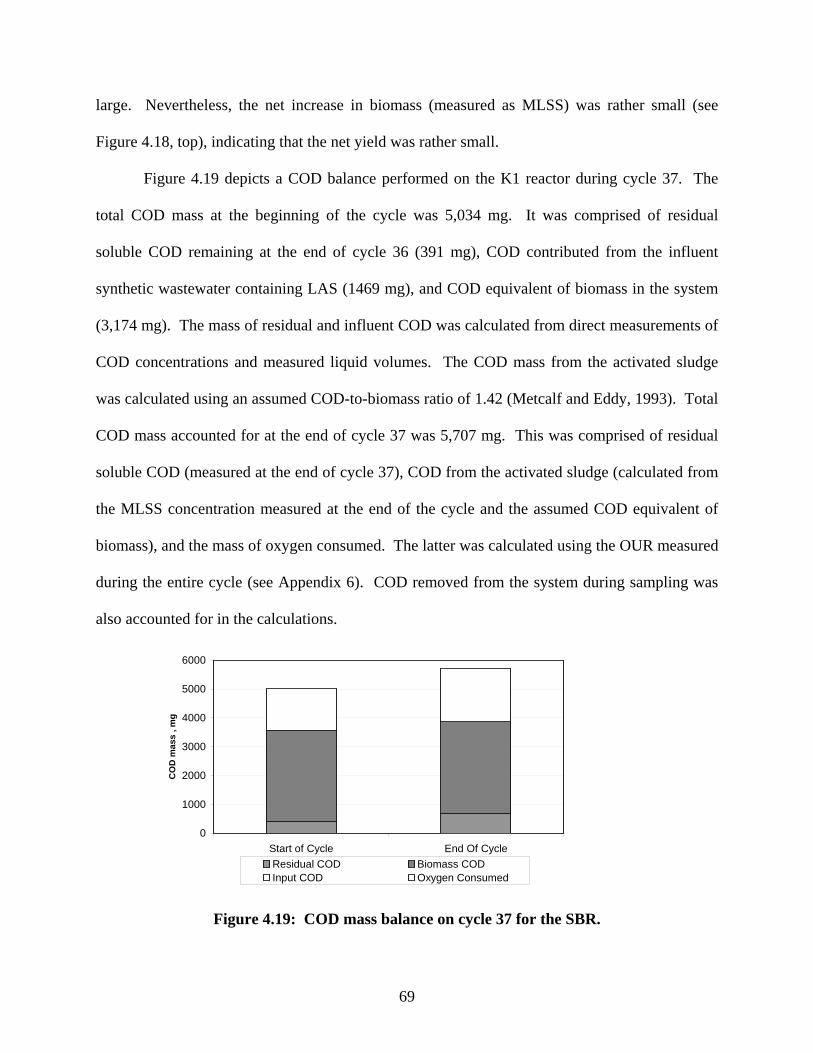
large. Nevertheless, the net increase in biomass (measured as MLSS) was rather small (see
Figure 4.18, top), indicating that the net yield was rather small.
Figure 4.19 depicts a COD balance performed on the K1 reactor during cycle 37. The
total COD mass at the beginning of the cycle was 5,034 mg. It was comprised of residual
soluble COD remaining at the end of cycle 36 (391 mg), COD contributed from the influent
synthetic wastewater containing LAS (1469 mg), and COD equivalent of biomass in the system
(3,174 mg). The mass of residual and influent COD was calculated from direct measurements of
COD concentrations and measured liquid volumes. The COD mass from the activated sludge
was calculated using an assumed COD-to-biomass ratio of 1.42 (Metcalf and Eddy, 1993). Total
COD mass accounted for at the end of cycle 37 was 5,707 mg. This was comprised of residual
soluble COD (measured at the end of cycle 37), COD from the activated sludge (calculated from
the MLSS concentration measured at the end of the cycle and the assumed COD equivalent of
biomass), and the mass of oxygen consumed. The latter was calculated using the OUR measured
during the entire cycle (see Appendix 6). COD removed from the system during sampling was
also accounted for in the calculations.
0
1000
2000
3000
4000
5000
6000
Start of Cycle End Of Cycle
CO
D m
ass
, mg
Residual COD Biomass CODInput COD Oxygen Consumed
Figure 4.19: COD mass balance on cycle 37 for the SBR.
69
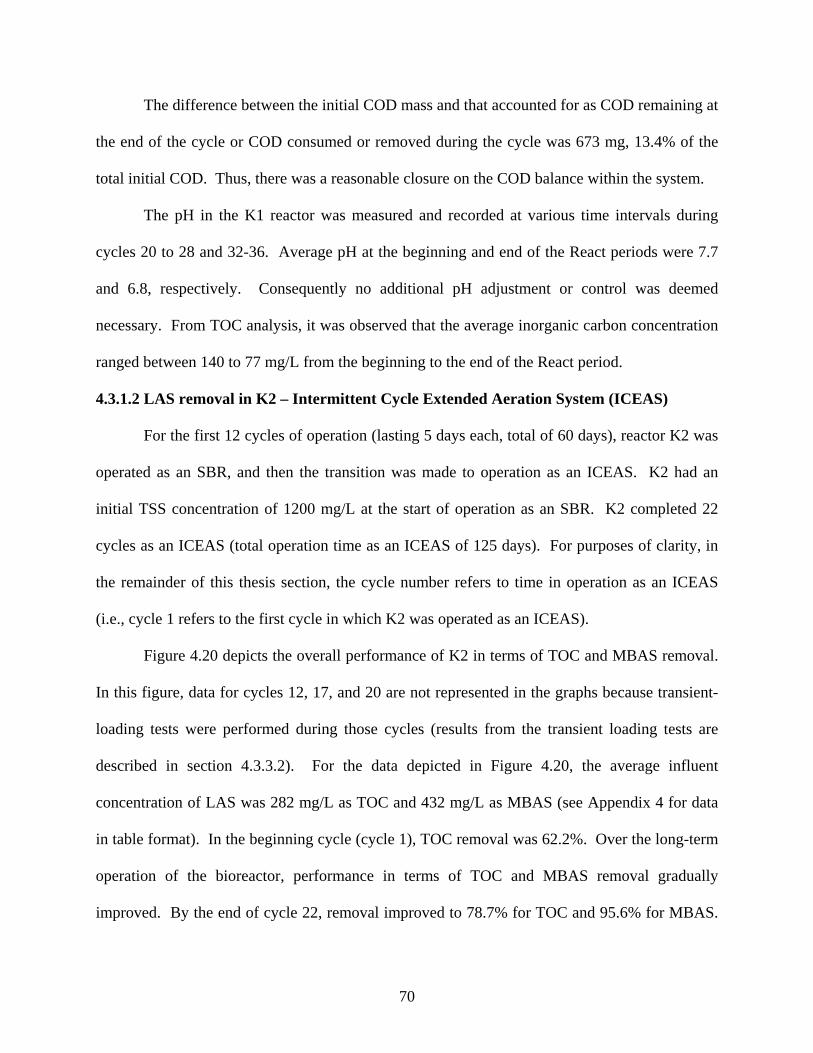
The difference between the initial COD mass and that accounted for as COD remaining at
the end of the cycle or COD consumed or removed during the cycle was 673 mg, 13.4% of the
total initial COD. Thus, there was a reasonable closure on the COD balance within the system.
The pH in the K1 reactor was measured and recorded at various time intervals during
cycles 20 to 28 and 32-36. Average pH at the beginning and end of the React periods were 7.7
and 6.8, respectively. Consequently no additional pH adjustment or control was deemed
necessary. From TOC analysis, it was observed that the average inorganic carbon concentration
ranged between 140 to 77 mg/L from the beginning to the end of the React period.
4.3.1.2 LAS removal in K2 – Intermittent Cycle Extended Aeration System (ICEAS)
For the first 12 cycles of operation (lasting 5 days each, total of 60 days), reactor K2 was
operated as an SBR, and then the transition was made to operation as an ICEAS. K2 had an
initial TSS concentration of 1200 mg/L at the start of operation as an SBR. K2 completed 22
cycles as an ICEAS (total operation time as an ICEAS of 125 days). For purposes of clarity, in
the remainder of this thesis section, the cycle number refers to time in operation as an ICEAS
(i.e., cycle 1 refers to the first cycle in which K2 was operated as an ICEAS).
Figure 4.20 depicts the overall performance of K2 in terms of TOC and MBAS removal.
In this figure, data for cycles 12, 17, and 20 are not represented in the graphs because transient-
loading tests were performed during those cycles (results from the transient loading tests are
described in section 4.3.3.2). For the data depicted in Figure 4.20, the average influent
concentration of LAS was 282 mg/L as TOC and 432 mg/L as MBAS (see Appendix 4 for data
in table format). In the beginning cycle (cycle 1), TOC removal was 62.2%. Over the long-term
operation of the bioreactor, performance in terms of TOC and MBAS removal gradually
improved. By the end of cycle 22, removal improved to 78.7% for TOC and 95.6% for MBAS.
70
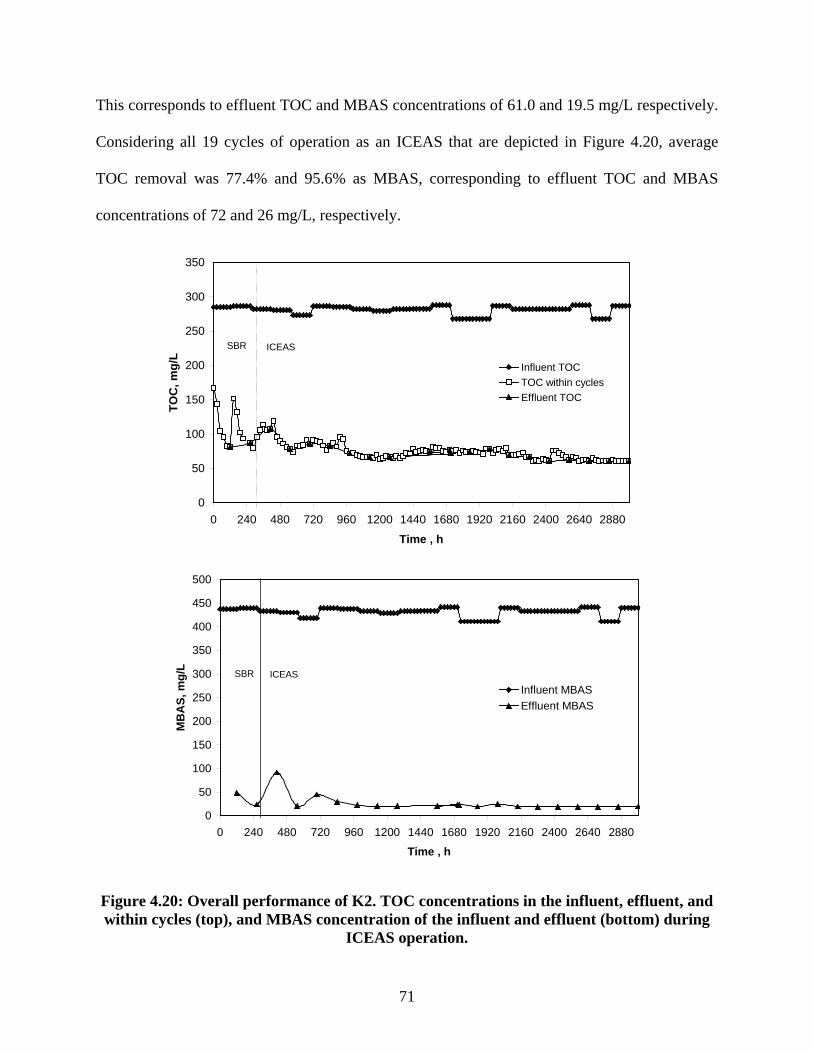
This corresponds to effluent TOC and MBAS concentrations of 61.0 and 19.5 mg/L respectively.
Considering all 19 cycles of operation as an ICEAS that are depicted in Figure 4.20, average
TOC removal was 77.4% and 95.6% as MBAS, corresponding to effluent TOC and MBAS
concentrations of 72 and 26 mg/L, respectively.
0
50
100
150
200
250
300
350
0 240 480 720 960 1200 1440 1680 1920 2160 2400 2640 2880
Time , h
TOC
, mg/
L
Influent TOCTOC within cyclesEffluent TOC
SBR ICEAS
0
50
100
150
200
250
300
350
400
450
500
0 240 480 720 960 1200 1440 1680 1920 2160 2400 2640 2880
Time , h
MB
AS,
mg/
L
Influent MBASEffluent MBAS
SBR ICEAS
Figure 4.20: Overall performance of K2. TOC concentrations in the influent, effluent, and within cycles (top), and MBAS concentration of the influent and effluent (bottom) during
ICEAS operation.
71
From Figure 4.20, it can be seen that the TOC within the cycles remained almost constant
with concentrations being similar to those of the effluent. This can be further observed from data
depicted in Figure 4.21 which shows the TOC concentration (top), MBAS concentration
(middle) and OUR (bottom) as a function of time within the reactor cycles. Because mixing and
aeration were supplied to the reactor during the entire duration that synthetic wastewater
continuously entered the reactor over the 5-day cycle length, LAS was degraded as it entered the
reactor. This prevented the degree of surfactant accumulation within the reactor that was
observed for K1 where the Fill period was quite short (2.88 minutes).
After the end of cycle 6 (1,128 hr), when performance had stabilized, the pattern of OUR
as a function of time within the reactor cycle consistently followed a trend of an initial increase
at the start of the cycle followed by a steady decrease during the remainder of the cycle length.
As further described in the following pages, the initial increase in OUR can be readily attributed
to degradation of surfactant accumulated in the system during the unaerated settle and draw
periods. The decrease in OUR as a function of cycle length can be readily attributed to the fact
that the MLSS concentration decreased throughout the cycle length. The mass of biomass in the
reactor was relatively constant (see subsequent discussion of net yield) while the reactor’s liquid
volume doubled from 1.25 to 2.5 L during the 4.95-day Fill period (thereby decreasing the
MLSS concentration by approximately half). As shown in Figure 4.21 (bottom), the OUR at the
end of the Fill/React period was roughly half of that observed at the start of the cycle, indicating
that the specific oxygen uptake rate (SOUR, mass of oxygen consumed per mass of suspended
solids per time) was relatively constant during most of the cycle length. This supports the notion
that after the first 24 hours of the cycle, LAS was degraded as it entered the system and little
accumulation occurred.
72
50
55
60
65
70
75
80
85
90
95
0 24 48 72 96 120
Time, h
Tota
l Org
anic
Car
bon
, mg/
L
Cycles 1-5Cycles 6-11Cycles 13-16,18,19,21-22
0
5
10
15
20
25
30
35
40
45
50
0 24 48 72 96 12Time, h
MB
AS
, mg/
L
0
Cycles 1-5
Cycles 6-11
Cycles 13-16,18,19,21-22
0
2
4
6
8
10
12
14
16
18
0 24 48 72 96
Time , hours
mg/
L-H
r Oxy
gen
120
Cycles 1-3Cycles 4-6Cycles 7-10Cycles 21,22Cycles 13-16Cycles 18,19
Figure 4.21: Performance of K2 within cycles. TOC (top), MBAS (middle), and OUR
(bottom).
73
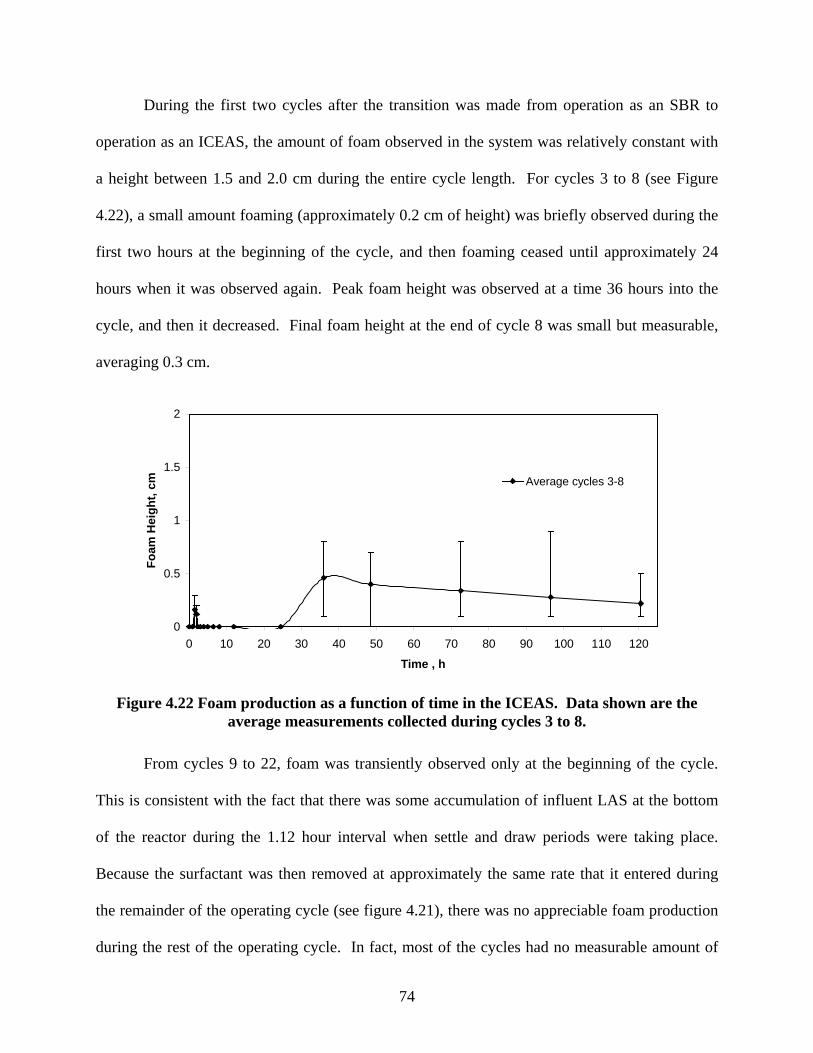
During the first two cycles after the transition was made from operation as an SBR to
operation as an ICEAS, the amount of foam observed in the system was relatively constant with
a height between 1.5 and 2.0 cm during the entire cycle length. For cycles 3 to 8 (see Figure
4.22), a small amount foaming (approximately 0.2 cm of height) was briefly observed during the
first two hours at the beginning of the cycle, and then foaming ceased until approximately 24
hours when it was observed again. Peak foam height was observed at a time 36 hours into the
cycle, and then it decreased. Final foam height at the end of cycle 8 was small but measurable,
averaging 0.3 cm.
0
0.5
1
1.5
2
0 10 20 30 40 50 60 70 80 90 100 110 120
Time , h
Foam
Hei
ght,
cm Average cycles 3-8
Figure 4.22 Foam production as a function of time in the ICEAS. Data shown are the
average measurements collected during cycles 3 to 8.
From cycles 9 to 22, foam was transiently observed only at the beginning of the cycle.
This is consistent with the fact that there was some accumulation of influent LAS at the bottom
of the reactor during the 1.12 hour interval when settle and draw periods were taking place.
Because the surfactant was then removed at approximately the same rate that it entered during
the remainder of the operating cycle (see figure 4.21), there was no appreciable foam production
during the rest of the operating cycle. In fact, most of the cycles had no measurable amount of
74
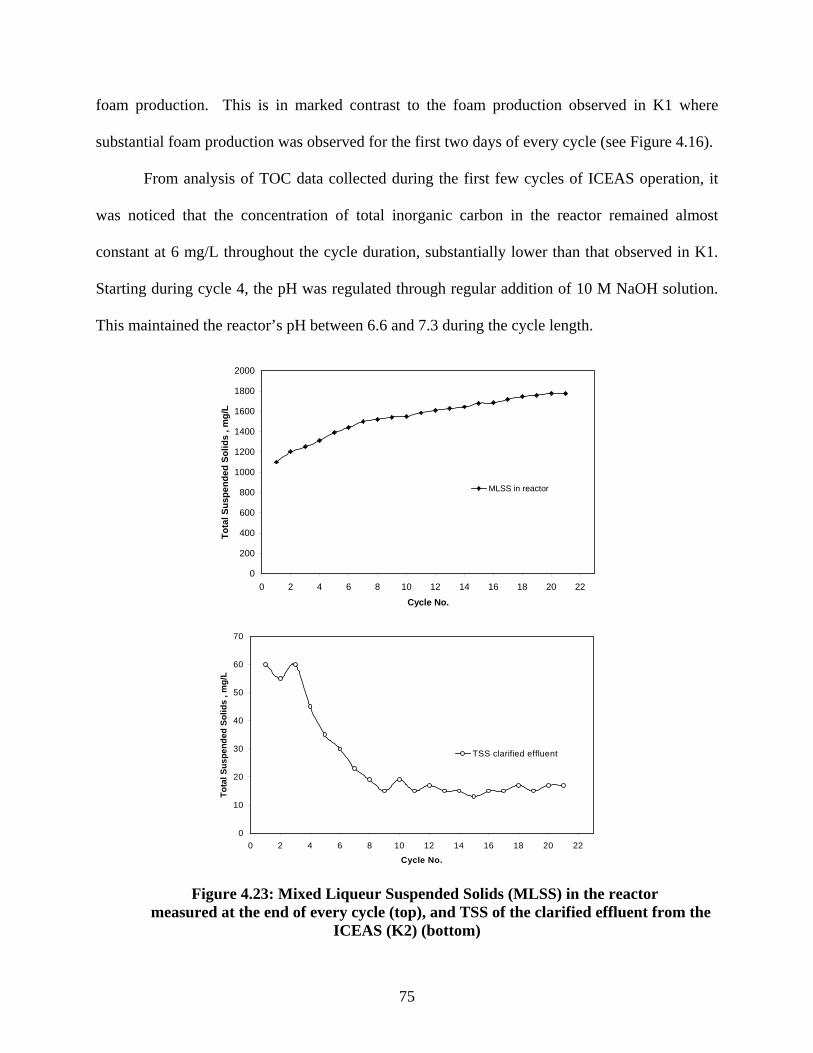
foam production. This is in marked contrast to the foam production observed in K1 where
substantial foam production was observed for the first two days of every cycle (see Figure 4.16).
From analysis of TOC data collected during the first few cycles of ICEAS operation, it
was noticed that the concentration of total inorganic carbon in the reactor remained almost
constant at 6 mg/L throughout the cycle duration, substantially lower than that observed in K1.
Starting during cycle 4, the pH was regulated through regular addition of 10 M NaOH solution.
This maintained the reactor’s pH between 6.6 and 7.3 during the cycle length.
0
200
400
600
800
1000
1200
1400
1600
1800
2000
0 2 4 6 8 10 12 14 16 18 20 22
Cycle No.
Tota
l Sus
pend
ed S
olid
s , m
g/L
MLSS in reactor
0
10
20
30
40
50
60
70
0 2 4 6 8 10 12 14 16 18 20 22
Cycle No.
Tota
l Sus
pend
ed S
olid
s , m
g/L
TSS clarified effluent
Figure 4.23: Mixed Liqueur Suspended Solids (MLSS) in the reactor measured at the end of every cycle (top), and TSS of the clarified effluent from the
ICEAS (K2) (bottom)
75
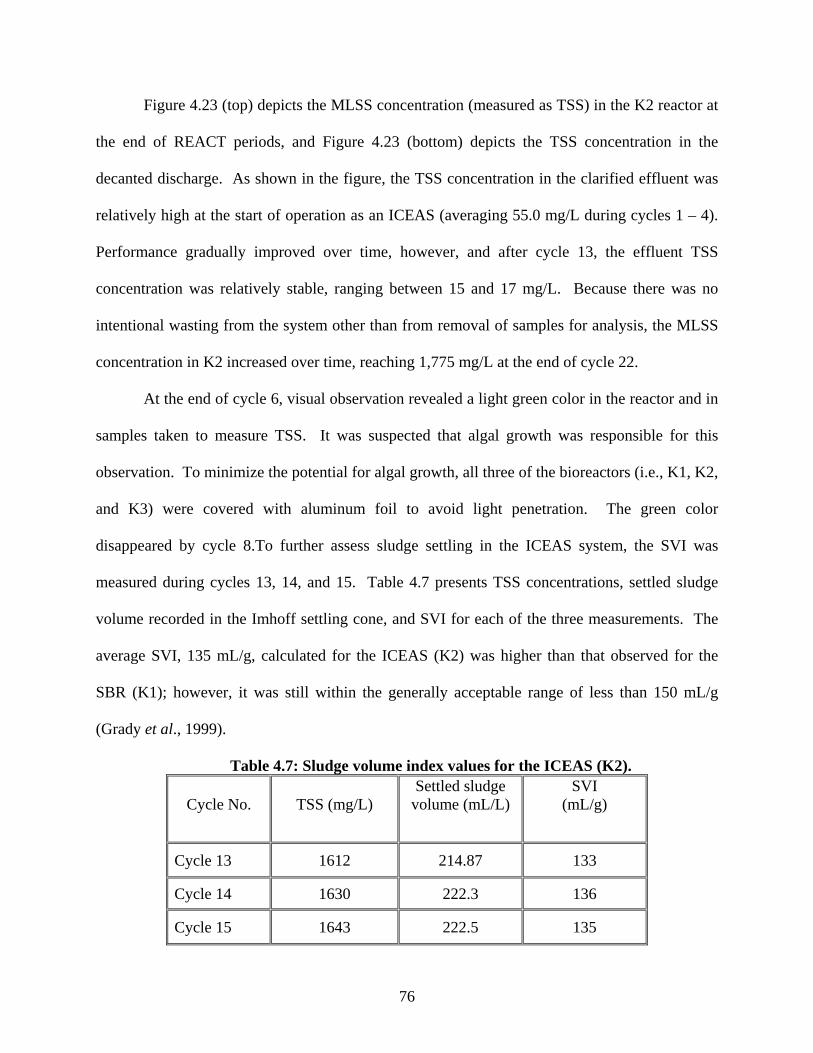
Figure 4.23 (top) depicts the MLSS concentration (measured as TSS) in the K2 reactor at
the end of REACT periods, and Figure 4.23 (bottom) depicts the TSS concentration in the
decanted discharge. As shown in the figure, the TSS concentration in the clarified effluent was
relatively high at the start of operation as an ICEAS (averaging 55.0 mg/L during cycles 1 – 4).
Performance gradually improved over time, however, and after cycle 13, the effluent TSS
concentration was relatively stable, ranging between 15 and 17 mg/L. Because there was no
intentional wasting from the system other than from removal of samples for analysis, the MLSS
concentration in K2 increased over time, reaching 1,775 mg/L at the end of cycle 22.
At the end of cycle 6, visual observation revealed a light green color in the reactor and in
samples taken to measure TSS. It was suspected that algal growth was responsible for this
observation. To minimize the potential for algal growth, all three of the bioreactors (i.e., K1, K2,
and K3) were covered with aluminum foil to avoid light penetration. The green color
disappeared by cycle 8.To further assess sludge settling in the ICEAS system, the SVI was
measured during cycles 13, 14, and 15. Table 4.7 presents TSS concentrations, settled sludge
volume recorded in the Imhoff settling cone, and SVI for each of the three measurements. The
average SVI, 135 mL/g, calculated for the ICEAS (K2) was higher than that observed for the
SBR (K1); however, it was still within the generally acceptable range of less than 150 mL/g
(Grady et al., 1999).
Table 4.7: Sludge volume index values for the ICEAS (K2).
Cycle No.
TSS (mg/L) Settled sludge
volume (mL/L) SVI
(mL/g)
Cycle 13 1612 214.87 133
Cycle 14 1630 222.3 136
Cycle 15 1643 222.5 135
76
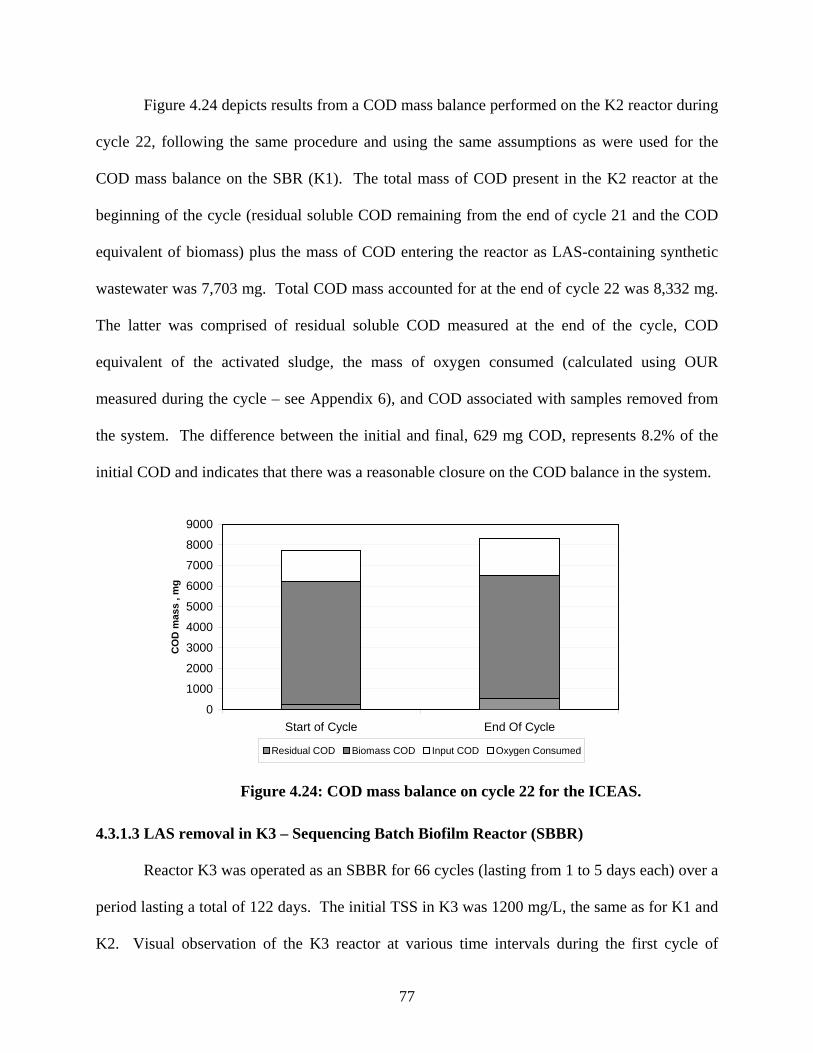
Figure 4.24 depicts results from a COD mass balance performed on the K2 reactor during
cycle 22, following the same procedure and using the same assumptions as were used for the
COD mass balance on the SBR (K1). The total mass of COD present in the K2 reactor at the
beginning of the cycle (residual soluble COD remaining from the end of cycle 21 and the COD
equivalent of biomass) plus the mass of COD entering the reactor as LAS-containing synthetic
wastewater was 7,703 mg. Total COD mass accounted for at the end of cycle 22 was 8,332 mg.
The latter was comprised of residual soluble COD measured at the end of the cycle, COD
equivalent of the activated sludge, the mass of oxygen consumed (calculated using OUR
measured during the cycle – see Appendix 6), and COD associated with samples removed from
the system. The difference between the initial and final, 629 mg COD, represents 8.2% of the
initial COD and indicates that there was a reasonable closure on the COD balance in the system.
0
1000
2000
3000
4000
5000
6000
7000
8000
9000
Start of Cycle End Of Cycle
CO
D m
ass
, mg
Residual COD Biomass COD Input COD Oxygen Consumed
Figure 4.24: COD mass balance on cycle 22 for the ICEAS.
4.3.1.3 LAS removal in K3 – Sequencing Batch Biofilm Reactor (SBBR)
Reactor K3 was operated as an SBBR for 66 cycles (lasting from 1 to 5 days each) over a
period lasting a total of 122 days. The initial TSS in K3 was 1200 mg/L, the same as for K1 and
K2. Visual observation of the K3 reactor at various time intervals during the first cycle of
77
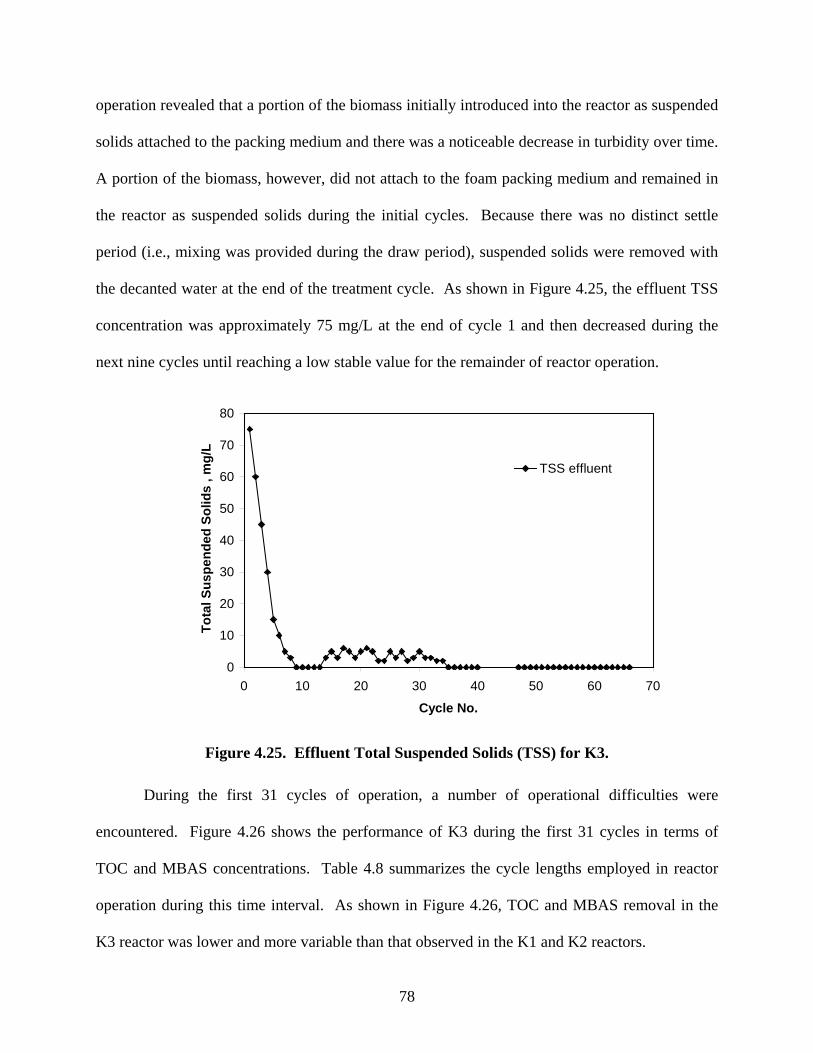
operation revealed that a portion of the biomass initially introduced into the reactor as suspended
solids attached to the packing medium and there was a noticeable decrease in turbidity over time.
A portion of the biomass, however, did not attach to the foam packing medium and remained in
the reactor as suspended solids during the initial cycles. Because there was no distinct settle
period (i.e., mixing was provided during the draw period), suspended solids were removed with
the decanted water at the end of the treatment cycle. As shown in Figure 4.25, the effluent TSS
concentration was approximately 75 mg/L at the end of cycle 1 and then decreased during the
next nine cycles until reaching a low stable value for the remainder of reactor operation.
0
10
20
30
40
50
60
70
80
0 10 20 30 40 50 60 70
Cycle No.
Tot
al S
uspe
nded
Sol
ids
, mg/
L
TSS effluent
Figure 4.25. Effluent Total Suspended Solids (TSS) for K3.
During the first 31 cycles of operation, a number of operational difficulties were
encountered. Figure 4.26 shows the performance of K3 during the first 31 cycles in terms of
TOC and MBAS concentrations. Table 4.8 summarizes the cycle lengths employed in reactor
operation during this time interval. As shown in Figure 4.26, TOC and MBAS removal in the
K3 reactor was lower and more variable than that observed in the K1 and K2 reactors.
78
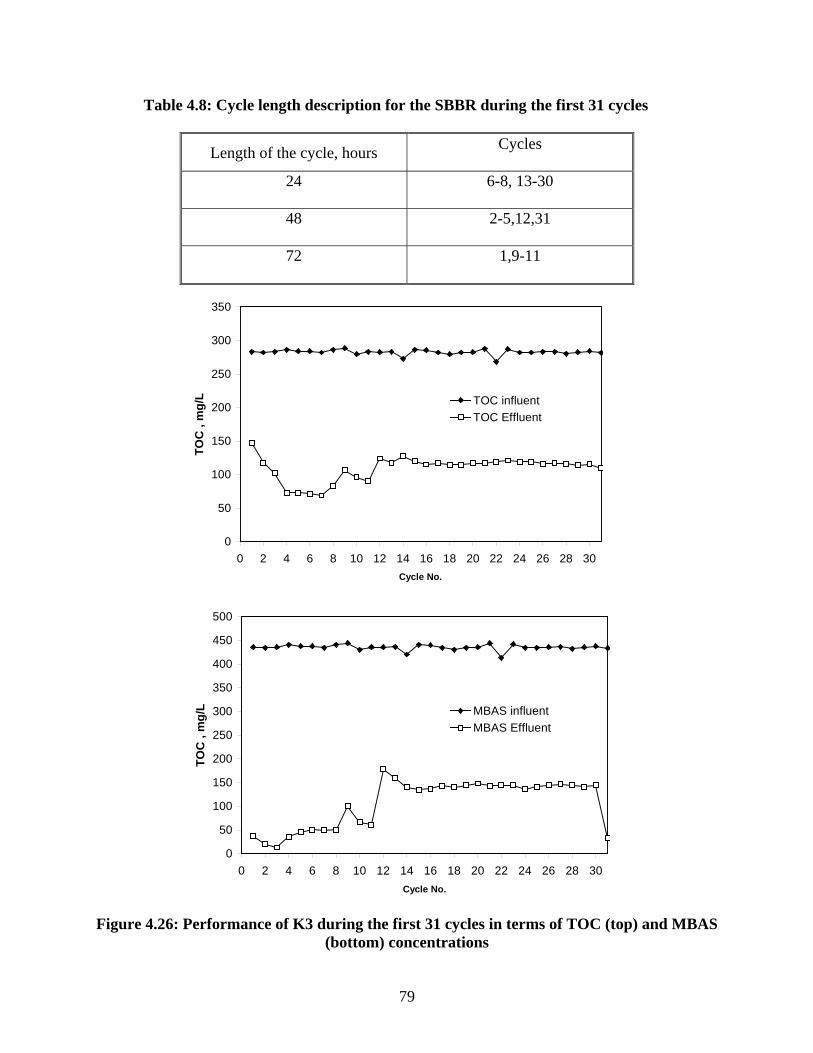
Table 4.8: Cycle length description for the SBBR during the first 31 cycles
Length of the cycle, hours Cycles
24 6-8, 13-30
48 2-5,12,31
72 1,9-11
0
50
100
150
200
250
300
350
0 2 4 6 8 10 12 14 16 18 20 22 24 26 28 30Cycle No.
TOC
, m
g/L TOC influent
TOC Effluent
0
50
100
150
200
250
300
350
400
450
500
0 2 4 6 8 10 12 14 16 18 20 22 24 26 28 30Cycle No.
TOC
, m
g/L MBAS influent
MBAS Effluent
Figure 4.26: Performance of K3 during the first 31 cycles in terms of TOC (top) and MBAS
(bottom) concentrations
79
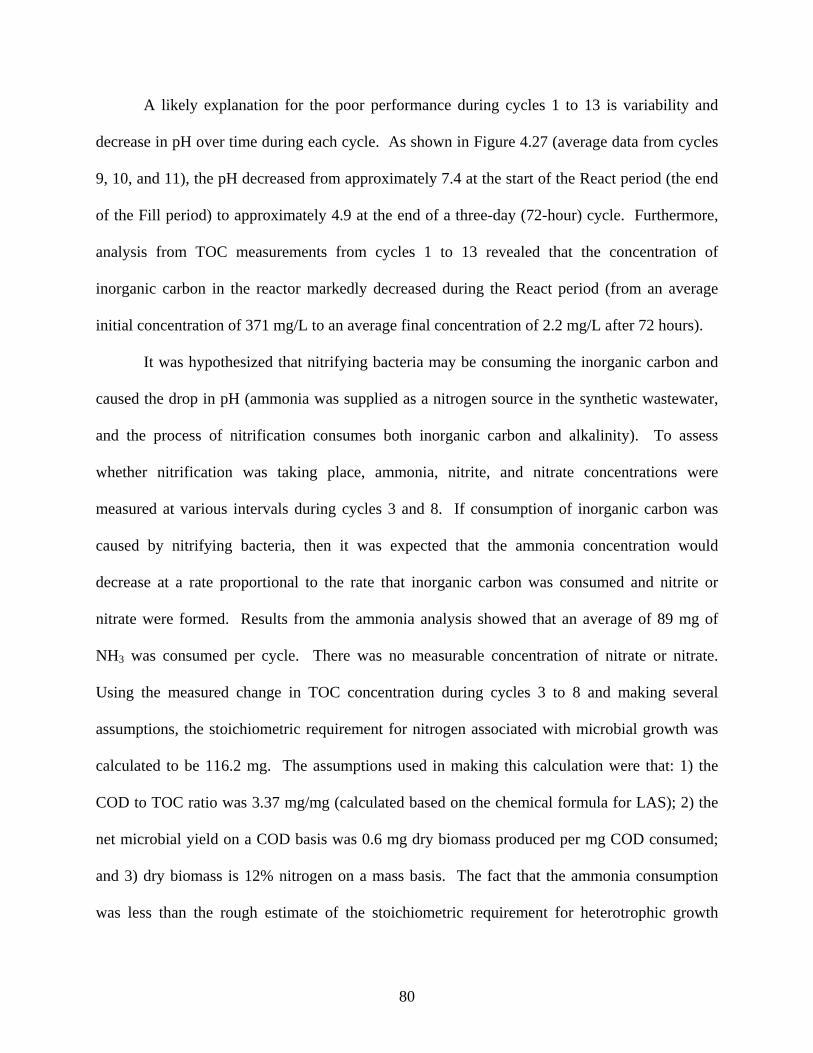
A likely explanation for the poor performance during cycles 1 to 13 is variability and
decrease in pH over time during each cycle. As shown in Figure 4.27 (average data from cycles
9, 10, and 11), the pH decreased from approximately 7.4 at the start of the React period (the end
of the Fill period) to approximately 4.9 at the end of a three-day (72-hour) cycle. Furthermore,
analysis from TOC measurements from cycles 1 to 13 revealed that the concentration of
inorganic carbon in the reactor markedly decreased during the React period (from an average
initial concentration of 371 mg/L to an average final concentration of 2.2 mg/L after 72 hours).
It was hypothesized that nitrifying bacteria may be consuming the inorganic carbon and
caused the drop in pH (ammonia was supplied as a nitrogen source in the synthetic wastewater,
and the process of nitrification consumes both inorganic carbon and alkalinity). To assess
whether nitrification was taking place, ammonia, nitrite, and nitrate concentrations were
measured at various intervals during cycles 3 and 8. If consumption of inorganic carbon was
caused by nitrifying bacteria, then it was expected that the ammonia concentration would
decrease at a rate proportional to the rate that inorganic carbon was consumed and nitrite or
nitrate were formed. Results from the ammonia analysis showed that an average of 89 mg of
NH3 was consumed per cycle. There was no measurable concentration of nitrate or nitrate.
Using the measured change in TOC concentration during cycles 3 to 8 and making several
assumptions, the stoichiometric requirement for nitrogen associated with microbial growth was
calculated to be 116.2 mg. The assumptions used in making this calculation were that: 1) the
COD to TOC ratio was 3.37 mg/mg (calculated based on the chemical formula for LAS); 2) the
net microbial yield on a COD basis was 0.6 mg dry biomass produced per mg COD consumed;
and 3) dry biomass is 12% nitrogen on a mass basis. The fact that the ammonia consumption
was less than the rough estimate of the stoichiometric requirement for heterotrophic growth
80
combined with the fact that no nitrite or nitrate was detected collectively suggest that nitrification
was not taking place in the reactor. An alternate explanation for the decrease in pH over time is
that acidic intermediates were produced as a result of LAS degradation (Perez et al., 1996,
Swisher, 1987); however, because no attempt was made to identify or quantify intermediates, a
general conclusion regarding whether that was in fact the case cannot be made.
0
1
2
3
4
5
6
7
8
0 12 24 36 48 60 72
Time , hours
pH
pH
Figure 4.27. Average pH values in a three-day cycle in the SBBR (data from cycles 9-11)
Regardless of the cause of the pH decrease over time, three techniques were employed in
an attempt to regulate pH in the reactor. During cycles 14-16, the amount of NaHCO3 in the
nutrient solution was increased. This caused the pH in the synthetic wastewater to be high (pH 8
– 10). An ammonia-like odor was detected, and analysis of the synthetic wastewater feed
revealed that the ammonia concentration in the feed solution was much lower than that of the
freshly prepared media. Consequently, in subsequent cycles, the NaHCO3 in the synthetic
wastewater was returned to its original level (see Table 3.1).
From cycles 17 to 31, NaHCO3 was added separately to the reactor at 12 hours intervals
as necessary to maintain a pH between 7.5 and 8.0. Increased turbidity started to appear in the
reactor during cycle 19. Two potential reasons for the increased turbidity are that: 1) the
81
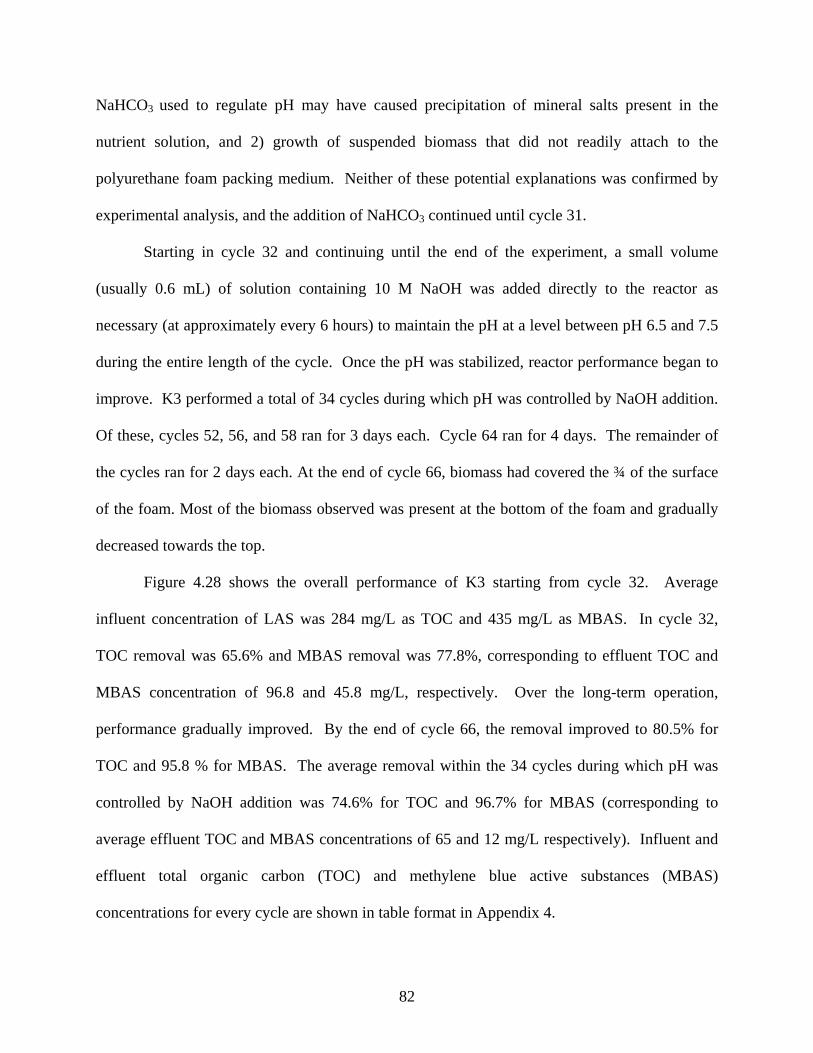
NaHCO3 used to regulate pH may have caused precipitation of mineral salts present in the
nutrient solution, and 2) growth of suspended biomass that did not readily attach to the
polyurethane foam packing medium. Neither of these potential explanations was confirmed by
experimental analysis, and the addition of NaHCO3 continued until cycle 31.
Starting in cycle 32 and continuing until the end of the experiment, a small volume
(usually 0.6 mL) of solution containing 10 M NaOH was added directly to the reactor as
necessary (at approximately every 6 hours) to maintain the pH at a level between pH 6.5 and 7.5
during the entire length of the cycle. Once the pH was stabilized, reactor performance began to
improve. K3 performed a total of 34 cycles during which pH was controlled by NaOH addition.
Of these, cycles 52, 56, and 58 ran for 3 days each. Cycle 64 ran for 4 days. The remainder of
the cycles ran for 2 days each. At the end of cycle 66, biomass had covered the ¾ of the surface
of the foam. Most of the biomass observed was present at the bottom of the foam and gradually
decreased towards the top.
Figure 4.28 shows the overall performance of K3 starting from cycle 32. Average
influent concentration of LAS was 284 mg/L as TOC and 435 mg/L as MBAS. In cycle 32,
TOC removal was 65.6% and MBAS removal was 77.8%, corresponding to effluent TOC and
MBAS concentration of 96.8 and 45.8 mg/L, respectively. Over the long-term operation,
performance gradually improved. By the end of cycle 66, the removal improved to 80.5% for
TOC and 95.8 % for MBAS. The average removal within the 34 cycles during which pH was
controlled by NaOH addition was 74.6% for TOC and 96.7% for MBAS (corresponding to
average effluent TOC and MBAS concentrations of 65 and 12 mg/L respectively). Influent and
effluent total organic carbon (TOC) and methylene blue active substances (MBAS)
concentrations for every cycle are shown in table format in Appendix 4.
82
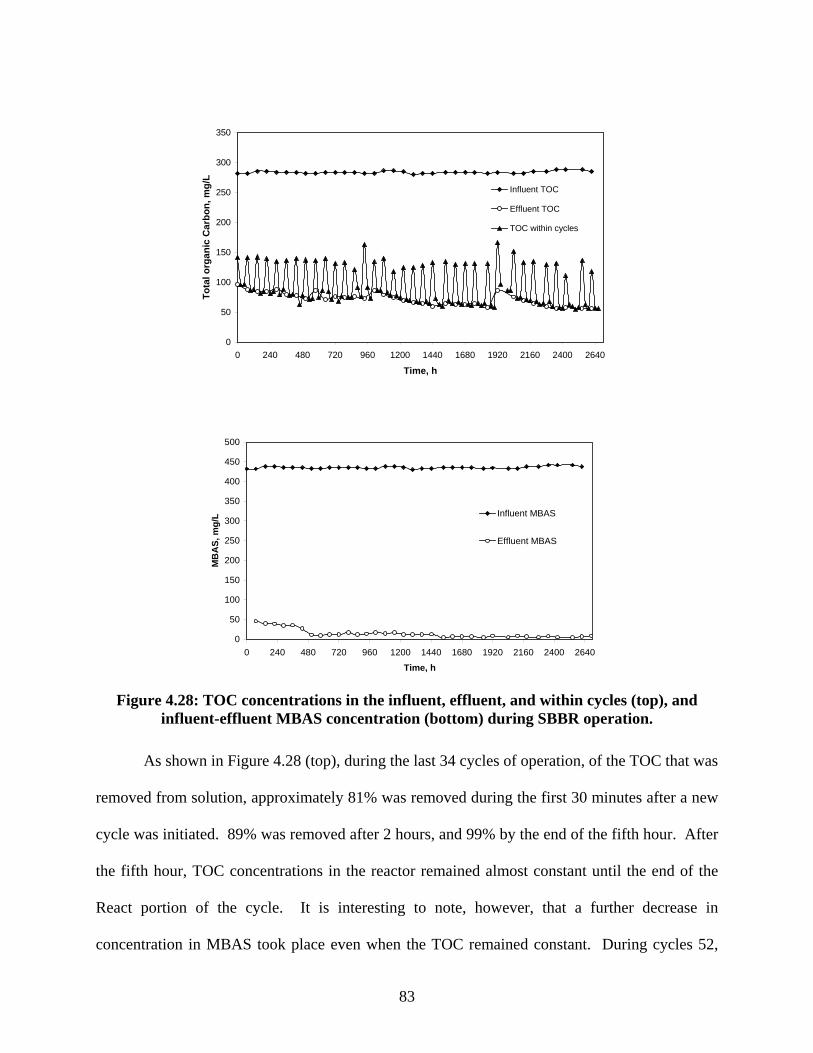
0
50
100
150
200
250
300
350
0 240 480 720 960 1200 1440 1680 1920 2160 2400 2640
Time, h
Tota
l org
anic
Car
bon,
mg/
L
Influent TOC
Effluent TOC
TOC within cycles
0
50
100
150
200
250
300
350
400
450
500
0 240 480 720 960 1200 1440 1680 1920 2160 2400 2640
Time, h
MB
AS,
mg/
L Influent MBAS
Effluent MBAS
Figure 4.28: TOC concentrations in the influent, effluent, and within cycles (top), and
influent-effluent MBAS concentration (bottom) during SBBR operation.
As shown in Figure 4.28 (top), during the last 34 cycles of operation, of the TOC that was
removed from solution, approximately 81% was removed during the first 30 minutes after a new
cycle was initiated. 89% was removed after 2 hours, and 99% by the end of the fifth hour. After
the fifth hour, TOC concentrations in the reactor remained almost constant until the end of the
React portion of the cycle. It is interesting to note, however, that a further decrease in
concentration in MBAS took place even when the TOC remained constant. During cycles 52,
83
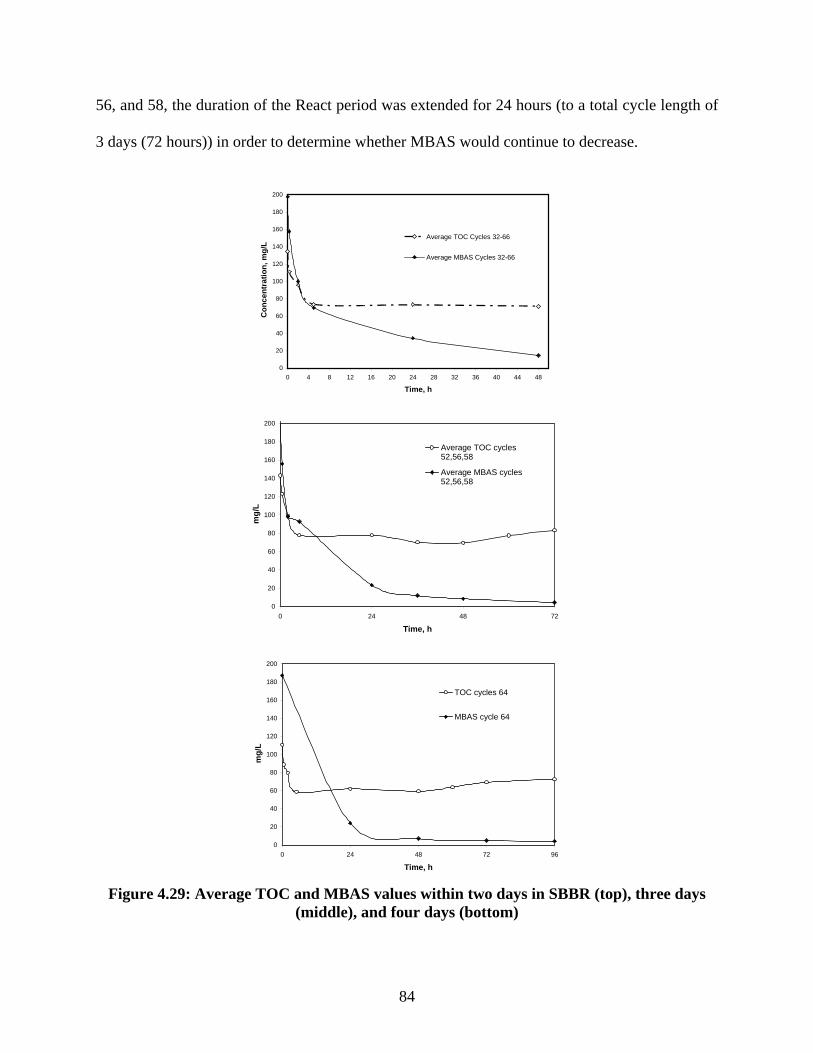
56, and 58, the duration of the React period was extended for 24 hours (to a total cycle length of
3 days (72 hours)) in order to determine whether MBAS would continue to decrease.
0
20
40
60
80
100
120
140
160
180
200
0 4 8 12 16 20 24 28 32 36 40 44 48
Time, h
Con
cent
ratio
n, m
g/L
Average TOC Cycles 32-66
Average MBAS Cycles 32-66
0
20
40
60
80
100
120
140
160
180
200
0 24 48
Time, h
mg/
L
72
Average TOC cycles52,56,58
Average MBAS cycles52,56,58
0
20
40
60
80
100
120
140
160
180
200
0 24 48 72 9
Time, h
mg/
L
6
TOC cycles 64
MBAS cycle 64
Figure 4.29: Average TOC and MBAS values within two days in SBBR (top), three days
(middle), and four days (bottom)
84
During cycle 64, the cycle length was extended to a total of 96 hours (4 days) for the
same reasons. As shown in Figure 4.29, MBAS concentrations did not appreciably decrease
further when the cycle length was extended to 72 hours (middle) or 96 hours (bottom).
This rapid removal of TOC lead to perform sorption test using the polyurethane foam to
verify its participation during the LAS disappearing. Results are showed and explained in further
sections.
0
0.5
1
1.5
2
2.5
3
3.5
4
4.5
5
0 4 8 12 16 20 24 28 32 36 40 44 48
Time , h
Foam
Hei
ght (
cm)
0
20
40
60
80
100
120
140
160
TOC
(mg/
L)
Foam height (cycles 33-36)TOC
0
1
2
3
4
5
6
0 4 8 12 16 20 24 28 32 36 40 44 48
Time , h
Foam
Hei
ght (
cm)
0
20
40
60
80
100
120
140TO
C (m
g/L)
Foam height (cycles 52-56)TOC
Figure 4.30: Comparison of foam production during cycles 33-36 (top) and 52-56 (bottom)
85
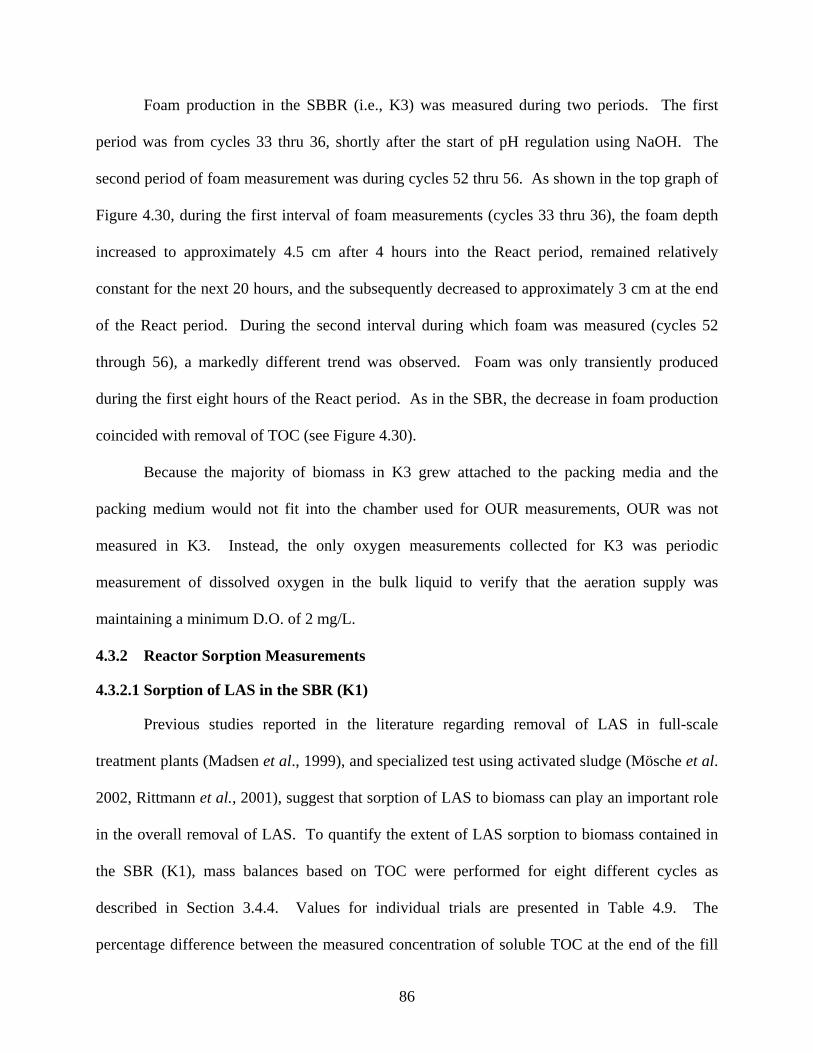
Foam production in the SBBR (i.e., K3) was measured during two periods. The first
period was from cycles 33 thru 36, shortly after the start of pH regulation using NaOH. The
second period of foam measurement was during cycles 52 thru 56. As shown in the top graph of
Figure 4.30, during the first interval of foam measurements (cycles 33 thru 36), the foam depth
increased to approximately 4.5 cm after 4 hours into the React period, remained relatively
constant for the next 20 hours, and the subsequently decreased to approximately 3 cm at the end
of the React period. During the second interval during which foam was measured (cycles 52
through 56), a markedly different trend was observed. Foam was only transiently produced
during the first eight hours of the React period. As in the SBR, the decrease in foam production
coincided with removal of TOC (see Figure 4.30).
Because the majority of biomass in K3 grew attached to the packing media and the
packing medium would not fit into the chamber used for OUR measurements, OUR was not
measured in K3. Instead, the only oxygen measurements collected for K3 was periodic
measurement of dissolved oxygen in the bulk liquid to verify that the aeration supply was
maintaining a minimum D.O. of 2 mg/L.
4.3.2 Reactor Sorption Measurements
4.3.2.1 Sorption of LAS in the SBR (K1)
Previous studies reported in the literature regarding removal of LAS in full-scale
treatment plants (Madsen et al., 1999), and specialized test using activated sludge (Mösche et al.
2002, Rittmann et al., 2001), suggest that sorption of LAS to biomass can play an important role
in the overall removal of LAS. To quantify the extent of LAS sorption to biomass contained in
the SBR (K1), mass balances based on TOC were performed for eight different cycles as
described in Section 3.4.4. Values for individual trials are presented in Table 4.9. The
percentage difference between the measured concentration of soluble TOC at the end of the fill
86
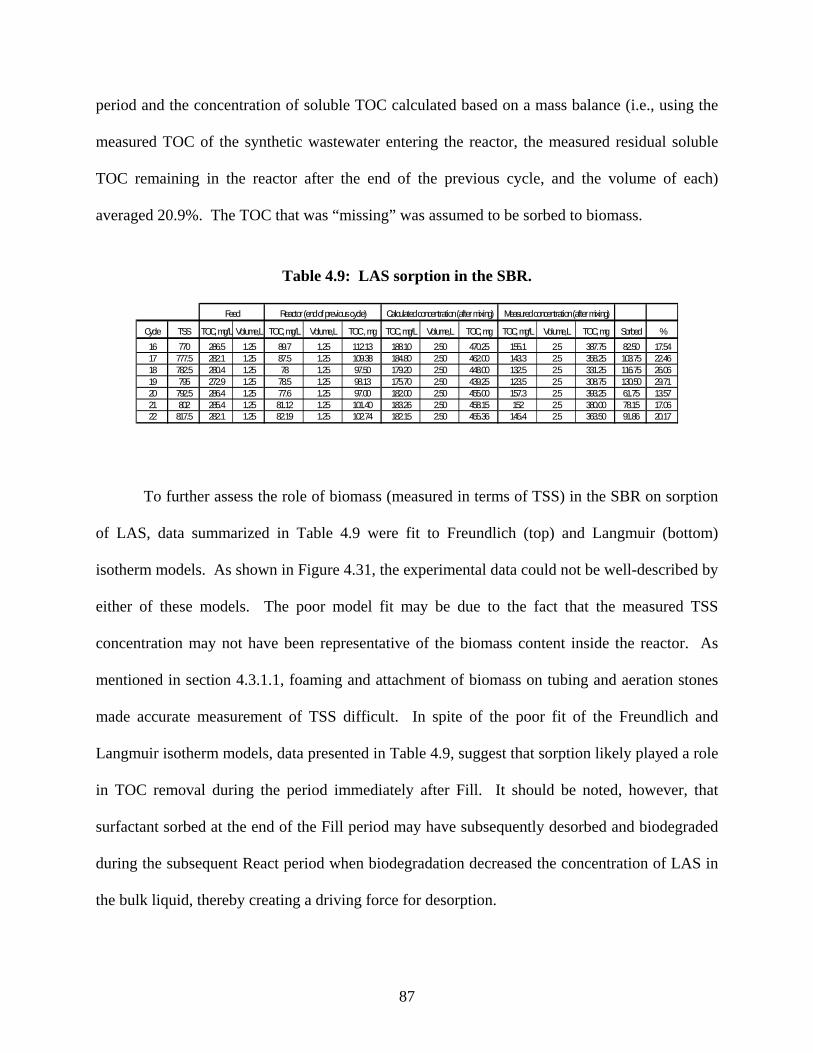
period and the concentration of soluble TOC calculated based on a mass balance (i.e., using the
measured TOC of the synthetic wastewater entering the reactor, the measured residual soluble
TOC remaining in the reactor after the end of the previous cycle, and the volume of each)
averaged 20.9%. The TOC that was “missing” was assumed to be sorbed to biomass.
Table 4.9: LAS sorption in the SBR.
Cycle TSS TOC, mg/L Volume,L TOC, mg/L Volume,L TOC , mg TOC, mg/L Volume,L TOC, mg TOC, mg/L Volume,L TOC, mg Sorbed %16 770 286.5 1.25 89.7 1.25 112.13 188.10 2.50 470.25 155.1 2.5 387.75 82.50 17.5417 777.5 282.1 1.25 87.5 1.25 109.38 184.80 2.50 462.00 143.3 2.5 358.25 103.75 22.4618 782.5 280.4 1.25 78 1.25 97.50 179.20 2.50 448.00 132.5 2.5 331.25 116.75 26.0619 795 272.9 1.25 78.5 1.25 98.13 175.70 2.50 439.25 123.5 2.5 308.75 130.50 29.7120 792.5 286.4 1.25 77.6 1.25 97.00 182.00 2.50 455.00 157.3 2.5 393.25 61.75 13.5721 802 285.4 1.25 81.12 1.25 101.40 183.26 2.50 458.15 152 2.5 380.00 78.15 17.0622 817.5 282.1 1.25 82.19 1.25 102.74 182.15 2.50 455.36 145.4 2.5 363.50 91.86 20.17
Feed Reactor (end of previous cycle) Calculated concentration (after mixing) Measured concentration (after mixing)
To further assess the role of biomass (measured in terms of TSS) in the SBR on sorption
of LAS, data summarized in Table 4.9 were fit to Freundlich (top) and Langmuir (bottom)
isotherm models. As shown in Figure 4.31, the experimental data could not be well-described by
either of these models. The poor model fit may be due to the fact that the measured TSS
concentration may not have been representative of the biomass content inside the reactor. As
mentioned in section 4.3.1.1, foaming and attachment of biomass on tubing and aeration stones
made accurate measurement of TSS difficult. In spite of the poor fit of the Freundlich and
Langmuir isotherm models, data presented in Table 4.9, suggest that sorption likely played a role
in TOC removal during the period immediately after Fill. It should be noted, however, that
surfactant sorbed at the end of the Fill period may have subsequently desorbed and biodegraded
during the subsequent React period when biodegradation decreased the concentration of LAS in
the bulk liquid, thereby creating a driving force for desorption.
87
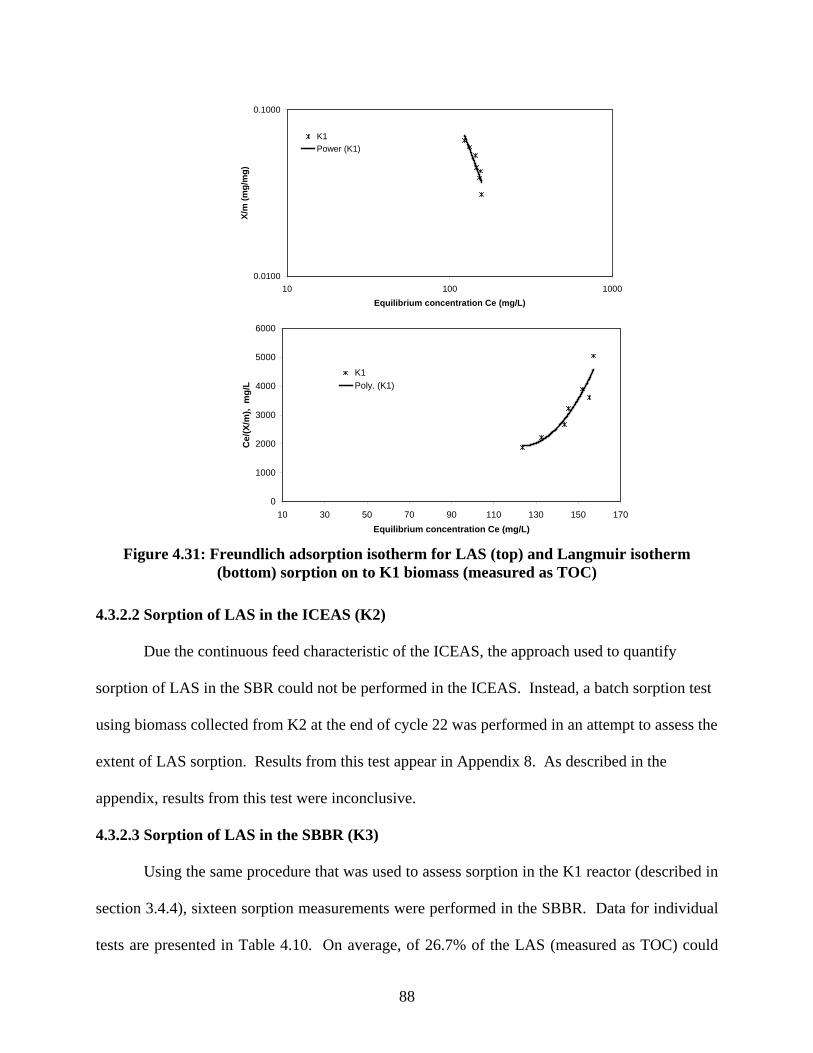
0.0100
0.1000
10 100 1000Equilibrium concentration Ce (mg/L)
X/m
(mg/
mg)
K1Power (K1)
0
1000
2000
3000
4000
5000
6000
10 30 50 70 90 110 130 150 170Equilibrium concentration Ce (mg/L)
Ce/
(X/m
), m
g/L
K1Poly. (K1)
Figure 4.31: Freundlich adsorption isotherm for LAS (top) and Langmuir isotherm
(bottom) sorption on to K1 biomass (measured as TOC)
4.3.2.2 Sorption of LAS in the ICEAS (K2)
Due the continuous feed characteristic of the ICEAS, the approach used to quantify
sorption of LAS in the SBR could not be performed in the ICEAS. Instead, a batch sorption test
using biomass collected from K2 at the end of cycle 22 was performed in an attempt to assess the
extent of LAS sorption. Results from this test appear in Appendix 8. As described in the
appendix, results from this test were inconclusive.
4.3.2.3 Sorption of LAS in the SBBR (K3)
Using the same procedure that was used to assess sorption in the K1 reactor (described in
section 3.4.4), sixteen sorption measurements were performed in the SBBR. Data for individual
tests are presented in Table 4.10. On average, of 26.7% of the LAS (measured as TOC) could
88
not be accounted for right after the FILL period was finished. Although this provided a general
indication that sorption was likely playing at least a temporary role in TOC removal, a more
complete analysis of these data using Freundlish or Langmuir isotherm models is not possible
because the mass of biomass attached to the polyurethane foam packing medium was not
measured.
The slightly higher TOC removal during the Fill period in the SBBR (K3) compared to
the SBR (K1) may have been due to the fact that there was a larger quantity of biomass in the
SBBR, or it may have been due to LAS adsorption by the polyurethane foam packing medium.
Table 4.10: Percentages of LAS sorbed in the SBBR based on calculation on mass balance
Cycle TOC, mg/L Volume,L TOC, mg/L Volume,L TOC , mg TOC, mg/L Volume,L TOC, mg TOC, mg/L Volume,L TOC, mg Sorbed, mg %46 282.1 1.25 73.20 1.25 91.50 177.65 2.50 444.13 134.20 2.50 335.50 108.63 24.4647 285.9 1.25 86.06 1.25 107.58 185.98 2.50 464.95 140.27 2.50 350.68 114.28 24.5848 285.9 1.25 78.64 1.25 98.30 182.27 2.50 455.68 117.90 2.50 294.75 160.93 35.3249 284.4 1.25 74.04 1.25 92.55 179.22 2.50 448.05 124.37 2.50 310.93 137.13 30.6050 280.0 1.25 69.01 1.25 86.26 174.51 2.50 436.26 125.00 2.50 312.50 123.76 28.3751 282.1 1.25 66.42 1.25 83.03 174.26 2.50 435.65 128.22 2.50 320.55 115.10 26.4252 282.1 1.25 65.21 1.25 81.51 173.66 2.50 434.14 132.60 2.50 331.50 102.64 23.6453 284.0 1.25 59.89 1.25 74.86 171.95 2.50 429.86 133.91 2.50 334.78 95.09 22.1254 284.0 1.25 64.07 1.25 80.09 174.04 2.50 435.09 130.55 2.50 326.38 108.71 24.9955 284.0 1.25 62.79 1.25 78.4875 173.40 2.50 433.49 131.06 2.50 327.65 105.84 24.4256 283.4 1.25 61.23 1.25 76.5375 172.32 2.50 430.79 130.80 2.50 327.00 103.79 24.0962 285.0 1.25 65.17 1.25 81.46 175.09 2.50 437.71 129.63 2.50 324.08 113.64 25.9663 288.0 1.25 58.86 1.25 73.58 173.43 2.50 433.58 131.86 2.50 329.65 103.93 23.9764 288.0 1.25 56.45 1.25 70.56 172.23 2.50 430.56 110.43 2.50 276.08 154.49 35.8865 288.0 1.25 57.70 1.25 72.13 172.85 2.50 432.13 136.80 2.50 342.00 90.13 20.8666 285.0 1.25 56.41 1.25 70.51 170.71 2.50 426.76 117.60 2.50 294.00 132.76 31.11
Feed Reactor (end of previous cycle) Calculated concentration (after mixing) Measured concentration (after mixing)
To assess whether sorption to the polyurethane foam packing medium may have
occurred, an isotherm experiment was conducted using virgin foam (i.e., foam that had not been
placed in the bioreactor) as described in Section 3.4.5.4. Figure 4.32 depicts the Freundlich
adsorption isotherm for LAS (measured as TOC) built from results obtained during the batch
sorption test. Freundlich constants (Kf and 1/n) for the polyurethane foam tested were calculated
along with the correlation coefficient. These values are presented in Table 4.11.
From the Freundlich adsorption isotherm built from the batch sorption tests, it was found
that mass of TOC adsorbed per unit mass of foam increased as the concentration of TOC in
solution increased. The model fit the experimental data quite well (R2 = 0.9879).
89
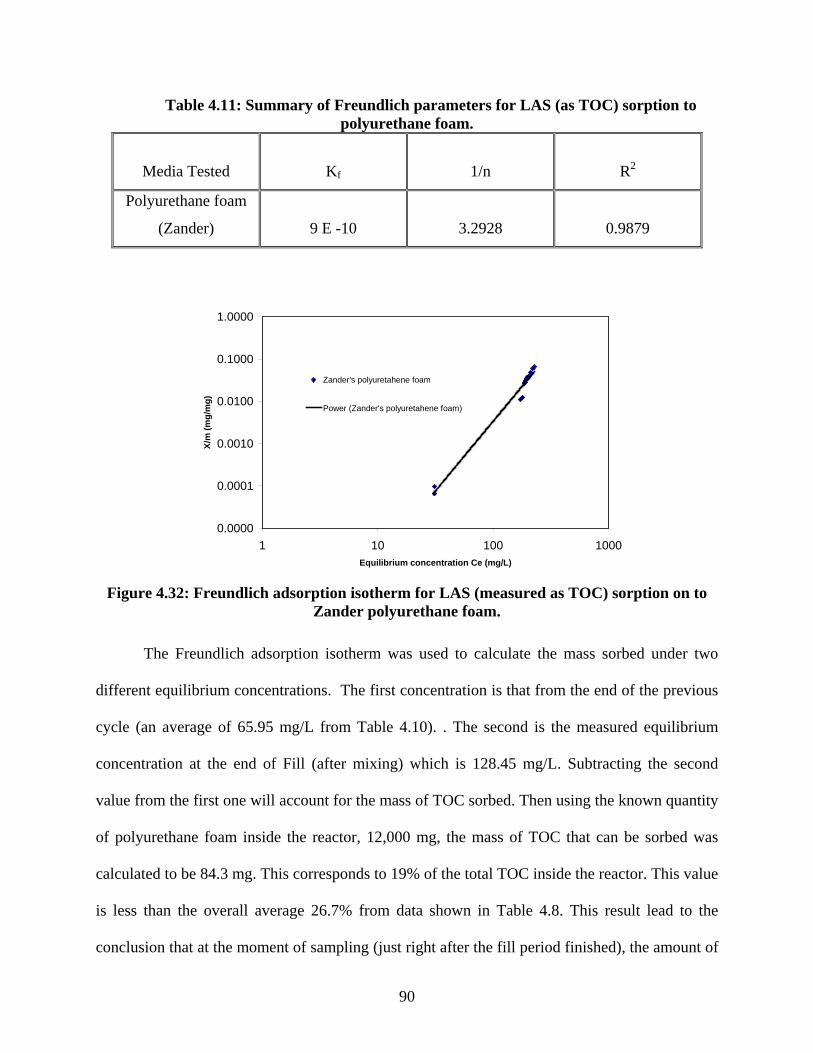
Table 4.11: Summary of Freundlich parameters for LAS (as TOC) sorption to polyurethane foam.
Media Tested
Kf
1/n
R2
Polyurethane foam
(Zander)
9 E -10
3.2928
0.9879
0.0000
0.0001
0.0010
0.0100
0.1000
1.0000
1 10 100 1000Equilibrium concentration Ce (mg/L)
X/m
(mg/
mg)
Zander's polyuretahene foam
Power (Zander's polyuretahene foam)
Figure 4.32: Freundlich adsorption isotherm for LAS (measured as TOC) sorption on to
Zander polyurethane foam.
The Freundlich adsorption isotherm was used to calculate the mass sorbed under two
different equilibrium concentrations. The first concentration is that from the end of the previous
cycle (an average of 65.95 mg/L from Table 4.10). . The second is the measured equilibrium
concentration at the end of Fill (after mixing) which is 128.45 mg/L. Subtracting the second
value from the first one will account for the mass of TOC sorbed. Then using the known quantity
of polyurethane foam inside the reactor, 12,000 mg, the mass of TOC that can be sorbed was
calculated to be 84.3 mg. This corresponds to 19% of the total TOC inside the reactor. This value
is less than the overall average 26.7% from data shown in Table 4.8. This result lead to the
conclusion that at the moment of sampling (just right after the fill period finished), the amount of
90
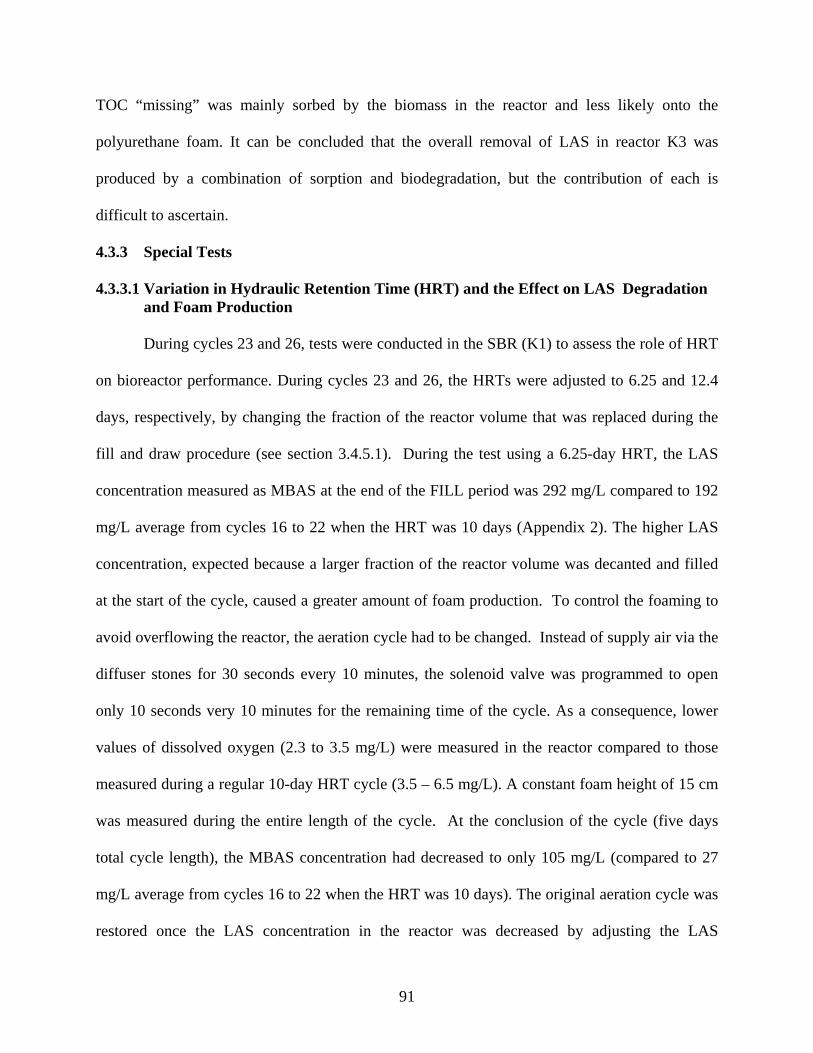
TOC “missing” was mainly sorbed by the biomass in the reactor and less likely onto the
polyurethane foam. It can be concluded that the overall removal of LAS in reactor K3 was
produced by a combination of sorption and biodegradation, but the contribution of each is
difficult to ascertain.
4.3.3 Special Tests
4.3.3.1 Variation in Hydraulic Retention Time (HRT) and the Effect on LAS Degradation and Foam Production
During cycles 23 and 26, tests were conducted in the SBR (K1) to assess the role of HRT
on bioreactor performance. During cycles 23 and 26, the HRTs were adjusted to 6.25 and 12.4
days, respectively, by changing the fraction of the reactor volume that was replaced during the
fill and draw procedure (see section 3.4.5.1). During the test using a 6.25-day HRT, the LAS
concentration measured as MBAS at the end of the FILL period was 292 mg/L compared to 192
mg/L average from cycles 16 to 22 when the HRT was 10 days (Appendix 2). The higher LAS
concentration, expected because a larger fraction of the reactor volume was decanted and filled
at the start of the cycle, caused a greater amount of foam production. To control the foaming to
avoid overflowing the reactor, the aeration cycle had to be changed. Instead of supply air via the
diffuser stones for 30 seconds every 10 minutes, the solenoid valve was programmed to open
only 10 seconds very 10 minutes for the remaining time of the cycle. As a consequence, lower
values of dissolved oxygen (2.3 to 3.5 mg/L) were measured in the reactor compared to those
measured during a regular 10-day HRT cycle (3.5 – 6.5 mg/L). A constant foam height of 15 cm
was measured during the entire length of the cycle. At the conclusion of the cycle (five days
total cycle length), the MBAS concentration had decreased to only 105 mg/L (compared to 27
mg/L average from cycles 16 to 22 when the HRT was 10 days). The original aeration cycle was
restored once the LAS concentration in the reactor was decreased by adjusting the LAS
91
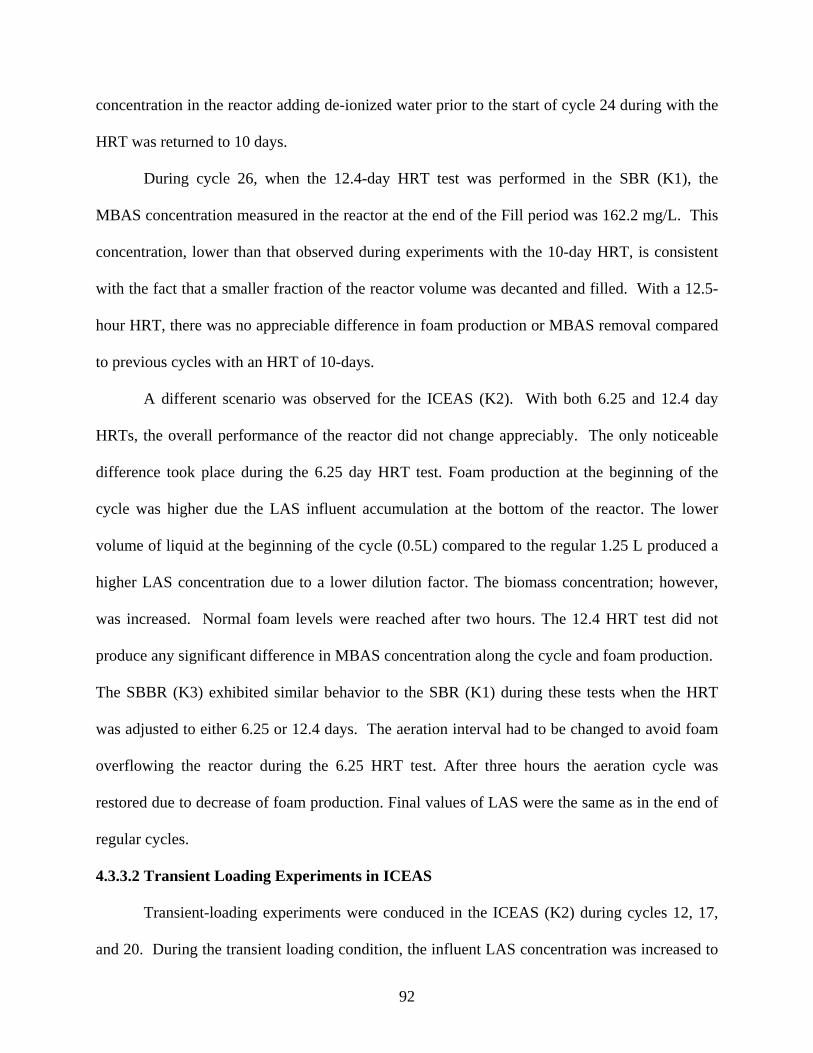
concentration in the reactor adding de-ionized water prior to the start of cycle 24 during with the
HRT was returned to 10 days.
During cycle 26, when the 12.4-day HRT test was performed in the SBR (K1), the
MBAS concentration measured in the reactor at the end of the Fill period was 162.2 mg/L. This
concentration, lower than that observed during experiments with the 10-day HRT, is consistent
with the fact that a smaller fraction of the reactor volume was decanted and filled. With a 12.5-
hour HRT, there was no appreciable difference in foam production or MBAS removal compared
to previous cycles with an HRT of 10-days.
A different scenario was observed for the ICEAS (K2). With both 6.25 and 12.4 day
HRTs, the overall performance of the reactor did not change appreciably. The only noticeable
difference took place during the 6.25 day HRT test. Foam production at the beginning of the
cycle was higher due the LAS influent accumulation at the bottom of the reactor. The lower
volume of liquid at the beginning of the cycle (0.5L) compared to the regular 1.25 L produced a
higher LAS concentration due to a lower dilution factor. The biomass concentration; however,
was increased. Normal foam levels were reached after two hours. The 12.4 HRT test did not
produce any significant difference in MBAS concentration along the cycle and foam production.
The SBBR (K3) exhibited similar behavior to the SBR (K1) during these tests when the HRT
was adjusted to either 6.25 or 12.4 days. The aeration interval had to be changed to avoid foam
overflowing the reactor during the 6.25 HRT test. After three hours the aeration cycle was
restored due to decrease of foam production. Final values of LAS were the same as in the end of
regular cycles.
4.3.3.2 Transient Loading Experiments in ICEAS
Transient-loading experiments were conduced in the ICEAS (K2) during cycles 12, 17,
and 20. During the transient loading condition, the influent LAS concentration was increased to
92
two times that of the normal loading (approximately 800 mg/L LAS during transient loading vs.
approximately 400 mg/L during “normal” loading). The higher influent LAS concentration
wastewater was pumped into the reactor for the entire cycle length during cycles 12 and 17, and
for three days of the 5-day cycle during cycle 20. The influent LAS concentration during these
tests, measured as TOC, corresponded to 567, 571, and 563 mg/L for cycles 12, 17, and 20,
respectively.
1565
115165215265315365415465515565615665715765
0 120 240 360 480 600 720 840 960 1080 1200 1320 1440 1560 1680
Time , h
mg/
L
Influent TOCTOC within cycles
Cycle 11 Cycle 16
Cycle 12 Cycle 17
Cycle 19
Cycle 20
Figure 4.33: Overall behavior of ICEAS during transient loading experiments.Time zero is
the start of the React period during cycle 11
Figure 4.33 depicts the performance of the ICEAS in terms of TOC in the influent and
TOC within cycles. The effect of the high LAS influent concentration can be observed during
cycles 12 and 17. Accumulation of influent LAS (measured as TOC) in the reactor during
SETTLE and DRAW stages increased the overall LAS concentration in the reactor at the start of
the Fill/React period. Average TOC concentrations before the transient loading began (i.e., at
the start of the settle period) were 74.8 mg/L during cycle 11, and 61.7 mg/L in cycle 16. Once
the reactor started to be fed with the higher concentration of LAS in the influent solution, the
TOC concentrations increased up to maximum concentrations of 112.4 mg/L in cycle 12 and
92.6 mg/L in cycle 17 (measured at the beginning of the React period on cycles 12 and 17).
93
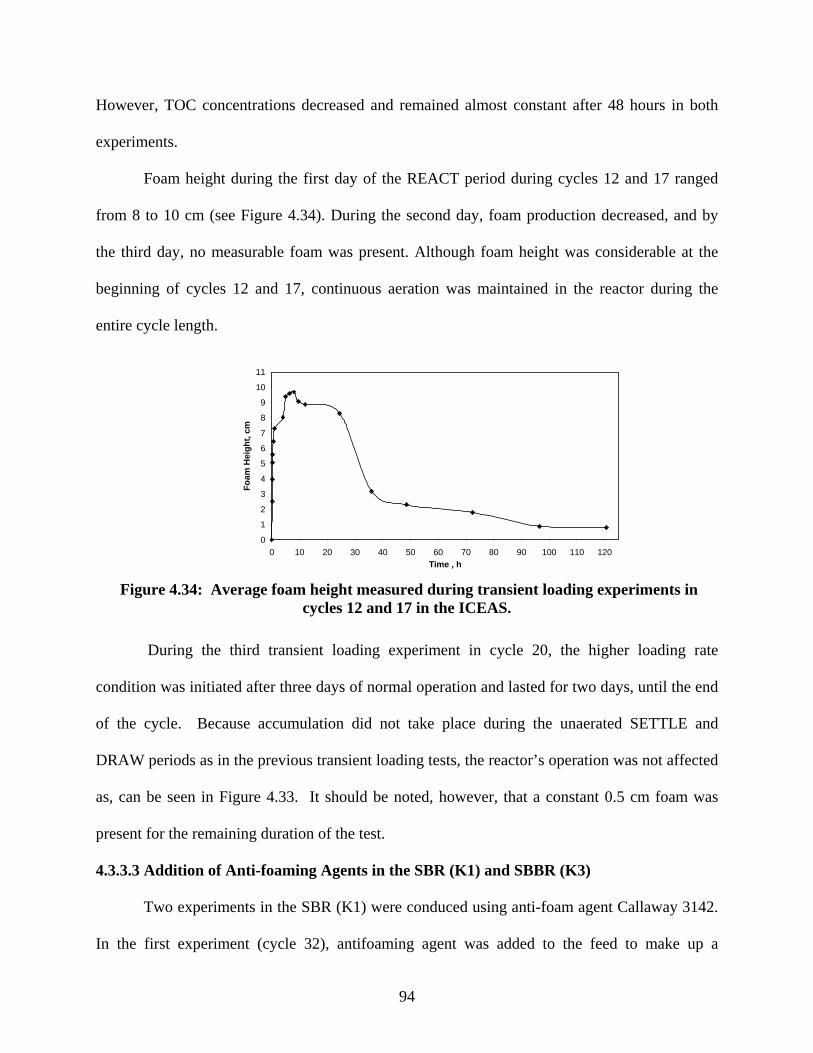
However, TOC concentrations decreased and remained almost constant after 48 hours in both
experiments.
Foam height during the first day of the REACT period during cycles 12 and 17 ranged
from 8 to 10 cm (see Figure 4.34). During the second day, foam production decreased, and by
the third day, no measurable foam was present. Although foam height was considerable at the
beginning of cycles 12 and 17, continuous aeration was maintained in the reactor during the
entire cycle length.
0
1
2
3
4
5
6
7
8
9
10
11
0 10 20 30 40 50 60 70 80 90 100 110 120Time , h
Foam
Hei
ght,
cm
Figure 4.34: Average foam height measured during transient loading experiments in
cycles 12 and 17 in the ICEAS.
During the third transient loading experiment in cycle 20, the higher loading rate
condition was initiated after three days of normal operation and lasted for two days, until the end
of the cycle. Because accumulation did not take place during the unaerated SETTLE and
DRAW periods as in the previous transient loading tests, the reactor’s operation was not affected
as, can be seen in Figure 4.33. It should be noted, however, that a constant 0.5 cm foam was
present for the remaining duration of the test.
4.3.3.3 Addition of Anti-foaming Agents in the SBR (K1) and SBBR (K3)
Two experiments in the SBR (K1) were conduced using anti-foam agent Callaway 3142.
In the first experiment (cycle 32), antifoaming agent was added to the feed to make up a
94
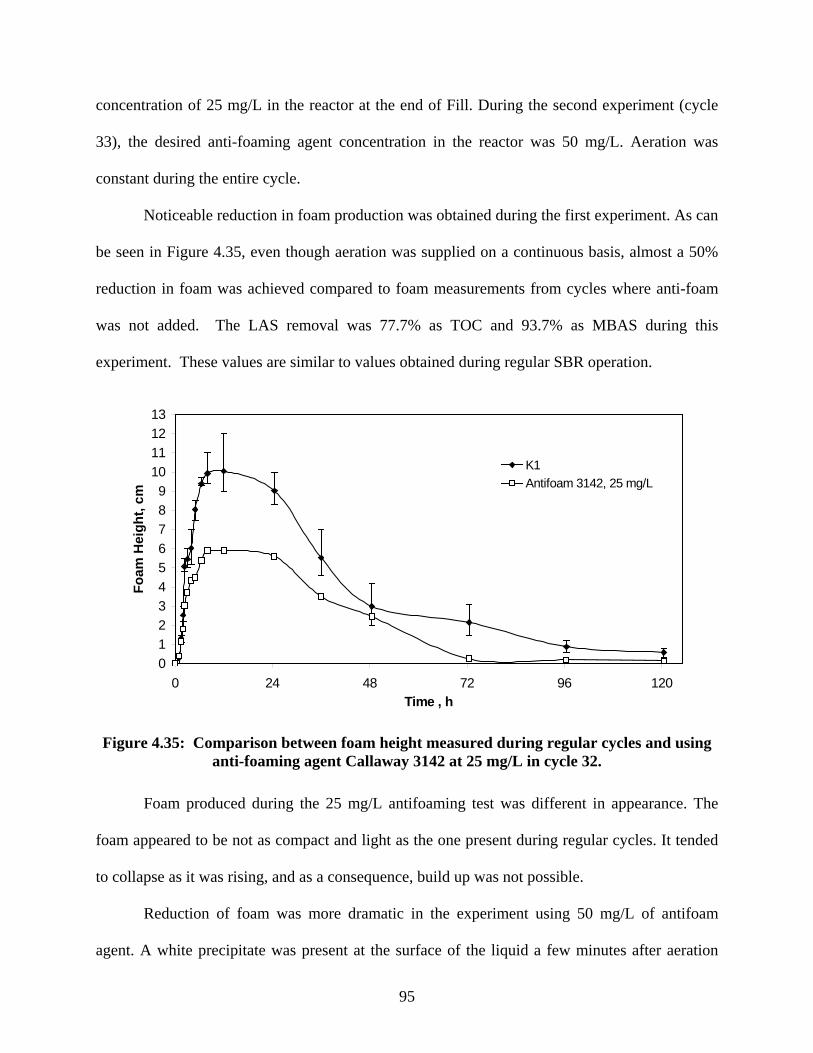
concentration of 25 mg/L in the reactor at the end of Fill. During the second experiment (cycle
33), the desired anti-foaming agent concentration in the reactor was 50 mg/L. Aeration was
constant during the entire cycle.
Noticeable reduction in foam production was obtained during the first experiment. As can
be seen in Figure 4.35, even though aeration was supplied on a continuous basis, almost a 50%
reduction in foam was achieved compared to foam measurements from cycles where anti-foam
was not added. The LAS removal was 77.7% as TOC and 93.7% as MBAS during this
experiment. These values are similar to values obtained during regular SBR operation.
0123456789
10111213
0 24 48 72 96 12Time , h
Foam
Hei
ght,
cm
0
K1Antifoam 3142, 25 mg/L
Figure 4.35: Comparison between foam height measured during regular cycles and using
anti-foaming agent Callaway 3142 at 25 mg/L in cycle 32.
Foam produced during the 25 mg/L antifoaming test was different in appearance. The
foam appeared to be not as compact and light as the one present during regular cycles. It tended
to collapse as it was rising, and as a consequence, build up was not possible.
Reduction of foam was more dramatic in the experiment using 50 mg/L of antifoam
agent. A white precipitate was present at the surface of the liquid a few minutes after aeration
95
was started in the reactor. Foam was similar in appearance as mentioned above, but in less
quantity. Higher values of foam reached between 2.5 and 3.0 cm. No measurable foam was
present by the second day of the cycle.
MBAS analysis showed an LAS concentration of 158 mg/L at the beginning of the cycle.
This value is low compared to regular values from previous and following cycles (cycles 30 to
37, Appendix 3), which ranged between 175 and 208 mg/L. Although LAS concentration
measured as MBAS was low, TOC measurements did not show any significant difference as can
be seen in Figure 4.36. Also, overall LAS removal as TOC and MBAS were close to the ones
from previous and following cycles, 75.9% and 93.6% respectively.
Experiments using anti-foam agent 3142 were conducted in the SBBR (K3) during cycles
45 and 58. The influent synthetic wastewater was amended with 25 mg/L of antifoaming agent
in cycle 45, and 50 mg/L during cycle 58. Continuous aeration could be maintained during the
entire cycle in both experiments due to low production of foam. Foam production was the same
in both experiments. Even when the concentration of antifoaming agent was double in cycle 58,
the recordings of foam height were similar to those observed during cycle 45. The maximum
foam height recorded, 6 cm, took place 5 minutes after the start of the cycle. Visual observation
of the foam produced in the reactor revealed that the foam had similar physical characteristics
presented during experiments performed in the SBR with anti-foam chemicals.
The 5 cm foam height was almost constant during two hours due to collapsing of the
foam as it rose. After two hours, no measurable foam was produced in the reactor. TOC and
MBAS concentrations did not show any remarkable difference from others recorded from
previous and following tests as shown in Figure 4.37. Partial sorption of the antifoaming agent
either onto the polyurethane foam or biomass is one potential explanation for why both
experiments showed similar outcomes in terms of foam production.
96
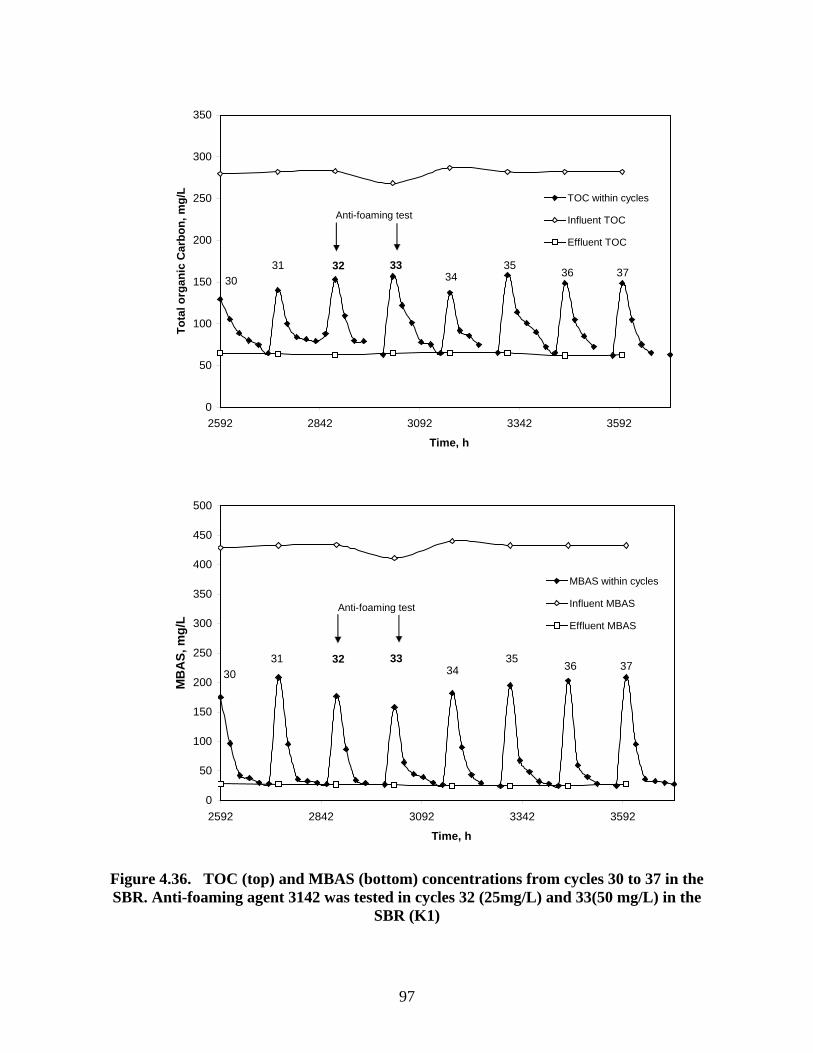
0
50
100
150
200
250
300
350
2592 2842 3092 3342 3592
Time, h
Tota
l org
anic
Car
bon,
mg/
LTOC within cycles
Influent TOC
Effluent TOC
3031 32 33
3435
36 37
Anti-foaming test
0
50
100
150
200
250
300
350
400
450
500
2592 2842 3092 3342 3592
Time, h
MB
AS,
mg/
L
MBAS within cycles
Influent MBAS
Effluent MBAS
3031 32 33
3435
36 37
Anti-foaming test
Figure 4.36. TOC (top) and MBAS (bottom) concentrations from cycles 30 to 37 in the SBR. Anti-foaming agent 3142 was tested in cycles 32 (25mg/L) and 33(50 mg/L) in the
SBR (K1)
97
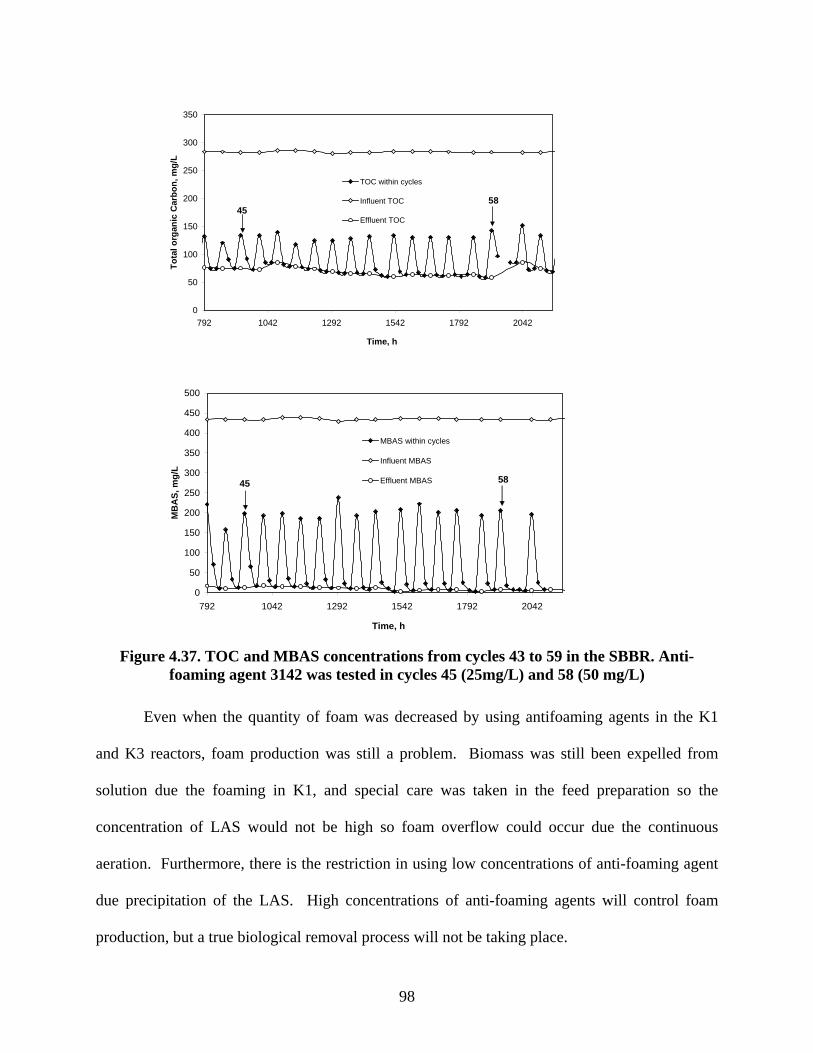
0
50
100
150
200
250
300
350
792 1042 1292 1542 1792 2042
Time, h
Tota
l org
anic
Car
bon,
mg/
LTOC within cycles
Influent TOC
Effluent TOC45
58
0
50
100
150
200
250
300
350
400
450
500
792 1042 1292 1542 1792 2042
Time, h
MB
AS,
mg/
L
MBAS within cycles
Influent MBAS
Effluent MBAS45 58
Figure 4.37. TOC and MBAS concentrations from cycles 43 to 59 in the SBBR. Anti-
foaming agent 3142 was tested in cycles 45 (25mg/L) and 58 (50 mg/L)
Even when the quantity of foam was decreased by using antifoaming agents in the K1
and K3 reactors, foam production was still a problem. Biomass was still been expelled from
solution due the foaming in K1, and special care was taken in the feed preparation so the
concentration of LAS would not be high so foam overflow could occur due the continuous
aeration. Furthermore, there is the restriction in using low concentrations of anti-foaming agent
due precipitation of the LAS. High concentrations of anti-foaming agents will control foam
production, but a true biological removal process will not be taking place.
98
CHAPTER 5 OVERALL CONCLUSIONS AND RECOMMENDATIONS FOR FUTURE RESEARCH
Development of a culture capable of using LAS in high concentrations was accomplished
using the respirometer. This issue was very important because during literature investigation
there was a lack of information regarding degradation of LAS in concentration greater than 10
mg/L. Analysis using first-order kinetics revealed that average half-lives were 12.1 days (from
TOC data) and 3.1 days (from MBAS data) for a solution containing an initial LAS
concentration of 500 mg/L seeded with a biomass concentration of 100 mg/L TSS. The average
half-life of 3.1 days calculated from MBAS is close to values reported by Nielsen et al. (1997)
for LAS in low concentrations from a Porous Pot Biodegradation Test System.
For laboratory scale reactors treating a synthetic wastewater containing 400 mg/L LAS,
removal was achieved in all three of the process configurations tested (SBR, ICEAS, and
SBBR). Results from this research showed that the SBR produced an effluent with an average of
75 mg/L in TOC and 32 mg/L as MBAS from an influent containing an average of 282 mg/L
TOC and 430 mg/L as MBAS. Although results indicate that the SBR operating cycle reported
in this thesis is a feasible process for treating wastewater with high concentrations of LAS,
excessive foam production was exhibited for the system when a short Fill period was utilized.
This resulted from the fact that high LAS concentrations were present in the reactor at the start of
the React period. Similarly, excessive foam production was also observed in the SBBR when a
short Fill period was utilized. For full scale implementation, it is anticipated that continuous
aeration will not be possible and that controllable addition of antifoaming agents will be
necessary in cases where short Fill periods or very high influent LAS concentrations result in
high LAS concentrations in the reactor at the start of aeration.
In terms of foam production, the ICEAS showed the best performance in treating an
influent with high concentrations in LAS. Minimal foaming was observed even when continuous
99
aeration was supplied even during transient loading tests where the influent wastewater
contained LAS concentrations of 800 mg/L. Treated effluent from the ICEAS had an average of
60 mg/L of TOC and 20 mg/L as MBAS.
Of the three systems evaluated in the research reported in this thesis, the SBBR (i.e., K3)
consistently produced the lowest TOC and MBAS concentrations in the effluent after a pH
control strategy was implemented. Effluent TOC and MBAS concentrations produced by this
system had an average of 60 mg/L TOC and 7 mg/L as MBAS. Furthermore, the SBBR
accomplished this treatment with a cycle time of only two days (HRT of 4 days) compared to a
cycle length of five days (HRT of 10 days) in the ICEAS and SBR.
The removal of LAS achieved in the SBR and ICEAS was concluded to be
predominantly due to biodegradation. Oxygen Uptake Rates measured during the operational
cycles in both the SBR and ICEAS verified microbial activity in the presence of LAS. TOC and
MBAS measurements support the fact that LAS was being consumed while OUR was taking
place. The activated sludge developed in the reactors was able to use LAS as sole source of
carbon.
Because biomass in the SBBR grew attached to solid packing medium, OUR was not
measured using the procedure used to confirm biodegradation as in the case of the SBR and
ICEAS. Nevertheless, experimental data support the notion that biodegradation was the main
cause for LAS removal in the SBBR system based on the following facts: 1) the mass of LAS
removed during the 66 operational cycles was quite large compared to the expected abiotic
sorption capacity of the polyurethane foam packing medium or biomass; 2) production of a
considerable amount of biomass growth could be visually observed over time; 3) there was a
need for continuous pH regulation, a phenomenon expected from production of acidic
intermediates reported by other researchers, and 4) the dissolved oxygen measured in the reactor
100
vessel was much lower than saturation indicating that it was being consumed by the microbial
population. Although the amount of biomass in the SBBR was not measured at the end of the
test, a crude estimate based on visual observation indicates that it was at least two times more
than that present in the ICEAS. The higher amount of biomass present in K3 could be the
explanation why the LAS removal in K3 occurred faster compared to K1 and K2 when treating a
wastewater with the same LAS concentration.
Based on the number of cycles performed and the shorter cycle length, the SBBR
removed approximately three times more LAS than the ICEAS and two times more than the
SBR. If sorption onto the polyurethane foam was the main cause of the removal, it have to be
assumed that it had a much large sorption capacity than was determined from batch sorption tests
performed using virgin foam.
The need for almost continuous pH regulation in the SBBR (K3) can be explained by the
results obtained by Perez et al., 1996. In their study, it was established that LAS influenced the
pH self-regulation capacity in aerobic degradation of organic matter when its concentration is
greater than 20 mg/L and external neutralization was required. The drop in pH was attributed to
the production of acidic intermediates as a result of LAS degradation following the degradation
pathway proposed by Swisher (1987). This last observation provides further credibility to the
notion that biodegradation rather than sorption was primarily responsible for to LAS removal in
K3 (i.e., the SBBR).
Complete removal of LAS was not achieved in either the SBR or ICEAS. There was an
average of 20% of the incoming TOC and 6% of the influent MBAS present at the end of the last
cycles performed in each system. From the data collected, it cannot be determined whether the
remaining TOC consisted of partially transformed degradation products (i.e., intermediates that
101
could not been used as carbon source by the microorganisms present), remaining LAS
homologues that could not be transformed by the microbial population, or if the residual TOC
was comprised of relatively inert soluble microbial products (i.e., dead biomass). The fact that
the concentration of MBAS was not zero suggests that residual surfactant accounted for at least a
portion of the residual TOC.
Foaming was of particular concern during the operation of the reactors. The ICEAS was
the only system capable of operating under continuous aeration during its REACT period.
Implementation of an intermittent aeration strategy in the SBR and SBBR was necessary to avoid
excessive foaming due the presence of high concentrations of surfactant at the start of the
REACT period. Using anti-foaming agents made it possible to aerate the reactors continuously;;
however, it did not completely eliminate the foaming problem. The amount of anti-foaming
agent was limited to 25 mg/L because higher concentrations precipitate the LAS in solution
making it unavailable to bacteria. There was no significant difference in LAS removal between
cycles aerated continuously and those under the intermittent aeration strategy.
The SVI and TSS content on the clarified effluent from the SBR and ICEAS showed that
even when the ICEAS had a better performance in LAS removal and foam production, activated
sludge in this system did not have as good settling capacity as the SBR. Also, visual observations
from each of the activated sludge revealed differences in the color and physical appearance of
the activated sludge. Activated sludge in the SBR had a light brown color with a granular
appearance while activated sludge from the ICEAS presented a light yellow color and fluffy
appearance. These characteristics suggest that there were at least some differences in the
microbial communities developed in each of the systems. If this is the case, it can be said that
different operation strategies lead to development of different bacterial cultures even when the
same departure activated sludge is used.
102
Based on the results from this research, a system consisting of an SBR or SBBR with a
long aerated Fill period would likely to be the best alternative in a full-scale treatment plant to
treat an influent wastewater containing high concentrations of LAS. It would venture to speculate
that an aerated Fill period (i.e., 3 days) instead of the short static fill performed, followed by a
shorter React period (i.e., two days) would avoid high LAS concentrations and will not produced
excessive foaming. Furthermore, using an SBR or SBBR would not present the disadvantage
observed in the ICEAS of having accumulation influent with high concentrations of surfactant
during the SETTLE and DECANT/DRAW periods that caused production of foam as soon the
aeration was started. Additional experiments could be conducted to verify the above stated.
Although the research reported in this thesis demonstrated that biological treatment is a
technically feasible option for treating wastewaters containing high concentrations of LAS, that
does not mean that it would be the most cost effective alternative for full-scale systems. It is
recommended that future research efforts include an economic analysis to determine if biological
treatment would offer a cost advantage in comparison to the DAF-polymer treatment used at the
industrial facility in Honduras.
From a research point of view, characterization of the microbial population in each of the
reactors would be of academic interest because it would allow further insights into whether the
various operating strategies influenced the composition of the microbial community structure.
Denaturant Gradient Gel Electrophoresis (DGGE) on the activated sludge from the SBR, SBBR,
and ICEAS will show if the populations are the same or different due to the selection and
enrichment strategies.
103
REFERENCES Angelidaki, I., Mogensen, AS., and Ahring, BK. (2000) Degradation of organic contaminants
found in organic waste. Biodegradation, 11:377-83.
Arnz, P., Esterl, S., Nerger, C., Delgado, A., Wilderer, P.A. (2000) Simultaneous loading and draining as a means to enhance efficacy of sequencing biofilm batch reactors. Water Research. 34(5):1763-1766.
Bryers, J.D.,Characklis, W.G., (1990) Biofilms in water and wastewater treatments. Biofilms. W.G. Characklis and K.C. Marshall, eds., John Wiley and Sons, NY.
Cavalli, L., Gellera, A., Landone, A. (1993) LAS Removal and biodegradation in a wastewater treatment plant. Environ. Toxicol. Chem., 12:1777-1788.
Figueroa, L.A., Miller, J., Dawson, H.E. (1997) Biodegradation of two polyethoxylated nonionic surfactants in sequencing batch reactors. Water Environmental Research , 69(7): 1282-1289.
Federle, T.W., Ventull, R.M., and White, D.C. (1990) Spatial distribution of microbial biomass, activity, community structure, and the biodegradation of linear alkylbenzene sulfonate and linear alcohol ethoxylate in the surface. Microbial Ecology. 20 (3): 297-313.
Irvine, R.L., Ketchum, L.H. (1989) Sequencing batch reactors for biological wastewater treatment. Environmental Control. 18(4): 255-294.
Khararjian, H.A., Callaway, W.H., Cardinal,P., Meany, J. (1990) Intermittent cycle extended aeration system (ICEAS R) for small wastewater treatment plants. Water Science and Technology. 22(3-4): 323-330.
Larson, R.J., Payne, A.G. (1981) Fate of the benzene ring of linear alkylbenzene sulfonates in natural waters. Appl. Environ. Microbiol., 41(3):621-627.
Larson, R.J., Rothgeb, T.M., Shimp, R.J., Ward, T.E., and Ventullo, R.M. (1995) Kinetics and practical significance of biodegradation of linear alkylbenzene sulfonate in the environment. The CLER review 1: 4-19.
Lee, C. Russell, N.J., White, G.F. (1998) Development and validation of laboratory microcosms for anionic surfactant biodegradation by riverine biofilms. Wat. Res. 32(8): 2291-2298.
Leon, V.M., Gonzales-Mazo, E., Pajares, J.M.F., Gomez-Parra, A. (1991) Vertical distribution profiles of linear alkylbenzene sulfonates and their long-chain intermediate degradation products in coastal marine sediments. Environ. Toxicol. Chem. 20 (10): 2171-2178.
Lung, W.S., Rapaport, R.A., Franco, A.C. (1990) Predicting concentrations of consumer product chemicals in estuaries. Environ. Toxicol. Chem. 9 : 1127-1136.
104
105
Madsen, T., Winther-Nielsen, M., Rasmussen, D. (1999) Studies of the fate of Linear alkylbenzene sulfonates in sludge and sludge-amended soil. The CLER Review. 6 : 14-19.
Metcalf and Eddy. (1991) Wastewater engineering - treatment ,disposal and reuse. Third edition.
McEvoy, J., Giger, W. (1986) Determination of linear alkylbenzene sulfonates in sewage-sludges by high-resolution gas chromatography mass-spectrometry. Environ. Sci. Technol. 20:376-383.
McAvoy, D.C., Eckhoff, W.S., Rapaport, R.A. (1993) Fate of linear alkylbenzene sulfonates in the environment. Environ. Toxicol. Chem. 12: 977-987.
Morgenroth, E., Wilderer, PA., Barnard, J., Boon, A., Williams, S., Xiong, F.,Ware, A., Pitman, T., De Jong, E. (1998) Sequencing batch reactor technology: concepts, design, and experiences. Journal of the Chartered Institution of Water and Environmental Management. 12(5): 314-321.
Mösche, M., Meyer, U. (2002) Toxicity of linear alkylbenzene sulfonate in anaerobic digestion: influence of exposure time. Water Res. 36: 3253-3260.
Nielsen, A.M., Britton, L.N., Becall, C.E., McCormick, T.P., Russell, G.L. (1997) Biodegradation of co-products of commercial linear alkylbenzene sulfonate. Environmental Science & Technology.31(12):3397-3404.
Organization for Economic Cooperation and Development, Guidelines for testing of Chemicals: Section 3, “Degradation and Accumulation”, OECD. Paris, 1981.
Pérez, M., Romero,J.M.,Quiroga,J.M., Sales, D. Effect of LAS (Linear Alkylbenzene Sulphonates) on organic matter biodegradation. (1996) Tenside Surf. Det. 33(6):473-478.
Prats, D., Rodriguez, M., Muela, M.A., Llamas, J.M. (2000) Elimination of linear alkylsulfonate in sewage biosolids by composting. The CLER Review. 6: 62-71.
Rapaport,R.A., Eckhoff, W.S. (1990) Monitoring linear alkylbenzene sulfonates in the environment Environ. Toxicol. Chem. 9:1245-1257.
Rittmann, B.E., Tularak, P., Lee, K.-C., Federle, T.W., Itrich, N.R., Kaiser, S.K., Shi, J., and McAvoy, D.C. (2001) How adaptation and mass transfer control the biodegradation of linear alkylbenzene sulfonate by activated sludge, Biodegradation, 12, 31-37.
Romano, P., Ranzani, M. (1992) Anionic surfactants removal and biodegradation in a large treatment plant. Wat. Sci and Technol. 26(9-11): 2547-2550.
Schulze, K. (1996) Der westeuropische Tensidmarkt 1994/1995. Tenside Surfactants Detergents 33, 94-95.
Sigoillot, J.C., Nguyen, M.H. (1992) Complete oxidation of linear alkylbenzene sulfonate by bacterial communities selected from coastal seawater. Applied Environmental Microbiology 58(4): 1308-1312.
Swisher, R.D. (1987) Surfactant Biodegradation. Second edition, pg 587-614.
Takada, H. Ishiwatari R. (1987) Linear alkylbenzene sulfonates in urban riverine environments in Tokyo – Distribution, source, and behavior. Environ. Sci. Tech. 21:875-883.
Trehy, M.L., Gledhill, W.E. Mieure, J. P., Adamove, J.E. Nielsen, A.M., Perkins H.O., Eckhoff, W.S. (1996) Environmental monitoring for lauryl alkylbenzenes, dialkyltetralin sulfonates and their biodegradation intermediates. Environ. Toxicol. Chem. 15(3): 233.
Wilderer, P.A., Roske, I., Ueberschar, A., and L. Davids. (1993) Continuous flow and sequenced batch operation of biofilm reactors: a comparative study of shock loading responses. Biofouling, 6, 295-304.
Zhang, C.L., Valsaraj, K.T., Constant, W.D., Roy, D. (1999) Aerobic biodegradation kinetics of four anionic and nonionic surfactants at sub- and supra- critical micelle concentrations. Water Research, 33(1): 115-124.
106
107
APPENDIX 1: TESTING ANTI-FOAMING AGENTS
A.1 Objective
Compare 12 different antifoaming agents (laboratory preparations from Vulcan
Performance Chemicals, Columbus, GA). Different concentrations of each anti-foaming agent
were tested to measure foam production using a 200 mg/L LAS solution.
A.2 Materials and Methods
A.2.1 LAS Stock Solution.
2 liters of LAS (Aldrich D-2525) stock solution containing 4.35 mg-LAS/mL was used to
prepare the working solutions.
A.2.2 Working Solutions
The working solutions were prepared pipetting 23 mL of LAS stock solution into a 500
mL flask. The final LAS concentration was 200 mg/L.
The amounts of antifoaming agents were weighed in a small beaker on an analytical scale with
0.0001 g precision. The beaker containing the antifoaming agent was washed with 10 mL of
LAS stock solution and transferred into the 500 mL flask, then the rest 13 mL of stock solution
were added and then the volume completed to 500 mL. The beaker was washed with stock
solution due that some of the testing antifoaming agents were soluble in water only when the
LAS was present. Every antifoaming agent tested was added into different working solutions to
make up concentrations ranging from 10 to 2000 mg/L.
A.2.3 Procedure
The testing procedure consisted of placing 100 mL of the wastewater containing the anti-
foaming agent in a 1000-mL glass cylinder. The cylinder was graduated in centimeter scale using
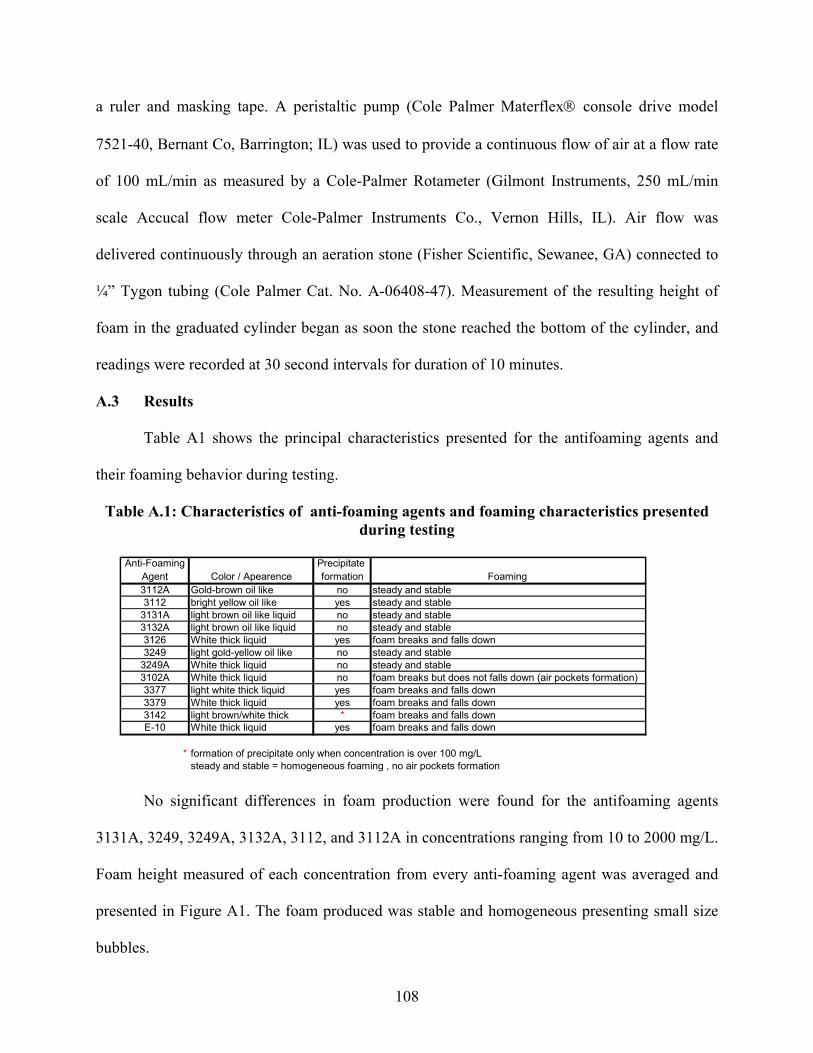
108
a ruler and masking tape. A peristaltic pump (Cole Palmer Materflex console drive model
7521-40, Bernant Co, Barrington; IL) was used to provide a continuous flow of air at a flow rate
of 100 mL/min as measured by a Cole-Palmer Rotameter (Gilmont Instruments, 250 mL/min
scale Accucal flow meter Cole-Palmer Instruments Co., Vernon Hills, IL). Air flow was
delivered continuously through an aeration stone (Fisher Scientific, Sewanee, GA) connected to
¼” Tygon tubing (Cole Palmer Cat. No. A-06408-47). Measurement of the resulting height of
foam in the graduated cylinder began as soon the stone reached the bottom of the cylinder, and
readings were recorded at 30 second intervals for duration of 10 minutes.
A.3 Results
Table A1 shows the principal characteristics presented for the antifoaming agents and
their foaming behavior during testing.
Table A.1: Characteristics of anti-foaming agents and foaming characteristics presented during testing
Anti-Foaming Precipitate
Agent Color / Apearence formation Foaming 3112A Gold-brown oil like no steady and stable3112 bright yellow oil like yes steady and stable
3131A light brown oil like liquid no steady and stable3132A light brown oil like liquid no steady and stable3126 White thick liquid yes foam breaks and falls down3249 light gold-yellow oil like no steady and stable
3249A White thick liquid no steady and stable3102A White thick liquid no foam breaks but does not falls down (air pockets formation)3377 light white thick liquid yes foam breaks and falls down3379 White thick liquid yes foam breaks and falls down3142 light brown/white thick * foam breaks and falls downE-10 White thick liquid yes foam breaks and falls down
* formation of precipitate only when concentration is over 100 mg/Lsteady and stable = homogeneous foaming , no air pockets formation
No significant differences in foam production were found for the antifoaming agents
3131A, 3249, 3249A, 3132A, 3112, and 3112A in concentrations ranging from 10 to 2000 mg/L.
Foam height measured of each concentration from every anti-foaming agent was averaged and
presented in Figure A1. The foam produced was stable and homogeneous presenting small size
bubbles.
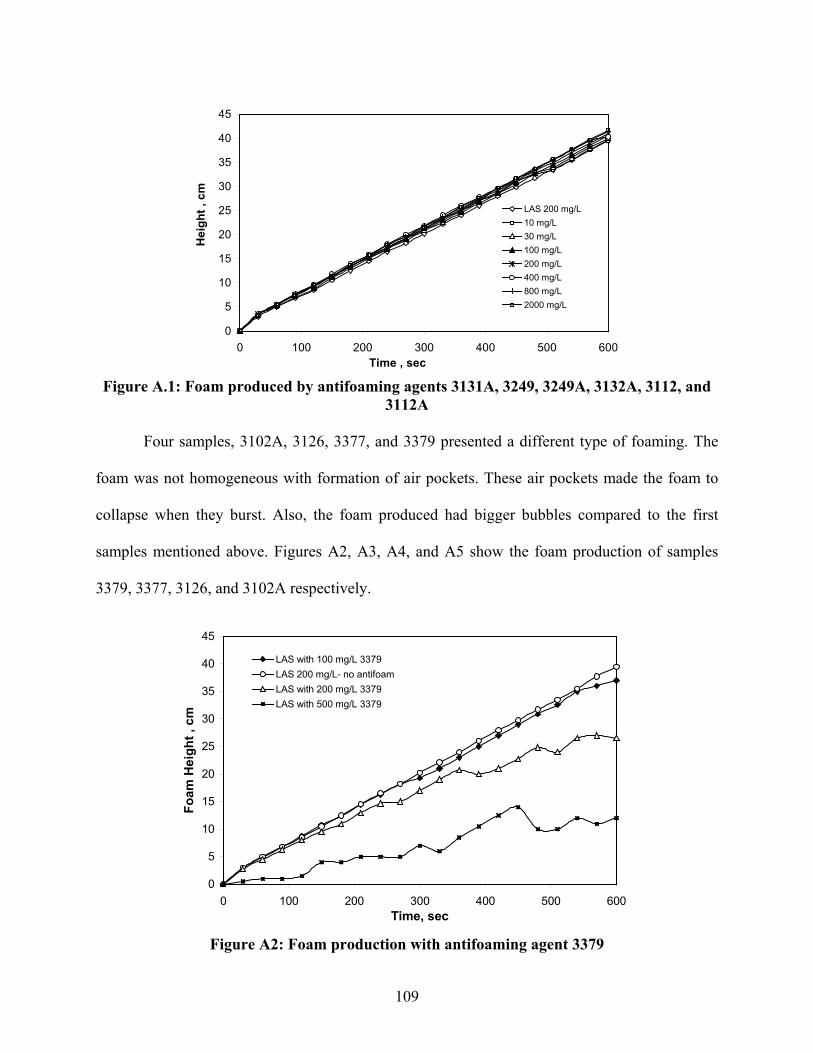
109
0
5
10
15
20
25
30
35
40
45
0 100 200 300 400 500 600Time , sec
Hei
ght ,
cm
LAS 200 mg/L10 mg/L30 mg/L100 mg/L200 mg/L400 mg/L800 mg/L2000 mg/L
Figure A.1: Foam produced by antifoaming agents 3131A, 3249, 3249A, 3132A, 3112, and
3112A
Four samples, 3102A, 3126, 3377, and 3379 presented a different type of foaming. The
foam was not homogeneous with formation of air pockets. These air pockets made the foam to
collapse when they burst. Also, the foam produced had bigger bubbles compared to the first
samples mentioned above. Figures A2, A3, A4, and A5 show the foam production of samples
3379, 3377, 3126, and 3102A respectively.
0
5
10
15
20
25
30
35
40
45
0 100 200 300 400 500 600Time, sec
Foam
Hei
ght ,
cm
LAS with 100 mg/L 3379LAS 200 mg/L- no antifoamLAS with 200 mg/L 3379LAS with 500 mg/L 3379
Figure A2: Foam production with antifoaming agent 3379
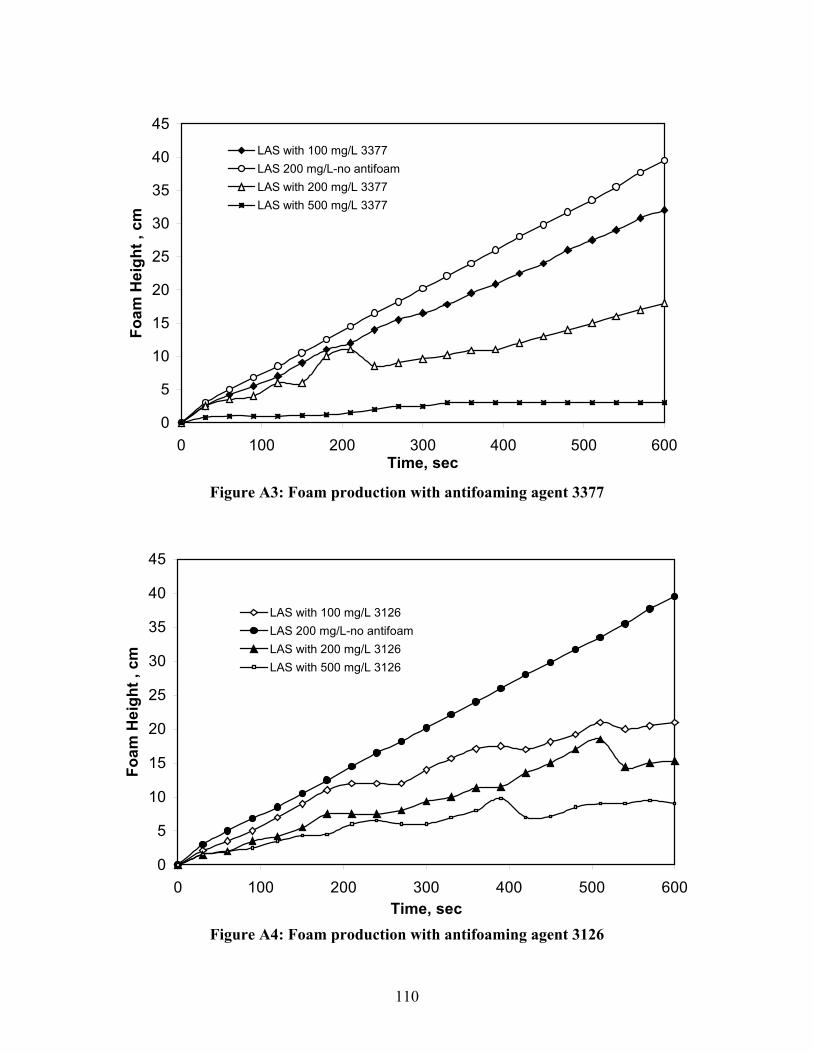
110
0
5
10
15
20
25
30
35
40
45
0 100 200 300 400 500 600Time, sec
Foam
Hei
ght ,
cm
LAS with 100 mg/L 3377LAS 200 mg/L-no antifoamLAS with 200 mg/L 3377LAS with 500 mg/L 3377
Figure A3: Foam production with antifoaming agent 3377
0
5
10
15
20
25
30
35
40
45
0 100 200 300 400 500 600Time, sec
Foam
Hei
ght ,
cm
LAS with 100 mg/L 3126LAS 200 mg/L-no antifoamLAS with 200 mg/L 3126LAS with 500 mg/L 3126
Figure A4: Foam production with antifoaming agent 3126
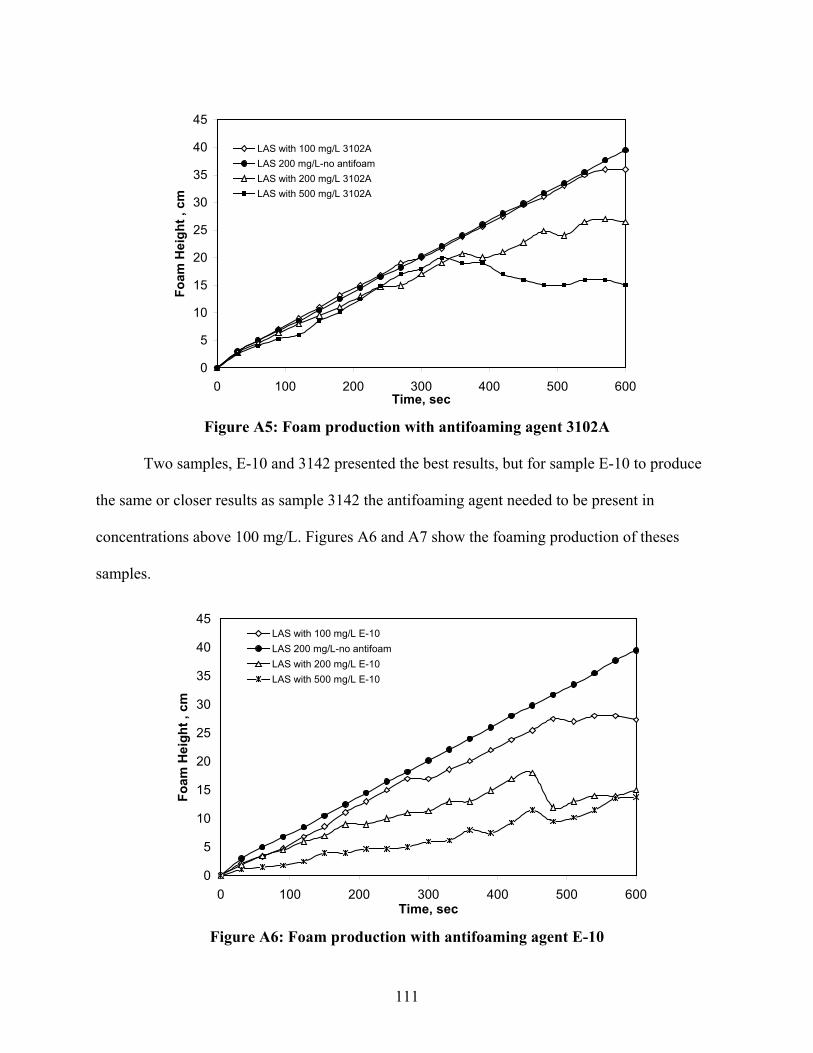
111
0
5
10
15
20
25
30
35
40
45
0 100 200 300 400 500 600Time, sec
Foam
Hei
ght ,
cm
LAS with 100 mg/L 3102ALAS 200 mg/L-no antifoamLAS with 200 mg/L 3102ALAS with 500 mg/L 3102A
Figure A5: Foam production with antifoaming agent 3102A
Two samples, E-10 and 3142 presented the best results, but for sample E-10 to produce
the same or closer results as sample 3142 the antifoaming agent needed to be present in
concentrations above 100 mg/L. Figures A6 and A7 show the foaming production of theses
samples.
0
5
10
15
20
25
30
35
40
45
0 100 200 300 400 500 600Time, sec
Foam
Hei
ght ,
cm
LAS with 100 mg/L E-10LAS 200 mg/L-no antifoamLAS with 200 mg/L E-10LAS with 500 mg/L E-10
Figure A6: Foam production with antifoaming agent E-10
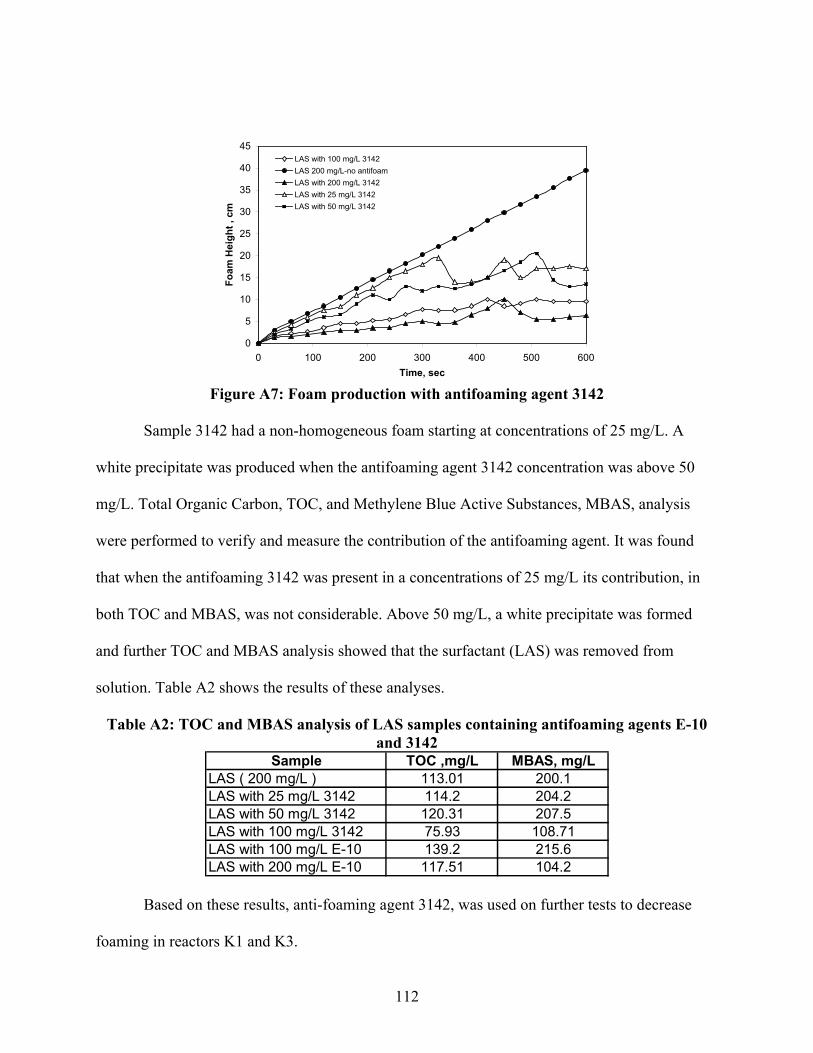
112
0
5
10
15
20
25
30
35
40
45
0 100 200 300 400 500 600Time, sec
Foam
Hei
ght ,
cm
LAS with 100 mg/L 3142LAS 200 mg/L-no antifoamLAS with 200 mg/L 3142LAS with 25 mg/L 3142LAS with 50 mg/L 3142
Figure A7: Foam production with antifoaming agent 3142
Sample 3142 had a non-homogeneous foam starting at concentrations of 25 mg/L. A
white precipitate was produced when the antifoaming agent 3142 concentration was above 50
mg/L. Total Organic Carbon, TOC, and Methylene Blue Active Substances, MBAS, analysis
were performed to verify and measure the contribution of the antifoaming agent. It was found
that when the antifoaming 3142 was present in a concentrations of 25 mg/L its contribution, in
both TOC and MBAS, was not considerable. Above 50 mg/L, a white precipitate was formed
and further TOC and MBAS analysis showed that the surfactant (LAS) was removed from
solution. Table A2 shows the results of these analyses.
Table A2: TOC and MBAS analysis of LAS samples containing antifoaming agents E-10 and 3142
Sample TOC ,mg/L MBAS, mg/LLAS ( 200 mg/L ) 113.01 200.1LAS with 25 mg/L 3142 114.2 204.2LAS with 50 mg/L 3142 120.31 207.5LAS with 100 mg/L 3142 75.93 108.71LAS with 100 mg/L E-10 139.2 215.6LAS with 200 mg/L E-10 117.51 104.2
Based on these results, anti-foaming agent 3142, was used on further tests to decrease
foaming in reactors K1 and K3.
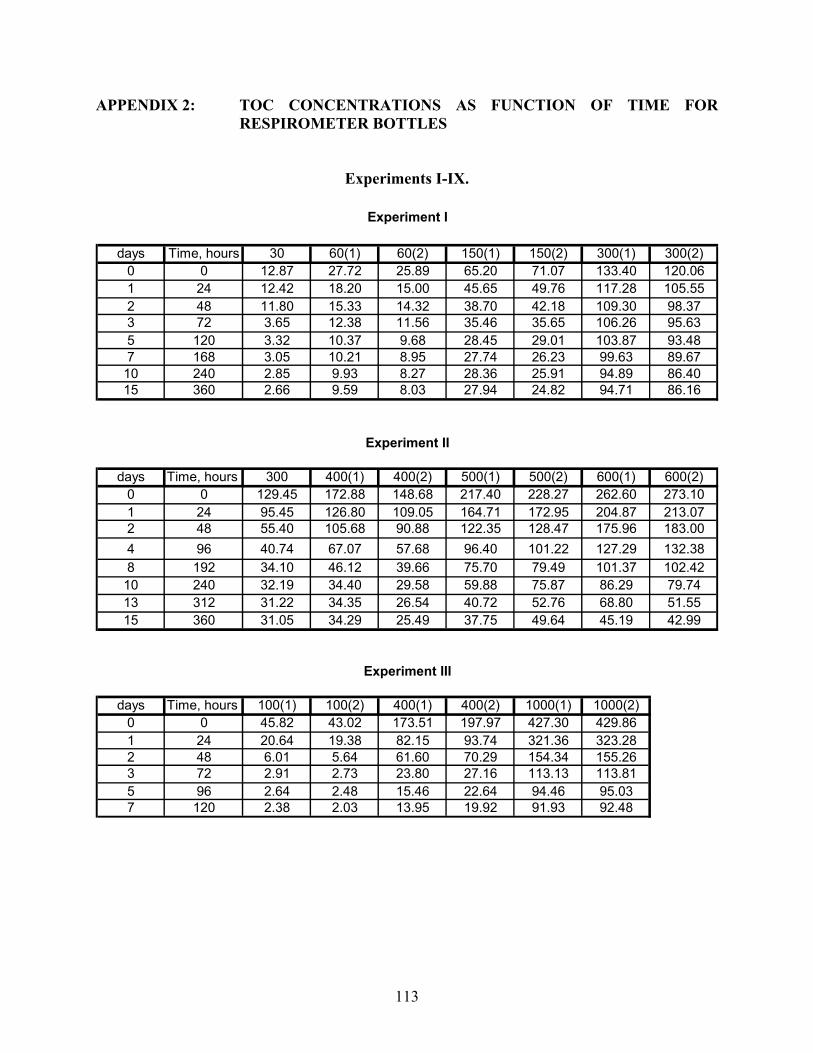
113
APPENDIX 2: TOC CONCENTRATIONS AS FUNCTION OF TIME FOR RESPIROMETER BOTTLES
Experiments I-IX.
days Time, hours 30 60(1) 60(2) 150(1) 150(2) 300(1) 300(2)0 0 12.87 27.72 25.89 65.20 71.07 133.40 120.061 24 12.42 18.20 15.00 45.65 49.76 117.28 105.552 48 11.80 15.33 14.32 38.70 42.18 109.30 98.373 72 3.65 12.38 11.56 35.46 35.65 106.26 95.635 120 3.32 10.37 9.68 28.45 29.01 103.87 93.487 168 3.05 10.21 8.95 27.74 26.23 99.63 89.67
10 240 2.85 9.93 8.27 28.36 25.91 94.89 86.4015 360 2.66 9.59 8.03 27.94 24.82 94.71 86.16
days Time, hours 300 400(1) 400(2) 500(1) 500(2) 600(1) 600(2)0 0 129.45 172.88 148.68 217.40 228.27 262.60 273.101 24 95.45 126.80 109.05 164.71 172.95 204.87 213.072 48 55.40 105.68 90.88 122.35 128.47 175.96 183.004 96 40.74 67.07 57.68 96.40 101.22 127.29 132.388 192 34.10 46.12 39.66 75.70 79.49 101.37 102.42
10 240 32.19 34.40 29.58 59.88 75.87 86.29 79.7413 312 31.22 34.35 26.54 40.72 52.76 68.80 51.5515 360 31.05 34.29 25.49 37.75 49.64 45.19 42.99
days Time, hours 100(1) 100(2) 400(1) 400(2) 1000(1) 1000(2)0 0 45.82 43.02 173.51 197.97 427.30 429.861 24 20.64 19.38 82.15 93.74 321.36 323.282 48 6.01 5.64 61.60 70.29 154.34 155.263 72 2.91 2.73 23.80 27.16 113.13 113.815 96 2.64 2.48 15.46 22.64 94.46 95.037 120 2.38 2.03 13.95 19.92 91.93 92.48
Experiment I
Experiment II
Experiment III
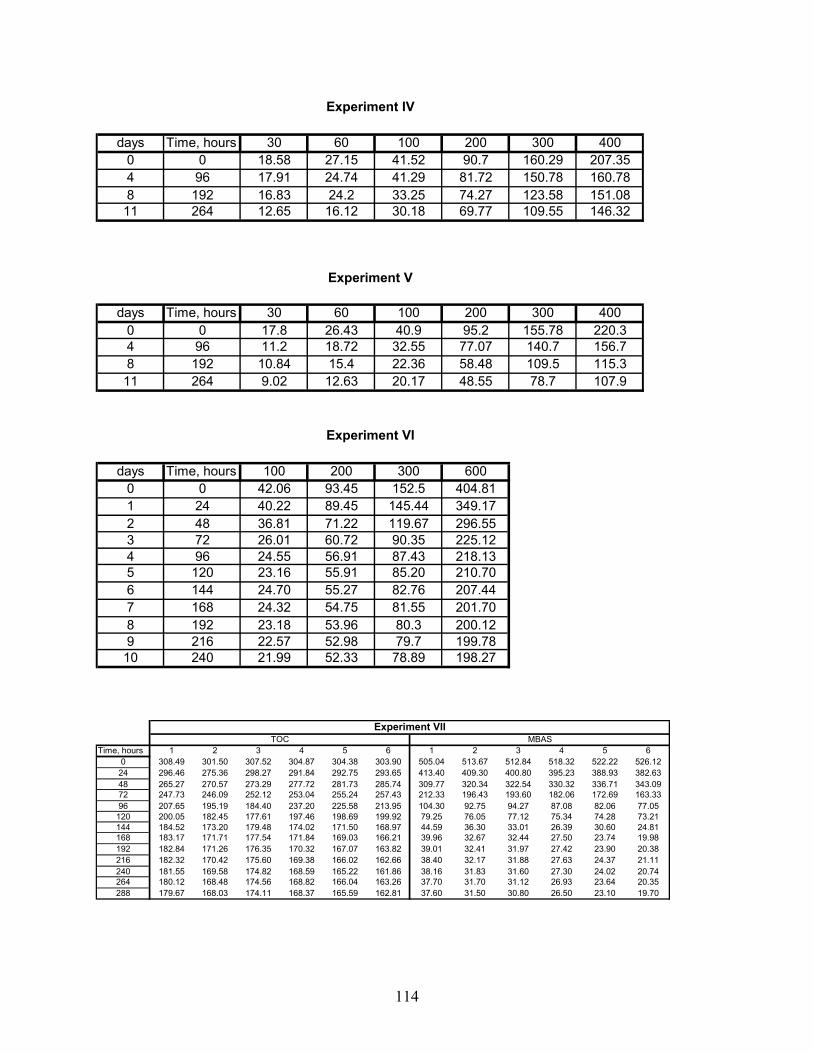
114
days Time, hours 30 60 100 200 300 4000 0 18.58 27.15 41.52 90.7 160.29 207.354 96 17.91 24.74 41.29 81.72 150.78 160.788 192 16.83 24.2 33.25 74.27 123.58 151.0811 264 12.65 16.12 30.18 69.77 109.55 146.32
days Time, hours 30 60 100 200 300 4000 0 17.8 26.43 40.9 95.2 155.78 220.34 96 11.2 18.72 32.55 77.07 140.7 156.78 192 10.84 15.4 22.36 58.48 109.5 115.311 264 9.02 12.63 20.17 48.55 78.7 107.9
days Time, hours 100 200 300 6000 0 42.06 93.45 152.5 404.811 24 40.22 89.45 145.44 349.172 48 36.81 71.22 119.67 296.553 72 26.01 60.72 90.35 225.124 96 24.55 56.91 87.43 218.135 120 23.16 55.91 85.20 210.706 144 24.70 55.27 82.76 207.447 168 24.32 54.75 81.55 201.708 192 23.18 53.96 80.3 200.129 216 22.57 52.98 79.7 199.7810 240 21.99 52.33 78.89 198.27
Experiment IV
Experiment V
Experiment VI
Time, hours 1 2 3 4 5 6 1 2 3 4 5 60 308.49 301.50 307.52 304.87 304.38 303.90 505.04 513.67 512.84 518.32 522.22 526.12
24 296.46 275.36 298.27 291.84 292.75 293.65 413.40 409.30 400.80 395.23 388.93 382.6348 265.27 270.57 273.29 277.72 281.73 285.74 309.77 320.34 322.54 330.32 336.71 343.0972 247.73 246.09 252.12 253.04 255.24 257.43 212.33 196.43 193.60 182.06 172.69 163.3396 207.65 195.19 184.40 237.20 225.58 213.95 104.30 92.75 94.27 87.08 82.06 77.05
120 200.05 182.45 177.61 197.46 198.69 199.92 79.25 76.05 77.12 75.34 74.28 73.21144 184.52 173.20 179.48 174.02 171.50 168.97 44.59 36.30 33.01 26.39 30.60 24.81168 183.17 171.71 177.54 171.84 169.03 166.21 39.96 32.67 32.44 27.50 23.74 19.98192 182.84 171.26 176.35 170.32 167.07 163.82 39.01 32.41 31.97 27.42 23.90 20.38216 182.32 170.42 175.60 169.38 166.02 162.66 38.40 32.17 31.88 27.63 24.37 21.11240 181.55 169.58 174.82 168.59 165.22 161.86 38.16 31.83 31.60 27.30 24.02 20.74264 180.12 168.48 174.56 168.82 166.04 163.26 37.70 31.70 31.12 26.93 23.64 20.35288 179.67 168.03 174.11 168.37 165.59 162.81 37.60 31.50 30.80 26.50 23.10 19.70
Experiment VIITOC MBAS
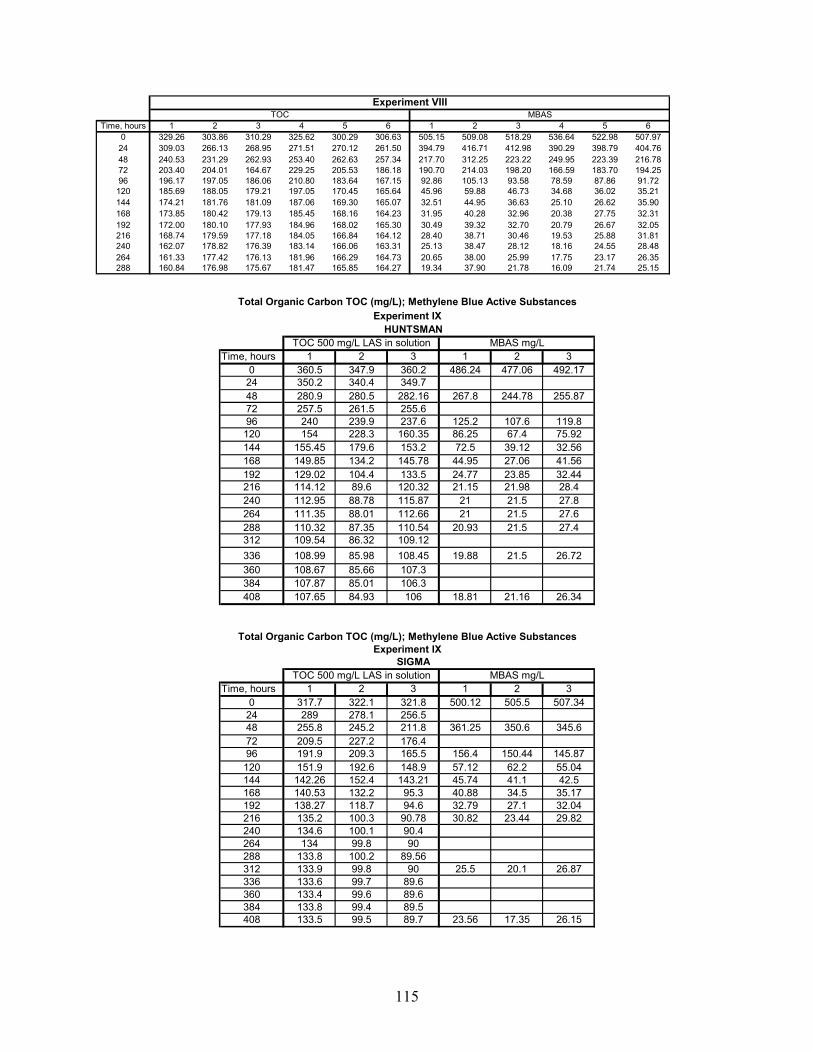
115
Time, hours 1 2 3 4 5 6 1 2 3 4 5 60 329.26 303.86 310.29 325.62 300.29 306.63 505.15 509.08 518.29 536.64 522.98 507.97
24 309.03 266.13 268.95 271.51 270.12 261.50 394.79 416.71 412.98 390.29 398.79 404.7648 240.53 231.29 262.93 253.40 262.63 257.34 217.70 312.25 223.22 249.95 223.39 216.7872 203.40 204.01 164.67 229.25 205.53 186.18 190.70 214.03 198.20 166.59 183.70 194.2596 196.17 197.05 186.06 210.80 183.64 167.15 92.86 105.13 93.58 78.59 87.86 91.72
120 185.69 188.05 179.21 197.05 170.45 165.64 45.96 59.88 46.73 34.68 36.02 35.21144 174.21 181.76 181.09 187.06 169.30 165.07 32.51 44.95 36.63 25.10 26.62 35.90168 173.85 180.42 179.13 185.45 168.16 164.23 31.95 40.28 32.96 20.38 27.75 32.31192 172.00 180.10 177.93 184.96 168.02 165.30 30.49 39.32 32.70 20.79 26.67 32.05216 168.74 179.59 177.18 184.05 166.84 164.12 28.40 38.71 30.46 19.53 25.88 31.81240 162.07 178.82 176.39 183.14 166.06 163.31 25.13 38.47 28.12 18.16 24.55 28.48264 161.33 177.42 176.13 181.96 166.29 164.73 20.65 38.00 25.99 17.75 23.17 26.35288 160.84 176.98 175.67 181.47 165.85 164.27 19.34 37.90 21.78 16.09 21.74 25.15
TOC MBASExperiment VIII
HUNTSMAN
Time, hours 1 2 3 1 2 30 360.5 347.9 360.2 486.24 477.06 492.17
24 350.2 340.4 349.748 280.9 280.5 282.16 267.8 244.78 255.8772 257.5 261.5 255.696 240 239.9 237.6 125.2 107.6 119.8120 154 228.3 160.35 86.25 67.4 75.92144 155.45 179.6 153.2 72.5 39.12 32.56168 149.85 134.2 145.78 44.95 27.06 41.56192 129.02 104.4 133.5 24.77 23.85 32.44216 114.12 89.6 120.32 21.15 21.98 28.4240 112.95 88.78 115.87 21 21.5 27.8264 111.35 88.01 112.66 21 21.5 27.6288 110.32 87.35 110.54 20.93 21.5 27.4312 109.54 86.32 109.12336 108.99 85.98 108.45 19.88 21.5 26.72360 108.67 85.66 107.3384 107.87 85.01 106.3408 107.65 84.93 106 18.81 21.16 26.34
SIGMA
Time, hours 1 2 3 1 2 30 317.7 322.1 321.8 500.12 505.5 507.34
24 289 278.1 256.548 255.8 245.2 211.8 361.25 350.6 345.672 209.5 227.2 176.496 191.9 209.3 165.5 156.4 150.44 145.87120 151.9 192.6 148.9 57.12 62.2 55.04144 142.26 152.4 143.21 45.74 41.1 42.5168 140.53 132.2 95.3 40.88 34.5 35.17192 138.27 118.7 94.6 32.79 27.1 32.04216 135.2 100.3 90.78 30.82 23.44 29.82240 134.6 100.1 90.4264 134 99.8 90288 133.8 100.2 89.56312 133.9 99.8 90 25.5 20.1 26.87336 133.6 99.7 89.6360 133.4 99.6 89.6384 133.8 99.4 89.5408 133.5 99.5 89.7 23.56 17.35 26.15
Total Organic Carbon TOC (mg/L); Methylene Blue Active SubstancesExperiment IX
TOC 500 mg/L LAS in solution MBAS mg/L
Total Organic Carbon TOC (mg/L); Methylene Blue Active SubstancesExperiment IX
TOC 500 mg/L LAS in solution MBAS mg/L
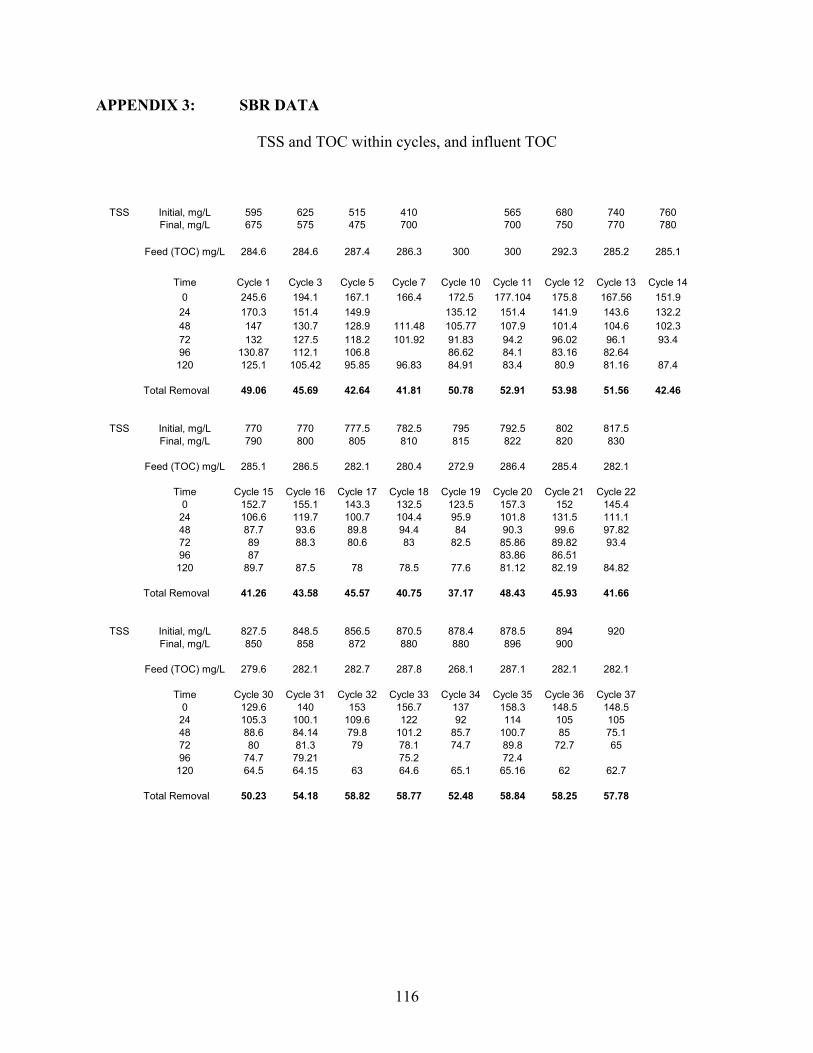
116
APPENDIX 3: SBR DATA
TSS and TOC within cycles, and influent TOC
TSS Initial, mg/L 595 625 515 410 565 680 740 760Final, mg/L 675 575 475 700 700 750 770 780
Feed (TOC) mg/L 284.6 284.6 287.4 286.3 300 300 292.3 285.2 285.1
Time Cycle 1 Cycle 3 Cycle 5 Cycle 7 Cycle 10 Cycle 11 Cycle 12 Cycle 13 Cycle 140 245.6 194.1 167.1 166.4 172.5 177.104 175.8 167.56 151.9
24 170.3 151.4 149.9 135.12 151.4 141.9 143.6 132.248 147 130.7 128.9 111.48 105.77 107.9 101.4 104.6 102.372 132 127.5 118.2 101.92 91.83 94.2 96.02 96.1 93.496 130.87 112.1 106.8 86.62 84.1 83.16 82.64120 125.1 105.42 95.85 96.83 84.91 83.4 80.9 81.16 87.4
Total Removal 49.06 45.69 42.64 41.81 50.78 52.91 53.98 51.56 42.46
TSS Initial, mg/L 770 770 777.5 782.5 795 792.5 802 817.5Final, mg/L 790 800 805 810 815 822 820 830
Feed (TOC) mg/L 285.1 286.5 282.1 280.4 272.9 286.4 285.4 282.1
Time Cycle 15 Cycle 16 Cycle 17 Cycle 18 Cycle 19 Cycle 20 Cycle 21 Cycle 220 152.7 155.1 143.3 132.5 123.5 157.3 152 145.4
24 106.6 119.7 100.7 104.4 95.9 101.8 131.5 111.148 87.7 93.6 89.8 94.4 84 90.3 99.6 97.8272 89 88.3 80.6 83 82.5 85.86 89.82 93.496 87 83.86 86.51120 89.7 87.5 78 78.5 77.6 81.12 82.19 84.82
Total Removal 41.26 43.58 45.57 40.75 37.17 48.43 45.93 41.66
TSS Initial, mg/L 827.5 848.5 856.5 870.5 878.4 878.5 894 920Final, mg/L 850 858 872 880 880 896 900
Feed (TOC) mg/L 279.6 282.1 282.7 287.8 268.1 287.1 282.1 282.1
Time Cycle 30 Cycle 31 Cycle 32 Cycle 33 Cycle 34 Cycle 35 Cycle 36 Cycle 370 129.6 140 153 156.7 137 158.3 148.5 148.5
24 105.3 100.1 109.6 122 92 114 105 10548 88.6 84.14 79.8 101.2 85.7 100.7 85 75.172 80 81.3 79 78.1 74.7 89.8 72.7 6596 74.7 79.21 75.2 72.4120 64.5 64.15 63 64.6 65.1 65.16 62 62.7
Total Removal 50.23 54.18 58.82 58.77 52.48 58.84 58.25 57.78
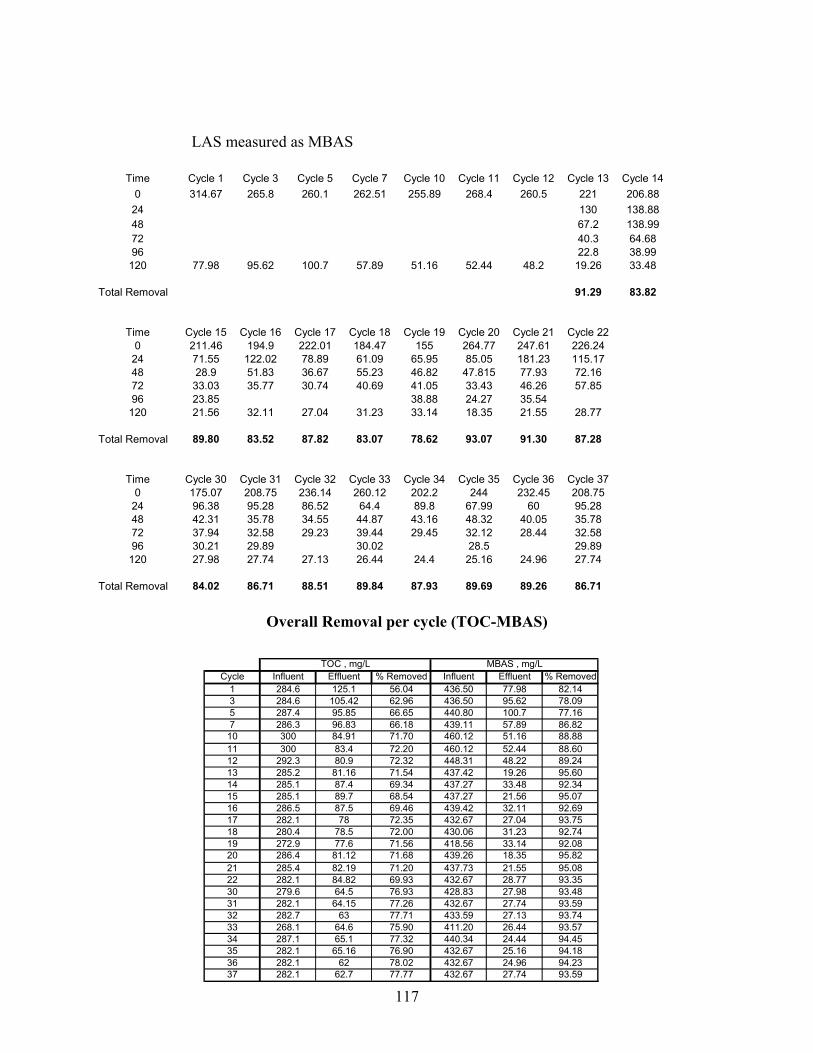
117
LAS measured as MBAS
Time Cycle 1 Cycle 3 Cycle 5 Cycle 7 Cycle 10 Cycle 11 Cycle 12 Cycle 13 Cycle 140 314.67 265.8 260.1 262.51 255.89 268.4 260.5 221 206.88
24 130 138.8848 67.2 138.9972 40.3 64.6896 22.8 38.99120 77.98 95.62 100.7 57.89 51.16 52.44 48.2 19.26 33.48
Total Removal 91.29 83.82
Time Cycle 15 Cycle 16 Cycle 17 Cycle 18 Cycle 19 Cycle 20 Cycle 21 Cycle 220 211.46 194.9 222.01 184.47 155 264.77 247.61 226.24
24 71.55 122.02 78.89 61.09 65.95 85.05 181.23 115.1748 28.9 51.83 36.67 55.23 46.82 47.815 77.93 72.1672 33.03 35.77 30.74 40.69 41.05 33.43 46.26 57.8596 23.85 38.88 24.27 35.54120 21.56 32.11 27.04 31.23 33.14 18.35 21.55 28.77
Total Removal 89.80 83.52 87.82 83.07 78.62 93.07 91.30 87.28
Time Cycle 30 Cycle 31 Cycle 32 Cycle 33 Cycle 34 Cycle 35 Cycle 36 Cycle 370 175.07 208.75 236.14 260.12 202.2 244 232.45 208.75
24 96.38 95.28 86.52 64.4 89.8 67.99 60 95.2848 42.31 35.78 34.55 44.87 43.16 48.32 40.05 35.7872 37.94 32.58 29.23 39.44 29.45 32.12 28.44 32.5896 30.21 29.89 30.02 28.5 29.89120 27.98 27.74 27.13 26.44 24.4 25.16 24.96 27.74
Total Removal 84.02 86.71 88.51 89.84 87.93 89.69 89.26 86.71
Overall Removal per cycle (TOC-MBAS)
Cycle Influent Effluent % Removed Influent Effluent % Removed1 284.6 125.1 56.04 436.50 77.98 82.143 284.6 105.42 62.96 436.50 95.62 78.095 287.4 95.85 66.65 440.80 100.7 77.167 286.3 96.83 66.18 439.11 57.89 86.8210 300 84.91 71.70 460.12 51.16 88.8811 300 83.4 72.20 460.12 52.44 88.6012 292.3 80.9 72.32 448.31 48.22 89.2413 285.2 81.16 71.54 437.42 19.26 95.6014 285.1 87.4 69.34 437.27 33.48 92.3415 285.1 89.7 68.54 437.27 21.56 95.0716 286.5 87.5 69.46 439.42 32.11 92.6917 282.1 78 72.35 432.67 27.04 93.7518 280.4 78.5 72.00 430.06 31.23 92.7419 272.9 77.6 71.56 418.56 33.14 92.0820 286.4 81.12 71.68 439.26 18.35 95.8221 285.4 82.19 71.20 437.73 21.55 95.0822 282.1 84.82 69.93 432.67 28.77 93.3530 279.6 64.5 76.93 428.83 27.98 93.4831 282.1 64.15 77.26 432.67 27.74 93.5932 282.7 63 77.71 433.59 27.13 93.7433 268.1 64.6 75.90 411.20 26.44 93.5734 287.1 65.1 77.32 440.34 24.44 94.4535 282.1 65.16 76.90 432.67 25.16 94.1836 282.1 62 78.02 432.67 24.96 94.2337 282.1 62.7 77.77 432.67 27.74 93.59
TOC , mg/L MBAS , mg/L
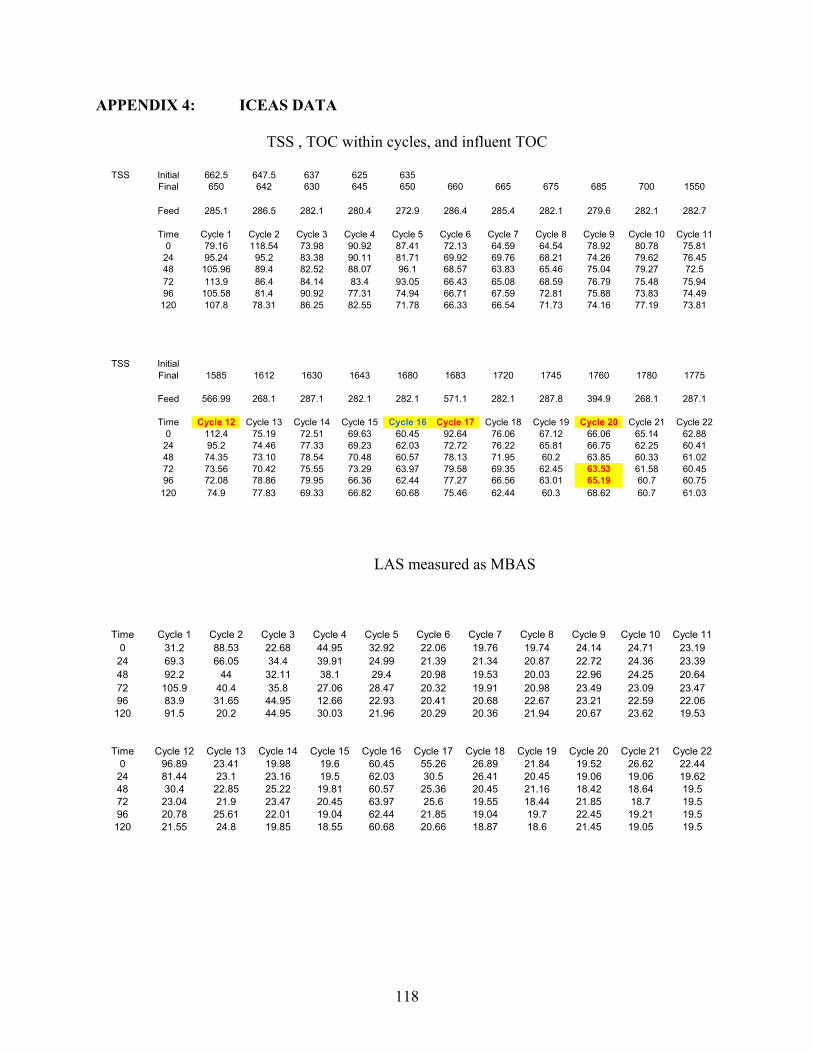
118
APPENDIX 4: ICEAS DATA
TSS , TOC within cycles, and influent TOC
TSS Initial 662.5 647.5 637 625 635Final 650 642 630 645 650 660 665 675 685 700 1550
Feed 285.1 286.5 282.1 280.4 272.9 286.4 285.4 282.1 279.6 282.1 282.7
Time Cycle 1 Cycle 2 Cycle 3 Cycle 4 Cycle 5 Cycle 6 Cycle 7 Cycle 8 Cycle 9 Cycle 10 Cycle 110 79.16 118.54 73.98 90.92 87.41 72.13 64.59 64.54 78.92 80.78 75.81
24 95.24 95.2 83.38 90.11 81.71 69.92 69.76 68.21 74.26 79.62 76.4548 105.96 89.4 82.52 88.07 96.1 68.57 63.83 65.46 75.04 79.27 72.572 113.9 86.4 84.14 83.4 93.05 66.43 65.08 68.59 76.79 75.48 75.9496 105.58 81.4 90.92 77.31 74.94 66.71 67.59 72.81 75.88 73.83 74.49120 107.8 78.31 86.25 82.55 71.78 66.33 66.54 71.73 74.16 77.19 73.81
TSS InitialFinal 1585 1612 1630 1643 1680 1683 1720 1745 1760 1780 1775
Feed 566.99 268.1 287.1 282.1 282.1 571.1 282.1 287.8 394.9 268.1 287.1
Time Cycle 12 Cycle 13 Cycle 14 Cycle 15 Cycle 16 Cycle 17 Cycle 18 Cycle 19 Cycle 20 Cycle 21 Cycle 220 112.4 75.19 72.51 69.63 60.45 92.64 76.06 67.12 66.06 65.14 62.88
24 95.2 74.46 77.33 69.23 62.03 72.72 76.22 65.81 66.75 62.25 60.4148 74.35 73.10 78.54 70.48 60.57 78.13 71.95 60.2 63.85 60.33 61.0272 73.56 70.42 75.55 73.29 63.97 79.58 69.35 62.45 63.53 61.58 60.4596 72.08 78.86 79.95 66.36 62.44 77.27 66.56 63.01 65.19 60.7 60.75120 74.9 77.83 69.33 66.82 60.68 75.46 62.44 60.3 68.62 60.7 61.03
LAS measured as MBAS
Time Cycle 1 Cycle 2 Cycle 3 Cycle 4 Cycle 5 Cycle 6 Cycle 7 Cycle 8 Cycle 9 Cycle 10 Cycle 110 31.2 88.53 22.68 44.95 32.92 22.06 19.76 19.74 24.14 24.71 23.19
24 69.3 66.05 34.4 39.91 24.99 21.39 21.34 20.87 22.72 24.36 23.3948 92.2 44 32.11 38.1 29.4 20.98 19.53 20.03 22.96 24.25 20.6472 105.9 40.4 35.8 27.06 28.47 20.32 19.91 20.98 23.49 23.09 23.4796 83.9 31.65 44.95 12.66 22.93 20.41 20.68 22.67 23.21 22.59 22.06120 91.5 20.2 44.95 30.03 21.96 20.29 20.36 21.94 20.67 23.62 19.53
Time Cycle 12 Cycle 13 Cycle 14 Cycle 15 Cycle 16 Cycle 17 Cycle 18 Cycle 19 Cycle 20 Cycle 21 Cycle 220 96.89 23.41 19.98 19.6 60.45 55.26 26.89 21.84 19.52 26.62 22.44
24 81.44 23.1 23.16 19.5 62.03 30.5 26.41 20.45 19.06 19.06 19.6248 30.4 22.85 25.22 19.81 60.57 25.36 20.45 21.16 18.42 18.64 19.572 23.04 21.9 23.47 20.45 63.97 25.6 19.55 18.44 21.85 18.7 19.596 20.78 25.61 22.01 19.04 62.44 21.85 19.04 19.7 22.45 19.21 19.5120 21.55 24.8 19.85 18.55 60.68 20.66 18.87 18.6 21.45 19.05 19.5
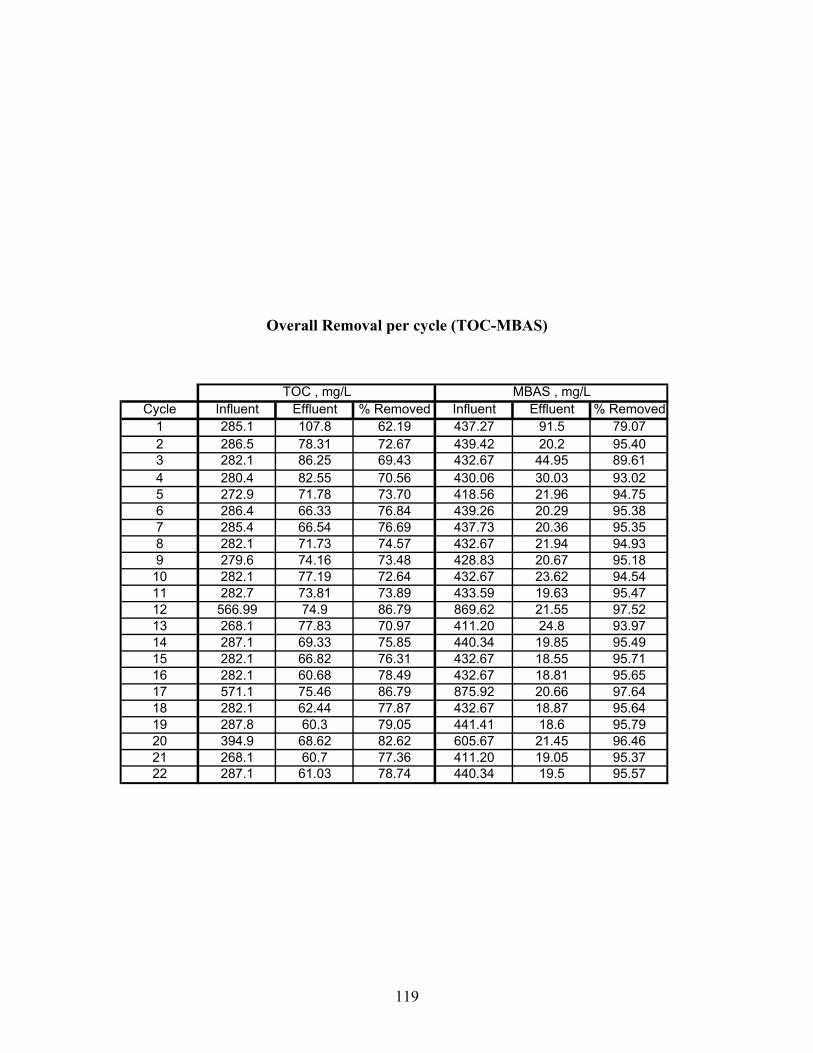
119
Overall Removal per cycle (TOC-MBAS)
Cycle Influent Effluent % Removed Influent Effluent % Removed1 285.1 107.8 62.19 437.27 91.5 79.072 286.5 78.31 72.67 439.42 20.2 95.403 282.1 86.25 69.43 432.67 44.95 89.614 280.4 82.55 70.56 430.06 30.03 93.025 272.9 71.78 73.70 418.56 21.96 94.756 286.4 66.33 76.84 439.26 20.29 95.387 285.4 66.54 76.69 437.73 20.36 95.358 282.1 71.73 74.57 432.67 21.94 94.939 279.6 74.16 73.48 428.83 20.67 95.1810 282.1 77.19 72.64 432.67 23.62 94.5411 282.7 73.81 73.89 433.59 19.63 95.4712 566.99 74.9 86.79 869.62 21.55 97.5213 268.1 77.83 70.97 411.20 24.8 93.9714 287.1 69.33 75.85 440.34 19.85 95.4915 282.1 66.82 76.31 432.67 18.55 95.7116 282.1 60.68 78.49 432.67 18.81 95.6517 571.1 75.46 86.79 875.92 20.66 97.6418 282.1 62.44 77.87 432.67 18.87 95.6419 287.8 60.3 79.05 441.41 18.6 95.7920 394.9 68.62 82.62 605.67 21.45 96.4621 268.1 60.7 77.36 411.20 19.05 95.3722 287.1 61.03 78.74 440.34 19.5 95.57
TOC , mg/L MBAS , mg/L
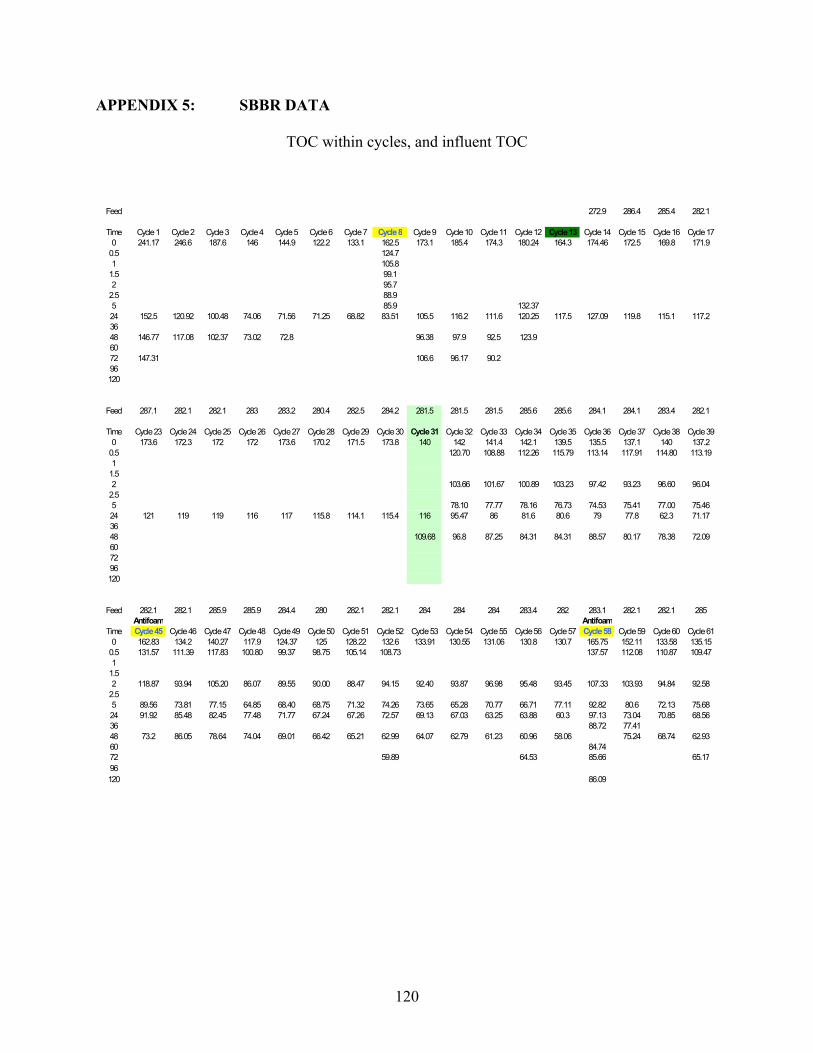
120
APPENDIX 5: SBBR DATA
TOC within cycles, and influent TOC
Feed 272.9 286.4 285.4 282.1
Time Cycle 1 Cycle 2 Cycle 3 Cycle 4 Cycle 5 Cycle 6 Cycle 7 Cycle 8 Cycle 9 Cycle 10 Cycle 11 Cycle 12 Cycle 13 Cycle 14 Cycle 15 Cycle 16 Cycle 170 241.17 246.6 187.6 146 144.9 122.2 133.1 162.5 173.1 185.4 174.3 180.24 164.3 174.46 172.5 169.8 171.9
0.5 124.71 105.8
1.5 99.12 95.7
2.5 88.95 85.9 132.3724 152.5 120.92 100.48 74.06 71.56 71.25 68.82 83.51 105.5 116.2 111.6 120.25 117.5 127.09 119.8 115.1 117.23648 146.77 117.08 102.37 73.02 72.8 96.38 97.9 92.5 123.96072 147.31 106.6 96.17 90.296120
Feed 287.1 282.1 282.1 283 283.2 280.4 282.5 284.2 281.5 281.5 281.5 285.6 285.6 284.1 284.1 283.4 282.1
Time Cycle 23 Cycle 24 Cycle 25 Cycle 26 Cycle 27 Cycle 28 Cycle 29 Cycle 30 Cycle 31 Cycle 32 Cycle 33 Cycle 34 Cycle 35 Cycle 36 Cycle 37 Cycle 38 Cycle 390 173.6 172.3 172 172 173.6 170.2 171.5 173.8 140 142 141.4 142.1 139.5 135.5 137.1 140 137.2
0.5 120.70 108.88 112.26 115.79 113.14 117.91 114.80 113.191
1.52 103.66 101.67 100.89 103.23 97.42 93.23 96.60 96.04
2.55 78.10 77.77 78.16 76.73 74.53 75.41 77.00 75.4624 121 119 119 116 117 115.8 114.1 115.4 116 95.47 86 81.6 80.6 79 77.8 62.3 71.173648 109.68 96.8 87.25 84.31 84.31 88.57 80.17 78.38 72.09607296120
Feed 282.1 282.1 285.9 285.9 284.4 280 282.1 282.1 284 284 284 283.4 282 283.1 282.1 282.1 285Antifoam Antifoam
Time Cycle 45 Cycle 46 Cycle 47 Cycle 48 Cycle 49 Cycle 50 Cycle 51 Cycle 52 Cycle 53 Cycle 54 Cycle 55 Cycle 56 Cycle 57 Cycle 58 Cycle 59 Cycle 60 Cycle 610 162.83 134.2 140.27 117.9 124.37 125 128.22 132.6 133.91 130.55 131.06 130.8 130.7 165.75 152.11 133.58 135.15
0.5 131.57 111.39 117.83 100.80 99.37 98.75 105.14 108.73 137.57 112.08 110.87 109.471
1.52 118.87 93.94 105.20 86.07 89.55 90.00 88.47 94.15 92.40 93.87 96.98 95.48 93.45 107.33 103.93 94.84 92.58
2.55 89.56 73.81 77.15 64.85 68.40 68.75 71.32 74.26 73.65 65.28 70.77 66.71 77.11 92.82 80.6 72.13 75.6824 91.92 85.48 82.45 77.48 71.77 67.24 67.26 72.57 69.13 67.03 63.25 63.88 60.3 97.13 73.04 70.85 68.5636 88.72 77.4148 73.2 86.05 78.64 74.04 69.01 66.42 65.21 62.99 64.07 62.79 61.23 60.96 58.06 75.24 68.74 62.9360 84.7472 59.89 64.53 85.66 65.1796120 86.09
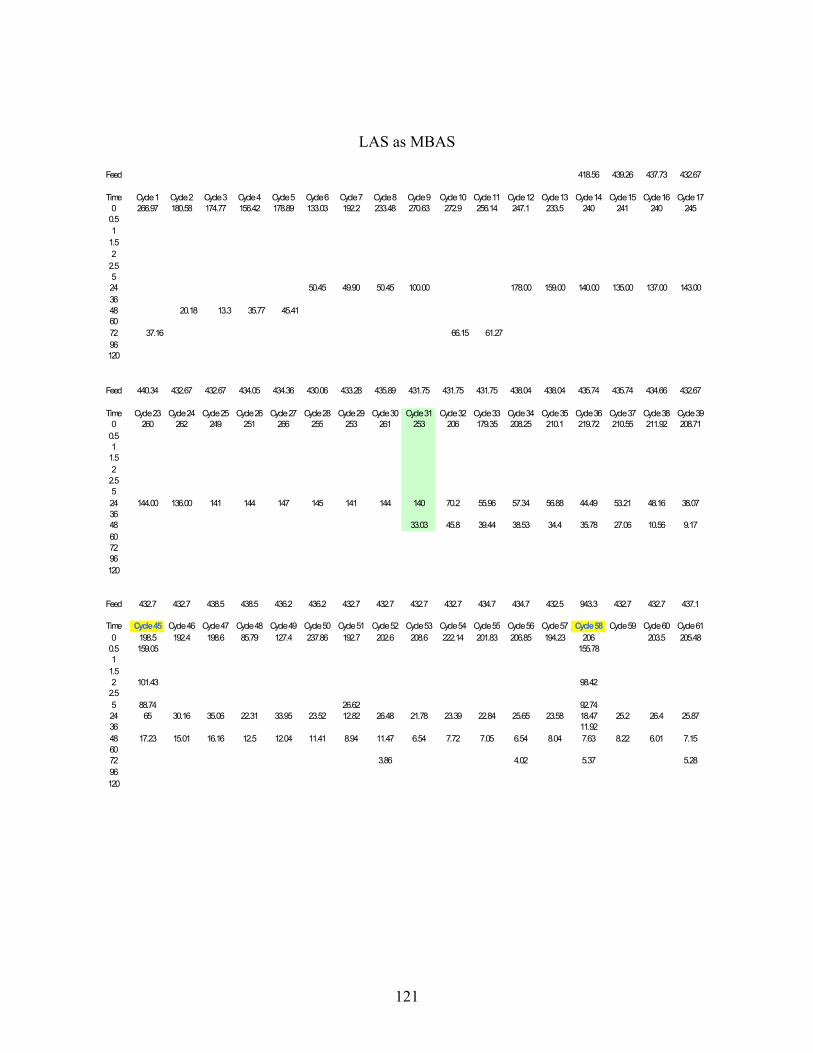
121
LAS as MBAS
Feed 418.56 439.26 437.73 432.67
Time Cycle 1 Cycle 2 Cycle 3 Cycle 4 Cycle 5 Cycle 6 Cycle 7 Cycle 8 Cycle 9 Cycle 10 Cycle 11 Cycle 12 Cycle 13 Cycle 14 Cycle 15 Cycle 16 Cycle 170 266.97 180.58 174.77 156.42 178.89 133.03 192.2 233.48 270.63 272.9 256.14 247.1 233.5 240 241 240 245
0.51
1.52
2.5524 50.45 49.90 50.45 100.00 178.00 159.00 140.00 135.00 137.00 143.003648 20.18 13.3 35.77 45.416072 37.16 66.15 61.2796120
Feed 440.34 432.67 432.67 434.05 434.36 430.06 433.28 435.89 431.75 431.75 431.75 438.04 438.04 435.74 435.74 434.66 432.67
Time Cycle 23 Cycle 24 Cycle 25 Cycle 26 Cycle 27 Cycle 28 Cycle 29 Cycle 30 Cycle 31 Cycle 32 Cycle 33 Cycle 34 Cycle 35 Cycle 36 Cycle 37 Cycle 38 Cycle 390 260 262 249 251 266 255 253 261 253 206 179.35 208.25 210.1 219.72 210.55 211.92 208.71
0.51
1.52
2.5524 144.00 136.00 141 144 147 145 141 144 140 70.2 55.96 57.34 56.88 44.49 53.21 48.16 38.073648 33.03 45.8 39.44 38.53 34.4 35.78 27.06 10.56 9.17607296120
Feed 432.7 432.7 438.5 438.5 436.2 436.2 432.7 432.7 432.7 432.7 434.7 434.7 432.5 943.3 432.7 432.7 437.1
Time Cycle 45 Cycle 46 Cycle 47 Cycle 48 Cycle 49 Cycle 50 Cycle 51 Cycle 52 Cycle 53 Cycle 54 Cycle 55 Cycle 56 Cycle 57 Cycle 58 Cycle 59 Cycle 60 Cycle 610 198.5 192.4 198.6 85.79 127.4 237.86 192.7 202.6 208.6 222.14 201.83 206.85 194.23 206 203.5 205.48
0.5 159.05 155.781
1.52 101.43 98.42
2.55 88.74 26.62 92.7424 65 30.16 35.06 22.31 33.95 23.52 12.82 26.48 21.78 23.39 22.84 25.65 23.58 18.47 25.2 26.4 25.8736 11.9248 17.23 15.01 16.16 12.5 12.04 11.41 8.94 11.47 6.54 7.72 7.05 6.54 8.04 7.63 8.22 6.01 7.156072 3.86 4.02 5.37 5.2896120
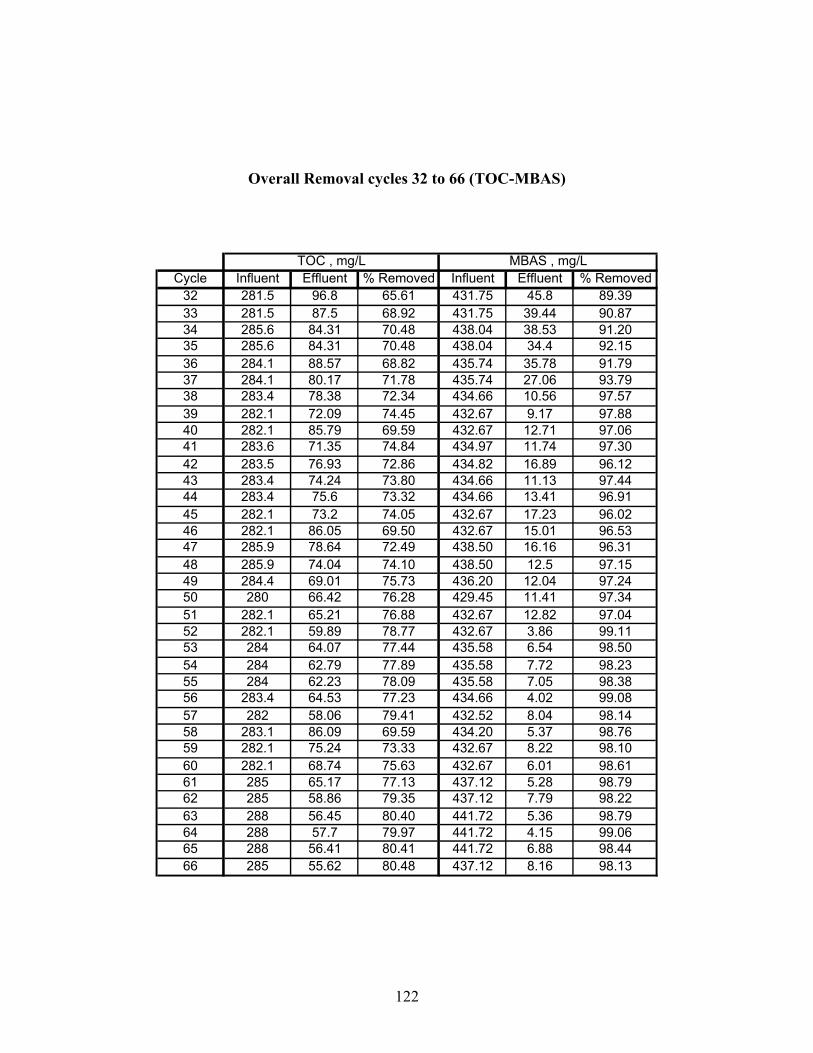
122
Overall Removal cycles 32 to 66 (TOC-MBAS)
Cycle Influent Effluent % Removed Influent Effluent % Removed32 281.5 96.8 65.61 431.75 45.8 89.3933 281.5 87.5 68.92 431.75 39.44 90.8734 285.6 84.31 70.48 438.04 38.53 91.2035 285.6 84.31 70.48 438.04 34.4 92.1536 284.1 88.57 68.82 435.74 35.78 91.7937 284.1 80.17 71.78 435.74 27.06 93.7938 283.4 78.38 72.34 434.66 10.56 97.5739 282.1 72.09 74.45 432.67 9.17 97.8840 282.1 85.79 69.59 432.67 12.71 97.0641 283.6 71.35 74.84 434.97 11.74 97.3042 283.5 76.93 72.86 434.82 16.89 96.1243 283.4 74.24 73.80 434.66 11.13 97.4444 283.4 75.6 73.32 434.66 13.41 96.9145 282.1 73.2 74.05 432.67 17.23 96.0246 282.1 86.05 69.50 432.67 15.01 96.5347 285.9 78.64 72.49 438.50 16.16 96.3148 285.9 74.04 74.10 438.50 12.5 97.1549 284.4 69.01 75.73 436.20 12.04 97.2450 280 66.42 76.28 429.45 11.41 97.3451 282.1 65.21 76.88 432.67 12.82 97.0452 282.1 59.89 78.77 432.67 3.86 99.1153 284 64.07 77.44 435.58 6.54 98.5054 284 62.79 77.89 435.58 7.72 98.2355 284 62.23 78.09 435.58 7.05 98.3856 283.4 64.53 77.23 434.66 4.02 99.0857 282 58.06 79.41 432.52 8.04 98.1458 283.1 86.09 69.59 434.20 5.37 98.7659 282.1 75.24 73.33 432.67 8.22 98.1060 282.1 68.74 75.63 432.67 6.01 98.6161 285 65.17 77.13 437.12 5.28 98.7962 285 58.86 79.35 437.12 7.79 98.2263 288 56.45 80.40 441.72 5.36 98.7964 288 57.7 79.97 441.72 4.15 99.0665 288 56.41 80.41 441.72 6.88 98.4466 285 55.62 80.48 437.12 8.16 98.13
TOC , mg/L MBAS , mg/L
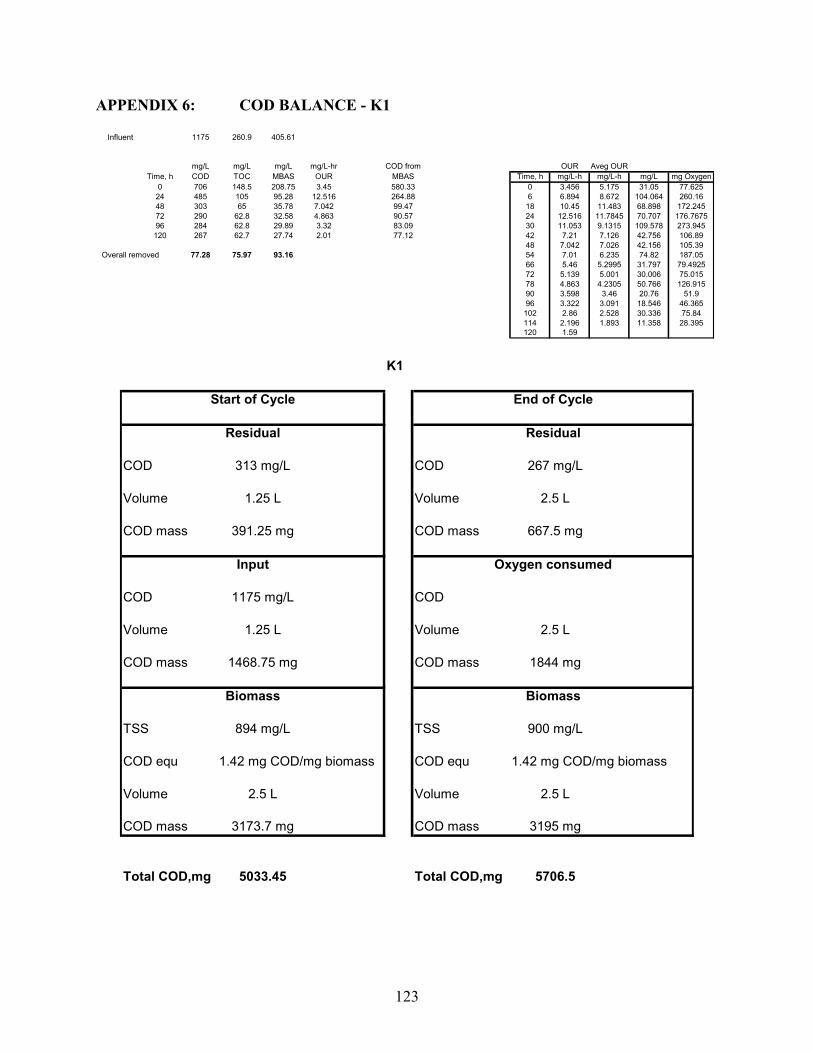
123
APPENDIX 6: COD BALANCE - K1
Influent 1175 260.9 405.61
mg/L mg/L mg/L mg/L-hr COD from OUR Aveg OURTime, h COD TOC MBAS OUR MBAS Time, h mg/L-h mg/L-h mg/L mg Oxygen
0 706 148.5 208.75 3.45 580.33 0 3.456 5.175 31.05 77.62524 485 105 95.28 12.516 264.88 6 6.894 8.672 104.064 260.1648 303 65 35.78 7.042 99.47 18 10.45 11.483 68.898 172.24572 290 62.8 32.58 4.863 90.57 24 12.516 11.7845 70.707 176.767596 284 62.8 29.89 3.32 83.09 30 11.053 9.1315 109.578 273.945120 267 62.7 27.74 2.01 77.12 42 7.21 7.126 42.756 106.89
48 7.042 7.026 42.156 105.39Overall removed 77.28 75.97 93.16 54 7.01 6.235 74.82 187.05
66 5.46 5.2995 31.797 79.492572 5.139 5.001 30.006 75.01578 4.863 4.2305 50.766 126.91590 3.598 3.46 20.76 51.996 3.322 3.091 18.546 46.365102 2.86 2.528 30.336 75.84114 2.196 1.893 11.358 28.395120 1.59
K1
COD 313 mg/L COD 267 mg/L
Volume 1.25 L Volume 2.5 L
COD mass 391.25 mg COD mass 667.5 mg
COD 1175 mg/L COD
Volume 1.25 L Volume 2.5 L
COD mass 1468.75 mg COD mass 1844 mg
TSS 894 mg/L TSS 900 mg/L
COD equ 1.42 mg COD/mg biomass COD equ 1.42 mg COD/mg biomass
Volume 2.5 L Volume 2.5 L
COD mass 3173.7 mg COD mass 3195 mg
Total COD,mg 5033.45 Total COD,mg 5706.5
End of CycleStart of Cycle
Residual
Input
Biomass
Residual
Oxygen consumed
Biomass
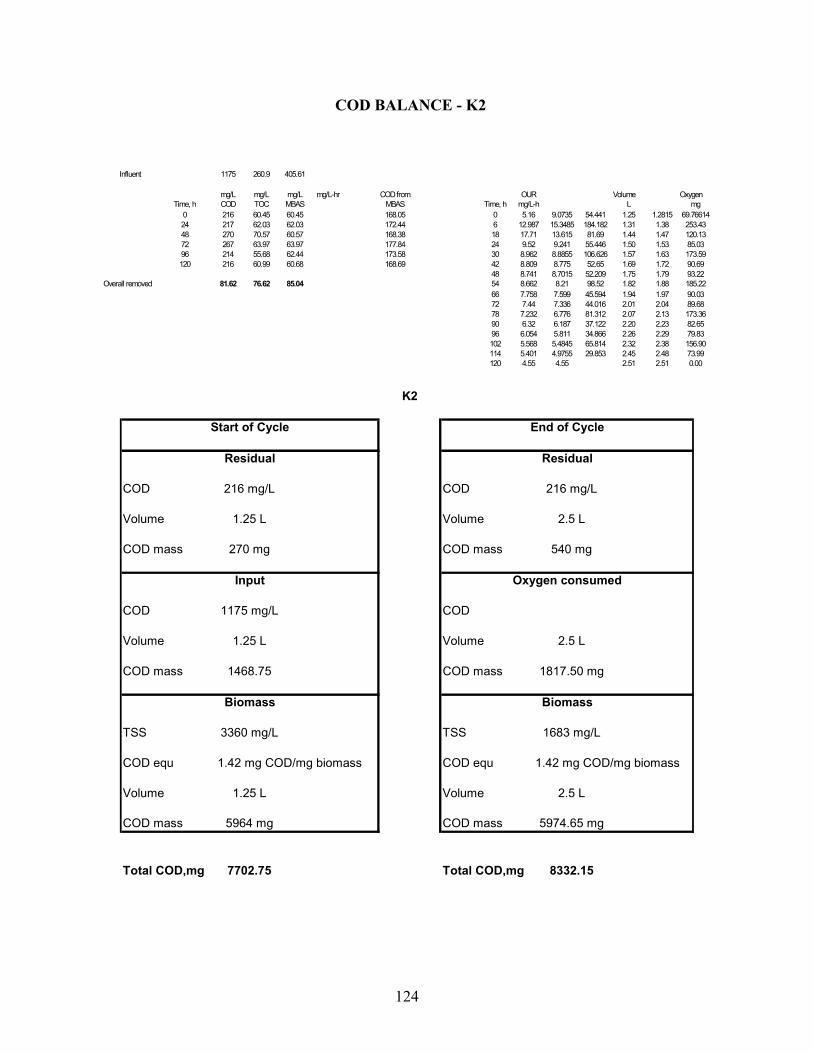
124
COD BALANCE - K2
Influent 1175 260.9 405.61
mg/L mg/L mg/L mg/L-hr COD from OUR Volume OxygenTime, h COD TOC MBAS MBAS Time, h mg/L-h L mg
0 216 60.45 60.45 168.05 0 5.16 9.0735 54.441 1.25 1.2815 69.7661424 217 62.03 62.03 172.44 6 12.987 15.3485 184.182 1.31 1.38 253.4348 270 70.57 60.57 168.38 18 17.71 13.615 81.69 1.44 1.47 120.1372 267 63.97 63.97 177.84 24 9.52 9.241 55.446 1.50 1.53 85.0396 214 55.68 62.44 173.58 30 8.962 8.8855 106.626 1.57 1.63 173.59120 216 60.99 60.68 168.69 42 8.809 8.775 52.65 1.69 1.72 90.69
48 8.741 8.7015 52.209 1.75 1.79 93.22Overall removed 81.62 76.62 85.04 54 8.662 8.21 98.52 1.82 1.88 185.22
66 7.758 7.599 45.594 1.94 1.97 90.0372 7.44 7.336 44.016 2.01 2.04 89.6878 7.232 6.776 81.312 2.07 2.13 173.3690 6.32 6.187 37.122 2.20 2.23 82.6596 6.054 5.811 34.866 2.26 2.29 79.83102 5.568 5.4845 65.814 2.32 2.38 156.90114 5.401 4.9755 29.853 2.45 2.48 73.99120 4.55 4.55 2.51 2.51 0.00
K2
COD 216 mg/L COD 216 mg/L
Volume 1.25 L Volume 2.5 L
COD mass 270 mg COD mass 540 mg
COD 1175 mg/L COD
Volume 1.25 L Volume 2.5 L
COD mass 1468.75 COD mass 1817.50 mg
TSS 3360 mg/L TSS 1683 mg/L
COD equ 1.42 mg COD/mg biomass COD equ 1.42 mg COD/mg biomass
Volume 1.25 L Volume 2.5 L
COD mass 5964 mg COD mass 5974.65 mg
Total COD,mg 7702.75 Total COD,mg 8332.15
Input Oxygen consumed
Biomass Biomass
Start of Cycle End of Cycle
Residual Residual
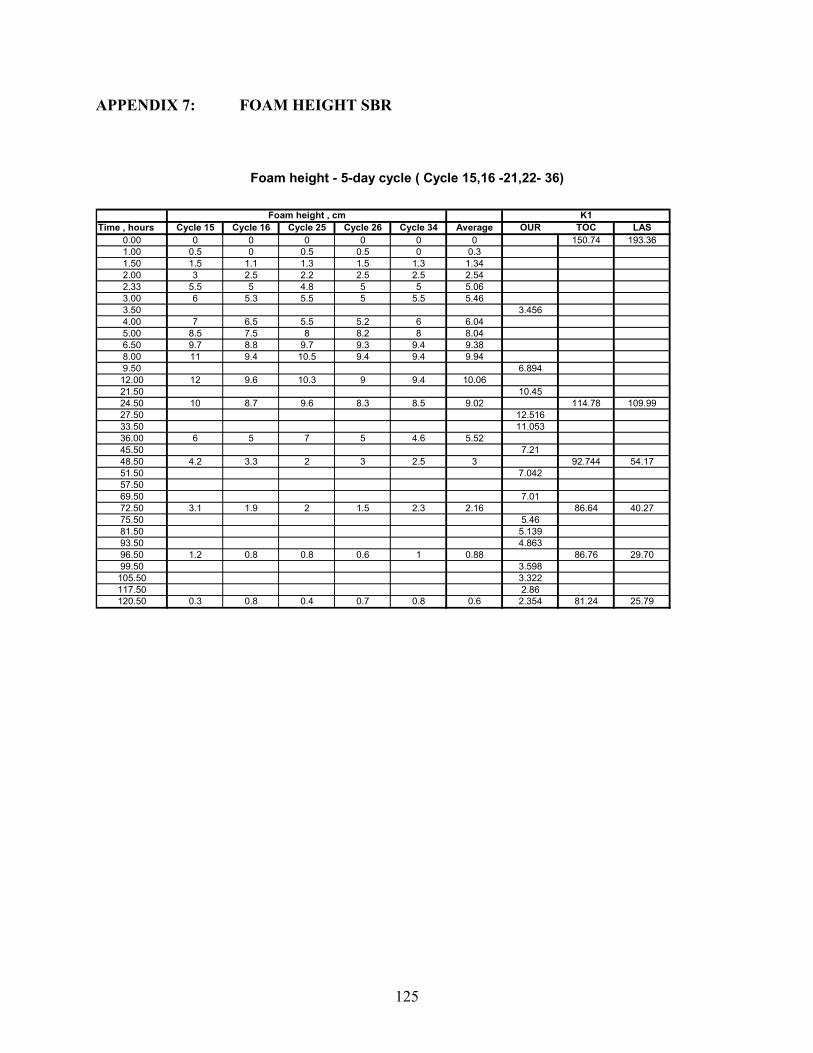
125
APPENDIX 7: FOAM HEIGHT SBR
Time , hours Cycle 15 Cycle 16 Cycle 25 Cycle 26 Cycle 34 Average OUR TOC LAS0.00 0 0 0 0 0 0 150.74 193.361.00 0.5 0 0.5 0.5 0 0.31.50 1.5 1.1 1.3 1.5 1.3 1.342.00 3 2.5 2.2 2.5 2.5 2.542.33 5.5 5 4.8 5 5 5.063.00 6 5.3 5.5 5 5.5 5.463.50 3.4564.00 7 6.5 5.5 5.2 6 6.045.00 8.5 7.5 8 8.2 8 8.046.50 9.7 8.8 9.7 9.3 9.4 9.388.00 11 9.4 10.5 9.4 9.4 9.949.50 6.89412.00 12 9.6 10.3 9 9.4 10.0621.50 10.4524.50 10 8.7 9.6 8.3 8.5 9.02 114.78 109.9927.50 12.51633.50 11.05336.00 6 5 7 5 4.6 5.5245.50 7.2148.50 4.2 3.3 2 3 2.5 3 92.744 54.1751.50 7.04257.5069.50 7.0172.50 3.1 1.9 2 1.5 2.3 2.16 86.64 40.2775.50 5.4681.50 5.13993.50 4.86396.50 1.2 0.8 0.8 0.6 1 0.88 86.76 29.7099.50 3.598
105.50 3.322117.50 2.86120.50 0.3 0.8 0.4 0.7 0.8 0.6 2.354 81.24 25.79
Foam height - 5-day cycle ( Cycle 15,16 -21,22- 36)
Foam height , cm K1
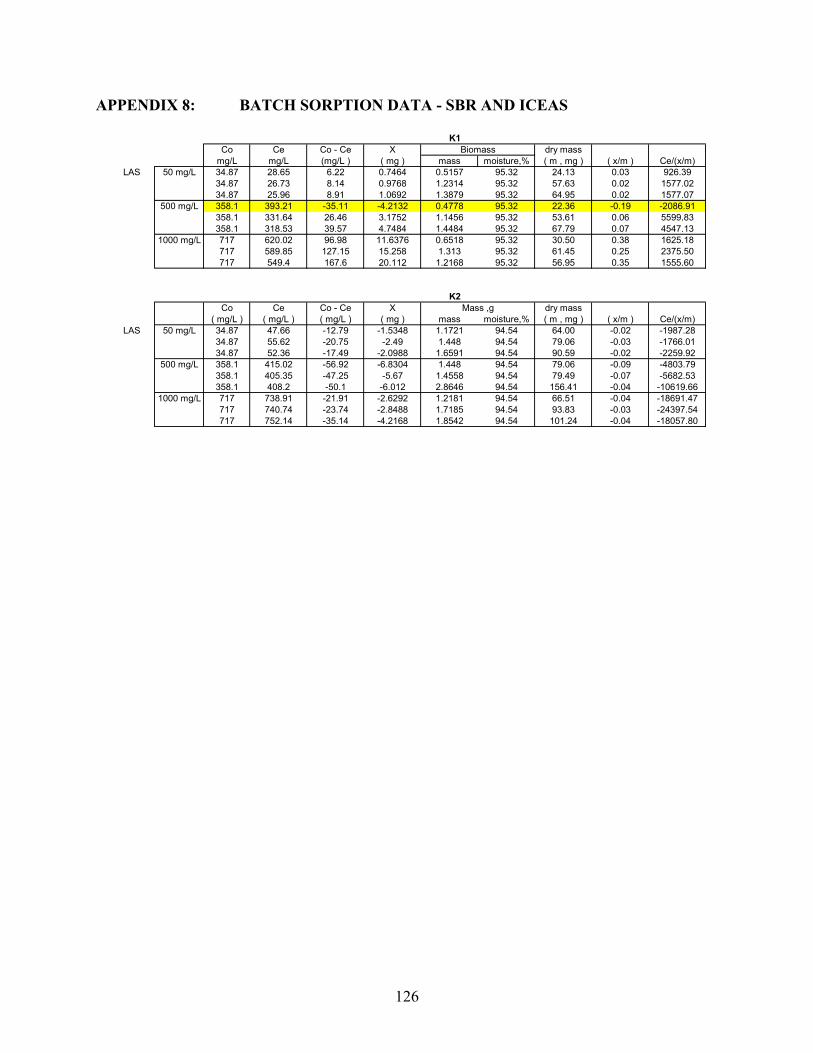
126
APPENDIX 8: BATCH SORPTION DATA - SBR AND ICEAS
Co Ce Co - Ce X dry massmg/L mg/L (mg/L ) ( mg ) mass moisture,% ( m , mg ) ( x/m ) Ce/(x/m)
LAS 50 mg/L 34.87 28.65 6.22 0.7464 0.5157 95.32 24.13 0.03 926.3934.87 26.73 8.14 0.9768 1.2314 95.32 57.63 0.02 1577.0234.87 25.96 8.91 1.0692 1.3879 95.32 64.95 0.02 1577.07
500 mg/L 358.1 393.21 -35.11 -4.2132 0.4778 95.32 22.36 -0.19 -2086.91358.1 331.64 26.46 3.1752 1.1456 95.32 53.61 0.06 5599.83358.1 318.53 39.57 4.7484 1.4484 95.32 67.79 0.07 4547.13
1000 mg/L 717 620.02 96.98 11.6376 0.6518 95.32 30.50 0.38 1625.18717 589.85 127.15 15.258 1.313 95.32 61.45 0.25 2375.50717 549.4 167.6 20.112 1.2168 95.32 56.95 0.35 1555.60
Co Ce Co - Ce X dry mass( mg/L ) ( mg/L ) ( mg/L ) ( mg ) mass moisture,% ( m , mg ) ( x/m ) Ce/(x/m)
LAS 50 mg/L 34.87 47.66 -12.79 -1.5348 1.1721 94.54 64.00 -0.02 -1987.2834.87 55.62 -20.75 -2.49 1.448 94.54 79.06 -0.03 -1766.0134.87 52.36 -17.49 -2.0988 1.6591 94.54 90.59 -0.02 -2259.92
500 mg/L 358.1 415.02 -56.92 -6.8304 1.448 94.54 79.06 -0.09 -4803.79358.1 405.35 -47.25 -5.67 1.4558 94.54 79.49 -0.07 -5682.53358.1 408.2 -50.1 -6.012 2.8646 94.54 156.41 -0.04 -10619.66
1000 mg/L 717 738.91 -21.91 -2.6292 1.2181 94.54 66.51 -0.04 -18691.47717 740.74 -23.74 -2.8488 1.7185 94.54 93.83 -0.03 -24397.54717 752.14 -35.14 -4.2168 1.8542 94.54 101.24 -0.04 -18057.80
BiomassK1
K2Mass ,g
VITA
Luis Alberto Espinoza Rodezno was born in Honduras on August 19, 1972. Luis received
his Bachelor of Science in Chemical Engineering from Universidad Nacional Autónoma de
Honduras, in 1995. He worked for Corporación Cressida as process engineer in the area of palm
oil extraction and bleaching from 1996 to 1998, and then was hired by Unilever de Honduras as
Quality Assurance manager for their chemical complex located in Comayagua. In 2001, Luis
entered the graduate school of Louisiana State University to obtain a Master of Science in Civil
Engineering under a Fulbright scholarship. He worked under the guidance of Dr. William M.
Moe, testing operating strategies for bioreactors treating model industrial wastewater containing
high concentrations of linear alkylbenzene sulfonate (LAS).
127