Embed Size (px)
Citation preview

____________________________________________________________________________________________
*Corresponding author: Email: [email protected];
Annual Research & Review in Biology4(4): 577-601, 2014
SCIENCEDOMAIN internationalwww.sciencedomain.org
Biological Network Inference: A Review ofMethods and Assessment of Tools and
Techniques
Jimmy Omony1*
1University of Groningen, Molecular Genetics department, P.O. Box 11103.9700 CC,Groningen, Netherlands.
Author’s contribution
The author (JO) conceived the idea, wrote, read and approved the manuscript.
Received 30th June 2013Accepted 16th October 2013
Published 9th November 2013
ABSTRACT
The topic of reconstruction of genetic networks is of great interest to the scientificcommunity today – particularly those in the biological sciences. Essentially the need fornetwork reconstruction is motivated by the need to find relationships between regulationmechanisms for genes, the need for discoveries in medicine, drug and pharmaceuticalindustry, the need for improved agricultural crops. All this requires a concerted effort frommulti-disciplinary sciences, e.g. physics, mathematics, biology and chemistry – whichhave led to disciplines such as Systems Biology and Bioinformatics. Mathematical andstatistical modeling has particularly been very instrumental for engineering and softwaredevelopment has been very useful in biological networks inference. Sometimes the linkbetween theory, modeling and data acquisition is unclear. The goal in this article is todiscuss tools and techniques for biological network inference and the areas ofapplication. The pros and cons of network reconstruction methods are also provided. Thenumber of scientific articles on network inference is overwhelming. Additionally, there is adilemma in methodology choice, which is attributed to the scarcity of novel ways tocompare the performance of the existing methods on experimental data. Applications ofdata visualization tools, modeling and simulation, data analysis and storage are given.
Keywords: Genetic network reconstruction; dynamic modeling; parameter identification.
Review Article
Annual Research & Review in Biology, 4(4): 577-601, 2014
578
1. INTRODUCTION
The topic of biological network inference is of great interest and its history dates back to asfar back as the 1960s [1] and the work on graph theory which is instrumental for studyingnetwork structures was pioneered as early as1959 [2]. Since then, network inference hasbeen vastly explored using genomic data with numerous analytic and numerical approaches[3,4,5,6]. We have also in the past few decades seen the publication of numerous papers onbiological systems including research and review articles providing insight into theapplications and challenges of network reconstruction, see. e.g. [5,7,8,9,10,11,12,13]. A lookat literature reveals an enormous list of genetic network reconstruction (GNR) methods thathave been proposed and used to reverse engineer networks in various model organisms,e.g. the E. coli bacteria [14][15]plants (especially the model plant Arabidopsis [16,17]) or inhumans to represent biological signaling networks, such as the tumor suppressor proteinp53 which regulates gene activity in cell growth and death [18,19].
By definition, a genetic regulatory network refers to genes which code for transcription factor(TF) proteins connected to their respective target genes. Elsewhere, a genetic network hasbeen defined as a group of genes in which individual genes can change the activity of othergenes [20]. Specific mathematically formulated definitions are sometimes used dependingon whether the regulation mechanisms in a network are directed or undirected. Most if not allGNR methods still fall short of perfection in the total recovery of the ”true” networkstructures, e.g. [21,22,23,24,25,26,27,28,29]. It still remains a challenge to find a clear guideon the choice of methods, especially for those with little or no experience in GNR. Not allmethods are equally powerful or applicable under the same conditions, there arecircumstances when one modeling approach (or algorithm) performs well and in some casesperforms poorly. The performances are based on the training datasets used for the modelcalibration. Here, a discussion on the available methods for GNR is provided. Thisdiscussion is aimed at enlightening and guiding those with interest in networks inference.The theories and working principles of the formalisms are not given in this review article,instead focus is on classifying the suitability and applicability of the methods. An assessmentof opinions from scientific articles on biological network reconstruction in the fields ofSystems and Synthetic biology, Bioinformatics, Biotechnology, Mathematics and Computingscience is made. Various terms have been used in literature to refer to studies involvingbiological networks, these terms are: GNR, network inference, network identification andreverse engineering of networks.
Studies of biological systems have for long been plagued by lack of data, making the use ofin silico studies with synthetic data a common practice. Modeling and simulation enablesrigorous probing of network dynamics prior to validation with experimental data.Mathematical modeling is a powerful tool for testing hypotheses that might be difficult toassess otherwise. The comparison of model predictions to experimental data enablesvalidation of current knowledge. Similarly, a poor match in model predictions to currentknowledge triggers a need to bridge the gap in knowledge. Modeling enables in silico testingand validation of experiments that cannot be done in vitro. The availability of relatively lowcost, high through-put genomic data has significantly increased model validation andhypothesis testing. GNR algorithms are divided into two categories, namely: the discretestate and continuous state approach. In discrete state based approaches, each node in anetwork is considered to have a small number of discrete states and the regulatoryinteractions between nodes (gene) are described using logical functions (typically, derivedfrom a combination of the Logical conjunction (AND), Logical disjunction (OR), Inverter
Annual Research & Review in Biology, 4(4): 577-601, 2014
579
(NOT) and Exclusive or (XOR) operators). Historically, the use of logical operations stemsfrom the need to describe biological processes using mathematical models.
In the continuous-state approach, messenger ribonucleic acid (mRNA) and protein levels areconsidered as continuous functions in time. GNR can be done at various levels namely: (i)genetic networks, (ii) metabolic networks, and (iii) protein networks. Although integratingthese levels into a single network is a nontrivial task, there is progress, resulting from aconcerted effort from inter-disciplinary research. Therefore, information at the geneexpression level is useful for projecting biochemical networks [30]. In a directed network, theedges are considered to be an ordered pair of vertices from one node to another. In anundirected network the edges are unordered. Signaling pathways are a good example ofdirected networks since they contain all genes or proteins being represented as nodes. In adirected network, the flow of information is from one gene to another while in an undirectednetwork the flow of information is not specified. Meanwhile, protein–protein interactions forman undirected network with the proteins as nodes and pair-wise interaction between proteinsbeing represented with edges. These concepts can be found in books on Graph theory (seee.g. [31,32]).
In literature there are numerous summaries of the requirements for good network inference.Most of the opinions converge around a couple of fundamental necessities. A good exampleof a discussion of such opinions can be found in the work of Kitano [33] which summarizesthe tasks required for proper understanding of biological systems. These tasks include: (i)system structure (topology) identification, (ii) system behavior (network dynamics) analysis,(iii) systems design, and (iv)systems control. Most biological networks are dynamic ratherthan static, which makes the dynamic approaches preferable over the static ones [34]. Ingeneral, there are two components of network inference, namely: (i) structure identificationwhich refers to the determination of relationships between the genes in a network of interestand their corresponding transcripts and (ii) the quantification of the relationship betweenthese genes (or transcripts) – a process that is referred to as parameter estimation. Thesetwo processes are closely interconnected and should not be confused to refer to the samething. The challenges associated with modeling of network dynamics and parameteridentification are discussed in this review article. Avast number of scientific articles andinformation storage systems on biological networks and genomic datasets have sprung up inthe last two decades. It is therefore useful to have guiding documents like this review paperon the state-of-the-art methods, currents trends and emerging challenges associated tonetwork inference. Recently, major progress has been made following scientific meetingslike the Dialogue for Reverse Engineering Assessment and Methods (DREAM) challenge[35]. The DREAM challenge is a project that aims to fairly compare the strengths andweaknesses of network reconstruction methods. It also aims to validate the reliability of themodels in the various situations in which they are used.
A number of interesting papers have since come out of the DREAM series challenge, e.g.DREAM1 [36], DREAM2 [37,38] and DREAM3 [35,39]. Details of the DREAM serieschallenges are not discussed here and instead its benefits are stressed. For instance inDREAM3, Yip et al. [35] performed in silico studies aimed to reconstruct networks from twotypes of data, i.e. gene expression profiles in the ”deletion data” and time series geneexpression trajectories after initial data perturbations. They used deletion data to detectdirect regulatory activities and perturbation to enrich data that aids identification of weak andcomplex regulation mechanisms. One of the interesting approaches that have beenexploited in network inference is that network excitation – also known as perturbationstudies. This excitation basically consists of introducing some kind of disturbance or external
Annual Research & Review in Biology, 4(4): 577-601, 2014
580
signal to a targeted component in a network or pathway and then assessing the resultantimpact on the other network components. This often involves experimental approaches toobtain information on networks, i.e. excitation of an existing unmodified network and theexcitation of a modified network in a bid to exclude certain specific pathways. Excitations ofnetworks have in principle been approached in various ways, e.g. the input-output analysisfollowing excitation of an intact network – an approach that is very much of interest tosystems and control engineers. On the other hand, biologists have exploited alternativestrategies aimed at obtaining extensive insight by using experimental modification. In thiswork, the terms time series and time course data often refer to the same process.
2. STATE-OF-THE-ART IN NETWORK INFERENCE
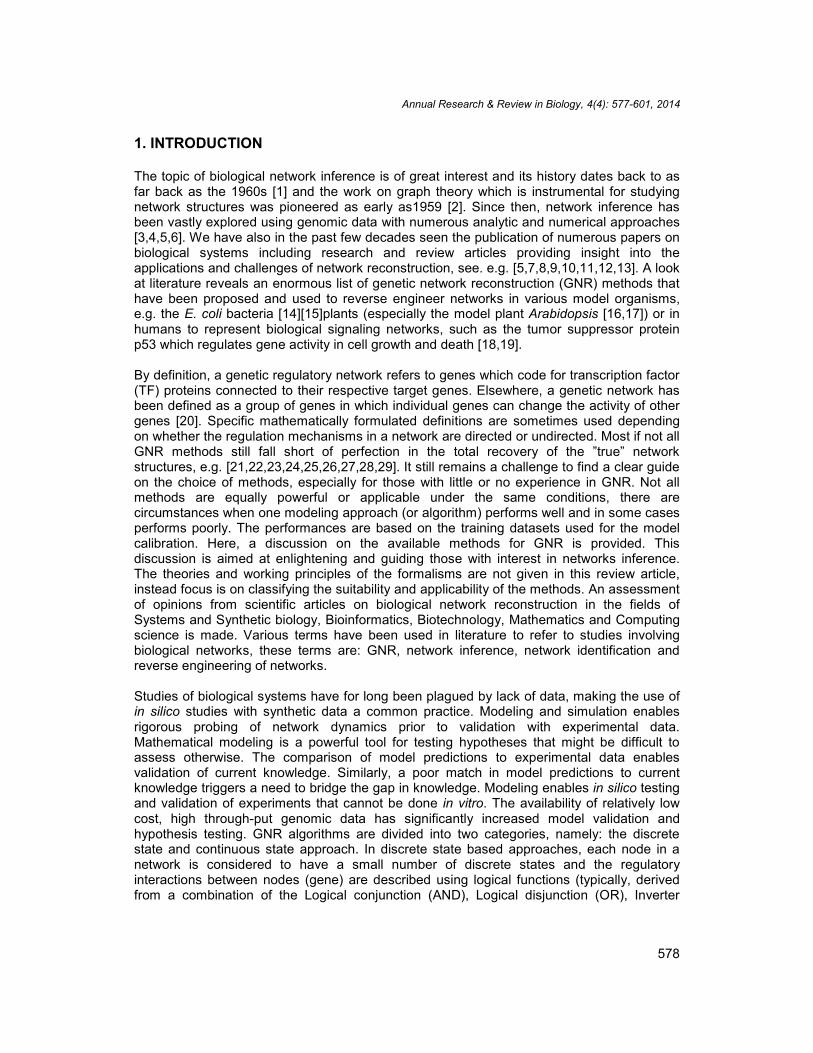
Good network inference requires proper planning and execution of an experiment, therebyensuring quality data acquisition. Optimal experimental design (OED) in principle refers tothe use of statistical and or mathematical concepts to plan for data acquisition. This must bedone in such a way that the data information content is enriched, and a sufficient amount ofdata is collected with enough technical and biological replicates where necessary. Theserequirements are necessary to ensure that the data quality does not compromise whateveranalytic approach is used for the network reconstruction and parameter estimation. Toprovide some insight into the various components and requirements for proper networkinference, an overview is given in Fig. 1.
Fig. 1. A schematic representation of the steps involved in network inference
Annual Research & Review in Biology, 4(4): 577-601, 2014
581
The Prior knowledge constitutes literature information from scientific publications, biologicaldatabases and expert knowledge on the subject. The performance of a GNR method isjudged by how well the Inferred network matches the True network structure. Starting with agiven dataset and Prior knowledge of a network, often the goal is to infer the true networkstructure. Generally, testing of a reverse engineering method is done by generating virtualdata from an assumed True system – which is of course not the true system itself.The termOED represents Optimal Experimental Design. Image adopted from PhD thesis, Omony[40].Numerous network inference formalisms have been proposed in literature, e.g.differential equations, hybrid models, regression models, Bayesian models and neuralnetworks. These approaches require large amounts of data and (super-)fast computers. Thepros and cons of the methods used in GNR are given in Table 1. Gathering sufficient priorknowledge from literature and databases is a necessary but time-consuming and tediousprocess. Once the true network topology is known, a performance comparison of reverseengineering approaches can be made (Fig.1). Successful validations require well-designedexperiments, high quality data and robust identification procedures.
2.1 Overview of Network Inference
Fig.1 shows the main steps in network inference. One goal is to compare how well the truenetwork approximates the inferred network and the other is to derive meaningful insightsfrom such inferences. Approximations are often sufficient for inferring network dynamics forhigh levels of identification accuracies. Additional comparisons as to whether two networkstructures match can be done by assessing the presence of corresponding edges in the trueand identified network structures (step 4 and 6). Many networks have a high level ofuncertain information such as the node dynamics and unknown network topologicalstructure. Identification of structures or pathways that are considered consistent andexperimentally verifiable in the laboratory is essential in biological sciences. The recentdecade has seen huge advances made on network structure prediction. The discovery of anetwork structure and the interaction mechanisms between the genes helps us: (i)understand the dynamic interaction between the genes, (ii) make predictions of the futureexpression values and the time trajectories of all genes in a network, and (iii) identify thebiological function of a gene, e.g. in relation to drug discovery and disease studies. Readerswithkeen interest on this issue are referred to [41,42,43,44].
There are many stages involved in network inference, as depicted in Fig. 1 (steps 1 to 12).These steps entail other elements that play important roles in the network inference. Thegoal of this paper is not to provide details of the individual steps but to show the interplaybetween the various steps. Overall, each of the steps has to be carefully considered if theBiological inference of results at step 12 is to be meaningful. This is because of the dataquality, experimental design, prior knowledge, model and/or network inference formalismused all play a part in network inference. Recently, interesting progress has been made onexperimental design (step 6), e.g. [45,46,47]. Good experimental design practice enrichesdata information content. There is evidence that studies from well-designed experimentssignificantly improve the network inference, as well as save time and money [47]. First, anoverview of the most popular methods for network inference is provided, this is followed byan assessment of the suitability of the method and then circumstances under which it can beused. The working principles of the methods are based on a diversity of approaches, e.g.probability theory, others are stochastic based and again others are deterministic in nature.
Annual Research & Review in Biology, 4(4): 577-601, 2014
582
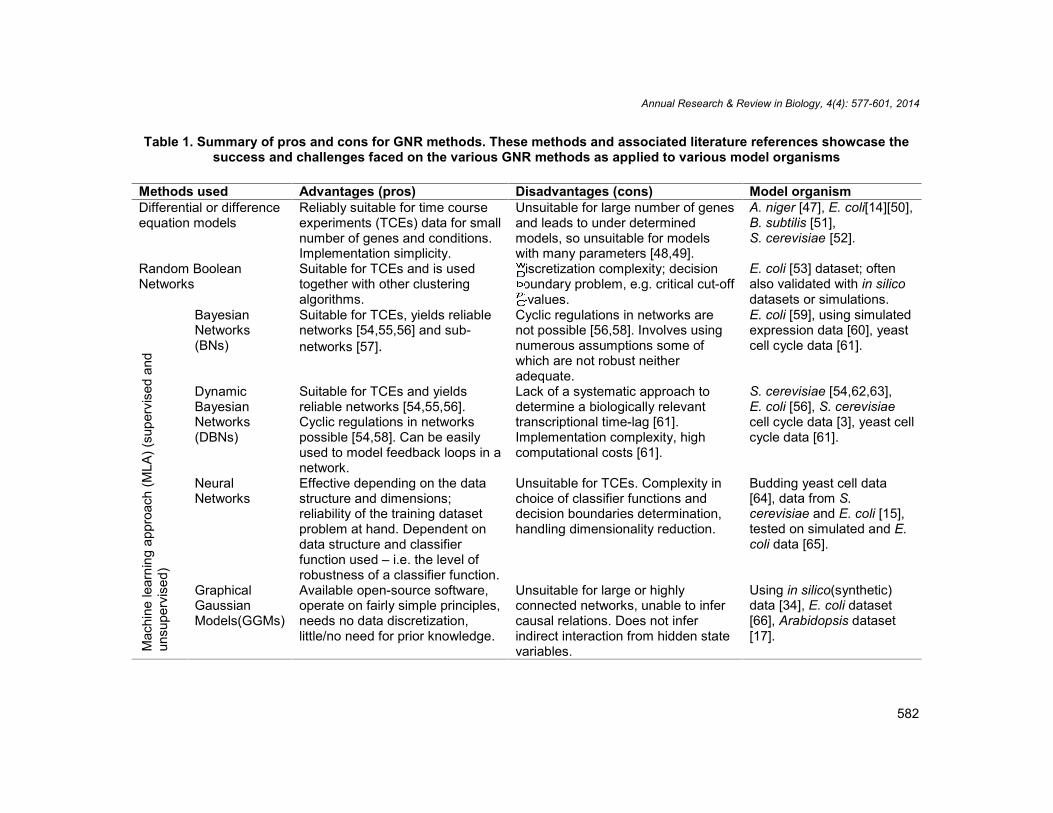
Table 1. Summary of pros and cons for GNR methods. These methods and associated literature references showcase thesuccess and challenges faced on the various GNR methods as applied to various model organisms
Methods used Advantages (pros) Disadvantages (cons) Model organismDifferential or differenceequation models
Reliably suitable for time courseexperiments (TCEs) data for smallnumber of genes and conditions.Implementation simplicity.
Unsuitable for large number of genesand leads to under determinedmodels, so unsuitable for modelswith many parameters [48,49].
A. niger [47], E. coli[14][50],B. subtilis [51],S. cerevisiae [52].
Random BooleanNetworks
Suitable for TCEs and is usedtogether with other clusteringalgorithms.
Discretization complexity; decisionboundary problem, e.g. critical cut-off
-values.
E. coli [53] dataset; oftenalso validated with in silicodatasets or simulations.
Mac
hine
lear
ning
app
roac
h (M
LA) (
supe
rvis
ed a
ndun
supe
rvis
ed)
BayesianNetworks(BNs)
Suitable for TCEs, yields reliablenetworks [54,55,56] and sub-networks [57].
Cyclic regulations in networks arenot possible [56,58]. Involves usingnumerous assumptions some ofwhich are not robust neitheradequate.
E. coli [59], using simulatedexpression data [60], yeastcell cycle data [61].
DynamicBayesianNetworks(DBNs)
Suitable for TCEs and yieldsreliable networks [54,55,56].Cyclic regulations in networkspossible [54,58]. Can be easilyused to model feedback loops in anetwork.
Lack of a systematic approach todetermine a biologically relevanttranscriptional time-lag [61].Implementation complexity, highcomputational costs [61].
S. cerevisiae [54,62,63],E. coli [56], S. cerevisiaecell cycle data [3], yeast cellcycle data [61].
NeuralNetworks
Effective depending on the datastructure and dimensions;reliability of the training datasetproblem at hand. Dependent ondata structure and classifierfunction used – i.e. the level ofrobustness of a classifier function.
Unsuitable for TCEs. Complexity inchoice of classifier functions anddecision boundaries determination,handling dimensionality reduction.
Budding yeast cell data[64], data from S.cerevisiae and E. coli [15],tested on simulated and E.coli data [65].
GraphicalGaussianModels(GGMs)
Available open-source software,operate on fairly simple principles,needs no data discretization,little/no need for prior knowledge.
Unsuitable for large or highlyconnected networks, unable to infercausal relations. Does not inferindirect interaction from hidden statevariables.
Using in silico(synthetic)data [34], E. coli dataset[66], Arabidopsis dataset[17].
Annual Research & Review in Biology, 4(4): 577-601, 2014
583
2.2 Probabilistic Bayesian Network Formalism
Bayesian networks (BNs) are defined by graphical structures which are a family ofconditional distributions and a set of corresponding parameters. Together they represent ajoint distribution for a set of random variables – the random variables being gene expression.BNs can be learned from a prior known network structures using well known sparse trainingdatasets. BNs were first introduced by Kauffman [67]. This approach is based on conditionaldependencies between sets of variables (see [7] for a detailed review). Applications ofDynamic Bayesian Networks (DBNs) can be found in the work of Kim et al. [54] and Zou andConzen [61]. The DBN as an extension of the BN incorporates time dynamics into the GNR.Unlike simple BNs, the DBN can model cyclic regulation in genetic networks [62].
Cyclic regulation refers to the regulatory effect of a gene starting from one particular gene toanother gene or group of genes in some kind of sequence, and finally ending back at thegene from which the regulation of transcription was initiated (Fig. 2B). Cyclic regulation canbe positive or negative depending on if the overall impact on transcription of the initial geneof interest is increased (up-regulated) or reduced (repressed). These collective up-regulatoryor down regulatory effect can arise from any of the other genes involved in the cyclic loopduring regulation – some might be repressors while others might be activators, or evenexhibit self-regulation. Cyclic regulation does occur in many biological networks although insome systems unraveling its existence can be a challenge due to indirect loops between thevarious network components. Additional applications can be found in the works of Werhli etal. [68], Spirtes et al. [58] and Pearl [69]. According to Murphy and Mian [70], BNs are highlystochastic and have been shown tobe suitable for modeling with noisy transcription data [3].The Bayesian formalism is efficient but requires many working assumptions, good networkstructural prior knowledge and readily handles missing values in microarray datasets [71].
Rogers and Girolami [60] used Bayesian regression to infer sparse genetic networks andnoted that the likelihood for observing false edges remains high, especially for datameasurement noise levels higher than 10%. The term false edges here refers to a predictionthat a relationship (or connection) exists between two nodes in a network and yet in realitysuch a relationship does not exist. They observed that typically precision levels drop to about10% and that for each true connection there are 9 false connections. This highlights thecomplications that arise from parameter variations in modeling genetic networks. Identifyingwhich approach is best suited for a given dataset is nontrivial since the efficiencies may varyacross datasets [72]. The problem with BNs is that for a large number of variables andrelatively small number of samples and/or experimental conditions ( ≫ )where –number of genes and - number of time points. Generally, the theoretical concepts arechallenging and the model complexity and implementation difficulty increases with increasingnetwork size. Incorporating additional information about TFs, signaling molecules orcandidate regulators in BNs reduces modeling complexity. This increases the likelihood ofobtaining a reliable biological inference.
Data clustering using statistical methods is the commonest way of visualizing data –particularly for uncovering closely related variables and patterns in high dimensionaldatasets. Data clustering might provide a useful means of extracting qualitative informationon gene co-expression between genes using a large dimensional dataset, but it does notprovide information on the directionality of regulation between genes. Such information ondirectionally can be obtained using BNs and DBNs. To ensure that such interactions areunraveled accurately, the last decade has seen advancements made towards reducing thenoise levels in genomics datasets. There is therefore hope that with the availability of high
Annual Research & Review in Biology, 4(4): 577-601, 2014
584
quality and high dimensional data from methods such as RNA sequencing (RNA-Seq), theaccuracy and precision with which genetic networks will be reconstructed irrespective of theapproach used for the reconstruction will be greatly improved (as was recently demonstratedfor co-expression networks [73]).
2.3 Regression-Based Methods
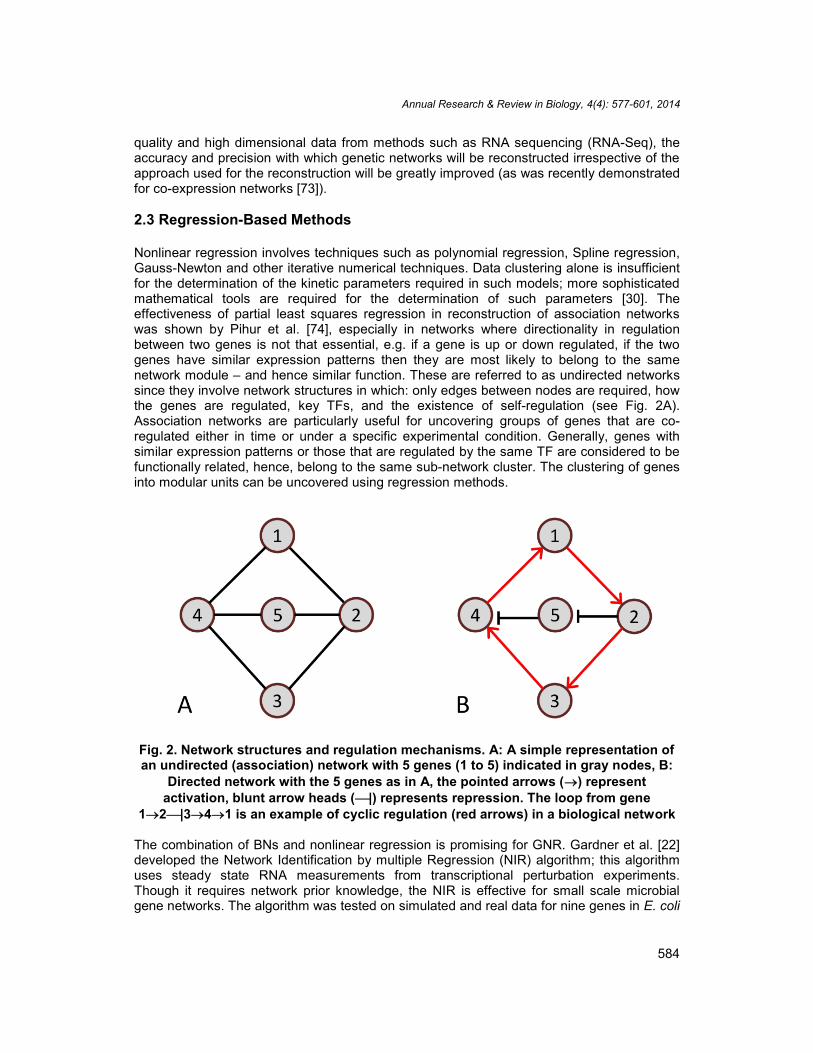
Nonlinear regression involves techniques such as polynomial regression, Spline regression,Gauss-Newton and other iterative numerical techniques. Data clustering alone is insufficientfor the determination of the kinetic parameters required in such models; more sophisticatedmathematical tools are required for the determination of such parameters [30]. Theeffectiveness of partial least squares regression in reconstruction of association networkswas shown by Pihur et al. [74], especially in networks where directionality in regulationbetween two genes is not that essential, e.g. if a gene is up or down regulated, if the twogenes have similar expression patterns then they are most likely to belong to the samenetwork module – and hence similar function. These are referred to as undirected networkssince they involve network structures in which: only edges between nodes are required, howthe genes are regulated, key TFs, and the existence of self-regulation (see Fig. 2A).Association networks are particularly useful for uncovering groups of genes that are co-regulated either in time or under a specific experimental condition. Generally, genes withsimilar expression patterns or those that are regulated by the same TF are considered to befunctionally related, hence, belong to the same sub-network cluster. The clustering of genesinto modular units can be uncovered using regression methods.
Fig. 2. Network structures and regulation mechanisms. A: A simple representation ofan undirected (association) network with 5 genes (1 to 5) indicated in gray nodes, B:
Directed network with the 5 genes as in A, the pointed arrows () representactivation, blunt arrow heads (|) represents repression. The loop from gene
12|341 is an example of cyclic regulation (red arrows) in a biological network
The combination of BNs and nonlinear regression is promising for GNR. Gardner et al. [22]developed the Network Identification by multiple Regression (NIR) algorithm; this algorithmuses steady state RNA measurements from transcriptional perturbation experiments.Though it requires network prior knowledge, the NIR is effective for small scale microbialgene networks. The algorithm was tested on simulated and real data for nine genes in E. coli
Annual Research & Review in Biology, 4(4): 577-601, 2014
585
and about 50% of the network edges were correctly recovered. The 9 gene network was partof the Son of Seven less (SOS) system in the larger E. coli network. A different algorithm(Time-Series Network Identification, TSNI) yielded a similar result as NIR [75].Perturbationdata enables investigation of how the gene expression changes from its steady state value.Network perturbation enables assessment of which genes, group of genes and/or sub-units(modules) in a network that influence the expression levels of the other genes. Perturbing anetwork ensures that fair comparisons can be made between datasets from twoexperimental conditions. Steady state perturbation data basically gives insight into what theexpression values of specific genes would be without any changes in the environment as aresult of, e.g. stressors like heat shock, change in pH and extreme (low or high) saltconcentrations.
Time course Auto Regression models coupled with the Granger causality in GNR have beenused for GNR. An extension of this model is the Auto Regressive Integrated Moving Average(ARIMA). The notion of Granger causality was first coined by Wiener [76]and Granger [77]. Itis based on the concept that there exists a causal effect from one time series to another, ifand only if the prediction of the first time series is improved based on knowledge of thesecond. The Granger causality measure enables determination of causal relation betweentwo signals and it also determines direct or indirect causality [78][79][80][81][82]. However,much still remains to be done in the study of biological networks using AR-e Xogenousmodels (ARX) and using the more extended ARIMA models. It was shown that successfulnetwork inference can be achieved using Granger causality [77] and partial correlationanalysis based methods, e.g. [83,84,85]. These methods do not infer causality betweennodes. Another approach is to use association based methods – also referred to asRelevance networks [86].
2.4 Boolean Networks
The use of discrete models in biology dates as far back as the 1940’s [67,87]. In discretemathematics and computer science, discrete time models are viewed as computingmachines [88]. Boolean networks are considered as qualitative descriptions of generegulatory interactions. The first computational methods for genetic network inference werethe Boolean and random Boolean network approaches [89,90,91,92]. Boolean functions mapstate variables at a time point to + 1. This formalism performs best for a small number ofgenes. Boolean networks work on the assumption that transcript production and mRNAdegradation are controlled by switch-like processes. This approach uses discretized data;hence there is a risk of information loss. However, according to Rocke and Durbin [93] theuse of Boolean formalisms should be treated with caution given the relatively large noiselevels in microarray data. For a brief overview into Boolean networks, let be an –dimensional binary vector that represents the state of a network of genes. Booleanfunctionsgenerallyhave two states, ”ON”(1) and ”OFF”(0). Given a genetic network of size ,these Boolean functions take on a total of2 possible states. In this formalism, a Booleanfunction of the other target genes is assigned to each gene in a network. This functionpredicts the state of a target gene at a point in time leading to an enormous number ofBoolean functions. Individuals with particular interest on details of the theoretical workingprinciples are advised to look at literature [94,95,96,97].
Huang et al. [98] considered the binary approximation of transcription to be an over-simplification. Many biological phenomena are portrayed as continuous. Nevertheless,numerous studies have demonstrated that binary (and ternary) discretization sometimes
Annual Research & Review in Biology, 4(4): 577-601, 2014
586
yield reliable results. Using the binary approximation, Huang and co-workers also showedthat the Boolean formalism yields biologically meaningful results. Though computationallycostly, using ternary and higher order discretization levels has the potential to reveal morecharacteristics of a biological network [99]. Liang et al. [6] proposed the REVerseEngineering ALgorithm (REVEAL) for large-scale Boolean network reconstruction. Booleannetworks are capable of capturing the dynamic behavior in complex systems when used withhigh through-put microarray data. Random Boolean networks realistically capture essentialnetwork characteristics [67,98,100,101]. According to Shmulevich and Zhang [102], thisability to realistically capture crucial features of networks justifies using the Booleanformalism for network inferences.
Boolean networks only allow for qualitative rather than quantitative inferences. Steggles etal. [103] showed that Boolean networks fail to capture vital network dynamics. To provideinsight into the complexities with random Boolean networks, suppose that ℓrepresents thenetwork connectivity number, –number of nodes. By assumingthat we have ℓ levels, thenthe number of possible states for such a network is 2ℓ with a total possible combination of2 ℓlogical functions. It therefore follows that for each node has a total of ( , ℓ) possible un-ordered combinations for ℓedges. Here the symbol is used to refer to a combinatorial. The
number of possible networks for a given set of parameters is 2 ℓ × ( , ℓ) ℓ(proof not
given here, interested readers can look at [104]). The higher ℓgets the more complex thetopology of the network becomes. Boolean networks use discretized data which to someextent subjects the formalism to information loss from the data discretization. Thedimensionality challenges highlight the complexity of the Boolean formalism in studyingbiological networks.
2.5 Ordinary Differential Equation (ODE) Formalism
2.5.1 Variants of the ODE formalism
ODEs are efficient for modeling small-sized networks [105], but face the problem ofcomputational time complexity for large dimensional networks [106][107]. De Hoon et al.[108] illustrated the efficiency of ODEs with real data from B. subtilis. By using ODEs,network dynamics can be studied prior to parameter identification [109]– usually throughmodeling and simulations. Simulation is a useful way to predict systems behavioraldynamics and the way the network components (e.g. mRNA and protein concentrations)vary over time. One of the most popular differential equation formalism for network inferenceis the S-system [110,111,112,113,114,115]. They are advantageous in terms of systemanalysis and control design since it allows for convenient use of analytical and computationalmethods. Steady-state evaluation, control analysis and sensitivity analysis of a given systemcan be established mathematically using S-system parameters [116,117].
A major disadvantage of S-systems is that it requires a large number of parameters, (i.e.2 ( + 1), being the number of state variables) to describe a network further posing achallenge during parameter estimation. The proof of how the number 2 ( + 1) is arrived atis not given here but further insight on its derivation can be found in [116,117].Anotherbottleneck lies in the parameter estimation which is also discussed in a subsequent sectionof this paper. Kabir et al. [118] used Linear Time Invariant models to infer biological networkstructures and parameter estimation using synthetic data. Zhan and Yeung [119] proposed amethod that combines spline theory with Linear Programming and Nonlinear Programming.
Annual Research & Review in Biology, 4(4): 577-601, 2014
587
They used enzyme kinetics models to describe the network dynamics and study systemsparameter sensitivity. ODEs are used with time course perturbation data and knock out data.
2.5.2 Mathematical formulation
A popular representation for modeling biological networks is the transcription-translationmodel: ̇ = ( ( ; , ℎ ), . . . , ( ; , ℎ )) − ,̇ = ( ; ) − , given (0), (0)This model formalism arises from the central Dogma of molecular biology in which the DNAis transcribed to mRNA and then translated into proteins.The nonnegative constants and
represent the mRNA and protein degradation parameters, respectively; ℎ ( =1, . . . , , . . . , ) are Hill coefficients, – number of TFs for gene and – number of genes.The vector-valued functions ∈ { , }: ℜ → ℜdescribe the gene regulation in time; and
are repressing and activating Hill functions, respectively. These functions describe thedependence of the mRNA concentration on the protein levels . The mRNA synthesisfunction consists of sums or products of . The specific formulation of these functions isbased on the specific molecular regulatory mechanism, which TFs are involves, the targetgenes of interest, the presence or absence of a feedback, feed-forward mechanism, timedelay etc.
The translation function of mRNA to protein is often considered to be linear. When theprotein has no effect on the mRNA levels , then the corresponding term in the model isset to zero, i.e. = 0.Occasionally, people ignore what is happening to state variables thatmight be crucial for determining the network dynamics and instead focus mainly on theobservable components which are easily quantifiable. However, understanding the particularroles of any hidden state variables might be vital in explaining certain peculiar behavioraldynamics of a network, thereby, reducing the reliance on considering the model as a blackbox with hidden variables. The most common forms of are Hill functions and Michaelis-Menten functions [120,121,122]. The parameters[ , . . . , , ] can be estimated using theMaximum Likelihood approach [123,124,125]. A good illustration of the working principles ofODEs in network inference can be found in the work of Polynikis et al. [126]. They used Hillfunctions in ODEs by exploiting analytic approaches such as steady state analysis byinvestigating how the concentration of mRNAs and proteins change in time for a givennetwork.
Big networks require a large number of ODEs and parameters. This further complicates thenetwork inference and increases the risk of obtaining biased parameter estimates. Thecomputational requirements for such networks are enormous and quickly scale up withnetwork size. ODEs effectively handle small-dimensional networks and irregularly sampleddata, for instance by using Kalman Filters [127]. Commonly, perturbation data obtained as aresult of variations in a factor that influences gene expression is used for the ODE formalism.In perturbation experiments in which gene expression is followed in time, the perturbation isperformed at time zero. After this the cells are allowed sometimes to recover and regain theirsteady states. Overall, differential equations model network dynamics in fine details and leadto biological realistic inferences. Additionally, on average it requires a small amount of dataand uses both discrete and continuous data, hence it is flexible and convenient.

Annual Research & Review in Biology, 4(4): 577-601, 2014
588
2.6 Hybrid Models
The hybrid formalism combines continuous models of slowly changing metaboliteconcentrations with discrete representations of the model components, particularly thosethat are changing in a switch-like fashion between two states. Hybrid models, though rarelyused in reverse engineering biological networks, have been shown to successfully yieldinteresting results. Hybrid models enable creation of quantitatively accurate representationsof the concentrations of metabolites in a cell [123]. This formalism is based on a combinationof methods that embrace discrete-continuous modeling. Zhang et al. [128] presented a novelnetwork inference method by integrating gene expression data and gene functional categoryinformation. Their network inference approach consisted of two parts, namely: (i) moduleselection, and (ii) network inference. The first of these parts uses optimal modules throughfuzzy –mean clustering and incorporating gene functional category information, while thelatter uses a hybrid of particle swarm optimization and recurrent neural network (PSO-RNN)methods during the network inference. The latter method was tested on real data. Thisdemonstrates the applicability of hybrid models in network inference. In this setting the RNNis the model formalism and the PSO refers to the parameters estimation approach. Thespecifics of the theoretical framework can be found in [128].
In contrast to the approach of Zhang et al. [128] discussed above, Fernandez et al. [129]focused on reducing computation time, increasing the efficiency and robustness of theirhybrid based optimization routine. Their approach integrates aspects of experimental designby evaluating the Fisher Information Matrix and effectively handles data measurement noiseand partial observations in data. Additionally, local and global model identifiability is alsotested in the same approach. Hybrid systems require good prior knowledge of a biochemicalsystem. Prior knowledge of network pathways aid setting up mathematical models uponwhich experimental designs are based.
2.7 Supporting Tools and Network Information Level
The singular value decomposition (SVD) [130,131,132], independent component analysis[133] and principal component analysis [134] when used with ODEs have aided successfulnetwork inference. However, this combination does not guarantee total recovery of the truegenetic network structure [135,136]. The use of SVD and ODEs can be improved byexploiting the network structural prior knowledge. This is mainly applied to linear systems ofequations for which the dynamics of gene expression data is portioned into a noise-free anddata measurement noise. Such a partition enables acquisition of an analytic solution and anapproximation of a numerical solution to the system of equations under consideration. It isnot possible to directly apply the analytic solution of the linear system since gene expressiondata because of data measurement noise. In such cases using SVD ensures that anaccurate solution to the linear system of equations as demonstrated in [130]. For most TCEsthe number of transcripts out-weighs the number of the time points, so the SVD can be usedto circumvent this problem [135].
Generally, reverse engineering networks is performed at two information levels, low andhigh. Bayesian and Neural networks are examples of high-level methods. Low-level methodsinclude ordinary, partial and delay differential equations. The choice of a level depends onthe research objective in consideration. Often distinctions are made between the forwardand reverse engineering [137]. Achieving high true positive (TP) values (≈100%, nearly allconnections/edgesbetween nodes in a network are correctly predicted) from biological
Annual Research & Review in Biology, 4(4): 577-601, 2014
589
inference without necessarily compromising the levels of false discoveries is a nontrivialtask. Likewise, with large datasets, realistic values for TPs are ≈90%. Higher TP values leadto higher false discovery rates, which particularly holds true for large networks.
2.8 Data Requirements, Data Sampling Strategies and Precision
Continuous dynamic models are suitable for modeling gene transcription data which isknown to be a continuous process in time. When modeling with sampled data, the challengeis to keep the number of data samples within cost-effective values. Optimal data samplingcriteria maximize cost-effectiveness [138,139,140,141,142]. Likewise, large datameasurement errors, low resolution and small dimensional datasets can negatively impactmeaningful network inference. For instance Bourque and Sankoff [143] showed that forrelatively low data measurement noise levels (<2.5%) and ≤ 12, false negative rate(FNRs) and false positive rates (FPRs) of as high as 30% are to be expected for a networkwith low gene transcription correlation values. These findings were validated using bothsynthetic and true biological networks. In GNR, using time course data, a large number oftime points in relation to model fitting to data are associated to low error rates (falsenegatives, FN and false positives, FP). In such cases the ratio FN/FP seemingly remainsinvariant of network size.
In practice the number of data points in a TCE is often low due to financial constraints.Recently, advancements using powerful computational approaches have been made, e.g.the improved self-adaptive Naïve Bayesian Tree (NBTree)[144], in these advancements itwas demonstrated that FPRs can tremendously reduce up to acceptable levels. Their workresulted in accuracy levels or TPs of ~99% using the NBTree algorithm. In another algorithm(a noise and redundancy reduction technique improves accuracy of gene regulatory networkinference (RARROMI)), proposed by [145], it was demonstrated that it outperformed the thenavailable algorithms by achieving an accuracy level of ~63%. However, such a performancerate might beto some extent dependent on the test datasets used, and is likely to vary forvarious datasets depending on their quality and dimension. It is therefore important thatcomputational methods and algorithms be trained on a variety of well-known datasetsobtained from a diversity of experiments. This is to ensure that the error rates from thenetwork inference can be reported with much bigger certainty and confidence. Thishighlights the significance of good design strategies to ensure that experimental costs areminimized while still obtaining datasets with high information content.
Kim et al. [146] studied the influence of varying the number of data points on estimatedstandard errors from a fitted regression model of three classifications, namely: least squares,total least squares and constraint total least squares. Of these criteria, the constraint totalleast squares approach yielded the best performance. Their findings suggest that a verysmall number of time points for analysis yields biased results while too many time points isassociated with increased financial costs and more experimental time for the data collectionprocess. The data requirement for accurate network inference with genes was investigatedby Kanehisa et al. [147]. For a Boolean network with average in-degree connectivity, thedata requirement scales to 2 + ( ) compared to a fully connected network of2 transition states [148]. The in-degree of a node in a genetic network refers to the numberof head endpoints adjacent to that specific node. Connectivity is the number of edges linkingthe nodes in a network.
Annual Research & Review in Biology, 4(4): 577-601, 2014
590
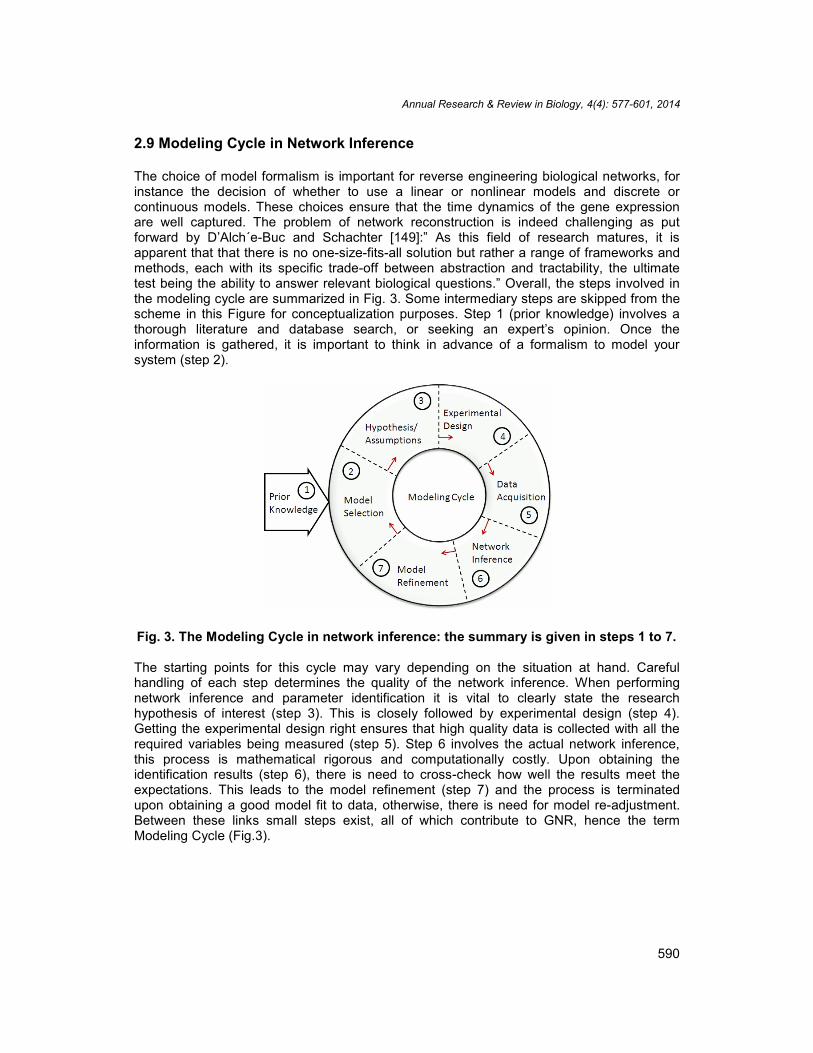
2.9 Modeling Cycle in Network Inference
The choice of model formalism is important for reverse engineering biological networks, forinstance the decision of whether to use a linear or nonlinear models and discrete orcontinuous models. These choices ensure that the time dynamics of the gene expressionare well captured. The problem of network reconstruction is indeed challenging as putforward by D’Alch´e-Buc and Schachter [149]:” As this field of research matures, it isapparent that that there is no one-size-fits-all solution but rather a range of frameworks andmethods, each with its specific trade-off between abstraction and tractability, the ultimatetest being the ability to answer relevant biological questions.” Overall, the steps involved inthe modeling cycle are summarized in Fig. 3. Some intermediary steps are skipped from thescheme in this Figure for conceptualization purposes. Step 1 (prior knowledge) involves athorough literature and database search, or seeking an expert’s opinion. Once theinformation is gathered, it is important to think in advance of a formalism to model yoursystem (step 2).
Fig. 3. The Modeling Cycle in network inference: the summary is given in steps 1 to 7.
The starting points for this cycle may vary depending on the situation at hand. Carefulhandling of each step determines the quality of the network inference. When performingnetwork inference and parameter identification it is vital to clearly state the researchhypothesis of interest (step 3). This is closely followed by experimental design (step 4).Getting the experimental design right ensures that high quality data is collected with all therequired variables being measured (step 5). Step 6 involves the actual network inference,this process is mathematical rigorous and computationally costly. Upon obtaining theidentification results (step 6), there is need to cross-check how well the results meet theexpectations. This leads to the model refinement (step 7) and the process is terminatedupon obtaining a good model fit to data, otherwise, there is need for model re-adjustment.Between these links small steps exist, all of which contribute to GNR, hence the termModeling Cycle (Fig.3).
Annual Research & Review in Biology, 4(4): 577-601, 2014
591
2.10 Parameter Identification
Parameter identification is an important part of network inference and the prediction ofnetwork behavior in time. Parameter estimation techniques like linear iterative models,stochastic optimization methods and constrained linear and nonlinear regression models areoften used in GNR [100,113,119,123,129,137]. Each approach has its own strengths andweaknesses many of which are strongly linked to the data quality and modeling approach.Genomic, proteomic and other -omic data types are prone to noise and/or have missingdata. With recent advancements in high resolution data acquisition techniques, the issue ofnoisy or missing data is becoming less problematic. Focus has slowly shifted away fromobtaining high-resolution data to unraveling the masked information contained in suchdatasets. Most methods focus on small-sized networks because of the computationalchallenges associated with larger networks. However, the need to accurately describemolecular mechanisms in biochemical systems cannot be understated. To achieve such highperformance descriptions, parameters have to be accurately and precisely identified. Manygradient search optimization procedures often fail to converge to a unique parameter value.Such a failure can bepartly attributed to the presence of correlated parameters and modeldegeneracy with respect to the cost function. This often compromises the precision withwhich the parameters are identified, therefore, there is need for alternative solutions to localoptimization methods.
Parameter identification, an important aspect of biological network inference, can be studiedusing sensitivity analysis. Sensitivity analysis is useful for assessing which parameterssignificantly affect the outputs or measured variables of interest following a networkperturbation with some stimuli [6]. Conventionally parameter sensitivity analysis is used as atool for analysis and design in engineering systems theory. Although it has mostly beenapplied in physical systems rather than biological systems, its use in the latter has recentlyincreased, especially in the study of complex networks. By using parameter sensitivityanalysis, once the most influential parameters are identified the correlation matrix betweenthe parameters is then investigated. Thereafter, the least sensitive parameters can be leftout of a model thereby reducing the model complexity and yet retaining its explanatorypower. In dealing with model complexity, an intriguing question that comes to mind is howpossible is coarse-graining in network? The term course-graining here refers to complexityreduction (see e.g. Erban [150]).For large networks with thousands of genes the number ofdifferential equations required to describe a particular system becomes huge [106]. Thisimplies an increased number of kinetic parameters, e.g. mRNA production and decay ratesand Hill constants. In principle, using parameter sensitivity analysis, some of theseparameters can be coalesced or dropped from the model – leaving a simpler, yet stillpowerful model to describe the network dynamics.
3. DISCUSSION AND CONCLUDING REMARKS
The use of OED to enrich data used in GNR has been exploited in engineering. All thisshows the worth of using OEDs in improving parameter estimation accuracy and precision.More on how OED can be used to improve parameter estimation can be found in the work ofFaller et al. [140]. However, its use is not yet widely embraced in network inference. It wouldbe interesting to see more applications of OEDs in GNR, particularly in parameter estimationproblems as suggested in [47]. Progress in the reconstruction of biological networks hasbeen hugely supported by advancements in data acquisition methods. High-throughputtechnologies have aided quantification of metabolite abundances in cells, e.g. measuring
Annual Research & Review in Biology, 4(4): 577-601, 2014
592
gene transcription using DNA microarrays or Real Time-quantitative Polymerase ChainReaction (RT-qPCR) technique. Integrating different omics datasets, e.g. genomic,transcriptomic and proteomic data drastically improves the quality of network inference [151].The decision of which model formalism to use should be based on data attributes such as:data noise level, data dimension, data type (continuous or discrete, relative or absolute) andthe research goal in consideration. Softwares for analyzing and visualizing data have aidednetwork inference – helping improve our understanding of biological pathways, e.g. theComplex Pathway SImulator ”COPASI” – abiochemical network simulator developed byMendes et al. [152] and its earlier version by Hoops et al. [153]; the correlational basedapproach “Gene Net” by Opgen-Rhein and Strimmer [154]; ”Snazer” – a network analyzerand data visualization software by Mazza et al. [155]; ”Cell Designer” – a tool for modelingbiochemical networks[156][157]. Most of these tools are freely available for download andcan be easily installed and run inthe specific software language in which they were written –although some might only run well on some operating systems. Such information is providedin the software user manuals. Prior to data analysis and/or model fitting, it’s is advisable toensure that data collection criterion, experimental conditions, normalization criteria as soundenough to ensure that the results are trustworthy. Preliminary, prior to deciding whichapproach to use to answer specific research questions or test hypothesis related to networkinference, one can start by looking at the summary of advantages and disadvantages of themethods given in Table 1.
The pace at which algorithms, software, network analysis and inference tools havedeveloped is astonishing– a development that has facilitated analysis and visualization ofhigh-dimensional datasets. Overall, deriving meaningful inferences from biological data is noeasy task. There is need for regular training to update our skills and keep abreast withliterature information and latest developments in the field through interaction with experts inconferences, workshops and/or courses on specialized courses on,e.g. networkreconstruction and mathematical modeling. Given the vast amount of literature, it is easy toget lost in a sea of information and inexperienced individuals in GNR are advised to seek anexpert’s opinion where necessary. Availability of relatively cheap high through-put dataacquisition techniques has revolutionized research on network inference, e.g. recently, therehas been interesting insight into the important role of small RNAs (sRNAs) inposttranscriptional regulation in eukaryotes – particularly in bacteria. The reduced cost ofgenome sequencing and RNA-Seq data in general has made these advancements inuncovering the roles of sRNAs possible, see [158].Such studies have provided insight intothe sRNA functional and regulatory roles. Intensified efforts along this line of research couldsee interesting discoveries in the line of drug discovery, cancer research and a generalimprovement in our understanding of posttranscriptional regulatory events. In a nutshell, themost important attributes in network inference are: (i) the ability to model direct and indirectcyclic regulation, (ii) model dynamics, (iii) robustness even for small dimensional datasets,(iv) the ease of implementation and user-friendliness, and (v) the ability to capture reality inlife with simple models.
In summary, this review article is mainly concerned with single cells rather than theinteraction between cells. Therefore, the work was focused mostly on approaches related tostudies on molecular biology and molecular genetics rather than towards developmentalbiology. During data analysis and network reconstruction it is advisable to pay particularattention to and clearly specify what hypothesis is to be tested, what dataset you intend touse, e.g. gene knock-out data, or time-series data; data quality and dimension; is it discreteor continuous data; what is the noise levels in your data (signal-to-noise ratio), what and howmany parameters are required to describe your network or biochemical system; decide if you
Annual Research & Review in Biology, 4(4): 577-601, 2014
593
are only interested in association between variables or trends in gene expression. It isimportant to identify appropriate data analysis tools: whether it is freely available (openaccess) or commercially available software, scrutinize and pay particular attention to whattype of data is being used, check if the data are from similar experiments, related strains,ensure that the data is properly scaled and normalized. All the above is in an effort to ensureimproved network inference.
ACKNOWLEDGEMENTS
This work was self-sponsored.
COMPETING INTERESTS
The author declares no competing interests.
REFERENCES
1. Lashkari DA, McCusker JH, Davis RW. Whole genome analysis: experimental accessto all genome sequenced segments through larger-scale efficient oligonucleotidesynthesis and PCR. Proc Natl Acad Sci U S A. 1997;94:8945-8947
2. Erdos P, Renyi A. On random graphs. Publicationes Mathematicae. 1959;6:290-2973. Friedman N, Linial M, Nachman I, Pe’er D. Using Bayesian networks to analyze
expression data. J Comput Biol 2000. 2000;7:601-6204. Chen T, He HL, Church GM. Modeling gene expression with differential equations.
Pac. Symp. Biocomp. 1999:29-405. Arnone MI, Davidson EH. The hardwiring of development: organization and function of
genomic regulatory systems. Development. 1997;124:1851-18646. Liang S, Fuhrman S, Somogyi R. REVEAL, A General Reverse Engineering Algorithm
For Inference Of Genetic Network Architectures. In Proc Pac Symp Biocomput WorldScientific Publishing Co. 1998;3:18-29
7. de Jong H. Modeling and simulation of genetic regulatory systems: a literature review.J. Comput. Biol. 2002;9:67–103
8. Gardner TS, Faith JJ. Reverse-engineering transcription control networks. Phys LifeRev. 2005;2:65-88
9. van Someren EP, Wessels LF, Backer E, Reinders MJ. Genetic network modeling.Pharmacogenomics. 2002;3:507-525
10. Schlitt T, Brazma A. Current approaches to gene regulatory network modelling. BMCBioinformatics. 2007;8:S9
11. Bansal M, Belcastro V, Ambesi-Impiombato A, di Bernardo D. How to infer genenetworks from expression profiles. Mol Syst Biol. 2007;3
12. Cho KH, Choo SM, Jung SH, Kim JR, Choi HS, Kim J. Reverse engineering of generegulatory networks. IET Syst Biol. 2007;1:149-163
13. Jeong H, Tombor B, Albert R, Oltvai ZN, Barabasi AL. The large-scale organization ofmetabolic networks. Nature. 2000;5:651-654
14. Zare H, Sangurdekar D, Srivastava P, Kaveh M, Khodursky A. Reconstruction ofEscherichia coli transcriptional regulatory networks via regulon-based associations.BMC Syst. Biol. 2009;3:39
15. Maraziotis IA, Dragomir A, Bezerianos A. Gene networks reconstruction and time-series prediction from microarray data using recurrent neural fuzzy networks. IET SystBiol. 2007;1:41-50
Annual Research & Review in Biology, 4(4): 577-601, 2014
594
16. Keurentjes JJB, Fu J, Terpstra IR, Garcia JM, van den Ackerveken G, Snoek, L.B,Peeters, A.J.M, Vreugdenhil D, Koornneef M, Jansen RC. Regulatory networkconstruction in Arabidopsis by using genome-wide gene expression quantitative traitloci. PNAS. 2007;108:1708-13
17. Ma S, Gong Q, Bohnert HJ. An Arabidopsis gene network based on the graphicalGaussian model. Genome Res. 2007;17:1614-1625
18. Levine AJ, Hu W, Feng Z. The p53 pathway: what questions remain to be explored?.Cell Death Differ. 2006;13:1027-1036
19. Batchelor E, Loewer A, Lahav G. The ups and downs of p53: understanding proteindynamics in single cells. Nat Rev Cancer. 2009;9:371-377
20. Wagner A. Estimating coarse gene network structure from large-scale geneperturbation data. Genome Res. 2002;12:309-315; doi:10.1101/gr.193902
21. de la Fuente A, Brazhnik P, Mendes P. Linking the genes: Inferring quantitative genenetworks from microarray data. Trends Genet. 2002;18:395-398
22. Gardner TS, di Bernardo D, Lorenzo D, Collins JJ. Inferring Genetic Networks andIdentifying Compound Mode of Action via Expression Profiling. Science.2003;301:102-105
23. Friedman N. Inferring cellular networks using probabilistic graphical models. Science.2004;303:799-805
24. di Bernardo D, Thompson MJ, Gardner TS, Chobot SE, Eastwood EL, Wojtovich AP,Elliott SJ, Schaus SE, Collins JJ. Chemogenomic profiling on a genome-wide scaleusing reverse-engineered gene networks. Nat Biotechnol. 2005;23:377-383
25. Rice JJ, Tu Y, Stolovitzky G. Reconstructing biological networks using conditionalcorrelation analysis. Bioinformatics. 2005;21:765-773
26. de la Fuente A, Makhecha DP. Unravelling gene networks from noisyunderdetermined experimental perturbation data. Systematic Biol. 2006;153:257-262
27. Bonneau R, Reiss DJ, Shannon P, Facciotti M, Hood L, Baliga NS, Thorsson V. TheInferelator: An algorithm for learning parsimonious regulatory networks from systems-biology datasets de novo. Genome Biol. 2006;7:R36
28. Faith JJ, Hayete B, Thaden JT, Mogno I, Wierzbowski J, Cottarel G, Kasif S, CollinsJJ, Gardner TS. Large-scale mapping and validation of Escherichia coli transcriptionalregulation from a compendium of expression profiles. PLoS Biol. 2007;5
29. Marbach D, Mattiussi C, Floreano D. Replaying the evolutionary tape: Biomimeticreverse engineering of gene networks. Annals of the New York Academy of Sciences.2009;1158:234-245
30. Brazhnik P, de la Fuente A, Mendes P. Gene networks: how to put the function ingenomics. Trends Biotechnol. 2002;20:467-472
31. Dharwadker A, Pirzada S. Applications of Graph Theory. Proceedings of the instituteof mathematics; 2011
32. Wiener A, Polynomials H. Distance in Molecular Graphs - Theory. In: Gutman I,Furtula B, editors. Altenburg, Wiener, and Hosoya Polynomials; 2011. p. 49-70
33. Kitano H. Foundations of Systems Biology, chapter Systems Biology: Toward Systemlevel Understanding of Biological Systems. MIT Press. 2001:1-29
34. Schafer J, Strimmer K. An empirical Bayes approach to inferring large-scale geneassociation networks. Bioinformatics. 2005;21:754-764
35. Yip KY, Alexander RP, Yan KK, Gerstein M. Improved Reconstruction of In SilicoGene Regulatory Networks by Integrating Knockout and Perturbation Data. PLoS One.2010;5
36. Stolovitzky G, Monroe D, Califano A. Dialogue on Reverse-Engineering Assessmentand Methods: The DREAM of High-Throughput Pathway Inference. In: Stolovitzky Gand Califano A, editor. ; 2007. p. 11-22
Annual Research & Review in Biology, 4(4): 577-601, 2014
595
37. Stolovitzky G, Prill RJ, Califano A. Lessons from the DREAM2 Challenges. Annals ofthe New York Academy of Sciences. 2009;1158:159-95
38. Parisi F, Koeppl H, Naef F. Network inference by combining biologically motivatedregulatory constraints with penalized regression. Ann N Y Acad Sci. 2009;1158:114-24
39. Prill RJ, Marbach D, Saez-Rodriguez J, Sorger PK, Alexopoulos LG, Xue X, ClarkeND, Altan-Bonnet G, Stolovitzky G. Towards a rigorous assessment of systemsbiology models: the DREAM3 challenges. PLoS One. 2010;5
40. Omony J. The Dynamics of the XlnR Regulon in Aspergillus niger: a Systems BiologyApproach. 2012
41. Wagner A. How to reconstruct a large genetic network from n gene perturbations infewer than n2 easy steps. Bioinformatics. 2001;17:1183-1197
42. Miller MA, Feng XJ, Li G, Rabitz HA. Identifying biological network structure, predictingnetwork behavior, and classifying network state with High Dimensional ModelRepresentation (HDMR). PLoS One. 2012;7:e37664;doi:10.1371/journal.pone.0037664; 10.1371/journal.pone.0037664
43. del Rio G, Koschutzki D, Coello G. How to identify essential genes from molecularnetworks?. BMC Syst Biol. 2009;3:102-0509-3-102; doi:10.1186/1752-0509-3-102;10.1186/1752-0509-3-102
44. Cai X, Bazerque JA, Giannakis GB. Inference of gene regulatory networks with sparsestructural equation models exploiting genetic perturbations. PLoS Comput Biol.2013;9:e1003068; doi:10.1371/journal.pcbi.1003068; 10.1371/journal.pcbi.1003068
45. Steinke F, Seeger M, Tsuda K. Experimental design for efficient identification of generegulatory networks using sparse Bayesian models. BMC Syst Biol. 2007;1:51;doi:10.1186/1752-0509-1-51
46. Steiert B, Raue A, Timmer J, Kreutz C. Experimental design for parameter estimationof gene regulatory networks. PLoS One. 2012;7:e40052;doi:10.1371/journal.pone.0040052; 10.1371/journal.pone.0040052
47. Omony J, Mach-Aigner AR, de Graaff LH, van Straten G, van Boxtel AJB. Evaluationof design strategies for time course experiments in genetic networks: case study of theXlnR regulon in Aspergillus niger. IEEE/ACM Trans Comput Biol Bioinform.2012;9:1316-1325
48. Zak DE, Gonye GE, Schwaber JS, Doyle III FJ. Importance of input perturbations andstochastic gene expression in the reverse engineering of genetic regulatory networks:insights from an identifiability analysis of an in silico network. Genome Res.2003;13:2396-2405
49. Sachs K, Perez O, Pe’er D, Lauffenburger DA. Causal Protein-Signaling NetworksDerived from Multiparameter Single-Cell Data. Science. 2005;308:523-529
50. Nabatame S, Iba H. Estimation of Gene Regulatory Network Using StochasticDifferential Equation Model. 2006
51. de Hoon M, Imoto S, Kobayashi K, Ogasawara N, Miyano S. Inferring gene regulatorynetworks from time-ordered gene expression data of Bacillus subtilis using differentialequations. Proc. Pac. Symp. Biocomp. 2003;8:17-28
52. Vu TT, Vohradsky J. Nonlinear differential equation model for quantification oftranscriptional regulation applied to microarray data of Saccharomyces cerevisiae.Nucleic Acids Research. 2007;35:279-287
53. Ropers D, de Jong H, Page M, Schneider D, Geiselmann J. Qualitative Simulation ofthe Nutritional Stress Response in Escherichia coli. INRIA, Rapport de Reacherche.2004
54. Kim SY, Imoto S, Miyano S. Infering gene networks from time series microarray datausing dynamic Bayesian networks. Briefings in Bioinformatics. 2003;4:228-235.
Annual Research & Review in Biology, 4(4): 577-601, 2014
596
55. Nachman I, Regev A, Friedman N. Inferring quantitative models of regulatory networksfrom expression data. Bioinformatics. 2004;20 Suppl 1:i248-56;doi:10.1093/bioinformatics/bth941.
56. Ong IM, Glasner JD, Page D. Modelling regulatory pathways in E. coli from time seriesexpression profiles Bioinformatics. ISMB2002. 2002.
57. Chen X, Chen M, Ning K. BNArray: an R package for constructing gene regulatorynetworks from microarray data by using Bayesian network. Bioinformatics.2006;22:2952-2954; doi:10.1093/bioinformatics/btl491
58. Spirtes P, Glymour G, Kauffman S, Aimalie V, Wimberly F. Constructing bayesiannetwork models of gene expression networks from microarray data. Proc. AtlanticSymp. Comp. Biol., Genome Information Systems & Technology. 2000
59. Ong IM, Page D. Inferring regulatory pathways in E. coli using dynamic Bayesiannetworks. Technical Report 1426, University of Wisconsin-Madison. 2001
60. Rogers S, Girolami M. A Bayesian regression approach to the inference of regulatorynetworks from gene expression data. Bioinformatics. 2005;21:3131-3137;doi:10.1093/bioinformatics/bti487
61. Zou M, Conzen SD. A new dynamic Bayesian network (DBN) approach for identifyinggene regulatory networks from time course microarray data. Bioinformatics.2005;21:71-79; doi:10.1093/bioinformatics/bth463
62. Zhang Y, Deng Z, Jiang H, Jia P. Dynamic Bayesian Network (DBN) with StructureExpectation Maximization (SEM) for Modeling of Gene Network from Time SeriesGene Expression Data. BIOCOMP. 2006:41-47
63. Pe'er D, Regev A, Elidan G, Friedman N. Inferring subnetworks from perturbedexpression profiles. Bioinformatics. 2001;17 Suppl 1:S215-24
64. Soinov LA, Krestyaninova MA, Brazma A. Towards reconstruction of gene networksfrom expression data by supervised learning. Genome Biol. 2003;4:R6
65. Cerulo L, Elkan C, Ceccarelli M. Learning gene regulatory networks from only positiveand unlabeled data. BMC Bioinformatics. 2010;11:228-2105-11-228;doi:10.1186/1471-2105-11-228; 10.1186/1471-2105-11-228
66. Schafer J, Opgen-Rhein R, Strimmer K. Reverse Engineering Genetic Networks usingthe GeneNet Package. R News. 2006;6
67. Kauffman SA. Metabolic stability and epigenesis in randomly constructed genetic nets.J Theor Biol. 1969;22:437-467
68. Werhli AV, Grzegorczyk M, Husmeier D. Comparative evaluation of reverseengineering gene regulatory networks with relevance networks, graphical gaussianmodels and bayesian networks. Bioinformatics. 2006;22:2523-2531;doi:10.1093/bioinformatics/btl391
69. Pearl J. Causality: Models, Reasoning, and Inference. Cambridge University Press.2000
70. Murphy K, Mian S. Modelling Gene Expression Data Using Dynamic BayesianNetworks. Technical Report. 1999
71. Heckerman D. Bayesian Networks for Data Mining. Data Mining and KnowledgeDiscovery. 1997;1:79-119
72. Marbach D, Prill RJ, Schaffter T, Mattiussi C, Floreano D, Stolovitzky G. Revealingstrengths and weaknesses of methods for gene network inference. PNAS.2010;107:6286-6291
73. Iancu OD, Kawane S, Bottomly D, Searles R, Hitzemann R, McWeeney S. UtilizingRNA-Seq data for de novo coexpression network inference. Bioinformatics.2012;28:1592-1597; doi:10.1093/bioinformatics/bts245; 10.1093/bioinformatics/bts245
Annual Research & Review in Biology, 4(4): 577-601, 2014
597
74. Pihur V, Datta S, Datta S. Reconstruction of genetic association networks frommicroarray data: a partial least squares approach. Bioinformatics. 2008;24:561-568;doi:10.1093/bioinformatics/btm640; 10.1093/bioinformatics/btm640
75. Bansal M, Della Gatta G, di Bernardo D. Inference of gene regulatory networks andcompound mode of action from time course gene expression profiles. Bioinformatics.2006;22:815-822; doi:10.1093/bioinformatics/btl003
76. Wiener N. The theory of prediction. In Modern Mathematics for Engineers. Volume 1.Edited by Beckenbach EF. ed. New York: McGraw-Hill; 1956.; 1956
77. Zou C, Ladroue C, Guo S, Feng J. Identifying interactions in the time and frequencydomains in local and global networks - A Granger Causality Approach. BMCBioinformatics. 2010;11:337
78. Granger C. Investigating causal relations by econometric models and cross-spectralmethods. Econometrica. 1969;37:424-438
79. Mukhopadhyay ND, Chatterjee S. Causality and pathway search in microarray timeseries experiment. Bioinformatics. 2007;23:442-449; doi:10.1093/bioinformatics/btl598
80. Chen Y, Rangarajan G, Feng J, Ding M. Analyzing multiple nonlinear time series withextended Granger causality. Phys Lett. 2004;324:26-35
81. Nagarajan R. A note on inferring acyclic network structures using Granger causalitytests. Int J Biostat. 2009;5:Article 10-4679.1119; doi:10.2202/1557-4679.1119;10.2202/1557-4679.1119
82. Fujita A, Severino P, Sato JR, Miyano S. Granger causality in systems biology:modeling gene networks in time series microarray data using vector autoregressivemodels. Proceeding BSB2010 Proceedings of the Advances in bioinformatics andcomputatiional biology, and 5th Brazilian conference on Bioinformatics. 2010
83. de la Fuente A, Bing N, Hoeschele I, Mendes P. Discovery of meaningful associationsin genomic data using partial correlation coefficients. Bioinformatics. 2004;20:3565-3574; doi:10.1093/bioinformatics/bth445
84. Magwene PM, Kim J. Estimating genomic coexpression networks using first-orderconditional independence. Genome Biol. 2004;5:R100; doi:10.1186/gb-2004-5-12-r100
85. Reverter A, Chan EK. Combining partial correlation and an information theoryapproach to the reversed engineering of gene co-expression networks. Bioinformatics.2008;24:2491-2497; doi:10.1093/bioinformatics/btn482; 10.1093/bioinformatics/btn482
86. Butte AS, Kohane IS. Mutual information relevance networks: functional genomicclustering using pairwise entropy measurements. Proc. Pac. Symp. Biocomput.2000:418-429
87. Thomas R, d’Ari R. Biological Feedback. CRC, Press, Boca Raton. 199088. Hopcroft JE, Motwani R, Ullman JD. Introduction to Automata Theory, Languages, and
Computation. Addison Wesley, Boston, MA, USA; 200689. Shmulevich I, Dougherty ER, Zhang W. From Boolean to probabilistic Boolean
networks as models of genetic regulatory networks. Proceedings of the IEEE.2002;90:1792
90. Dougherty ER, Shmulevich I. Mappings Between Probabilistic Boolean Networks.Signal Processing. 2003;83:799-809
91. Shmulevich I, Kauffman SA. Activities and sensitivities in boolean network models.Phys Rev Lett. 2004;93:048701
92. Hashimoto RF, Kim S, Shmulevich I, Zhang W, Bittner ML, Dougherty ER. Growinggenetic regulatory networks from seed genes. Bioinformatics. 2004;20:1241-1247;doi:10.1093/bioinformatics/bth074
93. Rocke DM, Durbin B. A Model for Measurement Error for Gene Expression Arrays. J.Comput. Biol. 2001;8:557-569
Annual Research & Review in Biology, 4(4): 577-601, 2014
598
94. Palsson BO. Systems Biology: Properties of Reconstructed Networks. Cambridgeuniversity press: UK; 2006
95. Newman MEJ. Networks: An Introduction. Oxford university press: Oxford, UK; 201096. Alon U. An Introduction to Systems Biology: Design Principles of Biological Circuits.
Boca Raton, FL: Chapman and Hall / CRC Press; 200697. Alon U. Network motifs: theory and experimental approaches. Nat. Rev. Genet.
2007;8:450-46198. Huang S. Gene expression profiling, genetic networks, and cellular states: an
integrating concept for tumorigenesis and drug discovery. J Mol Med (Berl).1999;77:469-480
99. Repsilber D, Liljenstrom H, Andersson SG. Reverse engineering of regulatorynetworks: simulation studies on a genetic algorithm approach for ranking hypotheses.BioSystems. 2002;66:31-41
100. Dimitrova E, Garcia-Puenteb LD, Hinkelmann F, Jarrah AS, Laubenbacher R, StiglereB, Vera-Licona P. Parameter estimation for Boolean models of biological networks.Theoretical Computer Science. 2010;412:2816-2826
101. Ideker TE, V T, Karp RM. Discovery of regulatory interactions through perturbation:inference and experimental design. Pac. Symp. Biocomput. 2000;5:302-313
102. Shmulevich I, Zhang W. Binary analysis and optimization-based normalization of geneexpression data. Bioinformatics. 2002;18:555-565
103. Steggles LJ, Banks R, Shaw O, Wipat A. Qualitatively modelling and analysing geneticregulatory networks: a Petri net approach. Bioinformatics. 2007;23:336-343;doi:10.1093/bioinformatics/btl596
104. Somogyi R, Sniegoski CA. Modeling the complexity of genetic networks:Understanding multigene and pleiotropic regulation. Complexity. 1996;1:45
105. August E, Papachristodoulou A. Efficient, sparse biological network determination.BMC Syst Biol. 2009;3:25-0509-3-25; doi:10.1186/1752-0509-3-25; 10.1186/1752-0509-3-25
106. Bornholdt S. Less Is More In Modeling Large Genetic Networks. Systems Biology(Perspectives), Science. 2005;310:449-451
107. Shi Y, Mitchell T, Bar-Joseph Z. Inferring pairwise regulatory relationships frommultiple time series datasets. Bioinformatics. 2007;23:755-763
108. de Hoon MJ, Makita Y, Nakai K, Miyano S. Prediction of transcriptional terminators inBacillus subtilis and related species. PLoS Comput Biol. 2005;1:e25;doi:10.1371/journal.pcbi.0010025
109. Mazur J, Ritter D, Reinelt G, Kaderali L. Reconstructing nonlinear dynamic models ofgene regulation using stochastic sampling. BMC Bioinformatics. 2009;10:448
110. Kimura S, Araki D, Matsumura K, Okada-Hatakeyama M. Inference of S-systemmodels of genetic networks by solving one-dimensional function optimizationproblems. Math Biosci. 2012;235:161-170; doi:10.1016/j.mbs.2011.11.008;10.1016/j.mbs.2011.11.008
111. Kikuchi S, Tominaga D, Arita M, Takahashi K, Tomita M. Dynamic modeling of geneticnetworks using genetic algorithm and S-system. Bioinformatics. 2003;19:643-650
112. Thomas R, Mehrotra S, Papoutsakis E, Hatzimanikatis V. A model-based optimizationframe-work for the inference on gene regulatory networks from dna array data.Bioinformatics. 2004;20:3221-3235
113. Almeida JS, Voit EO. Neural-network-based parameter estimation in S-system modelsof biological networks. Genome Inform. 2003;14:114-123
114. Spieth C, Streichert F, Speer N, Zell A. A memetic inference method for generegulatory networks based on S-systems. 2004:152-157
Annual Research & Review in Biology, 4(4): 577-601, 2014
599
115. Norman N, Iba H. Inference of gene regulatory networks using S-system anddifferential evolution. 2005:439-446.
116. Cho DY, Cho KH, Zhang BT. Identification of biochemical networks by S-tree basedgenetic programming. Bioinformatics. 2006;22:1631-1640;doi:10.1093/bioinformatics/btl122.
117. Voit EO. Computational Analysis of Biochemical Systems. Cambridge UniversityPress; 2000
118. Kabir M, Noman N, Iba H. Reverse engineering gene regulatory network frommicroarray data using linear time-variant model. BMC Bioinformatics. 2010;11 Suppl1:S56-2105-11-S1-S56; doi:10.1186/1471-2105-11-S1-S56; 10.1186/1471-2105-11-S1-S56.
119. Zhan C, Yeung LF. Parameter estimation in systems biology models using splineapproximation. BMC Syst. Biol. 2011;5:14.
120. Hofmeyr JH, Cornish-Bowden A. The reversible Hill equation: how to incorporatecooperative enzymes into metabolic models. Comput Appl Biosci. 1997;13:377-385.
121. Mendes P, Sha W, Ye K. Artificial gene networks for objective comparison of analysisalgorithms. Bioinformatics. 2003;19:ii122–ii129.
122. Fersht A. Enzyme structure and mechanism. In: W. H. Freeman and Company, NewYork, editor. ; 1985.
123. Singhania R, Sramkoski RM, Jacobberger JW, Tyson JJ. A Hybrid Model ofMammalian Cell Cycle Regulation. PloS Comp Biol. 2011;7:e100107.
124. Fisher RA. On an absolute criterion for fitting frequency curves. Messenger ofMathematics. 1912;41:155-160
125. Ljung L. Systems identification. Theory for the user Prentice Hall PRT. 1999;21.126. Polynikis A, Hogan SJ, di Bernardo M. Comparing different ODE modeling approaches
of gene regulatory networks. J. Theor. Biol. 2009;261:511-530.127. Kasabov NK, Chan ZSH, Jain V, Sidorov I, Dimitrov DS. Gene Regulatory Network
Discovery from Time series Gene Expression Data - A Computational IntelligenceApproach. ICONIP. 2004;3316:1344-1353.
128. Zhang Y, Xuan J, de los Reyes BG, Clarke R, Ressom HW. Reverse engineeringmodule networks by PSO-RNN hybrid modeling. BMC Genomics. 2009;10 Suppl1:S15-2164-10-S1-S15; doi:10.1186/1471-2164-10-S1-S15; 10.1186/1471-2164-10-S1-S15.
129. Rodriguez-Fernandez M, Mendes P, Banga JR. A hybrid approach for efficient androbust parameter estimation in biochemical pathways. BioSystems. 2006;83:248-265;doi:10.1016/j.biosystems.2005.06.016.
130. Chang C, Ding Z, Hung YS, Fung PCW. Fast network component analysis (FastNCA)for gene regulatory network reconstruction from microarray data. Bioinformatics.2008;24:1349-1358.
131. Kaern M, Blake WJ, Collins JJ. The engineering of gene regulatory networks. AnnuRev Biomed Eng. 2003;5:179-206; doi:10.1146/annurev.bioeng.5.040202.121553
132. Laubenbacher R, Stigler B. A computational algebra approach to the reverseengineering of gene regulatory networks. J Theor Biol. 2004;229:523-537;doi:10.1016/j.jtbi.2004.04.037.
133. Lee SI, Batzoglou S. Application of independent component analysis to microarrays.Genome Biol. 2003;4:R76; doi:10.1186/gb-2003-4-11-r76.
134. Alter O, Brown PO, Botstein D. Singular value decomposition for genome-wideexpression data processing and modeling. Proc Natl Acad Sci U S A. 2000;97:10101-10106.
135. Yeung MKS, Tegner J, Collins JJ. Reverse engineering gene networks using singularvalue decomposition and robust regression. Proc. Natl. Acad. Sci. 2002;99:6163-6168.
Annual Research & Review in Biology, 4(4): 577-601, 2014
600
136. Yang E, van Nimwegen E, Zavolan M, Rajewsky N, Schroeder M, Magnasco M,Darnell Jr JE. Decay rates of human mRNAs: correlation with functional characteristicsand sequence attributes. Genome Res. 2003;13:1863–1872; doi:doi:10.1101/gr.997703.
137. Chou IC, Voit EO. Recent developments in parameter estimation and structureidentification of biochemical and genomic systems. Math. Biosci. 2009;219:57–83;doi:doi: 0.1016/j.mbs.2009.03.002.
138. Casey FP, Baird D, Feng Q, Gutenkunst RN, Waterfall JJ, Myers CR, Brown KS,Cerione RA, Sethna JP. Optimal experimental design in an epidermal growth factorreceptor signalling and down-regulation model. IET Syst Biol. 2007;1:190-202.
139. Banga. J.R, Versyck KJ, van Impe JF. Computation of optimal identificationexperiments for nonlinear dynamic process models: a stochastic global optimizationapproach. Ind Eng Chem Res. 2002;41:2425-2430.
140. Faller D, Klingmuller U, Timmer J. Simulation methods for optimal experimental designin systems biology. Simulation-Transactions of the Society for Modeling andSimulation International. 2003;79:717-725.
141. Gadkar KG, Gunawan R, Doyle III FJ. Iterative approach to model identification ofbiological networks. BMC Bioinformatics 2005. 2005;6:155.
142. Balsa-Canto E, Alonso AA, Banga JR. An optimal identification procedure for modeldevelopment in systems biology; 2007.
143. Bourque G, Sankoff D. Improving gene network inference by comparing expressiontime-series across species, developmental stages or tissues. J Bioinform Comput Biol.2004;2:765-783.
144. Farid DM, Hoa NH, Darmont J, Harbi N, Rahman MZ. Scaling up Detection Rates andReducing False Positives in Intrusion Detection using NBTree. World Academy ofScience, Engineering and Technology. 2010;40.
145. 145. Zhang X, Liu K, Liu ZP, Duval B, Richer JM, Zhao XM, Hao JK, Chen L.NARROMI: a noise and redundancy reduction technique improves accuracy of generegulatory network inference. Bioinformatics. 2013;29:106-113;doi:10.1093/bioinformatics/bts619; 10.1093/bioinformatics/bts619.
146. Kim J, Bates DG, Postlethwaite I, Heslop-Harrison P, Cho KH. Least-squares methodsfor identifying biochemical regulatory networks from noisy measurements. BMCBioinformatics. 2007;8:8; doi:10.1186/1471-2105-8-8.
147. Kanehisa M, Goto S, Hattori M, Aoki-Kinoshita KF, Itoh M, Kawashima S, Katayama T,Araki M, Hirakawa M. From genomics to chemical genomics: new developments inKEGG. Nucleic Acids Res. 2006;34:D354-7; doi:10.1093/nar/gkj102.
148. Akutsu T, Miyano S, Kuhara S. Identification of genetic networks from a small numberof gene expression patterns under the Boolean network model. Proc. Pacific Symp.Biocomput. 1999;4:17-28
149. DAlche Buc F, Schachter V. Modeling and identification of biological networks.International Symposium on Applied Stochastic Models and Data Analysis. 2005
150. Erban R, Kevrekidis IG, Adalsteinsson D, Elston TC. Gene regulatory networks: acoarse-grained, equation-free approach to multiscale computation. J Chem Phys.2006;124:084106; doi:10.1063/1.2149854
151. Hecker M, Lambeck S, Toepfer S, van Someren E, Guthke R. Gene regulatorynetwork inference: data integration in dynamic models-a review. BioSystems.2009;96:86-103; doi:10.1016/j.biosystems.2008.12.004;10.1016/j.biosystems.2008.12.004.
152. Mendes P, Hoops S, Sahle S, Gauges R, Dada J, Kummer U. Computationalmodeling of biochemical networks using COPASI. Methods Mol Biol. 2009;500:17-59;doi:10.1007/978-1-59745-525-1_2; 10.1007/978-1-59745-525-1_2 .
Annual Research & Review in Biology, 4(4): 577-601, 2014
601
153. Hoops S, Sahle S, Gauges R, Lee C, Pahle J, Simus N, Singhal M, Xu L, Mendes P,Kummer U. COPASI--a COmplex PAthway SImulator. Bioinformatics. 2006;22:3067-3074; doi:10.1093/bioinformatics/btl485.
154. Opgen-Rhein R, Strimmer K. From correlation to causation networks: a simpleapproximate learning algorithm and its application to high-dimensional plant geneexpression data. BMC Syst Biol. 2007;1:37; doi:10.1186/1752-0509-1-37.
155. Mazza T, Iaccarino G, Priami C. Snazer: the simulations and networks analyzer. BMCSyst Biol. 2010;4:1-0509-4-1; doi:10.1186/1752-0509-4-1; 10.1186/1752-0509-4-1.
156. Funahashi A, Tanimura N, Morohashi M, Kitano H. CellDesigner: a process diagrameditor for gene-regulatory and biochemical networks. BIOSILICO. 2003;1:162.
157. Funahashi A, Matsuoka Y, Jouraku A, Morohashi M, Kikuchi N, Kitano H. CellDesigner3.5: A Versatile Modeling Tool for Biochemical Networks. In Proceedings of the IEEE.2008;96:1254-1265.
158. Modi SR, Camacho DM, Kohanski MA, Walker GC, Collins JJ. Functionalcharacterization of bacterial sRNAs using a network biology approach. Proc Natl AcadSci U S A. 2011;108:15522-15527; doi:10.1073/pnas.1104318108;10.1073/pnas.1104318108.
_______________________________________________________________________© 2014 Omony ; This is an Open Access article distributed under the terms of the Creative Commons AttributionLicense (http://creativecommons.org/licenses/by/3.0), which permits unrestricted use, distribution, and reproductionin any medium, provided the original work is properly cited.
Peer-review history:The peer review history for this paper can be accessed here:
http://www.sciencedomain.org/review-history.php?iid=316&id=32&aid=2478