Embed Size (px)
Citation preview
Biological Models Used to Evaluate Medium-Term Impacts
9-January-2004
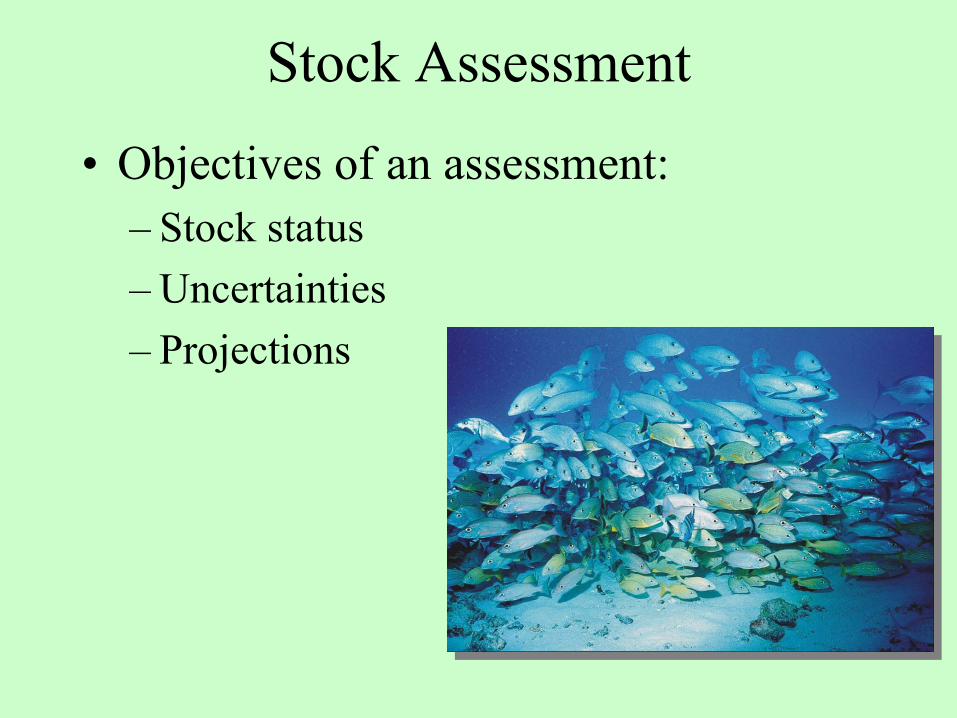
Stock Assessment
• Objectives of an assessment:– Stock status– Uncertainties– Projections
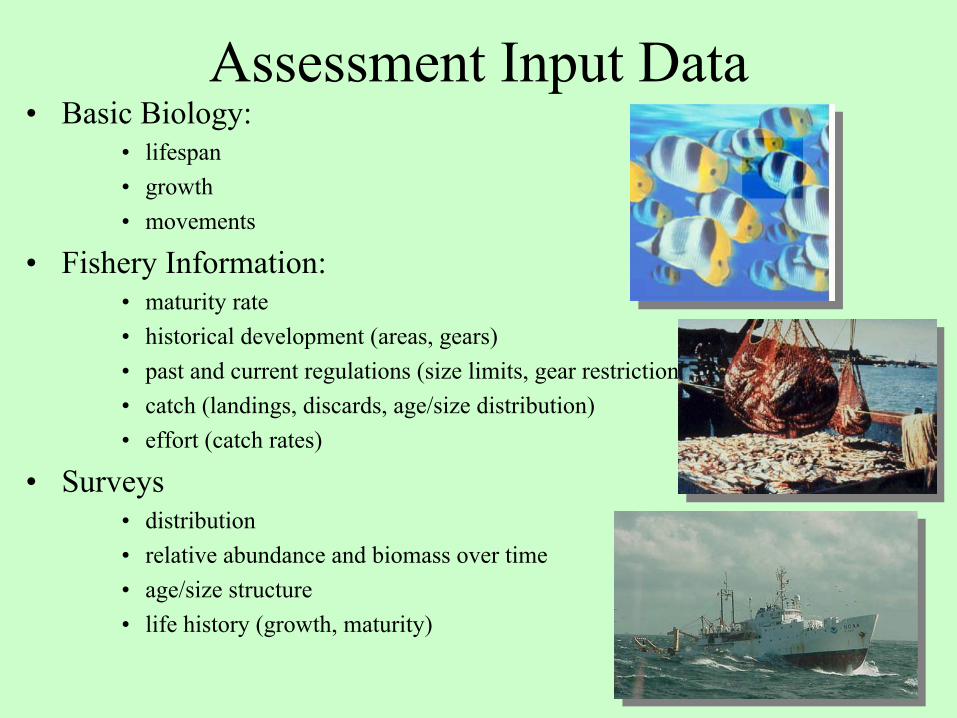
Assessment Input Data• Basic Biology:
• lifespan • growth • movements
• Fishery Information:• maturity rate• historical development (areas, gears)• past and current regulations (size limits, gear restrictions).• catch (landings, discards, age/size distribution)• effort (catch rates)
• Surveys• distribution• relative abundance and biomass over time• age/size structure• life history (growth, maturity)
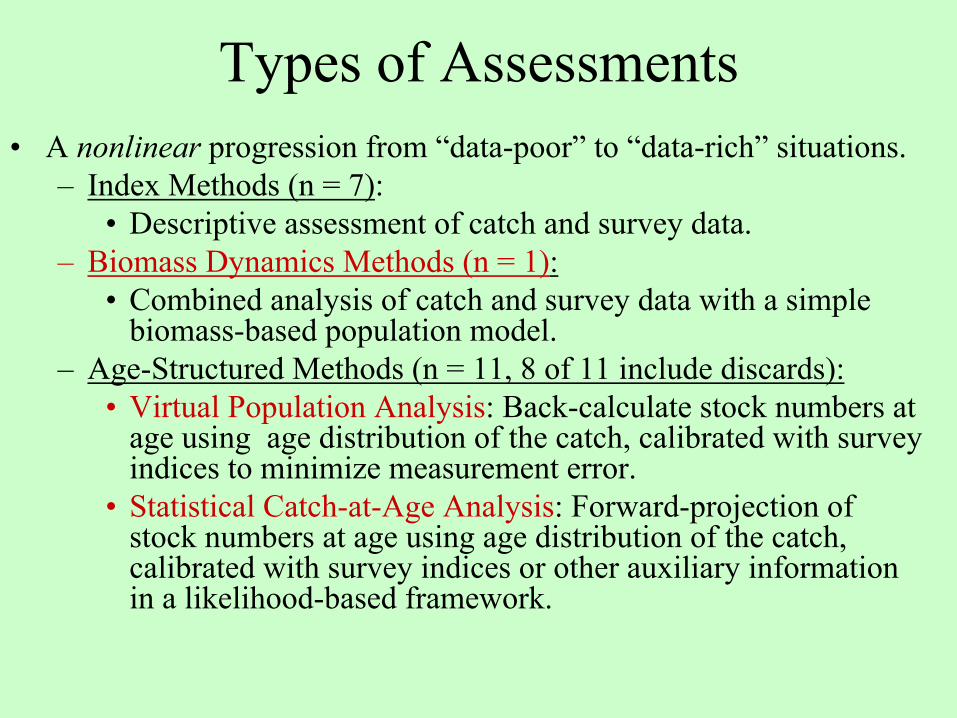
Types of Assessments• A nonlinear progression from “data-poor” to “data-rich” situations.
– Index Methods (n = 7):• Descriptive assessment of catch and survey data.
– Biomass Dynamics Methods (n = 1):• Combined analysis of catch and survey data with a simple
biomass-based population model.– Age-Structured Methods (n = 11, 8 of 11 include discards):
• Virtual Population Analysis: Back-calculate stock numbers at age using age distribution of the catch, calibrated with surveyindices to minimize measurement error.
• Statistical Catch-at-Age Analysis: Forward-projection of stock numbers at age using age distribution of the catch, calibrated with survey indices or other auxiliary information in a likelihood-based framework.
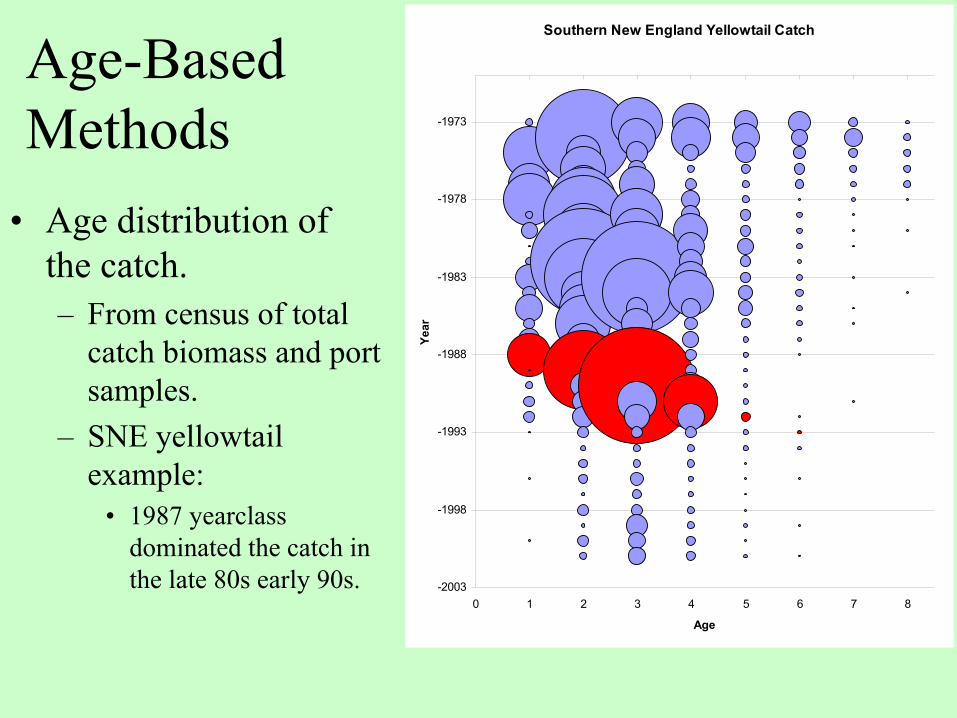
Age-Based Methods
• Age distribution of the catch.– From census of total
catch biomass and port samples.
– SNE yellowtail example:
• 1987 yearclass dominated the catch in the late 80s early 90s.
Southern New England Yellowtail Catch
-2003
-1998
-1993
-1988
-1983
-1978
-1973
0 1 2 3 4 5 6 7 8
Age
Year
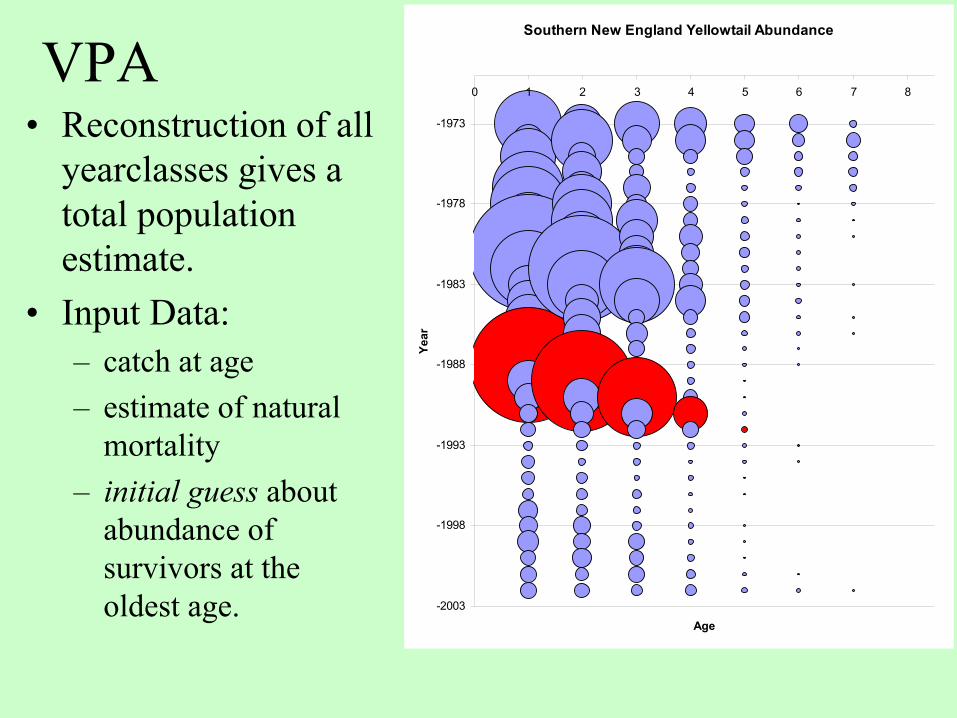
VPA• Reconstruction of all
yearclasses gives a total population estimate.
• Input Data:– catch at age– estimate of natural
mortality– initial guess about
abundance of survivors at the oldest age.
Southern New England Yellowtail Abundance
-2003
-1998
-1993
-1988
-1983
-1978
-1973
0 1 2 3 4 5 6 7 8
Age
Year
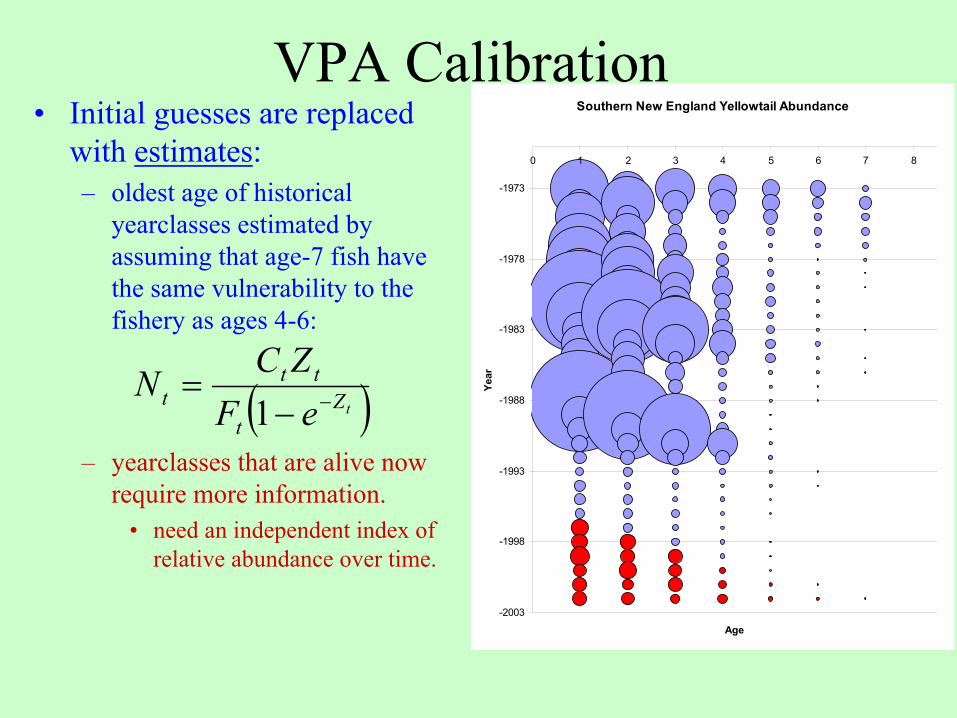
VPA Calibration• Initial guesses are replaced
with estimates:– oldest age of historical
yearclasses estimated by assuming that age-7 fish have the same vulnerability to the fishery as ages 4-6:
– yearclasses that are alive now require more information.
• need an independent index of relative abundance over time.
Southern New England Yellowtail Abundance
-2003
-1998
-1993
-1988
-1983
-1978
-1973
0 1 2 3 4 5 6 7 8
Age
Year
( )tZt
ttt eF
ZCN −−=
1
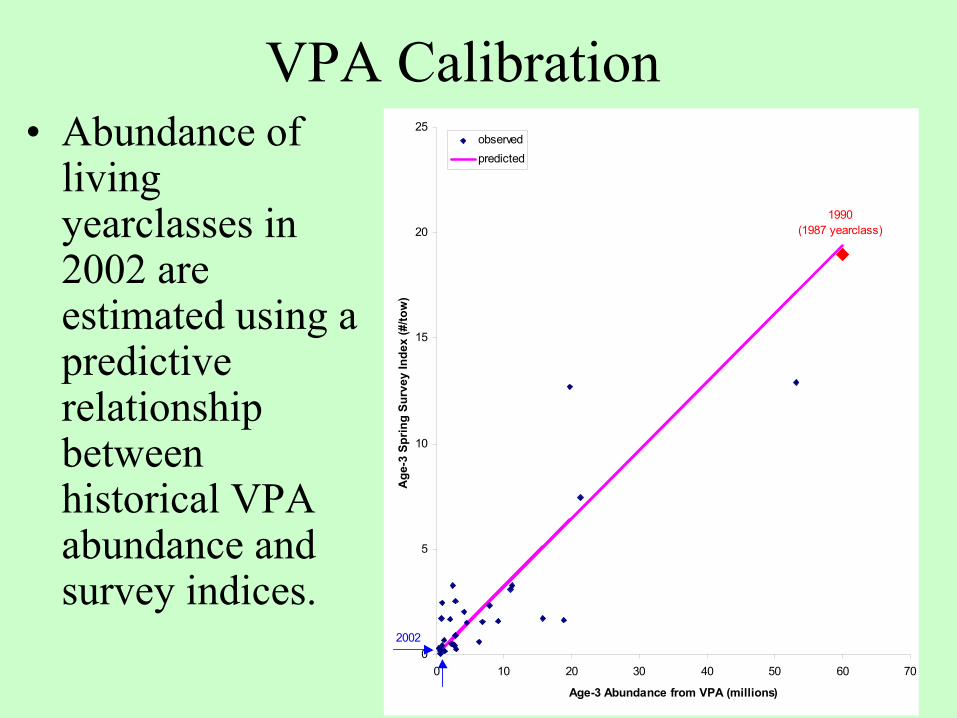
VPA Calibration• Abundance of
living yearclasses in 2002 are estimated using a predictive relationship between historical VPA abundance and survey indices.
0
5
10
15
20
25
0 10 20 30 40 50 60 70
Age-3 Abundance from VPA (millions)
Age
-3 S
prin
g Su
rvey
Inde
x (#
/tow
)
observedpredicted
2002
1990(1987 yearclass)
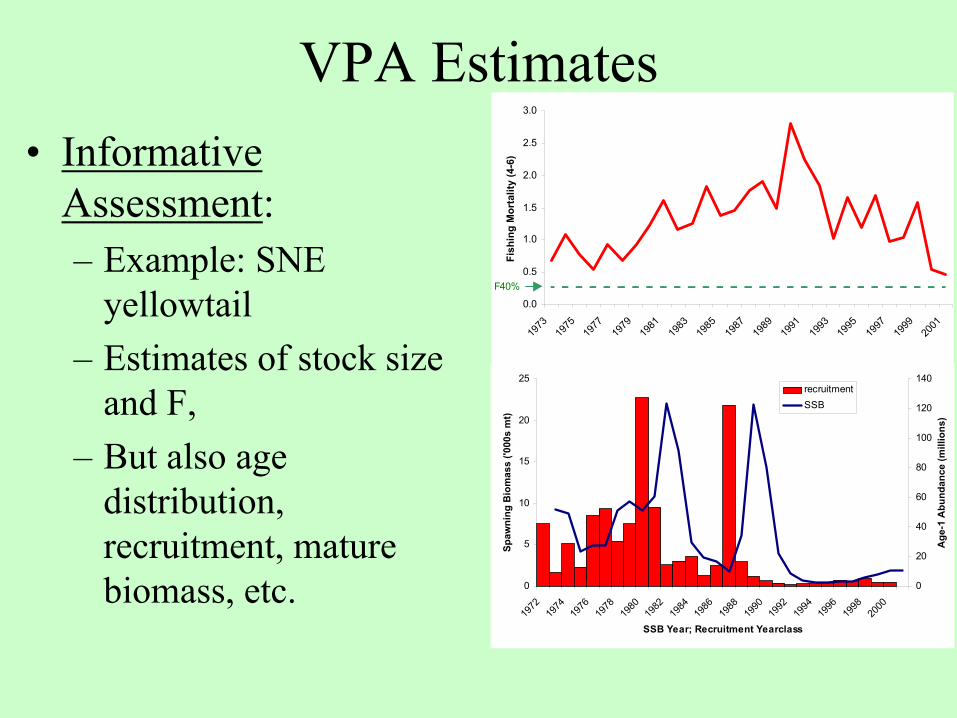
VPA Estimates• Informative
Assessment:– Example: SNE
yellowtail– Estimates of stock size
and F,– But also age
distribution, recruitment, mature biomass, etc.
0.0
0.5
1.0
1.5
2.0
2.5
3.0
1973
1975
1977
1979
1981
1983
1985
1987
1989
1991
1993
1995
1997
1999
2001
Fish
ing
Mor
talit
y (4
-6)
F40%
0
5
10
15
20
25
1972
1974
1976
1978
1980
1982
1984
1986
1988
1990
1992
1994
1996
1998
2000
SSB Year; Recruitment Yearclass
Spaw
ning
Bio
mas
s ('0
00s
mt)
0
20
40
60
80
100
120
140
Age
-1 A
bund
ance
(mill
ions
)
recruitmentSSB
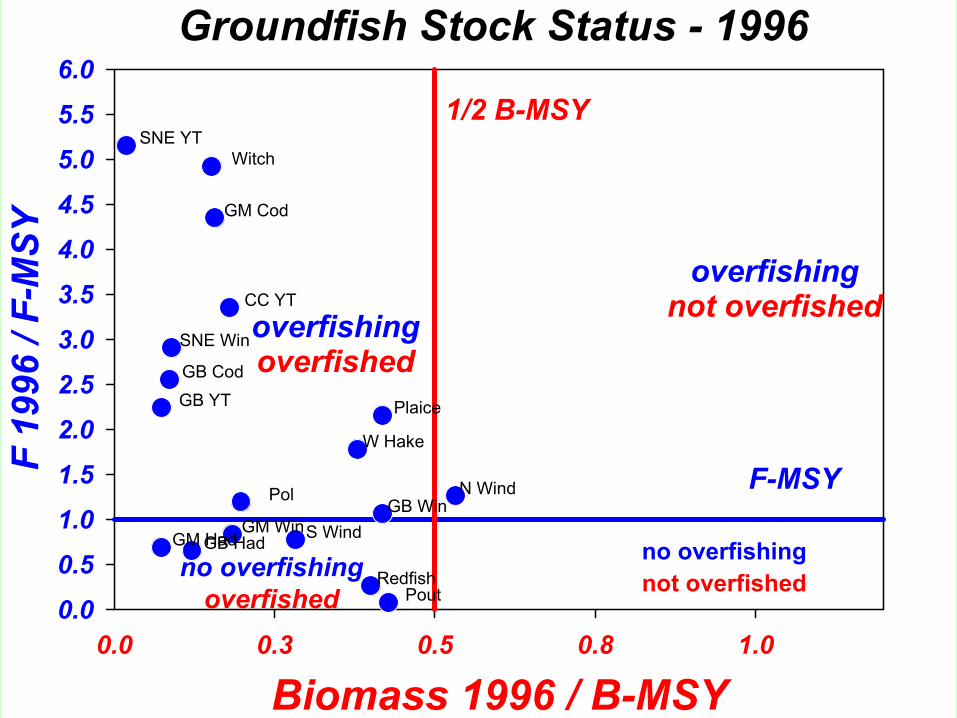
Groundfish Stock Status - 1996
Biomass 1996 / B-MSY0.0 0.3 0.5 0.8 1.0
F 19
96 /
F-M
SY
0.00.51.01.52.02.53.03.54.04.55.05.56.0
GM Cod
GB Cod
GM HadGB Had
CC YT
GB YT
SNE YTWitch
Plaice
GM WinGB Win
SNE Win
W Hake
Pol
RedfishPout
N Wind
S Wind
overfishingnot overfished
no overfishingoverfished
no overfishingnot overfished
overfishingoverfished
F-MSY
1/2 B-MSY
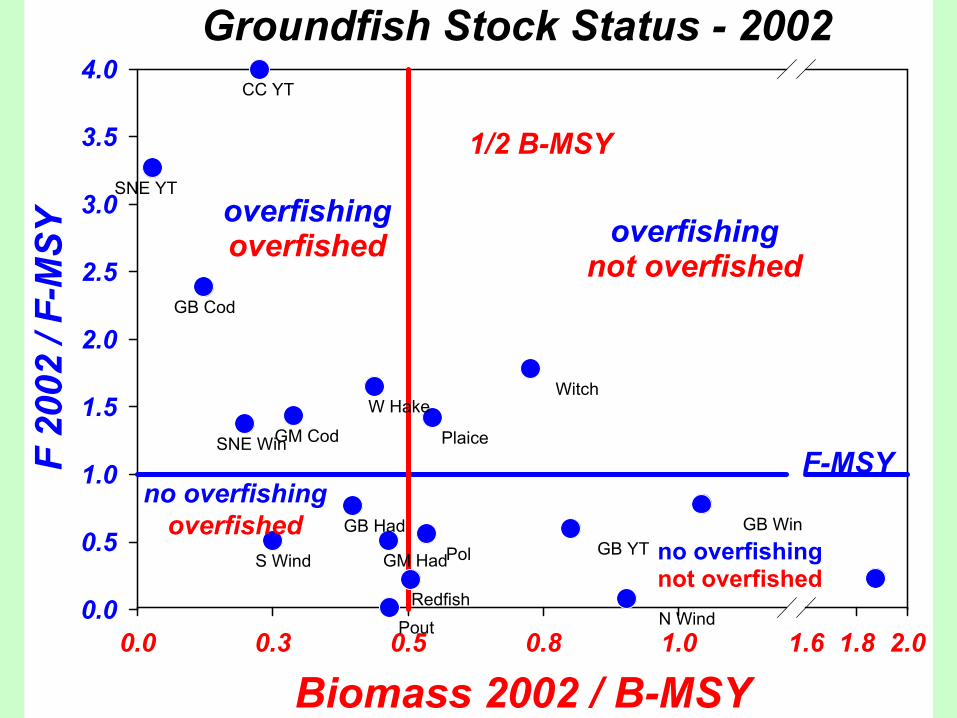
Groundfish Stock Status - 2002
Biomass 2002 / B-MSY0.0 0.3 0.5 0.8 1.0 1.6 1.8 2.0
F 20
02 /
F-M
SY
0.0
0.5
1.0
1.5
2.0
2.5
3.0
3.5
4.0
GM Cod
GB Cod
GM Had
GB Had
CC YT
GB YT
SNE YT
Witch
Plaice
GB Win
SNE Win
W Hake
Pol
RedfishPout N Wind
S Wind
overfishingnot overfished
no overfishingoverfished
no overfishingnot overfished
overfishingoverfished
F-MSY
1/2 B-MSY
VPA Uncertainty
• Similar to production model: survey measurement errors are reshuffled many times to estimate precision. (“bootstrapping”).
• The estimate of 2001 SSB is 1850mt, with a 80% confidence limit of 1500 to 2500mt.
SNE Yellowtail
0
10
20
30
40
50
60
70
1200
1300
1400
1500
1600
1700
1800
1900
2000
2100
2200
2300
2400
2500
2600
2700
2800
2900
3000
3100
3200
3300
2001 SSB (mt)
Freq
uenc
y
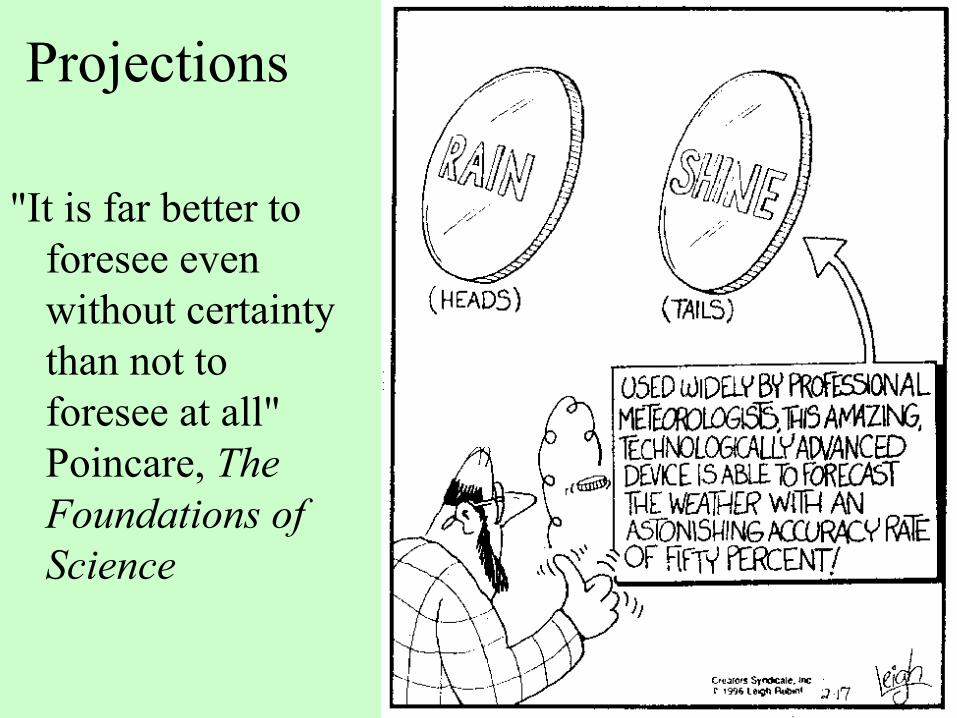
Projections
"It is far better to foresee even without certainty than not to foresee at all" Poincare, The Foundations of Science
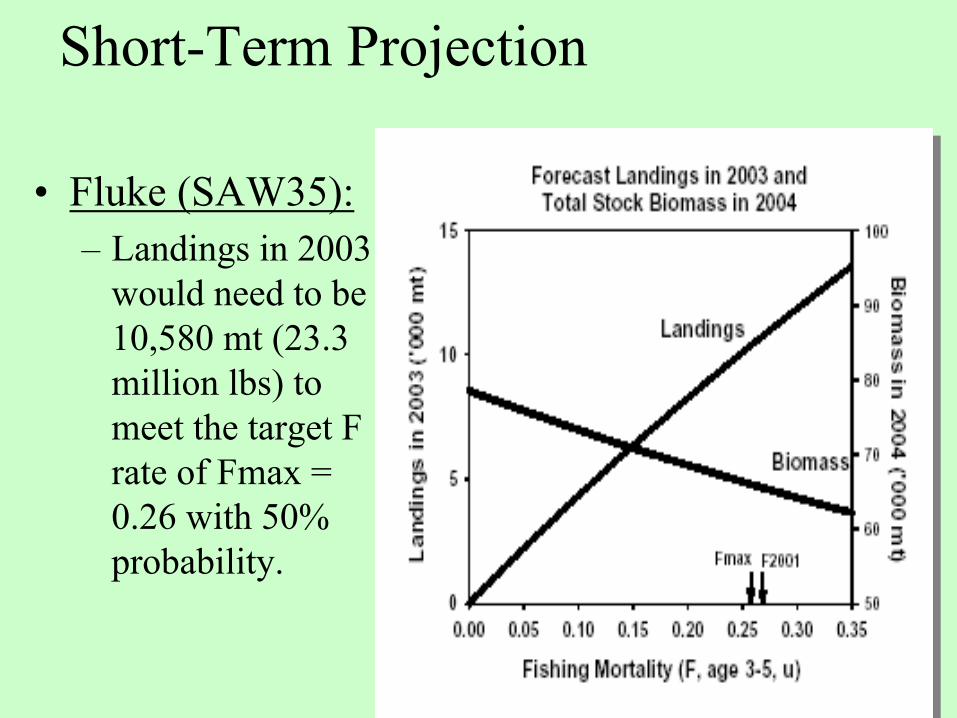
Short-Term Projection
• Fluke (SAW35):– Landings in 2003
would need to be 10,580 mt (23.3 million lbs) to meet the target F rate of Fmax = 0.26 with 50% probability.
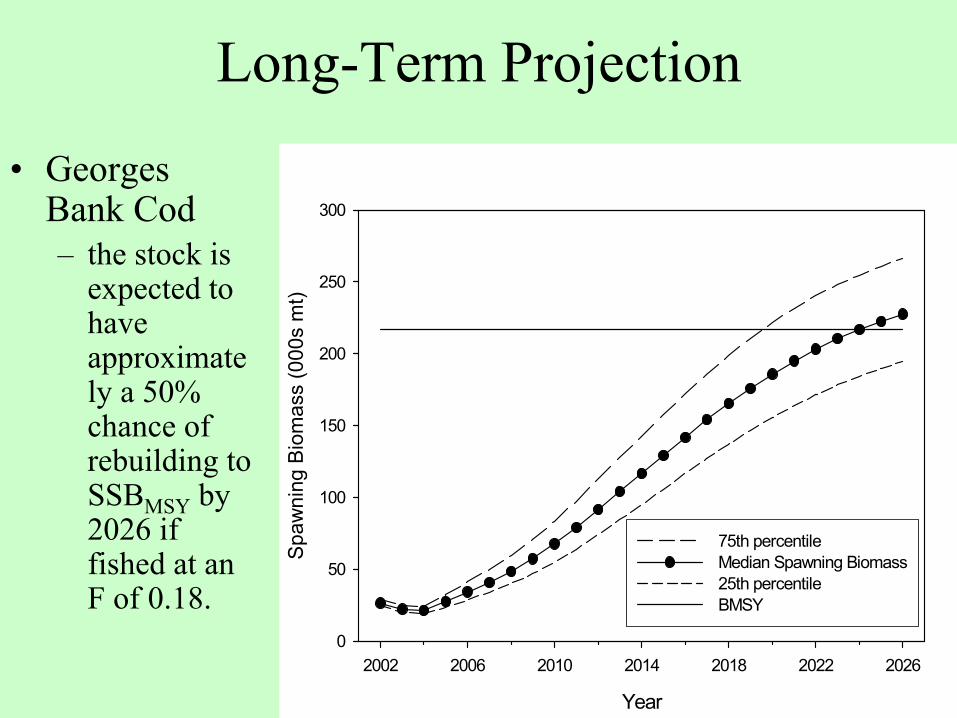
Long-Term Projection
• Georges Bank Cod– the stock is
expected to have approximately a 50% chance of rebuilding to SSBMSY by 2026 if fished at an F of 0.18.
Year
2002 2006 2010 2014 2018 2022 2026
Spaw
ning
Bio
mas
s (0
00s
mt)
0
50
100
150
200
250
300
75th percentile Median Spawning Biomass25th percentileBMSY
Age-Structured Model
• Population Numbers, Survival, Spawning Biomass
• Catch, Landings, and Discards
• Population Harvest
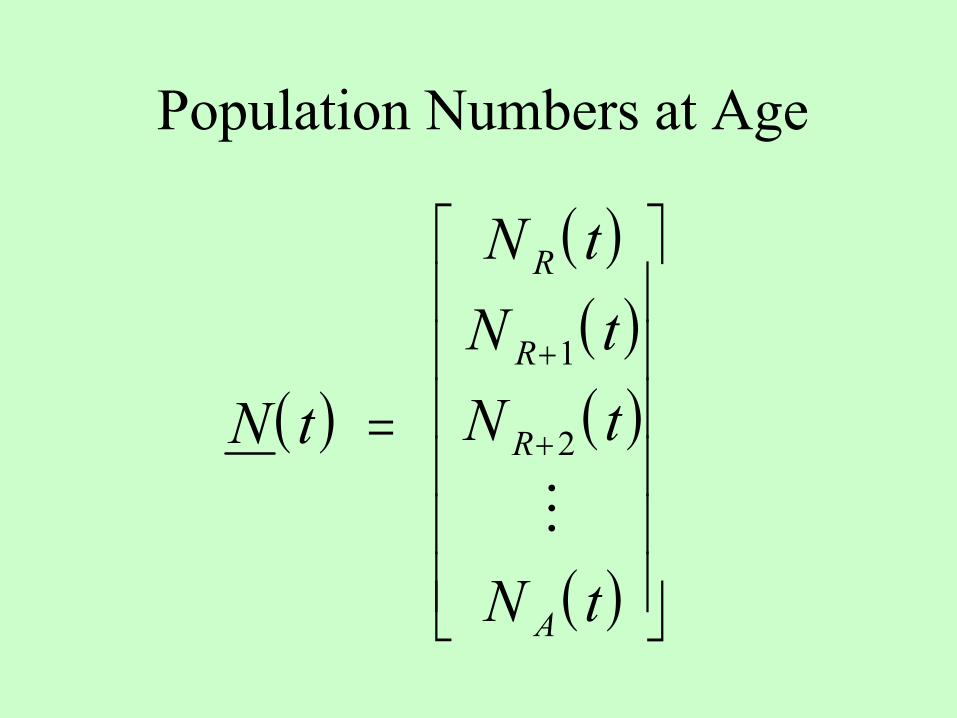
Population Numbers at Age
( )
( )( )( )
( )
N t
N tN tN t
N t
R
R
R
A
=
+
+
1
2
M
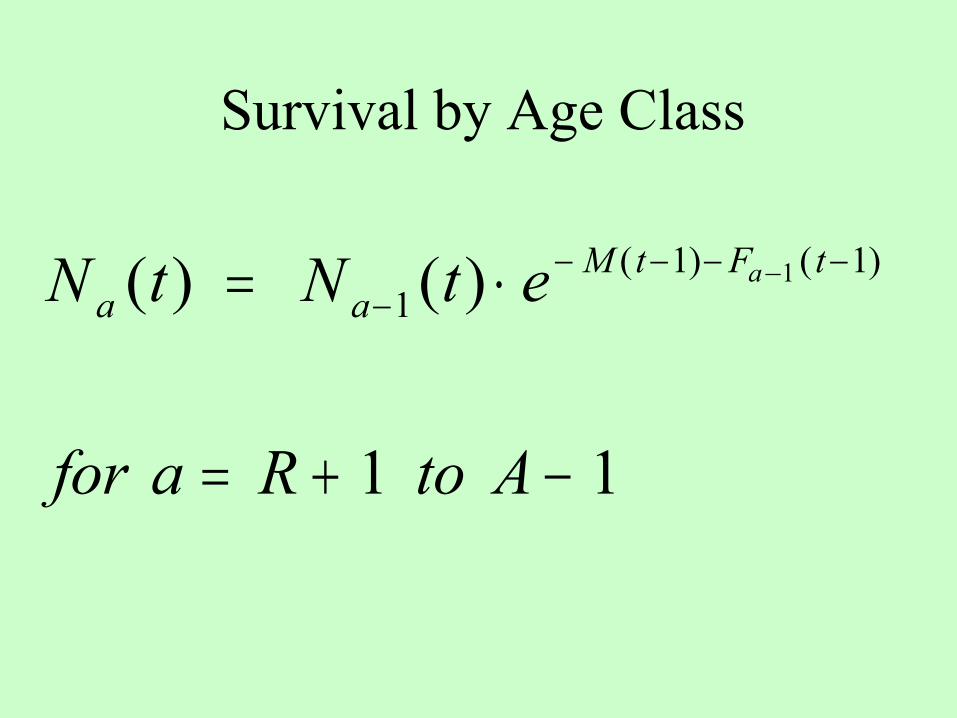
Survival by Age Class
N t N t e
for a R to A
a aM t F ta( ) ( ) ( ) ( )= ⋅
= + −
−− − − −−
11 11
1 1

Survival of Plus Group
N t N t eN t e
A AM t F t
AM t F t
A
A
( ) ( )( )
( ) ( )
( ) ( )
= − ⋅
+ − ⋅
− − − −
−− − − −−
11
1 1
11 11
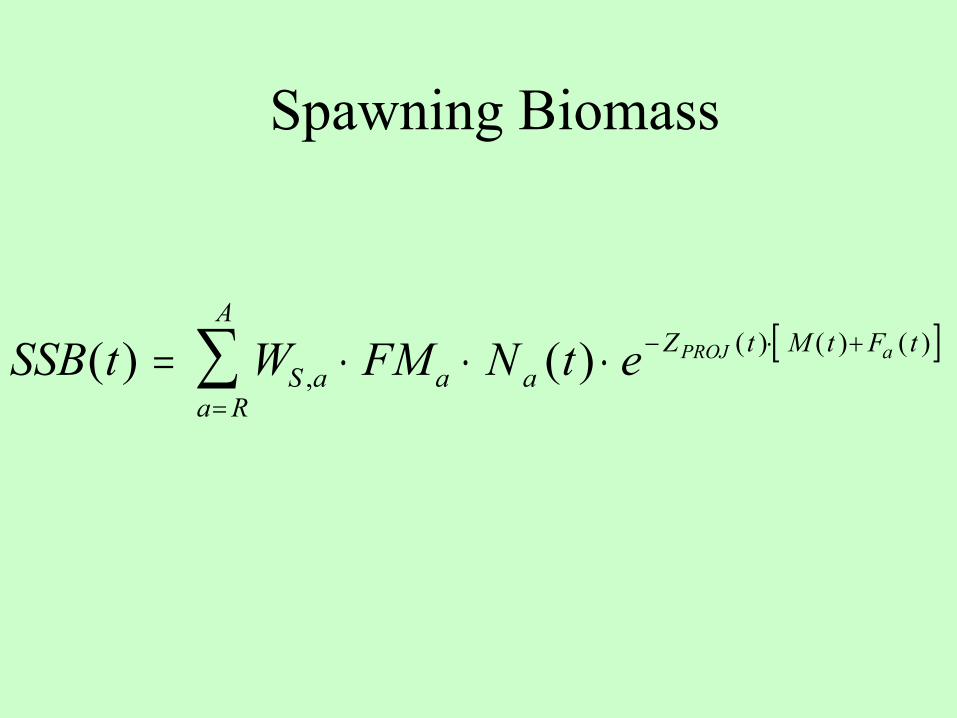
Spawning Biomass
[ ]SSB t W FM N t eS a a aZ t M t F t
a R
APROJ a( ) ( ),
( ) ( ) ( )= ⋅ ⋅ ⋅ − ⋅ +
=∑
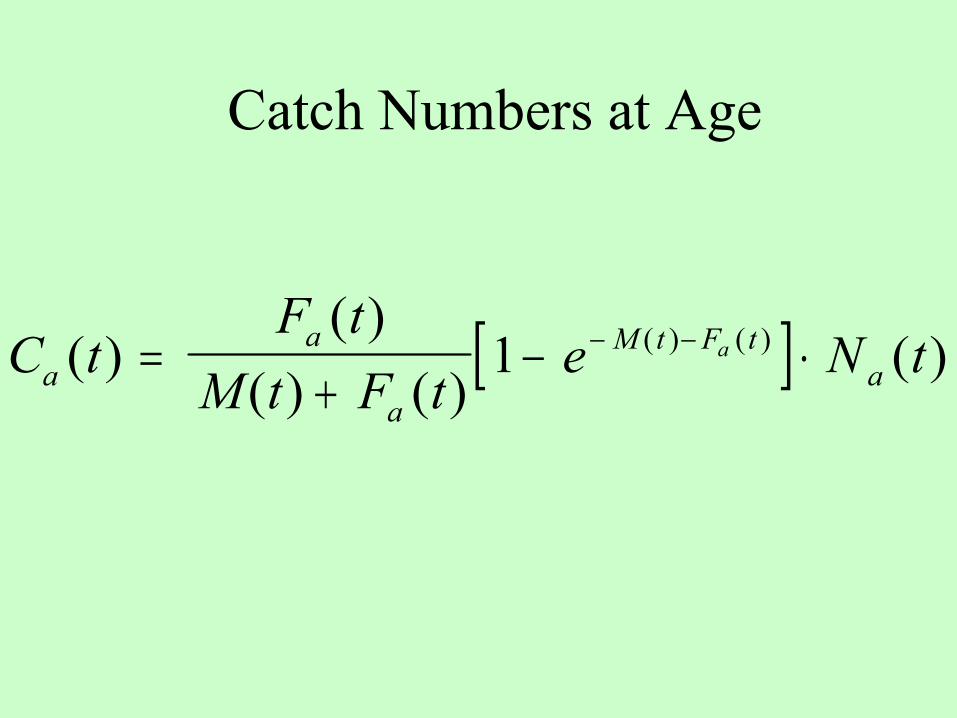
Catch Numbers at Age
[ ]C tF t
M t F te N ta
a
a
M t F ta
a( )( )
( ) ( )( )( ) ( )=
+− ⋅− −1
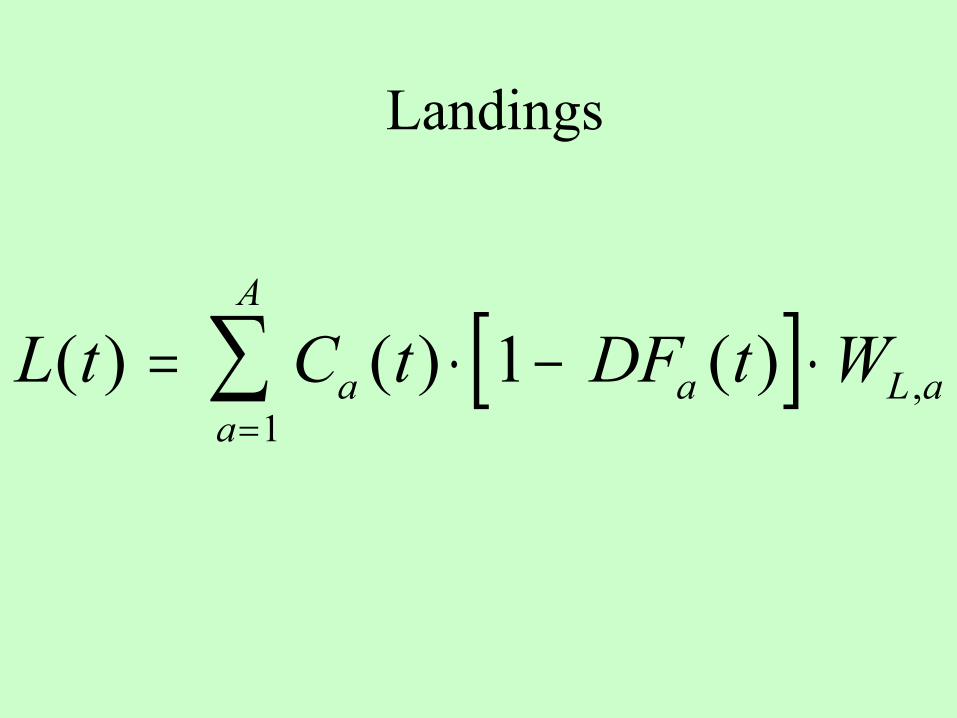
Landings
[ ]L t C t DF t Waa
A
a L a( ) ( ) ( ) ,= ⋅ − ⋅=∑
11
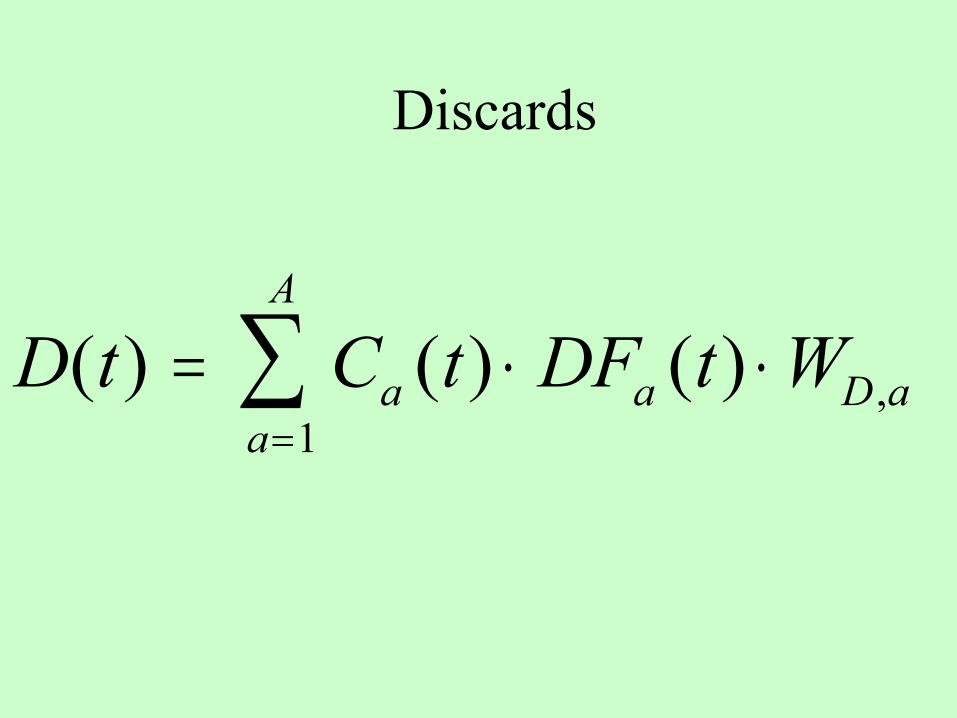
Discards
D t C t DF t Wa a D aa
A
( ) ( ) ( ) ,= ⋅ ⋅=∑
1
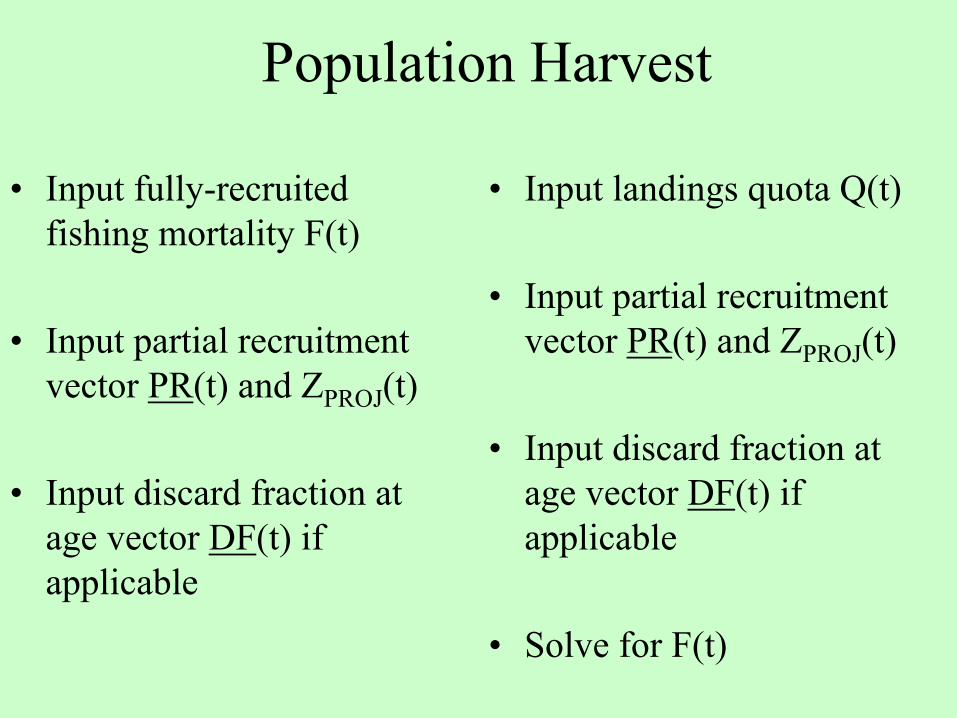
Population Harvest
• Input fully-recruited fishing mortality F(t)
• Input partial recruitment vector PR(t) and ZPROJ(t)
• Input discard fraction at age vector DF(t) if applicable
• Input landings quota Q(t)
• Input partial recruitment vector PR(t) and ZPROJ(t)
• Input discard fraction at age vector DF(t) if applicable
• Solve for F(t)
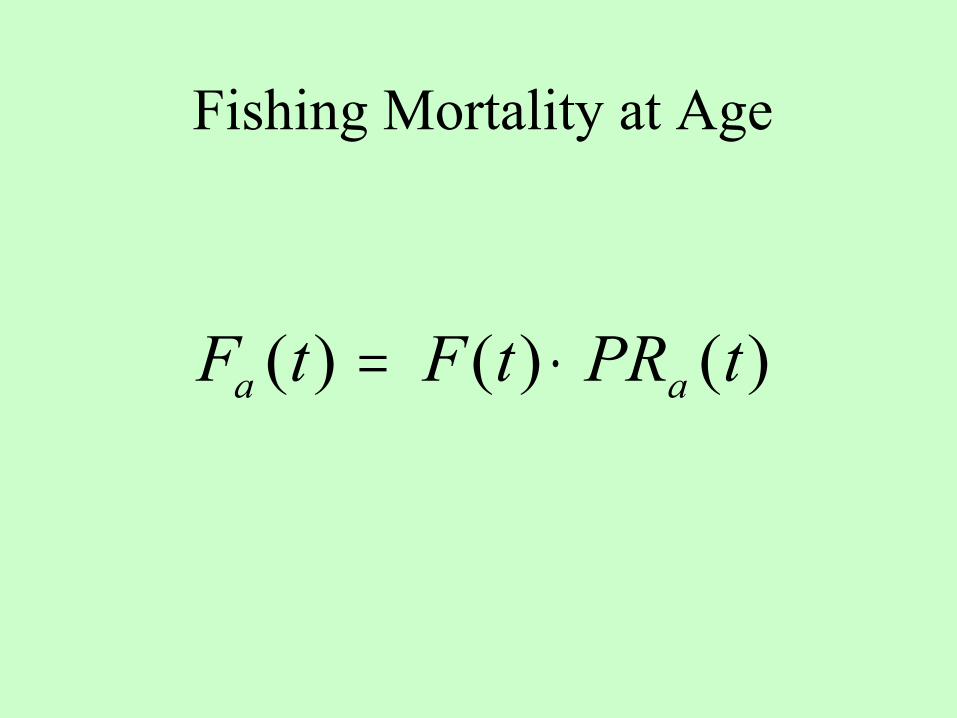
Fishing Mortality at Age
F t F t PR ta a( ) ( ) ( )= ⋅
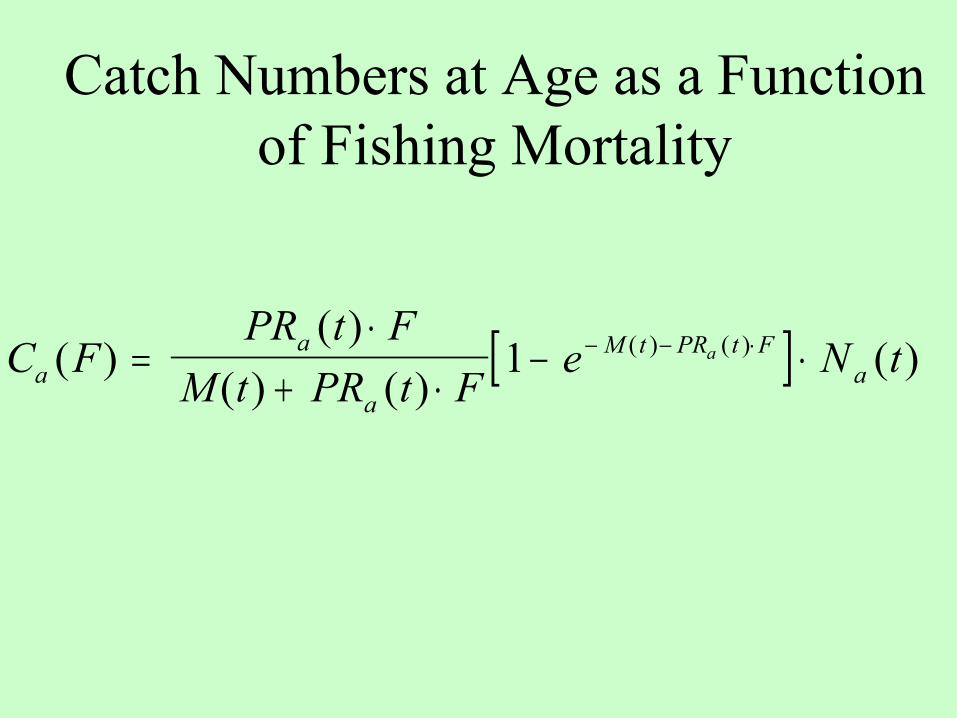
Catch Numbers at Age as a Function of Fishing Mortality
[ ]C FPR t F
M t PR t Fe N ta
a
a
M t PR t Fa
a( )( )
( ) ( )( )( ) ( )=
⋅+ ⋅
− ⋅− − ⋅1
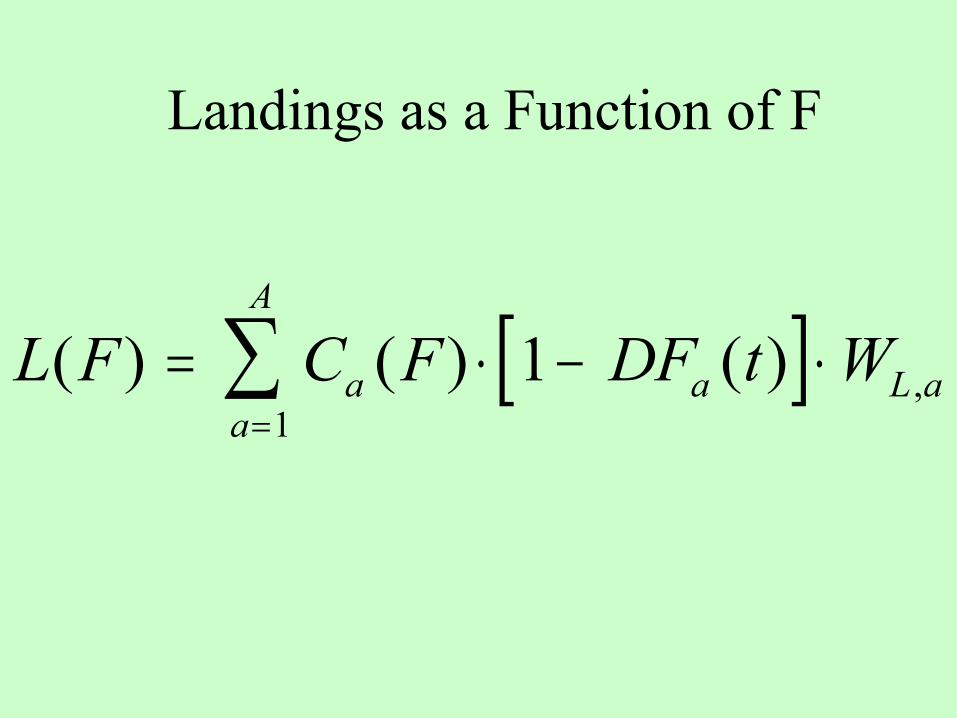
Landings as a Function of F
[ ]L F C F DF t Waa
A
a L a( ) ( ) ( ) ,= ⋅ − ⋅=∑
11
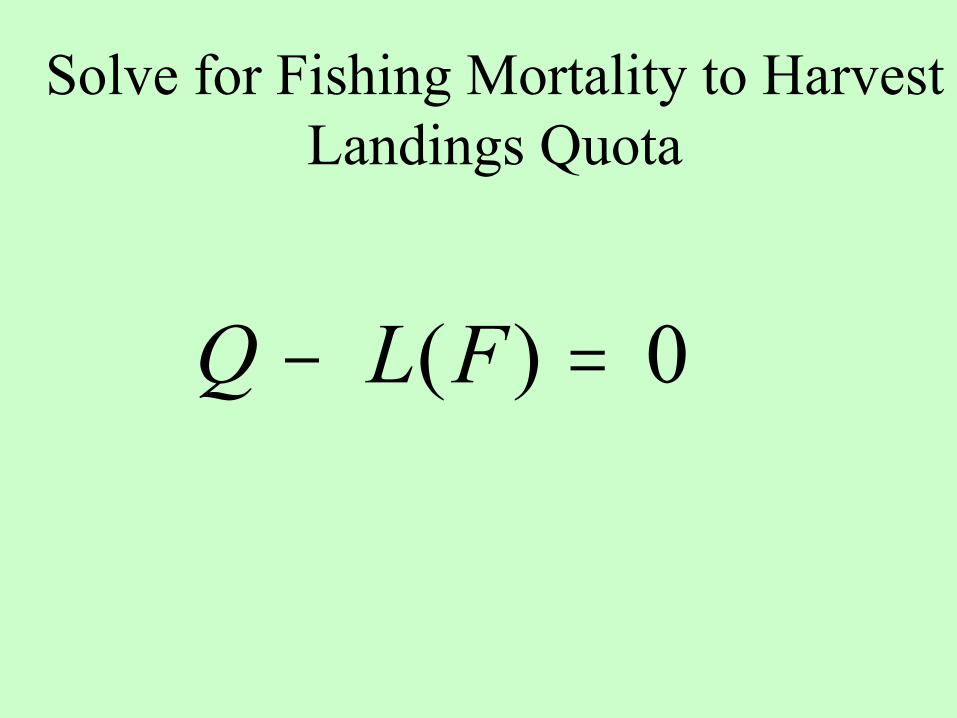
Solve for Fishing Mortality to Harvest Landings Quota
Q L F− =( ) 0
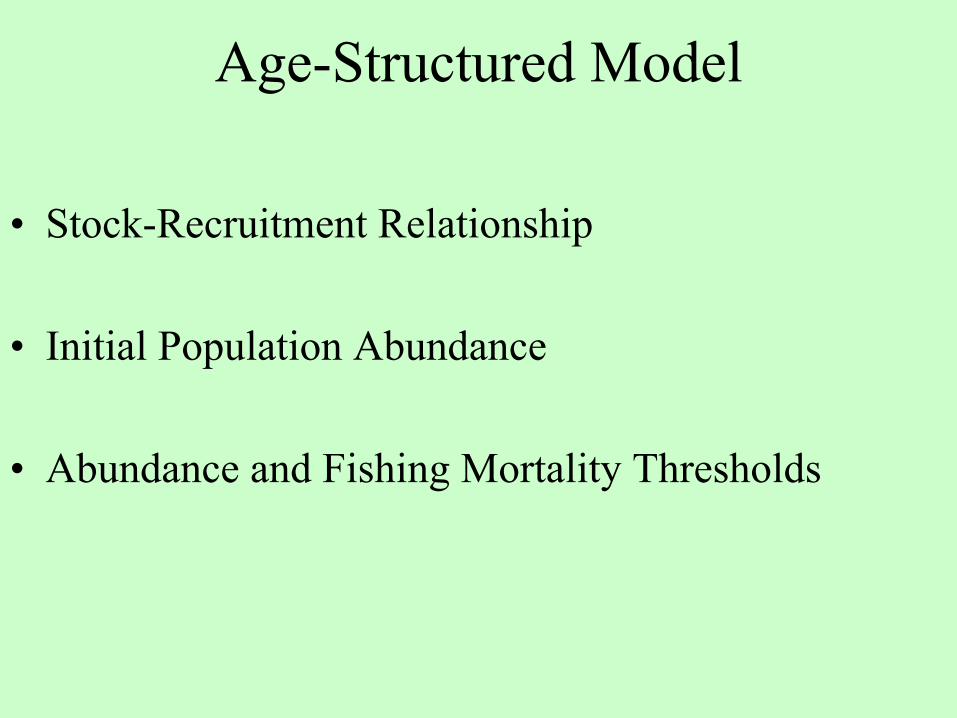
Age-Structured Model
• Stock-Recruitment Relationship
• Initial Population Abundance
• Abundance and Fishing Mortality Thresholds
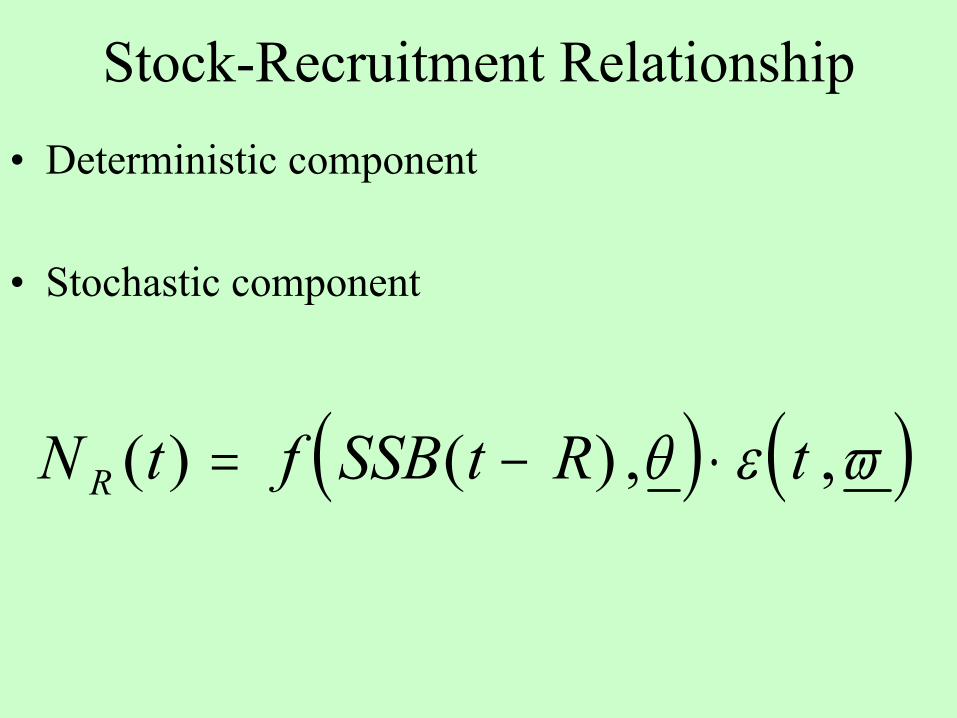
Stock-Recruitment Relationship• Deterministic component
• Stochastic component
( ) ( )N t f SSB t R tR ( ) ( ) , ,= − ⋅θ ε ϖ
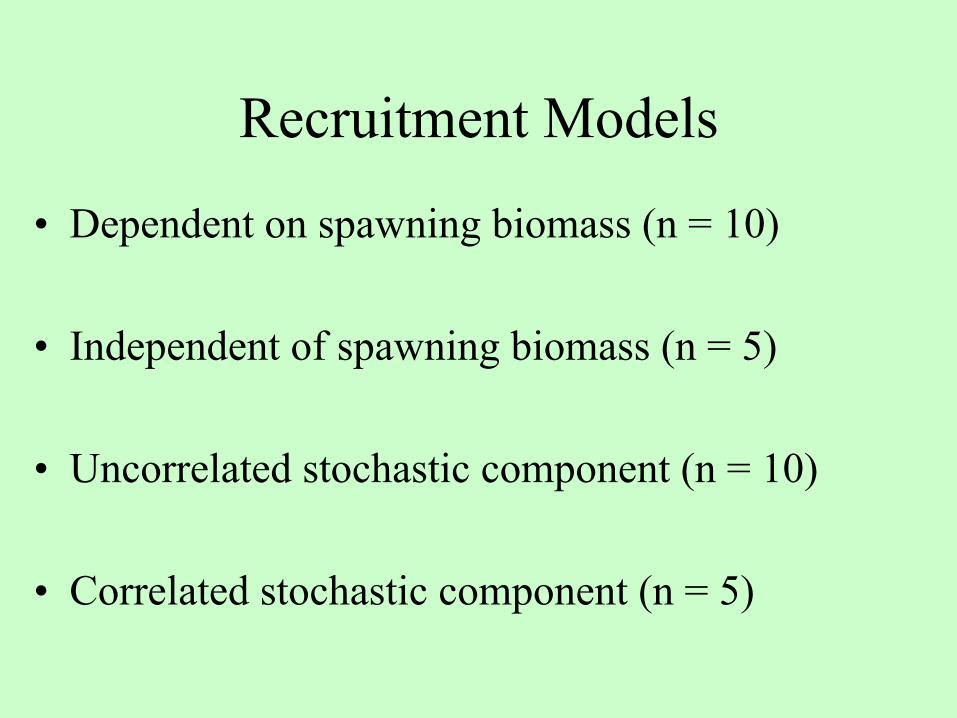
Recruitment Models
• Dependent on spawning biomass (n = 10)
• Independent of spawning biomass (n = 5)
• Uncorrelated stochastic component (n = 10)
• Correlated stochastic component (n = 5)
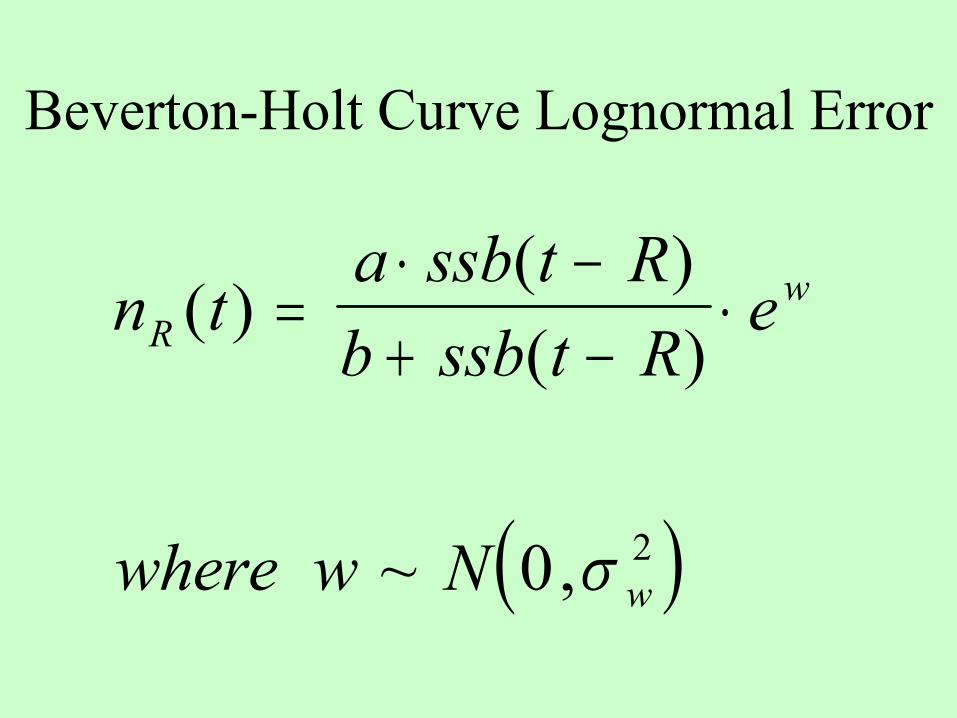
Beverton-Holt Curve Lognormal Error
( )
n ta ssb t Rb ssb t R
e
where w N
Rw
w
( )( )( )
~ ,
=⋅ −+ −
⋅
0 2σ
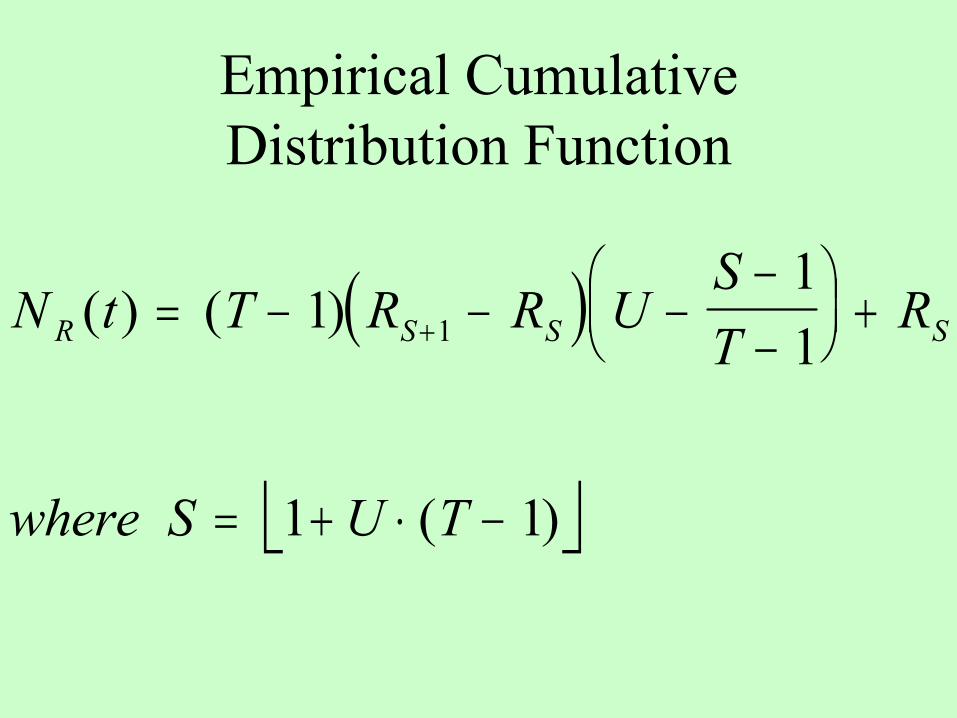
Empirical Cumulative Distribution Function
( )
N t T R R UST
R
where S U T
R S S S( ) ( )
( )
= − − −−−
+
= + ⋅ −
+111
1 1
1
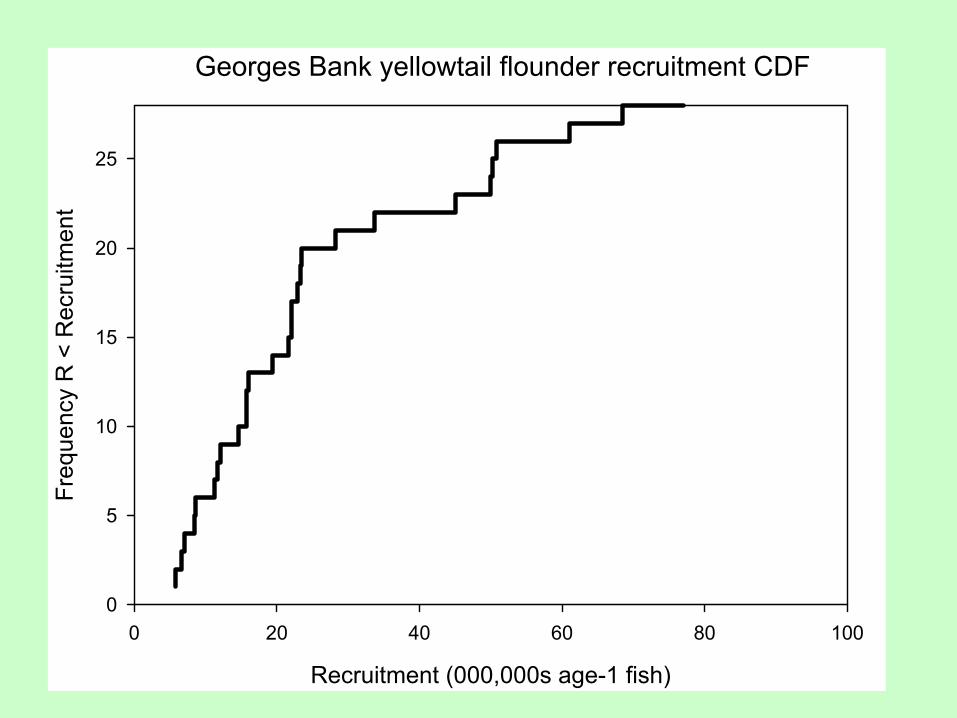
Georges Bank yellowtail flounder recruitment CDF
Recruitment (000,000s age-1 fish)
0 20 40 60 80 100
Freq
uenc
y R
< R
ecru
itmen
t
0
5
10
15
20
25
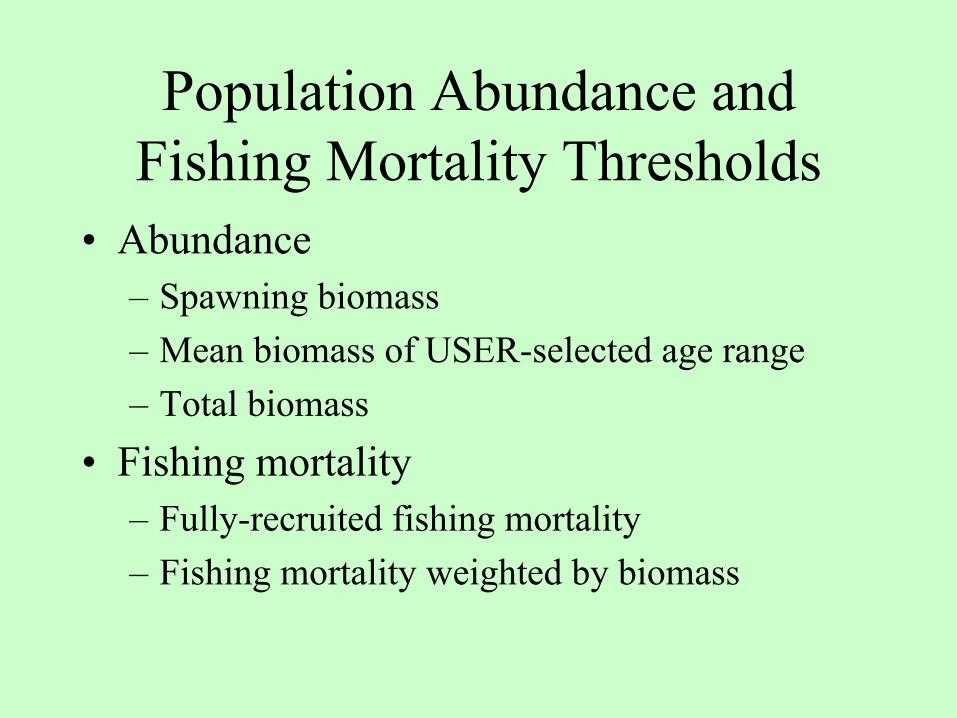
Population Abundance and Fishing Mortality Thresholds
• Abundance– Spawning biomass– Mean biomass of USER-selected age range– Total biomass
• Fishing mortality– Fully-recruited fishing mortality– Fishing mortality weighted by biomass
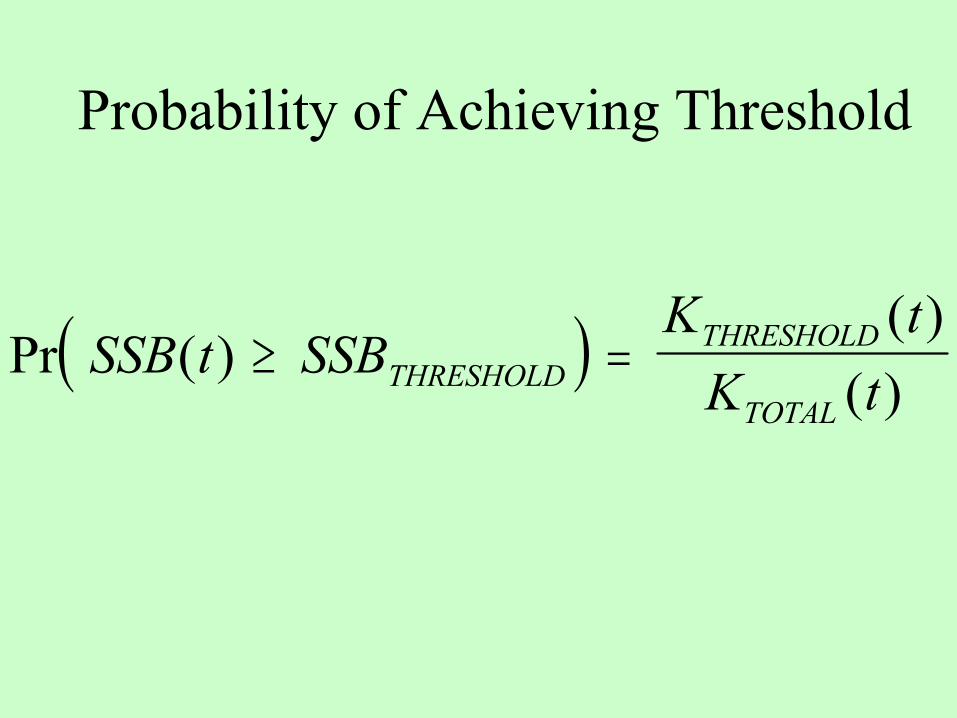
Probability of Achieving Threshold
( )Pr ( )( )
( )SSB t SSB
K tK tTHRESHOLDTHRESHOLD
TOTAL≥ =
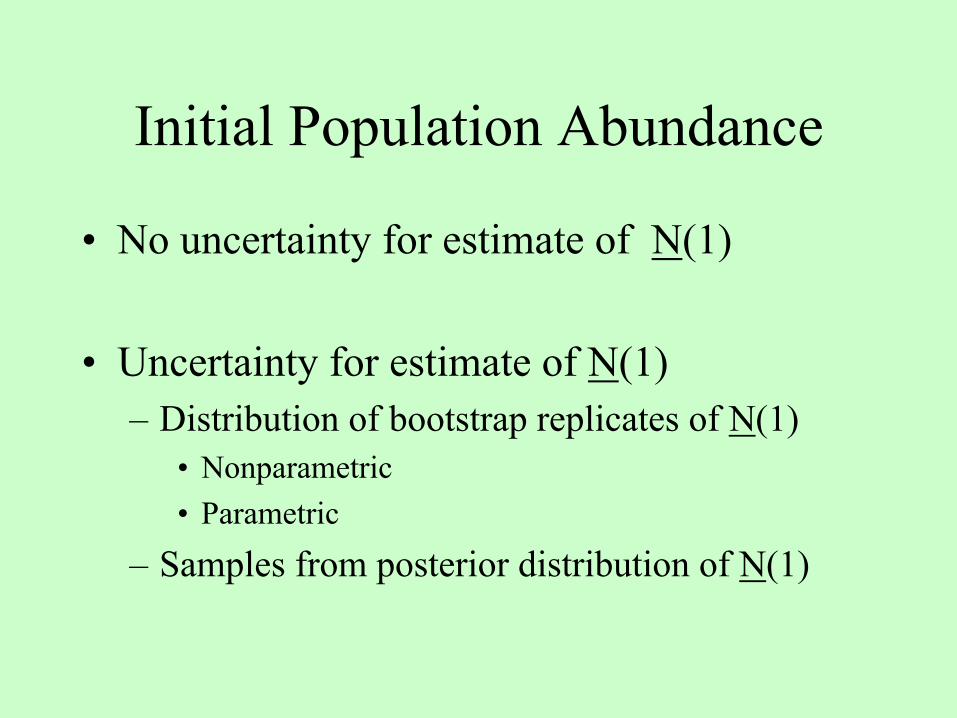
Initial Population Abundance
• No uncertainty for estimate of N(1)
• Uncertainty for estimate of N(1)– Distribution of bootstrap replicates of N(1)
• Nonparametric• Parametric
– Samples from posterior distribution of N(1)
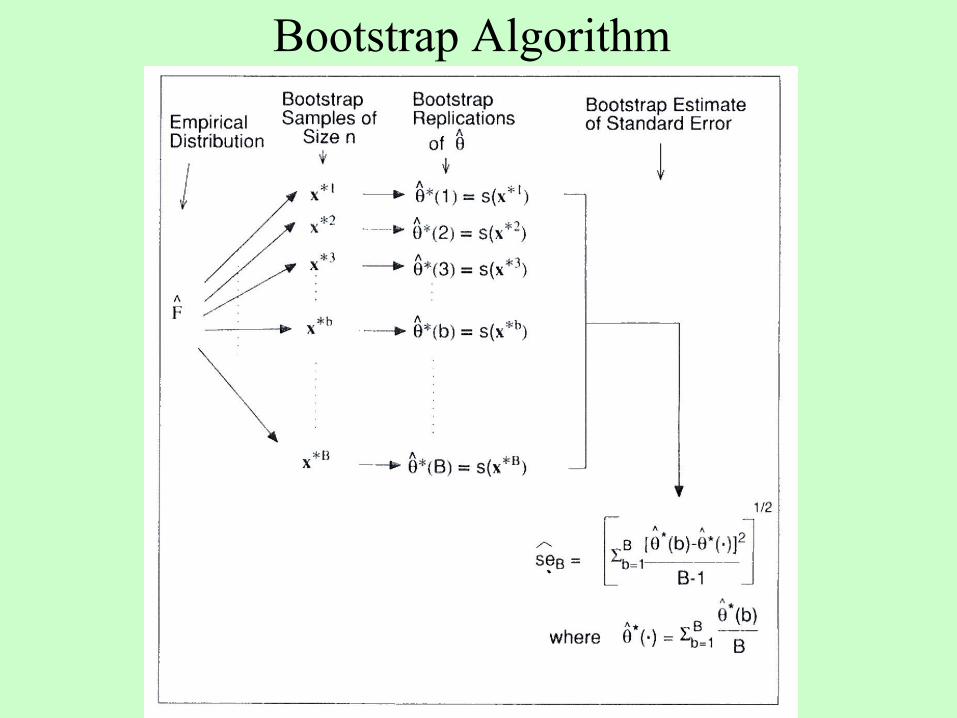
Bootstrap Algorithm
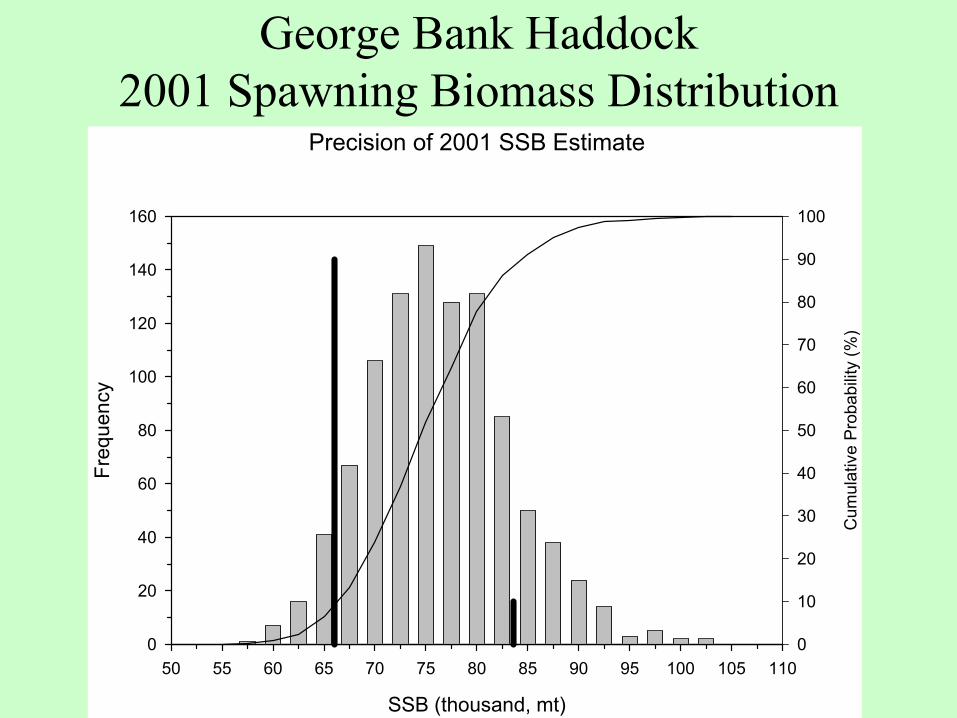
George Bank Haddock 2001 Spawning Biomass Distribution
Precision of 2001 SSB Estimate
SSB (thousand, mt)
50 55 60 65 70 75 80 85 90 95 100 105 110
Freq
uenc
y
0
20
40
60
80
100
120
140
160
Cum
ulat
ive
Prob
abilit
y (%
)
0
10
20
30
40
50
60
70
80
90
100
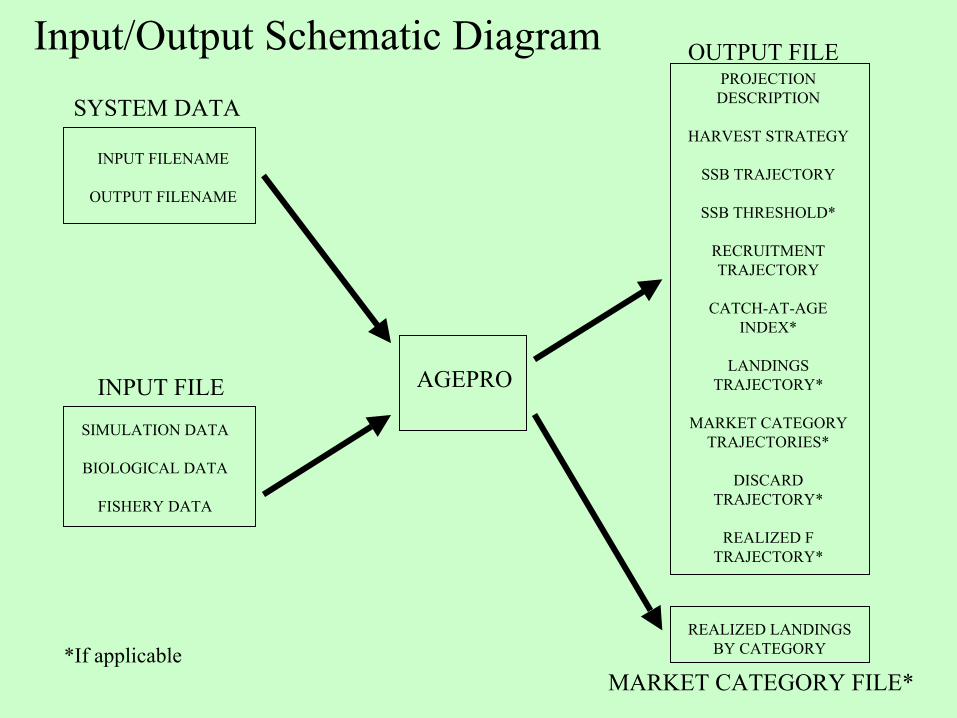
Input/Output Schematic Diagram
INPUT FILENAME
OUTPUT FILENAME
SYSTEM DATA
AGEPRO
SIMULATION DATA
BIOLOGICAL DATA
FISHERY DATA
INPUT FILE
PROJECTIONDESCRIPTION
HARVEST STRATEGY
SSB TRAJECTORY
SSB THRESHOLD*
RECRUITMENTTRAJECTORY
CATCH-AT-AGEINDEX*
LANDINGSTRAJECTORY*
MARKET CATEGORYTRAJECTORIES*
DISCARDTRAJECTORY*
REALIZED FTRAJECTORY*
OUTPUT FILE
MARKET CATEGORY FILE*
REALIZED LANDINGSBY CATEGORY*If applicable
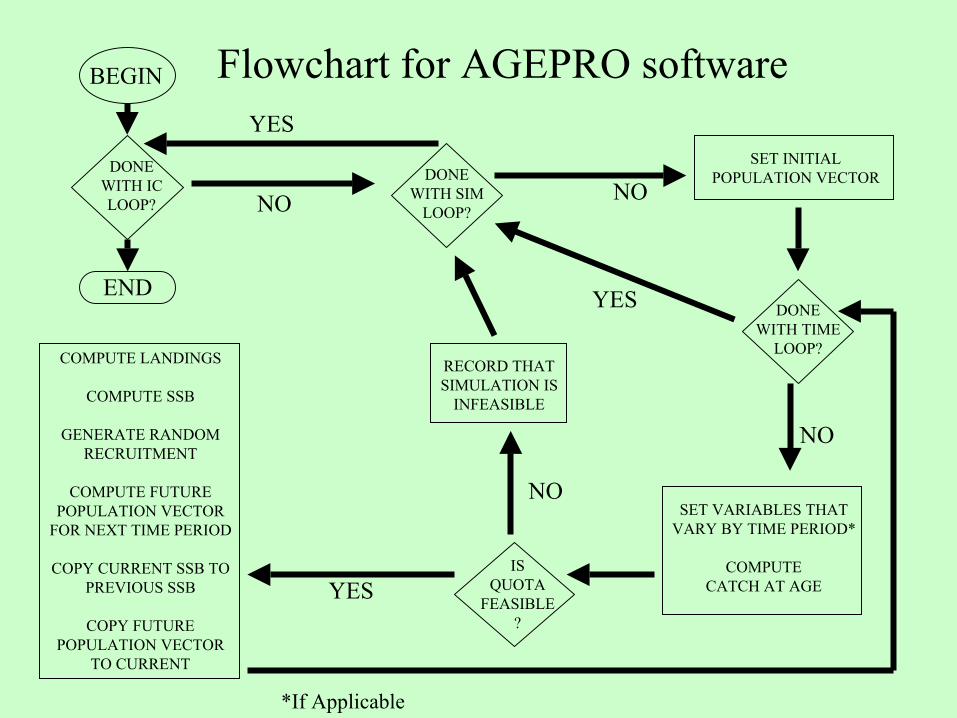
NO
YES
NO
YES
NO
NO
YES
BEGIN
END
*If Applicable
Flowchart for AGEPRO software
DONEWITH ICLOOP?
DONEWITH SIM
LOOP?
SET INITIALPOPULATION VECTOR
DONEWITH TIME
LOOP?
SET VARIABLES THATVARY BY TIME PERIOD*
COMPUTECATCH AT AGE
ISQUOTA
FEASIBLE?
RECORD THATSIMULATION IS
INFEASIBLE
COMPUTE LANDINGS
COMPUTE SSB
GENERATE RANDOMRECRUITMENT
COMPUTE FUTUREPOPULATION VECTOR
FOR NEXT TIME PERIOD
COPY CURRENT SSB TOPREVIOUS SSB
COPY FUTUREPOPULATION VECTOR
TO CURRENT
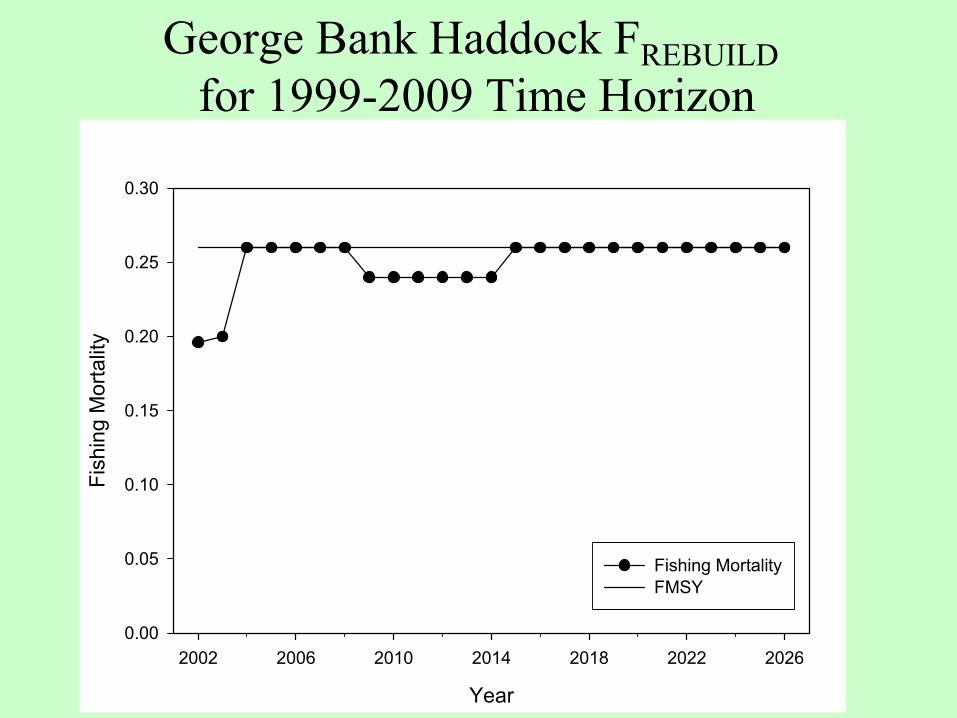
George Bank Haddock FREBUILDfor 1999-2009 Time Horizon
Year
2002 2006 2010 2014 2018 2022 2026
Fish
ing
Mor
talit
y
0.00
0.05
0.10
0.15
0.20
0.25
0.30
Fishing MortalityFMSY
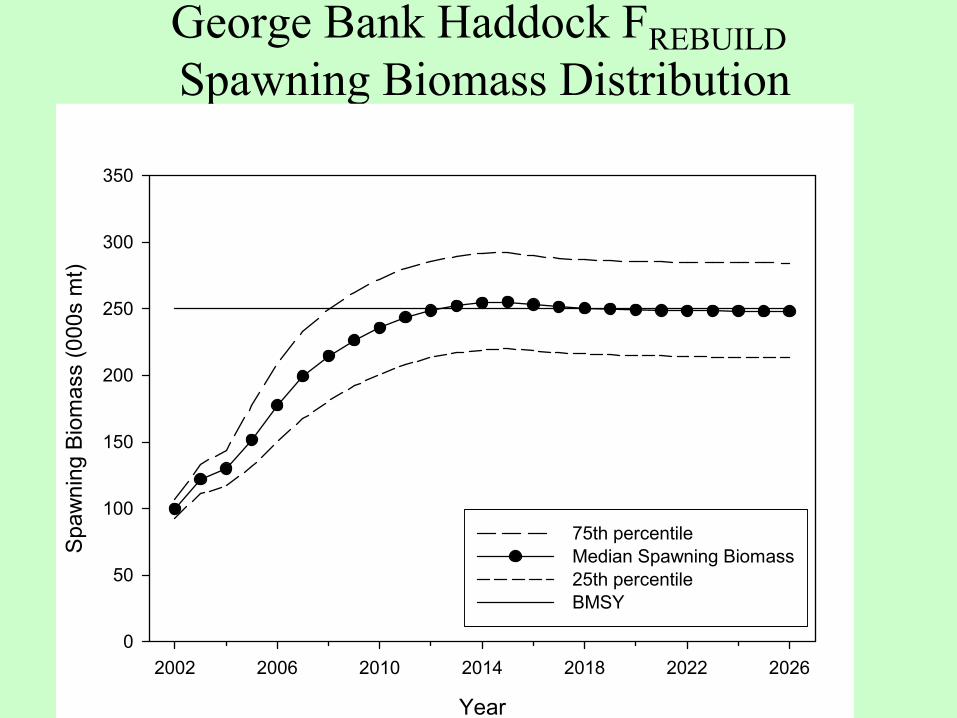
George Bank Haddock FREBUILDSpawning Biomass Distribution
Year
2002 2006 2010 2014 2018 2022 2026
Spaw
ning
Bio
mas
s (0
00s
mt)
0
50
100
150
200
250
300
350
75th percentile Median Spawning Biomass25th percentileBMSY
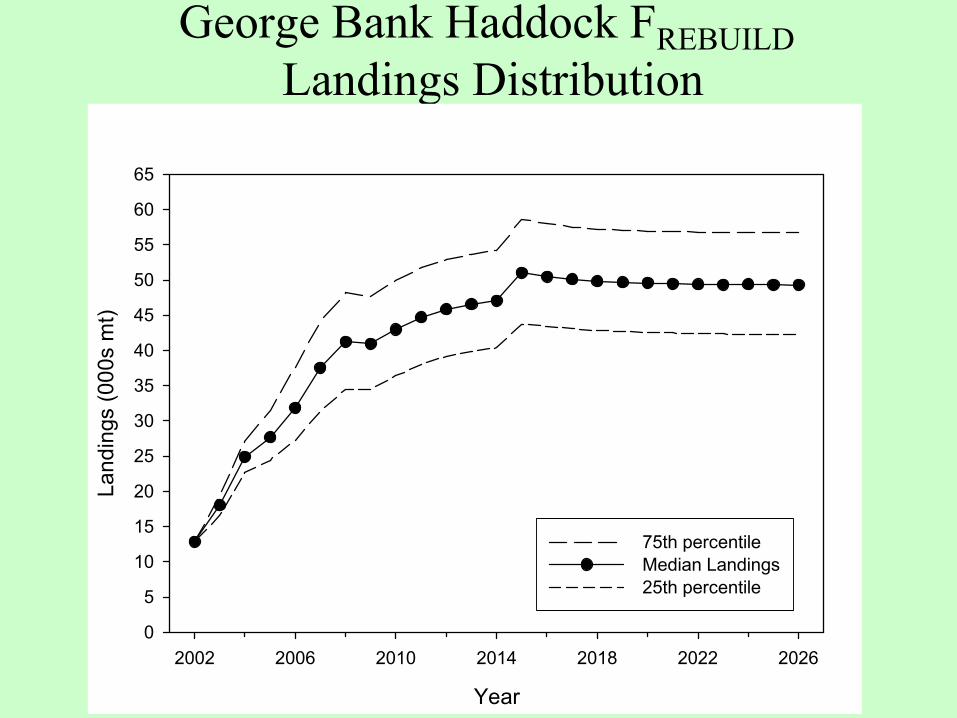
George Bank Haddock FREBUILDLandings Distribution
Year
2002 2006 2010 2014 2018 2022 2026
Land
ings
(000
s m
t)
0
5
10
15
20
25
30
35
40
45
50
55
60
65
75th percentileMedian Landings25th percentile

“““Prediction is very difficult Prediction is very difficult Prediction is very difficult …especially about the future”…especially about the future”…especially about the future”
NielsNielsNiels BohrBohrBohr