Embed Size (px)
Citation preview

Biological Measure of Stream ConditionsAuthor(s): Ruth PatrickSource: Sewage and Industrial Wastes, Vol. 22, No. 7 (Jul., 1950), pp. 926-938Published by: Water Environment FederationStable URL: http://www.jstor.org/stable/25031342 .
Accessed: 12/06/2014 21:47
Your use of the JSTOR archive indicates your acceptance of the Terms & Conditions of Use, available at .http://www.jstor.org/page/info/about/policies/terms.jsp
.JSTOR is a not-for-profit service that helps scholars, researchers, and students discover, use, and build upon a wide range ofcontent in a trusted digital archive. We use information technology and tools to increase productivity and facilitate new formsof scholarship. For more information about JSTOR, please contact [email protected].
.
Water Environment Federation is collaborating with JSTOR to digitize, preserve and extend access to Sewageand Industrial Wastes.
http://www.jstor.org
This content downloaded from 188.72.96.115 on Thu, 12 Jun 2014 21:47:01 PMAll use subject to JSTOR Terms and Conditions
Stream Pollution
BIOLOGICAL MEASURE OF STREAM CONDITIONS
By Ruth Patrick
Curator of Limnology, Academy of Natural Sciences of Philadelphia, Pa.
In the spring of 1948 the Sanitary Water Board of the Commonwealth of
Pennsylvania asked the Academy of Natural Sciences of Philadelphia to conduct a biological survey. The pur pose of this survey was to see if the or
ganisms living in a stream could serve as indices of stream conditions, partic ularly as related to sanitary and indus trial wastes.
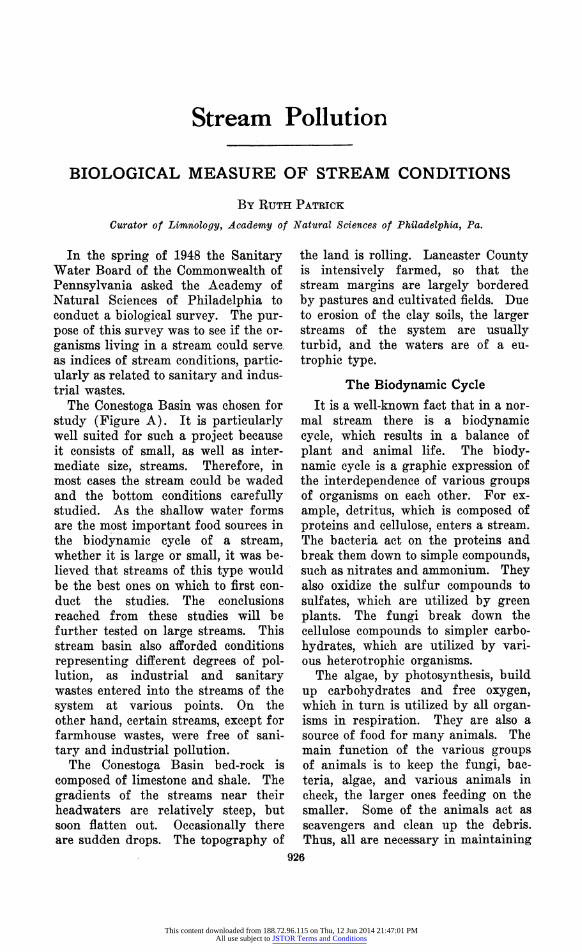
The Conestoga Basin was chosen for
study (Figure A). It is particularly well suited for such a project because
it consists of small, as well as inter mediate size, streams. Therefore, in most cases the stream could be waded and the bottom conditions carefully studied. As the shallow water forms are the most important food sources in
the biodynamic cycle of a stream, whether it is large or small, it was be lieved that streams of this type would
be the best ones on which to first con
duct the studies. The conclusions reached from these studies will be
further tested on large streams. This stream basin also afforded conditions
representing different degrees of pol lution, as industrial and sanitary
wastes entered into the streams of the
system at various points. On the other hand, certain streams, except for farmhouse wastes, were free of sani
tary and industrial pollution. The Conestoga Basin bed-rock is
composed of limestone and shale. The
gradients of the streams near their headwaters are relatively steep, but soon flatten out. Occasionally there are sudden drops. The topography of
the land is rolling. Lancaster County is intensively farmed, so that the stream margins are largely bordered
by pastures and cultivated fields. Due to erosion of the clay soils, the larger streams of the system are usually turbid, and the waters are of a eu
trophic type.
The Biodynamic Cycle
It is a well-known fact that in a nor
mal stream there is a biodynamic cycle, which results in a balance of
plant and animal life. The biody namic cycle is a graphic expression of the interdependence of various groups of organisms on each other. For ex
ample, detritus, which is composed of
proteins and cellulose, enters a stream. The bacteria act on the proteins and
break them down to simple compounds, such as nitrates and ammonium. They also oxidize the sulfur compounds to
sulfates, which are utilized by green
plants. The fungi break down the
cellulose compounds to simpler carbo
hydrates, which are utilized by vari ous heterotrophic organisms.
The algae, by photosynthesis, build
up carbohydrates and free oxygen, which in turn is utilized by all organ isms in respiration. They are also a
source of food for many animals. The
main function of the various groups of animals is to keep the fungi, bac
teria, algae, and various animals in
check, the larger ones feeding on the
smaller. Some of the animals act as
scavengers and clean up the debris.
Thus, all are necessary in maintaining 926
This content downloaded from 188.72.96.115 on Thu, 12 Jun 2014 21:47:01 PMAll use subject to JSTOR Terms and Conditions
Vol. 22, No. 7 BIOLOGICAL MEASURE OF STREAM CONDITIONS 927
a balance of life and energy relation
ships in a stream.
The effect of sanitary and industrial
pollution is to alter this cycle. If the
pollution is not excessive, organisms of
this biodynamic cycle can assimilate
it. That is, although at the point of
entrance of the pollution the biody namic cycle may be upset, farther
downstream the normal cycle is re
MAP OF
^CONESTOGA BASIN. PENNSYLVANIA SHOWING LOCATIONS OF SAMPLINC STATIONS
( JUNE 15 - AUGUST 31, 1948 )
-STREAM SURVEY COMMONWFALTH Uh PENNSYLVANIA -
ACADEMY OF NATURAL SCItNCES OF PHIL AOELPHIA
FIGURE A.
-?^ SprUfl ""* Drolnag* ?Ink
stored. This is referred to as the re
covery or rejuvenation of a stream.
Therefore, an effluent entering a stream should be allowed to upset the cycle only temporarily, if at all.
Measures of Pollution
Several different methods of ap
proach have been used to ascertain whether or not an effluent is harmful
to a stream. The most common method
is to determine for industrial effluents the B.O.D., and for sanitary wastes the
B.O.D. and coliform count. These
tests are valuable in measuring the
oxygen consumption of an effluent and
detecting the presence of sanitary wastes. They do not show the toxic
effect of a given effluent. Moreover,
although these tests are useful in com
paring various effluents to each other, they do not foretell the actual effect in a stream. This is because the physi cal, chemical, and environmental char
acteristics in a stream are so variable
that they cannot be reduced to a con stant. Therefore, such tests made on
an effluent before it enters a stream cannot accurately predict the effects of that effluent in a given stream.
This content downloaded from 188.72.96.115 on Thu, 12 Jun 2014 21:47:01 PMAll use subject to JSTOR Terms and Conditions
?28 SEWAGE AND IND?STBIAL WASTES July, 1950
Chemical and physical tests are also used to ascertain stream conditions.
Usually included are tests for hard
ness, alkalinity, pH, calcium, mag
nesium, sodium, potassium, ammonium,
nitrite, nitrate, silicates, iron, sulfates, phosphate, chlorides, dissolved oxy gen, free carbon dioxide, temperature, turbidity, suspended solids, and total
conductivity. Such tests are of value in giving the general characteristics of a stream, but they do not indicate
whether or not the plant and animal life is balanced. There are several reasons for this. First, the chemical
analysis only shows the conditions at the time the analysis was made. For
instance, Station 108 on Lititz Spring Run (Figure 22) was the most polluted station studied. Practically all the
plant and animal life had been killed.
However, from the chemical analysis of the water, which was made in July
when the industries had a vacation
period, and likewise from the analysis made in the fall, the only indication of
pollution was a fairly high C02 con tent (6.6 p.p.m. in July; 15 p.p.m. in
October). This content could hardly be considered indicative of pollution, as the station is within a mile of the
source, which is a large limestone
spring. The analysis made in August did show pollution, as the nitrates were high (4.39 p.p.m.), but they did not indicate the very toxic condition that existed. To have ascertained this polluted condition by chemical
means, unless the toxic substance in the effluent could have been found out
by other methods, would have meant considerable testing, perhaps over an
extended period of time.
Biological Tolerances
Another reason why the usual chem ical tests do not always indicate the conditions of the biodynamic cycle in a stream, is that the tolerance limits of
normal biodynamic cycle organisms to
various chemicals are not known. Ellis (1) and others have indicated,
for some of these chemicals, concen
trations found to be indicative of con
ditions undesirable for fish life. As to dissolved oxygen, Ellis (1) states, "5 p.p.m. of dissolved oxygen seems
to be the lowest value which may rea
sonably be expected to maintain in
good condition varied fish faunae of warm-water fishes in our inland streams if the water temperature be 20?C. or above/
' The tentative stand
ards of the State of West Virginia classify streams as follows :
Grade B?which would be a stream with some pollution.
Dissolved oxygen: Monthly aver
age, over 4 p.p.m.; daily mini
mum, 3 p.p.m. B.O.D.?monthly
average, not over 6 p.p.m.; daily maximum, not over 7 p.p.m.
Grade A?which is an unpolluted stream.
Dissolved oxygen: Monthly aver
age, over 6 p.p.m.; daily mini
mum, 5 p.p.m. B.O.D.?monthly
average, not over 2.5 p.p.m. ; daily maximum, 3.5 p.p.m.
As to pH, Ellis (1) states that a pH from 6.5 to 8.5 is to be expected in
most fresh-water streams. The spe
cific conductivity of streams support ing a well-developed fish fauna was be tween 150 and 500 mho X 10"6 at 25? C. According to an inspection of the
literature, nitrates in a healthy stream in the Eastern United States should
not be over 2 p.p.m. As to free car
bon dioxide, amounts in excess of 3 cc.
per 1. (6 p.p.m.) is indicative of pol lution in flowing inland streams (1).
Conestoga Basin Conditions
The stations studied were analyzed according to these criteria. Of the 23
stations which were found from the
biological analysis to be more or less
polluted, 6 (Nos. 13, 80, 89, 132, 134, and 138) showed no signs of pollution from the chemical analysis except that the C02 content was somewhat high. Two of these stations showed no signs
This content downloaded from 188.72.96.115 on Thu, 12 Jun 2014 21:47:01 PMAll use subject to JSTOR Terms and Conditions
Vol. 22, No. 7 BIOLOGICAL MEASURE OF STREAM CONDITIONS 929
of pollution from a chemical analysis (Nos. 89 and 109). All of the stations
studied in the Lititz Run series, except No. 96, were "polluted" to "very pol luted*
' according to the biological
analysis. Lititz Run has its source in a
large limestone spring, and as a result would be expected to have water
high in C02 content. These stations were surveyed two or three times. Three (Nos. 106, 108, and 110) at two of the three times they were surveyed showed no signs of pollution, except that the C02 content was high. One
(No. 122) showed no signs of pollution, except for the C02 content, one of the three times it was surveyed. No. 104
showed no signs of pollution, other than high C02, one of the two times it
was surveyed. On the other hand, four stations on other streams, which
supported healthy floras and faunas, had a high C02 content.
As to total conductivity, the highest amount found was 572 X 10-6 mho. The most polluted station studied (No. 108) had a total conductivity of 528 X 10"6 and 478 X 10~6 mho in the two
analyses made.
The pH values of all stations were
within the range that Ellis believes to
be satisfactory for a healthy station. As to B.O.D., ten of the surveys of
stations that showed an upset condi
tion from the biological analysis did
not indicate such a situation from
their B.O.D. Five biologically healthy stations had a high B.O.D. (Nos. 28,
63, 135, 136, and 153). Indeed, one
station (No. 136) had a B.O.D. of
11.55 p.p.m. which was one of the high est values found.
As a result of the work on the Cones
toga, it became evident that although the usual chemical analysis as de
scribed above affords many useful
facts in indicating the general condi tions of a stream, it can only be used as substantiating evidence in deter
mining the conditions of life in a
stream.
Approach to Biological Studies
The problem was to see if the change in the total number of species of each taxonomic group could be used as a
biological measure of stream condi tions. To do this it was attempted to determine which of the stations on the
Conestoga system were normal or
healthy stations. This was ascer
tained by examining the chemical, bacteriological, and biological data. Nine stations were found which, ac
cording to these criteria and ecological conditions, were typically healthy sta
tions. The averages of the number of
species in each taxonomic group for these nine stations were used as a basis of this study. These taxonomic groups
were then put into the following col umns. The reason for grouping them in this manner is that the organisms of a given column were found to behave
similarly under the same ecological conditions. To have kept all the taxo
nomic groups separate would have made far too intricate a histogram.
Column I: The blue-green algae; Stigeoclonium, Spirogyra, and Tribo
nema, genera of green algae; and the bdelloid rotifers, plus Cephalodel lamegalocephala and Proales decipiens.
Column II: Oligochaetes, leeches, and pulmonate snails.
Column III : Protozoa. Column IV : Diatoms, red algae, and
most of the green algae. Column V : All rotifers not included
in Col. I, plus clams, prosobranch snails, and tricladid worms.
Column VI: All insects and crus
t?cea.
Column VII: All fish.
As the best way to express these results seemed to be a histogram, the aver
age number of species for each column at the nine ''healthy'' stations was ob tained and assumed to be 100 per cent.
It will be noted that the bacteria are not included on the chart. The reason is that the number of species of bac
This content downloaded from 188.72.96.115 on Thu, 12 Jun 2014 21:47:01 PMAll use subject to JSTOR Terms and Conditions
930 SEWAGE AND INDUSTRIAL WASTES July, 1950
teria present do not seem to vary with the presence or absence of pollution.
Likewise, the kind of species do not
change. This may be due to the fact that the basis of classification of the bacteria is different from that of other
groups of plants and animals. The total count of bacteria and the coli form count did vary in the presence of pollution, particularly organic pol lution. These facts have been used in the qualitative consideration of the sta tions.
The findings at all of the stations were then made into histograms. These
findings correspond in some ways to the grouping of classes of Richardson and others, but differ in that the basis of their groupings were conditions re
sulting for the most part from the effect of sanitary wastes. Such con
ditions produce a zone, designated as 1 'septic/' "polysaprobic" or "the re
gion of active decomposition,' ' in which
the B.O.D. is high and the dissolved
oxygen is depleted due to decomposi tion. The conditions of pollution noted in this study were for the most part due to the toxic effluents from indus tries. There were some stations where active decomposition due to sanitary or industrial wastes was occurring (such as No. 133A, July sampling),
when a very high bacterial count was
found and a luxurious growth of
Sphaerotilus covered the rocks. The stage designated as "semi
healthy" is not recognized in previous classifications of streams. This is the condition in which deterioration is just starting or recovery is almost complete. This stage is the most difficult to rec
ognize, but is characterized by an un
balanced condition evidenced by the
overdevelopment of one species or by the great increase in species number of some groups while others are de
creasing.
Within each of these designated stages or zones there is a great deal of variation. This is to be expected, for very divergent ecological condi
tions existed?that is, difference in size
of streams (breadth variation from a
few feet to over 100 ft.), rate of flow, time of sampling in relation to rain
fall, and the variation in pools which were suitable habitats for fish. Fur ther studies will be needed to refine these patterns and to determine just
what types of ecological variation are
most important. The important consid eration is the relative heights of the various columns to each other, rather than the absolute height of any one
column.
It will also be noted that some of the groups, such as semi-healthy and
healthy, seem more or less to grade into each other. Theoretically, this
would be expected, for there exists a
continuous process on which an arbi
trary classification has been superim posed. The continuous gradation is most clearly seen when a stream is
being rejuvenated or brought back af ter pollution. This type of gradation
would have shown up clearly, particu larly on Little Muddy Creek, had the
sampling stations been closer together. It is in the classifying of such border line stations that qualitative indicators become very useful.
The histograms of the stations fell into the following groups:
1. A "healthy" stream is one which has a balance of organisms or in which the biodynamic cycle is such that con
ditions are maintained which are ca
pable of supporting a great variety of
organisms. The algae are mostly diatoms and green algae, such as
Cladophora crispata and glomerata, and the insects and fish are repre sented by a great variety of species. There are also numerous species of
protozoa, but as their coefficient of
variation was large, they were not a
good group to use in defining a station.
Columns I and II were found to vary
greatly, depending on the ecological conditions and the degree of enrich
ment of a station. Thus, a healthy
This content downloaded from 188.72.96.115 on Thu, 12 Jun 2014 21:47:01 PMAll use subject to JSTOR Terms and Conditions
Vol. 22, No. 7 BIOLOGICAL MEASURE OP STREAM CONDITIONS 931
Station was found to be one in which
Columns IV, VI, and VII were all above the 50 per cent level (see Fig ures).
2. "Semi-healthy" is the condition in which the balance of life as described for a healthy station has been some
what disrupted, but not destroyed. Often, a given species will be repre sented by a great number of individu als. This condition is noted in the
histograms by a double-width column.
Something has happened which has de
stroyed the check on this species. Un der other circumstances, conditions have altered so that a certain group will have a great many more species present than usually occur, whereas
other columns will be greatly de
pressed. Thus, the pattern is an ir
regular one. It may be defined as fol
lows:
a) Either or both Col. VI or VII below 50 per cent, and Col. I or
II under 100 per cent.
b) Either Col. VI or VII below 50 per cent, and Col. I, II, and IV 100 per cent or over, or Col. IV is a double-width column.
3. "Polluted" is the condition in which the balance of life found in a
healthy station is upset. However, con ditions are favorable for some groups of organisms, such as those represented in Col. I and II. Such a condition may
be defined as follows:
a) If either or both of Col. VI and VII are absent, and Col. I and II are 50 per cent or better.
b) If Col. VI and VII are both
present, but below 50 per cent, then Col. I and II must be 100
per cent or more.
4. "Very polluted" is a condition that is definitely toxic to plant and animal life. Often many groups are
absent. It may be defined as follows :
a) If Col. VI and VII are absent, and Col. IV is below 50 per cent.
b) If Col. VI or VII is present, but
Col. I or II is less than 50 per cent.
5. Besides these four classes there was a group of stations which have been
labeled "atypical" because they could not be compared, either due to gen eral ecological conditions or to meth ods of collection, to the healthy sta tions used as a basis of the histograms.
For example, the normal stations were
in eutrophic conditions, so that stations in cool oligotrophic water could
hardly be rated on the same basis.
Likewise, a stream with steep, newly eroded banks would not be comparable
with a normal stream with shallow water near the edges. Sometimes, local obstructions or accidents would
prevent thorough collection and thus render a station uncomparable. Fur
ther work will eliminate these differ
ences, for comparable bases will be
worked out for various types of eco
logical conditions and collecting meth ods will be perfected.
Stations illustrating the 5 groupings are shown in the accompanying histo
grams (Figures 1 through 26).
Biological Study Results
It is interesting to compare the
change in patterns of the following
types of streams from headwater to
mouth: (1) A stream polluted only by
sanitary wastes from farmyards and
small towns; (2) a stream that re
ceives a large amount of sanitary wastes and industrial effluents but re
covers; and (3) a stream that never
completely recovers after receiving in dustrial effluents.
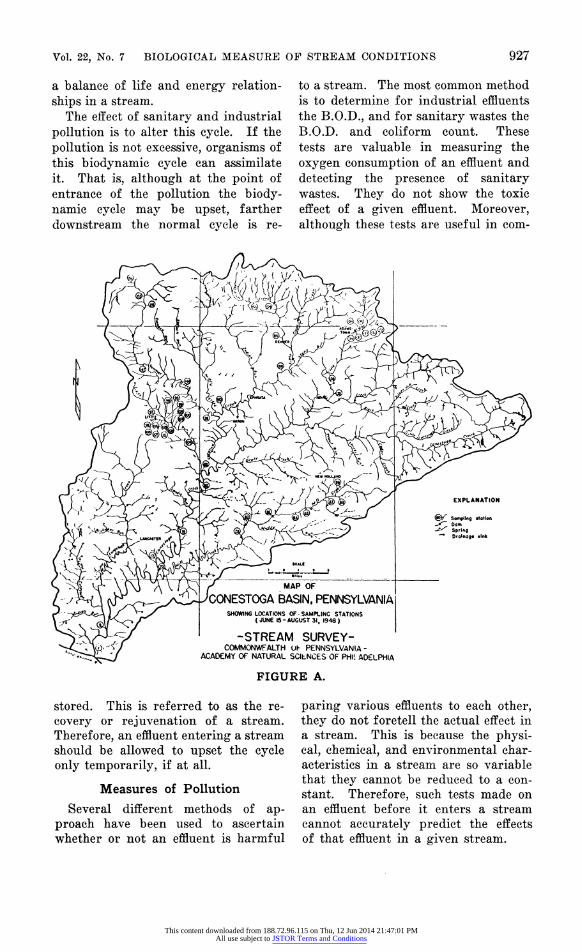
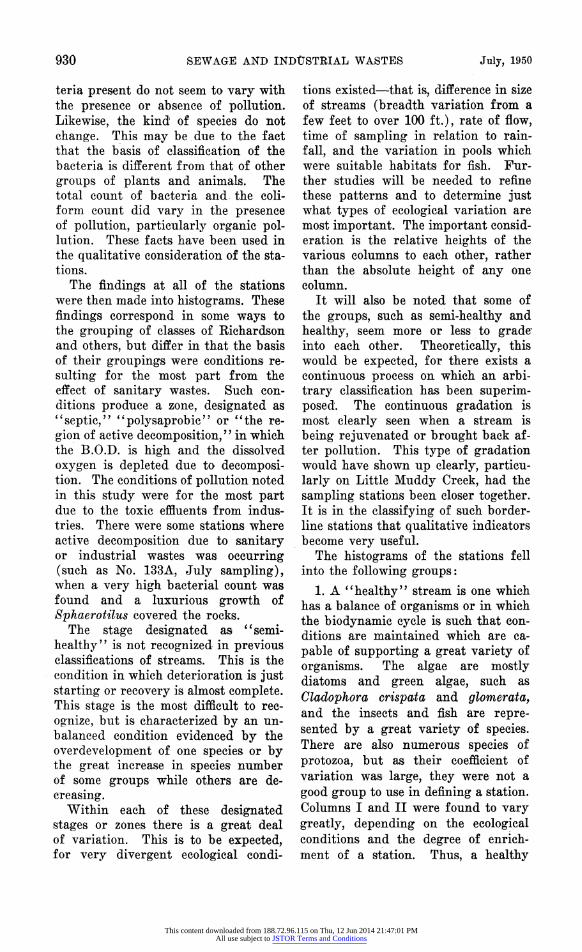
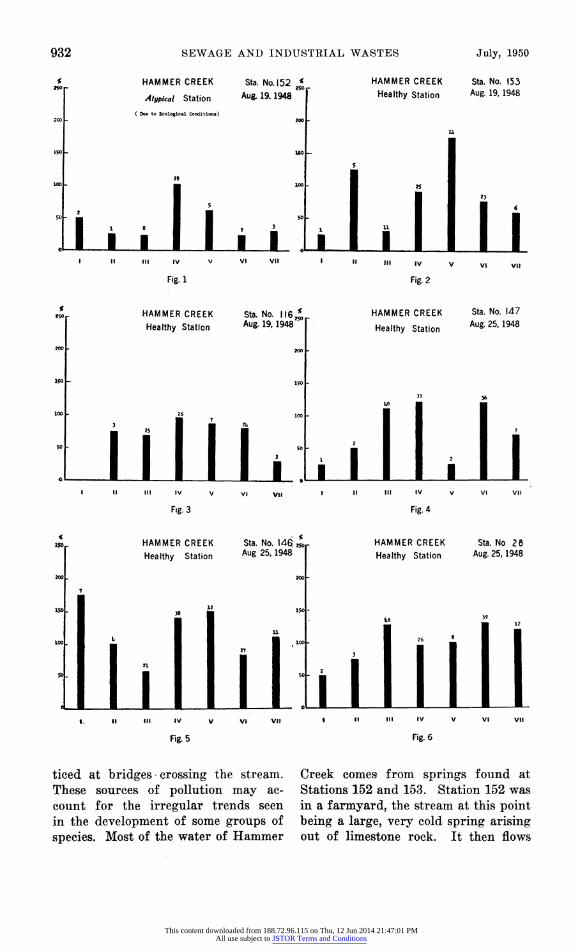
A stream of the first type is Ham mer Creek (Figures 1 to 6). The sta tions were all sampled during the latter half of August. This stream is appar
ently free of industrial pollution, but receives the sanitary wastes of small towns and farms. The common prac tice of the washing out agricultural spray tanks into the stream was prac
This content downloaded from 188.72.96.115 on Thu, 12 Jun 2014 21:47:01 PMAll use subject to JSTOR Terms and Conditions
932 SEWAGE AND INDUSTRIAL WASTES July, 1950
2
1
HAMMER CREEK
Atypical Station
( Do? to Ecological Conditions)
JLJL
5
1 II III IV
Fig. 1
Sta. No. 152 ? Aug. 19.1946
i_i
HAMMER CREEK Sta. No. 153
Healthy Station Au& 19-1948
l i ? III IV
Fig. 2
2J
?
HAMMER CREEK
Healthy Station
III IV V
Fig. 3
Sta. No. 116 *
Aug. 19,1948
Lull i j. VI VII
HAMMER CREEK Sta. No. 147
Healthy Station Aug. 25, 1948
2
1 X III IV V
Fig. 4
7
1 VI VII
HAMMER CREEK
Healthy Station
n
1
Fig. 5
Sta. No. 146 ,50. Aug 25,1948
III IV V VI VII
HAMMER CREEK Sta. No 28
Healthy Station Aug. 25,1948
3
III IV
Fig. 6
VI VII
ticed at bridges crossing the stream.
These sources of pollution may ac
count for the irregular trends seen
in the development of some groups of
species. Most of the water of Hammer
Creek comes from springs found at
Stations 152 and 153. Station 152 was
in a farmyard, the stream at this point being a large, very cold spring arising out of limestone rock. It then flows
This content downloaded from 188.72.96.115 on Thu, 12 Jun 2014 21:47:01 PMAll use subject to JSTOR Terms and Conditions
Vol. 22, No. 7 BIOLOGICAL MEASURE OF STREAM CONDITIONS 933
through a chicken yard ; Station 153 is in a pasture. At Station 116 the tem
perature has risen from 11? to 15? C. As the sampling was done in August, this may well be the highest tempera tures reached at these stations. Sta tions 147, 146, and 28 represent warm
eutrophic stream conditions. All of the stations except 152, which is atypi cal, are healthy stations. It will be noted that the number of insect species increase from headwater to mouth.
The fish shows this same general, though somewhat irregular, trend. The low number of fish at Station 116 is due to the fact that a large tree had fallen over the largest pool, and made it unseinable. The diatoms, etc., remain
relatively, constant throughout the stream system, their variation no doubt
being due to ecological conditions. The
protozoa also show a steady increase from headwater to mouth. Col. I and II behave erratically, as often happens in healthy stations. Thus, in those
groups which are important in main
taining the balance of life in a stream there is generally an increase from headwater to mouth. The very irregu lar appearance of these healthy station
patterns indicates that minor pollution or ecological variation may alter con
siderably the behavior of the various
groups, but Col. IV, VI, and VII are
always within the limits of a healthy station.
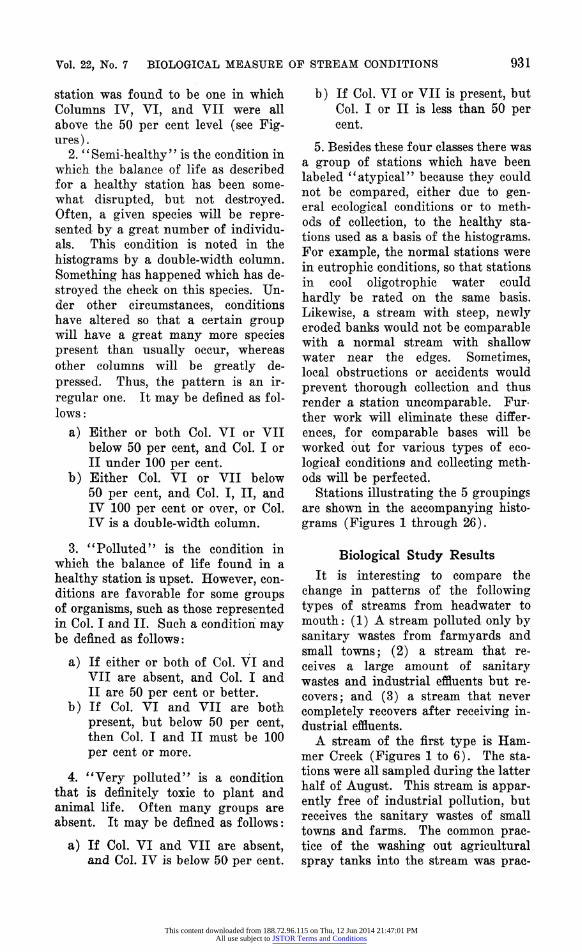
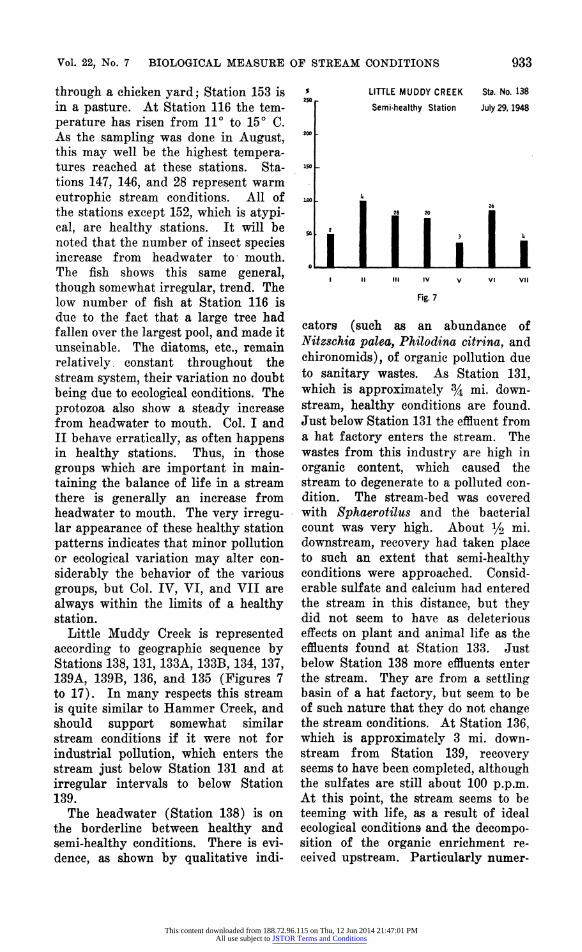
Little Muddy Creek is represented according to geographic sequence by Stations 138,131,133A, 133B, 134, 137, 139A, 139B, 136, and 135 (Figures 7 to 17). In many respects this stream is quite similar to Hammer Creek, and should support somewhat similar stream conditions if it were not for
industrial pollution, which enters the stream just below Station 131 and at
irregular intervals to below Station 139.
The headwater (Station 138) is on
the borderline between healthy and
semi-healthy conditions. There is evi
dence, as shown by qualitative indi
t LITTLE MUDDY CREEK Sta. No. 138 2? r
Semi-healthy Station July 29.1948
26 20
M I I I
I II III IV V VI VII
Fig. 7
cators (such as an abundance of Niizschia palea, Philodina citrina, and
chironomids), of organic pollution due to sanitary wastes. As Station 131,
which is approximately % mi. down
stream, healthy conditions are found.
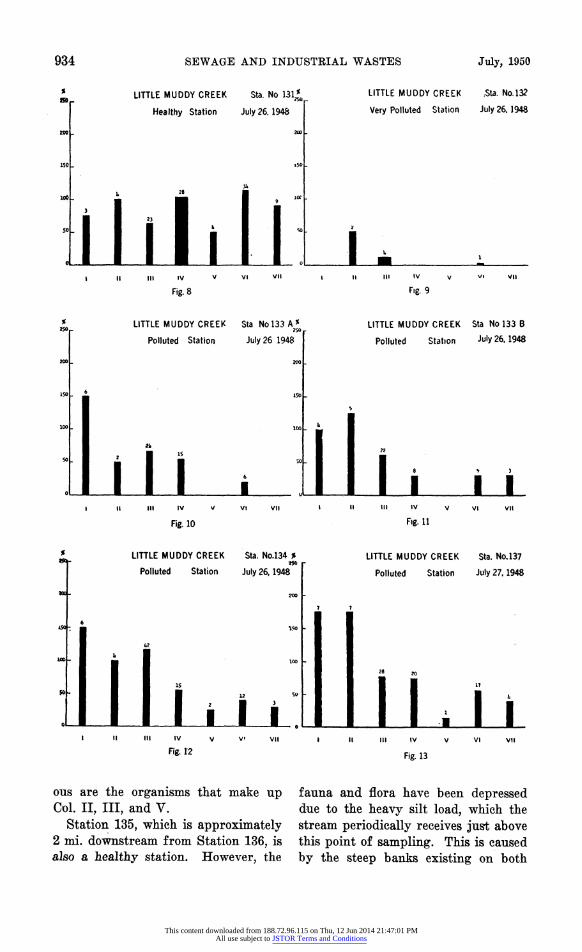
Just below Station 131 the effluent from a hat factory enters the stream. The wastes from this industry are high in
organic content, which caused the stream to degenerate to a polluted con
dition. The stream-bed was covered with Sphaerotilus and th? bacterial count was very high. About % mi
downstream, recovery had taken place to such an extent that semi-healthy conditions were approached. Consid erable sulfate and calcium had entered the stream in this distance, but they did not seem to have as deleterious effects on plant and animal life as the effluents found at Station 133. Just below Station 138 more effluents enter the stream. They are from a settling basin of a hat factory, but seem to be of such nature that they do not change the stream conditions. At Station 136,
which is approximately 3 mi. down stream from Station 139, recovery seems to have been completed, although the sulfates are still about 100 p.p.m.
At this point, the stream seems to be
teeming with life, as a result of ideal
ecological conditions and the decompo sition of the organic enrichment re ceived upstream. Particularly numer
This content downloaded from 188.72.96.115 on Thu, 12 Jun 2014 21:47:01 PMAll use subject to JSTOR Terms and Conditions
934 SEWAGE AND INDUSTRIAL WASTES July, 1950
% sa,.
% 250
UTTLE MUDDY CREEK Sta. No 131?
Healthy Station July 26.1948
1 ?
Oil
k
1 II III IV V VI VII
Fig. 8
LITTLE MUDDY CREEK Sta No 133 A *
Polluted Station July 26 1948
ill II III IV V VI VII
Fig. 10
LITTLE MUDDY CREEK Sta. No.134 % ?50 r
Polluted Station July 26,1948
lili III tv
Fig. 12
LITTLE MUDDY CREEK Sta. No.132
Very Polluted Station July 26.1948
1 It III IV
Fig. 9
VI VII
LITTLE MUDDY CREEK Sta No 133 B
Polluted Station -My 26.1948
i i i i? m IV V VI VII
Fig. 11
LITTLE MUDDY CREEK Sta. No,137
Polluted Station July 27,1948
2? ?0
LLi II III IV VI VII
Fig. 13
ous are the organisms that make up Col. II, III, and V.
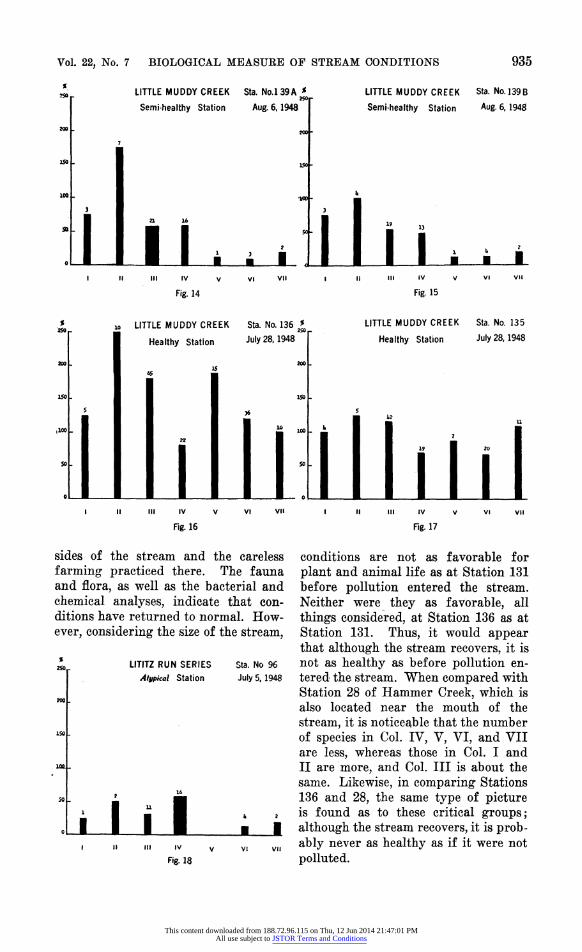
Station 135, which is approximately 2 mi. downstream from Station 136, is also a healthy station. However, the
fauna and flora have been depressed due to the heavy silt load, which the
stream periodically receives just above this point of sampling. This is caused
by the steep banks existing on both
This content downloaded from 188.72.96.115 on Thu, 12 Jun 2014 21:47:01 PMAll use subject to JSTOR Terms and Conditions
Vol. 22, No. 7 BIOLOGICAL MEASURE OF STREAM CONDITIONS 935
< 2SOr
3
1
LITTLE MUDDY CREEK Sta. N0.139A * 250p
Semi-healthy Station Aug. 6,1948
a 16
ii... II III IV
Fig. 14
LITTLE MUDDY CREEK Sta. No. 136 ?
Healthy Station July 28,1948
22
1 III IV
Fig. 16
LITTLE MUDDY CREEK Sta. No.l39B
Semi-healthy Station Aug. 6,1948
lln... i h m iv v VI VII
Fig. 15
LITTLE MUDDY CREEK Sta. No. 135
Healthy Station July 28,1948
ilhlii I II III IV V VI VII
Fig. 17
sides of the stream and the careless
farming practiced there. The fauna and flora, as well as the bacterial and chemical analyses, indicate that con ditions have returned to normal. How
ever, considering the size of the stream,
?^ LITITZ RUN SERIES Atypkal Station
lil I II m IV v vi VII
Fig. 18
conditions are not as favorable for
plant and animal life as at Station 131 before pollution entered the stream.
Neither were they as favorable, all
things considered, at Station 136 as at Station 131. Thus, it would appear that although the stream recovers, it is
not as healthy as before pollution en tered the stream. "When compared with Station 28 of Hammer Creek, which is also located near the mouth of the
stream, it is noticeable that the number of species in Col. IV, V, VI, and VII are less, whereas those in Col. I and II are more, and Col. Ill is about the same. Likewise, in comparing Stations 136 and 28, the same type of picture is found as to these critical groups;
although the stream recovers, it is prob
ably never as healthy as if it were not
polluted.
This content downloaded from 188.72.96.115 on Thu, 12 Jun 2014 21:47:01 PMAll use subject to JSTOR Terms and Conditions
936 SEWAGE AND INDUSTRIAL WASTES July, 1950
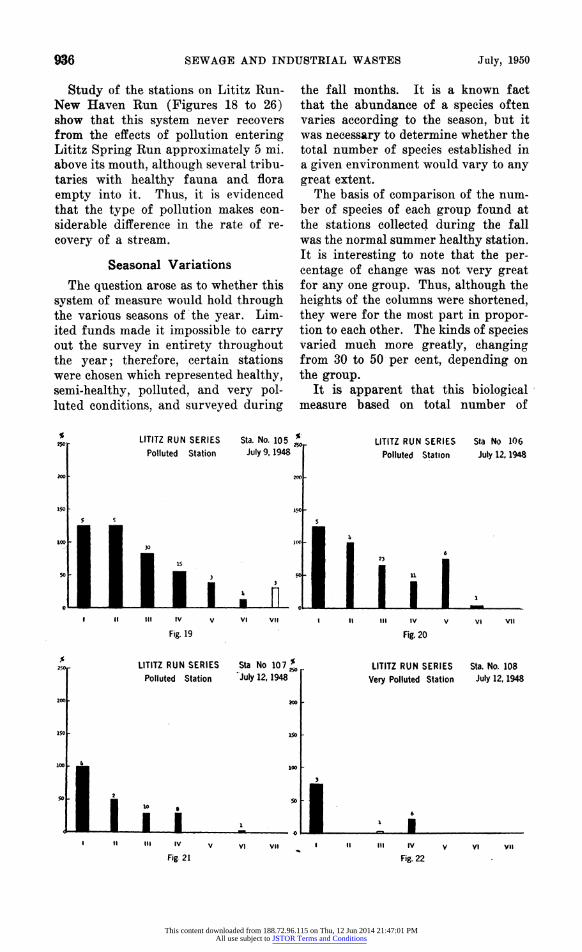
Study of the stations on Lititz Run New Haven Run (Figures 18 to 26) show that this system never recovers
from the effects of pollution entering Lititz Spring Run approximately 5 mi.
above its mouth, although several tribu taries with healthy fauna and flora
empty into it. Thus, it is evidenced
that the type of pollution makes con
siderable difference in the rate of re
covery of a stream.
Seasonal Variations
The question arose as to whether this
system of measure would hold through the various seasons of the year. Lim
ited funds made it impossible to carry out the survey in entirety throughout the year; therefore, certain stations
were chosen which represented healthy, semi-healthy, polluted, and very pol luted conditions, and surveyed during
the fall months. It is a known fact that the abundance of a species often varies according to the season, but it was necessary to determine whether the total number of species established in a given environment would vary to any
great extent. The basis of comparison of the num
ber of species of each group found at
the stations collected during the fall was the normal summer healthy station. It is interesting to note that the per centage of change was not very great for any one group. Thus, although the
heights of the columns were shortened, they were for the most part in propor tion to each other. The kinds of species varied much more greatly, changing from 30 to 50 per cent, depending on
the group. It is apparent that this biological
measure based on total number of
250r
LITITZ RUN SERIES Sta. No. 105 *
Polluted Station July 9,1948
lui
3
1 ?
LITITZ RUN SERIES Sta No 107 *,
Polluted Station July 12,1948
.00 . J^
I I I I II III IV
Fig 21
V) VII
LITITZ RUN SERIES Sta No 106
Polluted Station July 12,1948
hi I h m IV v VI VII I II III IV V VI VII
Fig. 19 Fig. 20
LITITZ RUN SERIES Sta. No. 108
Very Polluted Station July 12,1948
II III IV
Fig. 22
VI vu
This content downloaded from 188.72.96.115 on Thu, 12 Jun 2014 21:47:01 PMAll use subject to JSTOR Terms and Conditions
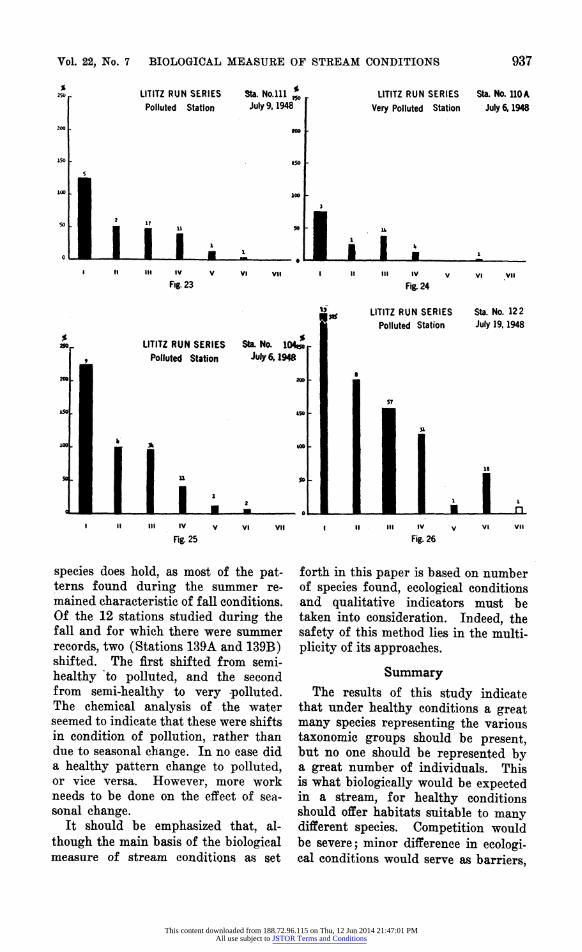
Vol. 22, No. 7 BIOLOGICAL MEASURE OF STREAM CONDITIONS 937
LITITZ RUN SERIES Polluted Station
Sta. No.111 ? July 9,1948
I i I k i Jill.
LITITZ RUN SERIES Sta. No. 110A
Very Polluted Station July 6,1948
n m IV v
Fig. 23
LITITZ RUN SERIES Sta. No. 104?,
Polluted Station July 6,1948
L.
Ill IV v VI VII
Fig. 24
LITITZ RUN SERIES Sta. No. 122
Polluted Station July 19,1948 a*
IB
1 _n
III IV v
Fig. 25
VI VII III IV
Fig. 26
VI VII
species does hold, as most of the pat terns found during the summer re
mained characteristic of fall conditions. Of the 12 stations studied during the fall and for which there were summer
records, two (Stations 139A and 139B) shifted. The first shifted from semi
healthy to polluted, and the second from semi-healthy to very -polluted. The chemical analysis of the water seemed to indicate that these were shifts in condition of pollution, rather than due to seasonal change. In no case did a healthy pattern change to polluted, or vice versa. However, more work
needs to be done on the effect of sea sonal change.
It should be emphasized that, al
though the main basis of the biological measure of stream conditions as set
forth in this paper is based on number of species found, ecological conditions and qualitative indicators must be taken into consideration. Indeed, the
safety of this method lies in the multi
plicity of its approaches.
Summary
The results of this study indicate that under healthy conditions a great
many species representing the various taxonomic groups should be present, but no one should be represented by a great number of individuals. This is what biologically would be expected in a stream, for healthy conditions should offer habitats suitable to many different species. Competition would be severe; minor difference in ecologi cal conditions would serve as barriers,
This content downloaded from 188.72.96.115 on Thu, 12 Jun 2014 21:47:01 PMAll use subject to JSTOR Terms and Conditions
938 SEWAGE AND INDUSTRIAL WASTES July, 1950
thus setting up small varying ecologi cal niches, and permit survival.
A pollutant would eliminate many
species; thus, the few which did sur
vive would have less competition, and more chance for multiplication. The
result of the first effect of toxicity, or
a pollutant, would be a reduction in
species number and a greater abun
dance of those remaining. Some groups would be affected more severely than others. More severe toxic effects would result in the complete elimination of some groups, and a reduction in spe cies numbers in other groups. Severely toxic conditions would kill all organ isms.
Thus, the general effect of pollution seems to be a reduction in species num
ber, with the most tolerant forms sur
viving. Only in a few cases were
species found that only occurred under a given degree of polluted condition, and thus could be truly termed quali tative indicators.
To summarize, the biological measure
of stream conditions as described is
useful for a number of reasons:
1. On the premise that the balanced
physiological activities of aquatic life
in surface waters are essential for the
maintenance of healthy water condi
tions, it may be assumed that the most
direct measure of this biodynamic cycle will indicate the condition of the wa
ter. This measure shows the presence or absence of species of all major taxo
nomic groups that play a role in this
cycle, with the exception of the bac
teria, which are considered as to total
count, and fungi, which are treated
only as indicator organisms. 2. The chemical and physical char
acteristics of normal healthy streams
vary widely and cannot be reduced to a simple standard. Furthermore, there is no practical means of testing for all possible toxic agents that may be
present in a stream, and it is seldom
that a single agent acts independently as a limiting factor; rather, it is the
interaction of all factors present in a
given environment.
3. This measure, which uses largely the organisms that are attached to the
bottom or edges of the stream, will
reflect the water conditions that have
flowed by a given point for a consider
able time prior to the time of sampling, whereas a water sample represents only the condition at the moment it was
taken.
Reference
1. Ellis, M. M., "
Detection and Measurement
of Stream Pollution. ' '
Bulletin of V. S. Bur. of Fisheries, 48, 365 (1937).
This content downloaded from 188.72.96.115 on Thu, 12 Jun 2014 21:47:01 PMAll use subject to JSTOR Terms and Conditions