Embed Size (px)
Citation preview
Volker Sigwarth, Skan AG, Switzerland BI and Isolator Decontamination February 2006
Biological Indicators and H2O2 Decontamination of Isolator Systems
Volker Sigwarth Skan AG
Switzerland
Process Development
Volker Sigwarth, Skan AG, Switzerland BI and Isolator Decontamination February 2006
Biological Indicators and H2O2 DecontaminationProcess Development
• Overview of current Regulations and Standards
• Biological Indicators
• Investigation on Germ reducing Effects
• Method for Cycle Development
• Discussion of Risks, Possibilities, and Experience
Volker Sigwarth, Skan AG, Switzerland BI and Isolator Decontamination February 2006
“Effect of Carrier Materials on the Resistance of Spores of Bacillus Stearothermophilus to gaseous Hydrogen Peroxide”
Volker Sigwarth, Skan AGAlexandra Stärk, Novartis Pharma AG
PDA Journal, Vol. 57, No.1 January / February 2003
• Research Article PDA Journal
Biological Indicators and H2O2 DecontaminationProcess Development
Volker Sigwarth, Skan AG, Switzerland BI and Isolator Decontamination February 2006
“Process development and validation studies should include a thorough determination of cycle capability. The characteristics of these agents generally preclude the reliable use of statistical methods (e.g. fractional negative) to determine the process lethality (Ref. 13).”
• FDA; GMP Guidance for Industry; Draft August 2003
“Sterile Drug Products Produced by Aseptic Processing”
Biological Indicators and H2O2 DecontaminationProcess Development
• Decontamination Efficacy
Volker Sigwarth, Skan AG, Switzerland BI and Isolator Decontamination February 2006
“Effect of Carrier Materials on the Resistance of Spores of Bacillus Stearothermophilus to gaseous Hydrogen Peroxide”
Volker Sigwarth, Skan AGAlexandra Stärk, Novartis Pharma AG
PDA Journal, Vol. 57, No.1 January / February 2003
• Research Article PDA Journal
Biological Indicators and H2O2 DecontaminationProcess Development
• Cited as Reference (13); FDA GMP Guidance for Industry
Volker Sigwarth, Skan AG, Switzerland BI and Isolator Decontamination February 2006
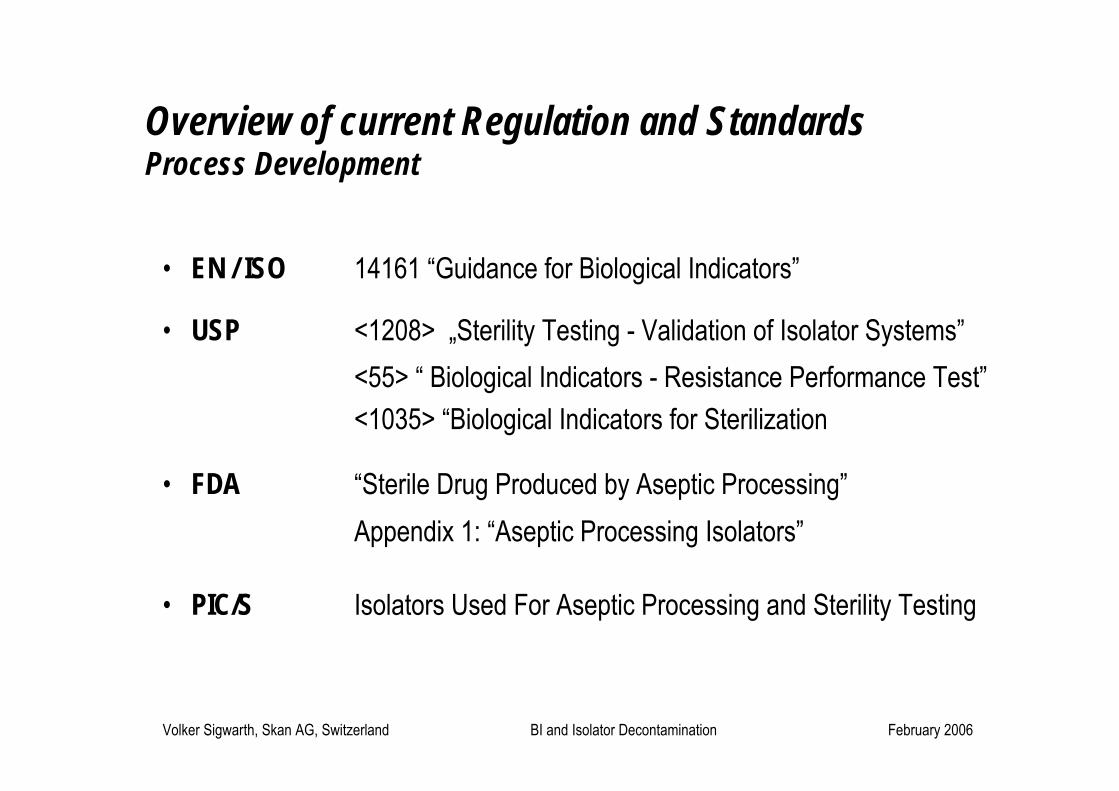
Overview of current Regulation and Standards Process Development
• EN / ISO 14161 “Guidance for Biological Indicators”
• USP <1208> „Sterility Testing - Validation of Isolator Systems”<55> “ Biological Indicators - Resistance Performance Test”<1035> “Biological Indicators for Sterilization
• FDA “Sterile Drug Produced by Aseptic Processing”Appendix 1: “Aseptic Processing Isolators”
• PIC/S Isolators Used For Aseptic Processing and Sterility Testing
Volker Sigwarth, Skan AG, Switzerland BI and Isolator Decontamination February 2006
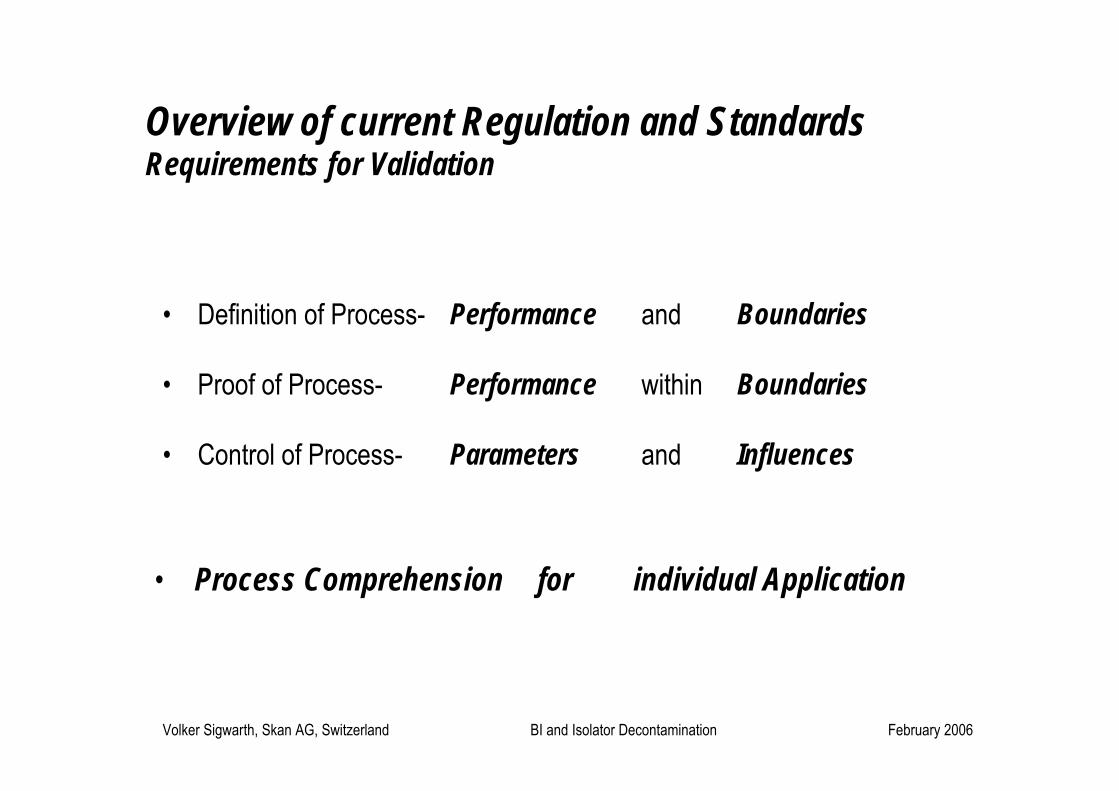
Overview of current Regulation and StandardsRequirements for Validation
• Definition of Process- Performance and Boundaries
• Proof of Process- Performance within Boundaries
• Control of Process- Parameters and Influences
• Process Comprehension for individual Application

Volker Sigwarth, Skan AG, Switzerland BI and Isolator Decontamination February 2006
• Process Development of an alternative Sterilization Method
Biological Indicators and H2O2 DecontaminationProcess Development
Physical System
Sterilization Process
Biological System

Volker Sigwarth, Skan AG, Switzerland BI and Isolator Decontamination February 2006
Biological Indicators for alternative Sterilization
• H2O2 Decontamination as alternative Sterilization Method
• Model of microbial Reduction Biological Indicators
• D-value Determination Biological Indicators
• Composition of Biological Indicators
Test Organism; Initial Population; Carrier Material; Primary Packaging
• Samples commercial available Biological Indicators

Volker Sigwarth, Skan AG, Switzerland BI and Isolator Decontamination February 2006
Standard Sterilization Methods
• Heat Processes Steam SterilizationDry Heat Sterilization
• Radiation Processes Gamma Radiation
• described in the Pharmacopoeias
• has to be used if possible
• Process Result „Sterility Assurance Level” SAL
• described Correlation
Physical Parameters Sterilization Effect

Volker Sigwarth, Skan AG, Switzerland BI and Isolator Decontamination February 2006
Alternative Sterilization Methods
• Chemical Processes Ethylene OxidePer Acetic AcidHydrogen Peroxide, H2O2OzoneChlorine Dioxide
• Physical Processes Electron BeamMicro WavesUV Beam
• Use only possible if Standard Methods are not applicable

Volker Sigwarth, Skan AG, Switzerland BI and Isolator Decontamination February 2006
Alternative Sterilization Methods
• One Step lower than Standard Sterilization Methods
• Terminology SanitizationDecontaminationInactivationDisinfection
• Process Result „Spore Log Reduction“ SLR
• Based on the Process Expectations individually defined

Volker Sigwarth, Skan AG, Switzerland BI and Isolator Decontamination February 2006
Alternative Sterilization Methods
• Surface Decontamination of the Isolator Chamber
• Vaporizing of aqueous H2O2 Solution
• Sporicidal Inactivation Process
• widely used in pharmaceutical Industry
H2O2 Decontamination of Isolator Systems
• Process Parameters are individually applied

Volker Sigwarth, Skan AG, Switzerland BI and Isolator Decontamination February 2006
Isolator System
Material: stainless steel, glass Volume: 1,4 m3 (40 ft3)
Vaporizer
Air in / out via Flaps
recirculated Air
Glove
Fan
HEPA Filter
PLC

Volker Sigwarth, Skan AG, Switzerland BI and Isolator Decontamination February 2006
Process Control
Process
• Temperature [°C]
• Humidity [% rH]
• Air Velocity [m/s]
• Pressure [Pa]
• Mass / Balance [g]
H2O2 Gas-Concentration
• Electro-chemical Sensor
• UV-Spectrometer
• IMS-Spectrometer
• NIR-Spectrometer
• Wet-chemistry Method

Volker Sigwarth, Skan AG, Switzerland BI and Isolator Decontamination February 2006
Decontamination Cycle
Cycle Phase
Decontamination Effect
1 3 42

Volker Sigwarth, Skan AG, Switzerland BI and Isolator Decontamination February 2006
Decontamination Cycle
Cycle Phase
Decontamination Effect
1 3 42
Phase 1: Pre-conditioningto establish the initial conditions in the chamber

Volker Sigwarth, Skan AG, Switzerland BI and Isolator Decontamination February 2006
Decontamination Cycle
Cycle Phase
Decontamination Effect
1 3 42
Phase 2: Conditioningto establish the decontamination effect

Volker Sigwarth, Skan AG, Switzerland BI and Isolator Decontamination February 2006
Decontamination Cycle
Cycle Phase
Decontamination Effect
1 3 42
Phase 3: Decontaminationto maintain stable decontamination effectto ensure the total bacterial reduction over time

Volker Sigwarth, Skan AG, Switzerland BI and Isolator Decontamination February 2006
Decontamination Cycle
Cycle Phase
Decontamination Effect
1 3 42
Phase 4: Aerationto reach minimal residual H2O2 concentration

Volker Sigwarth, Skan AG, Switzerland BI and Isolator Decontamination February 2006
Alternative Sterilization Methods
• No useful Correlation of:
• Relevant Process Parameters and Values not known
• Range and Boundaries of Process Values not known
• Design, Qualification, Routine Use generates Problems
• Unexpected high Effort for the Qualification of a single Application
Physical Parameters Inactivation Effect

Volker Sigwarth, Skan AG, Switzerland BI and Isolator Decontamination February 2006
Alternative Sterilization Methods
• No useful Correlation of:
• The use of alternative Inactivation Methods requires often:
Physical Parameters Inactivation Effect
• Description of the Inactivation Effect directly
• Measure of the Inactivation Effect
• by the Use of Biological Indicators

Volker Sigwarth, Skan AG, Switzerland BI and Isolator Decontamination February 2006
Microbiological System
Description of Biological Indicator
• defined Test Organism
• defined initial Population
• Carrier Material
• Primary Packaging
• defined Resistance to a specified Inactivation Method

Volker Sigwarth, Skan AG, Switzerland BI and Isolator Decontamination February 2006
Microbiological System
Resistance Description of Biological Indicator
• Initial Population of the Test Organisms [CFU/Carrier]
• D-value [min]
• Survival - Kill Window [min]
• Survival time [min] = D-value x ([log] Population – 2)
• Kill time [min] = D-value x ([log] Population + 4)

Volker Sigwarth, Skan AG, Switzerland BI and Isolator Decontamination February 2006
Microbiological System
-6.0
-5.0
-4.0
-3.0
-2.0
-1.0
0.0
1.0
2.0
3.0
4.0
5.0
6.0
0 1 2 3 4 5 6 7 8 9 10 11 12time [min]
Log Population
Model of microbial Reduction
survival fractional field kill
-1D- value
Model of Microbial Reduction
• Initial Population [log-scale]
• Inactivation Time [min]
• Survival Curve
• D-value [min]
• Survival - Kill Window [min]

Volker Sigwarth, Skan AG, Switzerland BI and Isolator Decontamination February 2006
Microbiological SystemProbability Distribution, positive / negative
0
10
20
30
40
50
60
70
80
90
100
2.0 1.0 0.0 -1.0 -2.0 -3.0 -4.0log m
%P(m)
Probability of negative
Probability of positive
P(m) = e- m
63 %
37 %

Volker Sigwarth, Skan AG, Switzerland BI and Isolator Decontamination February 2006
Microbiological System
-6.0
-5.0
-4.0
-3.0
-2.0
-1.0
0.0
1.0
2.0
3.0
4.0
5.0
6.0
0 1 2 3 4 5 6 7 8 9 10 11 12time [min]
Log Population
Model of microbial Reduction
- 1D-value
Model of Microbial Reduction
• Initial Population [log-scale]
• Inactivation Time [min]
• Survival Curve
• D-value [min]
• Survival - Kill Window [min]

Volker Sigwarth, Skan AG, Switzerland BI and Isolator Decontamination February 2006
Microbiological System
D-value of Biological Indicators
• Measure of the Inactivation Effect
• Quantification achieved Inactivation Effect
Important
• D-value Slope of the Survival Curve
• corresponding Model Behavior survival, fractional, kill

Volker Sigwarth, Skan AG, Switzerland BI and Isolator Decontamination February 2006
Methods of D-value Determination
• Numeration of the residual Population after Inactivation
Survivor Curve Method SCM
• Fractional Negative Methods
Stumbo Murphy Cochran Method SMCMLimited Spearman Karber Method LSKM
Suitable Method Selection of Biological Indicators Description of the Inactivation Effect

Volker Sigwarth, Skan AG, Switzerland BI and Isolator Decontamination February 2006
D-value Determination
SC Method
• defined numbers of BI
• defined Exposure Times
• Numeration of residual Population
• Plot of Survivor Curve
-6.0
-5.0
-4.0
-3.0
-2.0
-1.0
0.0
1.0
2.0
3.0
4.0
5.0
6.0
0 1 2 3 4 5 6 7 8 9 10 11 12time [min]
Log Population
• < 50% of initial Population
• > 50 Counts / Carrier
survival kill
Model of microbial Reduction
fractional Field
-1D-value

Volker Sigwarth, Skan AG, Switzerland BI and Isolator Decontamination February 2006
D-value Determination
SC Method• Survival Window• Beginning of fractional Field
-6.0
-5.0
-4.0
-3.0
-2.0
-1.0
0.0
1.0
2.0
3.0
4.0
5.0
6.0
0 1 2 3 4 5 6 7 8 9 10 11 12time [min]
Log Population
• high Lab Effort• good if Total Kill is not required• Disinfection Testing• “Last Chance Method”
survival kill
No Information about:
• Kill Window• Model Behaviour
Model of microbial Reduction
fractional Field
-1D-value

Volker Sigwarth, Skan AG, Switzerland BI and Isolator Decontamination February 2006
D-value Determination
SMCM
• high Number of BIs
• one Exposure Time; fractional Field
• Relationship of survival / kill
• initial Population
• Calculate D-value
-6.0
-5.0
-4.0
-3.0
-2.0
-1.0
0.0
1.0
2.0
3.0
4.0
5.0
6.0
0 1 2 3 4 5 6 7 8 9 10 11 12time [min]
Log Population
+-
survival kill
[ ] [ ] rnrn mPmPnCrrP −−××= )(1)()(
Model of microbial Reduction
fractional Field
-1D-value

Volker Sigwarth, Skan AG, Switzerland BI and Isolator Decontamination February 2006
D-value Determination
-6.0
-5.0
-4.0
-3.0
-2.0
-1.0
0.0
1.0
2.0
3.0
4.0
5.0
6.0
0 1 2 3 4 5 6 7 8 9 10 11 12time [min]
Log Population
+-
survival kill
SMC Method• initial Population• Survival Window• Beginning of fractional Field
• high statistical Accuracy• low Lab Effort • D-value has to be known• good if Total Kill is not required
No Information about:
• Kill Window• Model Behaviour
Model of microbial Reduction
fractional Field
-1D-value
[ ] [ ] rnrn mPmPnCrrP −−××= )(1)()(

Volker Sigwarth, Skan AG, Switzerland BI and Isolator Decontamination February 2006
Stumbo Murphy Cochran Method SMCM
exposure 01 exposure time [min] 13
- - - - + + + + + + neg - - - - + + + + + + - - - - + + + + + + + pos - - - + + + + + + + +
result
- - - + + + + + + +
D-value = 2.03 [min]95% CI D-value = 2.03 ± 0.05 [min]
+ growth- no growth
Initial Population N0: 1.0x 10⁶

Volker Sigwarth, Skan AG, Switzerland BI and Isolator Decontamination February 2006
D-value Determination
LSKM
• several Groups of Bioindicators
• different Exposure Times
• observed Model Behavior
• initial Population
• D-value Calculation
-6.0
-5.0
-4.0
-3.0
-2.0
-1.0
0.0
1.0
2.0
3.0
4.0
5.0
6.0
0 1 2 3 4 5 6 7 8 9 10 11 12time [min]
Log Population
Model of microbial Reduction
-1D-value
survival fractional Field kill
[ ] [ ] rnrn mPmPnCrrP −−××= )(1)()(

Volker Sigwarth, Skan AG, Switzerland BI and Isolator Decontamination February 2006
D-value Determination
-6.0
-5.0
-4.0
-3.0
-2.0
-1.0
0.0
1.0
2.0
3.0
4.0
5.0
6.0
0 1 2 3 4 5 6 7 8 9 10 11 12time [min]
Log Population
Model of microbial Reduction
-1D-value
survival fractional Field kill
[ ] [ ] rnrn mPmPnCrrP −−××= )(1)()(
LSKM
• Kill Window is covered
• Model Behavior is completely shown

Volker Sigwarth, Skan AG, Switzerland BI and Isolator Decontamination February 2006
Limited Spearman Karber Method LSKM
exposure 01 02 03 04 05 06 07 08 09 10exposuretime [min] 6.0 8.5 11.0 13.5 16.0 18.5 21.0 23.5 26.0 28.5result 1 + + + + + + - - - - neg 2 + + + + + + - - - - - 3 + + + + - - - - - - - 4 + + + + - - - - - - pos 5 + + + - - - - - - - + 6 + + + - - - - - - - + 7 + + + - - - - - - - 8 + + + - - - - - - - 9 + + - - - - - - - - 10 + - - - - - - - - -
D-value = 2.06 [min]95% CI D-value = 2.06 ± 0.22 [min]
+ growth- no growth
Initial Population N0:1.0 x 10⁶

Volker Sigwarth, Skan AG, Switzerland BI and Isolator Decontamination February 2006
Methods of D-value Determination
LSKM
• Determination the Resistance of Biological Indicator
• Evaluation of the complete Model Behaviour
• Certification of commercial Biological Indicators
• High Effort and Costs

Volker Sigwarth, Skan AG, Switzerland BI and Isolator Decontamination February 2006
Description of the Inactivation Effect
Selection of Biological Indicators Description of the Inactivation Effect
• good Estimation of the D- value
• good Understanding of the Model Behavior
• useful and pragmatic Tool
• good Relationship between Information and Costs

Volker Sigwarth, Skan AG, Switzerland BI and Isolator Decontamination February 2006
Limited Spearman Karber Method LSKM
exposure 01 02 03 04 05 06 07 08 09 10exposuretime [min] 6.0 8.5 11.0 13.5 16.0 18.5 21.0 23.5 26.0 28.5result 1 + + + + + + - - - - neg 2 + + + + + + - - - - - 3 + + + + - - - - - - - 4 + + + + - - - - - - pos 5 + + + - - - - - - - + 6 + + + - - - - - - - + 7 + + + - - - - - - - 8 + + + - - - - - - - 9 + + - - - - - - - - 10 + - - - - - - - - -
D-value = 2.06 [min]95% CI D-value = 2.06 ± 0.22 [min]
+ growth- no growth
Initial Population N0:1.0 x 10⁶

Volker Sigwarth, Skan AG, Switzerland BI and Isolator Decontamination February 2006
Minimized LSKM, Reactive Pattern
estimated D-value = 2.0 [min]
Group 01 02 03 04 05 06 07 08 09 10 pos Exposure Time[min]
6.0
9.0
12.0
15.0
18.0
21.0
24.0
27.0
30.0
33.0
+
Result 1 + + + + - - - - - - neg 2 + + + - - - - - - - - 3 + + - - - - - - - -
Initial Population N0:1.0 x 10⁶
+ growth- no growth
• statistical Accuracy lower• lost of Information in the fractional Field• good Estimation of the D-value

Volker Sigwarth, Skan AG, Switzerland BI and Isolator Decontamination February 2006
Description of the Inactivation Effect
Selection of Biological Indicators Description of the Inactivation Effect
• based on the Application of the minimized LSKM
• achieved Inactivation Effect can be quantified
• Model Behavior of Biological Indicator can be evaluated
• Application is useful and quite easy• Good Relationship between Information and Costs

Volker Sigwarth, Skan AG, Switzerland BI and Isolator Decontamination February 2006
Selection of Biological Indicators
• Test Organism
• Initial Population
• Carrier Material
• Primary Packaging
Composition of the Biological Indicator has to reflect the Process Expectations

Volker Sigwarth, Skan AG, Switzerland BI and Isolator Decontamination February 2006
Process Expectations H2O2 Decontamination of Isolator Systems
• Reduction of the microbial Contamination of the Isolator Chamber
• Reduction of the microbial Contamination on Surfaces
No Penetration of the Inactivation Effect
FDA: “Decontamination can be accomplished using a number of vaporizing agents, although these agents possess limited capability to penetrate obstructed or covered surfaces”

Volker Sigwarth, Skan AG, Switzerland BI and Isolator Decontamination February 2006
Process Expectations H2O2 Decontamination of Isolator Systems
• Reduction of the microbial Contamination of the Isolator Chamber
• Reduction of the microbial Contamination on Surfaces
No Penetration of the Inactivation Effect
• Total Kill of a 6 log Population 10 log Reduction

Volker Sigwarth, Skan AG, Switzerland BI and Isolator Decontamination February 2006
Selection of Bioindicators Reference Isolator
• defined and controlled Reference Isolator
• described and proven H2O2 Decontamination Cycle
achieved Decontamination Effect
Stability of Decontamination Effect
Comparability of all following data

Volker Sigwarth, Skan AG, Switzerland BI and Isolator Decontamination February 2006
Selection of Bioindicators Test Organism
• Test Organism „highly resistance”
• vegetative Microbes
• Bacteria Spores
Pharmacopoeia USP < 1035 >
PIC/S: “An understanding of the relationship between the resistance of the bioburden and that of the BI should be developed from trialsand/or the literature”

Volker Sigwarth, Skan AG, Switzerland BI and Isolator Decontamination February 2006
Selection of Bioindicators Test Organism
Glass0.3 – 0.6Penicillium species
Glass0.3 – 0.6Micrococcus luteusGlass0.6Acinetobaccter lwoffii
Glass0.3Aspergillus species
Glass< 0.3Pseudomonas aeroginosaGlass< 0.3Staphylococcus aureusCarrier MaterialD-value [min]Test Organism
Vegetative Microbes
Method Deviation ± 10%

Volker Sigwarth, Skan AG, Switzerland BI and Isolator Decontamination February 2006
Selection of Bioindicators Test Organism
Glass1.3Bacillus stearothermophilusATCC 12980
Glass1.4Bacillus stearothermophilus ATCC 7953
Glass1.3Bacillus subtilis var. nigerGlass1.2Bacillus sphaericusCarrier MaterialD-value [min]Test Organism
Bacteria Spores
Method Deviation ± 10%

Volker Sigwarth, Skan AG, Switzerland BI and Isolator Decontamination February 2006
Selection of Bioindicators Test Organism
• vegetative Microbes significant lower Resistance than B. Spores
• Bacteria Spores comparable Resistance

Volker Sigwarth, Skan AG, Switzerland BI and Isolator Decontamination February 2006
Selection of Bioindicators Test Organism
Bacillus stearothermophilus
• generally applied and accepted
• highly stable
• Incubation Temperature 55-60 °C
• Selective against Cross Contamination aseptic Handling
• ATCC Strain 12980 generally used in the USA
• ATCC Strain 7953 generally used in Europe

Volker Sigwarth, Skan AG, Switzerland BI and Isolator Decontamination February 2006
Biological Indicator for gaseous H2O2
+ growth- no growth
exposure 01 02 03 04 05 06 07 08 09 10 posexposuretime [min] 6.0 9.0 12.0 15.0 18.0 21.0 24.0 27.0 30.0 33.0 +result 1 + + + + - - - - - - neg 2 + + + - - - - - - - - 3 + + - - - - - - - -
exposure 01 02 03 04 05 06 07 08 09 10 posexposuretime [min] 6.0 9.0 12.0 15.0 18.0 21.0 24.0 27.0 30.0 33.0 +result 1 + + - - - - - - - - neg 2 + - - - - - - - - - - 3 + - - - - - - - - -
Testorganism: B. stearothermophilus ATCC 12980, min 1.0x10⁶
Carrier / Package: Stainless steel / TyvekSpezified D-value: 0.9 to 1.8 [min]
Lot 01
Lot 02

Volker Sigwarth, Skan AG, Switzerland BI and Isolator Decontamination February 2006
Biological Indicator for gaseous H2O2
+ growth- no growth
exposure 01 02 03 04 05 06 07 08 09 10 posexposuretime [min] 6.0 9.0 12.0 15.0 18.0 21.0 24.0 27.0 30.0 33.0 +result 1 + + + + - + - - - - neg 2 + + + + - - - - - - - 3 + + + - - - - - - -
exposure 01 02 03 04 05 06 07 08 09 10 posexposuretime [min] 6.0 9.0 12.0 15.0 18.0 21.0 24.0 27.0 30.0 33.0 +result 1 + - - - - - - - - - neg 2 + - - - - - - - - - - 3 + - - - - - - - - -
Testorganism: B. stearothermophilus ATCC 7953, min 1.0x10⁶
Carrier / Package: Stainless steel / TyvekSpezified D-value: 1.0 to 1.7 [min]
Lot 01
Lot 02

Volker Sigwarth, Skan AG, Switzerland BI and Isolator Decontamination February 2006
Selection of Bioindicators Test Organism
Bacillus stearothermophilus
commercially available Bioindicators with identical Composition
• bigger Differences of Resistance between single Lots
• than between different Strains

Volker Sigwarth, Skan AG, Switzerland BI and Isolator Decontamination February 2006
Selection of Bioindicators Population, N0
• Initial Population „total kill” of a 6 log Population ?
• D-value independent of the initial Population
• D-value only depends Resistance of the individual Microbe
Assumptions based on the ideal Model empiric

Volker Sigwarth, Skan AG, Switzerland BI and Isolator Decontamination February 2006
Initial Population, N0
Model of microbial Reduction
• Survival Curve is a straight Line
• BI Resistance independent of N0
• individual Resistance of Microbe defines D-value of BI`s
• Slope of Survival Curve identically observed
-6.0
-5.0
-4.0
-3.0
-2.0
-1.0
0.0
1.0
2.0
3.0
4.0
5.0
6.0
0 1 2 3 4 5 6 7 8 9 10 11 12time [min]
Log Population [Nt]
Model of microbial Reduction
- 1D-value

Volker Sigwarth, Skan AG, Switzerland BI and Isolator Decontamination February 2006
Selection of Bioindicators Population, N0
0.6≥ 1.0 x 10⁵Micrococcus luteus
> 3.6≥ 1.0 x 10⁶Micrococcus luteus
0.3≥ 1.0 x 10⁴Micrococcus luteus
0.3≥ 1.0 x 10³Micrococcus luteus
D-value [min]Population, N0 [log Steps]Test Organism
Resistance in dependency of Initial Population
Method Deviation ± 10%

Volker Sigwarth, Skan AG, Switzerland BI and Isolator Decontamination February 2006
Initial Population, N0
Model of microbial Reduction
• Resistance of BI seems to depend on N0
• Survival Curve seems to be not straight
• Model becomes questioned
-6.0
-5.0
-4.0
-3.0
-2.0
-1.0
0.0
1.0
2.0
3.0
4.0
5.0
6.0
0 1 2 3 4 5 6 7 8 9 10 11 12time [min]
Log Population [Nt]
Model of microbial Reduction

Volker Sigwarth, Skan AG, Switzerland BI and Isolator Decontamination February 2006
Population N0 Model Behavior
• Initial Population: 1 x 10⁵
• estimated D-value: 1.3 [min]• Model behavior: OK
Group 01 02 03 04 05 06 07 08 09 10 pos Exposure Time [min]
3.0
6.0
9.0
12.0
15.0
18.0
21.0
24.0
27.0
30.0
+
Result 1 + + + - - - - - - - neg 2 + + - - - - - - - - - 3 + - - - - - - - - -
+ growth- no growth
Test Organism: B. stearothermophilus carrier Material: Glass

Volker Sigwarth, Skan AG, Switzerland BI and Isolator Decontamination February 2006
Population N0 Model Behavior
• Initial Population: 1 x 10⁶
• estimated D-value: 1.9 [min]• Model Behavior: not OK
Group 01 02 03 04 05 06 07 08 09 10 pos Exposure time [min]
3.0
6.0
9.0
12.0
15.0
18.0
21.0
24.0
27.0
30.0
+
Result 1 + + + - - - + - + - neg 2 + + + - - - + - - - - 3 + + - - - - - - - -
Test Organism: B. stearothermophilus carrier Material: Glass + growth
- no growth

Volker Sigwarth, Skan AG, Switzerland BI and Isolator Decontamination February 2006
Selection of Bioindicators Population, N0
By Increasing the Initial Population of BI`s it can be observed
• Increase in Resistance higher D-value
• Artifacts in the Model Behavior late positive
H2O2 Decontamination Process seems to be not confidence

Volker Sigwarth, Skan AG, Switzerland BI and Isolator Decontamination February 2006
Selection of Bioindicators Population, N0
• vegetative Microbes are relatively big forming Agglomerates
• Preparation significantly difficult forming Agglomerates
• Suspensions often highly dirty forming a Coating
Dependency of Initial Population and Resistance

Volker Sigwarth, Skan AG, Switzerland BI and Isolator Decontamination February 2006
Selection of Bioindicators Population, N0

Volker Sigwarth, Skan AG, Switzerland BI and Isolator Decontamination February 2006
Selection of Bioindicators Population, N0

Volker Sigwarth, Skan AG, Switzerland BI and Isolator Decontamination February 2006
Selection of Bioindicators Population, N0

Volker Sigwarth, Skan AG, Switzerland BI and Isolator Decontamination February 2006
Selection of Bioindicators Population, N0
• vegetative Microbes are relatively big forming Agglomerates
• Preparation significantly difficult forming Agglomerates
• Suspensions often highly dirty forming a Coating
• Agglomerates and Coating are not penetrated by H2O2
• inconsistent Results of Bioindicators
Dependency of Initial Population and Resistance
The Penetration of the Decontamination Effect of the H2O2 Process is• not ensured• but also not expected

Volker Sigwarth, Skan AG, Switzerland BI and Isolator Decontamination February 2006
Selection of Bioindicators Population, N0
1.4≥ 1.0 x 10⁶Bacillus stearothermophilus
1.3≥ 1.0 x 10⁴Bacillus stearothermophilus
1.6≥ 1.0 x 10²Bacillus stearothermophilus
D-value [min]Population, N0 [log Steps]Test Organism
Dependency of Initial Population and Resistance
Method Deviation ± 10%

Volker Sigwarth, Skan AG, Switzerland BI and Isolator Decontamination February 2006
Selection of Bioindicators Population, N0

Volker Sigwarth, Skan AG, Switzerland BI and Isolator Decontamination February 2006
Selection of Bioindicators Population, N0

Volker Sigwarth, Skan AG, Switzerland BI and Isolator Decontamination February 2006
Selection of Bioindicators Population, N0

Volker Sigwarth, Skan AG, Switzerland BI and Isolator Decontamination February 2006
Selection of Bioindicators Carrier Material
PIC/S Recommendation on Isolator Technology
“The carrier type e.g. plastic, paper, metal or other, of the biologicalindicator organism should be relevant to the materials being gassed or shown to be irrelevant”
FDA Comments on Isolator Technology
“Rationale and justification of the use of stainless steel coupons as the challenge carrier for biological indicators”

Volker Sigwarth, Skan AG, Switzerland BI and Isolator Decontamination February 2006
Selection of Bioindicators Carrier Material
Isolator Systems
• Stainless- Steel Isolator Chamber, Filling line, dif. Equipment• Glass Isolator Windows, div. Product Enclosures• dif. Plastic Materials Gloves, Sleeves, div. Product Enclosures• dif. Metals e.g. Aluminum
Biological Indicator
• Should reflect the Process• Should behave according the Model of microbial Reduction

Volker Sigwarth, Skan AG, Switzerland BI and Isolator Decontamination February 2006
Effect of Carrier Materials on the Resistance of B.stearothermophilus to gaseous H2O2
“Effect of Carrier Materials on the Resistance of Spores of Bacillus Stearothermophilus to gaseous Hydrogen Peroxide”
Volker Sigwarth, Skan AGAlexandra Stärk, Novartis Pharma AG
PDA Journal, Vol. 57, No.1 January / February 2003
• Research Article PDA Journal

Volker Sigwarth, Skan AG, Switzerland BI and Isolator Decontamination February 2006
Selection of Bioindicators Carrier MaterialMaterials Use
CrNi steel, different qualities:1.4301 (304) unpolished1.4301 (304) polished (Ra < 0.8 μm)1.4435 (316L) unpolished1.4435 (316L) polished (Ra < 0.8 μm)
Main chamber materialParts of filling lineSteritest pump
Glass Window and door materialMedia bottles, product units
Polycarbonate, PC Window materialHypalon Glove materialPolyvinylchloride, PVC, soft Material of glove gauntletsPolyvinylchloride, PVC, hard Glove portsPolyvinylchloride, PVC Package of steritest unitsPolyoxymethylene, POM Conveyer system of filling line, shelfs of steritest isolatorPolypropylene, PP RTP-portsPolyethylene, PE-UHMW Conveyer system of filling line, RTP-portsPolytetrafluorethylene PTFE / (Teflon) Tubings, parts of filling line
Aluminium anodized, different qualitiesMaterial sample commercially availableMaterial sample filling lineMaterial sample air sampler
Butyl caoutchouc Stoppers of media bottles and product unitsLaminated foil 1; from inside to outside:Polyethylene, Aluminium, Polyester Package of media plates for cleanroom monitoring
Laminated foil 2; from inside to outside:Polyethylene, Polypropylene Package of media plates for cleanroom monitoring
Tyvek Package of Steritest unitsHEPA-filter pad HEPA-filter

Volker Sigwarth, Skan AG, Switzerland BI and Isolator Decontamination February 2006
Roughness• P-P: 137 nm• RMS: 3 nm• Ra: 1 nm
Wettability• high
Carrier Material; Glass

Volker Sigwarth, Skan AG, Switzerland BI and Isolator Decontamination February 2006
Carrier Material, Model Behavior
• estimated D-value: 1.2 [min]• Model Behavior: OK
Group 01 02 03 04 05 06 07 08 09 10 pos Exposure Time [min]
2.0
4.0
6.0
8.0
10.0
12.0
14.0
16.0
18.0
20.0
+
Result 1 + + + + - - - - - - neg 2 + + + - - - - - - - - 3 + + + - - - - - - -
+ growth- no growth
Test Organism: B. stearothermophilusInitial Population: > 1.0 x 10⁶
Carrier Material: Glass

Volker Sigwarth, Skan AG, Switzerland BI and Isolator Decontamination February 2006
Roughness• P-P: 817 nm• RMS: 82 nm• Ra: 57 nm
Wettability• high
Carrier Material; stainless steel 1.4435, not polished

Volker Sigwarth, Skan AG, Switzerland BI and Isolator Decontamination February 2006
Carrier Material, Model Behavior
Group 01 02 03 04 05 06 07 08 09 10 pos Exposure Time [min]
2.0
4.0
6.0
8.0
10.0
12.0
14.0
16.0
18.0
20.0
+
Result 1 + + + + + - - - - - neg 2 + + + - - - - - - - - 3 + + - - - - - - - -
+ growth- no growth
Test Organism: B. stearothermophilusInitial Population: > 1.0 x 10⁶
Carrier Material: Stainless Steel, not polished
• estimated D-value: 1.3 [min]• Model Behavior: OK

Volker Sigwarth, Skan AG, Switzerland BI and Isolator Decontamination February 2006
Carrier Material; stainless steel 1.4435, polished
Roughness• P-P: 1064 nm• RMS: 165 nm• Ra: 127 nm
Wettability• high

Volker Sigwarth, Skan AG, Switzerland BI and Isolator Decontamination February 2006
Carrier Material, Model Behavior
+ growth- no growth
Test Organism: B. stearothermophilusInitial Population: > 1.0 x 10⁶
Carrier Material: Stainless Steel, polished
• estimated D-value: 0.9 [min]• Model Behavior: OK
Group 01 02 03 04 05 06 07 08 09 10 pos Expousure [min]
2.5
5.0
7.5
10.0
12.5
15.0
17.5
20.0
22.5
25.0
+
Result 1 + + + - - - - - - - neg 2 + + - - - - - - - - - 3 + - - - - - - - - -

Volker Sigwarth, Skan AG, Switzerland BI and Isolator Decontamination February 2006
Carrier Material; PTFE, Teflon
Roughness• P-P: 1266 nm• RMS: 180 nm• Ra: 138 nm
Wettability• low

Volker Sigwarth, Skan AG, Switzerland BI and Isolator Decontamination February 2006
Carrier Material, Model Behavior
+ growth- no growth
Test Organism: B. stearothermophilusInitial Population: > 1.0 x 10⁶
Carrier Material: PTFE
• estimated D-value: 1.6 [min]• Model Behavior: OK
Group 01 02 03 04 05 06 07 08 09 10 pos Expousure [min]
2.5
5.0
7.5
10.0
12.5
15.0
17.5
20.0
22.5
25.0
+
Result 1 + + + + + - - - - - neg 2 + + + + - - - - - - - 3 + + + - - - - - - -

Volker Sigwarth, Skan AG, Switzerland BI and Isolator Decontamination February 2006
Roughness• P-P: 2114 nm• RMS: 350 nm• Ra: 286 nm
Wettability• low
Carrier Material, Hypalon

Volker Sigwarth, Skan AG, Switzerland BI and Isolator Decontamination February 2006
Carrier Material, Model Behavior
+ growth- no growth
Test Organism: B. stearothermophilusInitial Population: > 1.0 x 10⁶
Carrier Material: Hypalon
• estimated D-value: 3.0 [min]• Model Behavior: OK
Group 01 02 03 04 05 06 07 08 09 10 pos Expousure [min]
10.0
20.0
30.0
40.0
50.0
60.0
70.0
80.0
90.0
100.0
+
Result 1 + + - - - - - - - - neg 2 + - - - - - - - - - - 3 + - - - - - - - - -

Volker Sigwarth, Skan AG, Switzerland BI and Isolator Decontamination February 2006
Roughness• P-P: 1322 nm• RMS: 188 nm• Ra: 145 nm
Wettability• high
Carrier Material, Aluminium; commercial Sample

Volker Sigwarth, Skan AG, Switzerland BI and Isolator Decontamination February 2006
Carrier Material, Model Behavior
Group 01 02 03 04 05 06 07 08 09 10 pos Exposure Time [min]
10.0
20.0
30.0
40.0
50.0
60.0
70.0
80.0
90.0
100.0
+
Result 1 + + + + + + + - - + neg 2 + - - + + - + - - - - 3 + - - + + - - - - -
+ growth- no growth
• estimated D-value: 8.4 [min]• Model Behavior: not OK
Test Organism: B. stearothermophilusInitial Population: > 1.0 x 10⁶
Carrier Material: Aluminum, anodized

Volker Sigwarth, Skan AG, Switzerland BI and Isolator Decontamination February 2006
Carrier Material, Aluminium; Air Sampler
Roughness• P-P: 1436 nm• RMS: 290 nm• Ra: 236 nm
Wettability• high

Volker Sigwarth, Skan AG, Switzerland BI and Isolator Decontamination February 2006
Carrier Material, Model Behavior
+ growth- no growth
• estimated D-value: 7.9 [min]• Model Behavior: OK
Test Organism: B. stearothermophilusInitial Population: > 1.0 x 10⁶
Carrier Material: Aluminum, Air Sampler
Group 01 02 03 04 05 06 07 08 09 10 pos Expousure [min]
10.0
20.0
30.0
40.0
50.0
60.0
70.0
80.0
90.0
100.0
+
Result 1 + + + + + + + - - - neg 2 + + + + + - - - - - - 3 + + + + + - - - - -

Volker Sigwarth, Skan AG, Switzerland BI and Isolator Decontamination February 2006
Roughness• P-P: 1478 nm• RMS: 132 nm• Ra: 94 nm
Wettability• high
Carrier Material, Aluminium; Filling Line

Volker Sigwarth, Skan AG, Switzerland BI and Isolator Decontamination February 2006
Carrier Material, Model Behavior
+ growth- no growth
• estimated D-value: > 33.7 [min]• Model Behavior: not able to be evaluated
Test Organism: B. stearothermophilusInitial Population: > 1.0 x 10³
Carrier Material: Aluminum, anodized
Group 01 02 03 04 05 06 07 08 09 10 pos Expousure [min]
10.0
20.0
30.0
40.0
50.0
60.0
70.0
80.0
90.0
100.0
+
Result 1 + + + + + + + + + + neg 2 + + + + + + + + + + - 3 + + + + + + + + + +

Volker Sigwarth, Skan AG, Switzerland BI and Isolator Decontamination February 2006
Carrier Material of BI D-value Estimations [mins] Model BehaviourGlass 1.0 / 1.1 givenCrNi steel 1.4435, polished 1.3 / 0.9 givenCrNi steel 1.4301, unpolished 1.0 / 1.2 givenCrNi steel 1.4435, unpolished 1.0 / 1.4 givenCrNi steel 1.4301, polished 1.3 / 1.4 givenPVC, hard 1.0 / 1.8 givenPTFE 1.3 / 1.6 givenPE, UHMW 1.6 / 1.6 givenPP 1.3 / 2.0 givenPVC 2.0 / 1.6 givenLaminated foil 1, outside 1.6 / 2.5 givenPC 2.2 / 2.3 givenBI, commercially available 2.6 / 2.3 givenTyvek 2.0 / 3.1 givenLaminated foil 2, outside 2.5 / 3.2 givenButyl chaouchouc 2.9 / 3.1 givenHypalon 3.0 / 4.1 givenHEPA-filter pad 3.6 / 3.6 givenPVC, soft 4.3 / 4.6 givenPOM 4.6 / 4.4 givenAluminium, anodized, commercially available > 3.1 / 7.9 not givenAluminium, anodized, air sampler >8.3 / 10.1 givenAluminium, anodized, filling line >17.1 / > 33.7 not applicable
Selection of Bioindicators Carrier Material

Volker Sigwarth, Skan AG, Switzerland BI and Isolator Decontamination February 2006
Box and Whisker Plot
D-value [min]
Significantly higher D-value for the various aluminium samples
Selection of Bioindicators Carrier Material

Volker Sigwarth, Skan AG, Switzerland BI and Isolator Decontamination February 2006
Selection of Bioindicators Carrier Material
Unsuitable Carrier Material
• Negative influence on the Resistance of Bioindicators • Negative influence on the Model Behavior of Bioindicators
• Materials are spongy or porous • Test Organism penetrate into those Materials• not or only hart to be reached by H2O2 Decontamination

Volker Sigwarth, Skan AG, Switzerland BI and Isolator Decontamination February 2006
Carrier Material stainless steel, not polished

Volker Sigwarth, Skan AG, Switzerland BI and Isolator Decontamination February 2006
Carrier Material stainless steel, not polished

Volker Sigwarth, Skan AG, Switzerland BI and Isolator Decontamination February 2006
Carrier Material stainless steel, not polished

Volker Sigwarth, Skan AG, Switzerland BI and Isolator Decontamination February 2006
Carrier Material stainless steel, not polished

Volker Sigwarth, Skan AG, Switzerland BI and Isolator Decontamination February 2006
Carrier Material Aluminium; Air Sampler

Volker Sigwarth, Skan AG, Switzerland BI and Isolator Decontamination February 2006
Carrier Material Aluminium; Air Sampler

Volker Sigwarth, Skan AG, Switzerland BI and Isolator Decontamination February 2006
Carrier Material Aluminium; Air Sampler

Volker Sigwarth, Skan AG, Switzerland BI and Isolator Decontamination February 2006
Carrier Material Aluminium; Air Sampler

Volker Sigwarth, Skan AG, Switzerland BI and Isolator Decontamination February 2006
Carrier Material Aluminium anodized

Volker Sigwarth, Skan AG, Switzerland BI and Isolator Decontamination February 2006
Carrier Material Aluminium anodized

Volker Sigwarth, Skan AG, Switzerland BI and Isolator Decontamination February 2006
Carrier Material Aluminium anodized

Volker Sigwarth, Skan AG, Switzerland BI and Isolator Decontamination February 2006
Carrier Material Aluminium anodized

Volker Sigwarth, Skan AG, Switzerland BI and Isolator Decontamination February 2006
Carrier Material Aluminium anodized

Volker Sigwarth, Skan AG, Switzerland BI and Isolator Decontamination February 2006
Selection of Bioindicators Carrier Material
Unsuitable Carrier Material
• Negative influence on the Resistance of Bioindicators • Negative influence on the Model Behavior of Bioindicators
• Materials are spongy or porous • Test Organism penetrate into those Materials• not or only hart to be reached by H2O2 Decontamination
The Penetration of the Decontamination Effect of the H2O2 Process is• not ensured• but also not expected

Volker Sigwarth, Skan AG, Switzerland BI and Isolator Decontamination February 2006
0 0.5 1 1.5 2 2.5 3 3.5 4 4.5 5
Glass
Stainless steel 1.4435, polished
Stainless steel 1.4301, not polished
Stainless steel 1.4435, not polished
Stainless steel 1.4301, polished
Polyvinylchlorid, PVC hard
Polytetrafluorehylen PTFE
Polyethylen, PE UHMW
Polypropylen, PP
Polyvinylchlorid, PVC
Laminated foil 1
Polycarbonate, PC
Tyvek
Laminated foil 2
Reference BI
Butyl caoutchouc
Hypalon
HEPA-filter pad
Polyvinylchlorid, PVC soft
Polyoxymethylen, POM
Mat
eria
l
D-value [min]
D-value determination
D-value estimation 2
D-value estimation 1
Worst Case 4.33
Best Case 1.45
Reference 2.28
Selection of Bioindicators Carrier Material

Volker Sigwarth, Skan AG, Switzerland BI and Isolator Decontamination February 2006
Selection of Bioindicators Primary Packaging
„Primary Packaging should not effect the Inactivation and protectthe inoculated Carrier against Destruction and Contamination“
Standards EN/ISO 14161
H2O2 Decontamination
• semi permeable Membrane Tyvek • permeable for H2O2
• Barrier for Contamination

Volker Sigwarth, Skan AG, Switzerland BI and Isolator Decontamination February 2006
Primary Packaging
• Primary Packaging: Tyvek• estimated D-value: 1.2 [min]• Model Behavior: OK
Group 01 02 03 04 05 06 07 08 09 10 pos Exposure Time [min]
2.0
4.0
6.0
8.0
10.0
12.0
14.0
16.0
18.0
20.0
+
Result 1 + + + + - - - - - - neg 2 + + + - - - - - - - - 3 + + + - - - - - - -
Test Organism: B. stearothermophilusInitial Population: > 1.0 x 10⁶
Carrier Material: Stainless Steel + growth- no growth

Volker Sigwarth, Skan AG, Switzerland BI and Isolator Decontamination February 2006
Primary Packaging
Group 01 02 03 04 05 06 07 08 09 10 pos Exposure Time [min]
2.0
4.0
6.0
8.0
10.0
12.0
14.0
16.0
18.0
20.0
+
Result 1 + + - - - - - - - - neg 2 + + - - - - - - - - - 3 + + - - - - - - - -
Test Organism: B. stearothermophilusInitial Population: > 1.0 x 10⁶
Carrier Material: Stainless Steel + growth- no growth
• Primary Packaging: without primary Packaging• estimated D-value: 0.8 [min]• Model Behavior: OK

Volker Sigwarth, Skan AG, Switzerland BI and Isolator Decontamination February 2006
Selection of Biological Indicators
• Test organisms Bacteria Spores generally suitable
• Initial Population Preparation has to be suitable for Process
• Carrier Material Properties has to be suitable for Process
• Primary Packaging Properties has to be suitable for Process
BI Composition has to reflect the Process Requirements
• Bioindicators reflect the Decontamination effect realistic
• Bioindicators show a conform Model Behavior

Volker Sigwarth, Skan AG, Switzerland BI and Isolator Decontamination February 2006
Selection of Biological Indicators
• Bioindicators show unrealistic high Resistances
• Bioindicators show Artifacts in Model Behavior
• Bioindicators show Process- Performance und Boundaries
• Bioindicators are to high Process Challenge
• Bioindicators show Process to be overrated
• Bioindicators show Kind and Extent of acceptable Bioburden
Interpretation of the Process
Definition: Process- Performance und Expectations

Volker Sigwarth, Skan AG, Switzerland BI and Isolator Decontamination February 2006
Biological Indicator for gaseous H2O2
Testorganism: B. stearothermophilus ATCC 12980, min 4.5x10⁵
Carrier / Package: Glasfibre / TyvekSpezified D-value: 1.5 [min]
+ growth- no growth
exposure 01 02 03 04 05 06 07 08 09 10 posexposuretime [min] 5.0 10.0 15.0 20.0 25.0 30.0 35.0 40.0 45.0 50.0 +result 1 + + + + - + + - - - neg 2 + + - - - - - - - - - 3 + - - - - - - - - -
exposure 01 02 03 04 05 06 07 08 09 10 posexposuretime [min] 10.0 20.0 30.0 40.0 50.0 60.0 70.0 80.0 90.0 100.0 +result 1 + - + - + - - - - - neg 2 + - - - - - - - - - - 3 + - - - - - - - - -
Run 01
Run 02

Volker Sigwarth, Skan AG, Switzerland BI and Isolator Decontamination February 2006
Biological Indicator for gaseous H2O2
Testorganism: B. stearothermophilus ATCC 7953, min 1.0 x10⁶
Carrier / Package: Glasfibre / Tyvek, PESpezified D-value: 3.1 [min]
+ growth- no growthRun 01
Run 02
exposure 01 02 03 04 05 06 07 08 09 10 posexposuretime [min] 6.0 9.0 12.0 15.0 18.0 21.0 24.0 27.0 30.0 33.0 +result 1 + - + + + + + - - + neg 2 + - + + + + + - - + - 3 - - - + - + - - - +
exposure 01 02 03 04 05 06 07 08 09 10 posexposuretime [min] 10.0 20.0 30.0 40.0 50.0 60.0 70.0 80.0 90.0 100.0 +result 1 + + - + + + + - neg 2 + + - - + - - - - 3 + - - - - - - -

Volker Sigwarth, Skan AG, Switzerland BI and Isolator Decontamination February 2006
Selection of Biological Indicators Steam
Group 01 02 03 04 05 06 07 08 09 10 pos Exposure Time [min]
10.0
20.0
30.0
40.0
50.0
60.0
70.0
80.0
90.0
100.0
+
Result 1 + + + + + + + + + + neg 2 + + + + + + + + + + - 3 + + + + + + + - - +
+ growth- no growth
• estimated D-value: > 17.0 [min]• Model Behavior: not able to be evaluated
Test Organism: B. stearothermophilusInitial Population: > 1.0 x 10⁶
Carrier Material: Paper

Volker Sigwarth, Skan AG, Switzerland BI and Isolator Decontamination February 2006
Selection of Biological Indicators
• estimated D-value: = 2.0 [min]• Model Behavior: = OK
Group 01 02 03 04 05 06 07 08 09 10 pos Exposure Time [min]
6.0
9.0
12.0
15.0
18.0
21.0
24.0
27.0
30.0
33.0
+
Result 1 + + + + - - - - - - neg 2 + + + - - - - - - - - 3 + + - - - - - - - -
+ growth- no growth
Test Organism: B. stearothermophilusInitial Population: > 1.0 x 10⁶
Carrier Material: CrNi- StahlPrimary packaging: Tyvek

Volker Sigwarth, Skan AG, Switzerland BI and Isolator Decontamination February 2006
Selection of Biological Indicators
• Resistance and Model Behavior describes Bioindicator
• Process- Performance and Expectations defines Bioindicator
• careful Selection of Composition Bioindicators
Alternative Sterilization Methods
Artifacts in the Results of Bioindicators Process Boundaries

Volker Sigwarth, Skan AG, Switzerland BI and Isolator Decontamination February 2006
Biological Indicators and H2O2 Decontamination of Isolator Systems
Volker Sigwarth Skan AG, Switzerland
Alexandra Stärk Novartis Pharma AG, Switzerland

Volker Sigwarth, Skan AG, Switzerland BI and Isolator Decontamination February 2006
Biological Indicators and H2O2 Decontamination of Isolator Systems
Volker Sigwarth Skan AG
Switzerland
Process Development

Volker Sigwarth, Skan AG, Switzerland BI and Isolator Decontamination February 2006
• Process Development of alternative Sterilization Method
Biological Indicators and H2O2 DecontaminationProcess Development
Physical System
Sterilization Process
Biological System

Volker Sigwarth, Skan AG, Switzerland BI and Isolator Decontamination February 2006
Investigation on Germ Reducing Parameters of the H2O2 Decontamination Method
• Establish parameters of microbial reducing effects of H2O2 decontamination
• Target value is the D-value of a defined microbiological system
• Using the Design of Experiment method as statistical tool
• Statistical significant quantification of the influence of effects
• Correlation of Process Parameter versus Kill Effect
• Process Development

Volker Sigwarth, Skan AG, Switzerland BI and Isolator Decontamination February 2006
Investigation on Germ Reducing Parameters of the H2O2 Decontamination Method
• Comprehension of the decontamination process
• The nice and need to have parameters for the decontamination success
• Hints for Design, Qualification and Monitoring
• Method to describe, develop and quantify H2O2 decontamination cycles

Volker Sigwarth, Skan AG, Switzerland BI and Isolator Decontamination February 2006
Investigation on Germ Reducing Parameters of the H2O2 Decontamination Method
• Test - System and - Equipment
• Microbiological System
• Decontamination Process
• Selection of the experimental Factors
• Design of Experiment
• Result of Investigation and Interpretation
• Summary

Volker Sigwarth, Skan AG, Switzerland BI and Isolator Decontamination February 2006
Test - Isolator
Material: stainless steel, glass Volume: 1,4 m3 (40 ft3)
Vaporizer
Air in / out via Flaps
recirculated Air
Glove
Fan
HEPA Filter
PLC

Volker Sigwarth, Skan AG, Switzerland BI and Isolator Decontamination February 2006
Sensors
Process
• Temperature [°C]
• Humidity [% rH]
• Air Velocity [m/s]
• Pressure [Pa]
• Mass / Balance [g]
H2O2 Gas-Concentration
• Electro-chemical Sensor
• UV-Spectrometer
• IMS-Spectrometer
• NIR-Spectrometer
• Wet-chemistry Method

Volker Sigwarth, Skan AG, Switzerland BI and Isolator Decontamination February 2006
Microbiological System
• Commercially available Biological Indicators
• Bacillus stearothermophilus ATCC 12980
• Stainless Steel Carriers
• Tyvek Pouches

Volker Sigwarth, Skan AG, Switzerland BI and Isolator Decontamination February 2006
Microbiological System
-6.0
-5.0
-4.0
-3.0
-2.0
-1.0
0.0
1.0
2.0
3.0
4.0
5.0
6.0
0 1 2 3 4 5 6 7 8 9 10 11 12time [min]
Log Population
Model of microbial Reduction
- 1D-value
Model of Microbial Reduction
• Initial Population [log-scale]
• Inactivation Time [min]
• Survival Curve
• D-value [min]
• Survival - Kill Window [min]

Volker Sigwarth, Skan AG, Switzerland BI and Isolator Decontamination February 2006
Minimized LSKM, Reactive Pattern
estimated D-value = 2.0 [min]+ growth- no growth
exposure 01 02 03 04 05 06 07 08 09 10 posexposuretime [min] 6.0 9.0 12.0 15.0 18.0 21.0 24.0 27.0 30.0 33.0 +result 1 + + + + - - - - - - neg 2 + + + - - - - - - - - 3 + + - - - - - - - -

Volker Sigwarth, Skan AG, Switzerland BI and Isolator Decontamination February 2006
Limited Spearman Karber Method LSKMexposure 01 02 03 04 05 06 07 08 09 10exposuretime [min] 6.0 8.5 11.0 13.5 16.0 18.5 21.0 23.5 26.0 28.5result 1 + + + + + + - - - - neg 2 + + + + + + - - - - - 3 + + + + - - - - - - - 4 + + + + - - - - - - pos 5 + + + - - - - - - - + 6 + + + - - - - - - - + 7 + + + - - - - - - - 8 + + + - - - - - - - 9 + + - - - - - - - - 10 + - - - - - - - - -
D-value = 2.06 [min]95% CI D-value = 2.06 ± 0.22 [min]
+ growth- no growth

Volker Sigwarth, Skan AG, Switzerland BI and Isolator Decontamination February 2006
Decontamination Cycle
Cycle Phase
Decontamination Effect
1 3 42

Volker Sigwarth, Skan AG, Switzerland BI and Isolator Decontamination February 2006
Decontamination Cycle
Cycle Phase
Decontamination Effect
1 3 42
Phase 1: Pre-conditioningto establish the initial conditions in the chamber

Volker Sigwarth, Skan AG, Switzerland BI and Isolator Decontamination February 2006
Decontamination Cycle
Cycle Phase
Decontamination Effect
1 3 42
Phase 2: Conditioningto establish the decontamination effect

Volker Sigwarth, Skan AG, Switzerland BI and Isolator Decontamination February 2006
Decontamination Cycle
Cycle Phase
Decontamination Effect
1 3 42
Phase 3: Decontaminationto maintain stable decontamination effectto ensure the total bacterial reduction over time

Volker Sigwarth, Skan AG, Switzerland BI and Isolator Decontamination February 2006
Decontamination Cycle
Cycle Phase
Decontamination Effect
1 3 42
Phase 4: Aerationto reach minimal residual H2O2 concentration

Volker Sigwarth, Skan AG, Switzerland BI and Isolator Decontamination February 2006
Selection of Factors
Cycle Phase
Vaporized Quantity of H2O2
1 3 42

Volker Sigwarth, Skan AG, Switzerland BI and Isolator Decontamination February 2006
Selection of Factors
Pre-conditioningInitial conditions in the chamber Temperature [°C]
Humidity [%rH]
Cycle Phase
Vaporized Quantity of H2O2
1 3 42

Volker Sigwarth, Skan AG, Switzerland BI and Isolator Decontamination February 2006
Selection of Factors
ConditioningVaporized initial quantitiy of pure H2O2 Quantity [g/m3]
Cycle Phase
Vaporized Quantity of H2O2
1 3 42

Volker Sigwarth, Skan AG, Switzerland BI and Isolator Decontamination February 2006
Selection of Factors
DecontaminationRate of continuously vaporized pure H2O2 Redose [%/h]
Cycle Phase
Vaporized Quantity of H2O2
1 3 42

Volker Sigwarth, Skan AG, Switzerland BI and Isolator Decontamination February 2006
Selection of Factors
5 factors selected for the investigation
SpecialConcentration of H2O2 Solution H2O2 [%]
A: Quantity of pure H2O2 [g/m3]B: Rate of Redose [%A/h]C: Temperature [°C]D: Humidity [%rH]E: Concentration of H2O2 [%]

Volker Sigwarth, Skan AG, Switzerland BI and Isolator Decontamination February 2006
Range of Factors
No: Description Unit SP- FF- CP FF+ SP+
A: Quantity of pure H2O2 g/m3 4 5 6.5 8 9
B: Rate of Redose % A/h 20 40 70 100 120
C: Temperature °C 26 30 35 40 44
D: Humidity % rH 6 10 15 20 24
E: Concentration of H2O2 % 30 35 42.5 50 55

Volker Sigwarth, Skan AG, Switzerland BI and Isolator Decontamination February 2006
Design of Experiment DoEFF
FF FF
FF
CP
SP
SP SP
SP
• Fractional Factorial Plan FF• Centre Point CP• Star Point SP
Independent Estimation of the Parameters for:• Main Effects• Quatratic Effects• Interactions
• + 4 independent determinations of Centre Point

Volker Sigwarth, Skan AG, Switzerland BI and Isolator Decontamination February 2006
Range of Factors
No: Description Unit SP- FF- CP FF+ SP+
A: Quantity of pure H2O2 g/m3 4 5 6.5 8 9
B: Rate of Redose % A/h 20 40 70 100 120
C: Temperature °C 26 30 35 40 44
D: Humidity % rH 6 10 15 20 24
E: Concentration of H2O2 % 30 35 42.5 50 55

Volker Sigwarth, Skan AG, Switzerland BI and Isolator Decontamination February 2006
Test Handling
• place BI`s in the isolator gastight wrapped
Cycle Phase
Vaporized Quantity of H2O2
1 3 42

Volker Sigwarth, Skan AG, Switzerland BI and Isolator Decontamination February 2006
Test Handling
• establish required initial conditions• start vaporizing H2O2 up to required quantity
Cycle Phase
Vaporized Quantity of H2O2
1 3 42

Volker Sigwarth, Skan AG, Switzerland BI and Isolator Decontamination February 2006
Test Handling
• expose BI`s to the inactivation atmosphere• start redosing
Cycle Phase
Vaporized Quantity of H2O2
1 3 42

Volker Sigwarth, Skan AG, Switzerland BI and Isolator Decontamination February 2006
Test Handling
• remove BI`s out of the chamber in constant time intervals
Cycle Phase
Vaporized Quantity of H2O2
1 3 42

Volker Sigwarth, Skan AG, Switzerland BI and Isolator Decontamination February 2006
Results and Interpretation Centre Point
Independent Centre Point Determinations
• full LSKM 10 groups, 10 BI`s per group
• Constant parameters lead to a reproducable decontamination effect
Run No.: D-value [min]1 1.752 1.803 1.744 1.71

Volker Sigwarth, Skan AG, Switzerland BI and Isolator Decontamination February 2006
Results and Interpretation Model
Standardized Pareto Chart for D-value
Standardized effect
A: Quantity
CD
E: H2O2
AB
B: Redose
AA
D: Humidity
C: Temp.
Quantity of H2O2

Volker Sigwarth, Skan AG, Switzerland BI and Isolator Decontamination February 2006
Results and Interpretation Quantity (A)
Main Effects Plot for D-value
Quantity
D-v
alue
5.0 8.0
4.04
1.10

Volker Sigwarth, Skan AG, Switzerland BI and Isolator Decontamination February 2006
Results and Interpretation Quantity (A)
Plot of D-value versus Quantity
0
2
4
6
8
10
4.0 5.0 6.0 7.0 8.0 9.0 10.0Quantity [g/m3]
D-v
alue
[min
]

Volker Sigwarth, Skan AG, Switzerland BI and Isolator Decontamination February 2006
Results and Interpretation Quantity (A)
Main Effects Plot for D-value
Quantity
D-v
alue
5.0 8.0
4.04
1.10
Plot of D-value versus Quantity
0
2
4
6
8
10
4.0 5.0 6.0 7.0 8.0 9.0 10.0Quantity [g/m3]
D-v
alue
[min
]
• Quantity of vaporized H2O2 is the Main Effect in decontamination process
• Nonlinear effect quadratic fit within range of model• Asymptotic character observed with larger range than model

Volker Sigwarth, Skan AG, Switzerland BI and Isolator Decontamination February 2006
Results and Interpretation Quantity (A)
Main Effects Plot for D-value
Quantity
D-v
alue
5.0 8.0
4.04
1.10
Plot of D-value versus Quantity
0
2
4
6
8
10
4.0 5.0 6.0 7.0 8.0 9.0 10.0Quantity [g/m3]
D-v
alue
[min
]
• Starting with constant initial conditionsboost the quantity of vaporized H2O2
leads to a Steady State in decontamination effect

Volker Sigwarth, Skan AG, Switzerland BI and Isolator Decontamination February 2006
Results and Interpretation Redose (B)
Main Effects Plot for D-value
Redose
D-v
alue
2.03
1.11
100.040.0
• The higher the rates of Redose (B) the better the decontamination effect

Volker Sigwarth, Skan AG, Switzerland BI and Isolator Decontamination February 2006
Results and Interpretation Interaction (AB)
Interaction Plot for D-valueD
-val
ue
Redose 40.0
Redose 100.0
Redose 40.0Redose 100.0
Quantity8.05.0

Volker Sigwarth, Skan AG, Switzerland BI and Isolator Decontamination February 2006
Results and Interpretation Interaction (AB)
Interaction Plot for D-value
D-v
alue
Redose 40.0
Redose 100.0
Redose 40.0Redose 100.0
Quantity8.05.0
• Redose (B) loses its influence at higher values of factor Quantity (A)
• Only high rates of Redose (B) improve a low decontamination effect

Volker Sigwarth, Skan AG, Switzerland BI and Isolator Decontamination February 2006
Results and Interpretation Interaction (AB)
Interaction Plot for D-value
D-v
alue
Redose 40.0
Redose 100.0
Redose 40.0Redose 100.0
Quantity8.05.0
• Stability of decontamination effect over time depends on
the Rate of Redose

Volker Sigwarth, Skan AG, Switzerland BI and Isolator Decontamination February 2006
Results and Interpretation Temperature (C)Humidity (D)
Temperature Humidity
Main Effects Plot for D-value
D-v
alue
30.0 40.0 10.0 20.0

Volker Sigwarth, Skan AG, Switzerland BI and Isolator Decontamination February 2006
Results and Interpretation Temperature (C)
HumidityTemperature30.0
Main Effects Plot for D-value
D-v
alue
40.0 10.0 20.0
• The lower the Temperature (C) the better the decontamination effect
• Minor effect: change in D-value of only + 0.5 [min]within a temperature range of 10 [°C]

Volker Sigwarth, Skan AG, Switzerland BI and Isolator Decontamination February 2006
Results and Interpretation Temperature (C)
• Worst Case positions for the decontamination effect are
positions with higher temperature
HumidityTemperature30.0
Main Effects Plot for D-value
D-v
alue
40.0 10.0 20.0

Volker Sigwarth, Skan AG, Switzerland BI and Isolator Decontamination February 2006
Results and Interpretation Humidity (D)
• The higher the Humidity (D) the better the decontamination effect
• Minor effect: change in D-value of only - 0.4 [min]
within a humidity range of 10 [% rH]
HumidityTemperature30.0
Main Effects Plot for D-value
D-v
alue
40.0 10.0 20.0

Volker Sigwarth, Skan AG, Switzerland BI and Isolator Decontamination February 2006
Results and Interpretation Humidity (D)
• Worst Case positions for the decontamination effect are
positions with lower humidity
HumidityTemperature30.0
Main Effects Plot for D-value
D-v
alue
40.0 10.0 20.0

Volker Sigwarth, Skan AG, Switzerland BI and Isolator Decontamination February 2006
Results and Interpretation H2O2 (E)
Main Effects Plot for D-valueD
-val
ue
H2O250.035.0
1.87
1.27

Volker Sigwarth, Skan AG, Switzerland BI and Isolator Decontamination February 2006
Results and Interpretation H2O2 (E)
Main Effects Plot for D-value
D-v
alue
H2O250.035.0
1.87
1.27
• The lower the Concentration of H2O2 Solution (E) the better the decontamination effect
• Minor effect: change in D-value of only + 0.6 [min]within a concentration range of 15 [%]

Volker Sigwarth, Skan AG, Switzerland BI and Isolator Decontamination February 2006
Results and Interpretation H2O2 (E)
Main Effects Plot for D-value
D-v
alue
H2O250.035.0
1.87
1.27
• Vaporization of the same quantity of pure H2O2 produces a better decontamination effectat lower concentrations of the H2O2 solution

Volker Sigwarth, Skan AG, Switzerland BI and Isolator Decontamination February 2006
Results and Interpretation
One main Interrelationship between all Factors ?
A: Quantity Steady State
B: Redose Stability
C: Temp. lower temperature
D: Humidity higher humidity
E: H2O2 lower concentration
higher saturation of gaseous phase
higher saturation of gaseous phase
higher saturation of gaseous phase
higher saturation of gaseous phase
higher saturation of gaseous phase
• Decontamination effect depends on Saturation of gaseous phase
• “Physical Pressure” from gaseous phase to surface

Volker Sigwarth, Skan AG, Switzerland BI and Isolator Decontamination February 2006
Results and Interpretation H2O2 Gas-Concentration
• No useful correlation to the microbial reduction
• Depends highly on the temperature
• Most sensors show the same shape of measurement curve,
but highly differences in values

Volker Sigwarth, Skan AG, Switzerland BI and Isolator Decontamination February 2006
Results and Interpretation H2O2 Gas-Concentration
0
200
400
600
800
1000
1200
1400
0 20 40 60 80 100 120 140 160 180 200
time [min]
[ppm
] ETH
, Drä
ger
3 +
4, A
nser
os
0
500
1000
1500
2000
2500
3000
3500
[ppm
] Drä
ger
1, S
iegr
ist
ppm ETH
Dräger3
Dräger4
Anseros
Dräger1
Siegrist
200 ppm
3000 ppm

Volker Sigwarth, Skan AG, Switzerland BI and Isolator Decontamination February 2006
Results and Interpretation H2O2 Gas-Concentration
• Calibration method !!!
• Not yet a tool for describe microbial reduction
• No useful correlation to the microbial reduction
• Depends highly on the temperature
• Most sensors show the same shape of measurement curve,but highly differences in values

Volker Sigwarth, Skan AG, Switzerland BI and Isolator Decontamination February 2006
Results and Interpretation H2O2 Gas-Concentration
Measurement of process concentration• useful as indicative measurement
Measurement of residual H2O2 concentration
• important for the final release of the decontaminated area

Volker Sigwarth, Skan AG, Switzerland BI and Isolator Decontamination February 2006
Description of Decontamination Effect
The decontamination effect is described by:• the results of the minimized LSKM• the only useful sensor is the BI• the minimized LSKM leads to quantifiable results
• the suitability of the BI has to be tested prior• to “calibrate” the BI as
Sensor for the decontamination effect
Development and Quantification of H2O2 Decontamination Cycles

Volker Sigwarth, Skan AG, Switzerland BI and Isolator Decontamination February 2006
Selection of Biological Indicators
• estimated D-value: = 2.0 [min]• Model Behavior: = OK
Group 01 02 03 04 05 06 07 08 09 10 pos Exposure Time [min]
6.0
9.0
12.0
15.0
18.0
21.0
24.0
27.0
30.0
33.0
+
Result 1 + + + + - - - - - - neg 2 + + + - - - - - - - - 3 + + - - - - - - - -
+ growth- no growth
Test Organism: B. stearothermophilusInitial Population: > 1.0 x 10⁶
Carrier Material: CrNi- StahlPrimary packaging: Tyvek

Volker Sigwarth, Skan AG, Switzerland BI and Isolator Decontamination February 2006
Description of Cycle Physical
Cycle Phase
Vaporized Quantity of H2O2
1 3 42

Volker Sigwarth, Skan AG, Switzerland BI and Isolator Decontamination February 2006
Description of Cycle Physical
Reproducability of Decontamination Effect
Initial conditions in chamber Temperature ± 5 [°C]Humidity ± 5 [%rH]
Cycle Phase
Vaporized Quantity of H2O2
1 3 42

Volker Sigwarth, Skan AG, Switzerland BI and Isolator Decontamination February 2006
Description of Cycle Physical
Achieved Decontamination Effect
Quantity of initial vaporized H2O2 mass control, balance [g]
Cycle Phase
Vaporized Quantity of H2O2
1 3 42

Volker Sigwarth, Skan AG, Switzerland BI and Isolator Decontamination February 2006
Description of Cycle Physical
Stability of Decontamination Effect
Rate of Redose H2O2 mass control, balance [g/t]
Cycle Phase
Vaporized Quantity of H2O2
1 3 42

Volker Sigwarth, Skan AG, Switzerland BI and Isolator Decontamination February 2006
Description of Cycle Physical
Residual Concentration of H2O2
Aeration curve low concentration sensor [ppm/t]
Cycle Phase
Vaporized Quantity of H2O2
1 3 42

Volker Sigwarth, Skan AG, Switzerland BI and Isolator Decontamination February 2006
Description of Cycle Decontamination effect
• Based on a well known and defined BI
• Using the minimized LSKM as a methodical tool
• Proof the decontamination effect over the whole cycle
• Define the required values for cycle parameters

Volker Sigwarth, Skan AG, Switzerland BI and Isolator Decontamination February 2006
Description of Cycle Decontamination effect
Cycle Phase
Decontamination Effect
1 3 42

Volker Sigwarth, Skan AG, Switzerland BI and Isolator Decontamination February 2006
Description of Cycle Decontamination effect
Reproducability of Decontamination Effect
Physically defined by: Temperature ± 5 [°C]Humidity ± 5 [%rH]
Cycle Phase
Decontamination Effect
1 3 42

Volker Sigwarth, Skan AG, Switzerland BI and Isolator Decontamination February 2006
Temperature and Humidity Mapping
0
10
20
30
40
50
60
70
80
90
10010
:30:
1010
:36:
2010
:42:
30
10:4
8:40
10:5
4:50
11:0
1:00
11:0
7:10
11:1
3:20
11:1
9:30
11:2
5:40
11:3
1:50
11:3
8:00
11:4
4:10
11:5
0:20
11:5
6:30
12:0
2:40
12:0
8:50
12:1
5:00
12:2
1:10
12:2
7:20
12:3
3:30
12:3
9:40
12:4
5:50
12:5
2:00
12:5
8:10
13:0
4:20
13:1
0:30
13:1
6:40
13:2
2:50
13:2
9:00
13:3
5:10
13:4
1:20
13:4
7:30
13:5
3:40
13:5
9:50
14:0
6:00
14:1
2:10
14:1
8:20
14:2
4:30
14:3
0:40
Time
%H
r / °C
%Hr
°C

Volker Sigwarth, Skan AG, Switzerland BI and Isolator Decontamination February 2006
Description of Cycle Decontamination effect
Cycle Phase
Decontamination Effect
1 3 42
Achieved Decontamination Effect
achieved D-value defined initial Quantity of H2O2 [g]
D-value

Volker Sigwarth, Skan AG, Switzerland BI and Isolator Decontamination February 2006
Achieved Decontamination effect
Achieved decontamination effectQuantity 5 [g/m3]
+ growth- no growth
exposure 01 02 03 04 05 06 07 08 09 10 posexposuretime [min] 6.0 9.0 12.0 15.0 18.0 21.0 24.0 27.0 30.0 33.0 +result 1 + + + + + + + + - - neg 2 + + + + + + - - - - - 3 + + + + - - - - - -

Volker Sigwarth, Skan AG, Switzerland BI and Isolator Decontamination February 2006
Achieved Decontamination effect
Achieved decontamination effectQuantity 7.5 [g/m3]
+ growth- no growth
exposure 01 02 03 04 05 06 07 08 09 10 posexposuretime [min] 6.0 9.0 12.0 15.0 18.0 21.0 24.0 27.0 30.0 33.0 +result 1 + + + - - - - - - - neg 2 + + - - - - - - - - - 3 + - - - - - - - - -

Volker Sigwarth, Skan AG, Switzerland BI and Isolator Decontamination February 2006
Achieved Decontamination effect
Plot of D-value versus Quantity
0
2
4
6
8
10
4.0 5.0 6.0 7.0 8.0 9.0 10.0Quantity [g/m3]
D-v
alue
[min
]

Volker Sigwarth, Skan AG, Switzerland BI and Isolator Decontamination February 2006
Description of Cycle Decontamination effect
Cycle Phase
Decontamination Effect
1 3 42
Stability of Decontamination Effect
Stability of D-values defined Rate of Redose [g/t]
D-value D-value

Volker Sigwarth, Skan AG, Switzerland BI and Isolator Decontamination February 2006
Stability of Decontamination effect
Rate of Redose 25 [%A/h]+ growth- no growthLSKM 1, exposition 5 [min] after conditioning
LSKM 2, exposition 30 [min] after conditioning
exposure 01 02 03 04 05 06 07 08 09 10 posexposuretime [min] 7.5 10.0 12.5 15.0 17.5 +result 1 + - - - - neg 2 + - - - - - 3 - - - - -
exposure 01 02 03 04 05 06 07 08 09 10 posexposuretime [min] 7.5 10.0 12.5 15.0 17.5 +result 1 + + + + + neg 2 + + + + + - 3 + + + + +

Volker Sigwarth, Skan AG, Switzerland BI and Isolator Decontamination February 2006
Stability of Decontamination effect
Rate of Redose 100 [%A/h]+ growth- no growthLSKM 1, exposition 5 [min] after conditioning
LSKM 2, exposition 30 [min] after conditioningexposure 01 02 03 04 05 06 07 08 09 10 posexposuretime [min] 7.5 10.0 12.5 15.0 17.5 +result 1 + - - - - neg 2 + - - - - - 3 - - - - -
exposure 01 02 03 04 05 06 07 08 09 10 posexposuretime [min] 7.5 10.0 12.5 15.0 17.5 +result 1 + - - - - neg 2 + - - - - - 3 + - - - -

Volker Sigwarth, Skan AG, Switzerland BI and Isolator Decontamination February 2006
Description of Cycle Worst Case Positions
• Air Flow and Distribution Smoke Tests
• Temperature, Humidity Distribution Deco-Process
• Chemo Indicator Mapping qualitative
• deeply consider the Process Risk Analysis
Definition of Worst Case Positions, (BI- Positions)
Extreme Point of Application no Assumptions

Volker Sigwarth, Skan AG, Switzerland BI and Isolator Decontamination February 2006
Description of Cycle Decontamination effect
Cycle Phase
Decontamination Effect
1 3 42
Duration of Decontamination Phase
Worst Case Study defined D-value Worst CaseDuration of Decontamination [t]
Worst Case Study

Volker Sigwarth, Skan AG, Switzerland BI and Isolator Decontamination February 2006
Description of Cycle Worst Case Positions
• 3x BI`s per defined WC Position fractional results possible
• Deco time 10 x D-value best place shortest cycle to total kill
• Use resulting BI pattern to estimate kill - - - 10log, - - + 6log, + + + ??
• Calculate D-value worst case Deco time / achieved reduction
• longer Deco time if required 10 x D-value worst case
Assessment of Worst Case Positions

Volker Sigwarth, Skan AG, Switzerland BI and Isolator Decontamination February 2006
Description of Cycle Decontamination effect
Cycle Phase
Decontamination Effect
1 3 42
Required log Reduction
observed D-values defined achieved log Reduction
D-value

Volker Sigwarth, Skan AG, Switzerland BI and Isolator Decontamination February 2006
H2O2 Decontamination Process
• Reproducable and stable process if well developed
• Development contents two systems 1. Decontamination System2. Microbiological System
• Recognize the suitability of the microbiological system before hand
• Develop the decontamination cycle using:the “calibrated BI andthe whole physical range no assumption
• Transparent and systematic process development and comprehension
• Strong evidence for the following step Performance Qualification

Volker Sigwarth, Skan AG, Switzerland BI and Isolator Decontamination February 2006
Development and Quantification of H2O2 Decontamination Cycles
“Development and Quantification of H2O2 Decontamination Cycles”
Volker Sigwarth, Dr. Claude Moirandat, Skan AGPDA Journal, Vol. 54, July / August 2000
• Validation Article PDA Journal

Volker Sigwarth, Skan AG, Switzerland BI and Isolator Decontamination February 2006
Reference Studies for H2O2 Decontamination
• Suitability study for all commercially available BI`s
• D-value studies for a wide range of spores and vegetative germs
• Customized determination of virus decontamination
• Special studies for devices and equipment
• Effect of Carrier Materials on the Resistances of BI`s
• Co-operation with Novartis, Stein

Volker Sigwarth, Skan AG, Switzerland BI and Isolator Decontamination February 2006
Material Study
• Materials used in isolator as construction materialsas disposables in routine work
• Inoculate with min 1.0x10⁶ spores of B. stearothermophilus
• Determination of D- value and Reactive Pattern
• Compare the results with commercially available BI
• Transfer results to different Production Isolator Systems
• Conclusion “HOW to handle the Material Question”

Volker Sigwarth, Skan AG, Switzerland BI and Isolator Decontamination February 2006
Carrier Material of BI D-value Estimations [mins] Model BehaviourGlass 1.0 / 1.1 givenCrNi steel 1.4435, polished 1.3 / 0.9 givenCrNi steel 1.4301, unpolished 1.0 / 1.2 givenCrNi steel 1.4435, unpolished 1.0 / 1.4 givenCrNi steel 1.4301, polished 1.3 / 1.4 givenPVC, hard 1.0 / 1.8 givenPTFE 1.3 / 1.6 givenPE, UHMW 1.6 / 1.6 givenPP 1.3 / 2.0 givenPVC 2.0 / 1.6 givenLaminated foil 1, outside 1.6 / 2.5 givenPC 2.2 / 2.3 givenBI, commercially available 2.6 / 2.3 givenTyvek 2.0 / 3.1 givenLaminated foil 2, outside 2.5 / 3.2 givenButyl chaouchouc 2.9 / 3.1 givenHypalon 3.0 / 4.1 givenHEPA-filter pad 3.6 / 3.6 givenPVC, soft 4.3 / 4.6 givenPOM 4.6 / 4.4 givenAluminium, anodized, commercially available > 3.1 / 7.9 not givenAluminium, anodized, air sampler >8.3 / 10.1 givenAluminium, anodized, filling line >17.1 / > 33.7 not applicable
Materials Study Results

Volker Sigwarth, Skan AG, Switzerland BI and Isolator Decontamination February 2006
Box and Whisker Plot
D-value [min]
Significantly higher D-value for the various aluminium samples
Materials Study Summary of Result

Volker Sigwarth, Skan AG, Switzerland BI and Isolator Decontamination February 2006
• Extremely porous surface structure
• Suspension was absorbed into surface
• H2O2 decontamination is not able to penetrate into a surface
No or only a bad inactivation effect
Not suitable for H2O2 decontamination
Materials Study Interpretation Aluminium

Volker Sigwarth, Skan AG, Switzerland BI and Isolator Decontamination February 2006
Carrier Material Aluminium anodized

Volker Sigwarth, Skan AG, Switzerland BI and Isolator Decontamination February 2006
Carrier Material Aluminium anodized

Volker Sigwarth, Skan AG, Switzerland BI and Isolator Decontamination February 2006
0 0.5 1 1.5 2 2.5 3 3.5 4 4.5 5
Glass
Stainless steel 1.4435, polished
Stainless steel 1.4301, not polished
Stainless steel 1.4435, not polished
Stainless steel 1.4301, polished
Polyvinylchlorid, PVC hard
Polytetrafluorehylen PTFE
Polyethylen, PE UHMW
Polypropylen, PP
Polyvinylchlorid, PVC
Laminated foil 1
Polycarbonate, PC
Tyvek
Laminated foil 2
Reference BI
Butyl caoutchouc
Hypalon
HEPA-filter pad
Polyvinylchlorid, PVC soft
Polyoxymethylen, POM
Mat
eria
l
D-value [min]
D-value determination
D-value estimation 2
D-value estimation 1
Worst Case 4.33
Best Case 1.45
Reference 2.28
Materials Study Results

Volker Sigwarth, Skan AG, Switzerland BI and Isolator Decontamination February 2006
• 1 x Reference Isolator 1,4 m3
• 2 x Sterility Test Isolator 2,2 m3
• 5 x Filling Isolator 9,0 m3
• 2 x Material Pass Through 15,0 m3
Materials Study Transferability
• IQ / OQ finished
• Cycle development based on commercial BI`s finished
• Initial condition and cycle parameter defined

Volker Sigwarth, Skan AG, Switzerland BI and Isolator Decontamination February 2006
0 0.5 1 1.5 2 2.5 3 3.5 4 4.5 5
Glass
Stainless steel 1.4435, polished
Stainless steel 1.4301, not polished
Stainless steel 1.4435, not polished
Stainless steel 1.4301, polished
Polyvinylchlorid, PVC hard
Polytetrafluorehylen PTFE
Polyethylen, PE UHMW
Polypropylen, PP
Polyvinylchlorid, PVC
Laminated foil 1
Polycarbonate, PC
Tyvek
Laminated foil 2
Reference BI
Butyl caoutchouc
Hypalon
HEPA-filter pad
Polyvinylchlorid, PVC soft
Polyoxymethylen, POM
Mat
eria
l
D-value [min]
D-value determination
D-value estimation 2
D-value estimation 1
Worst Case 4.33
Best Case 1.45
Reference 2.28
Materials Study Results

Volker Sigwarth, Skan AG, Switzerland BI and Isolator Decontamination February 2006
D-value [mins]Reference Isolator
D-value [min]Serility Test Isolator
D-value [min]H2O2 Material Pass Through
D-value [min]Filling Isolator
B. stearothermophiluson Glass 1.45 ± 0.07 1.41 ± 0.04 0.96 ± 0.05 1.18 ± 0.20
Biological IndicatorReference 2.28 ± 0.06 2.22 ± 0.06 1.62 ± 0.08 1.72 ±0.07
B. stearothermophiluson POM 4.33 ± 0.20 4.00 ± 0.30 3.38 ± 0.16 3.41 ± 0.23
• 1 x Reference Isolator 1,4 m3
• 2 x Sterility Test Isolator 2,2 m3
• 5 x Filling Isolator 9,0 m3
• 2 x Material Pass Through 15,0 m3
Materials Study Transferability

Volker Sigwarth, Skan AG, Switzerland BI and Isolator Decontamination February 2006
-6.0
-5.0
-4.0
-3.0
-2.0
-1.0
0.0
1.0
2.0
3.0
4.0
5.0
6.0
0 2 4 6 8 10 12 14 16 18 20 22 24 26 28time [min]
Initial Population BI
Population [log-scale]
Quali
fied
log
Redu
ction
for B
I D-value Reference BI
Qualified Cycle Time
Bio load worst case material; POM D-value Worst case
Materials Study Implementation

Volker Sigwarth, Skan AG, Switzerland BI and Isolator Decontamination February 2006
• Reproducible different resistances on different carrier materials
• Some Materials seems to bee not suitable for H2O2 decontamination
borders of the process
• Resistances were transferable to different systems
• Cycle development and qualification based on commercial BI`s
• Knowledge of all inactivation factors
Materials Study Summary

Volker Sigwarth, Skan AG, Switzerland BI and Isolator Decontamination February 2006
Effect of Carrier Materials on the Resistance of B.stearothermophilus to gaseous H2O2
“Effect of Carrier Materials on the Resistance of Spores of Bacillus Stearothermophilus to gaseous Hydrogen Peroxide”
Volker Sigwarth, Skan AGAlexandra Stärk, Novartis Pharma AG
PDA Journal, Vol. 57, No.1 January / February 2003
• Research Article PDA Journal
• As Reference Study for Isolator Validation

Volker Sigwarth, Skan AG, Switzerland BI and Isolator Decontamination February 2006
Effect of Carrier Materials on the Resistance of B.stearothermophilus to gaseous H2O2
“The carrier type e.g. plastic, paper, metal or other, of the biologicalindicator organism should be relevant to the materials being gassed or shown to be irrelevant”
• Implementation in PIC/S Recommendation
“If studies have been carried to show that lethality on carrier type a is similarto materials c, d, e, etc. with a similar sporicidal process, this would meanthat in house studies need not be carried out.”
“The data would need to be from a reputable source”

Volker Sigwarth, Skan AG, Switzerland BI and Isolator Decontamination February 2006
Reproducibly “different resistances of B. stearothermophilus to a H2O2 decontamination on different carrier materials”.“Because of their surface structure and properties, certain materials seems to be not suitable for the H2O2 decontamination ...”But... resistances were found to be essentially “transferable", so development work may greatly reduce the need to address extensively during decontamination cycle validation.Development of decontamination cycle parameters should incorporate knowledge of material-effects. Commercial BI used as control for this study.Authors conclude that no single factor on its own is normally responsible for material effect
• FDA Comment, R. Friedman, ISPE Washington Conference 2003
Materials Study FDA; Comment

Volker Sigwarth, Skan AG, Switzerland BI and Isolator Decontamination February 2006
Development of alternative Sterilization Methods
Title: “Contamination Control in Parenteral Processing”Published by: Marcel Dekker Inc., USA Edited by: Kevin Williams, Eli Lilly & Co., USA Author: Volker Sigwarth, Skan AG, Switzerlandpublished: Middle of 2004
• Book Chapter “Process Development of alternative Sterilization Methods”

Volker Sigwarth, Skan AG, Switzerland BI and Isolator Decontamination February 2006
Decontamination of Isolator Systems
• “total kill approach” one surviving BI stops production
• Bioindicators are hand made reliable resistance of single BI
• use enough Bioindicators You will find a survivor
Risks in working with Biological Indicators
How to handle surviving Bioindicators during qualification work ?

Volker Sigwarth, Skan AG, Switzerland BI and Isolator Decontamination February 2006
Decontamination of Isolator Systems
• “total kill approach”
• Where come the requirement “total kill” from ?
• Steam Sterilization versus Isolator Decontamination
Risks in working with Biological Indicators
Regulatory Requirements and Possibilities

Volker Sigwarth, Skan AG, Switzerland BI and Isolator Decontamination February 2006
Decontamination of Isolator Systems
“Normally a four- to six-log reduction can be justified depending on the application. The specific spore titer used and the selection of BI placement site should be justified. For example, demonstration of a four-log reduction should be sufficient for controlled , very low bioburden material introduced into a transfer isolator including wrapped sterile supplies that are briefly exposed to the surrounding environment”
Regulatory Requirements; FDA Aseptic Guideline

Volker Sigwarth, Skan AG, Switzerland BI and Isolator Decontamination February 2006
Microbiological System
-6.0
-5.0
-4.0
-3.0
-2.0
-1.0
0.0
1.0
2.0
3.0
4.0
5.0
6.0
0 1 2 3 4 5 6 7 8 9 10 11 12time [min]
Log Population
Model of microbial Reduction
survival fractional field kill
-1D- value
Model of Microbial Reduction
• Initial Population [log-scale]
• Inactivation Time [min]
• Survival Curve
• D-value [min]
• Survival - Kill Window [min]

Volker Sigwarth, Skan AG, Switzerland BI and Isolator Decontamination February 2006
Microbiological SystemProbability Distribution, positive / negative
0
10
20
30
40
50
60
70
80
90
100
2.0 1.0 0.0 -1.0 -2.0 -3.0 -4.0log m
%P(m)
Probability of negative
Probability of positive
P(m) = e- m
63 %
37 %

Volker Sigwarth, Skan AG, Switzerland BI and Isolator Decontamination February 2006
Decontamination of Isolator Systems
Regulatory Requirements; USP 28, <1208>

Volker Sigwarth, Skan AG, Switzerland BI and Isolator Decontamination February 2006
Decontamination of Isolator Systems
• “fractional kill approach”
• relation between positive and negative Bioindicator results
• proof the required log reduction
Possibilities in working with Biological Indicators
Successfully applied for Filling and Sterility Test Isolators

Volker Sigwarth, Skan AG, Switzerland BI and Isolator Decontamination February 2006
Decontamination of Isolator Systems
• Basics of microbial inactivation has to be deeply understood
• Argumentations during audits and with authorities often much harder
• Steam Sterilization versus Isolator Decontamination
• Root cause of positive result ? BI, Cycle Parameter, Isolator System
Problems in using “fractional kill approach”
Will be the future approach for isolator cycle qualification

Volker Sigwarth, Skan AG, Switzerland BI and Isolator Decontamination February 2006
Decontamination of Isolator Systems
• Initial control of Bioindicators BI Quality Control
• D-value based Cycle Development quantifiable for each phase
• one unexpected positive BI result at one position
• followed by one more run with multiple BI samples at this position
Possibilities in working with Biological Indicators
Successfully applied “Back Up Tool” for Cycle Qualification

Volker Sigwarth, Skan AG, Switzerland BI and Isolator Decontamination February 2006
Biological Indicators and H2O2 Decontamination of Isolator Systems
Volker Sigwarth Skan AG
Switzerland
Process Development