Embed Size (px)
Citation preview
Biological Gene and Protein Networks
Xin Zhang
Department of Computer Science and Engineering
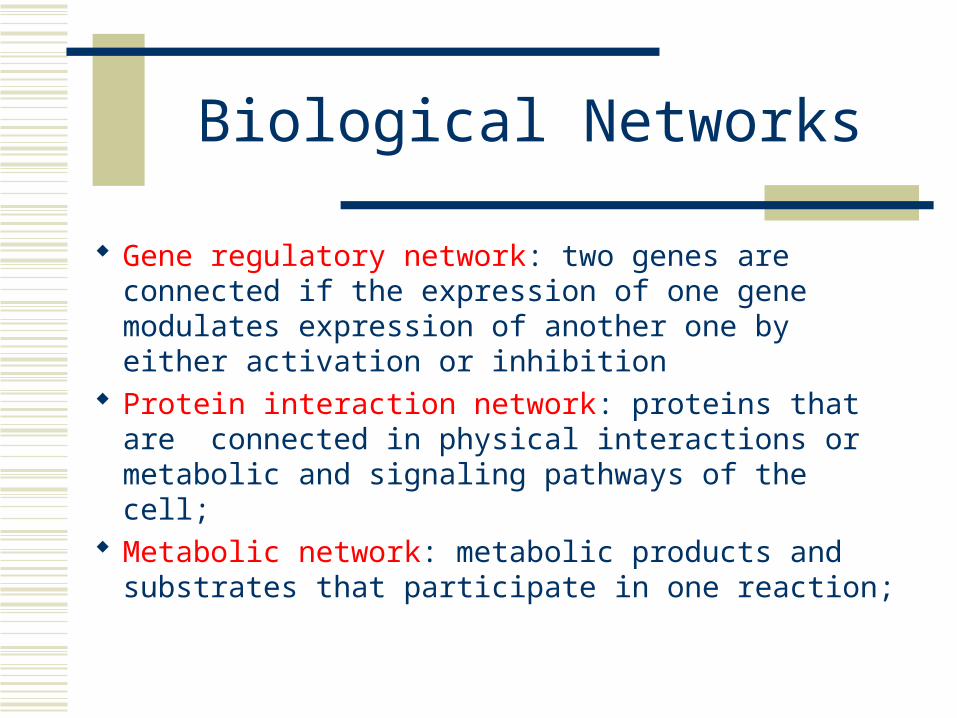
Biological Networks
Gene regulatory network: two genes are connected if the expression of one gene modulates expression of another one by either activation or inhibition
Protein interaction network: proteins that are connected in physical interactions or metabolic and signaling pathways of the cell;
Metabolic network: metabolic products and substrates that participate in one reaction;
Background Knowledge
Cell reproduction, metabolism, and responses to the environment are all controlled by proteins;
Each gene is responsible for constructing a single protein;
Some genes manufacture proteins which control the rate at which other genes manufacture proteins (either promoting or suppressing);
Hence some genes regulate other genes (via the proteins they create) ;

What is Gene Regulatory Network?
Gene regulatory networks (GRNs) are the on-off switches of a cell operating at the gene level.
Two genes are connected if the expression of one gene modulates expression of another one by either activation or inhibition
An example.
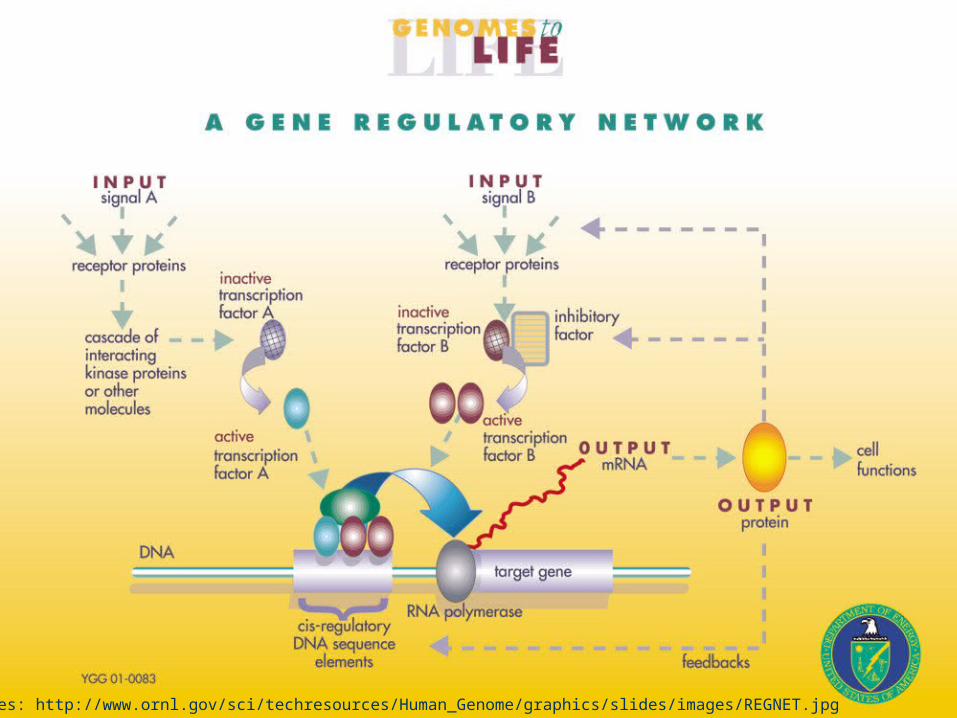
Sources: http://www.ornl.gov/sci/techresources/Human_Genome/graphics/slides/images/REGNET.jpg
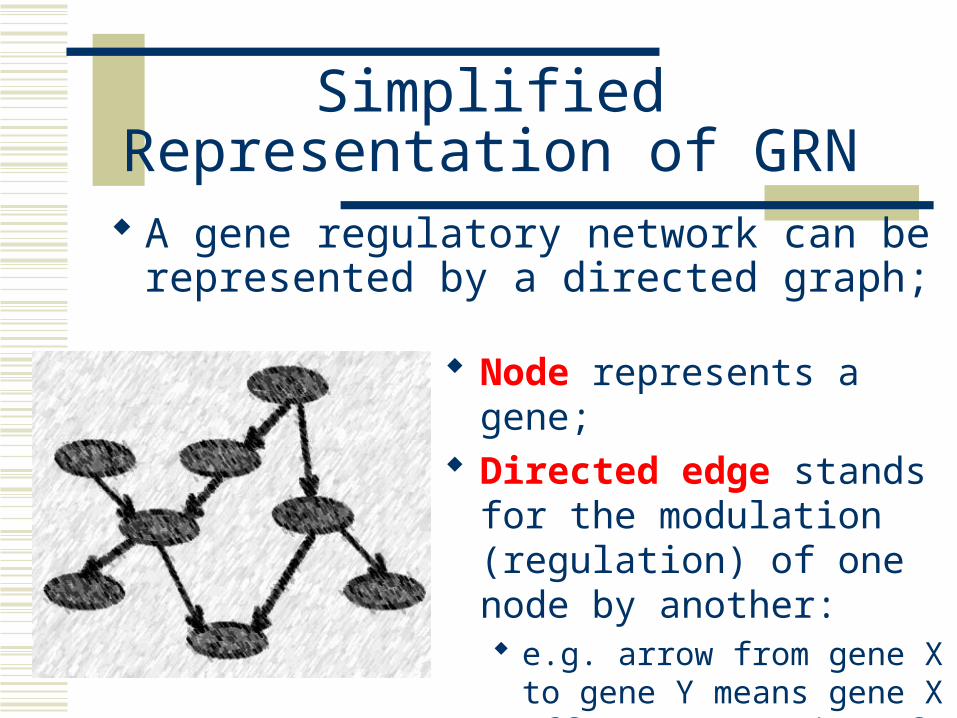
Simplified Representation of GRN
A gene regulatory network can be represented by a directed graph;
Node represents a gene; Directed edge stands for the
modulation (regulation) of one node by another: e.g. arrow from gene X to gene
Y means gene X affects expression of gene Y
Why Study GRN?
Genes are not independent; They regulate each other and act collectively; This collective behavior can be observed using
microarray; Some genes control the response of the cell to
changes in the environment by regulating other genes;
Potential discovery of triggering mechanism and treatments for disease;
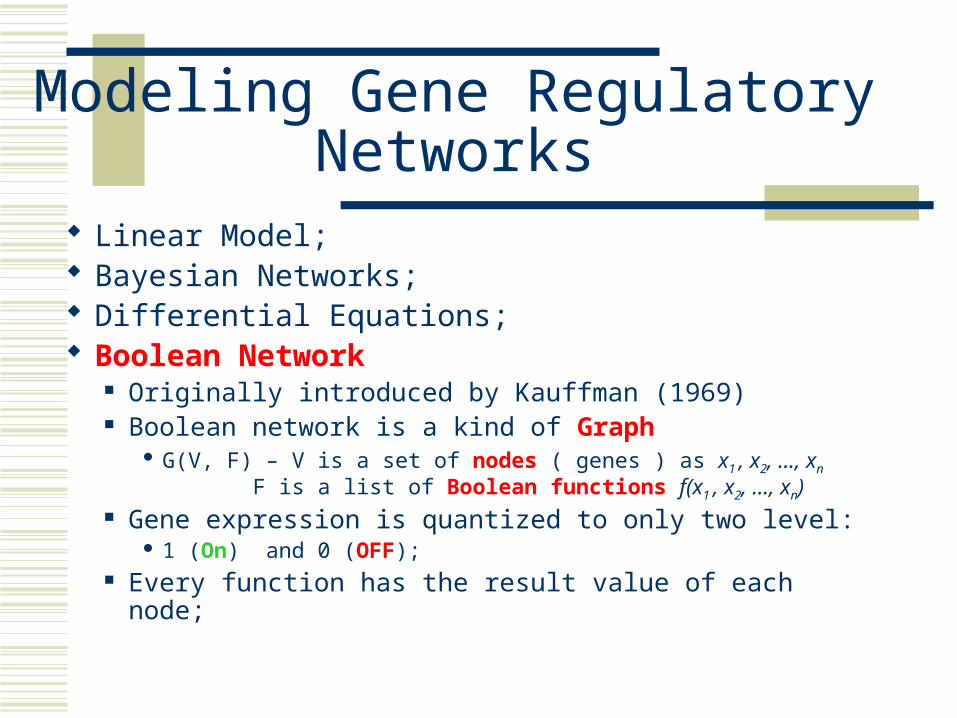
Modeling Gene Regulatory Networks
Linear Model; Bayesian Networks; Differential Equations; Boolean Network
Originally introduced by Kauffman (1969) Boolean network is a kind of Graph
G(V, F) – V is a set of nodes ( genes ) as x1 , x2, …, xn F is a list of Boolean functions f(x1 , x2, …, xn)
Gene expression is quantized to only two level: 1 (On) and 0 (OFF);
Every function has the result value of each node;
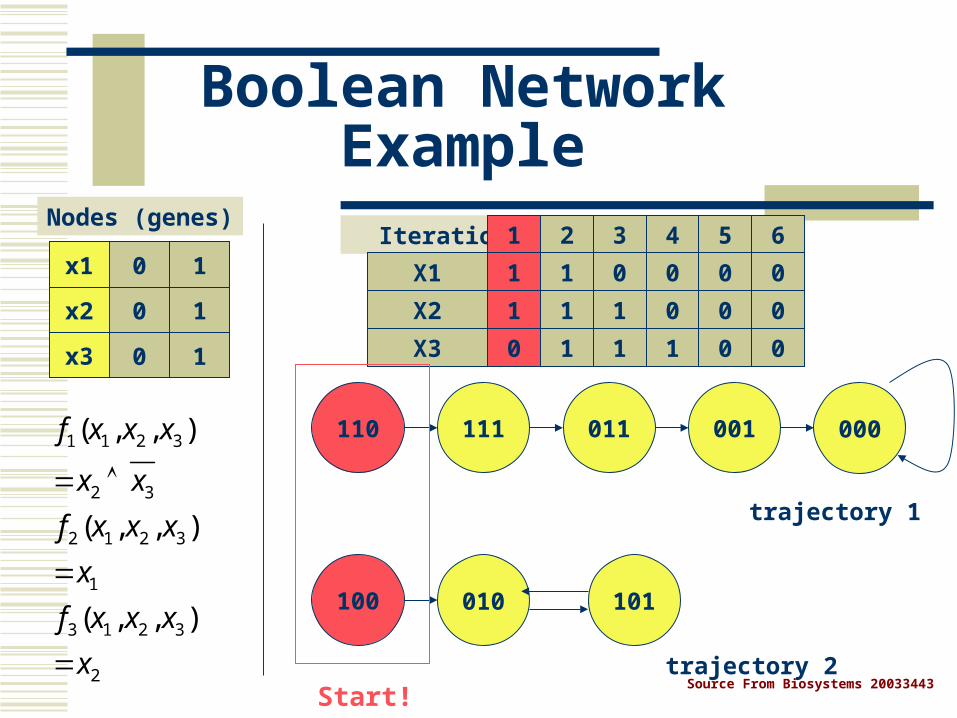
Boolean Network Example
x1
x2
x3
0 1
10
10
Nodes (genes) Iteration 1 2 3 4 5 6
1 1 0 0 0 0
1 1 1 0 0 0
0 1 1 1 0 0
X1
X2
X3
111 011110 000001
010100 101
Start!
trajectory 1
trajectory 2
1 1 2 3
2 3
2 1 2 3
1
3 1 2 3
2
( , , )
( , , )
( , , )
f x x x
x x
f x x x
x
f x x x
x
Source From Biosystems 20033443
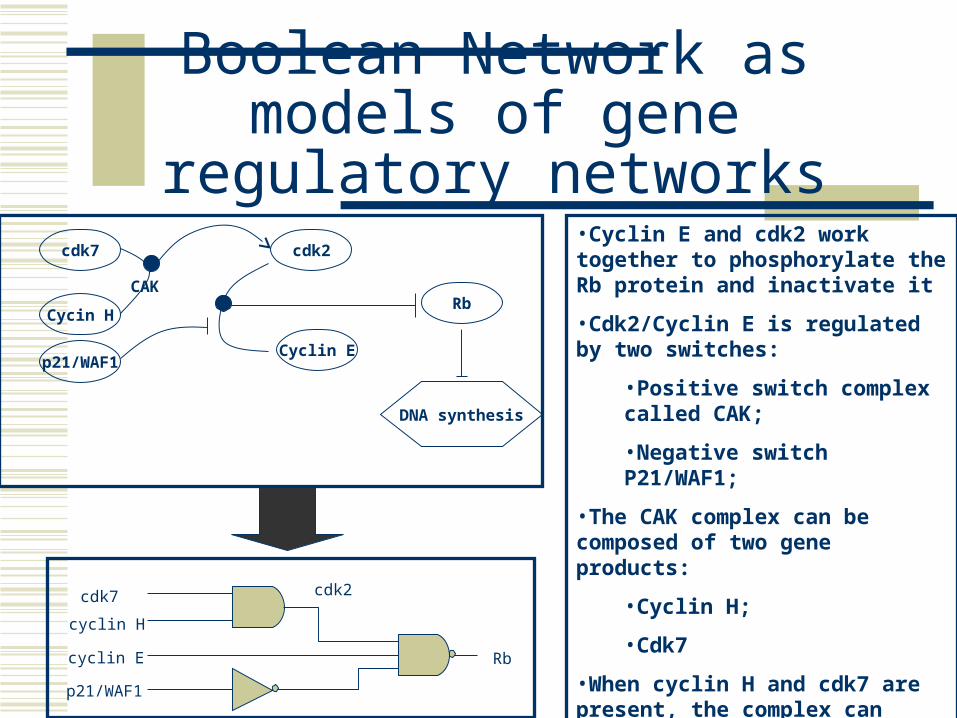
Boolean Network as models of gene regulatory networks
cdk7
Cycin H
p21/WAF1Cyclin E
cdk2
Rb
DNA synthesis
CAK
Rb
cdk2cdk7
cyclin H
cyclin E
p21/WAF1
•Cyclin E and cdk2 work together to phosphorylate the Rb protein and inactivate it
•Cdk2/Cyclin E is regulated by two switches:
•Positive switch complex called CAK;
•Negative switch P21/WAF1;
•The CAK complex can be composed of two gene products:
•Cyclin H;
•Cdk7
•When cyclin H and cdk7 are present, the complex can activate cdk2/cyclin E.
Learning Causal Relationships
High-throughput genetic technologies empowers to study how genes interact with each other;
Learning gene causal relationship is important: Turning on a gene can be achieved directly or through
other genes, which have causal relationship with it.
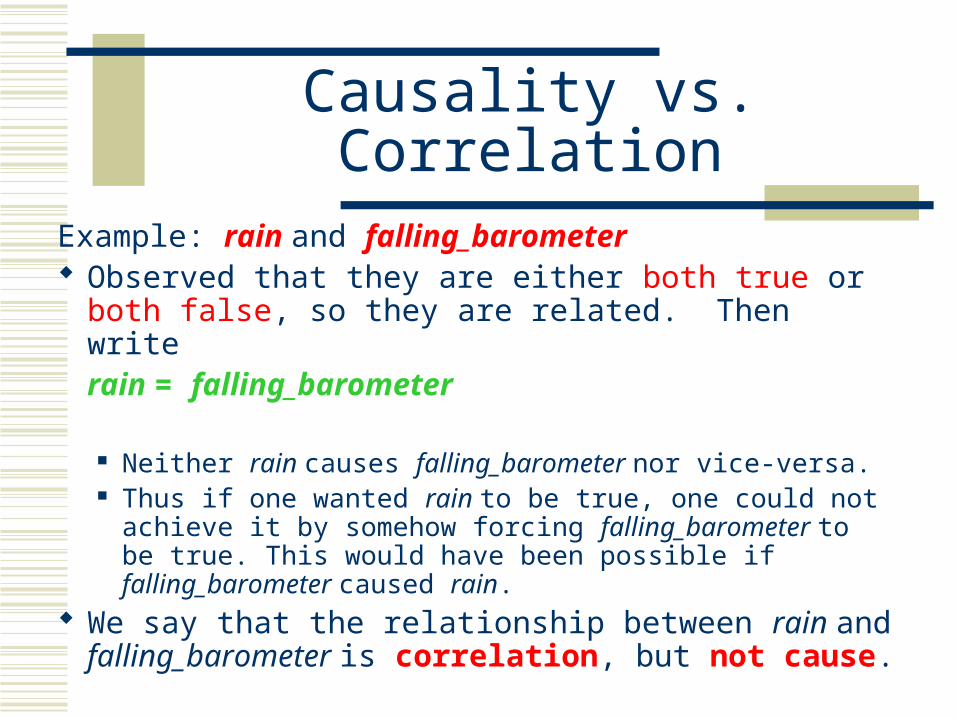
Causality vs. Correlation
Example: rain and falling_barometer Observed that they are either both true or both false, so
they are related. Then write rain = falling_barometer
Neither rain causes falling_barometer nor vice-versa. Thus if one wanted rain to be true, one could not achieve it
by somehow forcing falling_barometer to be true. This would have been possible if falling_barometer caused rain.
We say that the relationship between rain and falling_barometer is correlation, but not cause.
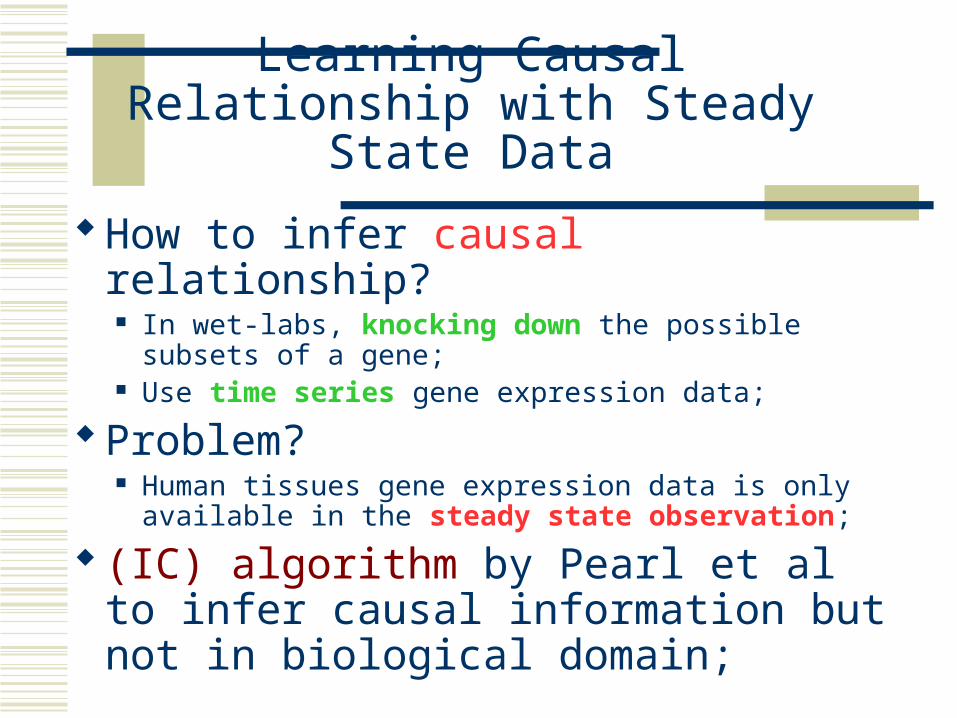
Learning Causal Relationship with Steady State Data
How to infer causal relationship? In wet-labs, knocking down the possible subsets of a
gene; Use time series gene expression data;
Problem? Human tissues gene expression data is only available in
the steady state observation;
(IC) algorithm by Pearl et al to infer causal information but not in biological domain;
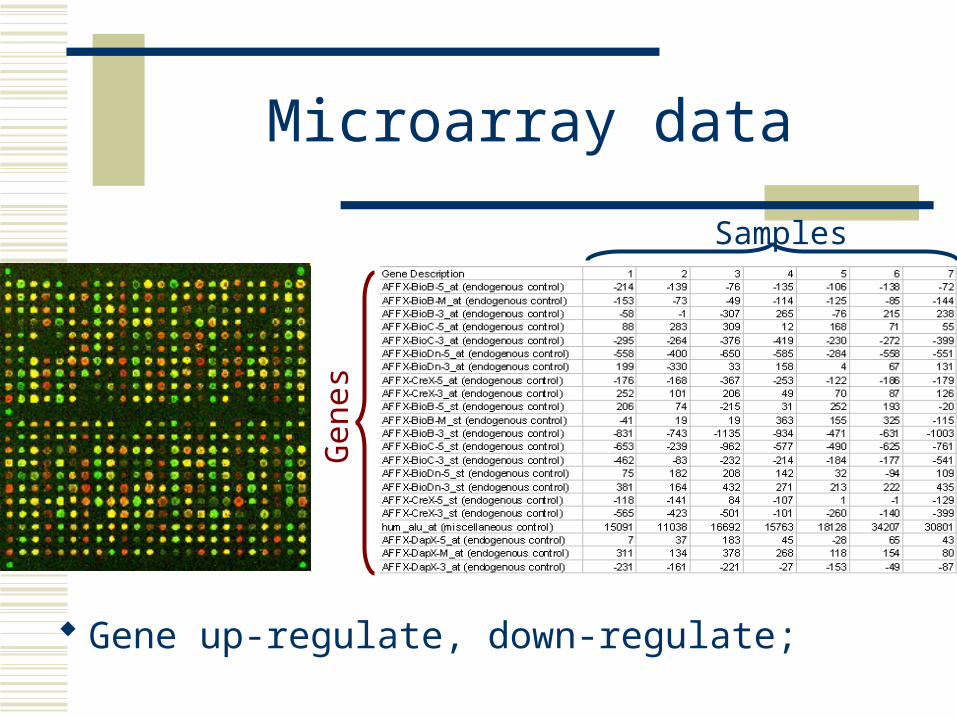
Microarray data
Gene up-regulate, down-regulate;
Gen
es
Samples
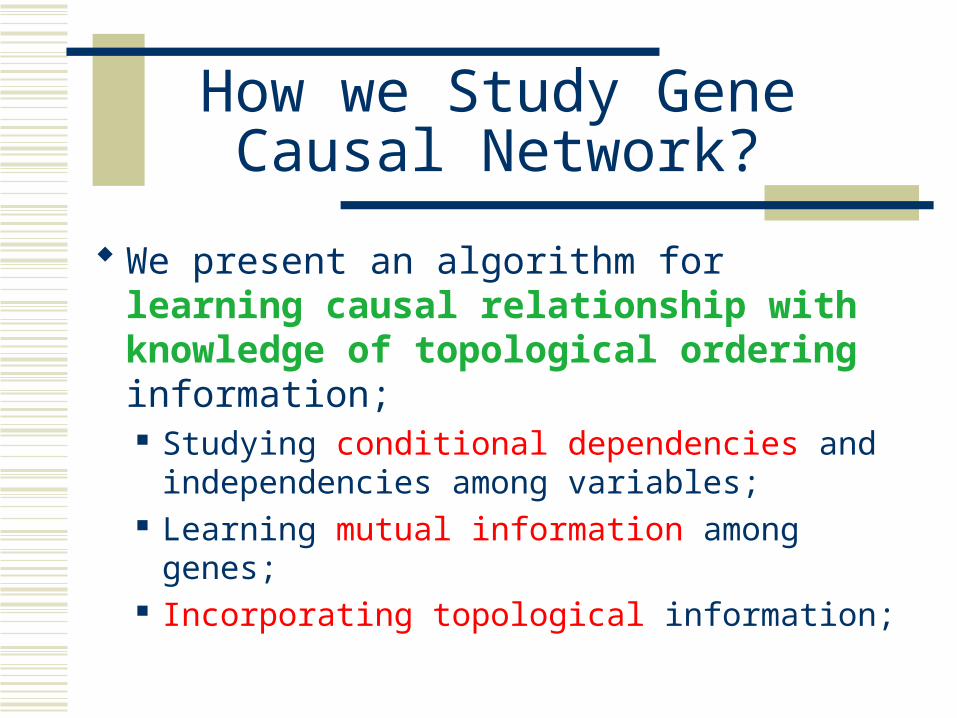
We present an algorithm for learning causal relationship with knowledge of topological ordering information; Studying conditional dependencies and
independencies among variables; Learning mutual information among genes; Incorporating topological information;
How we Study Gene Causal Network?
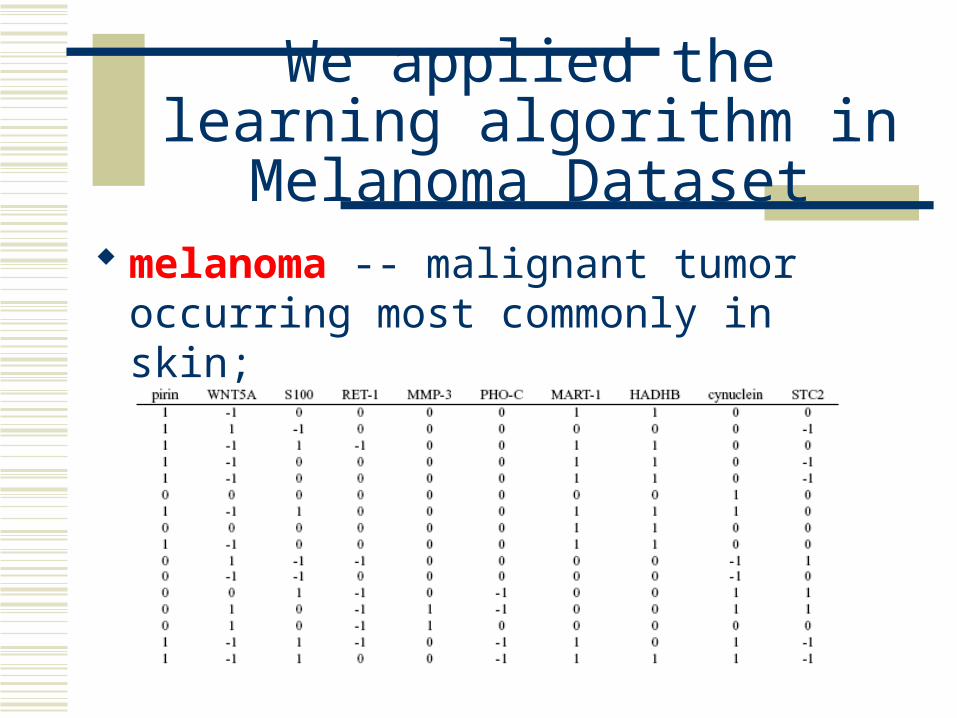
We applied the learning algorithm in Melanoma Dataset
melanoma -- malignant tumor occurring most commonly in skin;
Knowledge we have
The 10 genes involved in this study chosen from 587 genes from the melanoma data;
Previous studies show that WNT5A has been identified as a gene of interest involved in melanoma;
Controlling the influence of WNT5A in the regulation can reduce the chance of melanoma metastasizing;
Partial biological prior knowledge:MMP3 is expected to be the end of the
pathway
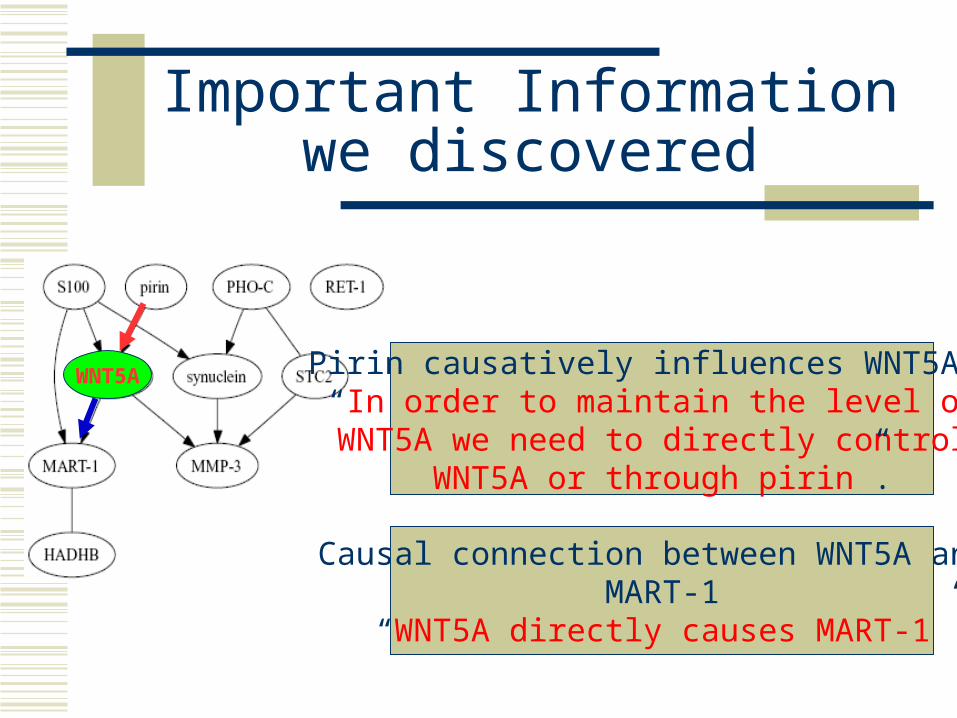
Important Information we discovered
WNT5A Pirin causatively influences WNT5A – “In order to maintain the level of
WNT5A we need to directly control WNT5A or through pirin”.
Causal connection between WNT5A and MART-1
“WNT5A directly causes MART-1”
Future Work and Possible Project Topic
Build a GUI simulation system for studying gene causal networks;
Learning from multiple data sources; Learning causality in Motifs; Learning GRN with feedback loops;
Build a GUI Simulation System
We have done the simulation study and real data application;
Need to develop a GUI interface for systematically studying causal network;
Learning from multiple data sources
We have gene expression data and topological ordering information;
Incorporating some other data sources as prior knowledge for the learning; Transcription factor binding location data; …
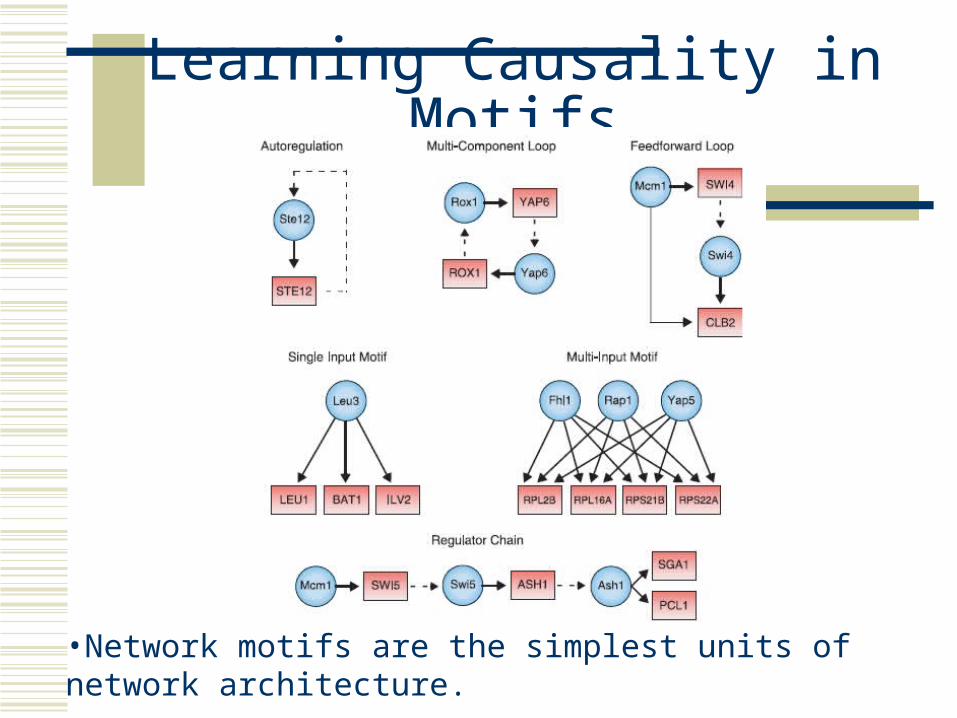
Learning Causality in Motifs
•Network motifs are the simplest units of network architecture.
•They be used to assemble a transcriptional regulatory network.
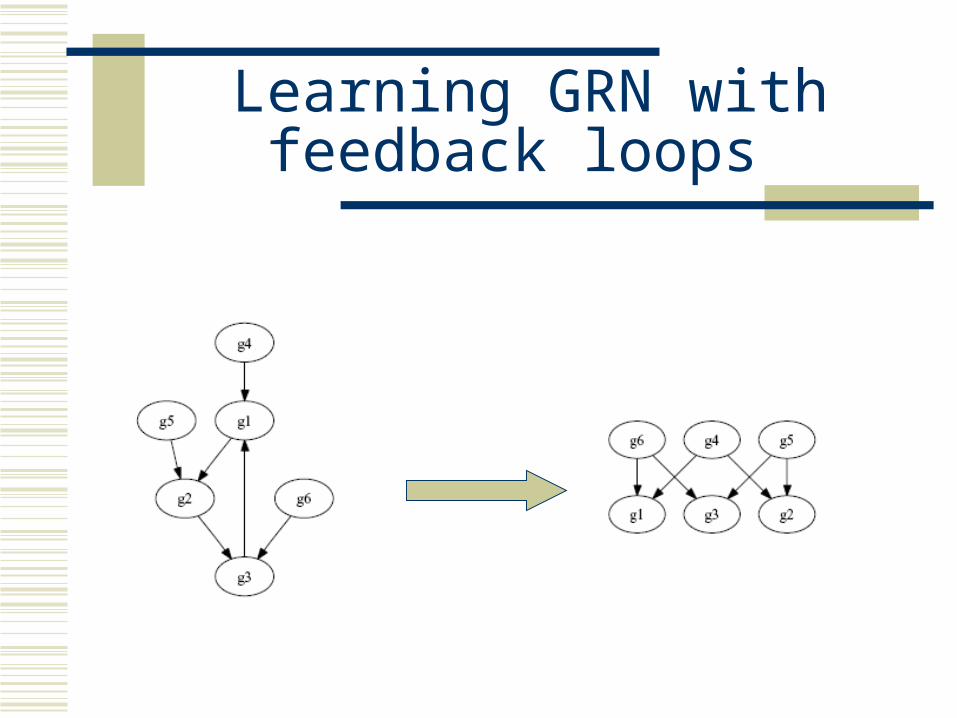
Learning GRN with feedback loops
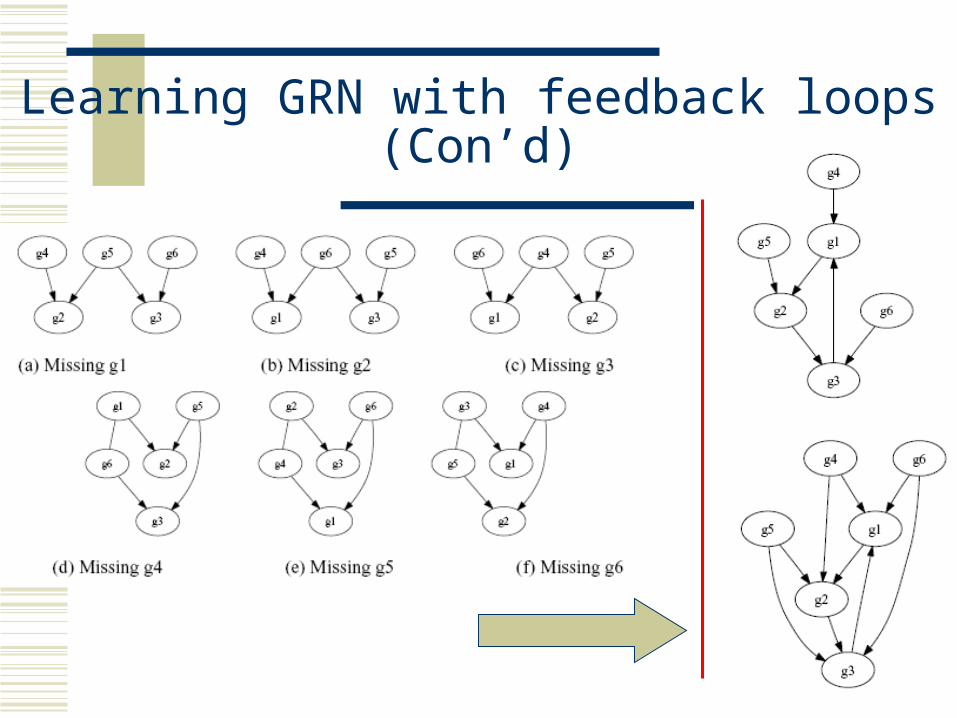
Learning GRN with feedback loops (Con’d)
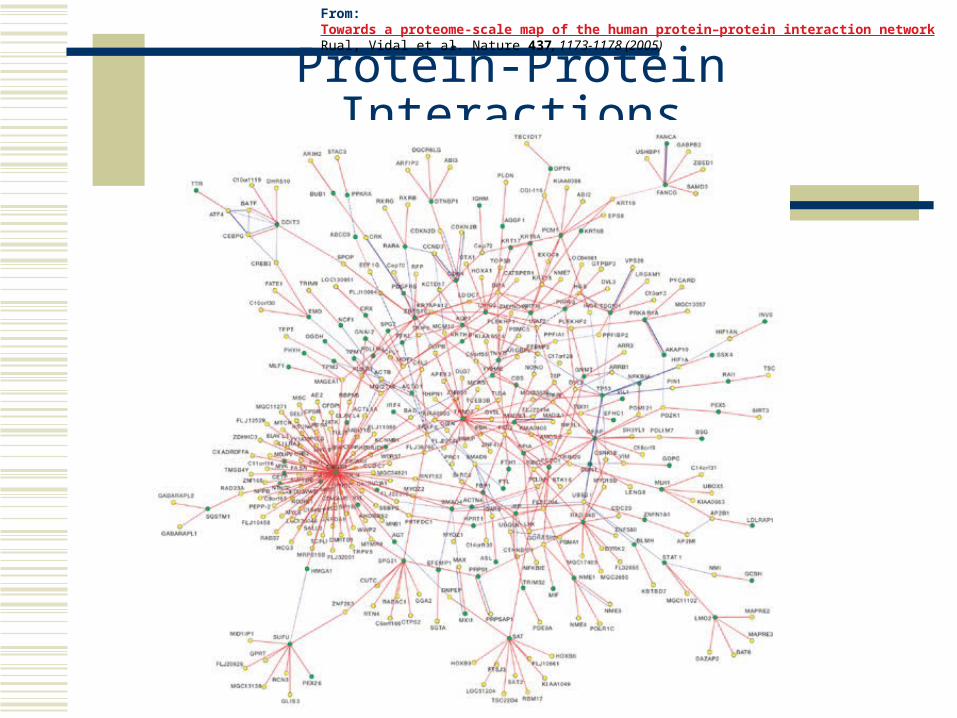
Protein-Protein Interactions
From:Towards a proteome-scale map of the human protein–protein interaction networkRual, Vidal et al. Nature 437, 1173-1178 (2005)
Most proteins perform functions by interacting with other proteins;
Broader view of how they work cooperatively in a cell;
Studies indicate that many diseases are related to subtle molecular events such as protein interactions;
Beneficial for the process of drug design.
Why Study Protein-Protein Interactions
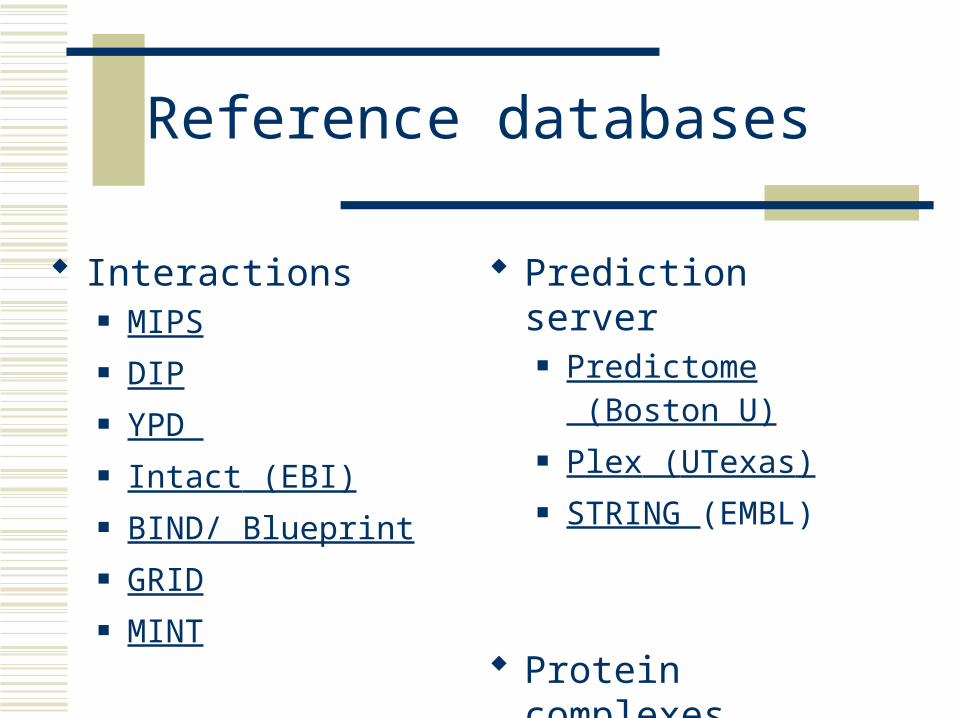
Reference databases
Interactions MIPS DIP YPD Intact (EBI) BIND/ Blueprint GRID MINT
Prediction server Predictome (Boston U) Plex (UTexas) STRING (EMBL)
Protein complexes MIPS YPD
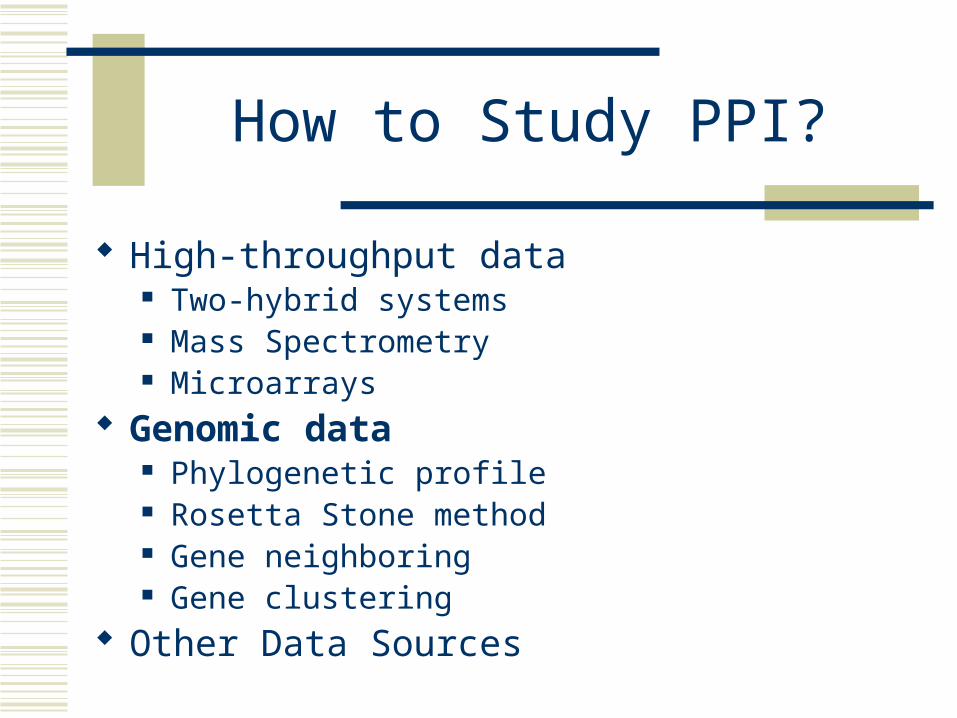
How to Study PPI?
High-throughput data Two-hybrid systems Mass Spectrometry Microarrays
Genomic data Phylogenetic profile Rosetta Stone method Gene neighboring Gene clustering
Other Data Sources
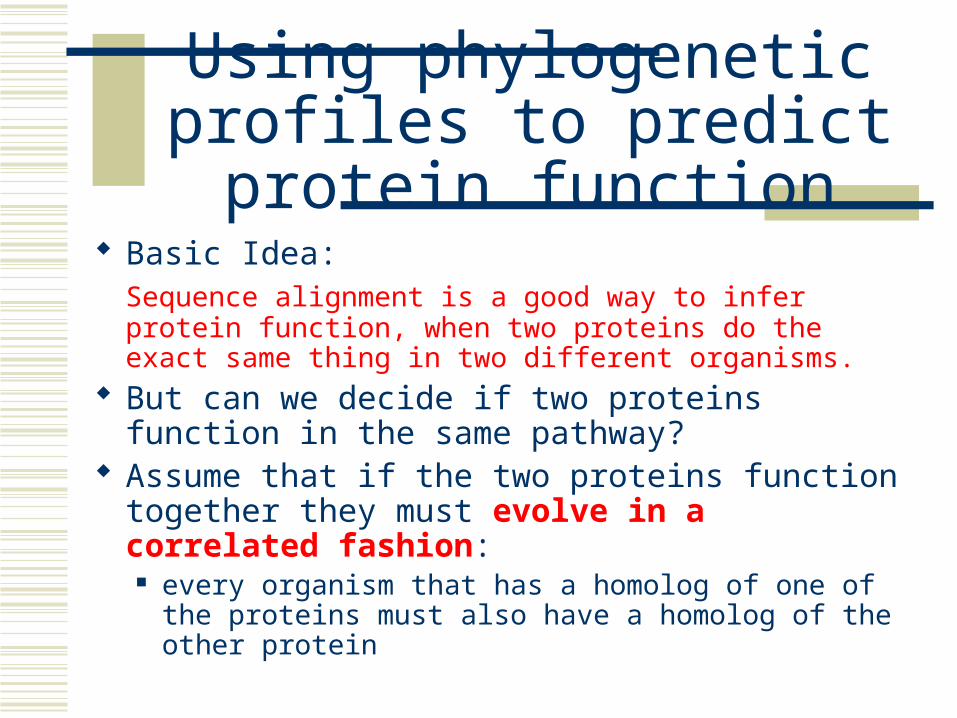
Using phylogenetic profiles to predict protein function
Basic Idea: Sequence alignment is a good way to infer protein function, when two proteins do the exact same thing in two different organisms.
But can we decide if two proteins function in the same pathway?
Assume that if the two proteins function together they must evolve in a correlated fashion: every organism that has a homolog of one of the
proteins must also have a homolog of the other protein
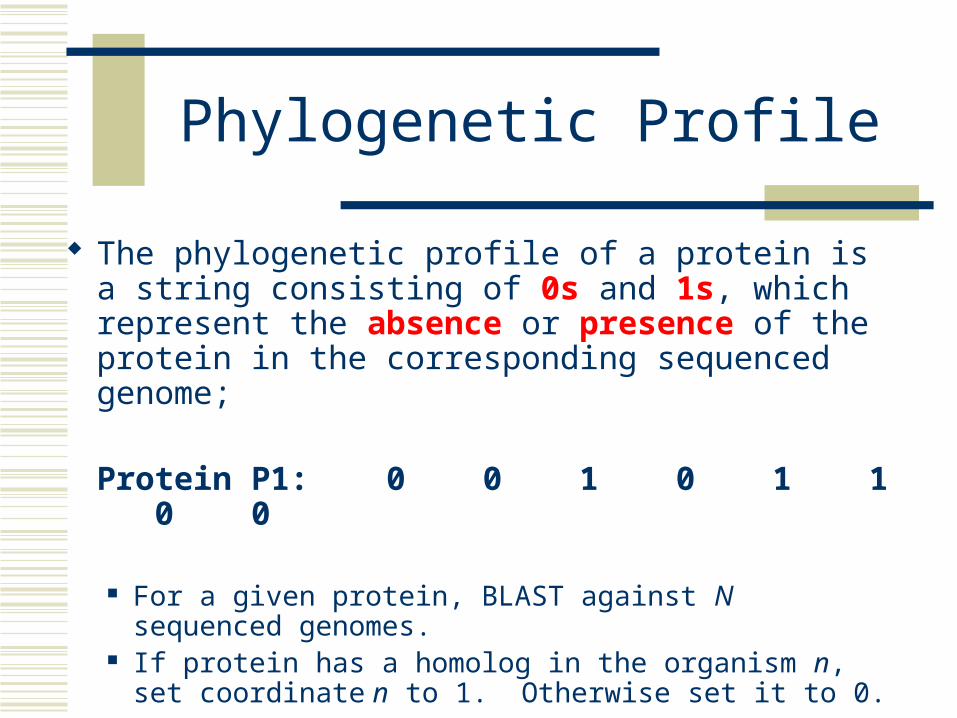
Phylogenetic Profile
The phylogenetic profile of a protein is a string consisting of 0s and 1s, which represent the absence or presence of the protein in the corresponding sequenced genome;
Protein P1: 0 0 1 0 1 1 0 0
For a given protein, BLAST against N sequenced genomes.
If protein has a homolog in the organism n, set coordinate n to 1. Otherwise set it to 0.
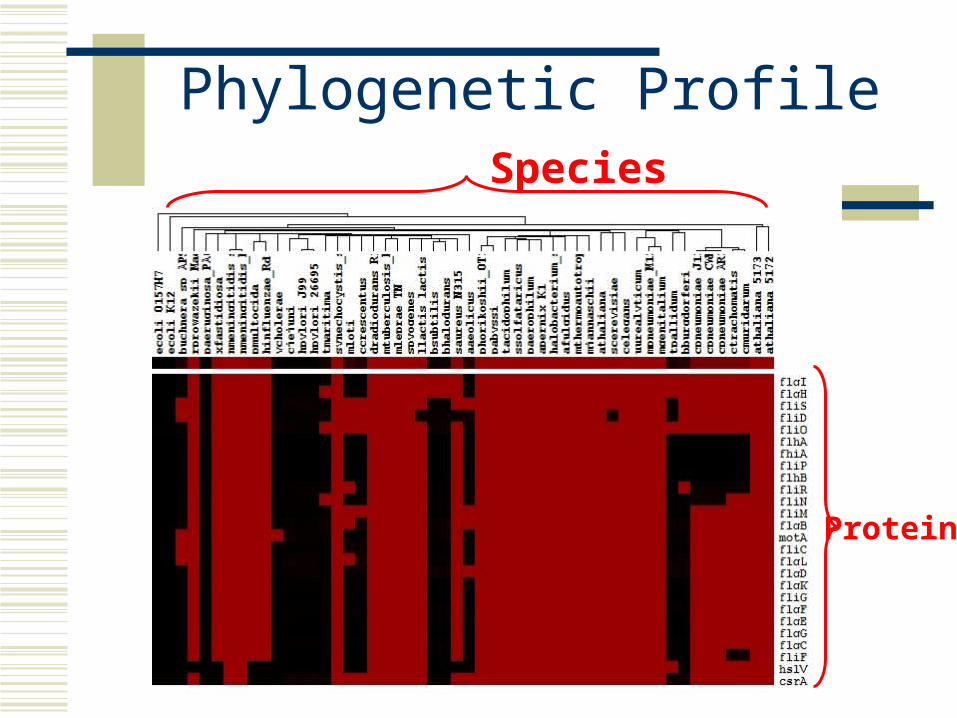
Phylogenetic Profile
Proteins
Species
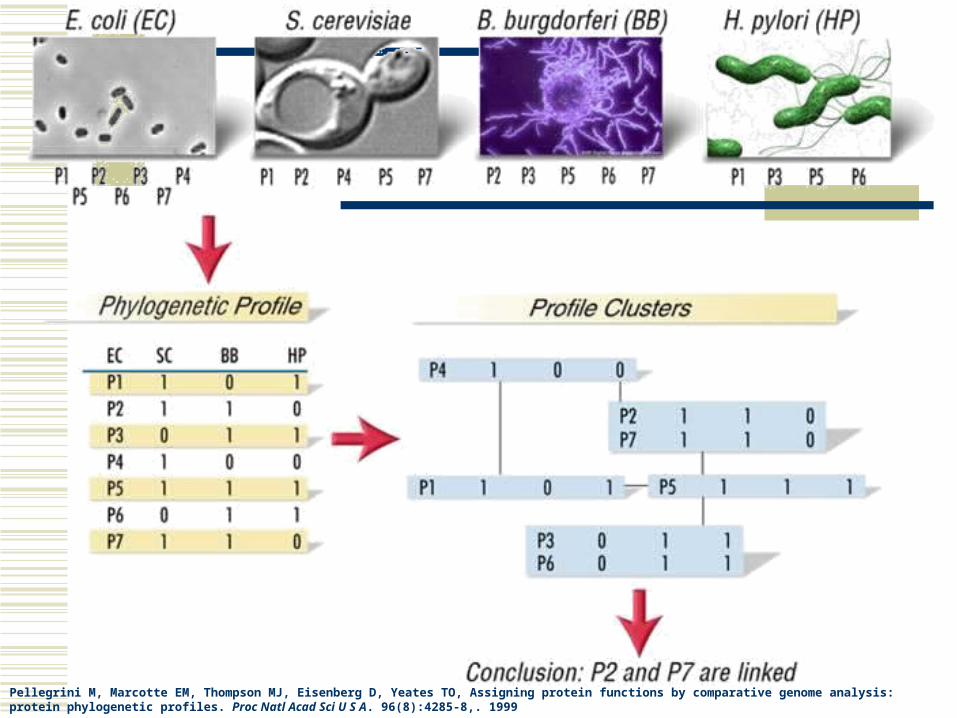
Pellegrini M, Marcotte EM, Thompson MJ, Eisenberg D, Yeates TO, Assigning protein functions by comparative genome analysis: protein phylogenetic profiles. Proc Natl Acad Sci U S A. 96(8):4285-8,. 1999
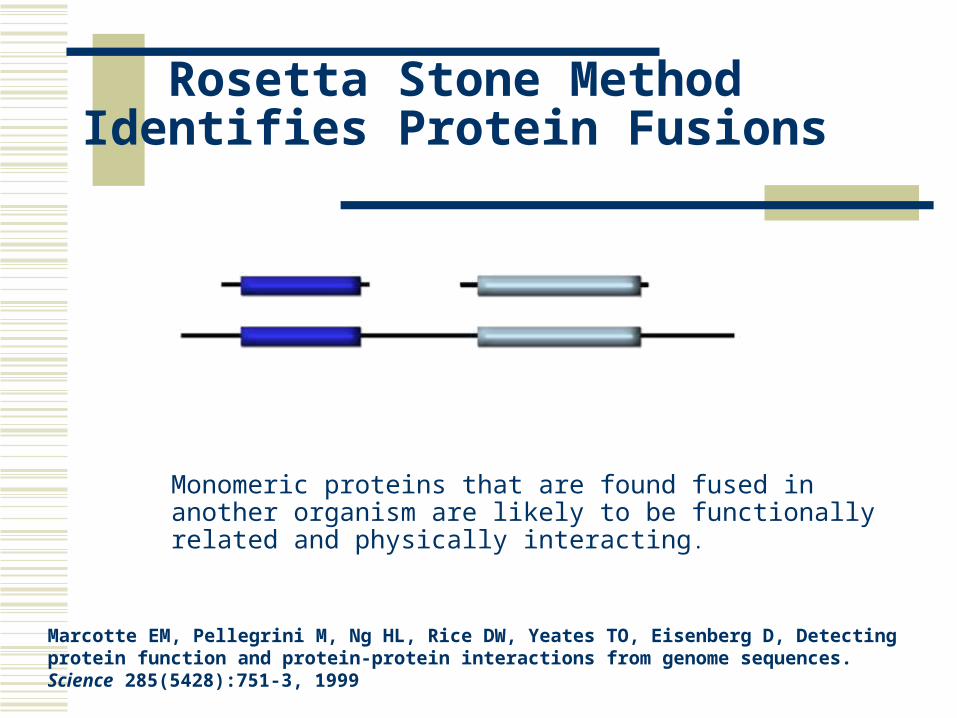
Rosetta Stone Method Identifies Protein Fusions
Monomeric proteins that are found fused in another organism are likely to be functionally related and physically interacting.
Marcotte EM, Pellegrini M, Ng HL, Rice DW, Yeates TO, Eisenberg D, Detecting protein function and protein-protein interactions from genome sequences. Science 285(5428):751-3, 1999
What we have done (1)
Logic analysis on phylogenetic profile; Plus combine phylogenetic profile data with
Rosetta Stone method;
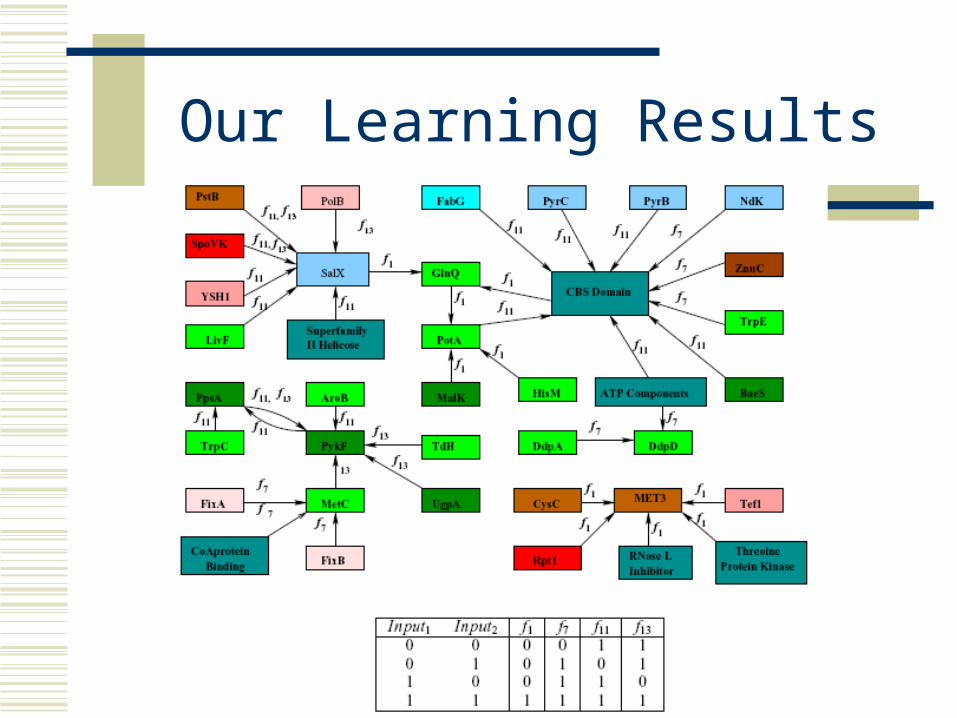
Our Learning Results
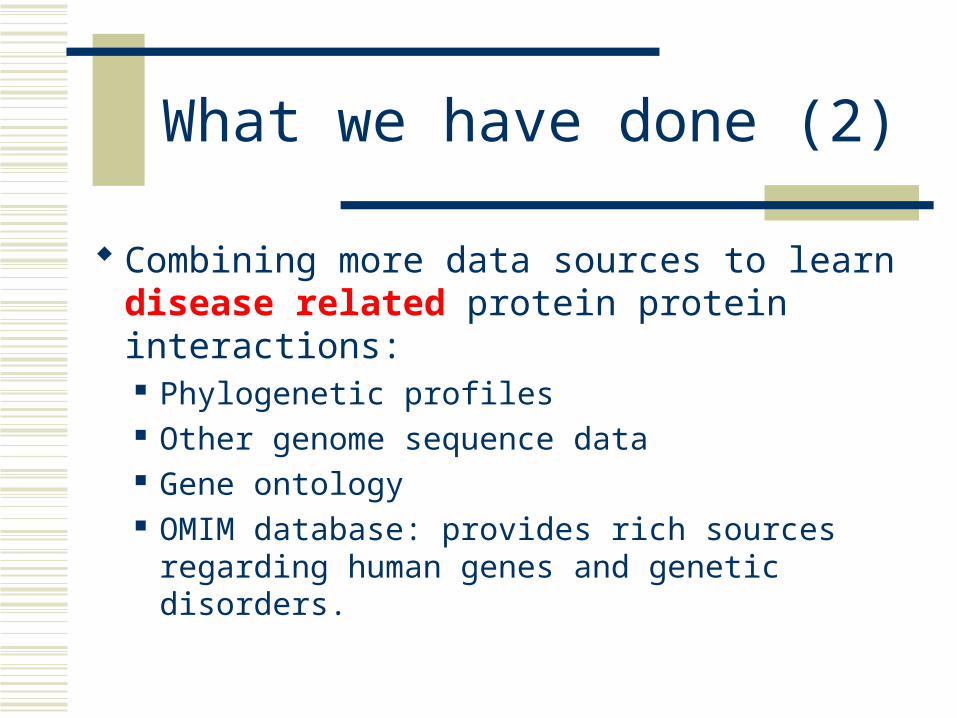
What we have done (2)
Combining more data sources to learn disease related protein protein interactions: Phylogenetic profiles Other genome sequence data Gene ontology OMIM database: provides rich sources regarding
human genes and genetic disorders.
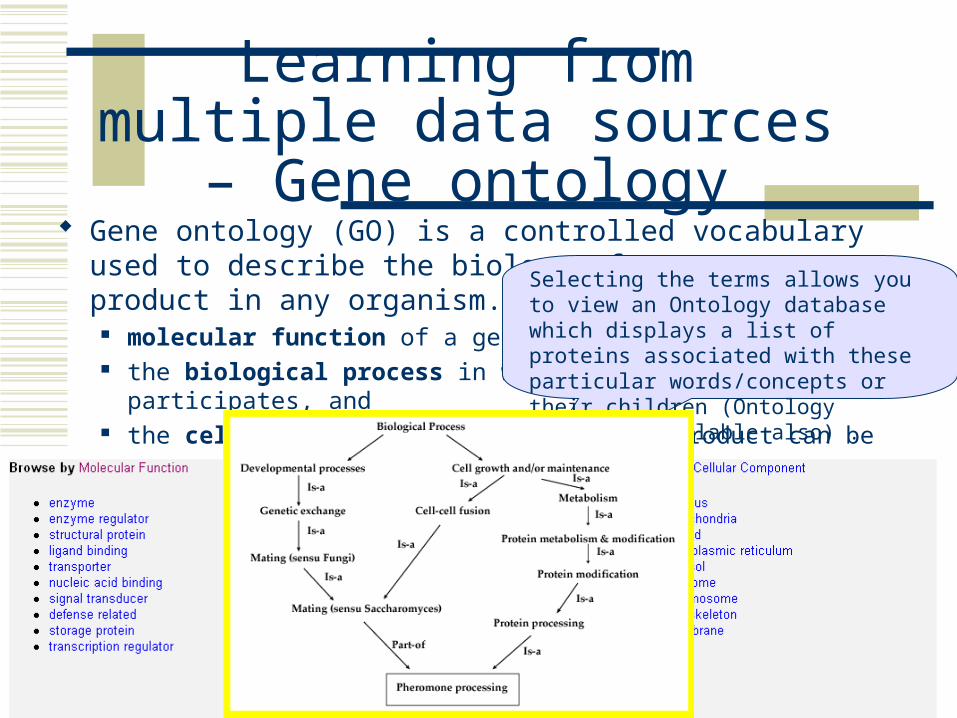
Learning from multiple data sources – Gene ontology
Gene ontology (GO) is a controlled vocabulary used to describe the biology of a gene product in any organism.
molecular function of a gene product, the biological process in which the gene product participates, and the cellular component where the gene product can be found
Selecting the terms allows you to view an Ontology database which displays a list of proteins associated with these particular words/concepts or their children (Ontology tutorial available also) .
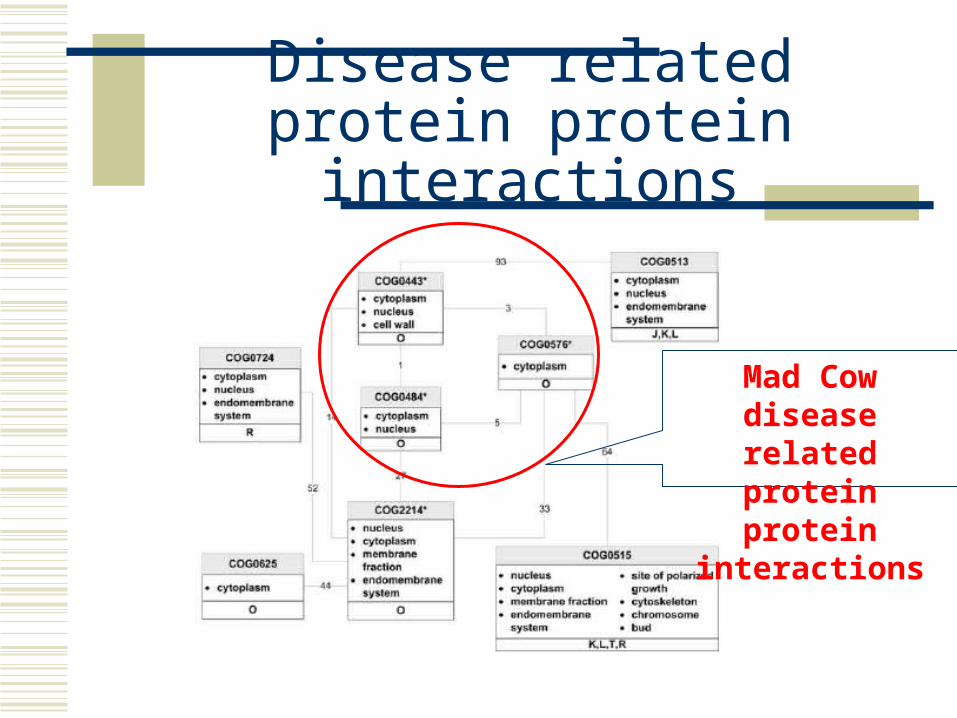
Disease related protein protein interactions
Mad Cow disease related protein
protein interactions
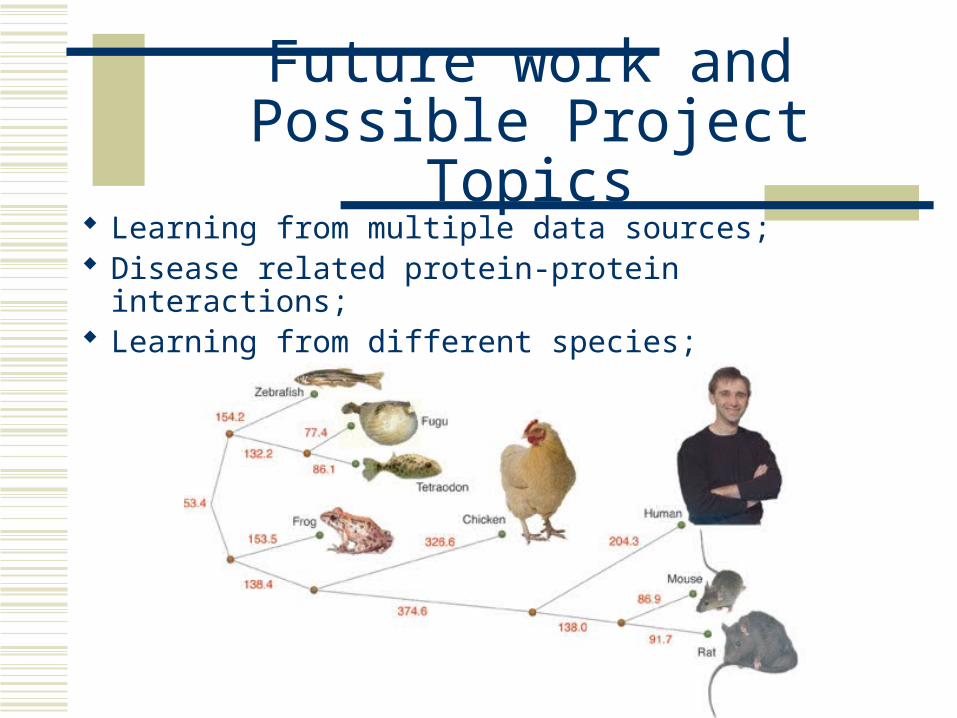
Future work and Possible Project Topics
Learning from multiple data sources; Disease related protein-protein interactions; Learning from different species;
References
Pearl, J. Causality : Models, Reasoning, and Inference. 2000 Akutsu, T., et al. Identification of Genetic Networks from A Small
Number of Gene Expression Patterns under the Boolean Network Models.
Lee, et al, Transcriptional Regulatory Networks in Saccharomyces cerevisiae Science 298: 799-804 (2002).
Pellegrini, et al. Assigning protein functions by comparative genome analysis: Protein phylogenetic profiles. (1999) PNAS 96, 4285-4288.
Marcotte, et al. Localizing proteins in the cell from their phylogenetic profiles. (2000) PNAS 97, 12115-12120
David Eisenberg, Edward M. Marcotte, Ioannis Xenarios & Todd O. Yeates(2000) Nature 405, 823-826