Embed Size (px)
Citation preview

BIOLOGICAL DEPOSITION OF IRON CATALYST
FOR CARBON NANOTUBE GROWTH
by
Mark Willis Esty
A senior thesis submitted to the faculty of
Brigham Young University
in partial fulfillment of the requirements for the degree of
Bachelor of Science
Department of Physics and Astronomy
Brigham Young University
April 2007

Copyright c© 2007 Mark Willis Esty
All Rights Reserved

BRIGHAM YOUNG UNIVERSITY
DEPARTMENT APPROVAL
of a senior thesis submitted by
Mark Willis Esty
This thesis has been reviewed by the research advisor, research coordinator,and department chair and has been found to be satisfactory.
Date Richard Vanfleet, Advisor
Date Eric Hintz, Research Coordinator
Date Scott D. Sommerfeldt, Chair

ABSTRACT
BIOLOGICAL DEPOSITION OF IRON CATALYST
FOR CARBON NANOTUBE GROWTH
Mark Willis Esty
Department of Physics and Astronomy
Bachelor of Science
The usefulness of ferritin as a catalyst in the chemical vapor deposition pro-
cess for carbon nanotube growth is analyzed. It is found that restricting the
ferritin deposition time and rinsing the sample reduced the density to a single,
well-spaced layer which significantly decreases the amalgamation of the iron
cores. The density of the deposited ferritin is found to be significantly af-
fected by the choice of substrate. Annealing studies were done to simulate the
nanotube growth conditions between 600◦C and 800◦C. The mobility of the
iron cores during the annealing process is decreased by removing the protein
shells of the ferritin molecules through exposure to an oxygen plasma prior
to the anneal. The suggested process can minimize the spread in the catalyst
diameters near 600◦C; however, it is unlikely that this process can prevent the
catalyst particles from amalgamating at temperatures near 800◦C, where most
nanotube growths are performed.
ACKNOWLEDGMENTS
I would like to thank Dr. Vanfleet for his extensive knowledge and his even
more extensive patience. I would also like to thank Jeff Farrer, Daniel Richard-
son, David Cullen, Clark Blockburger, Jason Neff, and the other members of
the TEM Research Group for their assistance in helping me to accomplish my
research and keep sane in the lab. I would also like to acknowledge funding
from the Department of Physics and Astronomy at BYU, the National Sci-
ence Foundation’s REU program at BYU, and BYU’s Office of Research and
Creative Activities.

Contents
Table of Contents 6
List of Figures 7
1 INTRODUCTION 11.1 Motivation for Research . . . . . . . . . . . . . . . . . . . . . . . . . 11.2 Background of Carbon Nanotubes . . . . . . . . . . . . . . . . . . . . 21.3 Research in Diameter-Controlled Chemical-Vapor-Deposition Catalysts 31.4 Ferritin . . . . . . . . . . . . . . . . . . . . . . . . . . . . . . . . . . . 51.5 Previous Research in Ferritin Catalysts . . . . . . . . . . . . . . . . . 61.6 Research Goals . . . . . . . . . . . . . . . . . . . . . . . . . . . . . . 9
2 MATERIALS AND METHODS 102.1 Imaging Equipment . . . . . . . . . . . . . . . . . . . . . . . . . . . . 102.2 Early Experiments . . . . . . . . . . . . . . . . . . . . . . . . . . . . 122.3 Obstacles: Density, Movement, and Heat . . . . . . . . . . . . . . . . 152.4 Ferritin Deposition Process . . . . . . . . . . . . . . . . . . . . . . . . 152.5 Importance of Substrate on Density . . . . . . . . . . . . . . . . . . . 162.6 Plasma Cleaning . . . . . . . . . . . . . . . . . . . . . . . . . . . . . 182.7 Annealing Process . . . . . . . . . . . . . . . . . . . . . . . . . . . . . 19
3 RESULTS AND CONCLUSIONS 203.1 Effect of Ferritin Proximity on Amalgamation . . . . . . . . . . . . . 203.2 Effect of Plasma Cleaning . . . . . . . . . . . . . . . . . . . . . . . . 223.3 Diffusion Length . . . . . . . . . . . . . . . . . . . . . . . . . . . . . 283.4 Conclusions . . . . . . . . . . . . . . . . . . . . . . . . . . . . . . . . 30
Bibliography 31
Index 33
6

List of Figures
1.1 Illustration of Carbon Nanotubes . . . . . . . . . . . . . . . . . . . . 21.2 The protein shell of a ferritin molecule . . . . . . . . . . . . . . . . . 6
2.1 Tecnai F-20 Analytical STEM microscope . . . . . . . . . . . . . . . 132.2 High density ferritin deposition . . . . . . . . . . . . . . . . . . . . . 142.3 Large iron crystal . . . . . . . . . . . . . . . . . . . . . . . . . . . . . 142.4 Ferritin concentration on silicon nitride . . . . . . . . . . . . . . . . . 162.5 Ferritin concentration on carbon . . . . . . . . . . . . . . . . . . . . . 172.6 Ferritin concentration on silicon dioxide . . . . . . . . . . . . . . . . . 182.7 Image of the plasma cleaner . . . . . . . . . . . . . . . . . . . . . . . 19
3.1 Small clusters and chains of ferritin molecules . . . . . . . . . . . . . 213.2 A dense clump of ferritin . . . . . . . . . . . . . . . . . . . . . . . . . 213.3 Large Iron crystals formed at 600◦C . . . . . . . . . . . . . . . . . . . 223.4 Ferritin clusters and chains before annealing . . . . . . . . . . . . . . 233.5 Ferritin clusters and chains after annealing . . . . . . . . . . . . . . . 243.6 Discrete ferritin pair after annealing . . . . . . . . . . . . . . . . . . . 253.7 Ferritin deposited on a silicon nitride surface . . . . . . . . . . . . . . 263.8 Disribution of iron cores after plasma cleaning . . . . . . . . . . . . . 263.9 Plasma cleaned sample annealed at 600◦C . . . . . . . . . . . . . . . 273.10 Ferritin nanoparticles annealed at 600◦C . . . . . . . . . . . . . . . . 283.11 Plasma cleaned sample annealed at 800◦C . . . . . . . . . . . . . . . 29
7
Chapter 1
INTRODUCTION
1.1 Motivation for Research
Carbon nanotubes have the potential to be among the most useful molecules in the
history of science. Despite diameters that are only slightly larger than one nanome-
ter, these tiny cylinders of carbon atoms have attracted interest from a variety of
scientific disciplines as a result of their unique intrinsic characteristics. For example,
carbon nanotubes’ immense strength-to-weight ratio suggests their ability to create
extremely strong and lightweight composites [1]; their hollow interiors suggests us-
ing them as nanoscopic syringes to deliver medicine directly to target cells [2]; and
their ability to be either a metal or a semiconductor suggests using them as channels
and gates in future transistor technologies [3]. Indeed, it seems like every day a new
use is suggested for these “renaissance” molecules. However, most of these potential
applications are hampered by researchers’ inability to develop a growth process that
can 1) produce carbon nanotubes with consistent characteristics and 2) control their
placement within a larger system.
1
1.2 Background of Carbon Nanotubes 2
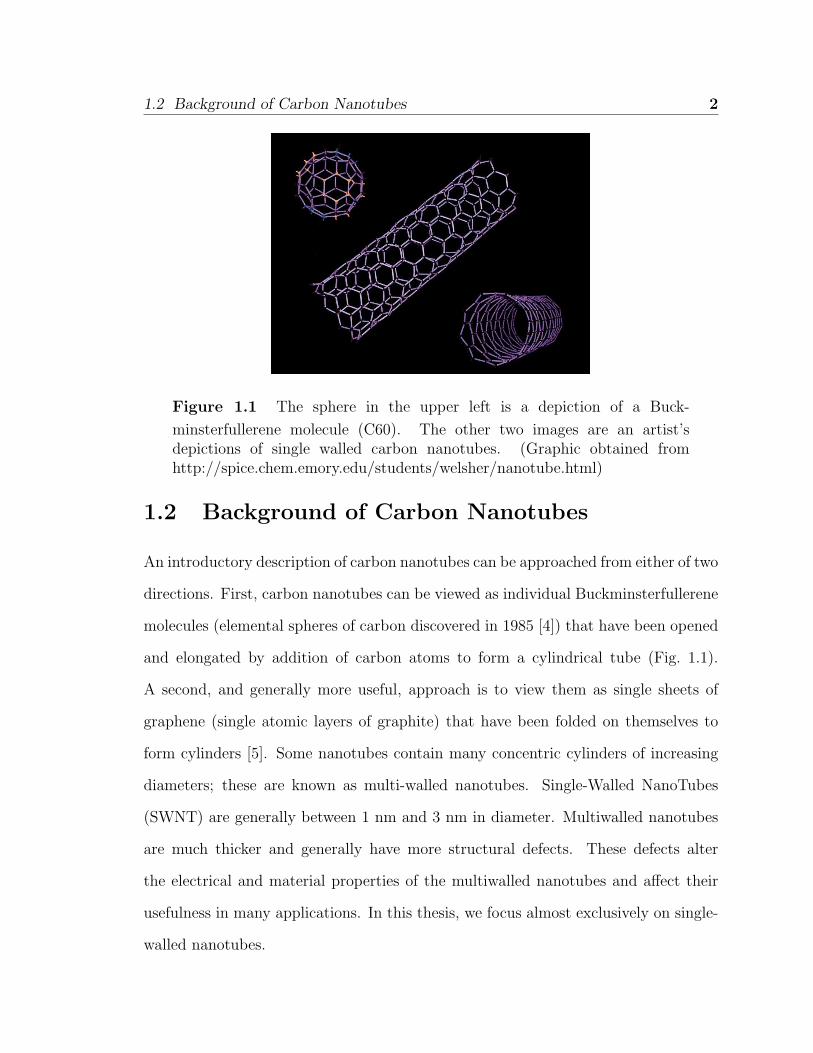
Figure 1.1 The sphere in the upper left is a depiction of a Buck-
minsterfullerene molecule (C60). The other two images are an artist’sdepictions of single walled carbon nanotubes. (Graphic obtained fromhttp://spice.chem.emory.edu/students/welsher/nanotube.html)
1.2 Background of Carbon Nanotubes
An introductory description of carbon nanotubes can be approached from either of two
directions. First, carbon nanotubes can be viewed as individual Buckminsterfullerene
molecules (elemental spheres of carbon discovered in 1985 [4]) that have been opened
and elongated by addition of carbon atoms to form a cylindrical tube (Fig. 1.1).
A second, and generally more useful, approach is to view them as single sheets of
graphene (single atomic layers of graphite) that have been folded on themselves to
form cylinders [5]. Some nanotubes contain many concentric cylinders of increasing
diameters; these are known as multi-walled nanotubes. Single-Walled NanoTubes
(SWNT) are generally between 1 nm and 3 nm in diameter. Multiwalled nanotubes
are much thicker and generally have more structural defects. These defects alter
the electrical and material properties of the multiwalled nanotubes and affect their
usefulness in many applications. In this thesis, we focus almost exclusively on single-
walled nanotubes.
1.3 Research in Diameter-Controlled Chemical-Vapor-Deposition Catalysts 3
Single-walled carbon nanotubes were first produced in 1993 by Sumio Iijima of
the NEC Fundamental Research Laboratory in Japan [3]. Iijima produced these nan-
otubes by causing an electric arc discharge to occur between two graphite electrodes
in a helium atmosphere [6]. Another process that is used to produce nanotubes was
pioneered by Richard Smalley at Rice University. In this process nanotubes are cre-
ated by “blasting a carbon target with an intense, pulsed laser beam” [6]. Both of
these processes can produce relatively large quantities of bulk SWNT that can then
be deposited on a surface or used in a solution.
The third major nanotube growth process, Chemical Vapor Deposition (CVD),
allows more control over the placement of the nanotubes as they are grown. In CVD,
a catalyst, usually a metal nanoparticle, is placed on a substrate and then heated
to a temperature between 600-1000 ◦C while a carbon-rich gas, such as ethylene or
methane, is blown over the surface. The high temperatures and actions of the catalyst
cause the gas to decompose and dissolve in the metal catalyst. When the catalyst
particles become saturated with carbon the carbon atoms precipitate and form carbon
nanotubes [5, 6]. Because it is more controllable than the other two processes, CVD
has become the leading method for nanotube growth in research where precision
placement of the nanotubes is important.
1.3 Research in Diameter-Controlled Chemical-Vapor-
Deposition Catalysts
Although CVD shows promise, there are many obstacles to overcome before it can
produce consistent SWNT growth. In CVD, the number, length, and chemical purity
of the nanotubes can be affected by changes in the growth temperature, catalyst
composition, growth pressure, substrate, and gas composition. All of these variables
1.3 Research in Diameter-Controlled Chemical-Vapor-Deposition Catalysts 4
are relatively easy to adjust.
However, the nanotubes’ diameters are much more difficult to control. Control
over this characteristic is very important since the diameters of the nanotubes have a
close correlation with their helicity [7]. Helicity, or chirality, refers to the orientation
of the graphene structure of a nanotube and determines whether the nanotube is
metallic or semiconducting (see [5] for further details). In addition, the energy gaps
of semiconducting nanotubes are inversely proportional to their diameters [5]. The
nanotube diameters are very dependant on the size of the metal nanoparticle from
which they were grown [8]. Many CVD growth experiments have contained fairly
broad diameter distributions in the nanoparticles used as catalysts, which carried
over into broad distributions in the diameters of the resultant nanotubes [7, 8].
Lei An et al. used an organic capping agent to produce nearly identical nanoparti-
cles containing 84 molybdenum atoms and 30 iron atoms [7]. They initially obtained
relatively broad distributions in their nanotube diameters. They speculated that the
nanoparticles were aggregating together to form larger catalyst particles. To reduce
these problems they chemically modified the silicon-dioxide surface to anchor the
nanoparticles to the substrate. With this technique they were able to obtain SWNT
with diameters ranging from 0.7 to 1.5 nm, an average size of 1.0 nm and a standard
deviation of 0.18 nm or 17 percent [7].
Another group, Ishida et al. in Tsukuba, Japan, used a combination of elec-
tron beam lithography and annealing to create nanoparticles of iron whose positions
could be controlled with great accuracy (within 5 nm of a desired location) [9]. The
nanotubes that were obtained by this method had an average diameter of 1.3 nm
and a standard deviation of 0.4 nm. However, in this method nanotubes only grew
from about 10 percent of the catalyst particles. This low particle-to-nanotube ratio
highlights one of the quandaries of catalyst design. The nanotube yield can be in-

1.4 Ferritin 5
creased by altering the composition of the catalyst. However, to preserve consistency
in the particle size, a new deposition process would need to be developed for each
new composition.
In summary, an ideal CVD catalyst would: 1) have nanoparticle diameters that are
both consistent and controllable, 2) have a metal composition that can be deliberately
varied, 3) be easily available and relatively simple to process, and 4) allow control
over its placement within a larger system.
1.4 Ferritin
The biological molecule ferritin has been suggested as a vehicle to produce a nan-
otube catalyst that approaches the ideal characteristics suggested above. The ferritin
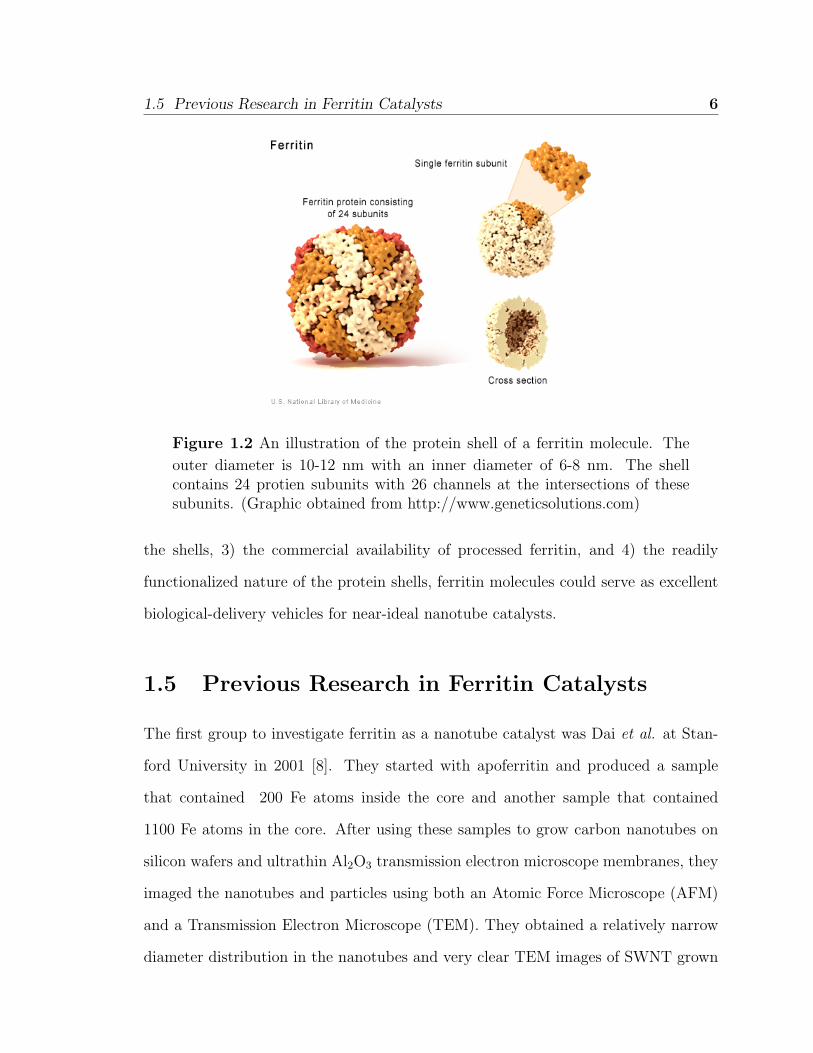
molecule is essential to the capture and storage of free iron in living organisms. Each
ferritin is composed of a 10 to 12 nm protein shell that is approximately 2.5 nm thick
(Fig. 1.2). This shell consists of 24 protein subunits which intersect to form channels
where ferrous (Fe2+) is oxidized to ferric (Fe3+) which is then transported into the
hollow center of the molecule where it is stored as Fe(OH)3. This stored iron can
then be reduced and released as it is needed by the parent organism [10]. When the
protein shell contains a metal core it is known as holoferritin. When the shell is empty
it is known as apoferritin. For a detailed study of the ferritin molecule, we refer the
reader to [10].
After ferritin has been obtained from a living organism, the iron cores can be
removed by chemical means to produce apoferritin. A controlled quantity of metal
atoms can then be added to the ferritin cores to produce reconstituted holoferritin [8,
11]. Due to: 1) the consistency of the biological shells and the narrow size distribution
of the resultant cores, 2) the variety of metals that can be artificially implanted inside
1.5 Previous Research in Ferritin Catalysts 6
Figure 1.2 An illustration of the protein shell of a ferritin molecule. The
outer diameter is 10-12 nm with an inner diameter of 6-8 nm. The shellcontains 24 protien subunits with 26 channels at the intersections of thesesubunits. (Graphic obtained from http://www.geneticsolutions.com)
the shells, 3) the commercial availability of processed ferritin, and 4) the readily
functionalized nature of the protein shells, ferritin molecules could serve as excellent
biological-delivery vehicles for near-ideal nanotube catalysts.
1.5 Previous Research in Ferritin Catalysts
The first group to investigate ferritin as a nanotube catalyst was Dai et al. at Stan-
ford University in 2001 [8]. They started with apoferritin and produced a sample
that contained 200 Fe atoms inside the core and another sample that contained
1100 Fe atoms in the core. After using these samples to grow carbon nanotubes on
silicon wafers and ultrathin Al2O3 transmission electron microscope membranes, they
imaged the nanotubes and particles using both an Atomic Force Microscope (AFM)
and a Transmission Electron Microscope (TEM). They obtained a relatively narrow
diameter distribution in the nanotubes and very clear TEM images of SWNT grown
1.5 Previous Research in Ferritin Catalysts 7
directly from discrete ferritin cores. While these findings are very impressive and
potentially beneficial, there appears to be some difficulty in replicating their results.
In their report, Dai et al. claim that after deposition the individual ferritin
molecules remain isolated and do not clump together. Their initial TEM analysis
of the ferritin deposition was done on carbon membranes that break down and evap-
orate at high temperatures (above 500◦C). For this reason, they used ultrathin Al2O3
membranes for their nanotube growth and subsequent TEM imaging of the nanotubes.
These membranes are very porous and may have contributed to the isolation of the
iron nanoparticles. To understand the distribution of the ferritin cores for growths
done on silicon wafers, the size of the nanoparticles after calcination (heating to 800◦C
for 5 min to remove the organic shell of the ferritin) were measured using an AFM.
In these measurements it was assumed that the nanoparticles were spherical so that
their lateral width could be obtained from their vertical height. If each particle truly
came from only one ferritin core then this may be an accurate assumption, but if the
ferritin cores were occasionally clumped then this assumption could be inaccurate.
In 2002, Bonard et al. in Lausanne Switzerland used ferritin to catalyze the growth
of thin and monodisperse multiwalled nanotubes [12]. Upon attempting to deposit
the ferritin and grow nanotubes, they discovered that the resultant nanotubes had
an extremely broad distribution in diameters. After analyzing these samples in the
TEM, they determined that the nanoparticles had diffused and coalesced together to
form large particles that then served as the catalyst for the nanotubes. To avoid this
agglomeration (clustering into a mass of particles) and amalgamation (consolidation
into a unified or integrated whole) they attempted to hinder the mobility of the par-
ticles by imbedding them in a Al(NO3)39H2O matrix that was stable and inert at the
growth conditions. This process succeeded in drastically decreasing the agglomera-
tion of the particles, and they were able to obtain fairly discrete cores with a mean
1.5 Previous Research in Ferritin Catalysts 8
diameter of 4.9 nm and a spread of 1.1 nm. However, the presence of the supporting
matrix limited the number of catalyst particles that were exposed to the hydrocarbon
gas. Consequently, only about 25 percent of the iron cores produced nanotubes.
Another group, at Kumamoto University in Japan, attempted to use ferritin to
obtain lattice-oriented growth of nanotubes on a gold surface [13]. This group used
ferritin that contained larger iron cores than previous groups (6 ± 2 nm) and a fairly
dense deposition density. They removed the carbon shells of the ferritin before the
nanotube growth process by heating the samples to 400◦C for 60 min. The nanotubes
that resulted from this process had average diameters (6 ± 2 nm) that were very
similar to the diameters of the catalyst particles; however, this size distribution is
very large.
A second group in Japan, Jeong et al., directly studied the relationship between
the density of the catalyst particles and the resulting diameters of the nanotubes [14].
They also removed the protein shell of the ferritin by calcinations (450◦C, 5 min)
prior to the CVD growth process. After growing SWNT they recognized that the
aggregation of the iron cores at high growth temperatures (900◦C) contributed to
the wide diameter distributions they obtained. This observation was supported by
experiments showing that when the density of the catalyst nanoparticles was de-
creased, the SWNT were more homogeneous. From their results they arrived at
the following conclusion: “From the systematic growth and analyses using different
nanoparticles densities and substrates, we can understand that the agglomeration of
discrete nanoparticles should be suppressed for nanotube growth with narrow diameter
distribution” [14](Italics added).
1.6 Research Goals 9
1.6 Research Goals
The research that is summarized above shows that ferritin can be used as an effective
catalyst for CVD SWNT growth. However, many of these researchers recognized that
the catalyst’s density and freedom of movement contribute to a disappointingly wide
distribution in the resulting nanotube diameters. Most groups studied the individual
particle size and overall distribution of the ferritin prior to their exposure to high
temperatures. Yet, despite recognizing the importance of consistency in catalyst
size and even the potential for catalyst amalgamation, these groups focused on the
distributions of the resulting nanotubes and failed to adequately determine catalyst
particles’ characteristics after their exposure to nanotube growth temperatures.
In my research, I expose the ferritin catalyst to nanotube growth temperatures and
seek to learn what is happening to the particles as they are deposited and annealed. To
accomplish this purpose, I focus on how the ferritin molecules react with the substrate
and each other, both as they are deposited and as they are heated to temperatures
between 600◦C and 800◦C. I find that 1) restricting the deposition time and rinsing
the sample increases consistency in the density and decreases the amalgamation of the
iron cores, 2) the nature of the substrate has a significant effect on the density of the
deposited ferritin, 3) the presence of the protein shells in the heating process increases
the mobility of the iron cores, 4) an oxygen plasma cleaner can remove the protein
shells without impacting the positioning of the iron cores, 5) ferritin cores that are
clustered together before heating can remain separate from one another above 700◦C,
if their cores have been removed by an oxygen plasma cleaner. However, it is unlikely
that they will remain discrete at temperatures in excess of 800◦C.

Chapter 2
MATERIALS AND METHODS
2.1 Imaging Equipment
Previous investigations in the use of ferritin as a nanotube catalyst have relied heav-
ily on Atomic-Force Microscopy (AFM) and High-Resolution Transmission Electron
Microscopy (HRTEM) to image the ferritin. However, both of these methods have in-
trinsic faults that limit their usefulness in studying ferritin. Atomic-force microscopy
produces images by passing a silicon tip over a surface and using a laser to measure
the vertical displacement of the tip as it encounters objects on that surface. This
process produces extremely accurate information on the vertical topography of the
sample, but the lateral resolution is seriously impaired by the width of the tip, which
can be 15-20 nanometers wide. The limitations on the AFM’s lateral resolution is
not very important in the imaging of cylindrical nanotubes that are lying flat on a
surface. However, when the lateral dimensions of a sample cannot be assumed by
symmetry, this characteristic of AFM’s can make size measurements very difficult
and inaccurate. Since it is generally assumed that it is the lateral dimensions, not the
vertical height, of the iron cores that directly affects the diameters of the nanotubes
10

2.1 Imaging Equipment 11
that are grown from them, AFM’s lateral imaging weaknesses seriously limit their
usefulness for catalyst imaging.
Transmission Electron Microscopy (TEM), in which an accelerated beam of elec-
trons passes through a very thin sample, has excellent lateral resolution capabilities.
However, the image obtained by the TEM is dependant on the diffraction of the elec-
tron beam from the crystalline objects in the sample. Therefore, it is very difficult
to distinguish the iron cores, which are approximately 5 nanometers in size, from
the 40 to 100 nanometer thick substrate that supports them. In addition, the thin,
amorphous, protein shells contribute almost nothing to the diffraction of the beam.
Consequently, these shells are essentially invisible in almost any form of transmission
electron microscopy.
HRTEM is a high magnification mode available on many transmission electron
microscopes. The high magnifications provided by HRTEM enable the viewing of the
diffraction lines from individual ferritin cores. But the very nature of high magnifi-
cation severely limits the microscopes field of view to only a few ferritin cores at a
time. Therefore, HRTEM cannot produce a large-scale image of the ferritin density.
These three forms of microscopy (AFM, TEM, and HRTEM) have many useful
applications. However, to understand the deposition and movement of the ferritin
cores, we needed an imaging method that could provide accurate information on
both the lateral sizes of the particles and their global distribution.
To accomplish our imaging needs, we relied heavily on the use of Scanning Trans-
mission Electron Microscopy (STEM). STEM differs from regular TEM in that the
electron beam is focused to a sub-nanometer spot on the surface of the sample and
then quickly scanned across the surface. At each point on the surface a High Angle
Annular Dark Field (HAADF) Detector records the number of electrons that are scat-
tered to relatively large angles. A computer then translates this data to an intensity

2.2 Early Experiments 12
that is displayed on a computer monitor. Since atoms with a larger atomic number
have a greater impact on the trajectory of the electron beam, the intensity recorded
by the detector is proportional to Z1.7, where Z is the atomic number of the target
atoms at the beam location. The contrast in the resulting image is related to the
ratioN1Z1.7
1
N2Z1.72
, where N1 and N2 represent the atomic densities of two materials and Z1
and Z2 represent their respective atomic numbers. The large difference between the
atomic number of iron cores (ZFe = 26) and that of the the silicon nitride membrane
(ZSi = 14 and ZN = 7) allows us to clearly distinguish the iron cores of the ferritin
from the background material.
All of the STEM imaging was done on the Tecnai F-20 (Fig. 2.1) microscope in the
underground lab of the Eyring Science Center at BYU. Some of the ferritin samples
were placed on copper grids coated with a carbon membrane (Ted Pella Inc.,01800-F).
Since the carbon membranes decompose and evaporate at temperatures above 450◦C,
all of the annealed samples were placed on Silicon Nitride (Si3N4) membranes. Both
50 nm (SPI Supplies, 4124SN) and 100 nm (SPI Supplies, 4122SN) thick silicon nitride
membranes were used in our experiments. However, due to the uneven background
produced by the 50 nm films, the majority of the experiments were performed using
the 100 nm silicon nitride membranes.
2.2 Early Experiments
To gain an initial understanding of how ferritin molecules interact with one another
at the temperatures typically used for nanotube growth, a simple test was first at-
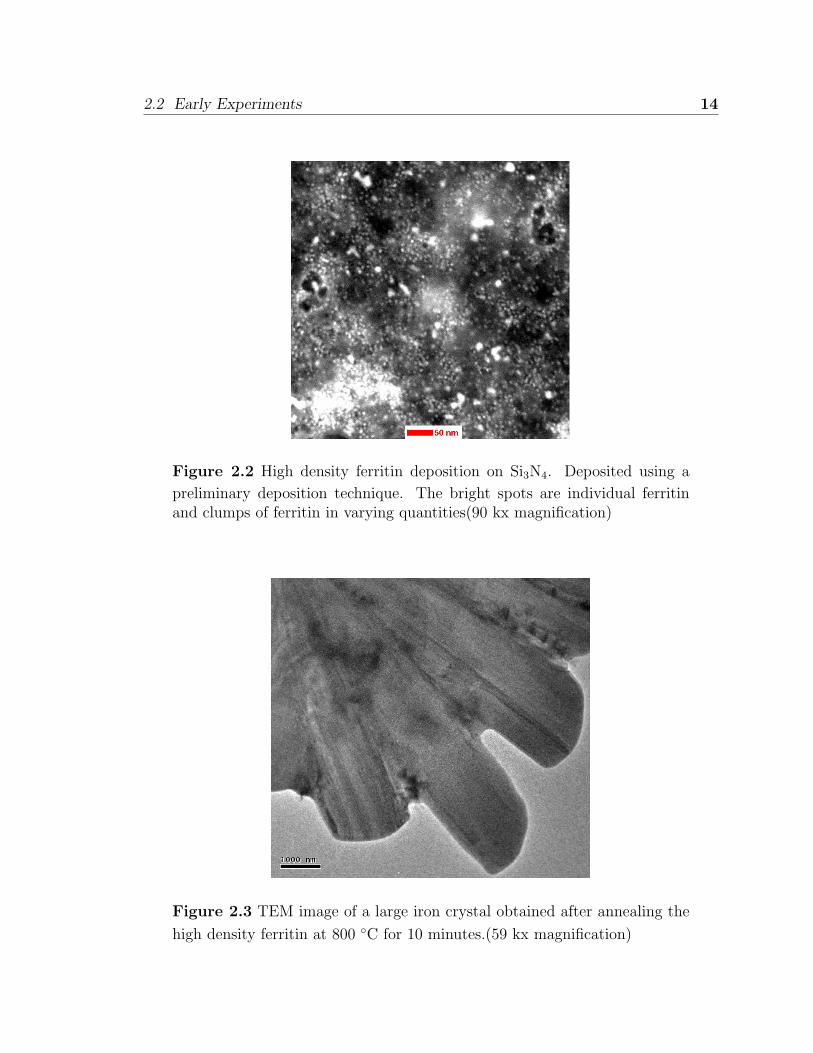
tempted, with rather surprising results. A drop of 1.82 mg/mL ferritin was placed
on a 100 nm thick silicon nitride membrane and then the excess liquid was drawn off
with filter paper. Fig. 2.2 shows a STEM image of the deposition density. The small

2.2 Early Experiments 13
Figure 2.1 Tecnai F-20 Analytical STEM microscope. Located in the Eyring
Science Center’s underground lab on Brigham Young University’s campus inProvo, Utah.
bright dots are the iron cores of the ferritin while the larger bright objects are mostly
dense clumps of ferritin. After imaging, the sample was annealed at 800◦C for 15
minutes.
We were surprised to find that the iron cores of the ferritin molecules had amal-
gamated together to form large crystals that were several microns in size (Fig. 2.3).
Since 800◦C is only roughly half the melting temperature of iron, the iron atoms
should have a diffusion length that is very short and the growth of crystals this size
should not result. For amalgamation of the iron to occur on this scale, the iron par-
ticles would need to have first formed large clumps by some means other than the
atomic diffusion of iron atoms.
2.2 Early Experiments 14
Figure 2.2 High density ferritin deposition on Si3N4. Deposited using a
preliminary deposition technique. The bright spots are individual ferritinand clumps of ferritin in varying quantities(90 kx magnification)
Figure 2.3 TEM image of a large iron crystal obtained after annealing the
high density ferritin at 800 ◦C for 10 minutes.(59 kx magnification)

2.3 Obstacles: Density, Movement, and Heat 15
2.3 Obstacles: Density, Movement, and Heat
We concluded that there were two major causes of the catalyst amalgamation. First,
the ferritin was clearly too densely deposited on the substrate. Second, the movement
of the melting protein shells led them to clump together, causing a drastic aggregation
of the iron cores. To solve these problems we focused on decreasing the density of the
deposited ferritin and finding a method to remove the protein shells from the ferritin
cores without allowing them to move. We then annealed the ferritin samples at a
variety of temperatures to determine the temperature at which the transition from
discrete iron cores to amalgamated particles occurs.
2.4 Ferritin Deposition Process
For our experiments we used horse-spleen ferritin with a concentration of 91 mg/mL in
a 0.15M sodium chloride solution (Sigma Chemical, St Louis MO). Most of the ferritin
that we used was mixed in two batches. The first batch was mixed by a BYU graduate
student, Degao Xu, on 8 March 2004 using a 0.05M phosphate buffer (pH 7.4) that
contained 0.05M NaCl to achieve several desired concentrations (0.01 mg/mL, 0.1
mg/mL, 1 mg/mL, and 10 mg/mL) [15]. The second batch was mixed by Mark Esty
on 9 November 2005, using high-purity water to achieve a concentration of 1 mg/mL.
Both batches were refrigerated at 4◦C when not in use. The deposition densities of
the two batches of ferritin appear to be very similar when they are deposited using
identical processes.
To decrease the density of the deposited ferritin, we modified a deposition process
that was suggested by Degao Xu [15]. We will hereafter refer to this process as our
“standard deposition technique.” It is outlined as follows:
1) Place a drop of ferritin on a substrate using a pipette with a disposable tip.

2.5 Importance of Substrate on Density 16
Figure 2.4 The ferritin concentration on silicon nitride using the standard
deposition technique. Each bright dot is an individual iron core inside aferritin molecule. (205 kx magnification)
2) Allow the ferritin to remain on the surface for a specified period of time, typi-
cally 30 seconds.
3) Dip the sample in high-purity water and rinse for 30 seconds.
4) Gently blow nitrogen gas on the sample to dry it.
We have discovered that using ferritin with a 1 mg/mL concentration and leaving
the ferritin on the substrate for 30 seconds before rinsing produces a fairly evenly
dispersed sub-monolayer of ferritin on a silicon nitride surface (Fig. 2.4).
2.5 Importance of Substrate on Density
By using several different TEM membranes we discovered that the nature of the
substrate has a significant impact on the density of the deposited ferritin. Fig. 2.5
shows the density of ferritin that was deposited on a carbon film using a process

2.5 Importance of Substrate on Density 17
Figure 2.5 Ferritin concentration on a carbon membrane using the standard
deposition technique. Notice the significant decrease in ferritin concentrationcompared to an identical deposition on silicon nitride (Fig. 2.4). (205 kxmagnification)
identical to the one used to deposit ferritin on the silicon-nitride film in Fig. 2.4.
This same dependance on the substrate was noticed by Li et al. [8]. They pre-wet
the carbon grid with methanol to overcome the highly hydrophobic nature of the
carbon film. The contrast between the ferritin density on carbon with that on silicon
nitride is important because carbon grids are the most common TEM membranes,
but nanotube growths have historically been performed on silicon wafers. To ensure
that there is continuity between the ferritin density on silicon nitride that we are
studying and the density that will be used in the growth processes, we manufactured
several silicon dioxide TEM membranes. By comparing the ferritin density on these
membranes with the density on silicon nitride membranes from SPI, we determined
that there was very little variance between silicon dioxide and silicon nitrite and that
continuity could be assumed (Fig. 2.6).

2.6 Plasma Cleaning 18
Figure 2.6 Ferritin concentration on a silicon dioxide membrane using
the standard deposition technique. While the magnification is higher thanFig. 2.4, notice the similarities in the density of the iron cores. (580 kxmagnification, individual iron cores are approximately 4-6 nm)
2.6 Plasma Cleaning
In most of the previous experiments [8, 14], the protein shells were removed from
the iron cores by heating the samples to temperatures above 450◦C for an extended
time. Because we believed that temperatures near the melting point of the shells were
contributing to the aggregation of the ferritin, we decided to remove the shells before
heating and test the validity of our predictions. To remove the protein shells from
the iron cores without heating the samples, we used a plasma cleaner (Fig. 2.7) which
removes carbon contamination from TEM samples by exposing them to an oxygen
plasma. Most of the samples that were plasma cleaned were exposed to the plasma
for five minutes. However, exposure times of about one minute appear to be sufficient
for removing the majority of the carbon.

2.7 Annealing Process 19
Figure 2.7 Fischione Instruments model 1020 Plasma Cleaner that is used
to clean carbon from TEM samples. A TEM sample holder is shown insertedinto the instrument on the right, front face.
2.7 Annealing Process
To anneal the ferritin samples we use a tube furnace (Lindberg/Blue M, TF55030COM
A-1) with a quartz tube (1” X 24”) and a quartz slide. The silicon dioxide membranes
are placed on the quartz slide under a flow of 500 standard cubic centimeters per
minute (sccm) of argon gas. After the furnace is heated to the desired temperature
(600◦C or 800◦C) the samples are held at that temperature for 10 minutes. The fur-
nace is then turned off and allowed to cool to under 90◦C before the gas is turned off
and the samples are removed.

Chapter 3
RESULTS AND CONCLUSIONS
3.1 Effect of Ferritin Proximity on Amalgamation
In our early experiments, we found that a dense distribution of ferritin on a surface
can drastically increase the clumping of the iron cores. To help resolve this problem
and keep the ferritin cores discrete at high temperatures, we dramatically decreased
the density of the deposited ferritin.
However, even after we decreased the density, many of the ferritin molecules
formed small clusters or chains (Fig. 3.1). In addition, large agglomerations of ferritin
would occasionally form during the deposition process (Fig. 3.2). As seen in Fig. 3.3,
even when these clumps are annealed at a relatively low temperature (600◦C), the
close proximity of the iron cores encouraged them to diffuse together and form rela-
tively large crystals of iron.
The smaller clusters and chains did not create extremely large crystals of iron;
however, the iron cores in these molecules did combine with their nearest neighbors
to form particles that consisted of two to six ferritin cores. The clumping of the iron
cores can be seen by comparing Fig. 3.4 to Fig. 3.5. In the annealed sample the
20

3.1 Effect of Ferritin Proximity on Amalgamation 21
Figure 3.1 Ferritin on a silicon nitride film. The ferritin molecules tend
to automatically form small clusters and chains. This sample has not beenannealed. (810 kx magnification)
Figure 3.2 A dense clump of ferritin molecules on a silicon nitride surface.
This sample has not been annealed. (81 kx magnification)
3.2 Effect of Plasma Cleaning 22
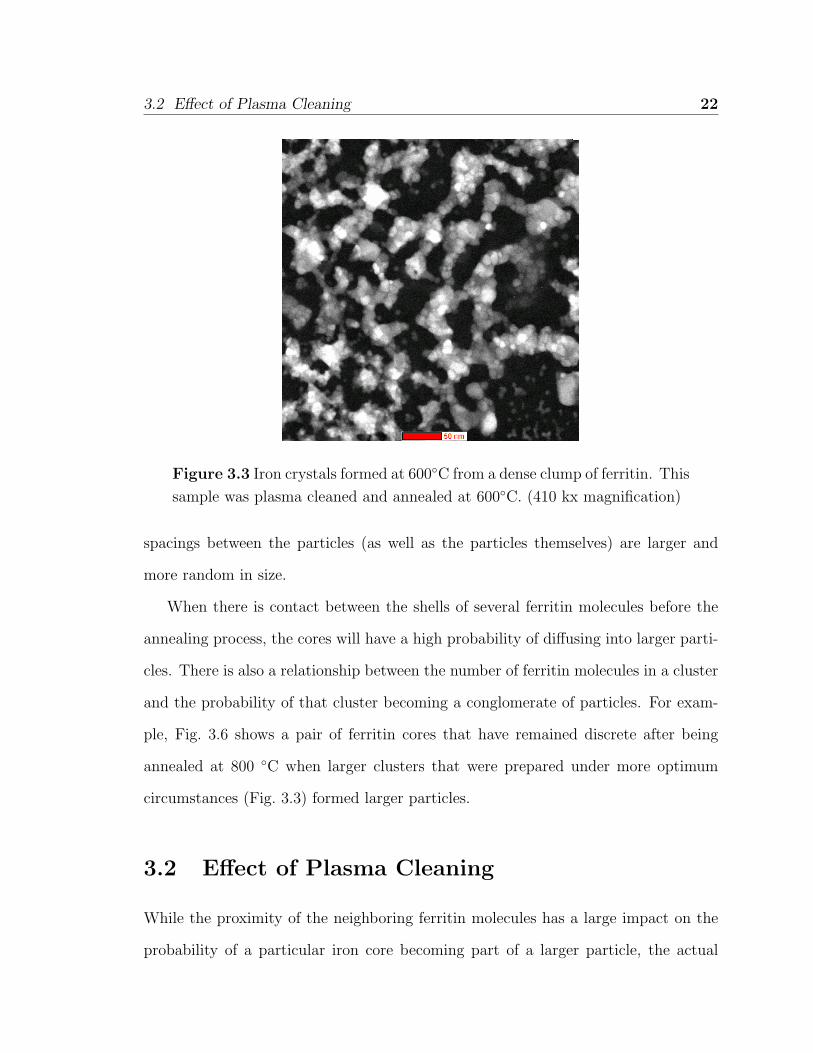
Figure 3.3 Iron crystals formed at 600◦C from a dense clump of ferritin. This
sample was plasma cleaned and annealed at 600◦C. (410 kx magnification)
spacings between the particles (as well as the particles themselves) are larger and
more random in size.
When there is contact between the shells of several ferritin molecules before the
annealing process, the cores will have a high probability of diffusing into larger parti-
cles. There is also a relationship between the number of ferritin molecules in a cluster
and the probability of that cluster becoming a conglomerate of particles. For exam-
ple, Fig. 3.6 shows a pair of ferritin cores that have remained discrete after being
annealed at 800 ◦C when larger clusters that were prepared under more optimum
circumstances (Fig. 3.3) formed larger particles.
3.2 Effect of Plasma Cleaning
While the proximity of the neighboring ferritin molecules has a large impact on the
probability of a particular iron core becoming part of a larger particle, the actual

3.2 Effect of Plasma Cleaning 23
Figure 3.4 Ferritin molecules deposited on a silicon nitride film. This sample
has not been plasma cleaned or annealed. Notice the regular spacing betweenthe discrete iron cores within clumps and chains. (205 kx magnification)
3.2 Effect of Plasma Cleaning 24
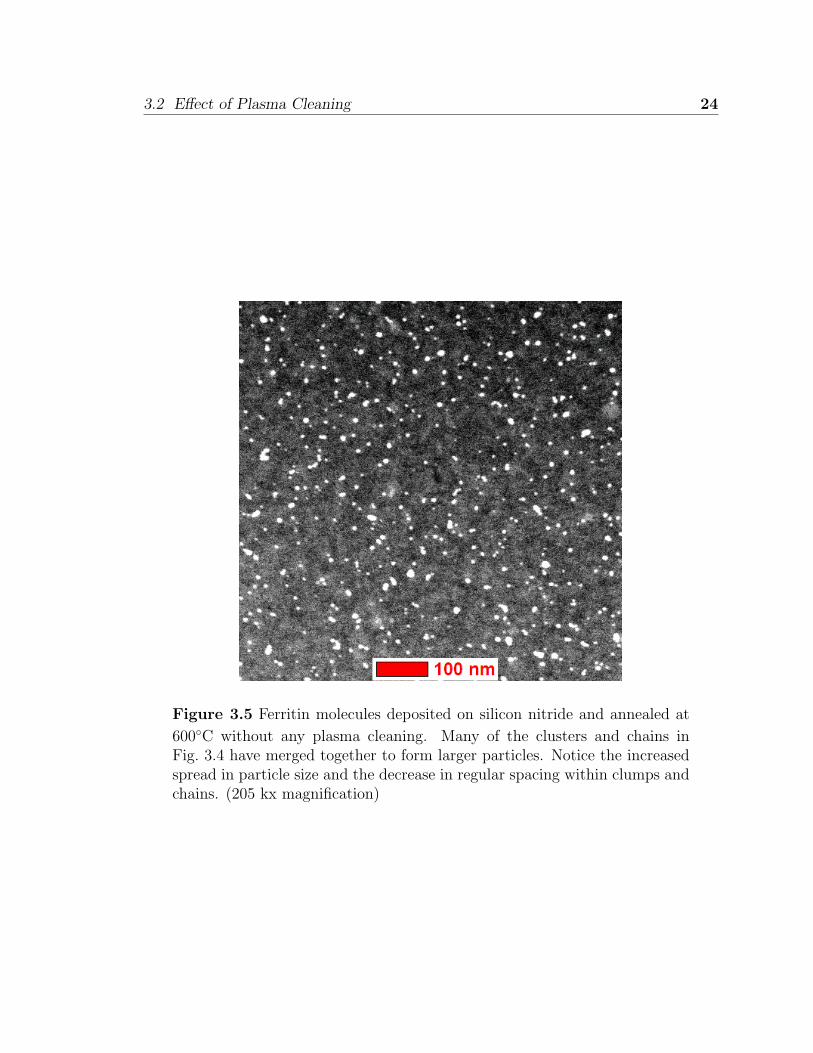
Figure 3.5 Ferritin molecules deposited on silicon nitride and annealed at
600◦C without any plasma cleaning. Many of the clusters and chains inFig. 3.4 have merged together to form larger particles. Notice the increasedspread in particle size and the decrease in regular spacing within clumps andchains. (205 kx magnification)

3.2 Effect of Plasma Cleaning 25
Figure 3.6 Ferritin cores deposited on silicon nitride and annealed at 800◦C
without any plasma cleaning. The bright iron cores are approximately 5 nmin size and may have remained discrete due to the relatively small size of theclumps (two or three iron cores). (810 kx magnification)
movement is the result of two processes: 1) the melting of the protein shells, creating
liquid droplets that bring together the core particles before the carbon evaporates,
and 2) the atomic diffusion of iron atoms across the distance that separates the
particles from their nearest neighbors. This atomic diffusion length can be affected
by a variety of factors including the particle’s composition, the nature of the substrate,
the temperature, and the environmental conditions surrounding the particle.
To test the hypothesis that the ferritin shells increase the mobility of the iron
cores, we removed the protein shells before the annealing process using a TEM plasma
cleaner. By imaging the samples before (Fig. 3.7) and after (Fig. 3.8) exposing them
to five minutes of plasma cleaning we determined that the positions of the iron cores
were not affected by the plasma processing.
Fig. 3.9 shows a sample that has been plasma cleaned and then annealed at 600◦C.
When this sample is compared to a sample that has been annealed at 600◦C without

3.2 Effect of Plasma Cleaning 26
Figure 3.7 Ferritin deposited on a silicon nitride surface. This sample has
not been plasma cleaned or annealed. (205 kx magnification)
Figure 3.8 Iron nanoparticles derived from ferritin after their protein shells
have been removed by a 5 minute exposure to an oxygen plasma. Whencompared to Fig. 3.7 it is clear that the relative positions of the iron coreshave not been affected by the plasma. (205 kx magnification)
3.2 Effect of Plasma Cleaning 27
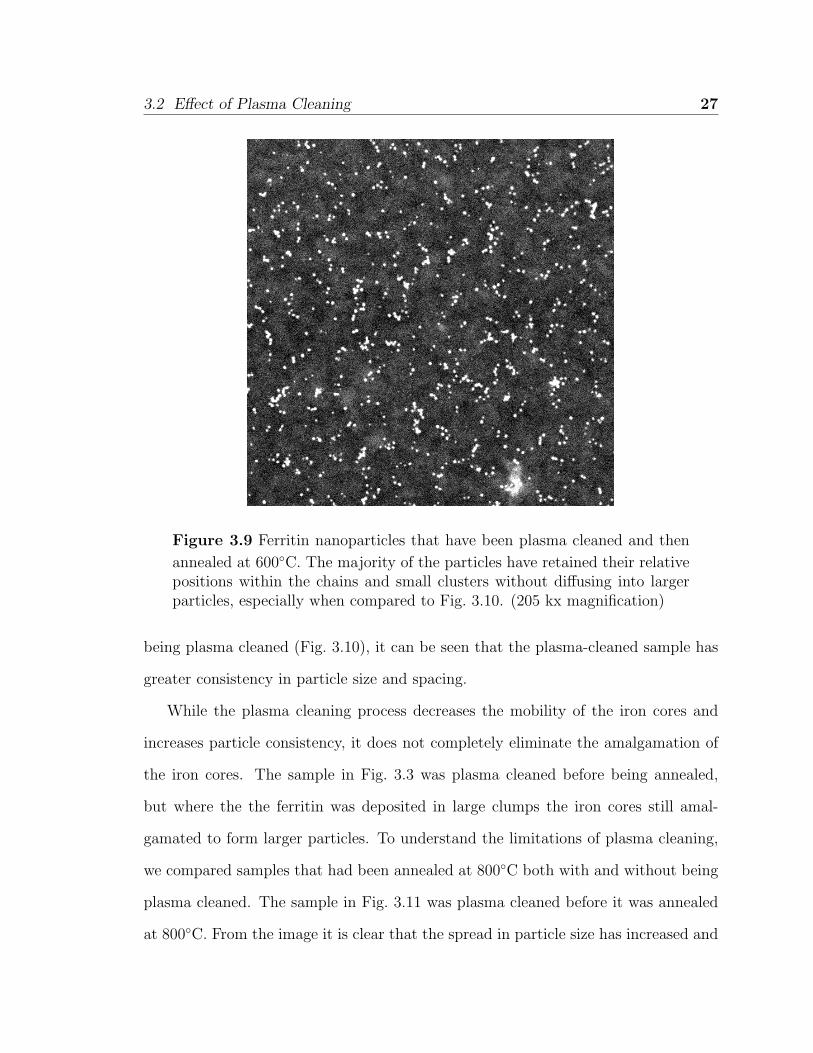
Figure 3.9 Ferritin nanoparticles that have been plasma cleaned and then
annealed at 600◦C. The majority of the particles have retained their relativepositions within the chains and small clusters without diffusing into largerparticles, especially when compared to Fig. 3.10. (205 kx magnification)
being plasma cleaned (Fig. 3.10), it can be seen that the plasma-cleaned sample has
greater consistency in particle size and spacing.
While the plasma cleaning process decreases the mobility of the iron cores and
increases particle consistency, it does not completely eliminate the amalgamation of
the iron cores. The sample in Fig. 3.3 was plasma cleaned before being annealed,
but where the the ferritin was deposited in large clumps the iron cores still amal-
gamated to form larger particles. To understand the limitations of plasma cleaning,
we compared samples that had been annealed at 800◦C both with and without being
plasma cleaned. The sample in Fig. 3.11 was plasma cleaned before it was annealed
at 800◦C. From the image it is clear that the spread in particle size has increased and
3.3 Diffusion Length 28
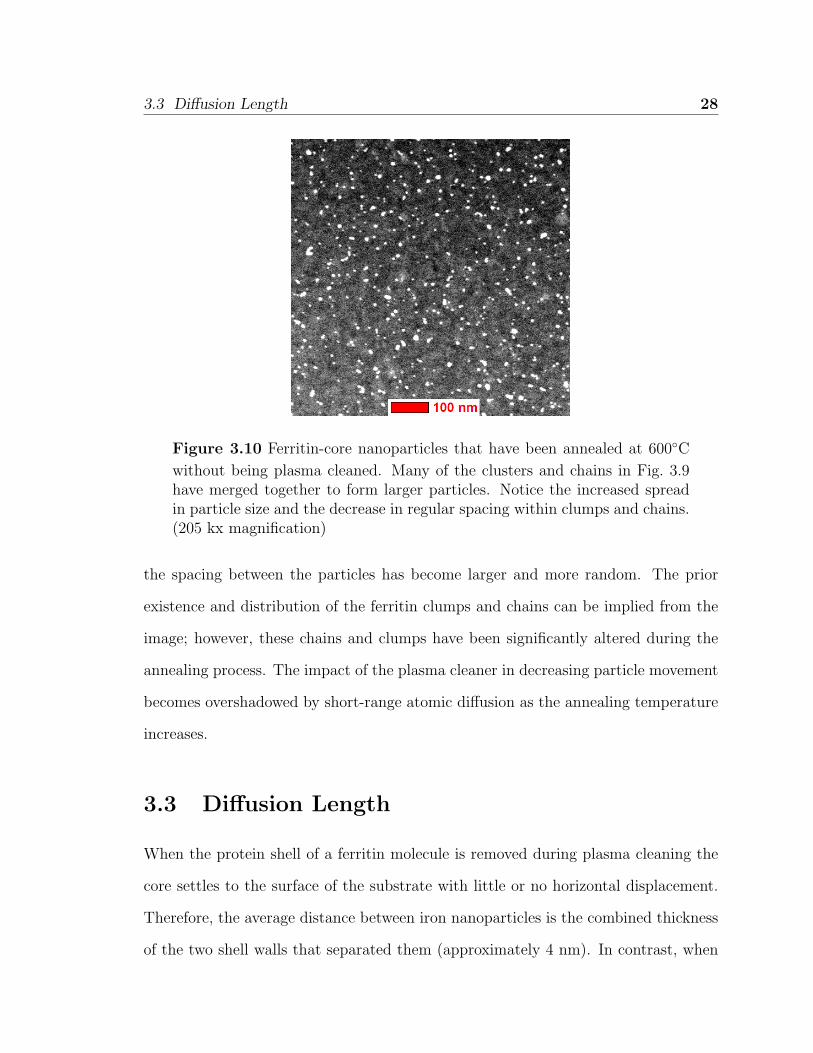
Figure 3.10 Ferritin-core nanoparticles that have been annealed at 600◦C
without being plasma cleaned. Many of the clusters and chains in Fig. 3.9have merged together to form larger particles. Notice the increased spreadin particle size and the decrease in regular spacing within clumps and chains.(205 kx magnification)
the spacing between the particles has become larger and more random. The prior
existence and distribution of the ferritin clumps and chains can be implied from the
image; however, these chains and clumps have been significantly altered during the
annealing process. The impact of the plasma cleaner in decreasing particle movement
becomes overshadowed by short-range atomic diffusion as the annealing temperature
increases.
3.3 Diffusion Length
When the protein shell of a ferritin molecule is removed during plasma cleaning the
core settles to the surface of the substrate with little or no horizontal displacement.
Therefore, the average distance between iron nanoparticles is the combined thickness
of the two shell walls that separated them (approximately 4 nm). In contrast, when

3.3 Diffusion Length 29
Figure 3.11 Ferritin-core nanoparticles that have been plasma cleaned and
then annealed at 800◦C. Notice the increased spread in size and spacing whencompared to the sample annealed at 600◦C (Fig. 3.10).(410 kx magnification)
the shells are removed using calcination (heating at 500◦C), there is an increased
probability of horizontal core movement that is likely to reduce the distance between
nearest-neighbor particles to under 4 nm.
Once the protein shells have been removed, particle amalgamation is dominated by
the atomic diffusion of the individual iron atoms. Near 600◦C the diffusion length of
these atoms appears to be smaller than the 4 nm average distance between particles,
and therefore the majority of the nanoparticles remain discrete from one another.
However, near 800◦C this atomic diffusion length has increased and appears to exceed
the average distance between the iron cores.
Within the larger clumps of ferritin, some of the cores appeared to be separated
by less than 4 nm both before and after being plasma cleaned. This could indicate
that not all of the molecules were located in the same lateral plane and that some of
the molecules may have been resting above others before the shells were removed. In
this situation the final lateral distance between cores after plasma cleaning would be

3.4 Conclusions 30
less than 4 nm. This could explain some of the amalgamation that occurred in the
plasma cleaned sample that was annealed at 600◦C.
3.4 Conclusions
We have found that the protein shells of the ferritin molecules increase the agglomer-
ation of the iron-core nanoparticles when the samples are annealed to temperatures
in excess of 600◦C. By removing these shells using an oxygen plasma cleaner, particle
movement has been reduced to where the diffusion length of the iron atoms between
the neighboring cores is the primary mechanism of particle growth. At 600◦C this
atomic diffusion length appears to be slightly less than twice the thickness of the
ferritin molecules’ protein shells (4 nm) and at 800◦C the diffusion length appears
to exceed 4nm. However, even near 600◦C, a below-average distance between two
particles in a larger clump may cause one particle to increase in size and eventually
absorb its nearest neighbors through diffusion.
Plasma cleaning holo-ferritin molecules can decrease their agglomeration dur-
ing the heating process without significantly altering the dispersion of the iron core
nanoparticles. If these particles are more than 4 nm apart after the plasma cleaning
they are likely to remain discrete from one another near 600◦C, but any benefit de-
rived from the plasma cleaning appears to be lost near 800◦C. To use ferritin molecules
to create well-defined catalyst particles nanotube growths should be performed near
600◦C and the distance between ferritin cores should be greater than 4 nm.

Bibliography
[1] M.-F. Yu, O. Lourie, M. J. Dyer, K. Moloni, T. F. Kelly, and R. S. Ruoff,
“Strength and Breaking Mechanism of Multiwalled Carbon Nanotubes Under
Tensile Load,” Science 287 (2000).
[2] W. Wu, S. Wieckowski, G. Pastorin, M. Benincasa, C. Klumpp, J.-P. Briand,
R. Gennaro, M. Prato, and A. Bianco, “Targeted Delivery of Amphotericin B to
Cells by Using Functionalized Carbon Nanotubes,” Angew. Chem. Int. Ed. 44
(2005).
[3] P. L. McEuen, “Single-wall carbon nanotube,” PHYSICS WORLD 13, 31–36
(2000).
[4] R. F. Curl, “Dawn of the Fullerenes: Conjecture and Experiment (Nobel Lec-
ture),” Angew. Chrm. In!. Ed. Engl 36 (2003).
[5] P. L. McEuen, M. S. Fuhrer, and H. K. Park, “Single-walled carbon nan-
otube electronics,” IEEE TRANSACTIONS ON NANOTECHNOLOGY 1, 78–
85 (2002).
[6] H. Dai, “Controlling nanotube growth,” PHYSICS WORLD 13, 43–47 (2000).
31

BIBLIOGRAPHY 32
[7] L. An, J. M. Owens, L. E. McNeil, and J. Liu, “Syntheis of Nearly Uniform
Single-Walled Carbon Nanotubes Using Identical Metal-Containing Molecular
Nanoclusters as Catalysts,” J. Am. Chem. Soc. 124, 13688–13689 (2002).
[8] Y. Li, W. Kim, Y. Zhang, M. Rolandi, D. Wang, and H. Dai, “Growth of
Single-Walled Carbon Nanotubes from Discrete Catalytic Nanoparticles of Var-
ious Sizes,” J. Phys. Chem. B 105, 11424–11431 (2001).
[9] M. Ishida, H. Hongo, F. Nihey, and Y. Ochiai, “Diameter-Controlled Carbon
Nanotubes Grown from Lithographically Defined Nanoparticles,” Jpn. J. Appl.
Phys. 43, 1356–1358 (2004).
[10] J. L. Johnson, “Non-Redox Iron Release Kinetics of Horse Spleen Ferritin,” Hon-
ors Thesis, Department of Chemistry and Biochemistry, Brigham Young Univer-
sity (1995).
[11] D. D. Brosnahan, “Phosphate and Ferritin Iron Deposition,” Honors Thesis,
Department of Chemistry and Biochemistry, Brigham Young University (2000).
[12] J.-M. Bonard, P. Chauvin, and C. Klinke, “Monodisperse Multiwall Carbon
Nanotubes Obtained with Ferritin as Catalyst,” Nano Letters 2, 665–667 (2002).
[13] M. Tominaga, A. Ohira, A. Kubo, I. Taniguchi, and M. Kunitake, “Growth of
carbon nanotubes on a gold (111) surface using two-dimensional iron oxide nano-
particle catalysts derived from iron storage storage protein,” Chem. Commun.
pp. 1518–1519 (2004).
[14] G.-H. Jeong, S. Suzuki, Y. Kobayashi, A. Yamazaki, and K. Homma, “Effect of
nanoparticle density on narrow diameter distribution of carbon nanotubes and
particle evolution during chemical vapor deposition growth,” J. App. Physics 98,
124311 (2005).

BIBLIOGRAPHY 33
[15] D. Xu, “Atomic Force Conductivity Measurements of Single Ferritin Molecules,”
Masters Thesis, Department of Physics and Astronomy, Brigham Young Univer-
sity (2004).

Index
Agglomeration, 7Amalgamation, 7Annealing, 19Apoferritin, 5Atomic-Force Microscopy (AFM), 10
Chemical Vapor Deposition (CVD), 3
Ferritin, 5Ferritin deposition, 15Ferritin, Image, 6
High-Resolution Transmission Electron Mi-croscopy (HRTM), 11
Holoferritin, 5
Nanotubes, Background, 2Nanotubes, Image, 2
Plasma Cleaner, 18
Scanning Transmission Electron Microscopy(STEM), 11
Single-Walled Nanotubes (SWNT), 2Standard deposition, 15
Transmission Electron Microscopy (TEM),11
34


![A Comparative Study of Iron-Based Film Deposition from Iron ......In particular, deposition of iron from Fe(CO)5 was obtained by W laser excitation [5,6] and by laser- induced thermal](https://img.pdfslide.us/doc/110x75/60ed256742a0b709a95b26a3/a-comparative-study-of-iron-based-film-deposition-from-iron-in-particular.jpg)