Embed Size (px)
DESCRIPTION
Biological Data in AWQMS (and WQX). Biological Entities. There are three entities (i.e. types of records) that can hold biological data : Results: The measurements, counts, or lab results relating to a particular species Metrics: - PowerPoint PPT Presentation
Citation preview
Biological Data in AWQMS (and WQX)
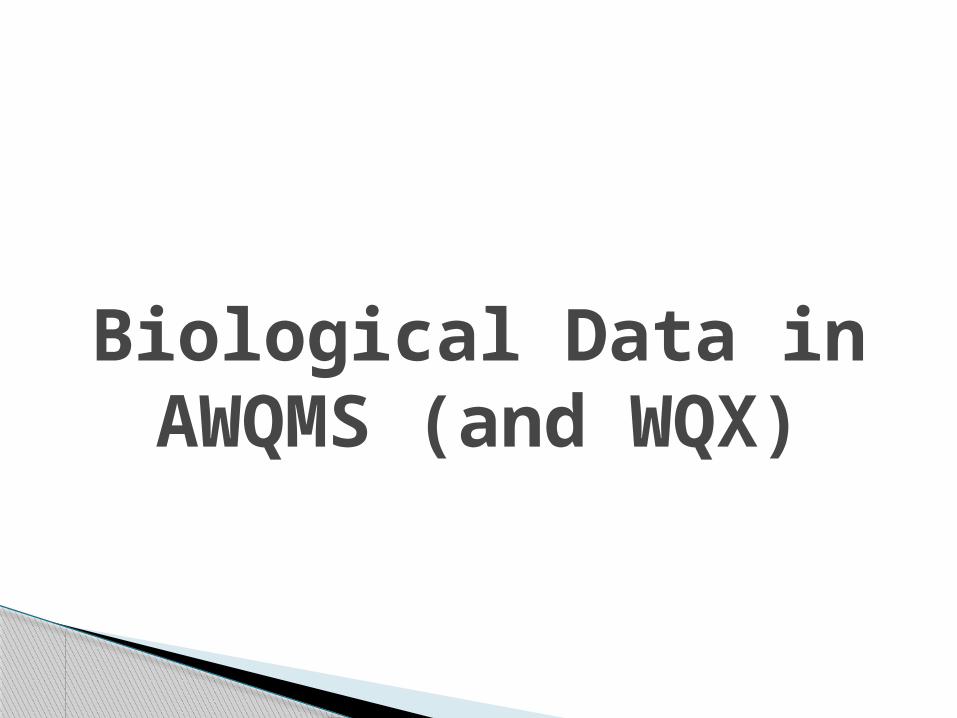
There are three entities (i.e. types of records) that can hold biological data:
◦ Results: The measurements, counts, or lab results relating to a
particular species
◦ Metrics: The individual values and scores that make up a biological
assessment (for a specific monitoring location)
◦ Indexes: The overall biological assessment score (for a specific
monitoring location)
Biological Entities

Results Metrics Index
In general terms…◦ Results are used to calculate Metric Values and Scores◦ Metric Scores are used to calculate an overall Index
Score.
There are relationships between all of these entities in WQX (so they can be linked to each other).
Data Flow
Used To Calculate
Used To Calculate

How These Entities are Related
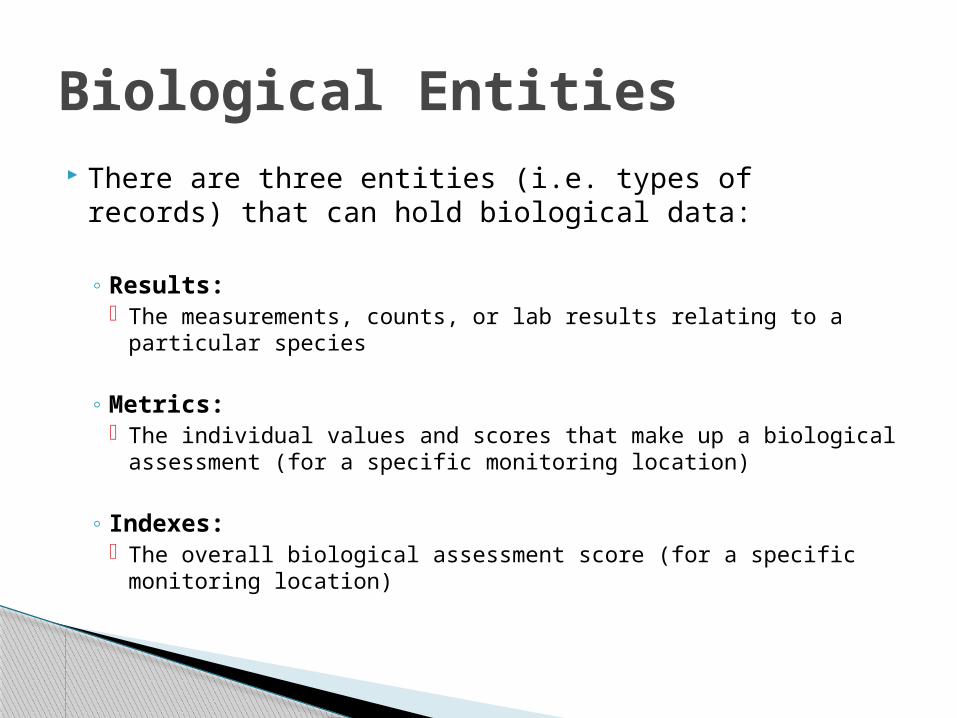
Results and Metrics must relate to an Activity
The Activity provides information about when, where, and how the biological samples were collected, as well as the Assemblage Sampled.
Each Activity must include an Activity ID, which is completely unique within your organization.◦ e.g. “BEARRV23-2013/05/04-FISH2”
Activities

Activity ExamplesActivity 1 Activity 2 Activity 3
Project ID TRIB-2013 LAKES-2013 LAKES-2013
Monitoring Location ID BEARRV23 BEARLK17 BEARLK12
Activity ID BEARRV23-2013/05/04-FISH2 BEARLK17-2013/05/04-PZ BEARLK17-2013/05/04-
Activity Type Sample-RoutineSample-Integrated Vertical Profile
Sample-Composite Without Parents
Media Tissue Biological Biological
Activity Start Date 5/4/2013 5/4/2013 5/4/2013
Assemblage Sampled Fish/Nekton Phytoplankton/Zooplankton Benthic Macroinvertebrates
Sample Collection Method ID
GRE:Fish GRE:Diatoms GRE:Sediment
Sample Collection Equipment
Backpack Electroshock Pump/Bailer Petite Ponar Grab
Toxicity Test Type Acute

You indicate that an Activity contains biological Results by setting the Activity Media to "Biological" or "Tissue".
Then you provide a Biological Intent (on each Result) to indicate the type of biological result being provided.
When the Activity Media is "Tissue" then the Biological Intent must also be "Tissue"
Results
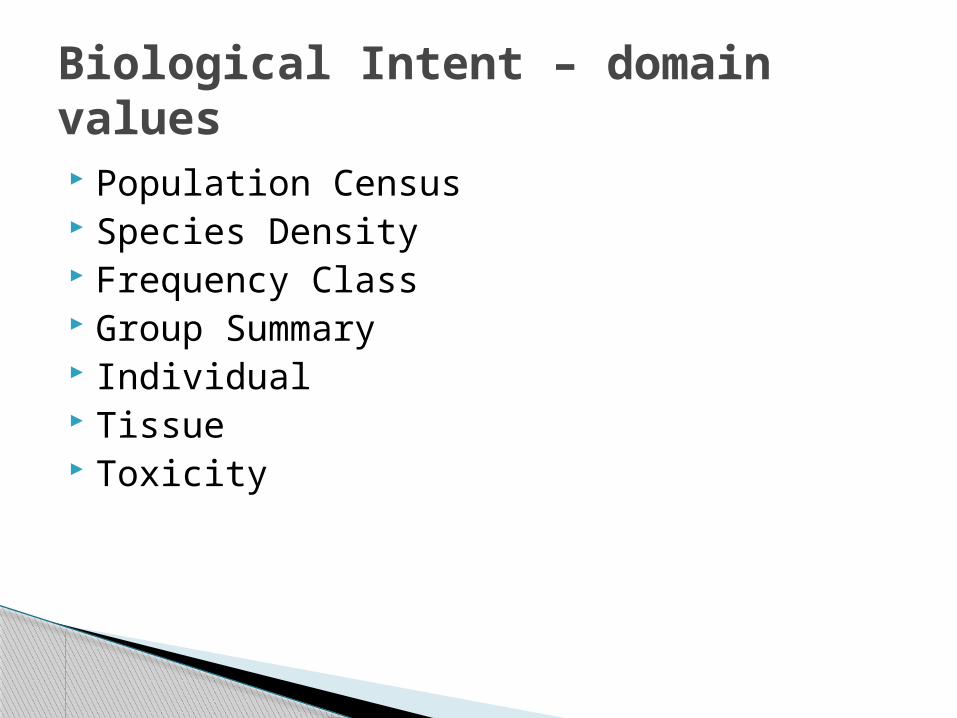
Population Census Species Density Frequency Class Group Summary Individual Tissue Toxicity
Biological Intent – domain values
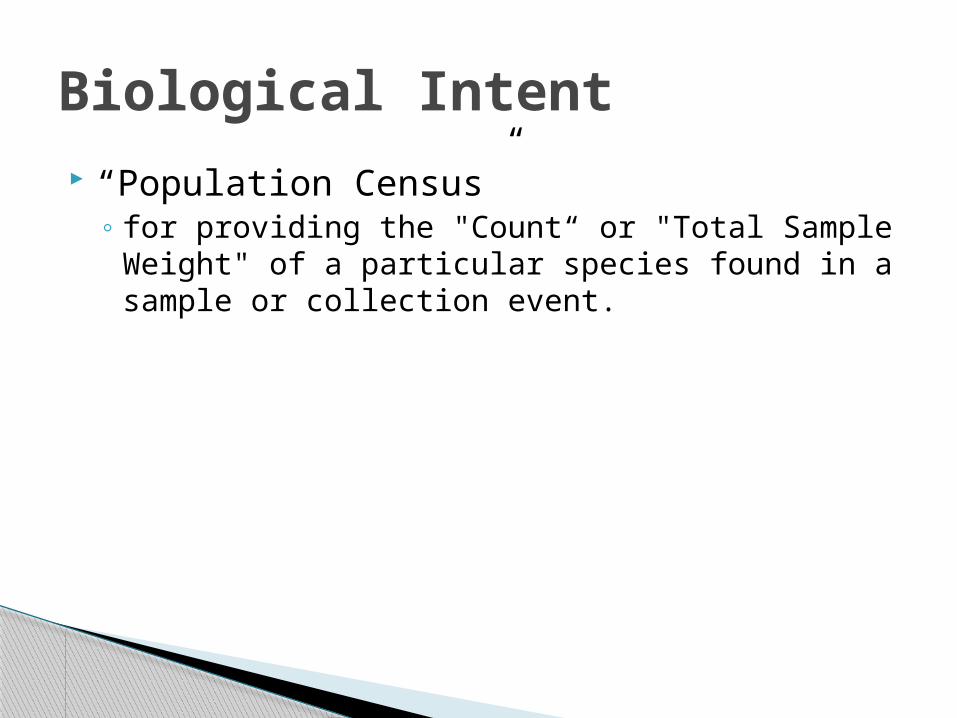
“Population Census”◦ for providing the "Count“ or "Total Sample Weight"
of a particular species found in a sample or collection event.
Biological Intent
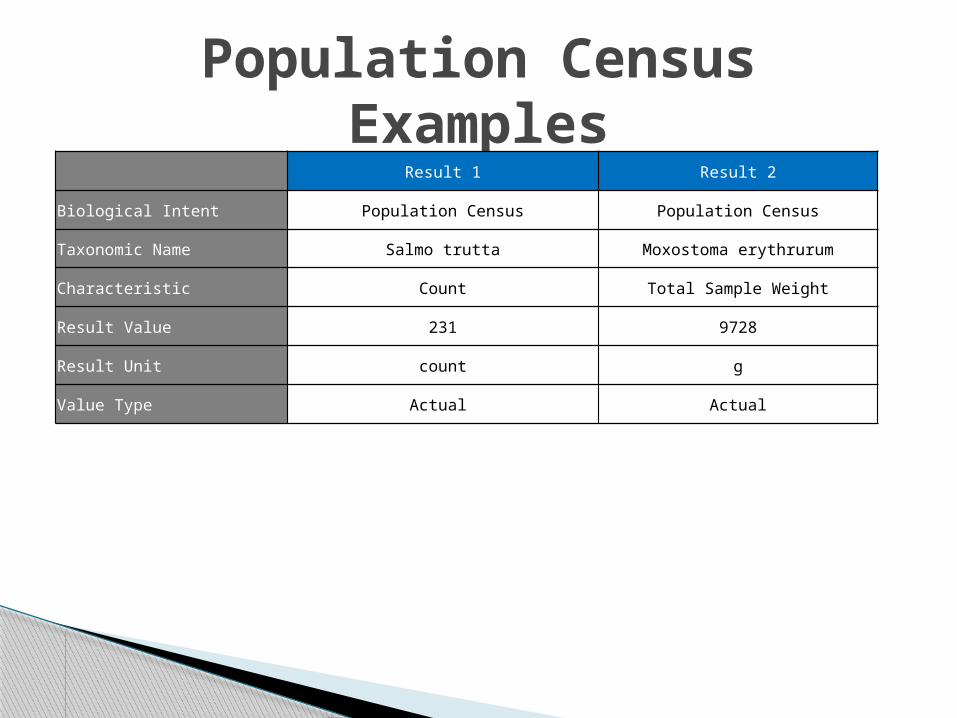
Population Census Examples
Result 1 Result 2
Biological Intent Population Census Population Census
Taxonomic Name Salmo trutta Moxostoma erythrurum
Characteristic Count Total Sample Weight
Result Value 231 9728
Result Unit count g
Value Type Actual Actual

“Species Density” (new)◦ for providing the “Density“ or “Relative Density”
of a particular species found in a sample.
Biological Intent

Species Density ExamplesResult 1 Result 2
Biological Intent Species Density Species Density
Taxonomic Name Cheumatopsyche Anabaena
Characteristic Relative Density Density
Result Value 43.7 20.9
Result Unit % #/l
Value Type Calculated Actual

“Frequency Class”
◦ for providing the "Count" of a particular species that fall within a particular frequency class.
◦ A frequency class is defined with one or more Frequency Class Descriptors and, in some cases, a Lower and Upper Bound.
Biological Intent

Types of Frequency Class Descriptors
Biological Abnormality
Lifestage Measured Characteristic
Sex
Deformities Adult Age Female
Emaciated Budded Diameter Hermaphrodite
Eroded Fins Egg Girth Indeterminate
Fungus Gravid Height Male
Hybrid Juvenile Length
Lesions Larva Length, Fork (Fish)
Other Nymph. Temperature, Tissue
Parasites Pupa Weight
Total Abnormalities Seedling Width
Tumors Subadult
You can combine descriptors, if needed, to define a frequency class. For example: Adult Male, Adult Female, etc.

Frequency Class ExamplesMeasured Characteristics
Result 1 Result 2 Result 3
Biological Intent Frequency Class Frequency Class Frequency Class
Taxonomic Name Catostomus commersoni Catostomus commersoni Catostomus commersoni
Characteristic Count Count Count
Result Value 7 3 1
Result Unit count count count
Value Type Actual Actual Actual
Frequency Class Descriptor Length Length Length
Frequency Class Descriptor
Frequency Class Lower Bound 0 20 40
Frequency Class Upper Bound 20 40 60
Frequency Class Unit cm cm cm

Frequency Class ExamplesLife Stage & Sex
Result 1 Result 2
Biological Intent Frequency Class Frequency Class
Taxonomic Name Catostomus commersoni Notemigonus crysoleucas
Characteristic Count Count
Result Value 4 7
Result Unit count count
Value Type Actual Actual
Frequency Class Descriptor Adult Adult
Frequency Class Descriptor Male Female
Frequency Class Lower Bound
Frequency Class Upper Bound
Frequency Class Unit
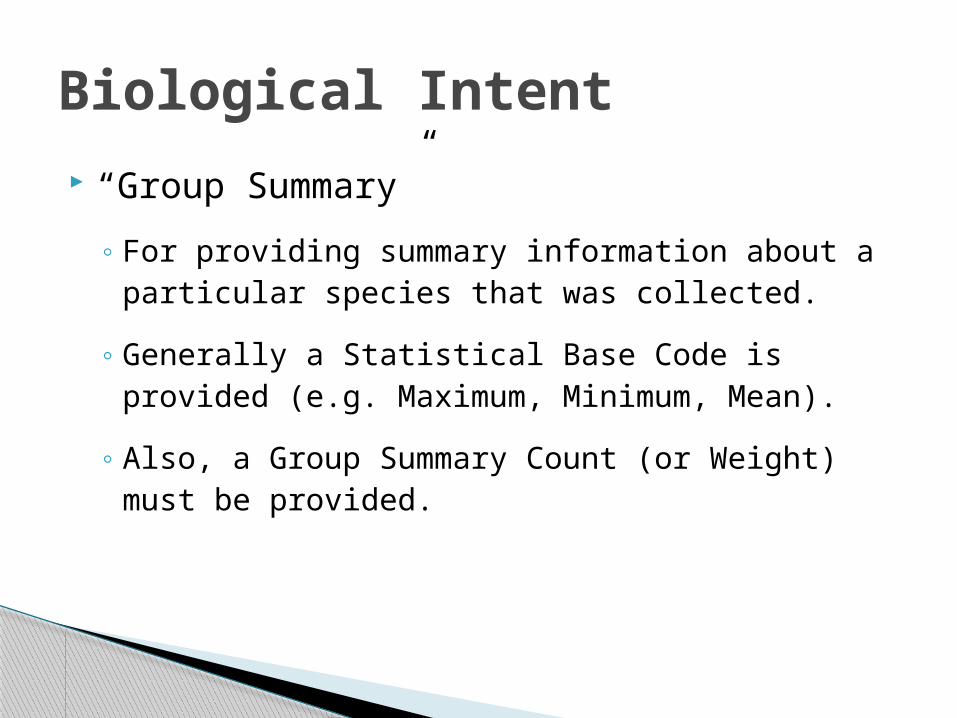
“Group Summary”
◦ For providing summary information about a particular species that was collected.
◦ Generally a Statistical Base Code is provided (e.g. Maximum, Minimum, Mean).
◦ Also, a Group Summary Count (or Weight) must be provided.
Biological Intent
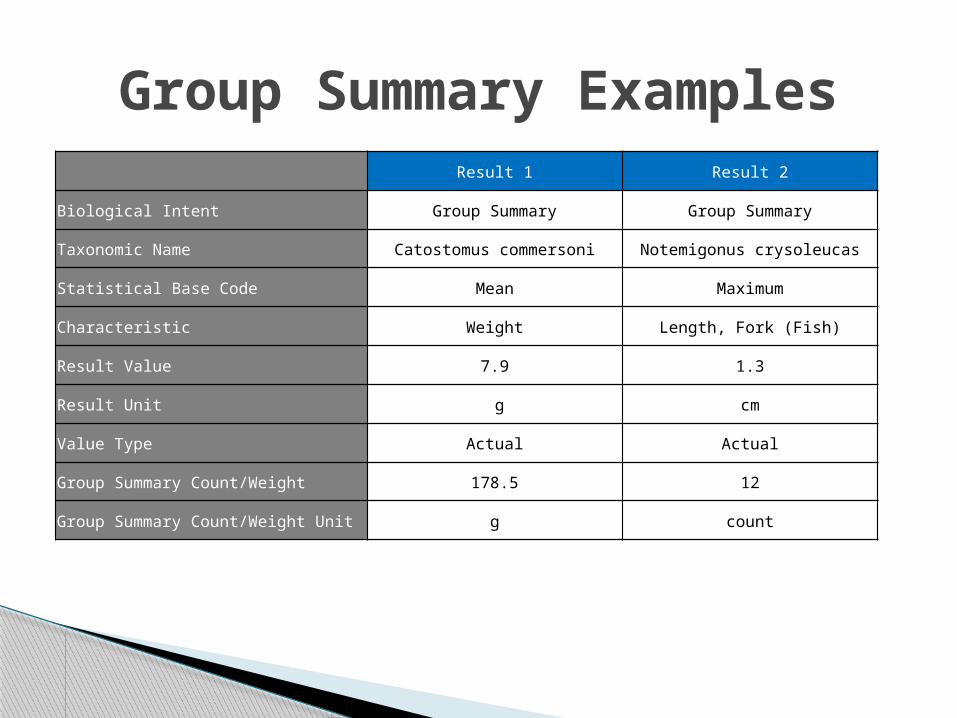
Group Summary ExamplesResult 1 Result 2
Biological Intent Group Summary Group Summary
Taxonomic Name Catostomus commersoni Notemigonus crysoleucas
Statistical Base Code Mean Maximum
Characteristic Weight Length, Fork (Fish)
Result Value 7.9 1.3
Result Unit g cm
Value Type Actual Actual
Group Summary Count/Weight 178.5 12
Group Summary Count/Weight Unit g count

“Individual”
◦ For reporting measurements from a single individual.
◦ A Biological Individual ID (e.g. #1, #2, …) is provided with each Result to identify which individual.
That way a suite of measurements (e.g. length, weight, girth) can be linked to each specific individual in the group.
Biological Intent
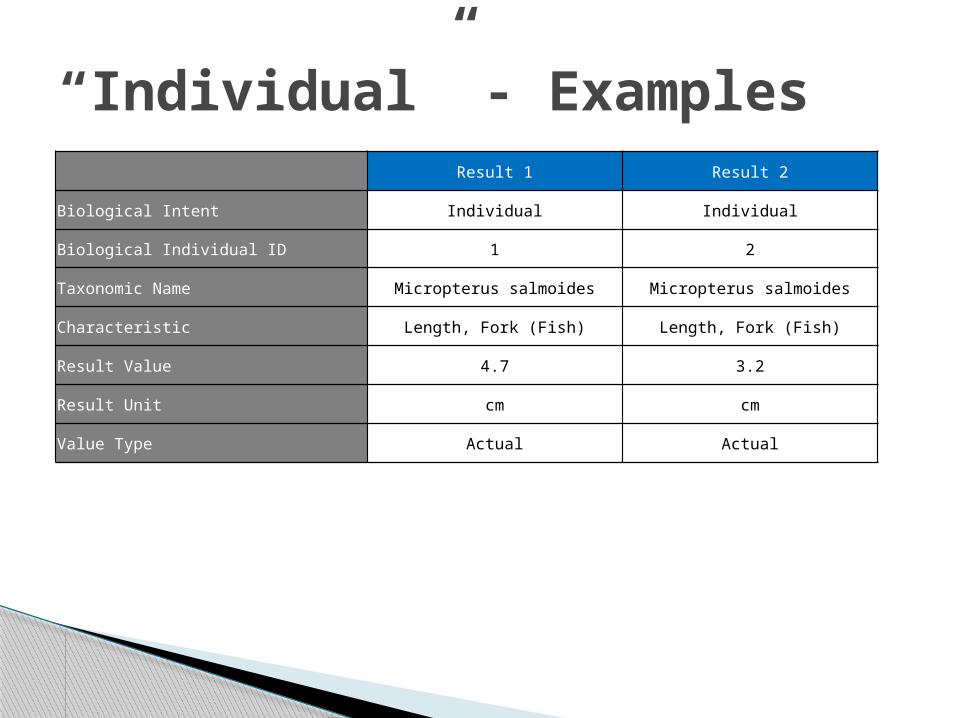
“Individual” - ExamplesResult 1 Result 2
Biological Intent Individual Individual
Biological Individual ID 1 2
Taxonomic Name Micropterus salmoides Micropterus salmoides
Characteristic Length, Fork (Fish) Length, Fork (Fish)
Result Value 4.7 3.2
Result Unit cm cm
Value Type Actual Actual

“Tissue”
◦ For reporting lab results on a tissue sample.
◦ “Sample Tissue Anatomy Name” must be provided to identify the body part from which the tissue sample was taken.
Biological Intent

Tissue ExamplesResult 1 Result 2
Biological Intent Tissue Tissue
Biological Individual ID 1 2
Sample Tissue Anatomy Muscle/Muscle Tissue Fish Fillet, Homog., Skin On
Taxonomic Name Selar crumenophthalmus Micropterus salmoides
Characteristic Arsenic 2,4-Dinitrotoluene
Sample Fraction Total
Result Value 2500
Result Unit ug/kg
Value Type Actual Actual
Detection Condition Not Detected
Detection/Quantitation Limit Type Method Detection Level
Detection/Quantitation Limit Value 111
Detection/Quantitation Limit Unit ug/kg
Analytical Method ID ICP-AES SOLIDS 1625(T)
Analytical Method Context HI301H_WQX USEPA

“Toxicity”
◦ For reporting the results of toxicity testing on a species.
Biological Intent

Toxicity (examples)Result 1 Result 2
Biological Intent Toxicity Toxicity
Taxonomic Name Pimephales promelas Ceriodaphnia dubia
Characteristic Survival Reproduction
Result Value 38.5 10
Result Unit % count
Value Type Calculated Calculated
Analytical Method ID 1000.0 1002.0
Analytical Method Context USEPA USEPA

A Metric must be linked to an Activity.◦ The Activity can be the same one that was used
for the Biological Results, or it can be a new one (with its own Activity ID)
A Metric may be linked to an Index◦ If you are using a product like WQX Web, this
means your Indexes must be loaded before your Metrics
A Metric has a “Score” (which is required) and a “Value” (which is optional).
Metrics

Each Metric has a “Metric Type” which identifies what is being measured/scored.
◦ "Metric Type" is equivalent to a “Characteristic" on a Result.
A Metric Type has an ID and a Context to uniquely identify it.
If the Context is the same as the Organization ID (for your file) then the Metric Type ID can be any value that your organization chooses to create.
◦ Otherwise…
Metric Type

There are a small set of Metric Types that are provided under the “USEPA” Context
Metric Type
ID Context
% Burrower Taxa USEPA
% Chironomid Taxa USEPA
% Clinger Taxa USEPA
% Ephemeroptera Taxa USEPA
% EPT Individuals USEPA
% EPT Taxa USEPA
% Individuals in top 3 taxa USEPA
% Individuals in top 5 taxa USEPA
% Non-Insect Individuals USEPA
% Non-Insect Taxa USEPA
% PTV 0-5.9 Taxa USEPA
% PTV 8-10 Taxa USEPA
% Tolerant Individuals USEPA
Clinger Taxa Richness USEPA
Ephemeroptera Taxa Richness USEPA
EPT Taxa Richness USEPA
Intolerant Richness USEPA
Scraper Richness USEPA
Shannon Diversity USEPA
Shredder Richness USEPA
Total Taxa Richness USEPA

Metric ExamplesMetric 1 Metric 2
Metric Type ID* 2000-DE-%Clingers Total Taxa Richness
Metric Type Context 21DELAWQ_WQX USEPA
Metric Score 6 4.482758
Metric Value 59 26
Metric Value Unit % count
Index ID BEARRV23-2013/05/04-FISH2
* Metric Type meta-data can also include citations and documentation on the formula and scale (e.g. 1-100) for the score

An Index is the parent of many Metrics◦ Although, technically, it can stand alone.
An Index does not relate to an Activity◦ so the “when, where, and how” is part of the
Index record
An Index has a “Score”, but does not have a “Value”.
Indexes
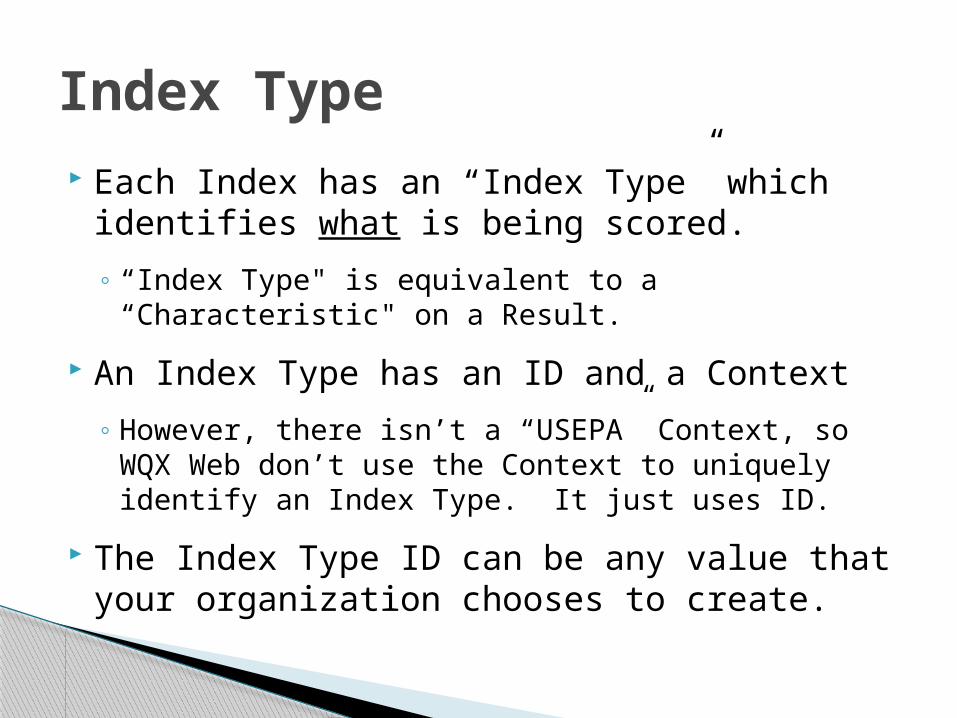
Each Index has an “Index Type” which identifies what is being scored.
◦ “Index Type" is equivalent to a “Characteristic" on a Result.
An Index Type has an ID and a Context
◦ However, there isn’t a “USEPA” Context, so WQX Web don’t use the Context to uniquely identify an Index Type. It just uses ID.
The Index Type ID can be any value that your organization chooses to create.
Index Type

Index ExamplesIndex 1 Index 2
Monitoring Location ID VERDE_RIVER_164 BEARRV23
Index Calculated Date 06/05/2001 05/04/2013
Index ID 30841 BEARRV23-2013/05/04-FISH2
Index Type ID* IBI Stream Fish Index
Index Type Context 21ARIZ_WQX IDEQ_WQX
Index Score 75.0369517 82.65292
* Index Type meta-data can also include citations and documentation on the scale (e.g. 1-100) for the score