Embed Size (px)
Citation preview
BIOLOGICAL CONTROL OF SPIDER MITES IN WALNUTS
Stephen C. Welter, Walt Bentley, and Frances Cave
ABSTRACT
Early season predator-prey ratios for phytoseiids to spider mites failed to successfully predict
effective biological control in a walnut orchard in King’s county. One of the more surprising
findings was the absence of the predatory mite, G. occidentalis, which has been considered the
dominant mite predator in walnuts for more than 35 years. What is not clear is how widespread
is this unexpected absence of this predator in other walnut orchards in King’s county or other
growing regions of CA. Similarly, the reason for its absence is also not known at this time. The
dominant predator in the early portion of the growing season was Amblyseius similoides with
Euseius spp increasing as the season progressed. Preliminary efforts were started in 2011 to
determine if mid-season releases of G. occidentalis could re-establish this species of predators in
an unsprayed walnut orchard. The effects of late leafing cultivars of walnuts on mite
colonization did not appear to be a significant obstacle for either the spider mites or phytoseiids
nor did it appear to differ significantly from other deciduous tree crop systems. These data
suggest that spider mite management in walnuts needs to be carefully re-evaluated relative to its
assumptions and possible changes in its current management programs, e.g. changes in
insecticide use patterns. To realize the full potential benefits of pheromone mating disruption for
codling moth, we need to be able to rely on the effective biological control of other pest species,
e.g. spider mites, that have traditionally been observed in non-disrupted orchards.
INTRODUCTION
The recent development of pheromone mating disruption for codling moth held promise for less
disruption of secondary pests, such as spider mites, for walnut growers. While this has proven
true in some cases, it has not been universal even in walnut growers who were not treating with
insecticides that may be eliminating the predatory mites in the family Phytoseiidae. The lack of
biological control of spider mites has been reported as more common in the central and more
southern portions of the Central Valley, but the data are currently just anecdotal. Biological
control of the spider mites, Pacific spider mite and the two spotted mite, has traditionally relied
on the suppressive effects of the western orchard predatory mite, Galendromus (=Metaseiulus)
occidentalis. In earlier research programs, G. occidentalis was always reported as the dominant
species driving biological control of spider mites in many deciduous tree fruit systems including
walnuts.
California Walnut Board 247 Walnut Research Reports 2011
Two areas were identified as potential reasons why biological control of spider mites in recent
years was less reliable in non-disrupted orchards than expected, especially compared to other
deciduous crops such as apples. One difference between pome fruit and walnut systems is the
timing for leaf development early in the season compared to the time of emergence by spider
mites from their overwintering state. It had been proposed that the early emergence of spider
mite populations in the spring was largely unsuccessful due to the lack of foliage. A similar
emergence by the predatory mites would also be unsuccessful if its host spider mite populations
failed to survive. The alternative means for colonization in walnuts by spider mites might also
include spider mite ballooning in on silk threads from adjacent crops such as almonds which leaf
out earlier than walnuts.
The most common pattern of colonization in crops such as almonds or pears is the early spider
mites emerge from under the bark of the tree or from the ground and move into the central
interior portions of the tree canopy. Over time, the population increases in number and colonizes
higher into the tree canopy as well as into the more exterior portions of the canopy.
Our goals for 2011 were to 1) document the spatial pattern of emergence for the overwintering
populations 2) determine the species of pest and predator that were emerging over time and 3)
an unexpected goal to see if populations of G. occidentalis could be established later in the
season using artificial inoculative releases of predatory mites. For objective 1, if no colonization
of the central portion of the trees was observed early in the season combined with later
infestation on the outside portions of the tree canopy, then we would have assumed that
populations of spider mites from outside of the walnut orchard were important contributors to
pest outbreaks. Conversely, if the more traditional pattern of colonization was observed, then
our efforts to managing internal populations would need to remain the focus.
OBJECTIVES
1. Evaluate dynamics of spider mite and predator mite populations in walnuts
a. Early season migration from ground cover into trees (movement on tree trunk)
b. Population distribution and development of spider mites and their associated
predators in canopy
2. Identify predator mite species complex in walnuts
3. Monitor results of late season G. occidentalis releases for re-establishing G. occidentalis
populations in walnuts
California Walnut Board 248 Walnut Research Reports 2011
PROCEDURES
All studies were conducted in a mature walnut orchard located in eastern Kings County, CA
(36°25'1.10"N 119°32'47.87"W) and focused on two blocks consisting of Vina and Chandler
cultivars. Trees in the Vina block were approximately 30 to 35 feet tall, those in the Chandler
block were younger, smaller trees ranging from 20 to 28 feet. Our sample areas received no
insecticide or miticide treatments during this study. While setting up two areas for sampling
doubled our original number of replicates, we felt that the inconsistency of areas even within an
orchard for developing spider mite populations warranted spreading our risk across two
locations.
Evaluations of spider mite and predator mite populations.
Movement between ground and trees. A total of 20 trees were selected to monitor for
movement of mites between ground and tree canopy. Ten trees in each of Vina and Chandler
plantings were marked with half the tress located north and half in south areas of each cultivar.
Mite movement from was monitored by creating an intercept trap with double-sided sticky tape
around the circumference of the tree trunk. A first layer of duct tape (3M Corporation,
Minneapolis, MN) was wrapped around the tree trunk between two and three feet from the
ground to provide a relatively broad and uniform surface on which to place the actual trapping
tape. A single strip of 3/4 inch wide Scotch ® Permanent Double Sided Tape (3M) was centered
on the duct tape and wrapped around the tree circumference. Tape was replaced on a two week
schedule beginning 4/6/11 and ending 8/3/11. Tape collection was performed by removing the
tape in approximate 6 inch sections, placing it on engineer’s graph paper and covering the page
with a piece of transparency paper (3M). Samples were returned to the lab where the tape was
examined under a dissecting microscope and the number of spider mites and predator mites was
recorded. The transparency film could not be removed from the tape without damaging the mite
sample. Though we were able to identify and count the broad categories of “spider mites” and
“predator mites” through the transparency, we could not remove specimens from the tape to
prepare slide mounts and make species identifications. The entire length of each tape sample
was examined on the first collection. Subsequently, randomly selected one-inch sections totaling
1/3 of the length of each sample tape were counted. Mite numbers are reported as average
number per inch.
Tree canopy samples. Leaf samples were collected from a tree immediately adjacent each tape
sample tree. This was done to avoid any potential impact on migration from the ground cover up
the tree trunk that might have been caused by the barrier of the tape samples. Leaf samples were
taken from six areas of each tree: low canopy and high canopy at center, low south, high south,
low north and high north sides of each tree. A long reach extending bypass pruner was used to
cut five leaves from each of the high sample areas. Samples in the Vinas were collected with the
California Walnut Board 249 Walnut Research Reports 2011
added height provided by a pruning tower. Samples from the Chandlers, were all taken from the
ground because the tree spacing, canopy, and irrigation prevented reasonable access with the
tower. With the extending pruners, high samples in the Chandlers could be collected from about
16 to 18 feet. Low samples were generally collected by hand. One penultimate leaflet was
removed from each leaf and the five leaflets of each sample were placed in a labeled paper bag.
Bags were returned to the lab in an ice chest and refrigerated until processed. Leaf samples were
collected six times from both Vina and Chandler blocks at biweekly intervals from 5/4/11 to
7/19/11. Samples from 8/3 to 8/31 were continued only in the Vina block.
Leaf samples were processed in the lab by examining both sides of each leaflet under a
microscope. All motile spider mites and predator mites were counted, and all predator mites
were preserved on slide mounts prepared with Hoyer’s media. Predator mites often hid in the
hairs where leaf veins joined the midrib. In order to find and isolate these predators, each vein
had to be cut at this junction to expose the cavity under or behind the hairs. Slides were later
examined and predator mites identified using the keys developed by Grafton-Cardwell, et al. (in
prep).
G. occidentalis release and recovery.
As the season progressed, we noted that G. occidentalis was rarely if ever found in our early
season samples. Obviously, these findings suggested that the populations of G. occidentalis had
been eliminated, but did not suggest the limiting factor. Since this area of the orchard would not
be receiving any insecticide or miticide treatments, we decided to try and re-establish a
population of G. occidentalis. Galendromas occidentalis (Nesbitt) was obtained from Biobest,
USA (McFarland, CA) for release into single tree replicates in the Vina block. Release trees
were located two rows (50 feet) north of each of the ten trees used for the ongoing canopy
samples. A release was made into five trees of the south set on 7/28/11 and 8/10/11, and a single
release into five trees for the north set on 8/10/11. Predator availability was very limited at the
earlier date, thus, we opted to release into fewer trees at that time. The predators were supplied
on cut bean plants and released by letting the predators crawl off the plant cuttings that we
placed in the central part of the tree. The number of predators released was estimated at 20 per
tree for five trees on 7/28/11 and 180 per tree for all 10 trees on 8/10/11.
We continued to monitor the original 10 trees as our “non-release” replicates. Original leaf
sample protocols were continued for this set. The 10 newly designated predator release trees
were sampled from two canopy areas only, center high canopy and south low canopy, by
collecting five leaflets from each area. Leaf samples were collected 8/3/11, 8/17/11, and
8/31/11. All spider mites and predator mites were counted and predator mites preserved as
described above.
California Walnut Board 250 Walnut Research Reports 2011
A final leaf sample was taken 10/12/11 from the 10 non-release and 10 release trees to determine
if predator species composition had changed and if G. occidentalis remained in the system. Five
leaflets were taken from each of three sample areas (high canopy center, low canopy north and
south) of each of the 20 trees. Leaves were processed to count, preserve and identify predator
mites only using the techniques described earlier.
RESULTS
Evaluations of predator mite movement and within canopy distribution
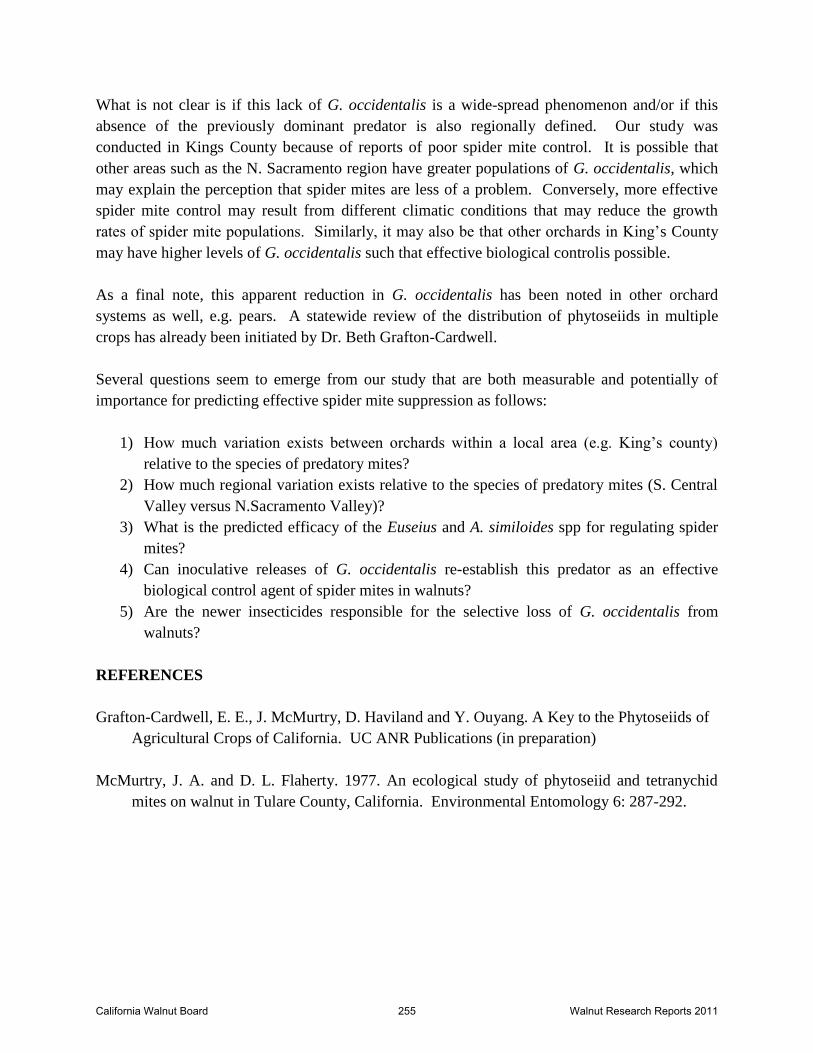
Movement on tree trunk. Mite movement was detected on sticky tape barriers placed on tree
trunks with the first samples we collected in early April. Both varieties of walnut showed a
similar pattern with both spider and predator mite capture rising throughout April and peaking
around the 1st of May (Figure 1). Capture patterns were similar in both cultivars. While it
appears that the Chandler block had greater numbers of both spider mites and predator mites
early in the season, these differences were not significant for the spider mites (F=1.05, P=0.3),
though were significant for the predator mites (F=7.5, P=0.01). Movement continued to be
detected at reduced levels, particularly for the predator mites, into August. Mite counts for these
surveys were standardized to number of mites per linear inch of sticky trap. Circumference of
the trees varied, with the Vinas averaging 25 inches the Chandlers averaging 21 inches. Early
season ratios (Figure 1C) suggested that adequate predatory mites were not emerging from the
overwintering sites in early to mid May at a rate that would be predicted to control spider mite.
Ratios of spider mites to predators peaked at ca. 175:1 in late May. However, the absolute
counts are difficult to interpret relative to risk of outbreaks in the canopy given the level of
foliage in the tree canopy versus the surface area of the sticky tapes.
Leaf samples. Canopy leaf samples were started in early May when trees had leafed enough to
be sampled. Leaf counts for the Chandler block are shown in Figure 2. Spider mites counts on
the leaves were low throughout the entire sample period. From 5/4 through 7/19/11, cumulative
number counted totaled only 7 spider mites. In the same time period, phytoseiid mite counts
totaled 212. Leaf samples were terminated after 7/19/11 in the Chandlers as there were not
enough spider mites to warrant additional samples. We cannot determine the reason there was
no spider mite outbreak in the Chandlers, given the high ratio of spider mjtes to predator mites in
the tape samples and the lack of evidence that the phytoseiid mites recovered are effective
predators of web-spinning mites. While we cannot attribute this to biocontrol, the reasons
remain unclear.
Leaf samples from Vina block did indicate a low level of spider mite infestation, but even this
looked very similar to the Chandler samples (Figure 3). A total of 60 spider mites and 314
phytoseiid mites were counted through 7/19/11. A small increase in distribution of spider mites
(percent of leaflets with mites) was noted by 7/19 (Figure 4) and was of concern as phytoseiids,
California Walnut Board 251 Walnut Research Reports 2011
which were broadly present through the canopy were not reducing the spider mite population.
Subsequent samples in August clearly indicated the phytoseiids present did not have a
controlling impact (Figure 4). The higher densities of predators compared to spider mites in
mid-June should have foretold of a very successful biological control for the year for the Vina
block. As subsequent data revealed, spider mites easily outstripped the population size of the
predators resulting in levels requiring intervention with miticides for the rest of the orchard.
What is clear from these data is that the prescence of predatory mites without any regard to
species identity is not sufficient for pest management practioners to make adequate early season
decisions. As revealed in the following sections, the early season species of predators were
primarily from the genus Amblyseius, which is a facultative predator capable of surviving on
pollen. Early season production of high levels of pollen by the walnut catkins is expected to
provide an ample supply of resources (pollen) for these predators to reach high numbers, but they
may in fact prove to be ineffective predators for spider mites in walnuts.
Distribution of mites through the canopy is indicated in Figures 5 – 7. As soon as the phytoseiid
population in the canopy reached consistent detection levels, they were widespread through all
sample areas of the tree – high and low canopy, center and periphery of the tree. Spider mites
were present in low numbers across all areas of the tree canopy until August when the population
increased dramatically. Spider mite infestation is typically clumped as a single female will feed
and oviposit in a small area. In sampling, this leads to highly variable counts on leaf samples.
While the data analysis for spider mites failed to distinguish any statistical difference in their
distribution in the canopy, there is a clear spike in spider mite numbers at the center of the tree
(Figure 7). Similarly, detection of spider mites or predators from the early portion of the season
through May was restricted to the low portions of the canopy. The pattern of infestation did not
appear to be dramatically different from colonization patterns observed in other systems. The
slow increase in percent infested leaves by spider mites starting in around mid-late June
foreshadowed the dramatic increase in numbers that would follow in August.
Phytoseiid mite identification.
Taxonomic keys for the Phytoseiidae are based on adult females. Thus, the identification of our
samples is based on a fraction of the total predaceous mites collected during this study. None the
less, our estimates of relative proportions should roughly correspond to the actual field
population structure. All slide mounted specimens were obtained from leaf samples, as mites
could not be removed intact from the tape intercept barrier. The vast majority of phytoseiids we
have collected and identified to date are either Amblyseius similoides Buchelos & Pritchard or
Euseius spp. Two species of the genus Euseius appear in our samples, E. tularensis Congdon
and E. quetzali McMurtry. As these species are difficult to separate, further review of the
samples should be conducted to verify the identifications, and thus, we will refer to these
collectively as Euseius spp. for this report. Only one specimen of G. occidentalis has been
positively identified from samples collected prior to 8/3/11.
California Walnut Board 252 Walnut Research Reports 2011
The population structure in our samples differs significantly from that described by McMurtry
and Flaherty (1977) in walnut orchards in the adjacent Tulare County. They found four
phytoseiid species in their samples; Typhlodromus occidentalis Nesbitt, Typlodromus citri
Garman and McGregor, Amblyseius hibisci (Chant) and a relatively less frequent component,
Typhlodromus caudiglans Schuster. (Note that taxomonic revisions have resulted in many
species being assigned to new or different genera. Thus, T. occidentalis is currently named
Galendromus occidentalis (Nesbitt).)
Little is known about the phytoseiid mites dominating these orchard samples. Species of
Euseius are generalist feeders consuming pollen, non-webbing mites, small insects and plant sap
and demonstrating no association with Tetranychus mites. Amblyseius similoides is also a
generalist feeder with no know associations with spider mites. Potential food resources we
observed on our leaf samples included pollen, tydeiid mites and thrips. With very favorable
ratios of phytoseiid mites to spider mites, it appears these species are not capable of impacting
the spider mite population.
G. occidentalis release and recovery
In July it appeared that the spider mite population in the Vina block was becoming detectable at
a sustained low level density. Our leaf samples indicated only 0.07 spider mites per leaflet, but
this had doubled from our previous sample. Furthermore, when we looked at the distribution of
mites in the Vina leaf samples, by late July spider mites were being found in an increasing
percent of leaf samples collected, even though predator mites were detected in more than 70% of
the leaf samples from late June onward (Figure 4). As G. occidentalis did not appear to have
much presence in the orchard, but is known as an effective predator of web-spinning mites, we
decided to release and attempt establishment. G. occidentalis was released into a total of 10
trees, each located 50 feet from an ongoing leaf sample tree. Releases were made on two dates,
the first into only five trees because of very limited availability of the predators, and the second
release two weeks later into all 10 designated release trees.
The spider mite population in the entire Vina block was increasing rapidly by late July, and the
grower applied a miticide in early August to the rest of the block, leaving our study areas
untreated.
Leaf samples taken three times following the start of releases, did not indicate any decline in the
spider mite population growth (Figures 8 and 10A). From August 3 to August 31, the spider
mite counts on non-release tree samples increased 45-fold while those on release tree samples
increased 6-fold. The number of predators on the same leaf samples decreased by about 30
percent in the non-release trees and increased by 50% in the release trees (Figures 8 and 10B).
The ratio of spider mites to predator mites was less than 5 to 1 on the release trees and only 0.6
California Walnut Board 253 Walnut Research Reports 2011
to 1 in the non-release trees on August 3. This ratio increased each sample period regardless of
treatment, though the increase was less pronounced in the release trees. On August 31, those
ratios were 16:1 in the release trees and 42:1 in non-release trees (Figure 10C). General
guidelines for G. occidentalis indicate spider mites will be controlled by this predator if there is a
ratio of 10 spider mites to 1 G. occidentalis. The time between release and our continuing
samples was short and perhaps inadequate for the released predators to propagate and distribute
enough to be detected in our samples. Clearly, control was not obtained in the three weeks that
we continued sampling. Sampling was terminated as the orchard approached harvest as access
with a pruning tower was no longer feasible.
We collected a final leaf sample on October 12th
, specifically to identify the phytoseiid species
complex that was present and compare it to mid season samples. Figure 9 shows the species
composition as a percentage of the total identifiable mites (adult females) collected. Of the 398
predators counted on leaf samples from 10/12/11, 197 were females that could be identified. Of
these, 76 were from the ongoing non-release trees and 121 were from the release trees. Samples
taken from the non-release trees on 7/3 and 7/19 were based on females of 82 and 96 specimens,
respectively. Two points are noted by this chart; 1) there was only a single specimen of G.
occidentalis found in the sample from 10/12, and this was recovered from a non-release tree; 2)
the relative proportion of the major species switches between the mid- and late season samples.
Thus, A. similoides represented 94% of the total phytoseiid sample in early July, but in October
represented only 21% of the sample. Conversely, Euseius spp. represented only 6% of the
phytoseiid mites in early July, but had grown to 78 % of the sample collected in October.
Theproportion of A. similoides to Euseius spp. was essentially the same in release and non-
release trees on 10/12/2011.
The spider mite and predator mite dynamic is a complex issue and one that has clearly changed
over the past four decades. G. occidentalis was an important component at one time because of
the selective advantage it had with resistance to organophosphates (OPs) at a time when the OPs
were a major part of a growers pest management program. It is possible that development of
new insecticides has changed this advantage, perhaps allowing additional species to establish
even though they may not be species relevant to spider mite control. Furthermore, some of the
newer chemistries may impact the predator mites and alter the dynamics that affect the biological
control of spider mites.
SUMMARY
Based on data from just one year, it does not appear that the colonization events of mites in
walnuts are dramatically different from those observed in other tree crops. The result obtained in
this study that was relatively unexpected was the near absence of G. occidentalis given the
widespread belief that effective spider mite control was achieved in walnuts from this predator.
California Walnut Board 254 Walnut Research Reports 2011
What is not clear is if this lack of G. occidentalis is a wide-spread phenomenon and/or if this
absence of the previously dominant predator is also regionally defined. Our study was
conducted in Kings County because of reports of poor spider mite control. It is possible that
other areas such as the N. Sacramento region have greater populations of G. occidentalis, which
may explain the perception that spider mites are less of a problem. Conversely, more effective
spider mite control may result from different climatic conditions that may reduce the growth
rates of spider mite populations. Similarly, it may also be that other orchards in King’s County
may have higher levels of G. occidentalis such that effective biological controlis possible.
As a final note, this apparent reduction in G. occidentalis has been noted in other orchard
systems as well, e.g. pears. A statewide review of the distribution of phytoseiids in multiple
crops has already been initiated by Dr. Beth Grafton-Cardwell.
Several questions seem to emerge from our study that are both measurable and potentially of
importance for predicting effective spider mite suppression as follows:
1) How much variation exists between orchards within a local area (e.g. King’s county)
relative to the species of predatory mites?
2) How much regional variation exists relative to the species of predatory mites (S. Central
Valley versus N.Sacramento Valley)?
3) What is the predicted efficacy of the Euseius and A. similoides spp for regulating spider
mites?
4) Can inoculative releases of G. occidentalis re-establish this predator as an effective
biological control agent of spider mites in walnuts?
5) Are the newer insecticides responsible for the selective loss of G. occidentalis from
walnuts?
REFERENCES
Grafton-Cardwell, E. E., J. McMurtry, D. Haviland and Y. Ouyang. A Key to the Phytoseiids of
Agricultural Crops of California. UC ANR Publications (in preparation)
McMurtry, J. A. and D. L. Flaherty. 1977. An ecological study of phytoseiid and tetranychid
mites on walnut in Tulare County, California. Environmental Entomology 6: 287-292.
California Walnut Board 255 Walnut Research Reports 2011
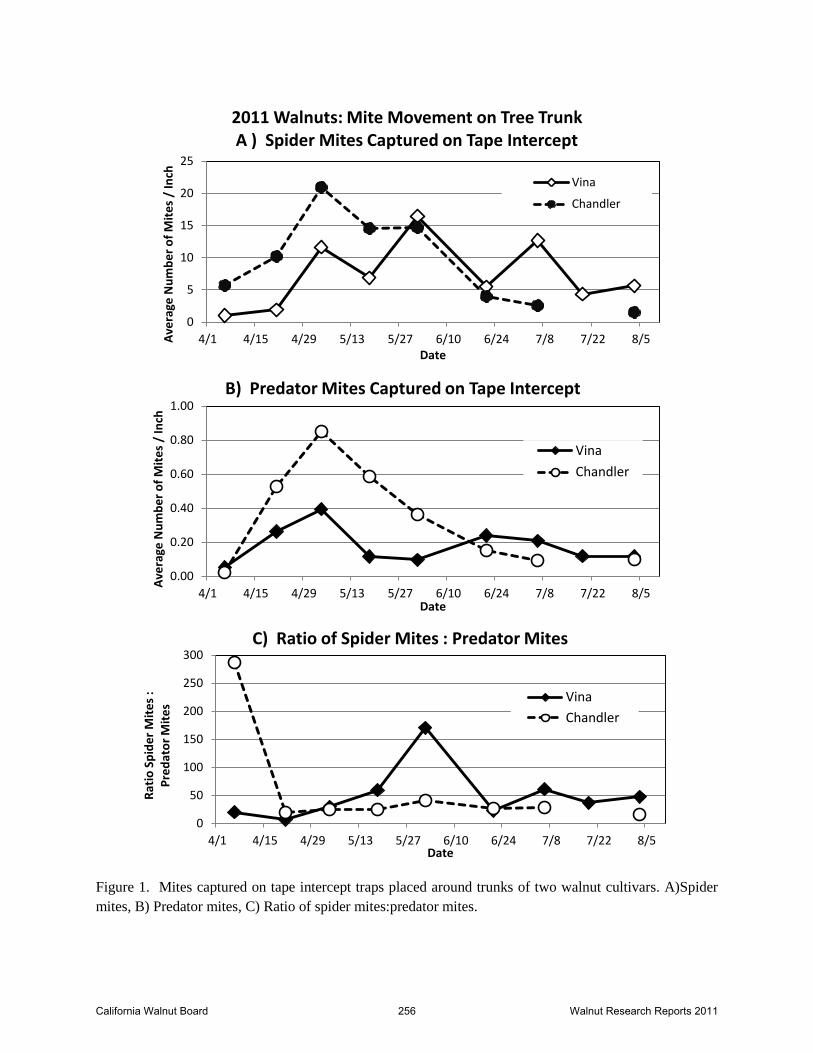
Figure 1. Mites captured on tape intercept traps placed around trunks of two walnut cultivars. A)Spider
mites, B) Predator mites, C) Ratio of spider mites:predator mites.
0
5
10
15
20
25
4/1 4/15 4/29 5/13 5/27 6/10 6/24 7/8 7/22 8/5 Ave
rage
Nu
mb
er
of
Mit
es
/ In
ch
Date
2011 Walnuts: Mite Movement on Tree Trunk A ) Spider Mites Captured on Tape Intercept
Vina
Chandler
0.00
0.20
0.40
0.60
0.80
1.00
4/1 4/15 4/29 5/13 5/27 6/10 6/24 7/8 7/22 8/5
Ave
rage
Nu
mb
er
of
Mit
es
/ In
ch
Date
B) Predator Mites Captured on Tape Intercept
Vina
Chandler
0
50
100
150
200
250
300
4/1 4/15 4/29 5/13 5/27 6/10 6/24 7/8 7/22 8/5
Rat
io S
pid
er
Mit
es
:
Pre
dat
or
Mit
es
Date
C) Ratio of Spider Mites : Predator Mites
Vina
Chandler
California Walnut Board 256 Walnut Research Reports 2011
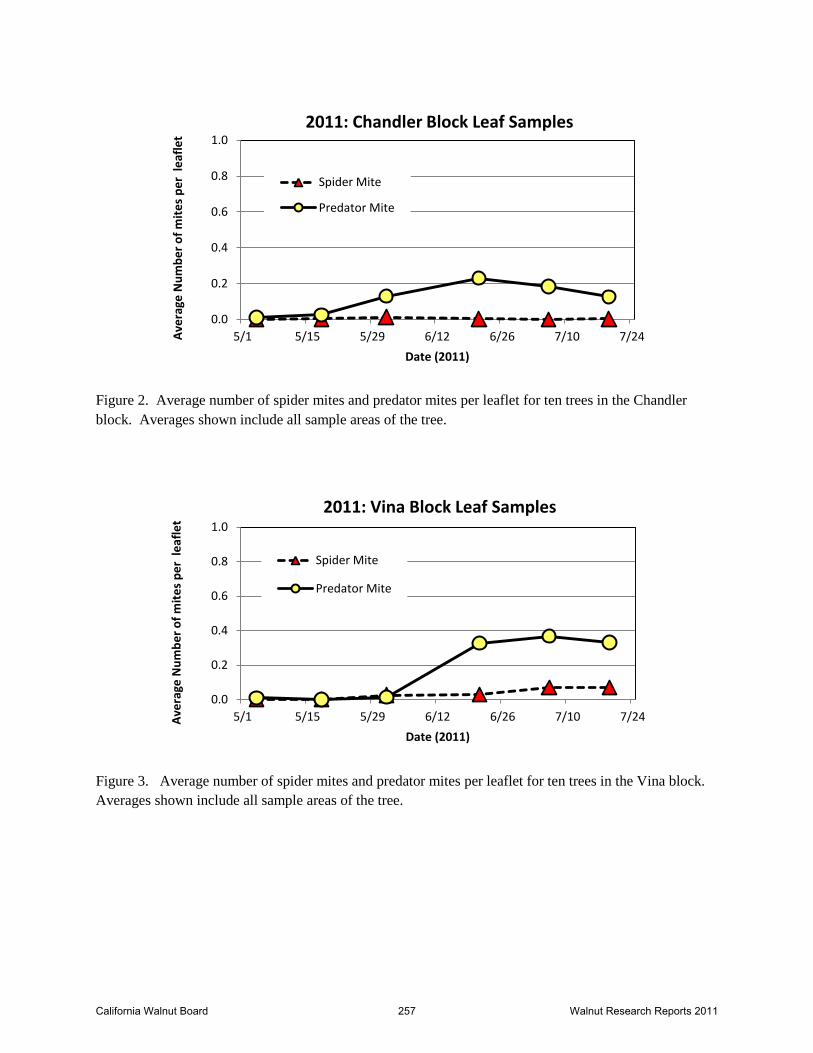
Figure 2. Average number of spider mites and predator mites per leaflet for ten trees in the Chandler
block. Averages shown include all sample areas of the tree.
Figure 3. Average number of spider mites and predator mites per leaflet for ten trees in the Vina block.
Averages shown include all sample areas of the tree.
0.0
0.2
0.4
0.6
0.8
1.0
5/1 5/15 5/29 6/12 6/26 7/10 7/24 Ave
rage
Nu
mb
er
of
mit
es
pe
r le
afle
t
Date (2011)
2011: Chandler Block Leaf Samples
Spider Mite
Predator Mite
0.0
0.2
0.4
0.6
0.8
1.0
5/1 5/15 5/29 6/12 6/26 7/10 7/24 Ave
rage
Nu
mb
er
of
mit
es
pe
r le
afle
t
Date (2011)
2011: Vina Block Leaf Samples
Spider Mite
Predator Mite
California Walnut Board 257 Walnut Research Reports 2011
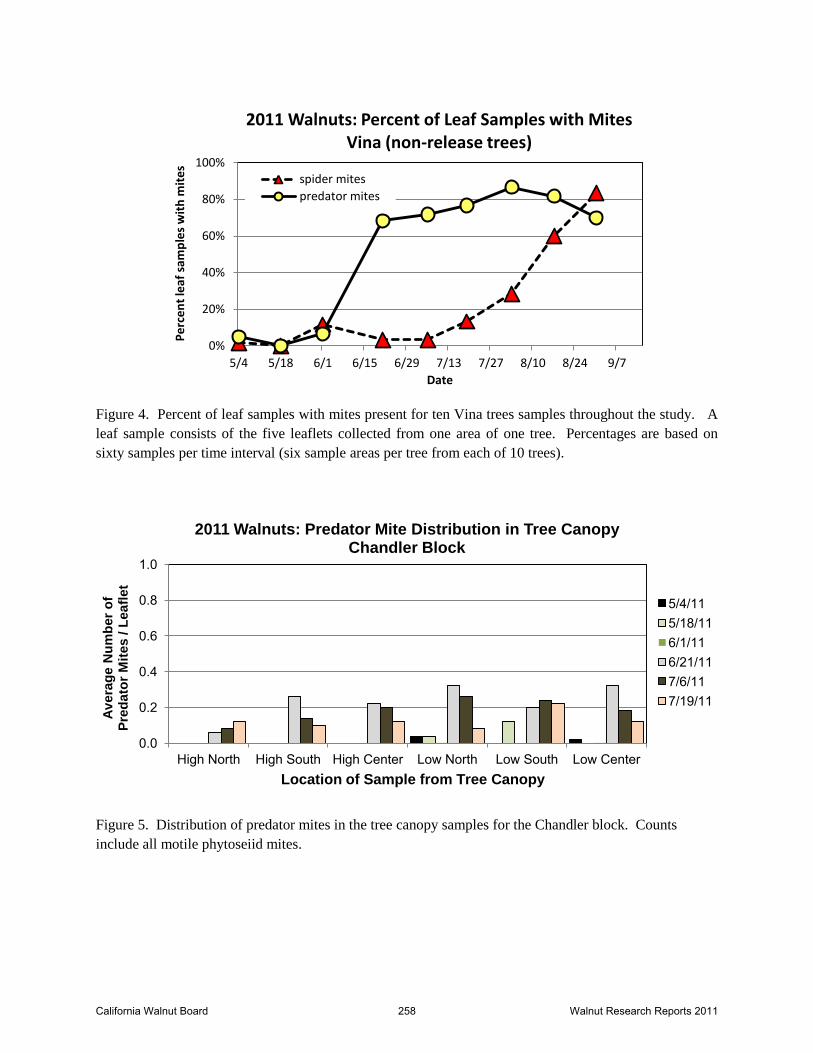
Figure 4. Percent of leaf samples with mites present for ten Vina trees samples throughout the study. A
leaf sample consists of the five leaflets collected from one area of one tree. Percentages are based on
sixty samples per time interval (six sample areas per tree from each of 10 trees).
Figure 5. Distribution of predator mites in the tree canopy samples for the Chandler block. Counts
include all motile phytoseiid mites.
0%
20%
40%
60%
80%
100%
5/4 5/18 6/1 6/15 6/29 7/13 7/27 8/10 8/24 9/7
Pe
rce
nt
leaf
sam
ple
s w
ith
mit
es
Date
2011 Walnuts: Percent of Leaf Samples with Mites Vina (non-release trees)
spider mites
predator mites
0.0
0.2
0.4
0.6
0.8
1.0
High North High South High Center Low North Low South Low Center
Av
era
ge N
um
ber
of
P
red
ato
r M
ites / L
eafl
et
Location of Sample from Tree Canopy
2011 Walnuts: Predator Mite Distribution in Tree Canopy Chandler Block
5/4/11 5/18/11 6/1/11 6/21/11 7/6/11 7/19/11
California Walnut Board 258 Walnut Research Reports 2011
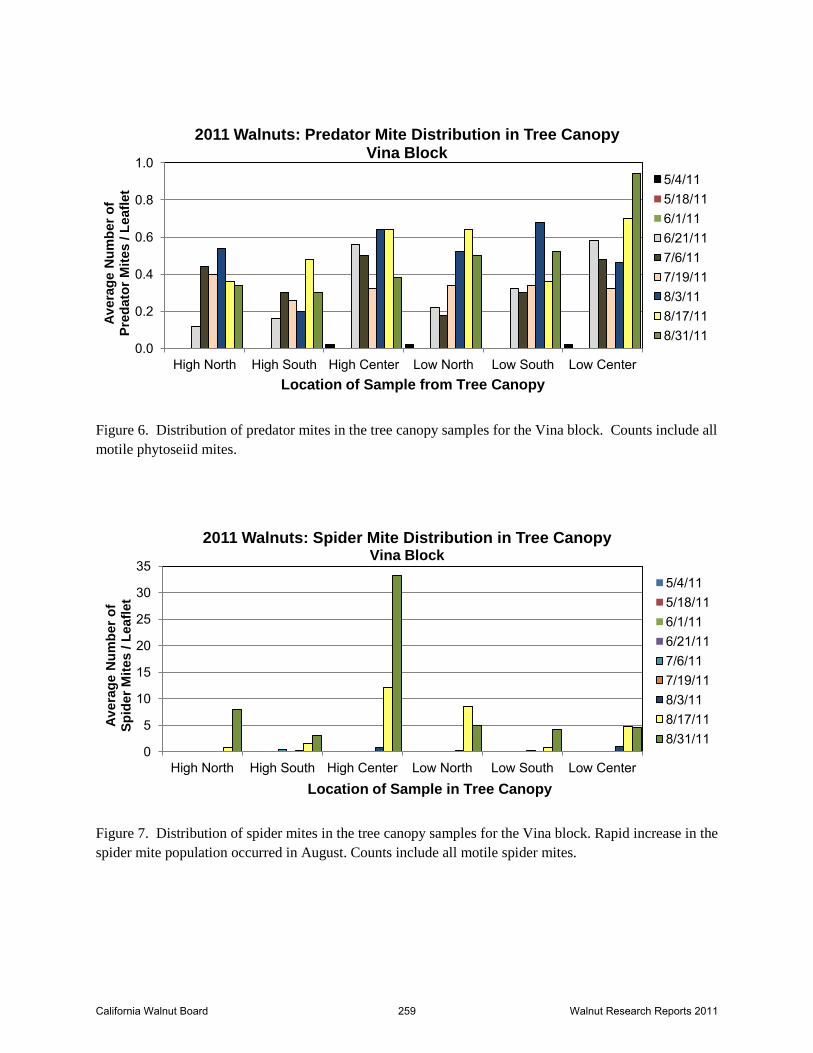
Figure 6. Distribution of predator mites in the tree canopy samples for the Vina block. Counts include all
motile phytoseiid mites.
Figure 7. Distribution of spider mites in the tree canopy samples for the Vina block. Rapid increase in the
spider mite population occurred in August. Counts include all motile spider mites.
0.0
0.2
0.4
0.6
0.8
1.0
High North High South High Center Low North Low South Low Center
Av
era
ge N
um
ber
of
P
red
ato
r M
ites / L
eafl
et
Location of Sample from Tree Canopy
2011 Walnuts: Predator Mite Distribution in Tree Canopy Vina Block
5/4/11 5/18/11 6/1/11 6/21/11 7/6/11 7/19/11 8/3/11 8/17/11 8/31/11
0
5
10
15
20
25
30
35
High North High South High Center Low North Low South Low Center
Av
era
ge N
um
ber
of
S
pid
er
Mit
es / L
eafl
et
Location of Sample in Tree Canopy
2011 Walnuts: Spider Mite Distribution in Tree Canopy Vina Block
5/4/11 5/18/11 6/1/11 6/21/11 7/6/11 7/19/11 8/3/11 8/17/11 8/31/11
California Walnut Board 259 Walnut Research Reports 2011
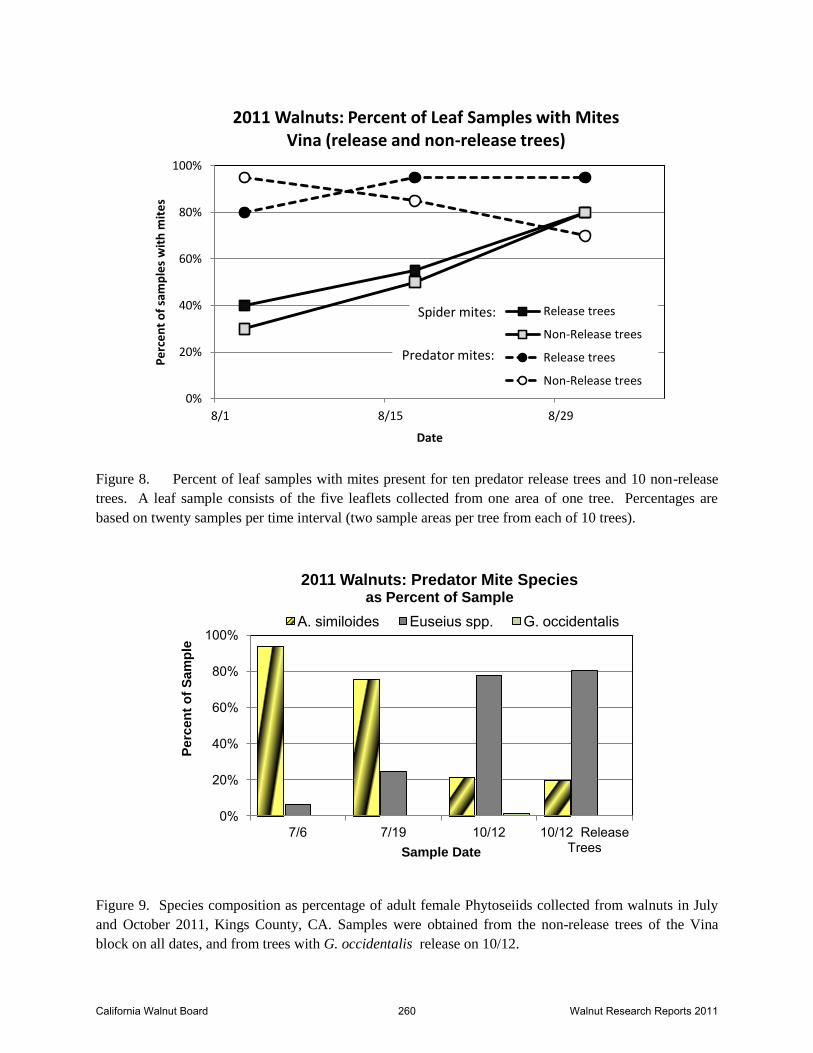
Figure 8. Percent of leaf samples with mites present for ten predator release trees and 10 non-release
trees. A leaf sample consists of the five leaflets collected from one area of one tree. Percentages are
based on twenty samples per time interval (two sample areas per tree from each of 10 trees).
Figure 9. Species composition as percentage of adult female Phytoseiids collected from walnuts in July
and October 2011, Kings County, CA. Samples were obtained from the non-release trees of the Vina
block on all dates, and from trees with G. occidentalis release on 10/12.
0%
20%
40%
60%
80%
100%
8/1 8/15 8/29
Pe
rce
nt
of
sam
ple
s w
ith
mit
es
Date
2011 Walnuts: Percent of Leaf Samples with Mites Vina (release and non-release trees)
Release trees
Non-Release trees
Release trees
Non-Release trees
Predator mites:
Spider mites:
0%
20%
40%
60%
80%
100%
7/6 7/19 10/12 10/12 Release Trees
Perc
en
t o
f S
am
ple
Sample Date
2011 Walnuts: Predator Mite Species as Percent of Sample
A. similoides Euseius spp. G. occidentalis
California Walnut Board 260 Walnut Research Reports 2011
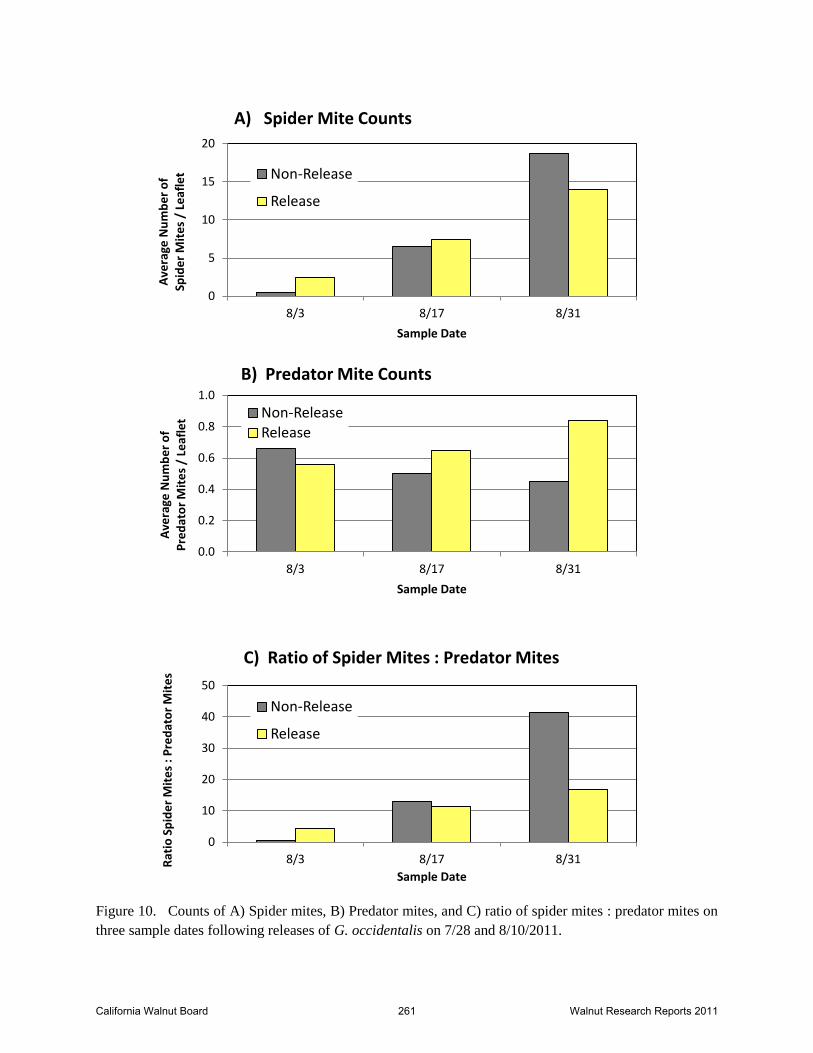
Figure 10. Counts of A) Spider mites, B) Predator mites, and C) ratio of spider mites : predator mites on
three sample dates following releases of G. occidentalis on 7/28 and 8/10/2011.
0
5
10
15
20
8/3 8/17 8/31
Ave
rage
Nu
mb
er
of
Sp
ide
r M
ite
s /
Leaf
let
Sample Date
A) Spider Mite Counts
Non-Release
Release
0.0
0.2
0.4
0.6
0.8
1.0
8/3 8/17 8/31
Ave
rage
Nu
mb
er
of
P
red
ato
r M
ite
s /
Leaf
let
Sample Date
B) Predator Mite Counts
Non-Release Release
0
10
20
30
40
50
8/3 8/17 8/31 Rat
io S
pid
er
Mit
es
: P
red
ato
r M
ite
s
Sample Date
C) Ratio of Spider Mites : Predator Mites
Non-Release
Release
California Walnut Board 261 Walnut Research Reports 2011