Embed Size (px)
Citation preview
Biological Assessment of
City of Sarasota Wastewater Treatment Plant Sarasota County
NPDES #FL0040771
Sampled October 1996
February 1997
Biology Section Division of Administrative and Technical Services
Comprehensive Quality Assurance Plan No. 870346G
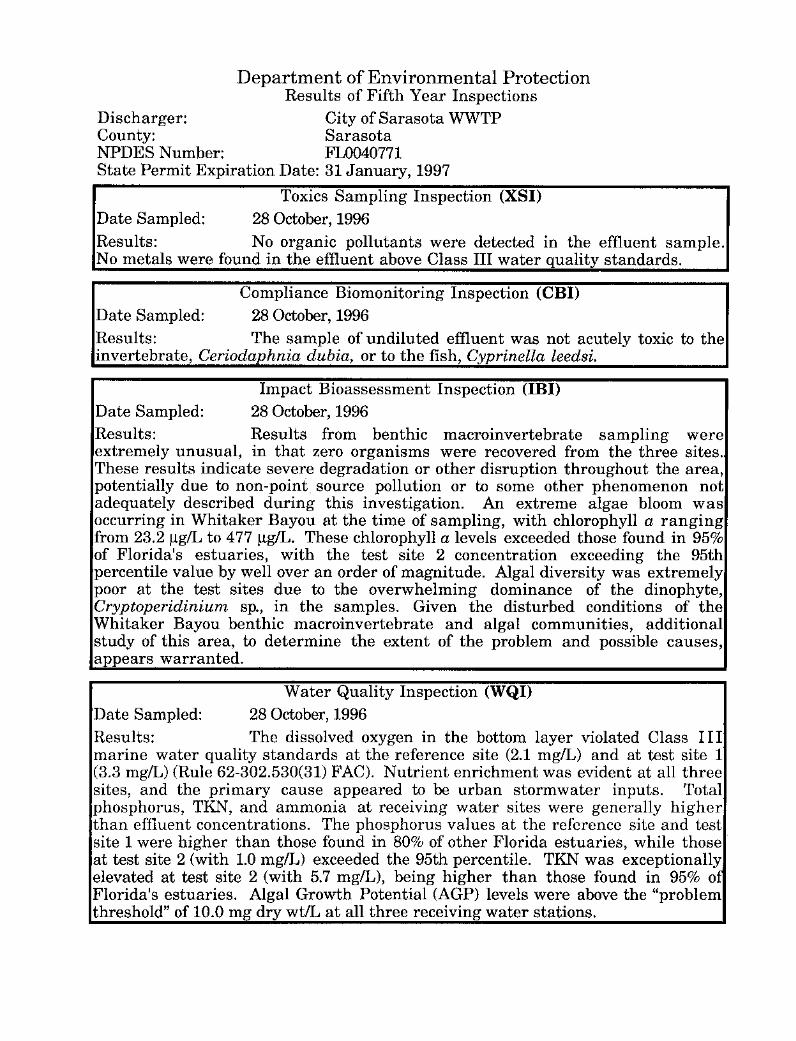
Department of Environmental Protection Results of Fifth Year Inspections
Discharger: City of Sarasota WWTP County: Sarasota NPDES Number: FL0040771 State Permit Expiration Date: 31 January, 1997
Toxics Sampling Inspection (XSI) Date Sampled: 28 October, 1996 Results: No organic pollutants were detected in the effluent sample. No metals were found in the effiuent above Class III water quality standards.
Compliance Biomonitoring Inspection (CBI) Date Sampled: 28 October, 1996 Results: The sample of undiluted effluent was not acutely toxic to the invertebrate, Ceriodaphnia dubia, or to the fish, Cyprinella leedsi.
Impact Bioassessment Inspection (IBI)
Date Sampled: 28 October, 1996 Results: Results from benthic macroinvertebrate sampling were extremely unusual, in that zero organisms were recovered from the three sites. These results indicate severe degradation or other disruption throughout the area, potentially due to non-point source pollution or to some other phenomenon not adequately described during this investigation. An extreme algae bloom was occurring in Whitaker Bayou at the time of sampling, with chlorophyll a ranging from 23.2 f!g!L to 4 77 f!g!L. These chlorophyll a levels exceeded those found in 95% of Florida's estuaries, with the test site 2 concentration exceeding the 95tb percentile value by well over an order of magnitude. Algal diversity was extremely poor at the test sites due to the overwhelming dominance of the dinophyte, Cryptoperidinium sp., in the samples. Given the disturbed conditions of the Whitaker Bayou benthic macroinvertebrate and algal communities, additional study of this area, to determine the extent of the problem and possible causes, appears warranted.
Water Quality Inspection (WQI)
Date Sampled: 28 October, 1996 Results: The dissolved oxygen in the bottom layer violated Class III marine water quality standards at the reference site (2.1 mg/L) and at test site 1 (3.3 mg!L) (Rule 62-302.530(31) FAC). Nutrient enrichment was evident at all three sites, and the primary cause appeared to be urban stormwater inputs. Total phosphorus, TKN, and ammonia at receiving water sites were generally higher than effluent concentrations. The phosphorus values at the reference site and test site 1 were higher than those fOund in 80% of other Florida estuaries, while those at test site 2 (with 1.0 mg!L) exceeded the 95th percentile. TKN was exceptionally elevated at test site 2 (with 5.7 mg!L), being higher than those found in 95% of Florida's estuaries. Algal Growth Potential (AGP) levels were above the "problem threshold" of 10.0 mg dry wt!L at all three receiving water stations.

Introduction
The City of Sarasota Wastewater Treatment Plant is located in Sarasota County (see maps in Appendix). This 10.2 MGD advanced wastewater treatment facility treats domestic waste via a "modified Bardenpho" process. Effiuent is either delivered to a public access reuse system or discharged into Whitaker Bayou. The mean discharge to Whitaker Bayou from the facility during October, 1996, was 11.2 MGD.
Discharge limits to Whitaker Bayou are based upon stream flow at the 38th Street gage. When the flow exceeds 3 cfs, the effluent must comply with the following limitations: CBOD (3.0 mg/L as a monthly average), TSS (5.0 mg/L as a monthly average), total phosphorous (1.0 mg/L as a monthly average), total nitrogen (3.0 mg/L as a monthly average) and dissolved oxygen (6.0 mg/L minimum). When the flow is less than 3 cfs, the following effiuent limits apply: CBOD (2.0 mg/ L as a monthly average), TSS (5.0 mg/L as a monthly average), total phosphorous (1.0 mg/L as a monthly average), total nitrogen (3.0 mg/L as a monthly average) and dissolved oxygen (6.0 mg/L minimum). The permit further stipulates that the amount of wastewater discharged to Whitaker Bayou shall not exceed 30% of the actual annual wastewater flow over the five year term of the permit.
The City of Sarasota WWTP was previously under a consent order because of problems in complying with minimal negative impact criteria and fOr providing insufficient wastewater reuse areas. In June, 1995, the effluent was chronically toxic to Ceriodaphnia dubia.
Major characteristics of community structure of reference and test sites.
Macroinvertebrate Ponar
Number of Taxa i Phytoplankton Algae
Number otTaxa !
Shannon-Weaver Diversity
Reference Site
0
10 2.45
-
Test Site 1
()
4 0.62
Test Site 2
0
5 0.2H
-- --- ----- .. -------------
Chlorophyll a (IJ.g/L) IU 23.2 477 Algal Density (#/mL) 1,396.8 5.489.7 49,989.5
% Blue-green 0.75 () 0 % Dinophyceac 30.7 90.4 97.5
%Diatoms 3.8 4.4 1.7 Algal urowtn >"otentlaJ \mg ory I 23.76 24.29 67.47 wtJI)
Methods
The focus of this investigation was to determine the discharger's effects on the receiving waters. A comparison of biological community health was made between a reference site (located in Bowlees Creek, approximately 4.5 miles north of the discharge site) and two test sites (bracketing the discharge in Whitaker Bayou near Tamiami Trail) (see maps in the Appendix). A habitat assessment was performed in situ to establish comparability between sites. Supplemental physical/chemical data were also collected on the effluent and study sites. Acute screening toxicity bioassays, using Ceriodaphnia dubia and Cyprinella leedsi as test organisms, were performed on an effluent sample (Weber 1991). The effluent was analyzed for metals and for organic constituents (base neutral and acid extractables, and pesticide extractables). Additionally, nutrient analyses were performed on effluent, reference, and test sites. Methods used for all
chemical analyses are on file at the Tallahassee DEP Chemistry Laboratory.
Benthic macroinvertebrate communities were evaluated at reference and test sites. Invertebrates were collected with 3 petite Ponar dredge samples per station (Ross 1990). Phytoplankton was sampled at both reference and test sites via subsurface grabs. Chlorophyll a was also determined for periphyton communities (Ross 1990). Algal Growth Potential tests, using Selena strum capricornutum for the freshwater discharge and Dunaliella tertiolecta for the saltwater receiving water sites, followed Miller et al. (1978) and EPA (1974). Sediment from reference and test sites was analyzed for grain size and percent organic matter (Ross 1990).
Explanation of Measurements of Community Health
Several different measurements ofmacroinvcrtebrate and algal community health have been employed
to determine the effects of a discharge. These are briefly discussed here.
Habitat Assessment: Attributes known to have potential effects on the estuarine biota were evaluated and scored. Based on the sum of these individual scores, overall habitat quality is assigned to one of four categories: Optimal (75-100 points); Suboptimal (50-75 points); Marginal (25-49 points); and Poor (0-24 points) (sec Habitat Assessment Field Sheets in Appendix).
Taxa richness: Stress tends to reduce the number of different types of organisms present in a system, although moderate nutrient enrichment may sometimes be correlated with increased algal taxa riclmess.
Shannon-Weaver diversity: This index is specified in the Florida Administrative Code as a measure ofbiological integrity (Rule 62-302.530(11) FAC). Low diversity scores are undesirable. They represent conditions where only a few organisms are abundant, to the exclusion of other taxa. Excessive numerical dominance of a single type of organism (a high % contribution of tho dominant taxon) is a related measure which is also associated with disturbance.
Numbers of pollution sensitive taxa: Some organisms become rare or absent as the intensity or duration of disturbance increases. For example, the Florida Index assigns points to stream-dwelling macroinvertcbrates based on their sensitivity to pollution (see Ross 1990). A site with a high Florida Index score is considered healthy. Species sensitivity data from other sources, such as Hulbert (1990), Hudson et al. (1990), Lenat (1993), Farrell (1992), Chang et al. (1992), and
Whitmore (1989), arc used as appropriate.
Ephemcroptera!Plecoptera/Trichoptera Index: This index is the sum of the number of EPT taxa present. Higher EPT values are associated with healthier systems.
Community structure: Substantial shifts in the proportions of major groups of organisms, compared to reference conditions, may indicate degradation. In marine systems, an increase in the% tubificid oligochaetes, a decrease in the % pelecypods, and a
0 0
' ¥
decrease in the number of polychaete taxa are all considered indicators of disturbance (Engel et al. 1994).
Algal biomass: High algal biomass (algal density or chlorophyll a) implies nutrient stress. A decreased diatom to blue-green algae ratio (calculated by dividing the number of individuals in the Bacillariophyta by the number of individuals in the Bacillariophyta + Cyanophyta) is often indicative of nutrient enriched conditions in flowing streams.
' '
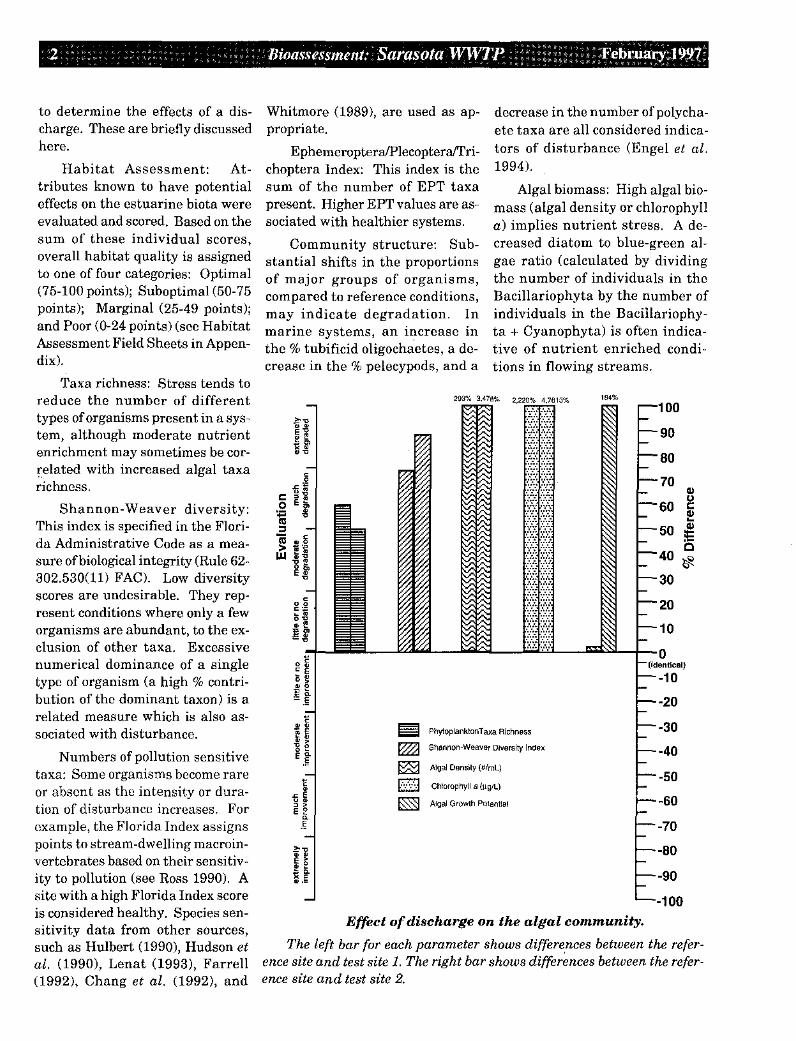
1 ~ Phytoplankton Taxa Richness
~ Shannon-Weaver Diversity Index
~ Algal Density (#lmL)
(:·/·/·.J Chlorophyll a (!Lgll)
~ Algal Growth Potential
Effect of discharge on the algal community.
The left bar for each parameter shows differe.nces between the reference site and test site 1. The right bar shows differences between the reference site and test site 2.
February1997~,';' '; ,'; ",,, Bioassessment: SarasotaW,WTP;!:;,;~": 't;: ,,:~:7::: ,,:'::,3,
Trophic composition/feeding guilds: Disturbance can shift the feeding strategies of invertebrates. In Florida, for example, pollution may be responsible for reducing the numbers of filterfeeders (FDEP 1994) and shredders (EA Engineering 1994).
The Stream condition Index for Florida (SCI) is a composite macroinvertebrate metric (Barbour et al. 1996). The SCI assigns points to a variety of parameters, depending on how closely each parameter approaches an expected reference condition.
For graphical purposes, the percent differences between the reference and test sites involving the number of taxa and the diversity index are measured as the reference site minus test site divided by the reference site. The percent differences between sites involving algal density, chlorophyll a, and algal growth potential are measured as the test site minus reference site divided by the reference site.
The following personnel were involved in this investigation: Andrea Grainger and Joe Squitieri (DEP SW District) and Lyn Burton, Jennifer Eichelberger, Marshall Faircloth, Russel Frydenborg, Joy Jackson, Kathleen Lurding, Elizabeth Miller, Urania Quintana, Bart Richard, Lisa Tamburello, David Whiting, Vicki Whiting, and Greg Wynn (Tallahassee Biology Laboratory). The report was reviewed by the Point Source Studies Review Committee, consisting of Wayne Magley, Jan Mandrup-Poulsen, and Michael Tanski; as well as District representatives.
Results and Discussion
The test sites were situated within Whitaker Bayou, a heavily urbanized and channelized tidal creek, with a shoreline consisting almost entirely of vertical seawalls. The reference site was located approximately 4.5 miles north, in Bow lees Creek, a system with similar habitat characteristics, as well as surrounding land usc. Habitat quality was "marginal" at all three receiving water sites, with the reference site scoring 31 points, test site 1 receiving 32 points, and test site 2 scoring 36 points. Commercial, residential and industrial land-uses dominated at all three sites. Marinas are located in the vicinity of each site. Petroleum hydrocarbons were observed at all sites, both in the sediments and on the water's surface. In the past, nearby residents have complained of chlorine odors near the test sites.
Physical/chemical parameters varied between the receiving water stations. The surface layer dissolved oxygen ranged from 6.0 mg/ L at the reference site to 7.8 mg/L at test site 2. The bottom layer dissolved oxygen was normal at test site 2 (7 .1 mg!L), but dropped dramatically at the reference site (2.1 mg!L) and test site 1 (3.3 mg/L), where it violated Class III marine water quality standards (Rule 62-302.530(31) FAC). The surface salinity at all three sites ranged from 10 ppt at test site 1 to 22 ppt at test site 2. Note that these two sites are situated approximately 200 m apart. The bottom salinities were higher, with 35 ppt at the reference site, 24 ppt at test site 1, and 27 ppt at test site 2. The pH ranged from 7.2 SU to 7.6 SU.
No organic pollutants were detected in the effluent sample. No metals were found in the effluent above Class III water quality standards.
The sample of undiluted effluent was not acutely toxic to the invertebrate, Ceriodaphnia dubia, or to the fish, Cyprinella leedsi.
Nutrient enrichment was evident at all throe sites, and the primary cause appeared to be urban stormwater inputs. For example, total phosphorus at the reference site (0.23 mg/L), test site 1 (0.27 mg/ L), and test site 2 (1.0 mg!L) were significantly higher than effluent concentrations (which were 0.092 mg!L in the timed composite sample and 0.1 mg/L in the flow proportionate sample). Note that these phosphorus values are higher than those found in 80% (the reference site and test site 1) to 95% (test site 2) of other Florida estuaries (see Table of1'ypical Water Quality Values in Appendix). Ammonia concentrations at the reference site (0.045 mg/L and at test site 2 (0.049 mg!L) exceeded the effluent level (0.035 mg/L or less). Conversely, despite 1.8 mg/L of nitrate-nitrite being detected in the timed composite effluent sample, nitrate-nitrite levels were higher at the reference site (0.2 mgll) when compared with test site 1 (0.087 mgll) or test site 2 (0.025 mg/1). TKN was exceptionally elevated at test site 2 (with 5. 7 mg/1), being higher than those found in 95% of Florida's estuaries. In contrast, effluent TKN was relatively normal (0.58 mg!L to 0.64 mg!L).
Algal Growth Potential (AGP) levels were above the "problem threshold" of 10.0 mg dry wtiL at all three receiving water stations (Ron Raschke, USEPA, pers.

comm.). AGP was 23.8 mg dry wtl L at the reference site, 24.3 mg dry wt/1 at test site 1, and 67.5 mg dry wtJL at test site 2. The effluent AGP was 28.7 mg dry wtJL.
Results from benthic macroinvertebrate sampling were extremely unusual, in that zero organisms were recovered from the three petite Ponar grabs of the sediments at each of the three sites. No macroinvertebrates were found in any of the samples, including the reference site. These results indicate severe degradation or other disruption throughout the area. These effects may be due to non-point source pollution, (e.g., habitat problems, petroleum contaminated sediments, low dissolved oxygen) or to ~orne other phenomenon not adequately described during this investigation. Further study ofthis area, to determine the extent of the problem and possible causes, appears warranted.
The figure on p. 2 represents c::hanges in the phytoplankton algal community. Larger differences (that is higher, percentages) correspond with greater degrees of degradation. An extreme algae bloom was occurring in Whitaker Bayou at tho time of sampling. Chlorophyll a was elevated at test site 1 (23.2 11g/L) and excessively elevat
'Cd at test site 2 (477~-tg/L). These chlorophyll a levels exceeded those found in 95% of Florida's estuaries, with the test site 2 concentration exceeding the 95th percentile value by well over an order of magnitude. Phytoplankton taxa richness decreased from 10 taxa at the reference site to 4 taxa test site 1 and 5 taxa at test site 2. Algal diversity followed a similar pattern, decreasing from 2.45 at the reference site to 0.62 at test site 1 and 0.28 at test site 2. These extremely poor
diversity values at the test sites were due to the overwhelming dominance of the dinophyte, Cryptoperidinium sp., in the samples. Cryptoperidinium sp. accounted for 90.4% of the total population at test site 1 and 96.6% of the population at test site 2. Given the disturbed conditions of the Whitaker Bayou algae, additional study is recommended.
Conclusions
The dissolved oxygen concentration in the bottom layer violated Class III marine water quality standards at the reference site (2.1 mg!L) and at test site 1 (3.3 mg/L) (Rule 62-302.530(31) FAC).
No organic pollutants were detected in the effluent sample. No metals were found in the effluent above Class III water quality standards.
The sample of undiluted effluent was not acutely toxic to the invertebrate, Ceriodaphnia dubia, or to the fish, Cyprinella leedsi.
Nutrient enrichment was evident at all three sites, and the primary cause appeared to be urban stormwater inputs. Total phosphorus, TKN, and ammonia at receiving water sites were generally higher than effluent concentrations. The phosphorus values at the reference site and test site 1 were higher than those found in 80% of other Florida estuaries, while those at test site 2 (with 1.0 mg!L) exceeded the 95th percentile. TKN was exceptionally elevated at test site 2 (with 5. 7 mg/ L), being higher than those found in 95% of Florida's estuaries.
Algal Growth Potential (AGP) levels were above the "problem threshold" of 10.0 mg dry wt/L at all three receiving water stations (Ron Raschke, USEPA, pers. comm.). AGP was 23.8 mg dry wt/1 at the reference site, 24.3 mg dry wt!L at test site 1, and 67.5 mg dry wt!L at test site 2. 'l'he effluent AGP was 28.7 mgdrywt/1.
Results from benthic macroinvertebrate sampling were extremely unusual, in that zero organisms were recovered from the three petite Ponar grabs of the sediments at each of the three sites. No macroinvertebrates were found in any of the samples, including the reference site. These results indicate severe degradation or other disruption throughout the area. These effects may be due to non-point source pollution, (e.g., habitat problems, petroleum contaminated sediments, low dissolved oxygen) or to some other phenomenon not adequately described during this investigation. Further study of this area, to determine the extent of the problem and possible causes, appears warranted.
An extreme algae bloom was occurring in Whitaker Bayou at the time of sampling, with chlorophyll a ranging from 23.2 J.lg/L to 4 77 Jlg/L. These chlorophyll a levels exceeded those found in 95% of Florida's estuaries, with the test site 2 concentration exceeding the 95th percentile value by well over an order of magnitude. Algal diversity was extremely poor at the test sites due to the overwhelming dominance of the dinophyte, Cryptoperidinium sp., in the samples. Cryptoperidinium sp. accounted for 90.4% of the total population at test site 1 and 96.6% of the population at test site 2. Given the disturbed conditions of the Whitaker Bayou algae, additional study is recommended.

Literature Cited
American Public Health Assoc., American Water Works Assoc., and Water Pollution Control Federation. 1989. Standard Methods for the Examination of Water and Wastewater, 17th ed. New York, N.Y. 1268 p.
Aquatic Toxicity Information Retrieval Data Base (AQUIRE). 1994. U.S. EPA Environmental Research Laboratory, Duluth, MN.
Chang, S., F. W. Steimle, R. N. Reid, S. A. Fromm, V. S. Zdanowicz, and R. A. Pikanowski. 1992. Association of benthic macrofauna with habitat types and quality in the New York Bight. Mar. Ecol. Prog. Ser. 89: 237-251.
EA Engineering, Science, and 'l'echnology and Tetra Tech, Inc. 1994. Bioassessment for the nonpoint source program (draft). Prepared for the Fla. Dept. Environ. Protection. Unpaginated.
Environmental Protection Agency. 1974. Marine algal assay procedure: Bottle test. Nat'l Environ. Res. Center, Office of Res. and Dev., U.S. EPA, Corvallis, Oregon. 43 p.
Engle, V. D., J. K. Summers, and G. R. Gaston. 1994. A benthic index of environmental condition of Gulf of Mexico estuaries. Estuaries 17(2): 372-384.
Farrell, D. H. 1992. A community based metric for marine benthos. Fla. Dept. Environ. Reg. SW Dist. Office. unpublished rept. 15 p.
FDEP. 1994. Lake bioassessments for the determination ofnonpoint source impairment in Florida. Fla. Dept. Environ. Prot. Biology Section, Tallahassee, Fla. 73 p.
Hudson, P. L., D. R. Lenat, B. A. Caldwell, and D. Smith. 1990. Chironomidae of the Southeastern United States: A checklist of species and notes on biology, distribution, and habitat. U.S. Fish Wildl. Serv., Fish. Wildl. Res. 7. 46 pp.
Hulbert, J. L. 1990. A proposed lake condition index for Florida. North Amer. Benth. Soc, 38th Ann. Mtg., Blacksburg, VA, 11 p.
Lcnat, D. R. 1993. A biotic index for the southeastern United States: derivation and list of tolerance values, with criteria for assigning water-quality ratings. J. N. Am. Benthol. Soc. 12(3): 270-290.
Miller, W. E., T. E. Maloney, and J. C. Greene. 1978. The Selenastrum capricornutum Printz algal assay bottle test. U. S. Environ. Prot. Agency, EPA-600/9-78-018. 126 p.
Raschke, R. L. and D. A. Schultz. 1987. The use of the algal growth potential test for data assessment. J. Wat. Poll. Cont. Fed. 59(4): 222-227.
Ross, L. T. 1990. Methods for aquatic biology. Fla. Dept. Environ. Reg. 'l'ech. Ser. 10(1): 1-47.
Weber, C. I. 1991. Methods for measuring the acute toxicity of effluents to freshwater and marine organisms. 4th edition. EPA/600/4-90/027. U.S. EPA, Cincinnati, Ohio. 216 pp.
Whitmore, T. J. 1989. Florida diatom assemblages as indicators of trophic state and pH. Limnol. Oceanogr. 34(5): 882-895.
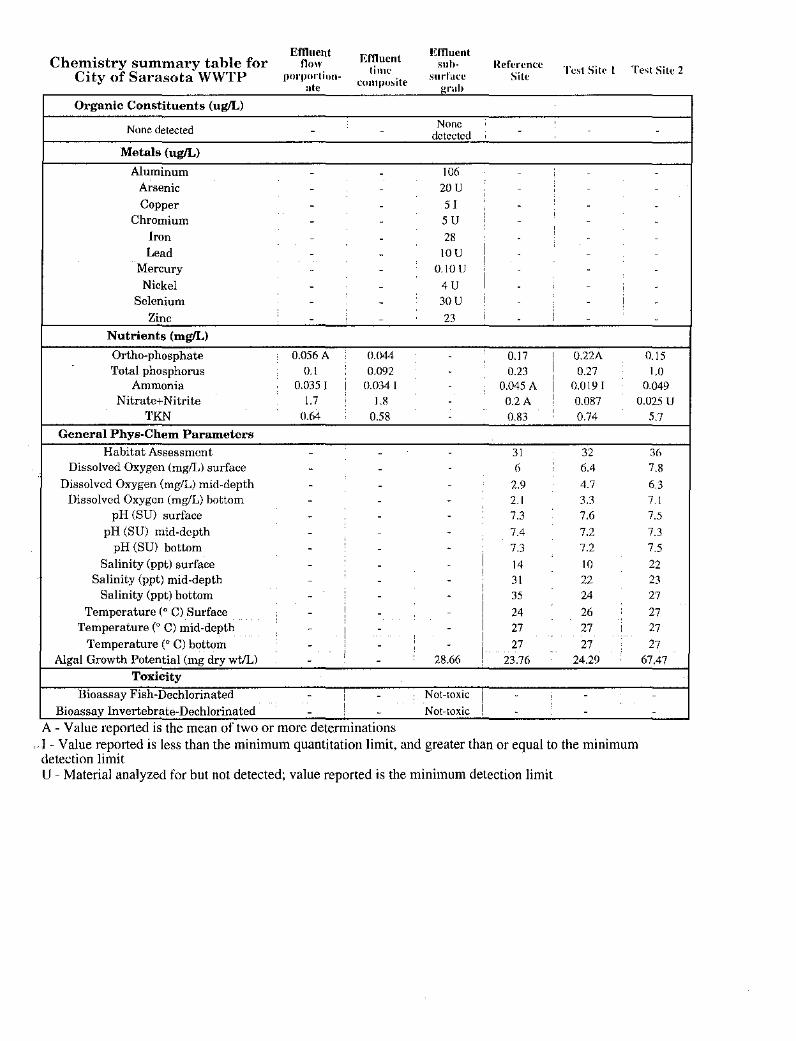
Chemistry summary table for City of Sarasota WWTP
Organic Constituents (ug!L)
None detected
Metals (ug/L)
Aluminum Arsenic
Copper Chromium
Iron Lead
Mercury Nickel
Selenium Zinc
Nutrients (mg/L)
Ortho-phosphate Total phosphorus
Ammonia
Effluent now
porpnrtion-:~te
-
----------
0.056 A 0. 1
0.035 I I
Emuent time
COU1]JU>ite
-
--
------
--
0.044
0.092 0.034 I
mnuent suh-
surl'acc grab
None detected '
106
20U 51 su i
28 IOU I
! 0.10 lJ
i 4U 30U ;
23 I
--
Reference Site
-
-
--
----
-
0.17 0.23
0.045 A
'
' '
'
I
i ' I
Test Sit(· t
-
--
- -- -- -
- -
- --
' -- ! -- -
0.22A 0.15
0.27 1.0 0.019 I 0.049
Nitrate+Nitrite 1.7 1.8 - 0.2A ! 0.087 O.OZ5 U 1'KN 0.64 0.58 0.83 ' 0.74 -
General Phys-Chem Parameters
Habitat Assessment - - 31 32 Dissolved Oxygen (mg!J ,) surface - - - " 6.4
Dissolved Oxygen (mg!L) mid-depth - - - 2.9 4.7 Dissolved Oxygen (mg!L) bottom - - - 2.1 3.3
pH (SU) surface - - - 7.3 7.6 pH (SU) mid-depth - - - 7.4 7.2
pH (SU) bottom - - - 7.3 7.2 Salinity (ppt) surface - - - i 14 10
' Salinity (ppt) mid-depth - - - 31 22 ' Salinity (ppt) bottom - - - 35 24
Temperature (° C) Surface - ' '
- - 24 26 Temperature CO C) mid-depth - I - - 27 27
' Temperature (° C) bottom ' ' 27 27 - -
' -
' Algal Growth Potential (mg dry wt/1) - - 28.66 23.76 24.29
Toxicity
Bioassay Fish-Dechlorinated -'
- : Not toxic
I -
' -
Bioassay Invertebrate-Dechlorinated ' - - Not-toxic - -A - Value reported IS the mean of two or more determmatmns
. I - Value reported is less than the minimum quantitation limit, and greater than or equal to the minimum detection limit U- Material analyzed for but not detected; value reported is the minimum detection limit
5.7
36 7.8 6.3 7.1 7.5 7.3 7.5 22 23 27 27 27 27
67.47
-

Typical Values for Selected Parameters in Florida Waters Adapted from Joe Hand, FDER, personal communication, 1991
(data was collected between 1980 aod 1989)
Percentile Distribution (Parameter 5% IO% !20% lao% l4o% !so% !so% I 70% I so% I9D% I 95% I STREAMS (1617 stations) Phytoplankton Chlorophyll o Pcriphyton Chlorophyll a H-D Diversity Qualitative Taxa Richness H-D Taxa Richness TKN Ammonia N02-N03 Total Phosphorus Ortho Phosphate Turbiditv LAKES (477 stations) Phytoplankton Chloroohvll a Dredge Diversity Dredge Taxa Richness TKN NH3+NH4 N02-N03 Total Phosphorus Ortho-Phosphate Turbidity ESTUARIES (690 stations) Phytoplankton Chloroohvll a Dred e Diversitv Dredge Taxa Richness TKN NH3+NH4 N02-N03 Total Phosphorus Ortho-Phosnhate Turbidity
Units:
0.22
0.31 0.84
9.00
6.00 0.30 0.02 0.01 0.02 0.01 0.60
0.80 0.71
3.00 0.36 0.01 0.00 0.01 0.00 1.00
2.14 1.34
4.00 0.26 0.01 0.00 0.01 0.01 3.50
0.52 0.94 1.60
0.43 0.77 1.04 2.12 2.48 2.74
12.00 17.00 20.00
6.50 9.00 11.50 0.39 0.56 0.73 0.02 0.04 0.05 Q.()l O.D3 0.05 0.03 0.05 0.06 0.01 0.03 0.04 0.90 1.20 1.45
1.71 2.88 4.28 0.97 1.43 1.74
5.00 6.50 7.00 0.49 0.67 0.83 0.02 O.D2 0.03 0.00 O.Dl 0.01 0.02 0.02 0.03 0.01 0.01 0.02 1.25 1.55 2.05
3.28 4.49 5.13 1.53 1.91 2.28
6.00 9.00 11.00 0.34 0.42 0.50 1).(12 0.03 0.04 0.00 0.01 0.01 0.02 0.06 0.07 0.02 O.D3 0.04 4.00 4.50 5.05
3.02 4.63 6.72 9.87 14.68 27.35
2.16 2.94 6.45 10.51 17.00 39.51 2.88 3.09 3.25 3.40 3.52 3.76
22.00 24.50 26.00 28.00 31.00 37.00
13.00 15.00 17.00 21.50 26.00 29.00 0.87 1.00 1.11 1.26 1.49 1.93 0.06 0.08 0.11 0.14 0.20 0.34 0.07 0.10 0.14 0.20 0.32 0.64 0.10 0.13 0.18 0.25 0.39 0.74 0.05 0.08 0.11 0.17 0.27 0.59 2.10 2.80 3.60 4.50 6.65 10.45
10.06 13.40 20.00 30.10 47.20 65.44 1.98 2.12 2.21 2.59 2.85 3.15
9.00 10.00 11.00 13.00 15.00 17.00 1.08 1.26 1.40 1.51 1.68 2.11 0.04 0.06 0.08 0.12 0.15 0.21 0.01 0.02 0.04 0.05 0.10 0.14 0.05 0.07 0.09 0.11 0.14 0.23 0.03 0.04 0.05 0.06 0.08 0.21 2.75 4.50 6.45 9.60 14.10 26.00
6.00 6.93 7.94 9.60 12.40 17.60 2.56 2.90 3.15 3.59 4.01 4.53
15.00 18.50 25.00 35.00 41.00 62.00 0.59 0.69 0.76 0.82 0.95 1.30 0.05 0.06 0.08 0.09 0.13 0.22 0.01 0.02 0.03 0.05 0.08 0.17 0.10 0.11 0.14 0.17 0.23 0.43 0.04 0.05 0.07 0.09 0.12 0.21 5.40 5.60 6.30 6.80 8.00 11.40
Phytoplankton Chlorophyll a (ug!L), Periphyton Chlorophyll a (mg/m2), Nutrients (mg/L), Turbidity (NTU), Taxa richness and diversity values are for macroinvertebrates
48.70
60.85 3.90
53.00
32.00 2.80 0.60 1.05 1.51 1.37
16.30
113.90 3.17
21.00 3.46 0.28 0.23 0.42 0.32
40.00
22.20 4.98
90.00 1.49 0.28 0.23 0.59 0.44
11.75

.j l J II ) - ~
Sarasota WWTP Site Locations
New College Of The University Of South I
------------ ------------- ----
<.Bish<JDS Point
Sarasota Bay
1·.
----Secondary SR, Road, Hwy Ramfl Geographic Feature
I 1:62,500 (at center)
1 Miles
2KM
- Major Connector
-State Route
=uS Highway
0 Point of Interest
0 Town, Small City
• Large City
+Park or Reservation
Schad Service Airport
Locale
County Boundary
Population Center
C:=J Land
(
I~
-:;:est Site 1 <=~ I .... 7L F!: <~ I li====~
=-+-----, 1:=:1 ~I ~Discharge .
\X ~ if==~==~ 1 Test Site 2
Mag 16.00
~-~ • WedDec1809:231996
I \:I!J<OlitJ:!l ~:C!'.lo::=]'ii:===:::Jscale 1:7,812 (at center) \ '\ ~ 500 Feet
200 Meters
!:::::===~==Secondary SA, Road, Hwy Ramp
~-=~ I US Highway
0 Point of Interest
4 Park or Reservation
Population Center
c:J Lake, Ocean
--River
.L~.. ~:.~Payne T~rminal © lkLormc 1996 Street Atlas USA ®3.0 for Macintosh ~1:1~52".WJI I I II
STATE OF FLORIDA DEPARTMENT OF ENVIRONMENTAL REGULATION
FACILITY SUMMARY
Date Summary Prepared : 10/ -; /1 b
Location (attach ~etailed map): . --: •• ('_(c:..-
District , , I- ·- ~/_)t c. r/f , >
Federal Permit# F L.C .. ()t..j()'77 I and expiration date:
1 /xi/'.P
State GMS #and t.o:::.;?'.'\000-:." State expiration date:
Fac_ili~y _Type: Industrial ~ Federal Agricultural Other (list):
Function of facility: A W T f ..... v- 1>-<
Description of treatment process:
Operation of a 10.2 MGD annual average (and 13.0 MGD maximum month) "modified Bardenpho" advanced wastewater treatment plant (AWWTP) with the reuse of reclaimed water for irrigation of urban public access areas including golf courses and agricultural land used for pasture or citrus crop, and discharge of the reclaimed water into Whitaker Bayou, under specific conditions set forth below.
Receiving waters: ll_)h.A_J~,z...f e.a...._,.x.A tO ' "S·"V C?,, S:C'-1~ ._ G:~
Design Flow: J () • :::t AMiJt, •. " 1 Mean Flow: 1·;>, o n·· . .H·:~r.\"' il ?.
Discharge is: (Corllinu~· Intermittent Seasonal .Other (describe)......___·--- ..
tryerefore, the best time to sample is:
j Classification: 1 11 (_Ill')
Rainfall dependent
If facility has a mixing zone, give details (size, parameters affected, etc.):
Nov\J.
----------r-----------1 J1. Discharge to Whitaker Bayou ) Oescribe special permit conditions
Discharo;re of dechlorinated reclaimed water meeting the - and permit modifications: regui~emcnts of Sp~cific Condition I 6 above to Whitaker Bayou, at the -exist>ng outfall, >G perlllitted when the streamUow at Whitaker Bayou at tlle JBLh Street gaqe and tho effluent quality comply with the • following limitations:
Whitaknr Bayou streamflow
> 3 cfs < 3 cfs
IJOD5 • 3.0 2.0 mg/). 1'SS,• tngjl 5.0 5.0 Total P*, mgjl 1.0 1.0 1'otal N, mg{l 3.0 3.0 Dissolved
oeygen mg/l 6.0 (minimum) 6.0 (minimum) • All tigures except dissolved oxygen represent average values far the number or dayz Of <lischarge during each calendar month at the raspective 5tl-eam flows. streamUow Shall be monitored through a real ;~~~e~~mrnunication link (telemetry) "ith the USGS Stream gage at 38th
35. Over the tive year term of the permit, discharge to Whitaker !layou sl1all not excead 30 percent of the actual waste,.atar flow. If the discharge to Whitaker Bayou exceeds JO percent of the actual flow, U1en the penuttec shall have violated this pennit once for each ca).endar year ;n which tlle permittee discharged to Whitake~ !layou more l11an 30 pnrcent of the actual no" to the treatment plant for that ~alcndar year.
) 1''\
C&OD p-f~
1c.' ::.I.ASJ.~,VV<,..i,)·;:/c{) J
'/h.V, f' <!\. d.U-

STATE OF FLORIDA Page 2 of ~. "-' , / DEPARTMENT OF ENVIRONMENTAL REGULATION l. V-'< "j . ·-" c'VCi. 'ln ·u... FACIUTY SUMMARY
· (Facility)
Description of permitted outfall(s): u_)y., -,~-,J,?; .. "' ' u h~.(~_(' -1l--.?_
(}rC'A!I CY)' (.)1C,~<..-)'fO,'"iJ· X> <JI•) ,~ .J ~ '" -, ).v_ 'S(lo.\\\ 'd-J'.~;, c,:,~ r. '"'r '-' o ·-~- • I :::;··-' •
0'~.~ ~ ~ L. -,-·1"-'- :s ~-.;.]:·1"'-' ,- :_~·~;,J.> . j_t,(")",o{<r(\1 )f,fi.U-' \!'!~-<-.>,
List permit violations (from MOR data or other source) and plant upsets that occurred within past year:
All the NPDES permit required acute toxicity tests have resulted in passing tests, however, a NPDES required chronic toxicity test demonstrated the effluent was toxic in June 1995. This test was conducted 06/07-14/95, and demonstrated NOEC values of 50% effluent
for cerioda2hnia dubia fecundity and survival. The survival rate of
~ dubia in the 100% effluent was 0%. For more information on this test please refer to my memo dated 22 September 1995 (SWFTA #2702).
Describe previous impact bioassessments, WQBEL's, and previous or current enforcement actions: ,-\ -rv'-P_~JC k>.ve . . , i::, . .e.a.."" v-.o. r ·tr · 5, o,. F ''-II· ::<., f"·" /io,_.,.,.,, d
c.-,/'-- f"v'"-" fc..c.'J.J.:..) ~· ~· {~UA t"'' f !v .. •' ;;7.,.~·._ ({. I r··.Y~\ -:'~:, __ (!_~
'· .,. ' . >•J )(c. (_3 __ ,,_: .. ~/.11.! t-{ ,:;,_ -(,• \ co ) .. lci"T' /o 0.--l·''i. tv-i t\J r o: ~ ,,,cL•. ././d,;.._~ Co ... \_C(c-\ <-: t~- A' . ' rqc,:s . ~'
Discuss comparability of MOR results to past DER results and whether there are trends (improving declining) in the data set: '
--rf. ""' !.'::- (,c) l_..;t.A-t:.. \0 C,r)rv~I-Jrt:;.
Additionallnfo1ation: . ,-- r- Staff contributing to this review (signature): r ) {') Sc~ .. 4 ?-.~ -:x~:lc\~ &,)v,_. I C Ja~,..dJ-.Ov\_ C-r"---···a.~..,"' L~_ :. (Biologist) .____.,_::J - - ~-
~ ,_.----· r. (._.~ r1_dt2_,..," CA.- C:'_CJ-,'•, $-!?-""•-'V d.,JJ L ,/;;; ' ~U,;._, (Inspector) ,l:::;...e c~/,.;;J,;,__., of r-y ot~~LQ__,.:,..,J;)
i-._; l,.r d..>J--.,(. I I,
I VI ('' 9VV"-.- F) Vjt. ;\~ 1,,, c1. ~' M ld I (Engineer)
~ 0 'j-( o,. \/'d rr 0 (/I <.t.~- --,/''\ ~-er~
,, ,_, 0.:,..<", c7-AJ2~. ( )
( )
Florid>. Jepartment of
Memorandum Environmental Protection
TO: Michael Hickey, Water Facilities Administrator Southwest District
'"' FROM: '"y"'Al Bishop, P.E., Administrator Point Source Evaluation Section
DATE: January 24, 1994
SUBJECT: City of Sarasota WWTP Effluent BOD
This is in response to the City of Sarasota's questions as relayed to us by Ed Snipes. Any one of the following discharge conditions is acceptable with respect to impact on Whitaker Bayou 1 assuming a discharge of 13 MGD at a DO of 6.0 mgjL:
1. Monthly average CBODS limit of 2 mg/L, discharge permitted at any streamflow.
2. Monthly average CBODS limit of 3 mg/L, no discharge if streamflow less than 3 cfs (as measured at USGS gauge located at 38th st.).
3. Monthly average CBOD5 limit of 5 mg/L, no discharge if streamflow less than 5 cfs.
We do not view the introduction of a variable CBOD limit in which a higher CBOD concentration is permitted on higher streamflow days to be a viable option unless the operational ability to comply to such a scheme can be clearly demonstrated.
Data provided by the city and by Camp Dresser & McKee indicate that of the 335 discharge days between August, 1991 and October, 1993, streamflow was below 5 cfs (at gauge) for 93 days (maximum of 10 consecutive days) and below 3 cfs for 15 days (maximum of 4 consecutive days).
Please contact me or Peter Krottje if you have any further questions.
AB/PK
cc: Ed snipes j
TO:
FROM:
Michael Hickey, Water Facilities southwest District
Al Bishop, P.E., Administrator Point Source Evaluation Section
Administrator
DATE:
AIPJ w--0-'
~t~?~ January 5, 1994 ;rlw,:J:[/~ ~~" ~
SUBJECT: City of Sarasota WWTP Effluent DO J~~ ~ ro"% ~ ~/:::.~!'---'-,,_f.__ X "1''R.r' "_z ---:-
we have reviewed the dissolved oxygen (D~) analyses submitted by Camp, r Dresser, and McKee on December 15, 1993. The submitted material provides adequate assurance that the facility can consistently meet a ,J DO concentration of 6.0 mgjL at the point of discharge to Whitaker 117 Bayou. The results of our recent WASP modeling runs indicate that a 1 DO of 6.0 mg/L is acceptable with respect to impact on the receiving water. We continue to have concerns regarding effluent biochemical oxygen demand (BOD), however. As we stated in our November 18, 1993 teleconference, modeling indicates that a BODS greater than 2.0 mg/L
'll=fiave more than minimum negative impact on Whitaker Bayou during ow)onditions. ---
If we may be of additional assistance, please contact me or Peter Krottje at suncom 278-0780.
cc: Ed Snipes
D.E.P
JAN2 1 1994 bvu !"HWEST U;SJ MtCT
TAMPA

:s fov-""' ~L~ cLr~s STATE OF FLORIDA 0~ I ~ll ( ;:;rv::. fr:<r!W\
DEPARTMENT OF ENVIRONMENTAL PROTECTIOfl boctl> PHYSICAUCHEMICAL CHARACTERIZATION FIELD DATA SHEET (5-10-00)
SUBMITIING AGENCY CODE·
s~~0TtQ~4q' j;~(;h73c> RECEIVING BODY OF WATER:
SUBMIITING AGENCY NAME· /?.0 ,,J Vi.r>S U€12.'k REMAAKS: COUNTY: lOCATION: FI~~E:n tffiw '~ .f?-""k- cJ_'i of 'Y;uz:Jd-'-> '-.).0D"'
CJ/ 'St/:.e RIPARIAN ZONE!INSTREAM FEATURES
v
Predominant Land-Use in Watershed (spedfy relative percent in each category):
ForesVNatural Silviculture Field/Pasture Agricultural Residential Commercial Industrial Other (Specify)
I I I I I I I I ISe> I I 5() I I I I I Local Watershed Erosion {check box): None D Slight ~ Moderate D Heavy D
Local Watershed NPS Pollution (check box): No evidence D Slighl0 Moderate potential D Obvious sources 'Eia Width of riparian vegetation (m) j List & map dominant Typical Width {m)/Dcpth (m) Neloclty (mlscc Transect
on least buffered side: 0 vegetation on back ~~c: m wide * - ------------ --- -> Al"lificiqlly Channelized D no [X] D D li .07m1'1" +['~ ; ~Sm0]
• . , ~ ""vcro oorno rccoocry tnootly rccovcr<>d ' ' . ArtlfiCi8lly Impounded 0 yes more oinuuuo ' ' ' High Waler Mark: b '/ia, I + I I - " I -1:1- . I [i m .. dee~ ' t
~1•3 mdeepl I I mde~ rn atxwo r<lS&nl wruar levol '"'""' d dr rn m m abOvo b<id
Canopy Cover % : Open : ISi'l Lighlly Shaded (11·45%): 0 Moderately Shaded (46-80%): 0 Heavily Shaded: D .
SEDIMENT/SUBSTRATE
Sediment Odors: Normal:~ Sewage: 0 Pelroleum: D Chemical: D Anaerobic: 0 Olher: 0
Sediment Oils: AbsentD Slight i:::jg Moderale: 0 Profuse: 0
Sediment Deposition: Sludge: fXl Sand smothering: ~~~onh~ modorato Silt smothering· ~l?anhe severe · sh ht moderate Other· severe ·
Substrate Types %coverage times sampled "Jl'l]<od Substrate Tx:ees %coverage #times sampled method -Woody Debris (Snags) ~and l!eaf Packs or Mats Mud/Muck/Silt
Aquatic Vegetation f.- Other: ---Rock or ble Olhor: -------Un!!ercut banks/Roots I J o-rtrrY' aerial view sketch of habitats found In 100m section
1 Ol!ALIT't Deplh (m): jTemp. ('C): pH (SU) D.O. (mg!l): Cond.·,,
I a'r's:;JiniN loo!l: u jm)
Top l'. ;; 24·1/, 7 ; . ' H l•
i I ~r-·<l~ '7• ) . I " I Bottom I· 7 11.:':'7.0< "'1 • < I • 14 < - (">(
Syslem Type • 1 0( 1~~·2,;:~ 7f~~;ds~:•,;:r~;;"'"' ) Lake [ J , I Estuary: Olher• rl Water Odors (checkbox): Normal: Sewage: J Petroleum:[ Chemical: [ umor•l
Water Surface Oils (check box): None: D Sheen:~ Globs:O Slick:O
Clarity (check box): Clear: [ Slightly turbid: J Turbid•@
Color (check box): Tannic: D Green (algae) [k'] Clear:O Olher: [
i R~o .f.it!tm•\ 1 ~lJ2, .... ~ evv-.J V\.al Periphyton -g g ~
b~~ Fish Aquatic Macrophytes ~ R B
~d.f<t!..O Iron/sulfur ~ n
Grc:u '1. "'- 0 (' cd . .[1 ' " " to 'yfv
Ll '-'

STATE OF FLoRIDA DEPARTMENT OF ENVIRONMENTAL REGULATION
MARINE BENTHIC HABITAT ASSESSMENT FIELD DATA SHEET
SUBMITTING AGENCi CODE· STORETSTATIONNUMBER: lo;-w= 'I RECEIVINGBOOYOFWATER: SUBMfnii>IG AGENCY NAME· ~ar oolfq 1o % ~s c~. REMARKS:
hcf!.p LOCATION: of Scv,~ L"'-VIP Flr,~~ce {o.-.) ~ s~
Habitat Parameter
llll§Ii:ff/ig#l Excellent Good Fair Poor
Littoral None----Unaltered Mostly natural Shoreline consisting Shoreline consisting
Alterations shoreline. shoreline, but with mostly ofriprap and almost entirely of 9-10 points occasional riprap. vertical seawalls. vertical seawalls.
IlL ·~ \ ----~ 6-8 points 3-5 points 0-2 points
At least four Two or three One community No communities communities observed communities observed observed from those observed from those
Community Types from the following from those listed. listed. \istad. list: mangrove 26-37 points 13-25 points 0-12 points
Observed swamp, marsh, oyster
li: tJSiiiiJTII bar, grass bed, reef,
b,m<" ~!> saltern, natural beach, or tidal creek. ~~u~ 38-50 points
Tidal Fluctuation >0.75 m. 0.5-0.75 m. 0.25-0.5 m. <0.25 m.
1•'&\'fil 4-5 points 3 points 2 points 0-1 point
Freshwate.r Only natural runoff .. Mostly natural runoff, Considerable Extensive manmade
Discharges/ 9-10 points but with a few, small storm water discharge discharges, especially
Alterations storm water sources. from local roads, from canals draining
6-8 points parking lots, etc. large tracts of land.
1-'lf'j 3-5 pOints 0-2 points :, Rx: Light to moderate Heavy wave action
Flow and wave action present sometimes present except under the even during average
Wave Action harshest weather weather conditions, o conditions. Flow flow restricted by
&II unrestricted by manmade structures manmade structures. so that velocities arD
9-10 points very high. 0-2 points
Sediment Type Combination of sand, Primarily sand, with Mixture of sand and Anaerobic mud. gravel, and shell. small areas of mud. mud, or well-aerated 0-3 points 12-15 points 8-11 points mud only.
4-7 points
''··- ~ ' ..... TOTAL SCORE 1113 L ... :$!
SIGNAllJRE;
:s- fov-~c:J:Su~ dr~J ,._, s t c'- Tw ru;t, - C> (-,"'
STATE OF FLORIDA · ~ r DEPARTMENT OF ENVIRONMENTAL PROTECTION '([" s
1·,1· c(' e
7ei"'-<Jl (\
((LJ ~I q,l..C..9t:L.t. \ PHYSICAUCHEMICAL CHARACTERIZATION FIELD DATA SHEeT '""""' ~ io<nle \
SUBMITIING AGENCY IXIOE· SUBMITTING AGENCY NAME·
STOAET STATION NUMBER DATE (MID'?~ TiME RECEIVING BODY OF WATER: \
;LL!-Ol OO'i( ·c »'('1b <f:oJ.o 'vk._kc,.lc.r ~""-- \
REMARKS: i.J:~J..-V fu:i....t I
LOCATION: FIElD IMIAME: 1 of' Sa_/<'-ovf-o._, WI,JJF Test s;t_,_ \
RIPARIAN ZONEIINSTREAM FEATURES
Predominant Land-Use in Watershed (specify relative percent in each category}:
ForesVNatural Silviculture Field/Pasture Agricultural Residential Commercial Industrial Other (Specify)
I I [too I I Slight [2(] Moderate D Heavy 0 J 1
Local Watershed NPS Pollution (chC!ck box): No evidence .• D'='p~Silig~hitnDNfi~M(;;i;od~ejir~a~te~pj;o~t0e~nt~ia~lo\D~~Oi;b~v~ioi,u~s~s~o~ucirc=e=s~(KJ V Width of riparian vegetation (m} I List & map dominaflt Typical Width (m)!Depth {m) Neloclty {mlsec Transect on least buffered side: 0 vegetation on back _ ~ ___________________ _ 1..?2... m w1del ->
Milicially Channelized D co ~ I&] D D 5Qffik1+ +[.Qsmlej + Q'()<jmle I ...
11,, ~~.
1 .•. "' rl!,.~•oroorecovory mostly~<~<:_oY<>to;<f 1 1 I c:;;:·_ ~
/\r!lfiCI3ny lmf.'ounded Dyes mo1os~<Nc vcJ.... 1 1 1 ...>OI.I.kt~ /
High WaterMark: I 0·5 I + 11·75 I -I ~·25 I [J mdoo~l ' ff "·'''.' .. P] m abovo ro,onl woJor O>vol presonl ;f,;: 1h on ml m abOW&ld . +[! • h nl deep I .
Local Watershed Erosion {check box): None D
Canopy Cover%: Open: D Lightly Shaded (ljr45%J"IS(] Moderately Shaded (46-80%): D Heavily Shaded: D
SEDIMENT/SUBSTRATE ~ 1 <1"'-'~ )/N.od.oc-J. '
.Sediment Odors: Normal: 0 Sewage: D Petroleum: D Chemical: 0 Anaerobic: IXJ Other: 0 Sediment Oils: Absent: D Slight: Jj] Moderate: [KJ Profuse: 0 Sediment Deposition: Sludge: fXI Sand smothering: none moderate Silt smothering· nl?n1e moderate Other: sli h1 severe · sh ht severe Substrate Tvoes %coverage times sample !---'method Substrate Tvoes %coverage # times sampled ·---
Woody Debris (Snags) --- and ---l'.caf Packs or Mats Mud/Muck/Silt
r ' ....
1 Other: --- ..
Aquatic Vegetation.-- ----Rock or Sj:).Q-H"Rubble Qltl<>f. Un~ut banks/Roots Praw aerial view sketch of habltai~ found In 100m section
vVATER QUALITY Depth (m): Temp. (CC): pH (SU): D.O. {mg/1): Cond. lj.Lmho/cm) Secchi (m): or Salinity (ppt):
,. " -- ------· ····- '
Top II C . ., ::l ·0'1 ·S lt-1·311 ·:l Mid-depth I a,, ·'12 • I . UeZ;J. l ·3 I • .2. Bottom I• S :J£, .ql '7·11. o.oll :''"
System Type: Stream·O( 1st- 2nd order 5th - 6\tl order ) Lake:O Wetland:D Estua<]': lEJ Other: 0 · 3rd - 41h order 7th order o'r"Ofeater
Water Odors (check box): Normal IXJ Sewage D Petroleum: D Chemicai:O Other:O
Water Surface Oils {check box): None:O Sheen lKJ Globs: liJ Slick0
Clarity (check box): Clea<:Q Slightly turbid: D Turbid: IRJ Opaque:O
Color (check box): Tannic:D Green (algae): D Clear:D Other: rKJ S..o<• ;:,;;' h~ J[• '2 "I Weather Conditions/Notes: Abundance: Absent Rare Common ADundant lz· Ct~, ;n ''ll;'j' Ld:ILe wind Periphyton D llll D D
fish D D D ~ Aquatic Macrophytes ~ R R R Iron/sulfur Bacteria ~
SMJP!.A:::~FI? ~ &a,..,. \'sz.v IC:AE: ~'-£' lr 0. A
[.,.;:;,;k 0 G {)
STATE OF FLQRIDA DEPARTMENT OF ENVIRONMENTAL REGULATION
MARINE BENTHIC HABITAT ASSESSMENT FIELD DATA SHEET
STORET STATION NUMIJ.ER: REC£1VING BODY OF WATER: SUBMITTING AGENCY CODE·
SUBMITTING AGENCY NAME· -I ;J.tto l 0 O'i f {,()fu.t-a_ l=.,r Ba<-jt'V\..
REMARKS:
Habitat Parameter '"1sc&fe1\" 1%.-.-.. ' ,.,._,::,,,.,•.w:~:l
Littoral Alterations
l!W
Community Types Observed
IT"/ '~ "%%1 L t..)o~
Tidal Fluctuation -Freshwater Discharges/ Alterations I~'Wll --..;{illf%
Flow and Wave Action
!\lN.IJil;ij
Sediment Type
!l ' ''
•
Excellent
None-Unaltered shoreline. 9-10 points
Good
Mostly natural shoreline, but with occasional riprap.
6-8 points
Fair
Shoreline consisting mostly ofriprap and vertical seawalls.
3-5 points
At least fotir Two or three One community communities observed communities observed observed from those from the following from those listed. listed. list: mangrove 26-37 points 13-25 points swamp, marsh, oyster 1 _ ·Y\..A.-(2~ -r bar, grass bed, reef, ~-J.J saltern, natural 0 ..... ~ c;y...... beach, or tidal creek. ~U-1 · 38-50 points
>0.75m. 4-5 points
Only natural runoff .. 9-10 points
Light to moderate wave action present except under the harshest weather condit:ions. Flow unrestricted by manmade structures. 9-10 points
Combination of snnd, gravel, and shell. 12-15 points
0.5- 0.75 m.
3 points 0.25-0.5 m. 2 points
Mostly natural runoff, Considerable but with a few, small storm water discharge stonnwatcr sources. from local roads, 6-8 points parking lots, etc.
3-5 pOints
Primarily sand, with small o.reaa of mud.
s-u points
Mixture of sand and mud, or well-aerated mud only.
4-7 points G
TOTAL SCORE
Poor
Shoreline consisting almost entirely of vertical seawalls.
0-2 points
No communities observed from those listed. 0-12 points
<0.25 m. 0-1 point
Extensive manmade discharges, especially from canals draining large tracts of land. 0-2 points
Heavy wave action sometimes present even during average weather conditions, o flow restricted by mnnmadc structures so that velocities are very high.
0-2 points
Anaerobic mud.
0-3 points

\..!_) Q(.. rr-.,Cl,..-~11~;.,. Vol" I '"""-' -"' • .,.,__ l "-" \,
(2..'") .3 f=~,o..u =J(.:.W > . ' STATE OF'FLORIDA 3 fu w«.O..r ~ t.h...o. o..J:{dJJ. .
DEPARTMENT OF ENVIRONMENTAL P ECTION r-V'il:> S hmrU, (.of' . flu. PHYSICAUCHEMICAL CHARACTERIZATION FIELD DATA SHEET ,,_,,oo, fx;rfO\,-... ~cl tr~'·
sumAmiNGAGENCYCODE· STORET STATION Nli~BEA:
;;~1 llo10 I RECEIVINGJO~WATER: &,;.rl SUB~ITTING AGENCY NAME· ;2. 'tO ( DO(i'l vJ lu_ <" 9-r • VI .
RE~ARKS: L.£\.~,.,'1 ~ COUNlY: LOCATION:
of Set-r7c.Sok hXcJTI' fiELD 10/NAME:
)1 /:<; p<-.t.r"-""k C~j ,.&')/- 7_
RIPARIAN ZONEIINSTREAM FEATURES
Predominant Land-Use in Watershed (specify relative percent in each category):
ForcsVNatural Silviculture Field/Pasture Agricultural Residential Commercial Industrial Other (Specify)
I I I I I I I I I :Lc- I I >:1'0 I I I I I Local Watershed Erosion (check box): None D Slight 00 Moderate D Heavy D
Local Watershed NPS Pollution (chock box): No evidence D Slight0 Moderate potential D Obvious sources [)(
Width of riparian vegetati(; (m) List & map dominant Typical Width (m)/Depth (m) Nclocity (mlsec Transect
on least buffered side: vegetation on back ~5 mwide
Artiliciqlly Channelized D no J~!. D D -- • • ... uu 'p;;£ u.--
; tfi·•.Hml' I ·>
b~; "' <£;;;;;:] "'rut-, . .. .......m"!; '""voro $Omo recovery moatly rocovored ' Ar11f1Cially Impounded 0 yes mo•• oinuou• ~' ' '
High Water Mark: I 0 •.S I + I I • ,§ I - I ;.! ' 0 I lo 4 4 m deeP I ' t
'fj:;5_ c;::<§'J p:_:, m deopj m nbov<1 rosonl woJor lovol presantlh rn m m abov<> G>d
Canopy Cover % : Open: IZJ Lightly Shaded (1 1 -45%): 0 Moderately Shaded (46-80%): 0 Heavily Shaded: 0
SEDIMENT/SUBSTRATE frJ..u...""""-~. ~<--'- C<''->L .,, ~·rl.l k""" cJ~J M<!!\
Sediment Odors: Normal: 0 Sewage: 0 Petroleum: 0 Chemical: D A~aerobic: "1' Other: [KJ Ci-J.Ooj~ Sediment Oils: Absent:O Slight:D Moderate:~ Profuse: D Sediment Deposition: Sludge: fYl Sand smothering: ~~?~h~ moderate Silt smothering· ~l?nnhe moderate Other: severe · sh ht severe Substrate Types %coverage times sampled Q)J3lllod Substrate TvOes "/o coverage #times sampled method
Woody Debris (Snags) -- ~and --!.::eat Packs or Mats Mud/Muck/Silt .. ·----" . ... '·---- ... -
Aquatic Vegetation Other:
Rock or u ble Other;..--
Undercut banks/Roots DraW aerial view sketch of habitats found In 100m section
~ATER QUALITY Depth (m): Temp. (oC): pH (SU): D.O. {mgll}: Cond. W.mho/cm) Secchi (rn): or Salinity (ppt): .. . . . Top ·3 . '1 ·' ~~ ~~- (;.,
Mid depth . • .. 3· _;. 0
"· . 7.. o.:, Bottom I· 3 Ill . "" I -r·f:>J .:) " -~
System Type : Stream·O{ 1st- 2nd order · 3rd- 4th order 5th-6lh~r~~r ) Lake:O Wetland:O Estuary:[] Other·D 7th order or realer ·
Water Odors (check box): Normal: [X] Sewage:O Petroleum: D Chemicai·Q Other:O
Water Surface Oils (check box): None: D Sheen:IS(I Globs:O Slick:O
Clarity {check box): Clear: 0 Slightly turbid: 0 Turbid:O Opaque: IZI cU.u. te' p r (.)~ Color (check box): Tannic: D Green (algae): D Clear: D Other 1')516rn..'»u sA./~ Weather Conditio.ns/Notes: ~ ~ c..t... F' Uho\...t Abundance: Absent Rare Common Abundant
Periphyton D r5il D D I A U.._l h<1:,:j<'"'- d.wt ~ t::Jr...2
Fish D D D [lij w<-0TP ~;J stl'n1';j vp ct01 Aquatic Macrophytes tiZJ R R B Se.t;;(., rnP. c Iron/sulfur Bacteria ~
SAMPliNG TEAM:

STATE OF FLQRIDA DEPARTMENT OF ENVIRONMENTAL REGULATION
MARINE BENTHIC HABITAT ASSESSMENT FIELD DATA SHEET
SUBMITTING AGENCY CODE· ~ ISTORET STATIONNUI.!BER: J;;r;.,~: I RECEIVING BOOYOFWATER: SUBMITTING AGENCY NAME· J.tto r o O'i ~ Vr6 vJ Jv..,&,J:a,- e "'-'1"""'
1-s,--.) 1'L&..t> IC.ti of 5oicHk ,J<-<JIP rerl-- 5d-c 2'-
Habitat Parameter /@:'''' ~" 'I >-- .§g,P;t,$#,
Excellent Good Fair Poor
Littoral None-Unaltered Mostly natural Shoreline consisting Shoreline consisting
Alterations shoreline. shoreline, but with mostlyofriprap and almost entirely of 9-10 points occasional riprap. vertical seawalls. vertical seawalls.
ltlii'.-w!wl 6-8 points 3-5 points 0-2 points
At least four Two or three One community No communities
communities 1_:_: ~~ _ from those observed from those
Community Types I from the following from those listed. listed. I list mangrove 26-37 points 13-?.S.·:~-l-- 0-12 points
Observed marsh,
1-R~Jitf~illt>l ! ba_r, grass bed, reef, :3'. ;,, '"'
natural ,,..'h or tidal creek. •;;:.~,' ~ '
points ~-r ~.
Tidal Fluctuation >0.75 m. 0.5 • 0.75 m. 0.25 · 0.5 m. <0.25 m.
l&ll.l-lml 4~5 points 3 points 2 points 0-1 point
Freshwater Only natural runoff .. Mostly natural orr Considerable Extensive manmade
Discharges/ 9-10 points but with a few, small storm water discharge discharges, especially
Alterations storm water sources. from local roads, from canals draining .... 6·8 points parking lots, etc. large tracts of land. 3-5 pOints 0·2 points .
Light to moderate Heavy wave action
Flow and wave action present sometimes present
under the even during average
Wave Action weather weather conditions, o Flow
14111?.1 flow restricted by
by manmade structures so that velocities are
19-10 points very high. 0-2 points
Sediment Type Combination of aand, In ~' sand, with of sand and Anaerobic mud. and shell. small areas of mud.
1 ~~d.-or well-aerated 0-3 points f'.WWij\j 119_1~ points 8-11 points mud only. ·:::.,~.. . ... ~ki> '":
14-7
.·«·wOo·<·"•>
TOTAL SCORE /~I
-
1plc Source:
County:
1ct I District:
ES Permit#:
S Sample#:
FDEP Biology Section- Acute Bioassay Bench Sheet
C-'7 ,f ['-"•-Jo/~ "'F-•7/" Sample Collection: Date /~/>- i bt) Time I):!,~'Test Beginning: Date lv/'-'f /?'e; Time 7SO tJ
/ Test Ending: Date 10/Ji/ft. Time /500 d"'d r-~ G..-"",'"-ye.f Si..J
Organism Batch #: _§_L_ Diluent Batch #: ZJ::- tAkJI FLOO Lf o I I I Organism Age: - I ~
1£7 777 UMS Job'' jJ,.(;""-'-oc'=-''--"'--"JCJ';'::-:c"-:c0 (' 11 f,-'dsl
li-t -1? -- Test Organism: -"-7\''lr""-''-'""'-'L'"'-""'---'-'-"'"-"-'---' ~!';;.,;;~-~-::-:;;, Instrument - 1 tr- creen1 I Definitive Calibrations: pH Temperature "C D.O. mg/L Conduclivity~mhos/cm
atic Renewal! Flow-through meter# 7851 90H018262 90H018262 G9005749
:Number:____&_ot_h_ Ohr 7.<[email protected] _!ll®2-3"L_f.2____®2-f'.l "C /J:>,i @~
narks: /.0 @7.o
24 hr 7.0 @ 7.0 '2!i-l @~
9 0@ 9-0
48 hr 7,0@ 7.0 ;)9,/ @i!.Z..!_ 'jJJ_@ 'f,o
UNCORRECTED ,--------,------,--------,--------1 Cond. {mmhos/cm)
Number Live pH Temperature (oC) D.O. {mg/L) o_nd. (~mhos/cmJ:::
-c::-,c:,:-:,-_ ---r-::C:;:h-:-,m-be;-::c-:#f-co;-;-hr 24 h 46 h o hr 24 h. 48 h o hr 24 h 46 h o hr _24 h 46 h o hr 24 h 48 h
'k/1 41 "-c-?---· s '"·' >rlil«, 21.2 -~-r/ ,,~~ 1.9_ 7-? 'l? 200 z,;,. 2" -fzj} LI'- !;~ 5~~--:s:o----tc\l,;-'·-cl _(f/j "(_,- ;~.2 25-" ?.D! 1'1 7!? )& 12o 23' ~-!-£ n.C A-} c; -- s s 8.1- 8-i' -o;· Z4-l __ 2S-i ""~ _--r_;j 79 I'H zc;o 2tO zw !:;t> 'li"(_S _;, c; 8.1 fL_'fsr_,- 24-2 ~r"''~' '-1~]-9 l~ z5o 26o n>-2oU _A;I s;__ 5 S cp li~.Y ]±1 2S, 2'l'-~ _},5 77 h~ !4ZD '~11.£ '"''' ,,,;u? tt-L '• S' S 'J'l- B-31i'.4 '-'·'" !Ji 1-~~ 7-S 77 '·' 1'1:!5 __ 41.\ 5C-
S .s +_ 1- ,; ~ l\>.'f 24,~ ?f-' 2~-,- '-"' 7-6 h-~ ,qz_< i,l>eo C:oo c; S ~7 s)l~'l H72YJ?'2'if_ '-" lti hJ< !42?Ji'to;<Cco
----- -~-- -- --1--t-~- +--+- '--+--+·· ---~+---t
---+--1- ----1--J~~- . ---
~~-.
--t--~-
-~--- --- -----~
... ----' ~ --· -- -~- ------
---
.
-"-----··
---· -----
__ Moo:aS-urediLCJ_·,;ded bt · · Recorded by
- r-~ ~-~r---
-----·· ---
··- --- -------
-- ---
-----
-- -~~-
-+-~+--~
···--~
--- --~
---
--~ ~ --
------~
-r-~
- 1-
lr~v~~\1gators' Sr~natur.Q_:. / ~--- Salt Water I Water Quality Parameters
' ' ~,.- :.-'~--- Well Water 20% Min W - -- -- --~ - ater Sample Method
)[ ~- -1/!. j,td,_t~ ' . ' - -, Field Total Residual Cl2 {mg/L) · [___ -- ___ _ --- - ---
lab Total Residual Cl2 (mg/LJ. _ L.. .o3 '--- · 0.:'3 -luJ;_, kf-, (i. -( ,<J co:____ ____ ,( .l!3 Dk' "llJt - - --- --
' - 011~~ Jj fW:< .{ I ~;~f::_ f/tjcf-( ---- -
-
---··- --
....
.fX Alkalinity (mg/L as CaC03) ____ ;,;.. ~-+----! Hardness (mgflasCaC0 3) :____!&...__ ______ '<'c _ _z// --< / - . '" ----- ...........!::: :...___ _)"f/JO{
-s_o
_rrL --~ _ __ [)('<_'-~
-- . -:q , &c', -"~-"' Tolal ammonia (mgll as N) _ ~"~·~· ~·~<27-_'---'''--"-c ' I <.c c, y
Ammonia Ammonia Ammonia Control
MRtor #9R130 Meter Slope:~_~'/, _L__ Blank: L' L"W~! Salinity: 0
('I:!. I(_/\) /)fl/
Sample ppl ,. ' 0 ppl
S;J rmtv

Test Number:__!___ of~ Remarks: tJ ::-j~
Temperature oc 90H018262
&2_® 137 'J.o ®1-0 <Jy-y- ~,1°~''7 @~s-.o oc
24 hr 7..o @ 1.o 2S ; @ 2f.? fl.fr @22;J oc 11ti!.?- i~Yi.p
1D ®.'lQ . . , . 1~;\,~ @/~·;'., ®2L,l' "C 48hr ~.:®7.0 Jll,/ @;1\1,2- 5,'/ ®2'/J_oc fl2.'[email protected]_
{f,J) ®'iJL 9fS ®Rr.l2_®C)J;Q_ "C
UNCORRECTED
Number Live pH Temperature (°C) D.O. (mgll..) Cood,Jromho~ ond. (j.!mhos/c
Cone. Chamber# o hr
Cf<A A . )
~- !3 f!, _;
cTL c c_ s cr~ D D ~ Inc· A ~ -/Do·% .d (!, s: ;oo:hc c_ 5 /0 "0 u !!:' ;_ D s
--·---·-
--------
-- ~-------
--- ------~
----------
·------· ---- ---
·-·· - -----··
---------
----.
---------- -------- -
------ ·-
(' _ M_easumd/Loade~___;___ ·11t:: Recorded b
Investigators Signatures
->. ~-<-"·'<~..-<'-
/j~f::'vi1fi!if!E ;::t:;;Y "'JA
C)
riivfewer form undared 4/01196
24h 46h o hr 24 h. 46h 0 hr 24h 46h o hr _24 h 46h 0 hr
'> s 8,0 8.1 J). 'f 24.4 ·-;., 9' 'l,4 11-5 5 .s B, I 24-+ ~!5
> s Bl ~4,3 :t/5 s 5 8.i ;zA.O +!5
~ "' "-5 6.5 23.6 lvd J8 '1-,":1 3 "'' > s 6.'5 24,3 +, 7-
s !; il" lA,Z <.? ., - -· ) ti •C liS ]A, I ·:;.. 7--- ---
--·- ·-· --- --·
.. - -- --··
---- - - ---.. -· ------·
-- .. ·--- - - --
----- --- ---- ---- -- --
-· --___ _, ----
-- - -·--- ----- --"·- ----- -
----- ----- ---- ---
---- -- -------- ... ------ -- -- ... - -""" - -- ... ----- --· ---- '"'"' ____
...... ·- ---- --- C-- -- -- ---
- -/);.-.! --c;~-- (q\ ·pw ' ·- if· . ·--·- - pi-· ,,, o- JS - --:r.s.: _j --, s "J.S "JS •J:S
Salt Water I Water Quality Parameters
Field Total Residual Cl2 (mgll}
Lab Total Residual Cl2 (mg/L)
Alkalinity (mg!L as CaC03)
Hardness lmg/L as CaC03)
Total ammonia (mg/L as N}
Well Water
I'' : : _!:_ t:S
I . -. ;. .) ---<--
I J_ c . I -o
. L' C C/ -:;-
20% Min Water Sample Method
:t!!~F:. l_, 03 .!:..:_~' ::s [)K .. JQG <<--
--!lAc i'< _ 1o /So
'i'o l%< HAcrl ·-.(o (1 '1:. <> -<-~t U-!<MJ
Ammonia Ammonia
Meter #98136 Meter Slone: ..., ~r.;,t/ L Ammon~a Control
Rl~nk L..0<i) i 7 SRiinitv- 0
24 h 48 h
18'5 19'5 8C -
H5 •W> i4+5' 42C --1<¥15
---~-
-- "" ---
-
--
--
------- --
- -----
-- ---
-·--- --
--"-- --
-- -
D~-j
Measure_~
1-'0 ____ PN nN
:)&______
(J ppt

Phytoplankton taxa list and densities (#/mL) for the City of Sarasota WWTP, collected via subsurface grabs in Whitaker Bayou (test sites) and Bowlees Creek (refernce site) on 28 October, 1996.
Refernce Site Test Site 1 Test Site 2 Cyanophyceae Lyngbya sp. 11 Bacillariophyceae Skeletonema sp. 32 239 420 Rhizosolenia setigera 420 Nitzschia sp. 21 Euglenophyceae Eutreptia sp. 357 286 420 Euglena sp. 315 Dinophyceae Cryptoperidinium sp. 389 4917 48309 Peridinium sp. 11 48 420 Ceratium sp. 21 Cryptophyceae Chroomonas sp. 210 Cryptomonas sp. 32

, " Fill Out, Th,isBection FOr All Surface, Water Di~charger Inspection~ (CEI, CSI, CBI, PAl, XSI- RI Optional) '"'' ""'"'' ""hw,'~:;, ' '""'*"'''~:::,"'' ''" "q,;, ,;;,';"
Transaction Code NPDES NUMBER YRIMOIDA lnsp Type Inspector Fac Type
21 66
Transaction Code NPDES NUMBER YR/MQ/DA lnsp Type Inspector Fac Type
1l::J 2l:J slrlt lolc 14lol7bl I 111 12 19 k l1lo Us>l 17 18 l2] 19 l:J 2olJ RemarkS
II II Ill II Ill Ill II Ill II Ill II Ill II Ill Ill II Ill II II 21 66