Embed Size (px)
Citation preview

P.O. Box 1049, 1800 WaterMark Dr., Columbus, Ohio 43266-0149
State of Ohio Ecological Assessment SectionEnvironmental Protection Agency Division of Surface Water
Biological and Water Quality Studyof the Black River (with selectedtributaries) and Beaver Creek
Lorain, Medina, Ashland, Huron, and
Cuyahoga Counties, Ohio
✪
Mayfly (Stenonema)
Hog Sucker (Hypentelium nigricans)
January 14, 1994
DSW/1992-12-8 1992 Black River June 13, 1996
Biological and Water Quality Study of the Black River Basin (with select tributaries)
and Beaver Creek
Lorain , Medina, Ashland, Huron, Cuyahoga Counties, Ohio
November, 1993
OEPA Technical Report EAS/1993-12-8
prepared by
State of Ohio Environmental Protection AgencyDivision of Surface Water
Ecological Assessment Section1685 Westbelt Drive
Columbus, Ohio 43228
andSurface Water Section2110 East Aurora RoadTwinsburg, Ohio 44087
DSW/1992-12-8 1992 Black River June 13, 1996
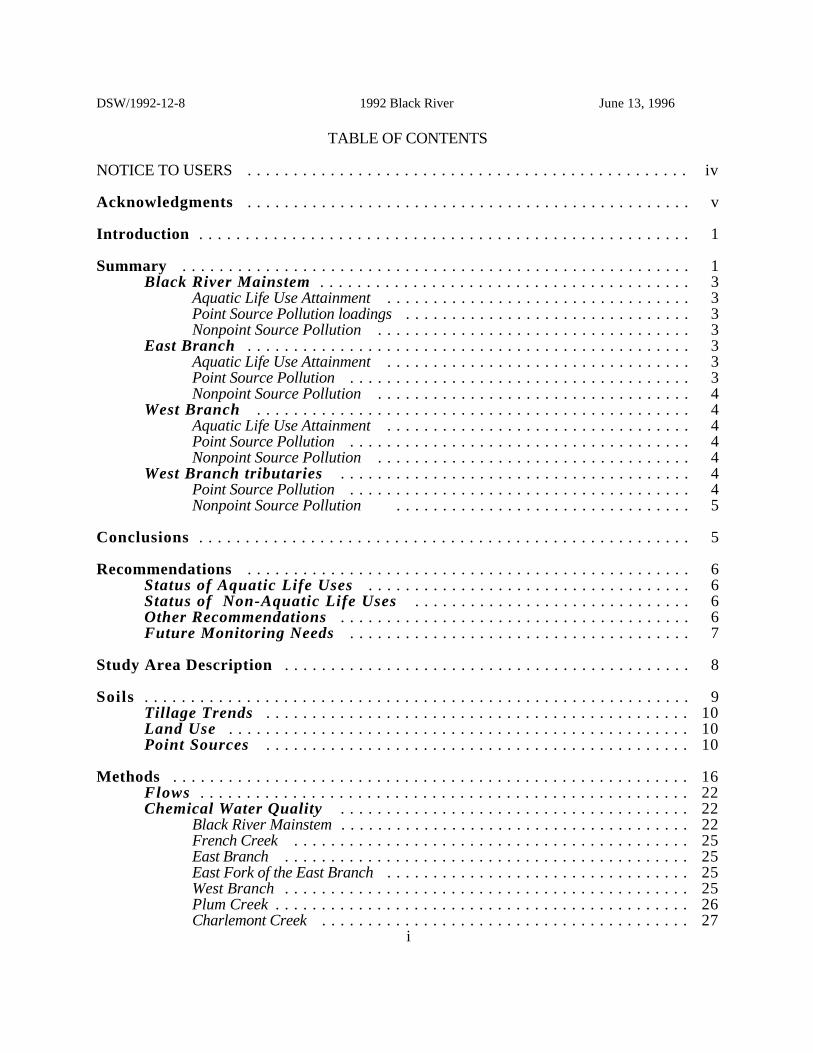
TABLE OF CONTENTS
NOTICE TO USERS . . . . . . . . . . . . . . . . . . . . . . . . . . . . . . . . . . . . . . . . . . . . . . . . iv
Acknowledgments . . . . . . . . . . . . . . . . . . . . . . . . . . . . . . . . . . . . . . . . . . . . . . . . v
Introduction . . . . . . . . . . . . . . . . . . . . . . . . . . . . . . . . . . . . . . . . . . . . . . . . . . . . . 1
Summary . . . . . . . . . . . . . . . . . . . . . . . . . . . . . . . . . . . . . . . . . . . . . . . . . . . . . . . 1Black River Mainstem . . . . . . . . . . . . . . . . . . . . . . . . . . . . . . . . . . . . . . . . 3
Aquatic Life Use Attainment . . . . . . . . . . . . . . . . . . . . . . . . . . . . . . . . . 3Point Source Pollution loadings . . . . . . . . . . . . . . . . . . . . . . . . . . . . . . . 3Nonpoint Source Pollution . . . . . . . . . . . . . . . . . . . . . . . . . . . . . . . . . . 3
East Branch . . . . . . . . . . . . . . . . . . . . . . . . . . . . . . . . . . . . . . . . . . . . . . . . 3Aquatic Life Use Attainment . . . . . . . . . . . . . . . . . . . . . . . . . . . . . . . . . 3Point Source Pollution . . . . . . . . . . . . . . . . . . . . . . . . . . . . . . . . . . . . . 3Nonpoint Source Pollution . . . . . . . . . . . . . . . . . . . . . . . . . . . . . . . . . . 4
West Branch . . . . . . . . . . . . . . . . . . . . . . . . . . . . . . . . . . . . . . . . . . . . . . . 4Aquatic Life Use Attainment . . . . . . . . . . . . . . . . . . . . . . . . . . . . . . . . . 4Point Source Pollution . . . . . . . . . . . . . . . . . . . . . . . . . . . . . . . . . . . . . 4Nonpoint Source Pollution . . . . . . . . . . . . . . . . . . . . . . . . . . . . . . . . . . 4
West Branch tributaries . . . . . . . . . . . . . . . . . . . . . . . . . . . . . . . . . . . . . . 4Point Source Pollution . . . . . . . . . . . . . . . . . . . . . . . . . . . . . . . . . . . . . 4Nonpoint Source Pollution . . . . . . . . . . . . . . . . . . . . . . . . . . . . . . . . 5
Conclusions . . . . . . . . . . . . . . . . . . . . . . . . . . . . . . . . . . . . . . . . . . . . . . . . . . . . . 5
Recommendations . . . . . . . . . . . . . . . . . . . . . . . . . . . . . . . . . . . . . . . . . . . . . . . . 6Status of Aquatic Life Uses . . . . . . . . . . . . . . . . . . . . . . . . . . . . . . . . . . . 6Status of Non-Aquatic Life Uses . . . . . . . . . . . . . . . . . . . . . . . . . . . . . . 6Other Recommendations . . . . . . . . . . . . . . . . . . . . . . . . . . . . . . . . . . . . . . 6Future Monitoring Needs . . . . . . . . . . . . . . . . . . . . . . . . . . . . . . . . . . . . . 7
Study Area Description . . . . . . . . . . . . . . . . . . . . . . . . . . . . . . . . . . . . . . . . . . . . 8
Soils . . . . . . . . . . . . . . . . . . . . . . . . . . . . . . . . . . . . . . . . . . . . . . . . . . . . . . . . . . . 9Tillage Trends . . . . . . . . . . . . . . . . . . . . . . . . . . . . . . . . . . . . . . . . . . . . . . 10Land Use . . . . . . . . . . . . . . . . . . . . . . . . . . . . . . . . . . . . . . . . . . . . . . . . . . 10Point Sources . . . . . . . . . . . . . . . . . . . . . . . . . . . . . . . . . . . . . . . . . . . . . . 10
Methods . . . . . . . . . . . . . . . . . . . . . . . . . . . . . . . . . . . . . . . . . . . . . . . . . . . . . . . . 16Flows . . . . . . . . . . . . . . . . . . . . . . . . . . . . . . . . . . . . . . . . . . . . . . . . . . . . . 22Chemical Water Quality . . . . . . . . . . . . . . . . . . . . . . . . . . . . . . . . . . . . . . 22
Black River Mainstem . . . . . . . . . . . . . . . . . . . . . . . . . . . . . . . . . . . . . . 22French Creek . . . . . . . . . . . . . . . . . . . . . . . . . . . . . . . . . . . . . . . . . . . 25East Branch . . . . . . . . . . . . . . . . . . . . . . . . . . . . . . . . . . . . . . . . . . . . 25East Fork of the East Branch . . . . . . . . . . . . . . . . . . . . . . . . . . . . . . . . . 25West Branch . . . . . . . . . . . . . . . . . . . . . . . . . . . . . . . . . . . . . . . . . . . . 25Plum Creek . . . . . . . . . . . . . . . . . . . . . . . . . . . . . . . . . . . . . . . . . . . . . 26Charlemont Creek . . . . . . . . . . . . . . . . . . . . . . . . . . . . . . . . . . . . . . . . 27
i

DSW/1992-12-8 1992 Black River June 13, 1996
Fish Tissue . . . . . . . . . . . . . . . . . . . . . . . . . . . . . . . . . . . . . . . . . . . . . . . . 27Collection/Procedures . . . . . . . . . . . . . . . . . . . . . . . . . . . . . . . . . . . . . . 27
Sediment Chemistry . . . . . . . . . . . . . . . . . . . . . . . . . . . . . . . . . . . . . . . . . 28Mainstem . . . . . . . . . . . . . . . . . . . . . . . . . . . . . . . . . . . . . . . . . . . . . . 28
Harbor . . . . . . . . . . . . . . . . . . . . . . . . . . . . . . . . . . . . . . . . . . . . . . . . . . . . . . . . . 28Point Source Improvements: 1982 - 1992 . . . . . . . . . . . . . . . . . . . . . . . . 29
City of Elyria . . . . . . . . . . . . . . . . . . . . . . . . . . . . . . . . . . . . . . . . . . . 31City of Lorain . . . . . . . . . . . . . . . . . . . . . . . . . . . . . . . . . . . . . . . . . . . 31
Point Source Pollutant Loadings Trends . . . . . . . . . . . . . . . . . . . . . . . . . 31USS/KOBE Steel Company . . . . . . . . . . . . . . . . . . . . . . . . . . . . . . . . . . 31Elyria WWTP . . . . . . . . . . . . . . . . . . . . . . . . . . . . . . . . . . . . . . . . . . . 36Oberlin WWTP . . . . . . . . . . . . . . . . . . . . . . . . . . . . . . . . . . . . . . . . . . 36 Grafton WWTP . . . . . . . . . . . . . . . . . . . . . . . . . . . . . . . . . . . . . . . . . 36Lodi WWTP . . . . . . . . . . . . . . . . . . . . . . . . . . . . . . . . . . . . . . . . . . . . 37French Creek WWTP . . . . . . . . . . . . . . . . . . . . . . . . . . . . . . . . . . . . . . 37Wellington WWTP . . . . . . . . . . . . . . . . . . . . . . . . . . . . . . . . . . . . . . . . 37
Physical Habitat for Aquatic Life . . . . . . . . . . . . . . . . . . . . . . . . . . . . . . . 45Macroinvertebrate Community . . . . . . . . . . . . . . . . . . . . . . . . . . . . . . . . . . 50
Black River Mainstem . . . . . . . . . . . . . . . . . . . . . . . . . . . . . . . . . . . . . . 50French Creek . . . . . . . . . . . . . . . . . . . . . . . . . . . . . . . . . . . . . . . . . . . 50West Branch Black River . . . . . . . . . . . . . . . . . . . . . . . . . . . . . . . . . . . 51Buck Creek . . . . . . . . . . . . . . . . . . . . . . . . . . . . . . . . . . . . . . . . . . . . . 51Charlemont Creek . . . . . . . . . . . . . . . . . . . . . . . . . . . . . . . . . . . . . . . . 51Wellington Creek . . . . . . . . . . . . . . . . . . . . . . . . . . . . . . . . . . . . . . . . . 51Plum Creek . . . . . . . . . . . . . . . . . . . . . . . . . . . . . . . . . . . . . . . . . . . . . 51East Branch Black River . . . . . . . . . . . . . . . . . . . . . . . . . . . . . . . . . . . . 51East Fork East Branch Black River . . . . . . . . . . . . . . . . . . . . . . . . . . . . . 52West Fork East Branch Black River . . . . . . . . . . . . . . . . . . . . . . . . . . . . 52Willow Creek . . . . . . . . . . . . . . . . . . . . . . . . . . . . . . . . . . . . . . . . . . . 52
Fish Community . . . . . . . . . . . . . . . . . . . . . . . . . . . . . . . . . . . . . . . . . . . . 57Black River mainstem . . . . . . . . . . . . . . . . . . . . . . . . . . . . . . . . . . . . . . 58French Creek . . . . . . . . . . . . . . . . . . . . . . . . . . . . . . . . . . . . . . . . . . . 59West Branch . . . . . . . . . . . . . . . . . . . . . . . . . . . . . . . . . . . . . . . . . . . . 59Plum Creek . . . . . . . . . . . . . . . . . . . . . . . . . . . . . . . . . . . . . . . . . . . . . 59Charlemont Creek . . . . . . . . . . . . . . . . . . . . . . . . . . . . . . . . . . . . . . . . 60Wellington Creek . . . . . . . . . . . . . . . . . . . . . . . . . . . . . . . . . . . . . . . . . 60Buck Creek . . . . . . . . . . . . . . . . . . . . . . . . . . . . . . . . . . . . . . . . . . . . . 60East Branch . . . . . . . . . . . . . . . . . . . . . . . . . . . . . . . . . . . . . . . . . . . . 60Willow Creek . . . . . . . . . . . . . . . . . . . . . . . . . . . . . . . . . . . . . . . . . . . 61East Fork . . . . . . . . . . . . . . . . . . . . . . . . . . . . . . . . . . . . . . . . . . . . . . 61West Fork . . . . . . . . . . . . . . . . . . . . . . . . . . . . . . . . . . . . . . . . . . . . . 61
Other Wildlife . . . . . . . . . . . . . . . . . . . . . . . . . . . . . . . . . . . . . . . . . . . . . . 67
Trend Assessment . . . . . . . . . . . . . . . . . . . . . . . . . . . . . . . . . . . . . . . . . . . . . . . . 67Chemical Water Quality Trends . . . . . . . . . . . . . . . . . . . . . . . . . . . . . . . . 67
Ambient Sites . . . . . . . . . . . . . . . . . . . . . . . . . . . . . . . . . . . . . . . . . . . 67Mainstem Surveys (1982 /1992): . . . . . . . . . . . . . . . . . . . . . . . . . . . . . . 67French Creek . . . . . . . . . . . . . . . . . . . . . . . . . . . . . . . . . . . . . . . . . . . 68Plum Creek . . . . . . . . . . . . . . . . . . . . . . . . . . . . . . . . . . . . . . . . . . . . . 68
ii

DSW/1992-12-8 1992 Black River June 13, 1996
Sediment Chemistry Trends . . . . . . . . . . . . . . . . . . . . . . . . . . . . . . . . . . 71Macroinvertebrate Community Trends . . . . . . . . . . . . . . . . . . . . . . . . . . 72
Black River Mainstem . . . . . . . . . . . . . . . . . . . . . . . . . . . . . . . . . . . . . . 72French Creek . . . . . . . . . . . . . . . . . . . . . . . . . . . . . . . . . . . . . . . . . . . 72West Branch Black River . . . . . . . . . . . . . . . . . . . . . . . . . . . . . . . . . . . 72Plum Creek . . . . . . . . . . . . . . . . . . . . . . . . . . . . . . . . . . . . . . . . . . . . . 72East Branch Black River . . . . . . . . . . . . . . . . . . . . . . . . . . . . . . . . . . . . 73
Fish Community Trends . . . . . . . . . . . . . . . . . . . . . . . . . . . . . . . . . . . . . . 73Black River Mainstem . . . . . . . . . . . . . . . . . . . . . . . . . . . . . . . . . . . . . . 73French Creek . . . . . . . . . . . . . . . . . . . . . . . . . . . . . . . . . . . . . . . . . . . 73West Branch . . . . . . . . . . . . . . . . . . . . . . . . . . . . . . . . . . . . . . . . . . . . 73Plum Creek . . . . . . . . . . . . . . . . . . . . . . . . . . . . . . . . . . . . . . . . . . . . . 73East Branch . . . . . . . . . . . . . . . . . . . . . . . . . . . . . . . . . . . . . . . . . . . . 74
Area of Degradation Values . . . . . . . . . . . . . . . . . . . . . . . . . . . . . . . . . . . 74
BEAVER CREEK SURVEY . . . . . . . . . . . . . . . . . . . . . . . . . . . . . . . . . . . . . . . . 77
Introduction . . . . . . . . . . . . . . . . . . . . . . . . . . . . . . . . . . . . . . . . . . . . . . . . . . . . . 77Study Area Description . . . . . . . . . . . . . . . . . . . . . . . . . . . . . . . . . . . . . . . 77Summary and Conclusions . . . . . . . . . . . . . . . . . . . . . . . . . . . . . . . . . . . . 78
Water Chemistry . . . . . . . . . . . . . . . . . . . . . . . . . . . . . . . . . . . . . . . . . 78Biological Communities and Stream Habitat . . . . . . . . . . . . . . . . . . . . . . . 79Status of Aquatic Life Uses . . . . . . . . . . . . . . . . . . . . . . . . . . . . . . . . . . 81
Recommendations . . . . . . . . . . . . . . . . . . . . . . . . . . . . . . . . . . . . . . . . . . . 81Future Monitoring Needs . . . . . . . . . . . . . . . . . . . . . . . . . . . . . . . . . . . 81
References . . . . . . . . . . . . . . . . . . . . . . . . . . . . . . . . . . . . . . . . . . . . . . . . . . . . . . 89
Appendix tables . . . . . . . . . . . . . . . . . . . . . . . . . . . . . . . . . . . . . . . . . . . . . . . . . . 91
iii

DSW/1992-12-8 1992 Black River June 13, 1996
NOTICE TO USERS
Ohio EPA adopted biological criteria into the Ohio Water Quality Standards (WQS; OhioAdministrative Code 3745-1) regulations in February 1990 (Effective May 1990). These criteriaconsist of numeric values for the Index of Biotic Integrity (IBI) and Modified Index of Well-Being(MIwb), both of which are based on fish, and the macroinvertebrate Community Index (ICI),which is based on macroinvertebrates. Criteria for each index are specified for each of Ohio's fiveecoregions, and are further organized by organism group, index, site type, and aquatic life usedesignation. These criteria, along with the chemical and whole effluent toxicity evaluationmethods, figure prominently in the assessment of Ohio’s surface water resources.
Several documents support the adoption of the biological criteria by outlining the rationale forusing biological information, the specific methods by which the biocriteria were derived andcalculated, the field methods by which sampling must be conducted, and the process for evaluatingresults. These documents are:
Ohio Environmental Protection Agency. 1987a. Biological criteria for the protection of aquatic life:Volume I. The role of biological data in water quality assessment. Division of WaterQuality Monitoring & Assessment, Surface Water Section, Columbus, Ohio.
Ohio Environmental Protection Agency. 1987b. Biological criteria for the protection of aquatic life:Volume II. Users manual for biological field assessment of Ohio surface waters. Divisionof Water Quality Monitoring & Assessment, Surface Water Section, Columbus, Ohio.
Ohio Environmental Protection Agency. 1989a. Addendum to Biological criteria for the protectionof aquatic life: Volume II. Users manual for biological field assessment of Ohio surfacewaters. Division of Water Quality Planning & Assessment, Ecological AssessmentSection, Columbus, Ohio.
Ohio Environmental Protection Agency. 1989b. Biological criteria for the protection of aquatic life:Volume III. Standardized biological field sampling and laboratory methods for assessingfish and macroinvertebrate communities. Division of Water Quality Planning &Assessment, Ecological Assessment Section, Columbus, Ohio.
Ohio Environmental Protection Agency. 1990a. The use of biological criteria in the Ohio EPAsurface water monitoring and assessment program. Division of Water Quality Planning &Assessment, Ecological Assessment Section, Columbus, Ohio.
Rankin, E.T. 1989. The qualitative habitat evaluation index (QHEI): rationale,methods, andapplication. Division of Water Quality Planning & Assessment, Ecological AssessmentSection, Columbus, Ohio.
These documents and this document can be obtained by writing to:
Ohio EPA - WQP&AEcological Assessment Section
1685 Westbelt DriveColumbus, Ohio 43228
(614) 777-6264
iv

DSW/1992-12-8 1992 Black River June 13, 1996
Acknowledgments
The following Ohio EPA staff are acknowledged for their significant contribution to this report.
Study Area Description - Mark WilsonPollutant Loadings - Dave StroudAmbient Chemical Quality - Dave StroudFish Tissue - Kelvin RogersBiological Assessment:
Macroinvertebrate Community - Mike Bolton Fish Community - Roger Thoma
Data Management - Dennis Mishne and Ed RankinTSD Coordinator - Roger F.ThomaReviewer(s) - Chris Yoder, Marc Smith and Jeff DeShon
This evaluation and report would not have been possible without the assistance of the study teamand numerous full and part time staff in the field and the chemical analyses provided by the OhioEPA Division of Environmental Services. Considerable assistance was provided by Jim Boddy,Dan Reed, Cindy Babitt, and Julie McCarthy of the Lorain County Health Department and BobDavic, Ken Frase, Steve Tuckerman, Suzy Wickham and Tod Chabuccos of the Ohio EPA.
Mary Ann Silagy of the Water Quality Modeling Section provided some of the chemical data usedin this report. Major assistance with the preparation of the study area map was provided by MarkWilson and Julio Perez.
v

DSW/1992-12-8 1992 Black River June 13, 1996
Introduction
The 1992 Black River basin survey extended from the area of Lake Erie enclosed by the BlackRiver Harbor breakwaters to the southern headwaters and included the mainstem (both lentic andlotic portions) and French Creek; the East Branch and Willow Creek, East Fork, and West Fork;and the West Branch and Plum Creek, Wellington Creek, Charlemont Creek, and Buck Creek(Figure 1). Urban areas specifically targeted in the study were Lorain, Elyria, Oberlin,Wellington, and Lodi. This report also contains a special section dedicated to an evaluation ofBeaver Creek and the impact of the Amherst waste water treatment plant (WWTP). Impacts ofnonpoint source (NPS) pollution were also evaluated in the above listed Black River basin area.
Specific objectives of this study were to:
1) evaluate the affects of contaminated sediment removal in the lentic (Lake Erie affected) portionof the basin,
2) evaluate the status of the Lorain Harbor section of Lake Erie and gather baseline data fromwhich to develop biological criteria for similar Lake Erie areas,
3) evaluate the possible impacts from the Lorain, Elyria, French Creek, Wellington, Oberlin, andLodi WWTPs,
4) evaluate the effects of sanitary sewer overflows (SSO) and same sewer overflows (SSO) inthe Elyria and Lorain municipal areas,
5) evaluate the possible impacts of agricultural NPS pollution within the basin and pinpointproblem areas,
6) evaluate the possible impacts of urban NPS pollution within the basin, identify problem areasand
7) assess the existing use designations of the principal streams in the study area.
8) evaluate any changes that have occured since the 1982 survey of the lower Black River.
The findings of this evaluation may factor into regulatory actions taken by Ohio EPA (e.g. NPDESpermits, Director’s Orders), may modify the Ohio Water Quality Standards (OAC 3745-1), andmay eventually be incorporated into the State Water Quality Management Plans, the Ohio NonpointSource Assessment, and the biennial Water Resource Inventory (305[b] report).
Summary
The Black River basin was observed to display a wide range of environmental conditions andtrends. In general, much of the upper reaches in the East and West Branches have been severelyimpacted by NPS pollution as evidenced by degraded biological communities. The lower portionsof the two main branches and the mainstem Black River have been historically impacted by pointsource discharges and municipal runoff. Though such sources of pollution continue to affectthese areas, the severity of the impact was considerably less in the 1992 survey. Contaminatedsediment problems in the lake affected area of the river have been addressed through removal thusreducing pollutant concentrations in the sediments. At present, insufficient time has elapsed tomake a determination of the long term effect of sediment removal on aquatic biotas in the area.
1

DSW/1992-12-8 1992 Black River June 13, 1996
Figure 1. The Black River study area showing principal streamsand tributaries, population centers, pollution sources,and water quality monitoring sites.
2

DSW/1992-12-8 1992 Black River June 13, 1996
Black River Mainstem
Aquatic Life Use AttainmentSignificant trends of environmental improvement have been recorded for the Black Rivermainstem. In terms of miles of attainment, the 1982 survey showed zero miles of stream attainingFULL WWH or PARTIAL WWH and all 13.2 miles surveyed falling into the NON WWHattainment category (Table 9) versus the 1992 results of FULL attainment achieved on 6.4 miles ofstream, PARTIAL WWH attainment achieved on 5.6 miles of stream, and NON WWH attainmenton only 1.4 miles of stream.
Point Source Pollution loadingsConsiderable reduction in peak loadings of copper and zinc from the Lorain East WWTP have beenrealized since the early to mid 1980s (Figure 12). Loadings for TKN, TSS, and phosphorus, wereinitially reduced in 1989 and 1990, but began to increase in 1991 and 1992. The Elyria WWTPdecreased loadings of copper, TSS, phosphorus, ammonia, and zinc after 1989 (Figure 13). Themost significant reduction in loadings was seen in peak loadings with peak ammonia loadingsbeing damatically reduced. Changes in discharge loadings from the USS/KOBE Steel Companywere variable. At the 001 outfall oil + grease and TSS loadings were greatly reduced (Figure 7);ammonia and TSS loadings were greatly reduced at the 002 outfall (Figure 8); ammonia wasreduced and peak TSS declined but median TSS remained high at the 003 outfall (Figure 9); TSSincreased while ammonia remained the same except for one elevated recording for 1991 at the 004outfall (Figure 10); COD declined at the 006 outfall (Figure 11); and TSS increased at the 005outfall (Figure 11). Overall loadings from the USS/KOBE Steel operations were reduced fromprevious years.
Nonpoint Source PollutionIn comparison to historic point source impacts of the 1980s, present nonpoint source impacts in theBlack River mainstem are nearly undetectable. Only one site on the mainstem was rated as NONWWH attainment and was located on the east shoreline (RM 5.8) where an active slag pile exists.The presence of the slag pile was the only factor at this site that was different from the other sitesthat attained PARTIAL WWH or FULL WWH use. Potential runoff from the slag pile may be apossible factor resulting in the observed biological community degradation.
East Branch
Aquatic Life Use AttainmentThe reduced size and geographic coverage of the 1982 survey prevented comparison of total ADVswith the larger 1992 survey (refer to Table 9 for the 1992 ADV results). Results of the 1992survey show that in the East Branch basin, 12.9 miles attained FULL WWH criteria, 19.8 milesachieved PARTIAL WWH attainment, and 9.4 miles displayed NON WWH attainment (Table 9).Impacts from both nonpoint and point source pollutants (see below) were present in this portion ofthe drainage even though the most stable, high quality communities in the Black River basin wererecorded in this stream. Nonpoint impacts were evident in the upper 20 miles between Grafton andLodi (RMs 36 through 11 in general). Point source impacts were evident downstream of Graftonand in the Brentwood area. Although numerous failed septic systems were observed in this lowerportion of the stream and contributed to the overall degradation of the biological community, it ispoint source impacts that are believed to be the principal cause of the observed degradation.
Point Source PollutionA moderate effect on the biological communities was associated with the Lodi WWTP (RM 41.5)while no impact was attributed to the Ross Environmental Services incinerator. The biological
3

DSW/1992-12-8 1992 Black River June 13, 1996
communities downstream of the Lodi WWTP remained within the bounds of WWH attainment.An impairment was detected downstream from the Grafton WWTP (RMs 6.0, 5.4, and 5.2).Loadings at both the Lodi and Grafton WWTPs have been reduced since 1982 (Figure 16). Theimpairment downstream from the Grafton WWTP appeared to be from a problem with sludgehandling.
Nonpoint Source PollutionAgricultural activities (row crop) were impacting the upper portion of the East Branch and the onesite on Willow Creek downstream of the Ross incinerator. The source of the impacts wasexcessive sediment runoff from adjacent cultivated fields.
West Branch
Aquatic Life Use AttainmentAn estimated 7.8 miles reached FULL WWH attainment, 7.2 miles reached PARTIAL WWHattainment, and 27.3 miles scored as NON WWH attainment in this portion of the basin in 1992.More miles of NON WWH attainment were recorded in the West Branch than in any other portionof the Black River study area (Table 9). Only one site reached FULL WWH attainment, one sitereached PARTIAL WWH attainment, and five sites scored as NON WWH attainment. The mostdownstream site was impacted by urban runoff, failed septic systems, combined sewer overflows(CSOs), broken sewer lines and sanitary sewer overflows (SSOs). All other impacted sites wereaffected by nonpoint pollution in the form of excess sediments, both suspended and bedload (seeembededness in Table 5). The most severe case of an agricultural nonpoint source impact everrecorded in Ohio was documented at RM 19.6, a site with locally low gradient and few riffles.These factors created conditions in which excess sediment and nutrient loads resulted in a strongsuppression of biological communities.
Point Source PollutionNo point source discharges were located on the West Branch proper. Dischargers were located ontributaries and were not observed to have direct impacts on the mainstem. Chemical results (Figure5) demonstrated a contribution of nutrients from WWTPs on the tributaries. Such facilities did addto the enrichment of the mainstem, the consequent increase in turbidity from algal growth, and theseverity of impacts to the biota.
Nonpoint Source PollutionImpacts from nonpoint source pollution dominated the West Branch. High bedload sediments andelevated turbidity were observed at most of the sampling sites (see embeddedness Table 5).Tolerant species of fish formed the principal components of the community. Some pollutants fromseptic systems, CSOs, SSOs, and WWTPs were present, but any effect from these sources wereovershadowed by the nonpoint source effects at all sites except RM 1.2/0.1.
West Branch tributaries
Point Source PollutionTwo point source discharges were located on West Branch tributaries. The Oberlin WWTP islocated on Plum Creek and the Wellington WWTP is located on Charlemont Creek. Impacts frompoint source impacts to the associated biological communities of the streams were not detectedalthough nutrients were elevated downstream from both facilities and nonpoint soure pollutionimpacts were pervasive. The lack of an impact downstream of the Oberlin WWTP indicates asignificant improvement in biological conditions as a result of Treatment plant upgrades
4

DSW/1992-12-8 1992 Black River June 13, 1996
Nonpoint Source PollutionPlum Creek was found to be affected by both agricultural and urban runoff. Only the mostdownstream site (downstream from the Oberlin WWTP) attained the aquatic life biocriteria (Table1). Wellington Creek was strongly affected by agricultural runoff. Neither of the two sites on thisstream attained the established biocriteria. Charlemont Creek was impacted by agricultural runoffwhich was expressed primarily in the fish community results (Table 8, Figure 23). Communitiesat all sites sampled in Charlemont Creek reached PARTIAL attainment.
Conclusions
• The Black River has shown significant chemical and biological community recovery in theareas below the Elyria WWTP (Figures 3, 19, and 21). Improving water quality trends areattributed primarily to the major treatment upgrade at the Elyria WWTP completed in late1988.
• Reliable loading information for the USS/KOBE Steel Company is not available due to thecurrent methods of estimating flows at several of the outfalls. Floating oil continues to be aproblem below the USS/KOBE Steel Company 001 and 005 outfalls.
• Fecal coliform bacteria exceedences were common (25 individual exceedences at 14 stations)throughout the study area (Table 4) and included both primary and secondary violoations.The highest bacteria counts were noted in the Elyria area (RMs 14.3, 11.5 & 9.8), the lowerWest Branch upstream from Elyria (RMs 4.2 & 0.2), and the East Branch from upstream ofGrafton to the confluence with the West Branch (RMs 11.3, 10.5, 5.2, 3.1, & 0.3).Exceedences upstream of Elyria and Grafton were probably the result of animal husbandryoperations while those exceedences downstream from Grafton and Elyria were primarily theresult of a combination of WWTP discharges, failing septic systems, and agriculturalactivities.
• Samples were collected under lower flow conditions (Figure 3) and thus do not reflect theexpected higher levels of pollutants that would be observed for NPS pollutants during highflow conditions especially during the first flush. Heavy metals concentrations were generallyat or below detection limits. Metals concentrations would most likely be higher if sampledunder first flush high flow conditions. Suspended solids levels would also be much higherunder high flow conditions.
• Nonpoint source pollution has had a strong influence in the basin. Degraded aesthetics werenoted throughout the basin due to high suspended solids levels and the resulting turbidity.Much of the stream beds upstream from Elyria were covered with silt and bedload sedimentsincluding sand and gravel (Table 5). The greatest impacts to the biological community wereobserved in the East Branch upstream from the Grafton area (RMs 41.5-24.6) andthroughout the West Branch (Figures 19, 22 and 23). The impacts to the West Branch andtributaries were the most severe ever observed in Ohio as a consequence of generalagricultural activities.
• Water quality in the lower East Branch was impacted by the numerous small treatment plants,CSOs, SSOs, and unsewered areas with numerous failing septic systems (Table 4, Figures19 and 22). Portions of the West Branch within Elyria are also affected by failing septicsystems and raw sewage discharges from CSOs, SSOs, and broken sewer lines (fromapproximately RM 4.0 to the confluence with the East Branch).
• The Lodi WWTP had a moderate effect on macroinvertebrate communities apparently due to
5

DSW/1992-12-8 1992 Black River June 13, 1996
residual chlorine toxicity and organic enrichment.
• Significant increases in phosphorus concentrations were noted in the East Branch Black Riverbelow the Grafton WWTP (Figure 4). Biological communities were degraded downstreamfrom the plant (Figures 19 and 21).
• With the exception of nitrate concentrations the Oberlin WWTP had no impact on most of theexisting water quality and biological communities of Plum Creek (Figures 15, and 23). Sandand grit from street runoff were impacting the stream above the WWTP.
• Due to limited resources and the resulting minimal sampling efforts it is difficult to concludewhether NPS runoff, the Ross Environmental Services complex, or some other unidentifiedsource is responsible for the depressed IBI at the single Willow Creek sampling site.
• A toxic impact to instream biological communities was detected in French Creek at RM 3.2upstream from the French Creek WWTP. The impact may have been from a fly ash disposalarea or industrial operations just upstream from the sampling site.
• No 1992 fish tissue samples (Appendix Table C-2) contained PCB contaminant levels abovethe FDA action level (2.0 mg/kg) or Ohio EPA WQS for whole aquatic organisms(640ug/kg).
• Fish tissue contamination by PAHs documented by the historical record was not present inthe 1992 samples (Appendix Table C-2). This indicates that the dredging of contaminatedsediments by USS/KOBE Steel may have significantly reduced the source of contamination.
• Hydrocarbon compounds identified in the 1992 fish tissue samples indicate the ubiquitousnature of these chemicals in the environment.
Recommendations
Status of Aquatic Life Uses
• All areas of the Black River basin are presently designated WWH. Specific segments are alsolisted as State Resource Waters. All existing use designations should be maintained.
Status of Non-Aquatic Life Uses
• All non-aquatic life uses should remain as presently designated in the Ohio Water QualityStandards.
Other Recommendations
• The City of Elyria must continue its CSO/SSO evaluation and control program. Centralsewers should be extended to the southern Elyria area.
• Additional treatment facilities may need to be constructed at Grafton to handle possibleincreases in future loadings if state corrections facilities are expanded. Phosphorus removaland de-chlorination capabilities must be a part of any expansion. Loadings should be keptnear current levels to prevent degradation of the receiving stream.
• Landowners throughout the watershed should be encouraged to expand and improve the
6

DSW/1992-12-8 1992 Black River June 13, 1996
riparian zones along the river and its tributaries especially in the upper East Branch and WestBranch areas. Suspended and bedload sediments and nutrients must be reduced in thesewatersheds before attainment of the WWH use designation can occure. Implementation ofconservation tillage systems, buffer strips and other agricultural best management practicesneeds to be continued. The agricultural community also needs to examine animal handlingand pasturing activities for possible changes that would improve water quality.
• De-chlorination facilities should be installed at the Lodi WWTP to address instream chlorineproblems.
• USS/KOBE Steel Company must prevent oil and grease from escaping at outfalls 001 and005. The Company must establish sampling stations and install proper flow measuringdevices to better characterize the various types of effluent released; this is especially importantat outfalls 003, 004, and 005.
• Further fish tissue sampling over a period of several years should be performed in order todocument the decrease in PAH contamination indicated by the 1992 sampling. The OhioDepartment of Health requires at least three consecutive years of data with contaminationlevels below FDA action levels prior to lifting the current fish advisory. The 1992 sampledata, as well as future data, should also be compared to forthcoming action levels or riskassessment methodologies in order to determine the safety of Black River fish forconsumption.
• Nonessential lowhead dams should be removed to facilitate fish passage, improve degradedhabitat, and alleviate areas of exaggerated environmental impact.
Future Monitoring Needs
• Additional fish tissue samples should be collected as part of an ongoing monitoring program.Samples should also be collected in the southern portion of the basin. In order to evaluate theODH fish consumption advisory that is currently in effect, three consecutive years of fishtissue data must be collected and evaluated. The advisory should then be reevaluated at thatpoint in time.
• Further biological and organic sediment chemistry sampling should be conducted at additionalsites on Willow Creek and the unnamed tributary leading from the Ross EnvironmentalServices complex to determine if the Ross complex is having an effect on Willow Creek.
• Additional sampling is needed in the tributaries located in the upstream portion of the basin tofurther detail the sources of nonpoint agricultural runoff and the extent of problem areas.
• Nearshore Lake Erie and harbor monitoring must be expanded to identify the extent ofimpaired beneficial uses, specifically as they relate to the public beaches located to the eastand west of the mouth of the river.
• The two Ohio EPA ambient water quality monitoring stations should be maintained. A flowgauge installed at the Ford Road station would aid in the calculation of stream loads.
• A follow-up investigation of the French Creek basin needs to be conducted to identify thearea from which toxic impacts are originating followed by chemical monitoring to verify thechemical(s) involved.
• The unnamed tributary harboring a population of state endangered blacknose shiner (Notropis
7

DSW/1992-12-8 1992 Black River June 13, 1996
heterolepis) should be monitored to determine population status and assign appropriateaquatic life use designation. Numerous other tributaries in the Black River basin either lackuse designations or are improperly designated at present. These designations could bedeveloped based on a minimal biological sampling effort.
• The location, density, and number of animal units in the present animal livestock handlingoperations in the basin need to be determined as a start on correcting operations which impactwater quality.
• The progress or success of current nonpoint source phosphorus and sediment reductionactivities within the basin should be reevaluated over the next five to ten years.
Study Area Description
The Black River Watershed covers 467 square miles (298,880 Ac.) and drains 887 stream miles inLorain County as well as portions of Ashland, Medina, Cuyahoga and Huron Counties (Figure 1).The Black River has two main branches: the East Branch, which drains 222 square miles of land inMedina and southeast Lorain Counties, and the West Branch, which drains 174 square miles ofland primarily in southwest Lorain County. The East and West Branches meet to form themainstem in Elyria, and then flow north for 15.6 miles to Lorain Harbor in Lake Erie. FrenchCreek, tributary to the mainstem at RM 5.1, drains 31.6 square miles of land in northeasternLorain County.
The entire Black River basin lies within the Erie/Ontario Lake Plain ecoregion. Like most of northcentral and northwest Ohio, geographic relief is flat to gently rolling due to past glacial activity.The gradient of the Black River ranges from about 0.8 ft. per mile at the French Creek confluenceto 29.8 ft. per mile at Charlemont Creek.
The geology and ground water resources of the basin also have been affected by glaciation.Generally, unconsolidated glacial deposits overlie consolidated sandstone and shale bedrock.Ground water resources are limited in the basin, yielding only five to 25 gallons per minute fromsandstone and shale bedrock and glacial end moraines. The exceptions to this are in the extremesoutheast where 100 to 500 gallons per minute are available from a buried valley aquifer and in thearea near the Black River's mouth where clay and silt deposits yield less than five gallons perminute.
The northeast Ohio climate where the Black River is located is characterized by moderateprecipitation which is fairly evenly spread throughout the year. The total yearly precipitationaverages about 34.5 inches. The average temperature is 500F with values rarely exceeding 900F orfalling below 00F.
Most streams in the Black River basin are designated Warmwater Habitat (WWH). Two streams,a portion of the West Branch of the Black River running from Parsons Road to US Route 20 andWellington Creek in the boundaries of Findley State forest, are designated as State ResourceWaters. The entire Black River and French Creek from Gulf Road to the creek's mouth are, alsodesignated seasonal salmonid.
The International Joint Commission has designated the Black River and its harbor as one of fourAreas of Concern (AOC) on Ohio's Lake Erie shore line. A Remedial Action Plan (RAP) is beingprepared to resolve the pollution problems in the lower mainstem as well as additional watershedconcerns.
8

DSW/1992-12-8 1992 Black River June 13, 1996
The Ohio EPA Phosphorus Reduction Strategy for Lake Erie ranks this watershed as "Priority 1".The Black River is estimated to contribute 107 metric tons of phosphorus each year into Lake Erie.
Soils
The soil associations of Mahoning, Trumbull and Ellsworth silt loams comprise 90% of the soils inthe watershed. These glacial till soils are classified as somewhat poorly drained to moderately welldrained. Wetness is the main limitation to crop production. The surface soil is a medium to finetextured silt loam or silty clay loam. These soils are typically found on nearly level to gentlyrolling landscapes with long slopes. The combination of soil texture and slope allow these soils toerode easily. However, soil erosion is not uniform across the watershed. It varies as a function oflocal soil type, land slope, and land use. The soils in the watershed have an average soil losstolerance of 3 tons/acre/year.
Studies conducted by the Northeast Ohio Areawide Coordinating Agency (NOACA) indicate thatthe area of greatest soil loss is the rolling till plain of western Medina County and Southern LorainCounty. This area comprises much of the upper portion of the Black River basin along both theEast and West Branches. The sub-basins within this area have greater than 20 % of their land areaeroding at a rate of more than 5 tons/acre/year. The most erosive of these highly eroding sub-basins are: East Branch (West Fork to Crow Creek), Coon Creek, Charlemont Creek, WestBranch (Headwaters to Charlemont Creek) and Buck Creek.
NOACA grouped the Highly Erodible Land (HEL) within the upper portion of the Black Riverbasin along both the East and West Branches according to land use type. Over 17,000 acres wereeroding at "excessive" levels in these basins. Cropland accounted for 82% of this total, followedby open space categories (e.g. grasslands, forestlands, and pastures) at 14 % and developed landsat 4 %.
The open space categories are areas least disturbed by human activities and are representative ofbackground erosion problems. Therefore, naturally occurring erosion and sedimentation rates arehigh in much of the upper basin along both the East and West Branches. Steep slopes and deepsoil depth combine to create erosive conditions. Background erosion rates are considered to be oneof the major sources of sediment in the Area of Concern.
Erosion on cropland can be substantial given that some commonly used agricultural practices resultin the ground laying bare for extended periods of the year. Overall, agricultural erosion is believedto be a major source of sediment in the Area of Concern. In its Erosion and Sedimentation Study,Lorain, Ohio, August, 1982, the U.S. Army Corps of Engineers reported that cropland in theBlack River watershed is eroding at an average rate of 4.7 tons/acre/year. According to the U.S.Army Corps study, 107,000 acres of cropland in the Black River watershed is eroding atapproximately twice the tolerable soil loss rate. The Corps further determined 835,000 tons ofsediment is produced annually within the watershed with 80% coming from cropland.
Soil erosion in the Black River basin is detrimental in many ways. Soil loss from fertile croplandnot only harms productivity, but does considerable damage to the drainage network throughout thewatershed. Furthermore, sediment deposited on stream bottoms interferes with the reproductivecycle of many fish species, thus reducing the diversity and numbers of species in the aquaticenvironment. Suspended sediments irritate and clog the gills of many fish species, and reduce theamount of light available to aquatic plants (see Fish Community section for further details).
9

DSW/1992-12-8 1992 Black River June 13, 1996
Tillage Trends
During the mid to late 1980's, no-till farming systems were used on approximately 5% of thetillable acres in the Black River basin, while less than 1% of the tillable acres were in other types ofconservation tillage systems (i.e. greater than 30% residue cover). From 1988 through 1992, no-till and other conservation tillage systems began to increase, primarily in response to compliancewith USDA Farm Bill requirements. Approximately 70% of the cropland in the Black River basinis planted to corn and soybeans because of poor internal drainage that restricts the growth ofalfalfa. Presently only 7% of the row crops are planted no-till, while 30% are planted using otherconservation tillage systems. Conventional tillage remains the most common method of tillage inthe watershed. An estimated 40% of the conventional tilled fields are fall plowed.
Through the Lorain County Agricultural Stabilization and Conservation Service (ASCS) Office,Agricultural Conservation Practice (ACP) Special Project funds were obtained in 1988-89. Cost-share assistance was provided in the form of long term agreements and annual practices. From1988 to 1989, $100,000 was appropriated toward 9 long term agreements that included cost-sharing for grassed waterways, erosion control structures and 2 animal waste holding facilities.Most of the cost-sharing dollars were spent on grassed waterways. These were determined to be"high priority" to reduce serious gully erosion.
Ohio EPA initiated another significant nonpoint source project for the Black river watershed in1992. Cost-share incentives were provided to farmers that purchased no-till drills and planters,straight chisel points and chaff spreaders. Furthermore cost-share payments were made to farmersfor establishment of winter cover crops, filter/buffer strips and 30% residue levels. These BestManagement Practices are to be used for a minimum of 3 years.
Land Use
There are an estimated 1,860 farms in the Black River Watershed with an average size of 95 acres.There are an estimated 200 Dairy farms in the Black River basin. A survey conducted in the WestBranch of the Black River in 1987-88, found that nearly 65% of the dairy operations lackedadequate manure storage facilities and consequently had to rely on daily hauling and landapplication. The following information is from a land classification study, using a 1991 satelliteimage, conducted for the Black River by Ohio Department of Natural Resources (ODNR): Agriculture . . . . . . . . . . . . . 66%
Agricultural Land (bare fields, fields with crop residue and pasture) - 10%Green Vegetation (some agricultural areas and urban and suburban vegetated areas) - 48%Bare Soil (some agricultural areas and urban and suburban areas) - 8%
Woodland . . . . . . . . . . . . . 23%Urban . . . . . . . . . . . . . . . 10%Misc. (water and wetlands) . . 1%
The agricultural subcategories of green vegetation and bare soil represent transitional categorieswhich do not clearly fall into either cropland or urban categories. These areas are best reflective ofthe large acreage that has been taken out of agricultural production in favor of residential,commercial, industrial and recreational development.
Point Sources
No permitted point source dischargers exist on the upper West Branch mainstem. The City ofNorts (21,522 residents, 1980 census) operates the 7.5 MGD French Creek WWTP that
10

DSW/1992-12-8 1992 Black River June 13, 1996
discharges to RM 2.8 of French Creek. Flows are also contributed by the City of Avon (7,241residents, 1980) and the Village of Sheffield (1,886 residents, 1980 census)
The City of Lorain (75,416 residents, 1980 census) operates the 15 MGD Lorain East WWTP thatdischarges to RM 0.2 in the ship channel. Flows are also contributed by the City of Sheffield Lake(10,484 residents, 1980 census).
The Moen Division operates a metal finishing facility and discharges non contact cooling water toRM 13.0 of the Black River. The USS/KOBE Steel works, a fully integrated steel mill, dischargescooling water and process wastewater through six outfalls between RM 5.0 and 2.5 of the BlackRiver.
The City of Oberlin (8,660 residents, 1980 census) operates a 1.5 MGD contact stabilizationactivated sludge WWTP that discharges to RM 3.0 of Plum Creek. The Village of Grafton (2,231residents, 1980 census) operates a 0.75 MGD bath treatment WWTP with effluent discharged toRM 11.2 of the East Branch of the Black River.
Cromwell Park was operated as a municipal landfill by the City of Lorain from 1963 to 1976 on172 acres. Municipal sewage sludge as well as organic residues from industries were disposed ofin 1974 and 1975. The Ford Road landfill was located on 15 acres of land on the west bank of theBlack River opposite the Elyria WWTP. It served as a disposal site for domestic and industrialwastes from 1910 to 1974. Numerous leachate seepages were noted during a 1983 evaluation forComprehensive Environmental Response and Liability Act (CERCLA) funding. The GardenStreet landfill is located on 40 acres of land approximately 0.5 miles from the West Branch of theBlack River in Elyria. This was operated as a municipal dump for the City of Elyria, but alsoaccepted industrial wastes. An intermittent stream borders the southern end of the dump anddischarges to RM 1.7 of the West Branch. Leachate pools were evident during a 1979 CERCLAevaluation with cadmium, copper, chromium, and zinc detected at trace levels in samples of theleachate.
The former Republic Steel Sandstone Quarry is located directly adjacent to the West Branch of theBlack River, with an outlet at RM 1.8. Several thousand gallons per year of used pickle liquorwere disposed of at this site between 1950 and 1972. No detectable contaminants were found inthe surface waters, while groundwater from monitoring wells was contaminated with trace levelsof chromium, cadmium, zinc, and arsenic during a CERCLA assessment in 1983.
11

DSW/1992-12-8 1992 Black River June 13, 1996
Table 1. Aquatic life use attainment status for the existing Warmwater Habitat (WWH) aquatic life usedesignations in the Black River basin based on data collected from June to October, 1992.
____________________________________________________________________________________
RIVER MILE Modified Attainment Fish/Invert. IBI Iwb ICIa QHEI Statusb Comment____________________________________________________________________________________
Black River (1992)Erie-Ontario Lake Plain - WWH Use designation
15.0/14.4 40 9.05 40 86.0 FULL Cascade Park11.9/11.2 31* 8.65 MGns 87.5 PART. Spring Valley CC10.6 25 6.45 28 N/A N/A Elyria mix. zone10.5/10.2 26* 6.80* 40 87.0 PART. dst. Elyria WWTP8.8/8.3 31* 8.20 40 77.0 PART. Detroit Rd. area
Black River estuary areaErie-Ontario Lake Plain - WWH Use designation
5.8c 25.3* 6.76* -- 58.0 (NON) east bank ust. D25.5/5.6c 30ns 6.46* 34 58.0 PART. west bank ust. D25.2/5.3c 25.3* 7.06ns 28 49.0 PART. dst. D2 landfill5.0c 22 N/A N/A 006 mix. zone
Black River estuary areaErie-Ontario Lake Plain - WWH Use designation
4.8c 28ns 6.50* 24 59.5 PART. dst. 001/FrenchCr.3.6/3.7c 28ns 7.06ns 20ns 42.0 FULL dst. USS/KOBE 0053.0c 32.6 7.26ns 22 57.0 FULL ust. 003/0042.3/2.0c 32.6 7.00ns 14* 55.0 PART. dst. 003/0040.9/1.1c 34.6 7.90 12* 52.0 PART. ust. Erie St.0.1c 28.6ns 6.80* 14* 40.0 PART. dst. Lorain WWTP
Black River harbor areaErie-Ontario Lake Plain - WWH Use designation
0.3c 32.6 7.26ns -- 59.5 (FULL) west breakwall0.2c 31.3ns 6.56* -- 54.5 (PART.) east breakwall
French CreekErie-Ontario Lake Plain - WWH Use designation
3.2 18* 5.50* 22* 71.0 NON Abbe Rd.0.4/0.5c 30ns 7.26 32ns 58.0 FULL dst. French Cr. WWTP
East Branch Black RiverErie-Ontario Lake Plain - WWH Use designation
41.5 33* 7.90 48 54.5 PART. Shaw Rd.36.8 32* 8.05 -- 75.0 (PART.) dst. Homer-River Rd.32.5/32.3 26* 8.10 42 60.0 NON Smith Rd.24.6 25* 7.35ns -- 57.0 (NON) Foster Rd.18.9 36ns 7.40ns 46 73.0 FULL Vermont Rd.11.3 41 8.05 46 65.5 FULL Parsons Rd.10.1/10.8 41 8.15 30ns 90.0 FULL dst. Grafton WWTP6.0 27* 7.35 38 53.5 NON ust. Brentwood trib.5.2/5.4 31* 8.70 48 84.0 PART. dst. Willow Cr.____________________________________________________________________________________
12

DSW/1992-12-8 1992 Black River June 13, 1996
Table 1. (cont.)____________________________________________________________________________________
RIVER MILE Modified Attainment Fish/Invert. IBI Iwb ICIa QHEI Statusb Comment____________________________________________________________________________________3.0 37ns 8.25 42 63.5 FULL Fuller St.0.3/0.1 29* 6.50* 42 57.0 PART. Washington St.
Willow CreekErie-Ontario Lake Plain - WWH Use designation
2.9/2.8 18* N/A MG 72.5 NON dst. Ross Incinerator
East Fork East BranchErie-Ontario Lake Plain - WWH Use designation
2.7/2.9 39ns N/A 46 70.5 FULL Lodi Community Park1.6/1.5 38ns N/A 40 70.5 FULL dst. Lodi WWTP
West Fork East BranchErie-Ontario Lake Plain - WWH Use designation
4.1/4.2 36ns 7.60ns VG 75.0 FULL Congress Rd.
West Branch Black RiverErie-Ontario Lake Plain - WWH Use designation
41.7 35* N/A 54 58.0 PART. Oh.Rt. 51133.3 35ns 7.60ns -- 84.0 (FULL) dst. Oh.Rt. 1825.3 29* 5.30* 38 49.5 NON Oh.Rt. 5819.6 17* 5.20* -- 64.0 (NON) Oh.Rt. 30313.6/13.5 23* 5.50* MGns 51.5 NON dst. Parsons Rd.4.1/4.2 24* 6.75* 22* 70.0 NON dst. U.S.Rt. 201.2/0.1 32* 6.70* 28* 69.5 NON 3rd St./Lake Ave.
Plum CreekErie-Ontario Lake Plain - WWH Use designation
7.0 23* N/A F* 70.0 NON Hamilton Rd.3.3/3.1 21* N/A 34 69.5 NON ust. E. Lorain St.2.95 24* N/A -- N/A N/A Oberlin WWTP mix. zone2.9 20* N/A 36 57.0 NON dst. Oberlin WWTP0.9/0.8 35ns N/A 44 87.5 FULL dst. old Oh.Rt. 20
Wellington CreekErie-Ontario Lake Plain - WWH Use designation
13.1 29* N/A F* 69.0 NON Cemetery Rd.10.8 19* N/A F* 55.0 NON Hawley Rd.
\Charlemont CreekErie-Ontario Lake Plain - WWH Use designation
2.8 32* 7.80ns -- 70.5 (PART.) ust. Oh.Rt. 18____________________________________________________________________________________
13
DSW/1992-12-8 1992 Black River June 13, 1996
Table 1. (cont.)____________________________________________________________________________________
RIVER MILE Modified Attainment Fish/Invert. IBI Iwb ICIa QHEI Statusb Comment____________________________________________________________________________________0.7/0.6 33* 6.60* MGns 74.5 PART. ust. Wellington WWTP0.5/0.4 32* 7.05* MGns 73.0 PART. dst. Wellington WWTP
Buck CreekErie-Ontario Lake Plain - WWH Use designation
1.0 42 N/A MGns 67.5 FULL Bursley Rd.____________________________________________________________________________________
Ecoregion Biocriteria: Erie-Ontario Lake Plan (EOLP)
INDEX - Site Type WWH EWHIBI - Headwaters 40 50IBI - Wading 38 50Mod. Iwb - Wading 7.9 9.4IBI - Boat 40 48Mod. Iwb - Boat 8.7 9.6IBI - interim estuary 32 48Mod. Iwb - interim estuary 7.5 9.6ICI - all lotic sites 34 46ICI - interim estuary 22
____________________________________________________________________________________* Significant departure from ecoregional biocriteria; poor and very poor results underlined.ns Nonsignificant departure from ecoregional biocriteria(<4 IBI or ICI units;<0.5 MIwb units ).a Narrative evaluation used in lieu of ICI (E=Exceptional; VG=very good; G=Good; MG=Marginally Good; F=Fair;P=Poor; VP=Very Poor).b Attainment status based on one organism group is parenthetically expressed.N/A Non applicable.c Interim estuary and harbor criteria apply.
14

DSW/1992-12-8 1992 Black River June 13, 1996
Table 2. Stream Characteristics and Significant Identified Pollution Sources in the 1992 Black River BasinStudy Areas (ODNR 1954 and Ohio EPA 1992).
___________________________________________________________________________________
Stream Length Avg. Fall Drainage Area NPS Point Sources(Miles) (Ft./Mi.) (Mi2) Pollution type* Evaluated
___________________________________________________________________________________
Black River (West/East Branch to Lake Erie)15.55 9.7 470.00 Ag; CP; L; U; SR; Elyria WWTP
OS; IPP D2 Landfill; USS/KOBELorain WWTP
French Creek15.8 13.1 31.60 Ag; CP; CS; SR; H; French Cr. WWTP
OS; IPP
East Branch (West FK East BR to West Branch)45.1 3.5 166.94 Ag; CP; L; SaS; SR; Brentwood WWTP
OS Grafton WWTP
East Fork of the East Branch9.3 27.8 18.16 Ag; OS; SR Lodi WWTP
West Fork of the East Branch17.2 16.0 36.90 Ag; L; OS; SR
Willow Creek8.7 4.6 22.90 Ross Environmental
Services
West Branch (Headwaters to East Branch)53.2 6.1 174.00 Ag; CP; L; U; H; OS
Plum Creek7.3 14.7 14.54 Ag; U; OS; SaS; SL Oberlin WWTP
Wellington Creek7.6 21.6 30.50 Ag; L; OS
Charlemont Creek1.5 29.8 25.19 Ag; L; OS Wellington WWTP
Buck Creek7.5 22.9 20.79 Ag;
__________________________________________________________________________________* Ag - General Agriculture I PP - In Place Pollutants U - General UrbanCP - Crop Production SL - Sanitary Landfill SR - Surface RunoffL - Livestock SaS - Sanitary Sewers CS - Construction Sites
OS - On-site Septic Systems H - Hydromodification
15

DSW/1992-12-8 1992 Black River June 13, 1996
Methods
All chemical, physical, and biological field, laboratory, data processing, and data analysis methodsand procedures adhere to those specified in the Manual of Ohio EPA Surveillance Methods andQuality Assurance Practices (Ohio Environmental Protection Agency 1989a) Biological Criteria forthe Protection of Aquatic Life, Volumes ll-llI (Ohio Environmental Protection Agency 1987,1989b, 1989c), and The Qualitative Habitat Evaluation Index (QHEI): Rationale, Methods, andApplication (Rankin 1989) for aquatic habitat assessment with the following exceptions in theestuary areas:
Due to the lack of current in the estuary area (a lentic habitat) outside bends were not the primarycriteria for selecting a sampling site for fish communities. In this study (and other estuary studies)the area of greatest habitat diversity in the river segment was selected. Macroinvertebratecommunity sampling followed Ohio EPA standard methods using Hester-Dendy multiple plateartificial substrate samplers, supplemented with a qualitative assessment of the available naturalsubstrates.
At present the development of biological criteria for Lake Erie estuary areas has not beencompleted. An examination of the data available from the Lake Erie estuary areas reveals that anIBI of 32, a MIwb of 7.5, and an ICI of 22 are the levels of performance that can reasonably beexpected at least impacted sites (Ohio EPA 1990). Areas which deviate from these values areclassified as impaired and displaying non-attainment of the Warmwater Habitat (WWH) aquatic lifeuse criteria for Lake Erie estuaries. Deviations of four or less points from an expected IBI and ICIvalue or 0.5 points from an expected MIwb value are considered to be insignificant departuresfrom the expected value and within the range of attainment. These are interim criteria and havebeen set by OEPA as short term guidlines until formal biocriteria can be developed. Unlike thebiological criteria for Ohio's inland rivers and streams these criteria are not codified in the OhioWater Quality Standards (WQS).
In lotic habitats attainment/non-attainment of aquatic life uses is determined by using biologicalcriteria codified in Ohio Administrative Code (OAC) 3745-1-07, Table 7-17. The biologicalcommunity performance measures that are used include the Index of Biotic Integrity (IBI) and theModified Index of Well-being (MIwb), both of which are based on fish community characteristics.The macroinvertebrate Community Index (ICI) is based on macroinvertebrate communitycharacteristics. IBI and ICI are multi-metric indices patterned after an original IBI described byKarr (1981) and Fausch et al. (1984). The MIwb is a measure of fish community abundance anddiversity using numbers and weight information; it is a modification of the original Index ofWell-Being applied to fish community information from the Wabash River (Gammon 1976,Gammon et al. 1981).
Performance expectations for the basic aquatic life uses (Warmwater Habitat [WWH] andExceptional Warmwater Habitat [EWH]) were developed using the regional reference site approach(Hughes et al. 1986; Omernik 1988). This fits the practical definition of biological integrity as thebiological performance of the natural habitats within a region (Karr and Dudley 1981). Attainmentof an aquatic life use is FULL if all three indices (or those available) meet the applicable criteria,PARTIAL if at least one of the indexes does not attain and performance does not fall below the faircategory, and NON if all indices either fail to attain or any index indicates poor or very poorperformance.
Physical habitat was evaluated using the Qualitative Habitat Evaluation Index (QHEI) developed bythe Ohio EPA for streams and rivers in Ohio (Rankin 1989). Various attributes of the availablehabitat are scored based on their overall importance to the establishment of viable, diverse aquatic
16

DSW/1992-12-8 1992 Black River June 13, 1996
faunas. Evaluations of type and quality of substrate, amount of instream cover, channelmorphology, extent of riparian canopy, pool and riffle development and quality, and streamgradient are among the metrics used to determine the QHEI score which generally ranges from 20to 100. The QHEI is used to evaluate the characteristics of a stream segment, not just thecharacteristics of a single sampling site. As such, individual sites may have much poorer physicalhabitat due to a localized disturbance yet still support aquatic communities closely resembling thosesampled at adjacent sites with better habitat, provided water quality conditions are similar. QHEIscores from hundreds of segments around the state have indicated that values higher than 60 aregenerally conducive to the establishment of warmwater faunas while those scores in excess of75-80 often typify habitat conditions which have the ability to support exceptional faunas.
During this survey, macroinvertebrates were primarily sampled using modified Hester-Dendymultiple-plate artificial substrate samplers supplemented with a qualitative assessment of theavailable natural substrates. Exceptions were the Black River at RM 11.2 and the West Branch atRM 13.5 where the artificial substrate samplers were lost. Also, at a number of sites on thesmaller tributaries only qualitative natural substrate samples were taken.
Macroinvertebrate sites in the study area were also evaluated using a new assessment tool whichutilizes the qualitative, natural substrate collections available from each site. This method relies ontolerance values derived for each macroinvertebrate taxon collected. Unlike tolerance values usedin other common indices (e.g., the Hilsenhoff Biotic Index), these tolerance values are based onabundance data for a given taxon collected using artificial substrates. To determine the tolerancevalue of a given taxon, ICI scores at all locations where the taxon has been collected with artificialsubstrates are weighted by the abundance data of that taxon at those sites. The mean of theweighted ICI scores for the taxon results in the tolerance value of that taxon. Thus, a taxon’stolerance value represents its relative level of tolerance on the ICI’s 0 to 60 scale. High tolerancevalues are calculated for the more intolerant taxa which tend to reach their greatest abundance atundisturbed sites (i.e., sites with highest ICI scores). Conversely, more pollution tolerant taxaattain their greatest abundances at highly disturbed sites with low ICI scores, which results in alower tolerance value. For the qualitative macroinvertebrate collections in the Rocky River studyarea, the median tolerance value, based on all tolerance values of the organisms collected at a site,resulted in what has been termed the Qualitative Community Tolerance Value (QCTV). Thoughonly in the developmental stage, the QCTV shows potential as a method to supplement existingassessment methods using the qualitatively collected macroinvertebrate information. Its use inevaluating sites in the Black River study area was restricted to relative comparisons between siteswith no attempt to interpret quality of the sites or aquatic life use attainment status.
Fish were sampled 2 times using the pulsed DC electrofishing wading methodology (150 meterzones) or 3 times using the pulsed DC electrofishing boat methodology (500 meter zones). Allchemical/physical and biological sampling locations are listed in Table 3. Fish tissue samples werecollected as skin-on fillet composites of representative benthic feeders and sport species from eachstation (carp fillet samples were skin-off composites). Whole body composites of carp werecollected at six stations to compare with whole body samples collected in previous years. Sampleswere made of two to six fish fillets of the same species and size class. All fish were collectedusing Ohio EPA electrofishing boats or sportyak. After collection fish were sorted by weight andlength, with weight and abnormalities noted for each fish. The samples were later analyzed forpercent lipid content, cadmium, chromium, lead, mercury, zinc, copper, organic “prioritypollutants” (including PCBs and pesticides), and all other tentatively identified compounds (TICs)from Ohio EPA’s National Bureau of Standards spectral library of organic compounds.
An Area Of Degradation Value (ADV; Rankin and Yoder 1991) was calculated for the study areabased on the longitudinal performance of the biological communities. The ADV portrays the length
17

DSW/1992-12-8 1992 Black River June 13, 1996
or "extent" of degradation to aquatic communities and is simply the distance that the biologicalindex (IBI, MIwb, and ICI) departs from the stream criterion or the upstream level of performance(Figure 2). The magnitude of impact refers to the vertical departure of each index below thecriterion. The total ADV is the area beneath the ecoregional criterion when the results for eachindex are plotted against river mile. This is also expressed as ADV/mile to normalize comparisonsbetween segments and other areas.
Figure 2. Graphic illustration of the calculation of Area of Degradation Values(ADV) based on upstream potential and the ecoregion warmwaterhabitat use or minimum criteria (WWH). Criteria for exceptionalwarmwater habitat use (EWH) is provided for reference.
18
DSW/1992-12-8 1992 Black River June 13, 1996
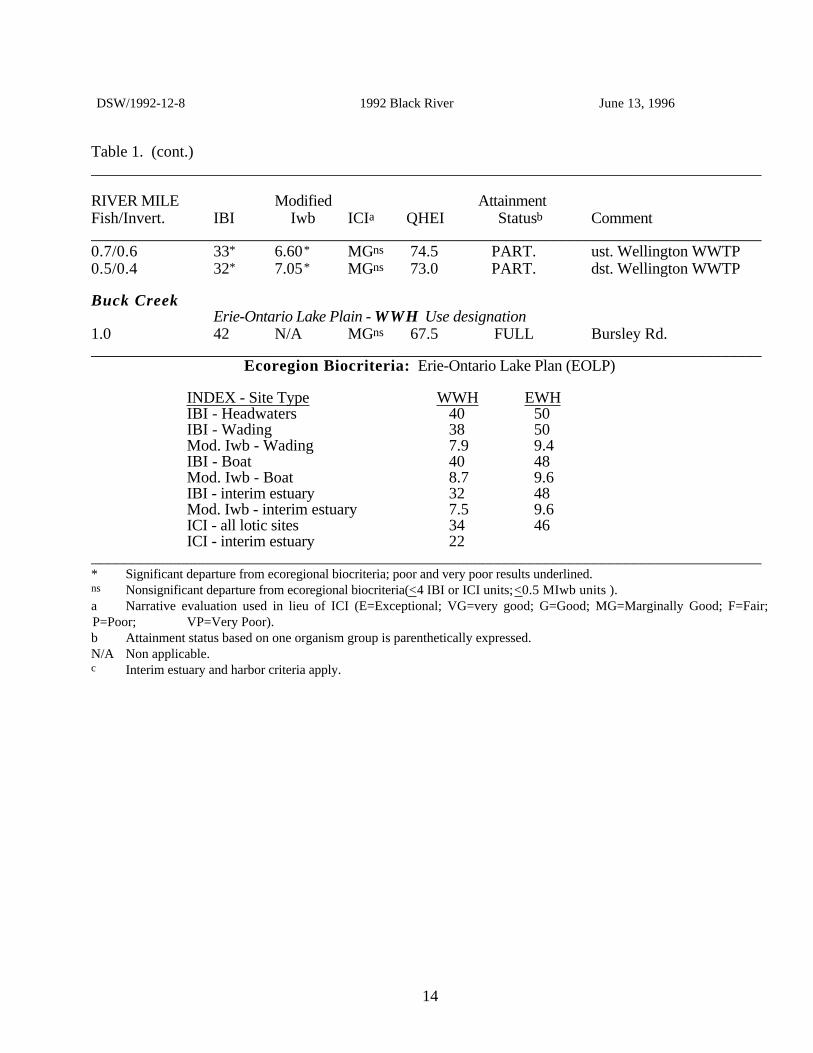
Table 3. Sampling locations (water chemistry-C, sediment chemistry-S, benthic community-B,fish community-F) in the Black River study area, 1992.
_____________________________________________________________________________Stream/ type of USGS toporiver mile sampling Latitude/Longitude landmark map_____________________________________________________________________________Black River15.0 F 41˚22’37”/82˚06’43” Cascade Park Avon14.95 C,S 41˚22’50”/82˚06’17” Cascade Park Avon14.4 B 41˚22’55”/82˚06’12” Cascade Park Avon11.9 F 41˚23’46”/82˚06’12” Spring Valley CC Avon11.5 C 41˚23’49”/82˚05’52” Spring Valley CC Avon11.2 B 41˚23’53”/82˚05’42” Spring Valley CC Avon10.6 F,B 41˚24’39”/82˚05’25” mix zone Avon10.5 S,F,B 41˚24’30”/82˚05’34” Elyria WWTP Avon9.8 C 41˚24’42”/82˚05’45” Ford Rd. Avon8.8 F,B 41˚25’32”/82˚06’13” ust. Detroit Rd. Avon8.4/8.3 C,B 41˚25’31”/82˚05’50” Detroit Rd. Avon5.8 F 41˚26’53”/82˚06’30” adj slag pile Avon5.5/5.6 F,B 41˚27’16”/82˚06’48” ust. D-2 Avon5.3/5.2 C,F,B 41˚27’17”/82˚06’58” adj D-2 Avon5.0 C,B 41˚26’21”/82˚06’42” 006 mix zone Avon4.8 C,F,B 41˚27’33”/82˚07’42” dst 001/Fr Cr Avon3.7/3.6 C,F,B 41˚27’15”/82˚08’06” dst 005 Lorain3.0/2.9 C,F,B 41˚27’20”/82˚08’50” ust 003/004 Lorain2.3/2.0 F,B 41˚27’12”/82˚09’15” dst 003/004 Lorain1.8 C 41˚27’26”/82˚09’07” dst 003/004 Lorain1.05 C 41˚27’50”/82˚10’05” RR bridge Lorain0.9/1.1 F,B 41˚27’54”/82˚10’14” ust. Erie St. Lorain0.1/0.01 C,S,F,B 41˚28’18”/82˚10’57” dst Lorain WWTP Lorain
Black River HarborS 41˚28’28”/82˚11’08” w. of breakwall Lorain
0.3 S,F 41˚28’29”/82˚11’19” e. of w.brkwall Lorain0.2 S,F 41˚28’38”/82˚11’09” w. of e. brkwall Lorain
S 41˚28’41”/82˚10’19” east of CDF Lorain
French Creek3.2 C,S,F,B 41˚27’50”/83˚04’34” Abbe Rd. Avon0.5/0.4 C,F,B 41˚27’30”/82˚06’21” Gulf Rd. Avon
West Branch Black River41.7 C,S,F,B 41˚08’00”/82˚18’24” Rt. 511 Brighton33.3 F 41˚10’15”/82˚16’54” dst. Rt. 18 Brighton25.3 C,S,F,B 41˚12’21”/82˚13’02” Rt. 58 Wellington19.6 F 41˚14’18”/82˚11’55” Rt. 303 Wellington14.4 C 41˚16’46”/82˚09’45” Parsons Rd. Oberlin13.6/13.5 F,B 41˚16’47”/82˚09’10” dst. Parsons Rd. Oberlin4.2/4.1 C,S,F,B 41˚20’13”/82˚07’11” Rt. 20 Grafton1.2 F 41˚20’18”/82˚06’41” 3rd St. Bridge Grafton0.2/0.1 C,B 41˚22’18”/82˚06’45” Lake Ave. Grafton_____________________________________________________________________________
19

DSW/1992-12-8 1992 Black River June 13, 1996
Table 3. (cont.)_____________________________________________________________________________Stream/ type of USGS toporiver mile sampling Latitude/Longitude landmark map_____________________________________________________________________________Plum Creek7.0 C,F,B 41˚16’47”/82˚14’44” Hamilton Rd. Oberlin3.3/3.1 F,B 41˚17’35”/82˚11’14” ust. E. Lorain St. Oberlin2.95 C 41˚17’38”/82˚11’11” ust. Oberlin WWTP Oberlin2.9 F 41˚17’43”/82˚11’01” WWTP mix zone Oberlin2.8 F,B 41˚17’44”/82˚10’57” dst. Oberlin WWTP Oberlin0.9/0.8 C,F,B 41˚18’03”/82˚09’34” Rt. 20 Oberlin
Charlemont Creek2.8 F 41˚10’03”/82˚14’49” ust. Rt. 18 Wellington0.7/0.6 C,F,B 41˚11’19”/82˚13’38” ust Wellington Wellington
WWTP trib.0.5/0.4 C,F,B 41˚11’19”/82˚13’36” dst Wellington Wellington
WWTP trib.
Wellington Creek13.1 C,F,B 41˚09’28”/82˚12’35” Cemetery Rd. Wellington10.8 C,F,B 41˚10’39”/82˚11’38” Hawley Rd. Wellington
Buck Creek1.0 C,F,B 41˚06’55”/82˚17’00” Bursley Rd. Nova
East Branch Black River41.4/41.5 C,F,B 41˚05’11”/82˚04’08” Shaw Rd. Lodi36.8 F 41˚06’31”/82˚05’45” dst. Homer-River Rd Lodi32.5/32.4/32.3 C,F,B 41˚08’12”/82˚07’00” Smith Rd. LaGrange24.6 F 41˚11’23”/82˚06’00” Foster Rd. LaGrange18.9 C,S,F,B 41˚14’04”/82˚04’55” Vermont Rd. LaGrange11.3 C,S,F,B 41˚16’28”/82˚04’01” Parsons Rd. Grafton10.5/10.8 C,F 41˚16’18”/82˚04’35” dst Grafton WWTP Grafton10.1 B 41˚17’24”/82˚04’54” dst Grafton WWTP Grafton6.0 C,F,B 41˚19’30”/82˚04’38” ust Brentwood trib Grafton5.2/5.4 C,F,B 41˚19’58”/82˚04’11” dst Willow Cr Grafton3.07/3.0 C,F,B 41˚20’49”/82˚05’41” Fuller St. Grafton0.3/0.1 C,S,F,B 41˚22’07”/82˚06’24” Washington St. Grafton
Willow Creek2.85/2.9/2.8C,S,F,B 41˚19’36”/82˚03’04” dst Ross Grafton
East Fork of the East Branch of the Black River2.7/2.9 C,S,F,B 41˚02’24”/82˚00’47” Lodi Park Lodi1.6/1.5 C,F,B 41˚02’19”/82˚01’13” dst Lodi WWTP Lodi
West Fork of the East Branch of the Black River3.9/4.1/4.2 C,F,B 41˚01’17”/82˚03’17” Congress Rd. Lodi____________________________________________________________________________
20

DSW/1992-12-8 1992 Black River June 13, 1996
Table 4. Exceedences of Ohio EPA Warmwater Habitat criteria (OAC 3745-1) forchemical/physical parameters measured in the Black River study area, 1993 (units are#/100 ml for fecal coliform, µg/l for metals, and mg/l for all other parameters).
_____________________________________________________________________________
Stream Name River Mile Violation: Parameter (value)______________________________________________________________________________Black River 14.3 Fecal coliform:(6100◊¥, 5800◊¥, 9200◊¥, 9800◊¥) 11.5 Fecal coliform:(3100◊)
9.8 Fecal coliform:(2650◊)4.8 Oil and grease (27.6*)1.8 D.O.(2.2B‡‡ , 4.3M‡, 4.8B‡, 3.7B‡‡ , 4.3B‡, 4.9M‡)1.05 D.O.(2.1B‡‡ , 3.3B‡‡ , 4.4M‡, 4.7S‡, 3.75B‡‡ , 4.6M‡,
4.9S‡)0.01 Fecal coliform:(300,000◊)
East Branch 11.3 Fecal coliform:(4400◊)10.5 Fecal coliform:(5200◊¥)5.2 Fecal coliform:(2650◊)3.1 Fecal coliform:(2300◊, 3400◊)0.3 Fecal coliform:(10600◊¥, 6000◊¥, 3700◊, 5000◊¥, 3350◊)
Willow Creek 2.85 Fecal coliform:(5200״)
East Fork of 1.6 Fecal coliform:(4400◊)East Branch Copper: 59(62*)
Total residual chlorine:(0.3**)
West Branch 4.2 Fecal coliform:(3950◊)0.2 Fecal coliform:(4300◊, 25000◊¥, 13000◊¥, 11400◊¥)
Plum Creek 7.0 Fecal coliform:(2150◊)
Buck Creek 1.0 D.O. (4.6‡)
Wellington Cr. 13.1 D.O. (2.5‡‡ , 4.4‡)10.8 D.O. (1.7‡‡ , 4.4‡)
Charlemont Cr. 0.5 D.O. (4.0‡)______________________________________________________________________________* indicates an exceedence of numerical criteria for prevention of chronic toxicity (CAC)** indicates an exceedence of numerical criteria for prevention of acute toxicity (AAC)‡ violation of the average dissolved oxygen (D.O.) criterion‡‡ violation of the minimum dissolved oxygen (D.O.) criterion◊ exceedence of the Primary Contact Recreation criterion¥ exceedence of the Secondary Contact Recreation criterionS indicates surface sampleM indicates mid-depth sampleB indicates bottom sample
21

DSW/1992-12-8 1992 Black River June 13, 1996
Results and Discussion
FlowsDuring the 1992 survey season the months of July, August, and September experiencedabove normal rain fall in the Black River basin area. June and October flows, on average,were below normal. All flows recorded during the study were above the 80% duration flow(Figure 3).
1
10
100
1000
10000
5/1
Flow
(cf
s)
6/11 7/23 9/3 10/15
flow
Month / Day
chemical sampling dates
Q7-10
80% duration
80% Duration Exceedance=11 cfs
Q7,10
=3.6 cfs
(May-November)
fish community sampling
benthos colonization period
Figure 3. Flow hydrograph for the Black River at Cascade Park (Rm14.92) just downstream of the East and Weast Branchsconfluence. May 1992 to October 1992 with sampling dates forchemistry, benthos, and fish marked.
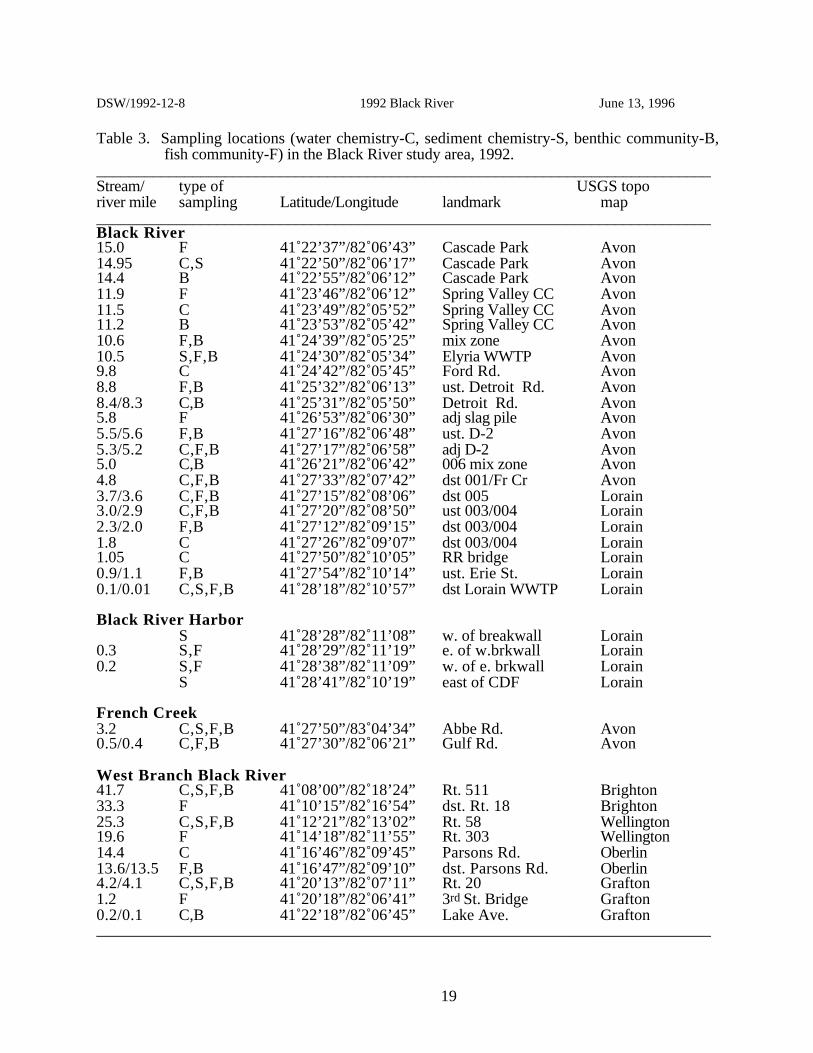
Chemical Water Quality
Black River Mainstem• Mean dissolved oxygen concentrations (based on daytime measurements) were in the 8-9
mg/l range from RM 14.3 to the head of the navigation channel where it declined to the 5-6mg/l range (Figure 4). Dissolved oxygen readings from samples taken at bottom and mid-river depths in the lower section of the navigation channel were frequently below the 4.0 mg/lminimum WWH criterion.
22

DSW/1992-12-8 1992 Black River June 13, 1996
• Datasonde™ surveys conducted on the mainstem showed a decline in dissolved oxygen (DO)concentrations downstream from the Elyria WWTP that extended about two milesdownstream to the start of the estuarine portion of the river. None of the DO values recordedwere violations of established criteria. Oxygen levels did not fall below 7.0 mg/l in thissegment. Oxygen concentrations were generally lower in the estuary with levels approaching6.0 mg/l at RM 1.05.
• Mean arsenic values ranged from <0.2 to 2.7 µg/l. The highest values were recorded at RM1.8 (downstream from the USS/KOBE Steel complex). Mean cadmium concentrations wereabove detection limits (0.21 to 0.28 µg/l) throughout the mainstem. The highest levels wererecorded below the Elyria WWTP. Mean chromium values were below detection limits in allmainstem samples. Mean copper values were below detection limits (10 µg/l) at all mainstemsites except for one sample at RM 0.01 (downstream Lorain-East WWTP) that had a value of12 µg/l. Mean lead concentrations ranged from <2 to 3.7 µg/l with the highest valuerecorded at RM 4.8 (downstream French Creek and USS/KOBE Steel 001). Mean nickelvalues were below detection limits (40 µg/l) in all samples except for one reading of 42 at RM3.7 (downstream USS/KOBE 005). Mean zinc concentrations ranged from <10 to 17 µg/lwith the highest values generally found throughout the river segment adjacent to theUSS/KOBE complex. None of the metal values recorded exceeded chronic water qualitycriteria.
• Mean chemical oxygen demand (COD) values ranged from 20.3 to 30.3 mg/l. The highestvalues were recorded at RM 4.8 (downstream French Creek and USS/KOBE 001) and thelowest were recorded at the mouth of the Black River.
• Mean nitrate concentrations increased below the Elyria WWTP from 1.4 mg/l to 6.03 mg/lthen declined to 4.44 mg/l at RM 8.4. Levels rose slightly for the next five river miles thendropped to 2.5 mg/l and eventually dropped to 1.25 mg/l at the mouth Mean ammonia-Nconcentrations were at or near the detection limit of 0.05 mg/l from RM 14.3 to RM 4.8(downstream French Creek and USS/KOBE 001). There was a gradual increase inconcentrations through the navigation channel. The highest value (0.47 mg/l) was recordedat RM 0.01 which is downstream from the Lorain-East WWTP discharge. Mean totalKjeldahl nitrogen (TKN) values ranged from 0.7 to 0.95 mg/l throughout the mainstem. Thehighest values were at RM 9.8 (downstream Elyria WWTP) and at RM 4.8 (downstreamFrench Creek and USS/KOBE 001). The highest individual sample result was from RM0.01 which is downstream from the Lorain-East WWTP.
• Mean cBOD5 ranged from 1.1 mg/l to 1.7 mg/l from RM 8.4 to the mouth.
• Mean phosphorus concentrations ranged from 0.08 to 0.24 mg/l with the highest levelsdownstream from the Elyria WWTP. (Figure 4).
• Mean total suspended solids values ranged from 17 mg/l at RM 0.01 to 35 at RM 2.9(upstream USS/KOBE 003/004 and the navigation channel).
• Oil sheens were common from RM 4.8 to RM 3.0. Oil seeps were observed on the westbank of the river adjacent the USS/KOBE Steel area from approximately RM 5.5 to 5.0.
23

DSW/1992-12-8 1992 Black River June 13, 1996
0
0.5
1
1.5
2
2.5
3
02468101214
Phos '82
Phos '92
Ph
osp
ho
rus (m
g/l)
Elyria WWTP
0
2
4
6
8
10
12
02468101214
DO '82
DO'92
Dis
solv
ed
Oxy
ge
n (m
g/l )
Elyria WWTP
River Mile
WWH 24hr. avg. min.
criterion
Minimum at any time
criterion
Figure 4. Phosphorus and Dissolved Oxygen (DO) concentrations in the BlackRiver mainstem by river mile in 1982 and 1992.
24

DSW/1992-12-8 1992 Black River June 13, 1996
French Creek• There was no significant difference in data collected at the two French Creek sites. The
French Creek WWTP is not having any noticable impact on the water quality in this segment.
East Branch• None of the individual D.O. values recorded in this subbasin violated water quality
standards. Mean dissolved oxygen concentrations did decline slightly (from 7.9 to 6.6 mg/l)between RM 41.45 and 32.4. Mean D.O. levels increased steadily, down to RM 6.0(downstream Grafton WWTP) where another slight decline occurred. D.O. again increasedslightly at the next downstream station then started another gradual decline through thebalance of the East Branch, but remained well above the WQS criterion of 4.0 mg/l (Figure5).
• Datasonde™ information showed oxygen concentrations steadally declining for four milesdownstream from the Grafton WWTP. These values did not drop below 6.0 mg/l though.
• Mean phosphorus concentrations increased below the Grafton WWTP and then again belowan unsewered area near RM 3.0 where the levels increased from 0.14 to 0.49 mg/l (Figure4). Other nutrients concentrations increased slightly below the Grafton WWTP.
• Mean heavy metals values varied little throughout the length of the East Branch with mostvalues at less than lab detection limits.
• Total suspended solids values were generally lower in the East Branch than in the WestBranch.
East Fork of the East Branch• There was a slight decrease in mean dissolved oxygen levels below the Lodi WWTP (9.35 to
8.57 mg/l)
• The Lodi WWTP had a slight effect on the East Fork of the East Branch as measured with theuse of DatasondsTM. Oxygen concentrations showed a decline downstream from the WWTPbut did not fall below 6.0 mg/l.
• Mean cadmium, copper, lead, and zinc concentrations increased below the Lodi WWTP.Cadmium increased from <0.2 to 0.45 µg/l, copper increased from <10 to 24.5 µg/l, leadincreased from <2 to 5.5 µg/l, and zinc increased from <10 to 25.5 µg/l.
• Nutrient concentrations increased significantly below the Lodi WWTP. Mean nitrateconcentrations increased from 0.1 to 4.2 mg/l. Mean phosphorus concentrations increasedfrom 0.2 to 0.86 mg/l.
• High total residual chlorine readings were noted below the Lodi WWTP and in the LodiWWTP effluent. On one sample date the residual chlorine level was 0.30 mg/l downstreamfrom the 001 outfall.
West Branch• Nitrate concentrations increased steadily in a downstream direction. There was a noticeable
25

DSW/1992-12-8 1992 Black River June 13, 1996
increase in phosphorus concentrations (from 0.06 to 0.28 mg/l) below Charlemont Creek(Figure 5). Other nutrients remained steady.
• Heavy metals levels showed little change throughout the basin.
• Mean temperature and dissolved oxygen readings increased steadily from upstream todownstream.
0
0.1
0.2
0.3
0.4
0.5
Pho
spho
rus
(mg/
l)
45 35 25 15 50
0.1
0.2
0.3
0.4
0.5
Pho
spho
rus
(mg/
l)
45 35 25 15 5
Charlemont Creek
0
2
4
6
8
10
12
45 35 25 15 5
RIVER MILE
Diss
olve
d O
xyge
n (m
g/l)
Minimum at any time
criterion
WWH
24hr. avg. min.criterion
0
2
4
6
8
10
Diso
lved
Oxy
gen
(mg/
l)
12
45 35 25 15 5River Mile
Minimum
at any timecriterion
Charlemont Creek
WWH
24hr. avg. min.criterion
Figure 5. Phosphorus and dissolved oxygen concentrations in the East Branch (lefthand figures) and the West Branch (right hand figures) of the Black Riverby river mile 1992.
• Mean suspended solids levels increased from 6.8 mg/l at river mile 41.7 to 39 mg/l at river mile4.2 then dropped to 19.5 mg/l at the most downstream site (RM 0.2).
Plum Creek• The site at RM 7.0 continues to suffer from low dissolved oxygen levels. Readings as low as
1.5 mg/l were recorded. The DatasondTM survey conducted on Plum Creek showed theOberlin WWTP was not influencing the dissolved oxygen concentrations in the stream (Figure5).
26

DSW/1992-12-8 1992 Black River June 13, 1996
• Except for nitrate levels, which increase significantly (0.19 to 13.58 mg/) below the OberlinWWTP, there was very little difference in the water quality in Plum Creek when comparing thesites located upstream and downstream of the Oberlin WWTP which is located at RM 2.85.
Charlemont Creek• Mean nutrients concentrations, especially phosphorus and nitrate, increased significantly
(nitrate increased from 0.76 to 6.0 mg/l and phosphorus increased from 0.1 to 0.9 mg/l) at thesite downstream the Wellington WWTP tributary. No major differences were noted in otherparameters.
Fish Tissue
Collection/Procedures• Thirty fish tissue samples collected from nine stations during the 1992 survey were
analyzed.. Two stations were located in the East Branch (RM 3.07 and 0.3), two stations inthe West Branch (RM 4.2 and 1.3), three stations in the main stem (RM 5.3, 2.9 and 1.05)and two stations in the Lake Erie harbor area just inside the east and west breakwalls.
Results• The results of the 1992 fish collections and the tissue analytical results are shown in
Appendix Table C-2.
• Carp (both whole-body and fillet) and brown bullhead collected during the survey usuallyhad higher lipid content and higher concentrations of pollutants than either sport species orother benthic feeders. Carp fillet samples usually had lower lipid content and lower pollutantconcentrations than whole-body samples. Tissue samples from all species collected in theEast and West Branches generally had lower pollutant concentrations than those collected inthe mainstem and harbor area.
• Reportable PCB concentrations were identified in 24 of 30 samples and ranged from non-detectable to 0.6 ppm (PCB 1260). No samples were identified with contaminant levels ofPCBs greater than the FDA action level of 2 ppm.
• Only one volatile organic compound (VOC) priority pollutant (M-Xylene) was identified inone sample at a concentration of 0.208 ppm (detection limit of 0.189 ppm). A total of 14non-priority pollutant VOC’s were tentatively identified from GC/MS peaks. The highestconcentration of a VOC in one sample was 5.85 ppm for the compound hexanal. Petroleumbased VOC’s were found in 27 of 30 samples.
• Priority pollutant pesticide compounds were identified in all 30 samples and ranged fromnon-detectable to 0.1 ppm (4,4-DDE). The pesticides identified consisted of dieldrin,methoxychlor and DDT and its metabolites (Table C-2).
• No base neutral acid extractible compounds (BNA’s) were identified in the samples.
• At least one heavy metal was present in each sample. Concentrations ranged from non-detectable to 0.264 ppm (cadmium), 4.34 ppm (chromium), 1.98 ppm (copper), 0.297 ppm(lead), 0.549 ppm (mercury), and 90.1 ppm (zinc).
Historical Data• Historical fish tissue results from the Black River are from whole body composite samples
(both single and multi-species) collected from 1978-82 and analyzed for PCBs, pesticides,
27

DSW/1992-12-8 1992 Black River June 13, 1996
and priority pollutants. Total PCB concentrations ranged from 0.1 to 12.6 ppm. Twosamples contained PCB concentrations above the FDA action level of 2.0 ppm. Sixteenpesticide compounds were identified and quantified with concentrations from 0.002 to 0.174ppm. Thirty-one organic compounds (consisting mainly of polyaromatic hydrocarbons orPAHs) were identified in concentrations ranging from non-detectable to 5.724 ppm(phenanthrene). Three other PAHs (acenapthylene, fluoranthene and pyrene) were found inbrown bullhead composites at amounts greater than 1 ppm. All samples were collected in themainstem or harbor area and consisted primarily of bottom dwelling species (carp, brownbullhead, channel catfish, freshwater drum).
Sediment Chemistry
Mainstem• The US EPA-Eastern District Office sampled 13 sites on the mainstem in 1992. That survey
area covered RM 5.5 to RM 2.35. Samples were collected for heavy metals, BNAs, VOCs,PCBs, and pesticides. Ohio EPA sampled three additional mainstem sites, three sites eachon the West and East Branches, and single sites on French Creek, Willow Creek, and theEast Fork of the East Branch. Parameter coverage included heavy metals, BNAs, PCBs, andpesticides at the Black River mouth and French Creek-Abbe Road sites and heavy metals atthe other sites. Metals results are presented in Appendix Table C-3 and organic results arepresented in Appendix Table C-4.
• Unquantifiable and quantifiable concentrations of naphthalene, benzo(a) anthracene,benzo(a)pyrene, toluene, ethyl benzene, and total xylene was found throughout the studyarea. The highest sediment organics concentrations were detected at RM 3.8, which is justupstream of the upper limit for the 1990 USS/KOBE Steel contaminated sediment removalproject.
• No PCBs were detected in any of the samples.
• The pesticides 4,4,-DDE and 4,4,-DDT were detected at 12 of 14 sites at concentrations up to10 ppb.
• Elevated metals concentrations can be found throughout the US EPA sampled segment (RM5.5-2.35) (using Kelly and Hite 1984). The site at RM 5.3 downstream from theUSS/KOBE D-2 landfill had 6 of 7 metals in the highly elevated and \extremely elevatedranges. The sites at RMs 3.8, 3.45, and 2.35 had 5 of 7 metals in the highly elevated andextremely elevated ranges. Zinc, cadmium, and iron were the metals most often found in thehighly elevated and extremely elevated ranges. The sample from the mouth of French Creekshowed highly elevated levels of cadmium, chromium, iron, lead, and zinc. The WestBranch, East Branch , East Fork, and Willow Creek results were all in the non-elevated,slightly elevated,, and elevated ranges except for one highly elevated cadmium result at RM0.3 of the East Branch.
Harbor• Four harbor/breakwall sites were sampled by Ohio EPA. Parameter coverage included heavy
metals, BNAs, PCBs, and pesticides. Metals results are presented in Appendix Table C-3and organic results are presented in Appendix Table C-4.
• The pesticide 4,4, -DDE was detected in low concentrations at all four harbor/breakwall sites.
• The PAH benzo (b) fluoranthene was found at 0.9 ppm at the site located on the east side of
28

DSW/1992-12-8 1992 Black River June 13, 1996
the confined disposal facility (CDF).
• No other organic compounds, PCBs, or pesticides were found.
• Arsenic was found at heavily polluted levels at all four harbor breakwall sites. (GuidelinesFor The Pollutional Classification of Great lakes Harbor Sediments, US EPA,, 1977).Chromium, copper, and lead were found at moderatly polluted levels at two sites and at non-polluted levels at two sites. Iron was found at heavily polluted levels at two sites, moderatlypolluted levels at one site, and non-polluted levels at one site. Zinc was found at moderatlypolluted levels at all four sites.
Point Source Improvements: 1982 - 1992
• 1983 - US Steel (now USS/KOBE) closed its coke plant, eliminating coking wastewaterdischarge from outfall 002.
• 1988 - Lorain West Side WWTP started operation. It receives 3 MGD of flow treated by theEast Side WWTP prior to discharge to the Black River. The East Side WWTP dischargesdirectly to Lake Erie.
• 1988 - Lodi, Wellington, Oberlin and Grafton WWTPs complete upgrades, resulting insignificant improvement in quality of their discharges.
• 1988 - Stanadyne (now MOEN) eliminated a major industrial discharge by connecting toElyria sanitary sewer system following pretreatment.
• 1989 - Elyria WWTP upgrade completed, resulting in significant improvement in the qualityof its discharge.
• 1989 - GMC Fisher Body Elyria Plant closed, eliminating a major industrial wastewaterdischarge.
• 1990 - US Steel (now USS/KOBE) dredged PAH contaminated sediment from around theold coke plant outfall 002. Dredged material placed in D2 landfill on USS/KOBE property.
• 1992 - Lagrange WWTP upgrade completed.
29
DSW/1992-12-8 1992 Black River June 13, 1996
0
2
4
6
8
10
11.25 10.05 8.55 7.90 5.90
Dis
solv
ed Oxy
gen (m
g/l)
RIVER MILE
Grafton WWTP
WWH 24 Hr. ave. min. criterion
Minimum at any time criterion
East Branch Black River
2
4
6
8
10
12
14
16
18
10.7 9.8 9.0 8.3 6.5 5.4 4.6 3.2 2.25 1.0
Dis
solv
ed Oxy
gen (m
g/l)
RIVER MILE
WWH 24 hr. ave. min.criterion
Minimum at any timecriterion
Black River mainstem
Figure 6. Boxplot results for dissolved oxygen in the East Branch andmainstem of the Black River showing medium, 25%, 75%,minimum, maximum, and outliers.
30
DSW/1992-12-8 1992 Black River June 13, 1996
Collection System Overflows
City of Elyria • There are 37 combined sewer overflows (CSOs) and 58 separate sewer overflows (SSOs) in
the Elyria collection system. Elyria has instituted an aggressive sewer rehabilitation/reliefsewer construction program which has improved conditions by eliminating or reducing flowsfrom four CSOs and twenty SSOs since 1986. Fifteen SSOs and one CSO are scheduled tobe upgraded in 1993. Elyria is under a 1986 USEPA Consent Order to eliminate the SSOsby December, 1993. Elyria has not been able to meet this milestone and is expected torequest an extension of the deadline. There are 9 pump station overflows in the collectionsystem. The pump stations have been rehabilitated and now overflow less often. On arotating basis Elyria monitors overflows from the CSOs/SSOs listed in its NPDES permit forcBOD, total suspended solids, volume, number of occurrences and duration.
City of Lorain• There are five CSOs and one pump station in the Lorain collection system that discharge to
the Black River. Fourteen CSO/SSOs are listed in the NPDES permit as discharging to LakeErie. The completion of the Lorain West Side WWTP in 1988 was designed to reduce oreliminate discharges from these overflows. The NPDES permit requires Lorain to monitorand report overflows from these sources. This was not being performed in 1992. The cityhas contracted with a consulting firm to begin SSO monitoring and evaluation in late 1993.
Point Source Pollutant Loadings Trends
USS/KOBE Steel Company• 001-This outfall originates at the Pipe Mill lagoon. Flows have been significantly reduced
due to increased efforts towards recycling the treated wastewater. There has been a majordecrease in the loadings of suspended solids and oil+grease as a result (Figures 7).
• 002-The coke ovens that contributed flow to this outfall were shut down in 1983. This hasresulted in significant decreases in the loadings for oil+grease, ammonia-N, PAHs, andsuspended solids from this outfall (Figure 8).
• 003-This blast furnace outfall has had a steady to slightly declining flow rate over the last tenyears. The blast furnace outfalls are among the largest contributors of suspended solids andammonia-N in the basin (Figure 9).
• 004-Flows from this blast furnace outfall have increased significantly over the last ten years.It is a major source for suspended solids, Ammonia-N, and oil+grease (Figure 10).
• 005-Flows from the Bar Mill outfall have been incresing steadily since 1983. Loadings foroil and grease and suspended solids have been increasing with the increased flow (Figure11).
• 006-This outfall services the leachate treatment system at the dredged sediment landfill. It hasbeen in operation since 1989. Flows, as well as BOD5, COD, ammonia-N, and totalsuspended solids have been decreasing steadily (Figure 11).
31

DSW/1992-12-8 1992 Black River June 13, 1996
0
500
1000
1500
2000
Oil + G
rease
(kg
/day)
50th percentile
95th percentile
0
5000
1.000 104
1.500 104
2.000 104
2.500 104
3.000 104
TS
S (
kg/d
ay)
50th percentile
95th percentile
0
10
20
30
40
50
60
Flo
w (
mgd)
82 83 84 85 86 87 88 89 90 91 92YEAR
Figure 7. Annual trends in oil and grease, Total Suspended Solids and flowfrom the USS/KOBE Steel 001 discharge outfall, 1982-1992.
32

DSW/1992-12-8 1992 Black River June 13, 1996
0
200
400
600
800
1000
1200
Am
monia
-N (
kg/d
ay)
50th
percentile
95th percentile
0
5000
1.000 104
1.500 104
2.000 104
TS
S (
kg/d
ay)
50th percentile
95th percentile
0
5
10
15
20
Flo
w (
mgd)
82 83 84 85 86 87 88 89 90 91 92
YEAR
Figure 8. Annual trends in ammonia- N, Total Suspended Solids and flowfrom the USS/KOBE Steel 002 discharge outfall, 1982-1992.
33

DSW/1992-12-8 1992 Black River June 13, 1996
0
200
400
600
800
1000
1200
1400
Am
monia
-N (
kg/d
ay) 50th percentile
95th percentile
0
5000
1.000 104
1.500 104
2.000 104
2.500 104
3.000 104
3.500 104
4.000 104
TS
S (
kg/d
ay)
50th percentile
95th percentile
0
10
20
30
40
50
60
70
80
Flo
w (
mgd)
82 83 84 85 86 87 88 89 90 91 92YEAR
Figure 9. Annual trends in ammonia- N, Total Suspended Solids and flowfrom the USS/KOBE Steel 003 discharge outfall, 1982-1992.
34

DSW/1992-12-8 1992 Black River June 13, 1996
0
500
1000
1500
2000
Am
monia
-N (
kg/d
ay)
50th percentile95th percentile
0
4000
8000
1.2x10⁴
1.6x10⁴
TS
S (
kg/d
ay)
2.0x10⁴
50th percentile95th percentile
0
5
10
15
20
25
Flo
w (
mgd)
82 83 84 85 86 87 88 89 90 91 92YEAR
Figure 10. Annual trends in ammonia- N, Total Suspended Solids and flowfrom the USS/KOBE Steel 004 discharge outfall, 1982-1992.
35

DSW/1992-12-8 1992 Black River June 13, 1996
0
1000
2000
3000
4000
5000
6000
7000
82 83 84 85 86 87 88 89 90 91 92
USS/KOBE 005 outfall
TSS 50%TSS 95%
TS
S (k
g/d
ay)
YEAR
0
2
4
6
8
10
12
14
82 83 84 85 86 87 88 89 90 91 92
USX-KOBE 006 outfall
COD 50%COD 95%
CO
D (k
g/d
ay)
YEAR
0
2
4
6
8
10
12
14
16
82 83 84 85 86 87 88 89 90 91 92
USS/KOBE 005 outfall
Flo
w (m
gd)
YEAR
0
0.01
0.02
0.03
0.04
0.05
0.06
0.07
82 83 84 85 86 87 88 89 90 91 92
USS/KOBE 006 outfallF
low
(mgd)
YEAR
Figure 11. Annual trends in COD loadings and flows for the USS/KOBE Steel 005outfall and annual trends for TSS loadings and flow for the USS/KOBESteel 006 outfall 1982-1992.
Lorain -East WWTP• Flows from the Eastside facility declined starting in 1988 when the Lorain West WWTP
came on line and took over a portion of the flow originally going to the Eastside WWTP.Flows have begun to increase though in the last year. Total suspended solids, ammonia-N, ,TKN, phosphorus, copper, lead, and zinc loadings (Figure 12)and cBOD5 (Figure 14) allmirrored the increasing flow pattern .
Elyria WWTP• Flows from the Elyria WWTP have been steady for the past ten years. A $38 million
upgrade was completed in late 1988. Since that time, loadings for monitored nutrients andmost metals have dropped significantly (Figure 13 and 14).
Oberlin WWTP• Flows from the Oberlin WWTP have declined somewhat since the City started a sewer
rehabilitation project in their service area. A $4.3 million upgrade was completed in 1988.Since that time loadings for most metals and nutrients have been declining (Figure 15).
36

DSW/1992-12-8 1992 Black River June 13, 1996
Grafton WWTP• The Grafton WWTP completed a $1.8 million expansion in 1988. Since that time, additional
flows have been directed to the facility as smaller package plants and treatment systems havebeen tied into the Grafton facility. Two large prisons have recently been constructed inGrafton and a possible third is under consideration although planning is presently on hold.The WWTP may need to expand in the near future. Loadings of all permitted parametershave been increasing steadily (Figure 16). This WWTP has had a major problem withsolids/sludge management. Sludge has been observed overflowing the drying beds.
Lodi WWTP• A Lodi WWTP expansion and upgrade was completed in 1988. Mean flows have been
relatilely constant, except in wet years when flows increase substantialy. Nutrient loadingshave been declining in the last 2-3 years. Little monitoring information was available for theyears prior to 1988 (Figure 16)
French Creek WWTP• Flows from the French Creek WWTP have been increasing as sewers are extended further
out into the service area. Loadings for certain heavy metals and total suspended solids havebeen increasing while loadings for nutrients have been decreasing (Figure 17). This WWTPis under-loaded at this time.
Wellington WWTP• Flows and loadings for nutrient parameters have been increasing steadily since 1988 (Figure
18).
37

DSW/1992-12-8 1992 Black River June 13, 1996
0
0.5
1
1.5
2
2.5
Copper (kg
/day)
82 83 84 85 86 87 88 89 90 91 92
50th
percentile
95th
percentile
0
200
400
600
800
1000
1200
1400
TK
N (
kg/d
ay)
82 83 84 85 86 87 88 89 90 91 92
50th percentile
95th percentile
0
500
1000
1500
2000
2500
3000
TS
S (kg
/day)
82 83 84 85 86 87 88 89 90 91 92
50th percentile
95th
percentile
0
20
40
60
80
100
120
Phosp
horu
s (kg
/day)
82 83 84 85 86 87 88 89 90 91 92
50th percentile
95th percentile
0
5
10
15
82 83
Zin
c (k
g/d
ay)
84 85 86 87 88 89 90 91 92
50th percentile
95th percentile
Year
0
5
10
15
20
25
Flo
w (m
gd)
82 83 84 85 86 87 88 89 90 91 92Year
Figure 12. Yearly average loadings for copper, TKN (total Kjeldahl nitrogen, TSS(total suspended solids), phosphorus, and zinc with yearly average flowsfor the Lorain East WWTP 1982-1992.
38

DSW/1992-12-8 1992 Black River June 13, 1996
0
1
2
3
4
5
6
7
Copper (kg
/day)
82 83 84 85 86 87 88 89 90 91 92
50th percentile
95th percentile
0
500
1000
1500
2000
2500
TS
S (
kg/d
ay)
82 83 84 85 86 87 88 89 90 91 92
50th percentile
95th percentile
0
50
100
150
200
250
300
Phosp
horu
s (kg
/day)
82 83 84 85 86 87 88 89 90 91 92
50th percentile
95th percentile
0
200
400
600
800
1000
1200
1400
1600
Am
monia
-N (
kg/d
ay)
82 83 84 85 86 87 88 89 90 91 92
50th percentile
95th percentile
0
2
4
6
8
10
12
14
Zin
c (kg
/day)
82 83 84 85 86 87 88 89 90 91 92YEAR
50th percentile
95th percentile
0
2
4
6
8
10
Flo
w (
mgd)
82 83 84 85 86 87 88 89 90 91 92
YEAR
Figure 13. Yearly average loadings for copper, TSS, phosphorus, ammonia-N,and zinc with yearly average flows for the Elyria WWTP 1982 - 1992.
39

DSW/1992-12-8 1992 Black River June 13, 1996
0
200
400
600
800
1000
1200
1400
1600
82 83 84 85 86 87 88 89 90 91 92
Lorain-East WWTP50th percentile
95th percentile
cBO
D5
(kg
/da
y)
0
500
1000
1500
2000
2500
3000
82 83 84 85 86 87 88 89 90 91 92
Elyria WWTP50th percentile
95th percentile
cBO
D5 (kg/d
ay)
Year
Figure 14. Yearly average cBOD5 for the Lorain East and Elyria WWTPs 1982-1992.
40

DSW/1992-12-8 1992 Black River June 13, 1996
0
10
20
30
40
50
60
70
80
82 83 84 85 86 87 88 89 90 91 92
5 0 th percentile
9 5th percentile
TSS
(kg
/day
)
Year
0
20
40
60
80
100
82 83 84 85 86 87 88 89 90 91 92
5 0 th percentile
9 5th percentile
Am
mon
ia-N
(kg/
day)
Year
0
20
40
60
80
100
82 83 84 85 86 87 88 89 90 91 92
50th percentile
95th percentile
cBO
D5 (k
g/da
y)
Year
0
5
10
15
20
25
30
35
40
82 83 84 85 86 87 88 89 90 91 92
5 0th percentile
9 5 th percentileP
hosp
horu
s (k
g/da
y)
Year
0
0.5
1
1.5
2
82 83 84 85 86 87 88 89 90 91 92
Flow
(mgd
)
YEAR
Figure 15. Yearly average loadings of ammonia-N, phosphorus, cBOD5, andTSSwith yearly average flows for the Oberlin WWTP 1982-1992.
41

DSW/1992-12-8 1992 Black River June 13, 1996
0
5
10
15
20
25
30
35
83 84 85 86 87 88 89 90 91 92
LODI WWTP 50th percentile
95th percentile
cBO
D5 (kg/d
ay)
Year
0
0.2
0.4
0.6
0.8
1
1.2
1.4
82 83 84 85 86 87 88 89 90 91 92
Flo
w (m
gd)
Year
LODI WWTP
0
50
100
150
200
82 83 84 85 86 87 88 89 90 91 92
GRAFTON WWTP 50th percentile
95th percentile
cBO
D5 (kg/d
ay)
Year
0
50
100
150
200
250
82 83 84 85 86 87 88 89 90 91 92
50t h
percentile
95th percentile
TS
S
(kg/d
ay)
Year
GRAFTON WWTP
0
0.2
0.4
0.6
0.8
1
82 83 84 85 86 87 88 89 90 91 92
Flo
w (m
gd)
Year
GRAFTON WWTP
Figure 16. Yearly average loadings for cBOD5 and yearly average flows for the Lodi WWTPand yearly average loadings for cBOD5 and TSS with yearly average flows for theGrafton WWTP 1982-1992.
42

DSW/1992-12-8 1992 Black River June 13, 1996
0
20
40
60
80
100
86 87 88 89 90 91 92
50th percentile
95th percentile
cBO
D5
(kg
/da
y)
0
2
4
6
8
10
12
14
86 87 88 89 90 91 92
50 t h percentile
95 t h percentile
Ph
osp
ho
rus
(kg
/da
y)
0
10
20
30
40
50
60
70
86 87 88 89 90 91 92
50 t h percentile
95 t h percentile
TK
N
(kg/d
ay)
0
50
100
150
86 87 88 89 90 91 92
50 t h percentile
95 t h percentileT
SS
(k
g/d
ay)
0
0.5
1
1.5
2
2.5
3
3.5
4
86 87 88 89 90 91 92
Flo
w (m
gd)
Figure 18. Yearly average loadings for cBOD5, phosphorus,TKN, and TSS with yearlyaverage flows for the French Creek WWTP 1986-1992.
43
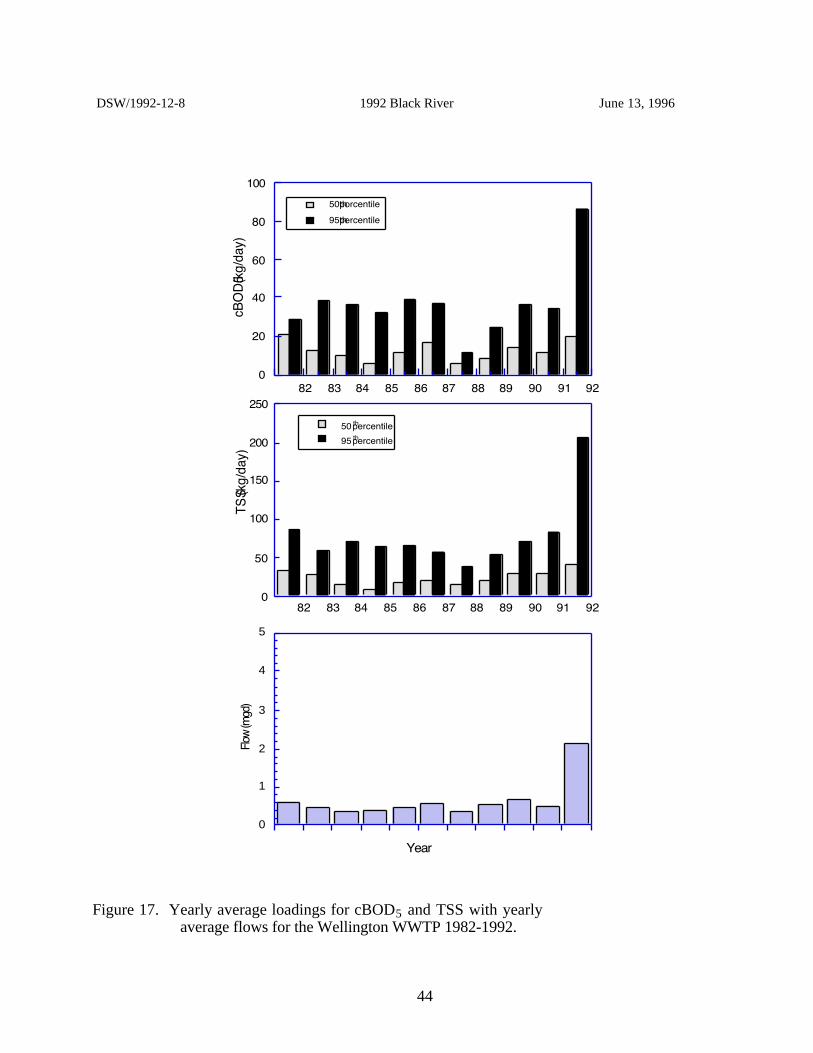
DSW/1992-12-8 1992 Black River June 13, 1996
0
20
40
60
80
100
82 83 84 85 86 87 88 89 90 91 92
50th porcentile
95th percentile
cBO
D5
(kg
/da
y)
0
50
100
150
200
250
82 83 84 85 86 87 88 89 90 91 92
50 th percentile
95 th percentile
TS
S (kg
/da
y)
0
1
2
3
4
5
Flow
(mgd
)
Year
Figure 17. Yearly average loadings for cBOD5 and TSS with yearlyaverage flows for the Wellington WWTP 1982-1992.
44

DSW/1992-12-8 1992 Black River June 13, 1996
Physical Habitat for Aquatic Life
• Overall the fundamental habitat quality in the Black River basin is good. Very little directchannel modification has taken place in the system. The greatest concentration of habitatmodification has occurred in the navigation channel (RMs 3.0 - 0.1) where shorelines havebeen modified with cement and steel sheetpiling seawalls and the channel has been dredged toapproximately twenty-five feet. The lowest average QHEI scores are found in the lakeaffected portions of the river. On the other extreme, the highest quality habitat is found in theWest Fork of the East Branch where gradients are high and nonpoint impacts from agricultureare consequently least.
• Most lotic sites in the basin display a well developed riffle/pool complex with a substratederived primarily from glacial tills (sand, gravel, cobble, and boulders). Some sites havebedrock dominating the substrate (QHEI scores remained above fifty). Other sites, whereboats were used to sample, pools were quite long and riffles were very few. These lowergradient areas (East Br. RM 24.6, West Br. RMs19.6 and 13.6) had increased sedimentdeposition and lower than average habitat quality scores.
• The most prevalent habitat deterioration was a consequence of substrate embededness as aresult of runoff from farm fields, especially in the West Branch (RMs 41.7-1.2) and EastBranch (RMs 41.5 - 18.9). Most of the tributaries in the upper reaches of the East and WestBranch are affected by sediment runoff. Specifically French Creek Rm 3.0, East Fork EastBranch Rm 1.6, Willow Creek RM 2.9, Plum Creek Rms 3.3 and 2.9, Wellington CreekRMs 13.1 and 10.9, Charlemont Creek RMs 2.8 and 0.5, and Buck Creek RM 1.0 all wereaffected by excess sediments. If siltation and embededness factors are removed from theQHEI matrix (Table 6) for these areas, the number of moderate Modified Warmwater Habitatinfluences is halved. If sediment associated impacts were reduced in the Black River basin,overal habitat quality would be much higher.
Table 5. Average QHEI scores for thirteen relatively homogenous segments of the Black Riverbasin based on sampling conducted during July - October, 1992.
______________________________________________________________________________
Sample Location: Segment Description Sample Segment
Upstream Downstream Substrate Location AverageRiver Mile River Mile River Mile Embeddedness QHEI QHEI
______________________________________________________________________________
Segment 1: Buck Creek1.0 1.0 1.0 Moderate 67.5 67.5
Segment 2: Charlemont Creek2.8 0.5 2.8 Extensive 70.5 72.7
0.7 Normal 74.5 0.5 Extensive 73.0
Segment 3: Wellington Creek13.1 10.8 13.1 Moderate 69.0 62.0
10.8 Extensive 55.0______________________________________________________________________________
45

DSW/1992-12-8 1992 Black River June 13, 1996
Table 5. (cont.)______________________________________________________________________________
Sample Location: Segment Description Sample Segment
Upstream Downstream Substrate Location AverageRiver Mile River Mile River Mile Embeddedness QHEI QHEI
______________________________________________________________________________
Segment 6: West Fork East Branch4.1 4.1 4.1 None 75.0 75.0
Segment 7: East Fork East Branch2.7 1.6 2.7 None 70.5 70.5
1.6 Moderate 70.5Segment 8: Willow Creek
2.9 2.9 2.9 Moderate 72.5 72.5Segment 9: East Branch
41.5 0.3 41.5 Extensive 54.5 66.636.8 Moderate 75.032.5 Extensive 60.024.6 Extensive 57.018.9 Moderate 73.011.3 Normal 65.510.1 Normal 90.0 6.0 Normal 53.5 5.2 Normal 84.0 3.0 None 63.5 0.3 Moderate 57.0
Segment 10: French Creek3.2 0.4 3.2 Moderate 71.0 64.5
0.4 Normal 58.0Segment 11: East Branch West Branch confluence to lake affected area
15.0 8.8 15.0 Normal 86.0 75.811.9 Normal 87.510.5 Normal 87.0 8.8 Normal 77.0
Segment 12: Lake Erie affected area of Black River5.8 0.1 5.8 Normal 58.0 52.3
5.5 Normal 58.0 5.2 Normal 49.0 4.8 Normal 59.5 3.7 Normal 42.0 3.0 Normal 57.0 2.3 Normal 55.0 0.9 Normal 52.0 0.1 Moderate 40.0
Segment 13: Black River harbor areaN/A N/A 0.3 Normal 59.5 57.0
0.2 Normal 54.5
______________________________________________________________________________
46

KeyQHEIComponents
WWH Attributes
QHEI
MWH Attributes
High Influence Moderate Influence
Gradient(ft/mile)
RiverMile
Qualitiative Habitat Evaluation Index (QHEI) matrix showing modified and warmwater habitat characteristics forthe Black River study area, July-September, 1992.
Table 6.
(20-001) Black River
Year: 92
86.0 ■ ■ ■ ■ ■ ■ ■ ■ ■ 15.0 3.70 9 0 0 0.10 0.10
87.5 ■ ■ ■ ■ ■ ■ ■ ■ 11.9 5.62 8 0 1▲ 0.11 0.22
87.0 ■ ■ ■ ■ ■ ■ ■ ■ ■ 10.5 ▲ 5.62 9 0 1 0.10 0.20
77.0 ■ ■ ■ ■ ■ ■ ■ ■ 8.8 4.00 8 0 1▲ 0.11 0.22
53.0 ■ ■ ■ ■ 5.8 ▲ ▲ ▲▲ 0.10 4 0 5▲ 0.20 1.20
58.0 ■ ■ ■ ■ ■ 5.5 ▲▲ ▲ 0.10 5 0 4▲ 0.17 0.83
49.0 ■ ■ ■ ■ 5.2 ▲ ▲ ▲ ▲ 0.10 4 0 5▲ 0.20 1.20
59.5 ■ ■ ■ ■ ■ ■ 4.8 ▲ ▲ 0.10 6 0 3▲ 0.14 0.57
57.0 ■ ■ ■ ■ ■ ■ 3.0 ▲ ▲ 0.10 6 0 3▲ 0.14 0.57
55.0 ■ ■ ■ ■ ■ 2.3 ▲ ▲ ▲ 0.10 5 0 4▲ 0.17 0.83
52.0 ■ ■ ■ ■ ■ 0.9 ▲ ▲ ▲ ▲ 0.10 5 0 5▲ 0.17 1.00
59.5 ■ ■ ■ ■ ■ 0.3 ▲▲ ▲▲ 0.10 5 0 5▲ 0.17 1.00
54.5 ■ ■ ■ ■ 0.2 ▲▲ ▲▲ 0.10 4 0 6▲ ▲ 0.20 1.40
40.0 ■ ■ ■ ■ ● 0.1 ▲▲ ▲ 0.10 4 1 5▲ ▲ 0.40 1.40
(20-002) French Creek
Year: 92
71.0 ■ ■ ■ ■ ■ ■ ■ 3.0 ▲ ▲ 6.85 7 0 3▲ 0.13 0.50
58.0 ■ ■ ■ ■ ■ 0.4 ▲▲ ▲ 0.10 5 0 4▲ 0.17 0.83
(20-003) Beaver Creek
Year: 92
61.0 ■ ■ ■ ■ ■ ■ ● 11.0 ● ● ▲▲ ▲15.15 6 3 3 0.57 1.00
71.5 ■ ■ ■ ■ ■ ■ ■ ■ 7.0 ● ▲33.33 9 1 1 0.20 0.30
70.5 ■ ■ ■ ■ ■ ■ ■ 4.7 ● ▲ ▲11.11 7 1 2 0.25 0.50
68.5 ■ ■ ■ ■ ■ ■ 3.0 ● ▲ ▲▲13.16 6 1 4▲ 0.29 0.86
70.0 ■ ■ ■ ■ ■ ■ ■ ■ 1.8 ▲ ▲ 7.35 8 0 2 0.11 0.33
(20-010) East Branch Black River
Year: 92
54.5 ■ ■ ■ ■ ■ ■ 41.5 ▲ ▲ ▲ 3.34 6 0 5▲ ▲ 0.14 0.86
06/13/9 1

KeyQHEIComponents
WWH Attributes
QHEI
MWH Attributes
High Influence Moderate Influence
Gradient(ft/mile)
RiverMile
Qualitiative Habitat Evaluation Index (QHEI) matrix showing modified and warmwater habitat characteristics forthe Black River study area, July-September, 1992.
Table 6.
(20-010) East Branch Black River
Year: 92
75.0 ■ ■ ■ ■ ■ ■ ■ ■ 36.8 ▲ ▲ 3.05 8 0 2 0.11 0.33
60.0 ■ ■ ■ ■ ■ ■ 32.5 ▲ ▲ ▲ 1.55 6 0 5▲ ▲ 0.14 0.86
57.0 ■ ■ ■ ■ ■ ■ 24.6 ▲ ▲ ▲ 1.95 6 0 5▲ ▲ 0.14 0.86
73.0 ■ ■ ■ ■ ■ ■ ■ 18.9 ▲ ▲ ▲ 2.98 7 0 4▲ 0.13 0.63
65.5 ■ ■ ■ ■ ■ ■ ■ 11.3 ▲▲12.82 7 0 3▲ 0.13 0.50
90.0 ■ ■ ■ ■ ■ ■ ■ ■ ■ 10.1 12.82 9 0 0 0.10 0.10
53.5 ■ ■ ■ ■ ■ 6.0 ● ▲▲ 8.33 5 1 3▲ 0.33 0.83
84.0 ■ ■ ■ ■ ■ ■ ■ ■ ■ 5.2 2.44 9 0 0 0.10 0.10
63.5 ■ ■ ■ ■ ■ ■ ■ 3.0 ▲▲ ▲13.51 7 0 4▲ 0.13 0.63
57.0 ■ ■ ■ ■ 0.3 ▲ ▲ ▲▲21.74 4 0 5▲ 0.20 1.20
(20-014) East Fork East Branch Black River
Year: 92
71.5 ■ ■ ■ ■ ■ ■ ■ ■ 2.7 ● ● ▲30.30 8 2 2▲ 0.33 0.56
70.5 ■ ■ ■ ■ ■ ■ ■ 1.6 ▲ ▲ ▲▲21.90 7 0 5▲ 0.13 0.75
(20-015) West Fork East Branch Black River
Year: 92
75.0 ■ ■ ■ ■ ■ ■ ■ ■ ■ ■ 4.1 18.52 10 0 1▲ 0.09 0.18
(20-018) Willow Creek
Year: 92
72.5 ■ ■ ■ ■ ■ ■ ■ ● 2.9 ▲ ▲ ▲11.63 8 1 4▲ 0.22 0.67
(20-020) West Branch Black River
Year: 92
58.0 ■ ■ ■ ■ 41.7 ● ▲ ▲ ▲▲ 8.47 4 1 6▲ ▲ 0.40 1.60
84.0 ■ ■ ■ ■ ■ ■ ■ ■ ■ 33.3 ▲14.71 9 0 1 0.10 0.20
49.5 ■ ■ ■ ■ 25.3 ● ▲ ▲▲ ▲▲ 3.62 4 1 7▲ ▲ 0.40 1.80
64.0 ■ ■ ■ ■ ■ 19.6 ▲ ▲▲ ▲▲ 2.92 5 0 6▲ 0.17 1.17
51.5 ■ ■ ■ ■ ● 13.6 ▲ ▲ ▲▲ 1.93 4 1 5▲ 0.40 1.40
70.0 ■ ■ ■ ■ ■ ■ ■ ■ ■ 4.1 ▲ 3.52 9 0 1 0.10 0.20
06/13/9 2

KeyQHEIComponents
WWH Attributes
QHEI
MWH Attributes
High Influence Moderate Influence
Gradient(ft/mile)
RiverMile
Qualitiative Habitat Evaluation Index (QHEI) matrix showing modified and warmwater habitat characteristics forthe Black River study area, July-September, 1992.
Table 6.
(20-020) West Branch Black River
Year: 92
69.5 ■ ■ ■ ■ 1.2 ▲ ▲▲ ▲▲ 7.14 4 0 6▲ 0.20 1.40
(20-021) Plum Creek
Year: 92
70.0 ■ ■ ■ ■ ■ ■ ■ 7.0 ● ▲ ▲15.15 7 1 2 0.25 0.50
69.5 ■ ■ ■ ■ ■ ■ 3.3 ▲ ▲▲ 9.43 6 0 4▲ 0.14 0.71
57.0 ■ ■ ■ ■ ■ ■ 2.9 ● ▲ ▲ ▲10.42 6 1 5▲ ▲ 0.29 1.00
87.5 ■ ■ ■ ■ ■ ■ ■ ■ ■ 0.9 ▲17.24 9 0 1 0.10 0.20
(20-023) Wellington Creek
Year: 92
69.0 ■ ■ ■ ■ ■ ■ ■ 13.1 ▲ ▲ ▲ 7.35 7 0 4▲ 0.13 0.63
55.0 ■ ■ ■ ■ 10.8 ● ▲ ▲ ▲▲ 8.33 4 1 5▲ 0.40 1.40
(20-024) Charlemont Creek
Year: 92
70.5 ■ ■ ■ ■ ■ 2.8 ▲ ▲▲16.13 5 0 4▲ 0.17 0.83
74.5 ■ ■ ■ ■ ■ ■ ■ ■ 0.7 8.93 9 0 1▲ 0.10 0.20
73.0 ■ ■ ■ ■ ■ ■ ■ 0.5 ▲ ▲ ▲ 8.93 7 0 4▲ 0.13 0.63
(20-025) Buck Creek
Year: 92
67.5 ■ ■ ■ ■ ■ ■ ■ 1.0 ● ▲ ▲ ▲13.70 7 1 4▲ 0.25 0.75
06/13/9 3

DSW/1992-12-8 1992 Black River June 13, 1996
Macroinvertebrate Community (Table 7, Figures 19 &20)
Black River Mainstem• The macroinvertebrate community was evaluated at 14 sites on the Black River mainstem
from RM 14.4 to 0.1. Communities in the free flowing segment (RM 14.4-8.3) upstreamfrom the Lake Erie estuary were evaluated as good except for the site in the Elyria WWTPmixing zone (RM 10.6). Within the Elyria WWTP mixing zone, the community declined tothe fair range due primarily to an increase in oligochaetes, a pollution tolerant group, and adecrease in the diversity of mayflies, a pollution sensitive group. This community shift wasan indication of organic enrichment. Acute toxicity was not indicated by the results.
• Communities within the Lake Erie estuary demonstrated a gradual decline in ICI scores fromthe upstream sites which still had detectable current to farther downstream which was wider,deeper, and without detectable current. Macroinvertebrate communities within the Lake Erieaffected area are evaluated using an interim ICI estuary criterion of 22. The communitiessampled at RMs 5.6 and 5.3 retained a semblance of the riverine fauna present upstream.The declines in the ICI metric scores were best attributed to a gradual increase in lake effect(i.e., lessening of current, more monotonous habitat conditions). There were no noticeableimpacts from adjacent landfills or the USS/KOBE Steel 006 discharge.
• The macroinvertebrate community collected within the USS/KOBE 001 discharge mixingzone (RM 5.0) reflected the continued decline associated with the lake effect. The ICI at thissite scored at the interim ICI estuary criterion of 22. The community response was notindicative of acute toxicity from the 001 discharge. However, this is the first estuary sitewhere oil was observed in the natural substrates. Oil was evident at nearly all of theremaining downstream stations. The community located immediately downstream from the001 discharge was similar to that collected in the mixing zone.
• The remaining two sites upstream from the turning basin scored just below (ICI=20 at RM3.6) and at (ICI=22 at RM 3.0) the interim ICI estuary criterion. These are the last sites thathave remnants of the upstream riverine fauna. The communities were predominated by themidge genus Glyptotendipes and oligochaetes (aquatic segmented worms); both were welladapted to the near lentic conditions prevalent at these sites.
• The communities downstream from the turning basin scored well below the interim ICIestuary criterion (ICI=12 at RM 1.1 and 14 at RMs 2.0 and 0.1) and were evaluated as fair.All sites were predominated by oligochaetes. The station downstream from the LorainWWTP (RM 0.1) supported very high numbers of oligochaetes (i.e. 24,193/ft.2) which wasprobably due to increased organic enrichment from the WWTP effluent. The collectedcommunity did not indicate a problem with acute toxicity from this discharge.
• Zebra mussels (Dreissena polymorpha) were present in the Black River as far upstream asRM 5.6 where only a few individuals were collected. They were scarce in the upper part ofthe estuary until RM 3.0 where they became more common and remained common at allsampling stations downstream. They reach their highest numbers on artificial substrates(111/ft2) at RM 0.1.
French Creek• The community upstream from the French Creek WWTP (RM 2.8) was in the fair range
(ICI=22 at RM 3.2). Mayfly and caddisfly diversity and density were low with midges andoligochaetes predominant. The collected community was of considerable lesser quality than
50
DSW/1992-12-8 1992 Black River June 13, 1996
the one present in 1982. This decline may have been due to the construction of an upstreamfly ash disposal site operated by Cleveland Electric Illuminating. The communitydownstream from the North Ridgeville WWTP improved to the marginally good range(ICI=32 at RM 0.5). The WWTP discharge did not have an adverse impact on this site.
West Branch Black River• Macroinvertebrate communities were evaluated at five locations on the W. Br. Black River
from RMs 41.7 to 0.1. The communities gradually declined from exceptional at RM 41.7(ICI=54) to fair at RMs 4.2 and 0.1 (ICIs=22 and 28, respectively). The decline to the goodrange at RM 25.3 (ICI=38) may have been due to a combination of lower gradient, nonpointrunoff, and sedimentation. Further declines in the lower reaches of the West Branch weremost likely due to on-site sewer systems, nonpoint runoff and CSOs associated withincreased urbanization.
Buck Creek• The macroinvertebrate community in Buck Creek at RM 1.0 was evaluated using qualitative
methods. Mayfly and caddisfly diversity was relatively low (EPT=6) while the QCTV (35.6)was just below the lower 25th percentile of sites in the EOLP ecoregion that attain the WWHICI criterion (QCTV = 35.7). The site was evaluated as marginally good.
Charlemont Creek• Macroinvertebrate communities qualitatively collected upstream (RM 0.6) and downstream
(RM 0.4) from the Wellington WWTP tributary were evaluated as marginally good. Thecommunities at both sites may have been limited by nonpoint source runoff. Fieldobservations at the downstream site noted increases in attached algae, midges, andoligochaetes which may have been due to organic enrichment from the Wellington WWTP.However, there was no significant change in macroinvertebrate community performance fromthe upstream condition.
Wellington Creek• Two sites qualitatively collected on Wellington Creek had fair macroinvertebrate communities
with a low diversity of mayflies and caddisflies (EPTs = 4 at RM 13.1 and 3 at RM 10.8) andlow QCTVs (27.2 at RM 13.1 and 30.0 at RM 10.8). The community was assessed as fair atboth sites, but no additional impact was detected downstream from Wellington. Nonpointsource runoff was the probable cause of the impaired communities.
Plum Creek• Macroinvertebrate communities evaluated in Plum Creek ranged from fair upstream from
Oberlin (RM 7.0) to very good (ICI=44 at RM 0.8) 2.2 miles downstream from the OberlinWWTP discharge at RM 3.0. The upstream site was not very diverse with 27 taxa collectedby qualitative methods including only two taxa of mayflies and caddisflies. This site waslimited by periodic intermittent stream flow conditions and possibly nonpoint source runoff.The WWTP discharge did not have an additional adverse impact on the community. The ICIincreased to 36 (good) downstream from the discharge at RM 2.9 compared to 34 (good)immediately upstream at RM 3.1.
East Branch Black River• Macroinvertebrate communities were evaluated at nine locations on the E. Br. Black River
from RMs 41.5 to 0.1. The communities were very good or exceptional at all stations exceptthe two sites downstream from the Grafton WWTP (RM 11.2). The stonefly speciesAcroneuria evoluta was present at the farthest upstream site. These relatively large and long-lived predators are usually found only in high quality streams. The community 0.4 mile
51

DSW/1992-12-8 1992 Black River June 13, 1996
downstream from the Grafton WWTP was adversely impacted by the WWTP discharge. TheICI score declined to 30 (marginally good) which was significantly less than the score of 46(exceptional) at RM 11.3, immediately upstream from the WWTP. The changes in the ICIwere due to declines in the diversity of mayflies and caddisflies, a drop in the density ofcaddisflies, and an increase in pollution tolerant oligochaetes. Other evidence of an impact atthis site was burned gills on hydropsychid caddisflies. This problem has been associatedwith chlorine toxicity from WWTPs in New York (Simpson 1980). The communityrecovered to conditions similar to those observed upstream at RM 5.4 (ICI=48). Septic tankdischarges were observed entering the stream at RMs 6.0 and 3.0. The relatively highnumber of oligochaetes a pollution tolerant group, at RM 3.0 was probably due to organicenrichment from these on-site sewage systems.
East Fork East Branch Black River• The macroinvertebrate community was evaluated upstream from Lodi (RM 2.9) and
downstream from the Lodi WWTP (RM 1.7) at RM 1.5. The upstream station had anexceptional community (ICI=46) and consisted of a number of coolwater macroinvertebratetaxa including the caddisfly Diplectrona modesta and the midge taxa Parachaetocladius,Parametriocnemus , Polypedilum (P.) albicorne, Polypedilum (P.) aviceps, andParatanytarsus n. sp. 1. These coolwater taxa reflected the influence of substantialgroundwater recharge in this part of the stream. Also present at this site was the pollutionsensitive stonefly species Acroneuria evoluta. The community sampled 0.2 mile downstreamfrom the Lodi WWTP declined to the good range (ICI=40). Minor structural andcompositional changes were attributed to organic enrichment from the WWTP. The stoneflyAcroneuria evoluta was still present at this site; however, one specimen had burned gills apossible indication of chlorine contamination.
West Fork East Branch Black River• The macroinvertebrate community in the W. Fk. E. Br. Black River (RM 4.2) was evaluated
as very good. Seventeen EPT taxa were qualitatively collected at this site including thestonefly species Acroneuria evoluta.
Willow Creek• The macroinvertebrate community qualitatively collected in Willow Creek (RM 2.8) was
evaluated as marginally good. Forty taxa were collected including seven mayfly andcaddisfly species; none of the taxa collected are particularly pollution sensitive. Thecommunity sampled reflected an impact from nonpoint source pollution and possibly theRoss Environmental Services incinerator.
52

DSW/1992-12-8 1992 Black River June 13, 1996
Table 7. Summary of macroinvertebrate data collected from artificial substrates (quantitativesampling) and natural substrates (qualitative sampling) in the Black River study area,August 12 to October 6, 1992.
_____________________________________________________________________________
Quantitative EvaluationStream Density Quant. Qual. Qual.River Mile ( /ft2) Taxa Taxa EPTa QCTVb ICI Evaluation______________________________________________________________________________
Black River14.4 306 41 32 10 35.3 40 Good11.2 Qual. Only NA 32 9 37.5 NA Marg. Good10.6 (Mix Zone) 489 40 31 9 32.0 28 Fair10.5 471 40 41 10 35.8 40 Good8.3 568 51 31 11 37.7 40 Good
Black River Estuary5.6 617 46 18 2 30.3 34 Good5.3 854 48 17 3 30.1 28 Good5.0 (Mix Zone) 473 30 11 0 20.2 22 Good4.8 1067 42 18 1 31.9 24 Good3.6 2311 28 28 2 30.3 20ns Marg. Good3.0 1708 33 24 3 32.7 22 Good2.0 1061 21 11 0 23.0 14* Fair1.1 952 25 21 1 21.9 12* Fair0.1 5238 27 10 1 22.5 14* Fair
W. Br. Black River41.7 297 51 50 15 40.5 54 Exceptional25.3 447 40 41 9 37.4 38 Good13.5 Qual. Only NA 37 9 37.8 NA Marg. Good4.2 487 33 34 5 32.1 22* Fair0.1 384 43 22 7 34.0 28* Fair
Plum Creek7.0 Qual. Only NA 27 2 31.4 NA Fair3.1 401 42 28 4 31.4 34 Good2.9 288 39 23 3 30.3 36 Good0.8 255 33 33 8 34.6 44 V. Good
E. Fk. E. Br. Black River2.9 256 46 42 15 38.9 46 Exceptional1.5 526 46 44 10 36.3 40 Good
E. Br. Black River41.5 908 46 49 17 38.8 48 Exceptional32.3 584 55 42 10 37.4 42 V. Good
_____________________________________________________________________________
53

DSW/1992-12-8 1992 Black River June 13, 1996
Table 7. (cont.)_____________________________________________________________________________
Quantitative EvaluationStream Density Quant. Qual. Qual.River Mile ( /ft2) Taxa Taxa EPTa QCTVb ICI Evaluation______________________________________________________________________________
18.9 510 48 32 11 39.1 46 Exceptional111.3 941 47 47 14 38.9 46 Exceptional10.8 1688 41 56 13 37.7 30ns Marg.Good 6.0 1166 33 54 19 38.8 38 Good5.4 880 50 50 20 39.4 48 Exceptional3.0 1054 44 44 19 39.0 42 V. Good0.1 581 46 33 13 37.5 42 V. Good
French Creek3.2 426 43 32 1 30.0 22* Fair0.5 263 36 29 4 32.0 32ns Marg. Good
______________________________________________________________________________
Qualitative EvaluationStream No. Qual. Qual. Relative Predominant River Mile Taxa QCTVb EPTa Density Organisms Evaluationc
______________________________________________________________________________
Black River11.2 32 35.3 9 Low Hydropsychids, Marg. Good
Riffle beetles
W. Br. Black River13.5 37 37.8 9 Low Hydropsychids, Marg. Good
Mayflies,Midges
Buck Creek1.0 41 35.6 6 Low Hydropsychids, Marg. Good
Midges,Heptageniids
Charlemont Creek0.6 40 37.0 8 Moderate Hydropsychids, Marg. Good
Heptageniids0.4 30 35.6 8 Moderate Midges, Marg. Good
Heptageniids,Ferrissia
Wellington Creek13.1 42 27.2 4 Low Midges, Fair
Oligochaetes10.8 24 30.0 3 Low Hydropsychids, Fair
______________________________________________________________________________
54

DSW/1992-12-8 1992 Black River June 13, 1996
Table 7. (cont.)______________________________________________________________________________
Qualitative EvaluationStream No. Qual. Qual. Relative Predominant River Mile Taxa QCTVb EPTa Density Organisms Evaluationc
______________________________________________________________________________Oligochaetes,Heptageniids
Plum Creek7.0 27 31.4 2 Low Blackflies, Fair
Hydropsychids,Isopods
W. Fk. E. Br. Black River4.2 44 38.7 17 Moderate Hydropsychids, V. Good
Baetidae,Blackflies
Willow Creek2.8 40 37.4 7 Moderate Hydropsychids, Marg. Good
Midges,Heptageniids
______________________________________________________________________________
Ecoregion Biocriteria: Erie Ontario Lake Plain (EOLP)
INDEX WWH EWH Interim Lake Erie EstuaryICI 34 46 22
_____________________________________________________________________________________________
a EPT = total Ephemeroptera (mayflies), Plecoptera (stoneflies) and Tricoptera (caddisflies).b Qualitative Community Tolerance Value calculated as the median of the weighted ICI for each taxon.c A qualitative narrative evaluation is based on best professional judgement and is used when quantitative data is
not available to calculate the macroinvertebrate Community Index (ICI) scores.* Significant departure from ecoregion biocriteria (>4 ICI units); poor and very poor results are underlined.ns Nonsignificant departure from biocriterion (≤4 ICI units).
55

DSW/1992-12-8 1992 Black River June 13, 1996
0
10
20
30
40
50
ICI
60
16 14 12 10 8
1982
1992 1992 Mix Zone
Estuary Area
WWH Criterion (ICI=34)
6 4 2 0
Interim EstuaryCriterion(ICI=22)
Black River
USS/Kobe 001
Lorain WWTP
Elyria WWTP
10
20
30
40
50
60
ICI
East Branch Black River
WWH Criterion (ICI=34)
Grafton WWTP
19821992
0
10
20
30
40
50
60
ICI
45 40 35 30 25 20 15
River Mile
West Branch Black River
10 5 0
Charlemont Creek
Plum CreekWWH Criterion (ICI=34)
EWH Criterion (ICI=46)
19821992
Figure 19. Invertebrate Community Index (ICI) values for the Black Rivermainstem (upper), East Branch (middle), and West Branch(lower) study areas during 1992 and 1982.
56

DSW/1992-12-8 1992 Black River June 13, 1996
0
10
20
30
40
50
60
76 78
I C
I
80 82
Year
84 86 88 90 92
Exceptional
Good
Fair
Poor
Black RiverElyria, OH
94
Figure 20. Annual trend in the Invertebrate Community Index (ICI) at theBlack River National Ambient Water Quality MonitoringNetwork station at Elyria (RM 14.4).
Fish Community (Table 8, Figures 21, 22, & 23)
• The fish communities of the Black River have been impacted by a broad range ofenvironmental insults. Habitat modification, industrial waste, municipal waste, agriculturalrun-off, and failing septic systems were all documented in the system. Only the mostupstream sites (at the southern most edge of the basin), a short section of the East Branch andone site in the estuary area were found to be fully attaining the criteria set for WWH fishcommunities. Impacts to the community were extreme with several sites having indicesvalues that fell into the POOR range. However, none of the sites on the mainstem BlackRiver were degraded to the classification of POOR, a common condition found during the1982 survey.
• One of the more striking facts that illustrates the dramatic changes that have occurred in thisbasin is the loss of species. A historical review shows that eighteen previously recordedspecies of fish were not collected during this survey while only four new species wereobserved. In a normal survey of a minimally disturbed system the number of new speciesrecords usually far exceeds the number of previously known species not recorded. Speciescomposition has also been disrupted. In the West Branch the creek chub (Semotilesatromaculatus) was the most abundant species recorded followed by common shiner (Luxiluscornutus), white sucker (Catostomus commersoni), green sunfish (Lepomis cyanellus) and
57

DSW/1992-12-8 1992 Black River June 13, 1996
blacknose dace (Rhinichthys atratulus). For the most part, these species are associated withsmall headwater streams and are tolerant of most environmental disturbances common toOhio. An undisturbed community in this basin would have river chubs (Nocomismicropogon) and hornyhead chubs (Nocomis biguttatus) dominating instead of creek chubs,more hog suckers (Hypentelium nigricans) than white suckers, striped shiners (Luxiluschrysocephalus) instead of common shiners, darter species (Ethiostoma sp.) more abundantthan blacknose dace and longear sunfish (Lepomis megalotis) instead of green sunfish.Species composition in the East Branch was less disturbed with species such as smallmouthbass, rock bass, greenside darter and sand shiner showing the highest abundantces. In themainstem, communities were comprised of both the tolerant and less tolerant speciesmentioned above, an indication of the improved conditions in the area but also a sign thatmore improvement is needed before full restoration of the community will be achieved.
• During the 1992 survey of the Black River, four species of fish were recorded for the basinthat had not previously been recorded by Trautman (1981). The species were; smallmouthbuffalo (Ictiobus bubalus, a difficult to collect species which most likely was always presentin very low numbers), white perch (Morone americana, a recently established exotic species),black crappie (Pomoxis nigromaculatus, stocked in local ponds recently) and stickleback(Culaea inconstans, a highly localized coldwater species). This number of species recordadditions is low for a typical Ohio EPA survey and is an overall reflection of the level ofenvironmental degradation that has occurred in the basin. A total of eighteen species of fishthat had previously been recorded in the basin were not captured during the 1992 survey.The missing species can be broken into three groups related by their zoogeography and thetype of environmental impact that has resulted in their demise.
• The first group is species found in the Black River mainstem (the basin area downstream ofElyria) and are mostly associated with aquatic vegetation and/or clean substrates. They arelongnose gar (Lepisosteus osseus), bowfin (Amia calva), northern pike (Esox lucius),muskellunge (Esox masquinongy), tadpole madtom (Noturus gyrinus), silver chub(Macrhybopsis storeriana), mooneye (Hiodon tergisus), sand darter (Ammocrypta pellucida),and sauger (Stizostedion canadense). These fish were all victims of the historic excessivelyhigh levels of point source pollution discharged. The first five were also affected by the lossof submerged aquatic vegetation. The second group is comprised of species mostlyassociated with the mid-sections of the basin (primarily the East and West Branches upstreamof Elyria). They are hornyhead chub (Nocomis biguttatus), river chub (Nocomismicropogon), bigeye chub (Notropis amblops), rosyface shiner (Notropis rubellus), blackredhorse (Moxostoma duquesnei), stonecat, (Noturus flavus) and brindled madtom (Noturusmiurus). They were principally affected by excess turbidity and bedload sedimentsoriginating from agricultural activities. The third group consit of the southern redbelly dace(Phoxinus erythrogaster) and blacknose shiner (Notropis heterolepis). Both species arenormally found in small headwater streams with intact habitats and continuosly flowingwater. The 1992 survey did not sample the tributary streams that these species hadpreviously been recorded in and was therefore unlikely to record them. The present status oftheir populations is unknown, however both have shown declines on a statewide basis (OhioEPA 1992).
Black River mainstem• In general the fish community in this portion of the basin is on the verge of FULL attainment.
Most of the sites are at or near the ecoregional criteria. Two areas notably depart from thisstatus, the sites downstream of the Elyria WWTP discharge (RM 10.6 & 10.5) and the areaaround the USS/KOBE Steel 001 and 006 discharges, the mouth of French Creek and anextensive slag pile area (RMs 5.8, 5.2, 5.0, & 4.8). Because the system is already stressed
58
DSW/1992-12-8 1992 Black River June 13, 1996
by pollutants and excess nutrients the fish community is also stressed (a condition that existsthroughout most of the basin). Any additional pollutants added to the system will cause thefish community to further decline in quality. The four sites in the USS/KOBE - FrenchCreek slag pile area displayed some of the highest percentages of DELT anomalies recordedin the basin (7.0 - 10.6 percent). The two sites downstream of the Elyria WWTP (RMs 10.5and 8.8) exhibited a predominence of tolerant fishes (RM 10.5 also had high percentages ofomnivors), a characteristic response to enrichment from municipal sewage.
• Considerable potential for improvement exists for the mainstem fish community. Faunalcomponents that are presently suppressed include darter species, sucker species, roundbodied suckers, intolerant species and simple lithophils. Except for a few metrics at somesites (top carnivores - RMs 15.0 and 0.9, omnivores - Rms 0.9 & 0.2, insectivores - RMs15.0 and 0.9, and relative numbers - RM 0.9) all other metrics at all sites could showimprovement.
• Both the IBI and MIwb exceed the WWH biocriteria at RMs 15.0 and 0.9. The site at RM15.0 is above the principal discharges on the mainstem and is located in an area of highquality habitat. The site at RM 0.9 is upstream of the Lorain WWTP and far enoughdownstream from the USS/KOBE Steel area to have recovered. It should be noted that RM0.9 is the only site in the river proper that had submerged aquatic vegetation.
French Creek• Two sites were sampled in French Creek to evaluate the quality of the French Creek WWTP.
Downstream of the plant (RM 0.4) the fish community did not show an additional impactfrom the WWTP discharge and scored an IBI of 30 and a MIwb of 7.26. A strong impact tothe fish community was detected upstream of the plant (RM 3.2) at Abbe Rd where the IBIwas 18 and the MIwb was 5.5 both well below ecoregion criteria. The fish community atRM 3.2 displayed all the signs of a toxic impact. Fish were absent from the riffle areas andwere mostly found in the pools at the edge of the stream or in root-wad / root-mat areas.Further investigation will be needed to decern the specific cause of impact at this site.
West Branch• Only one site (Buck Creek RM 1.0, IBI = 42) in this portion of the basin exceeded the IBI
warmwater criteria of 40. The downstream site on Plum Creek (RM 0.9) and two sites onthe West Branch proper (RMs 41.7 & 33.3) had IBIs of 35 which is a nonsignificantdeparture from the WWH criteria; all other sites violated the IBI criteria for WWH.Attainment of WWH criteria for the MIwb was FULL at the most upstream site onCharlemont Creek (RM 2.8, MIwb = 7.8) and non-significant departure (MIwb = 7.6) at RM33.3 in the West Branch proper. All other sites in the West Branch basin did not attainWWH criteria.
• The overall status of the fish community in this portion of the basin is poor. The principalcause of impairment are silt, turbidity, bedload sediments and nutrient enrichment. Theprimary source is NPS pollution derived from agricultural activities (row crops and dairyoperations). Plum Creek is uniquely impaired by urban runoff such as sand and grit. Themost upstream site in Plum Creek (RM 7.0) is impaired by both urban and agriculturalactivities. The extreme severity of the NPS impact at the West Branch sites RM 19.6 and13.6 is among the strongest agricultural NPS impacts recorded by Ohio EPA.
Plum Creek• The Plum Creek subbasin is less than 20 sq mi. and therefore only IBI values are calculated
for the sites sampled in the basin. The four upstream sites (RMs 7.0, 3.3, 2.9, and 2.8)
59

DSW/1992-12-8 1992 Black River June 13, 1996
were all classified as poor with scores ranging between 20 and 24. At the most upstream sitefish communities are already impacted by a golf course and an open pasture horse farm. Thearea was silted and nutrient enriched as evidenced by abundant algal growths in sunlit areas.The three next downstream sites were all affected by bedload sediments that appeared to haveoriginated from urban runoff. The site at RM 2.9 was in the Oberlin WWTP mixing zone todetermine the extent of any toxicity. No toxicity was detected at this site. The communitydownstream of the WWTP (RM 2.8) was not significantly different from what was observedupstream. At RM 0.9 much of the bedload sediments observed upstream were reduced orabsent. In response to this environmental change the fish community was much improved.The fish community data from Plum Creek indicated that the Oberlin WWTP was not havinga detectable impact while NPS pollution from city streets, a golf course, and farmingactivities was having a suppressing effect on the community.
Charlemont Creek• Fish community results from three sites sampled in the subbasin suggest a basin wide impact
from NPS pollution associated with agricultural activities. Differances in communityattainments upstream (RM 0.7) and downstream (RM 0.5) of the Wellington WWTPtributary were indistinguishable. It is concluded from this data that the WWTP is not havingan effect on the community. Overall community performance at the most upstream site (RM2.8) was only slightly higher than the two downstream sites. Nonpoint source pollution wasthe most obvious cause of the decreased performance at this site. In the absence of the NPSimpact, an effect from the WWTP might have been more evident.
Wellington Creek• Only two sites were sampled in Wellington Creek. The upstream site (RM 13.1) was located
1.7 river miles downstream of the Findley Lake dam and the downstream site (RM 10.8) waslocated downstream of the village of Wellington . Although the community was impacted atthe upstream site, it was not as severe as at the site farther downstream (RM 10.8). Much ofthe stream bed at RM 10.8 was covered with sand and the stream banks were activelyeroding. It appeared that most of the sediments had been derived from agricultural runoff asopposed to urban runoff.
Buck Creek• The Buck Creek site (the most upstream site in the West Branch basin) at RM 1.0 attained the
WWH headwater IBI criteria. The fact that all of the headwater sites in the upper reaches ofthe East and West Branches had the highest IBI scores, illustrates the effect of basin wideNPS pollution. In the upper reaches of the system, bedload sediments and rowcrop runoffhave not yet accumulated to the level at which an impairment to the fish community occures.The NPS pollution load builds with distance downstream to the point that it adversely effectscommunity performance.
East Branch• Degraded conditions in the East Branch were generally not as extensive as in the West
Branch, although in a few areas they are just as severe. Nonpoint source problems existupstream of Grafton and downstream of Lodi with RMs 32.5 and 24.6 suppressed to thePOOR category of IBI performance. Conversely, the MIwb showed all sites either achievingor nonsignificantly departing from the WWH criteria. As discussed earlier, communitystructure was not as severely disrupted in this portion of the basin.
• Fish communities in the immediate area of Grafton achieved both IBI and MIwb WWHcriteria. Further downstream at RM 6.0 the fish community was impaired. The impairmentcontinued at the next downstream site (RM 5.2) which had a lower IBI while the MIwb
60

DSW/1992-12-8 1992 Black River June 13, 1996
achieved the WWH criteria. The phenomenon of low IBI performance with higher MIwbscores occurs frequently in areas of impact due to nutrient enrichment which disruptscommunity function but does not affect the overall abundance of individuals and number ofspecies. Full recovery occurred at RM 3.0 but the community declined again at RM 0.3. Thedecline at RM 0.3 was most likely in response to the large number of failing and improperlyinstalled septic systems between Grafton and the mouth of the river. This entire reach ofriver needs to be investigated to locate the problem systems and have them repaired.
Willow Creek• The fish community at the Willow Creek site (RM 2.9) was poor (IBI=18). The Ross
incinerator is located upstream of this site, and there may be an impact to the fish communityas a result of that facility. Also, heavy bedload sediments and large shallow water areasexisted at the site. The origin of the sediments appeared to be row crop runoff. It is uncertainif the principal cause of the impairment was the Ross incinerator or NPS pollution. Furtherdata is needed to make this distinction.
East Fork• The two sites on the East Fork had similar IBI values. One site was located upstream of the
Lodi WWTP (RM 2.7, IBI = 39) and one was located downstream of the WWTP (RM 1.6,IBI = 38). Both sites had some faunal components that are associated with high qualitystream conditions. No impact from Lodi or it’s WWTP were detected in the fish community.
West Fork• The site on the West Fork was located upstream of the Lodi WWTP area. The West Fork
forms the East Branch at its confluence with the East Fork. Conditions in this area weresimilar to those found in the East Fork with the IBI scoring 36 (classified marginally good asthe East Fork sites were). Though some NPS pollution exist in both streams, it was notsevere enough to cause the community to not attain the WWH criteria.
61

DSW/1992-12-8 1992 Black River June 13, 1996
Table 8. Fish community indices based on pulsed D.C. electrofishing samples at fourty-nine locationssampled by Ohio EPA in the Black River study area during July - October, 1992.
___________________________________________________________________________________________
Mean Mean Mean Mean Mean Modified Index of
Stream Number Cumulative Rel. No. Rel. Wt. Index of Biotic NarrativeRiver Mile of Species Species (No./Km) (Kg/Km) QHEI Well-Being Integrity Evaluation
___________________________________________________________________________________________
Black River Erie Ontario Lake Plain - WWH Use designation15.0b 23.5 28 887 35.0 86.0 9.05 40 Good11.9b 20.0 22 1182 27.8 87.5 8.65 31* Good-Fair10.6b 14.0 16 789 51.1 - - - (mz)10.5b 21.0 21 1318 17.7 87.0 6.8* 26* Fair10.5c 17.0 17 471 65.6 87.0 6.4* 24* Fair 8.8b 20.5 25 591 14.2 77.0 8.2 31* Good-Fair 5.8c 16.0 22 316 108.0 58.0 6.76* 25.3* Fair 5.5c 15.0 21 391 116.3 58.0 6.46* 30ns Fair 5.2c 17.7 26 274 68.3 49.0 7.06ns 25.3* Fair 4.8c 15.7 21 374 106.2 59.5 6.5* 28ns Fair 3.7c 15.7 21 515 66.9 42.0 7.06ns 28ns Fair 3.0c 13.7 20 540 49.2 57.0 7.26ns 32.6 Good 2.3c 18.0 27 752 196.5 55.0 7.0ns 32.6 Good 0.9c 16.8 27 1001 67.4 52.0 7.9 34.6 Good 0.1c 12.3 18 780 127.3 40.0 6.8* 28.6ns Fair
Black River Harbor 0.3c 15.5 25 782 220.9 59.5 7.26ns 32.6 Good 0.2c 11.0 18 335 75.8 54.5 6.56* 31.3ns Fair-Good
French Creek 3.2b 11.0 11 555 10.5 71.0 5.5* 18* Poor 0.4c 17.3 27 460 35.0 58 7.26 30ns Good
East Branch41.5b 21.0 24 863 8.3 54.5 7.9 33* Marg. Good36.8b 19.0 20 692 8.5 75.0 8.05 32* Good-Fair32.5b 20.0 22 490 17.8 60.0 8.1 26* Good-Fair24.6c 10.0 12 653 65.1 57.0 7.35ns 25* Fair-Poor18.9b 18.5 21 283 8.0 73.0 7.4ns 36ns Marg.Good11.3b 16.0 23 694 16.3 65.5 8.05 41 Good10.1b 17.0 17 717 8.1 90.0 8.15 41 Good 6.0b 17.5 21 2022 7,8 53.5 735 27* Pr.-M.G. 5.2c 18.3 22 871 161.1 84.0 8.7 31* Good-Fair 3.0b 16.0 18 523 36.2 63.5 8.25 37ns M.G.-Good 0.3c 11.7 13 456 51.8 57.0 6.5* 29* Fair
Willow Creek 2.9d 11.0 12 1415 N/A 72.5 N/A 18* Poor
East Fork East Branch 2.7d 10.0 11 1745 N/A 70.5 N/A 39ns M. Good 1.6d 17.5 20 1261 N/A 70.5 N/A 38ns M. Good
___________________________________________________________________________________________
62

DSW/1992-12-8 1992 Black River June 13, 1996
Table 8. (cont.)___________________________________________________________________________________________
Mean Mean Mean
Stream Number Cumulative Rel. No. Rel. Wt. Mean Mean NarrativeRiver Mile of Species Species (No./Km) (Kg/Km) QHEI MIwb IBI Evaluation
___________________________________________________________________________________________
West Fork East Branch 4.1b 13.0 15 2129 8.9 75.0 7.6ns 36ns M. Good
West Branch41.7d 12.5 14 878 N/A 58.0 N/A 35* Fair33.3b 18.0 19 700 9.6 84.0 7.6ns 35ns M. Good25.3b 16.0 19 270 11.3 49.5 5.3* 29* Fair-Poor19.6c 10.5 13 754 46.5 64.0 5.2* 17* Poor13.6c 13.0 14 225 41.5 51.5 5.5* 23* Poor 4.1b 15.0 16 422 9.5 70.0 6.75* 24* Fair-Poor 1.2b 15.5 19 447 20.7 69.5 6.7* 32* Fair
Plum Creek 7.0d 5.5 7 188 N/A 70.0 N/A 23* Poor 3.3d 7.5 9 713 N/A 69.5 N/A 21* Poor 2.9d 6.5 7 597 N/A 57.0 N/A 24* Poor 2.8d 6.0 7 511 - - - - (mz) 0.9d 16.0 18 846 N/A 87.5 N/A 35ns FairWellington Creek13.1d 12.5 15 933 N/A 69.0 N/A 29* Fair10.8d 12.5 15 895 N/A 55.0 N/A 19* Poor
Charlemont Creek 2.8b 17.0 17 498 6.7 70.5 7.8ns 32* F.-M.Good 0.7b 18.5 20 1036 15.6 74.5 6.6* 33* Fair
0.5b 17.0 19 1171 10.7 73.0 7.05* 32* Fair
Buck Creek 1.0d 14.0 17 580 N/A 67.5 N/A 42 Good
___________________________________________________________________________________________Ecoregion Biocriteria: Erie/Ontario Lake Plains (EOLP)
INDEX - Site Type WWH EWHIBI - Headwaters 40 50IBI - Wading 38 50 IBI - Boat 40 48 Mod. Iwb - Wading 7.9 9.4 Mod. Iwb - Boat 8.7 9.6
_______________________________________________________________________________________* - Significant departure from applicable biological criterion (>4 IBI units or >0.5 Iwb units); underlined values are in the poor
and very poor range.ns - Nonsignificant departure from biocriterion (<4 IBI units or < 0.5 MIwb units)a - Narrative evaluation is based on both MIwb and IBI scores.NA - Headwater site; MIwb is not applicable.(mz) - Mixing Zone sample.b - Wading methodology resultsc - Boat methodology resultsd - Headwater methodology results
63

DSW/1992-12-8 1992 Black River June 13, 1996
20
30
40
50
60
IBI WWH boat criteria
estuary
criteria
19921982
Estuary area
1977 LorainWWTP
French Creek
Elyria WWTP
USS/KOBE area
2
4
6
8
10
MIw
b
12
WWH boatcriteria
19921982
estuary
criteria
Estuary area
Elyria WWTP
French Creek
LorainWWTP
USS/KOBE area
0
20
40
60
80
100
QH
EI
16 14 12 10 8 6 4River Mile
2 0
Estuary area
Figure 21. Longitudinal trend of the Index of Biotic Integrity (IBI; upper),the Modified Index of Well-Being (MIwb; middle), and theQualitative Habitat Evaluation Index (QHEI; lower) in the BlackRiver study area.
64

DSW/1992-12-8 1992 Black River June 13, 1996
20
30
40
50
60
IBI
WWH boat criteriaWWH wading criteria
Lodi WWTP
WestFork
(East Fork)
199219821987
Boat site 19921977
Grafton WWTP
Brentwood Lakes WWTP trib.
2
4
6
8
10
MIw
b
12
MIwb 1992
MIwb 1982
Boat site 1992
Grafton WWTP
BrentwoodLakes WWTP
WWH boat criteria
WWH wading criteria
0
20
40
60
80
100
QH
EI
45 39 33 27 21 15River Mile
9 3
Mainstem and East ForkWest ForkWillow Creek
4
confluence of
East & West Forks
Figure 22. Longitudinal trend of the Index of Biotic Integrity (IBI; upper),the Modified Index of Well-Being (MIwb; middle) and theQualitative Habitat Evaluation Index (QHEI; lower) in the EastBranch of the Black River study area.
65

DSW/1992-12-8 1992 Black River June 13, 1996
20
30
40
50
60
IBI
Oberlin
WWTP
Wellington WWTP
1992
Boat site
Plum Creek
Wellington Creek
Charlemont Creek
Buck Creek
1982
1977
WWH boat criteria
WWH wading criteria
2
4
6
8
10
MIw
b
12
MIwb 1992
WWH wading criteria
Boat site Charlemont Creek
Charlemont CreekPlum Creek
WWH boat criteria
0
20
40
60
80
100
QHE
I
51 45 39 33 27 21 15River Mile
9 3
West BranchBuck Cr.Charlemont Cr.
Wellington Cr.Plum Cr.
Figure 23. Longitudinal trend of the Index of Biotic Integrity (IBI; upper), theModified Index of Well-Being (MIwb; middle), and the QualitativeHabitat Evaluation Index (QHEI; lower) in the West Branch of theBlack River study area, 1992.
66

DSW/1992-12-8 1992 Black River June 13, 1996
Other Wildlife• During the summer of 1992 terrestrial wildlife populations were investigated (as part of the
Black River Remedial Action Plan) by Mr. C. William Limpach, a private consultant. Thestudy was unable to document effects on mammal populations in the Area of Concern but didconclude that effects were present in the bird populations. Limpach concluded that Great BlueHeron populations were increasing while Yellow Warbler and Redwinged Blackbirdpopulations were “severely” impacted. No conclusion was drawn as to the cause of impact tothe two species.
Trend Assessment
Chemical Water Quality Trends
Ambient Sites• Ford Road: Water quality data have been collected by Ohio EPA at Ford Road (RM 9.8) since
1973. This site is located approximately one mile downstream from the Elyria WWTP. Heavymetals concentrations declined in the mid-1980s after initiation of the industrial pre-treatmentprogram. Water quality trends showed a dramatic improvement following the 1988 upgrade ofthe Elyria WWTP. Concentrations of ammonia-N, phosphorus, and TKN, have droppedsignificantly. Prior to1988 significant exceedences of water quality criteria were commonplaceSuspended solids and fecal coliform bacteria levels have held steady over the period (Figure24).
• Cascade Park: Water quality data have been collected by Ohio EPA at Cascade Park (RM 14.3)since 1975. Water quality trends show a steady decline in the concentrations of lead, zinc,copper, cadmium, ammonia-N, TKN, and phosphorus over the past 18 years. Concentrationsof total suspended solids, fecal coliform bacteria, and COD have held steady. This site isdownstream from the CSO/SSO area in Elyria (Figure 25).
Mainstem Surveys (1982 /1992): • The mainstem of the Black River has seen some of the most dramatic positive changes in water
quality of any river in northeast Ohio in recent years. These changes can be directly attributedto the upgrade of the Elyria WWTP which was completed in late 1988. During the intensivesurvey conducted in the summer of 1982, dissolved oxygen levels were below the 4.0 mg/lminimum standard for five miles downstream from the Elyria WWTP. The river showed somerecovery from RM 5.3 to RM 2.9 where the D.O. levels again showed a decrease due to theU.S. Steel 002 coke oven outfall (RM 3.4). Readings approached 5.0 mg/l in this segment.Dissolved oxygen levels recovered somewhat in the lower two miles of the river. During the1992 survey the D.O. concentrations were generally above 8.0 mg/l downstream as far as thenavigation channel. From that point on the D.O. declined to the 5.5-7.0 mg/l range, valuesthat are common in the navigation channel.
• Nutrients such as phosphorus and ammonia-N showed similar trends. In 1982 theconcentrations of these parameters were very high downstream from the Elyria WWTP .Ammonia-N concentrations exceeded water quality criteria in 80% of the samples.Phosphorus readings were consistantly above 2.5 mg/l. These high values continueddownstream to the estuarine portion of the river where the concentrations increased somewhatdue to the multiple discharges from USS/KOBE. Chemical results from the 1992 surveyshowed the levels of these nutrients were much lower. Mean ammonia-N concentrations wereat or near the detection limit (0.05mg/l) down to RM 3.7, adjacent to the USS/KOBE Steelcomplex, where the mean values increased to the 0.1-0.5 mg/l range. Concentrations
67

DSW/1992-12-8 1992 Black River June 13, 1996
increased to 0.47 mg/l at the mouth of the river, just downstream from the Lorain-East WWTPdischarge. Mean phosphorus concentrations ranged from 0.08-0.24 mg/l throughout themainstem (Figure 4).
• Heavy metals concentrations also showed dramatic improvements in the Black River mainstem(Figure 24). Copper concentrations approached 32 µg/l below the Elyria WWTP in 1982.Concentrations declined steadily to 10 µg/l at RM 1.05. In 1992 the mean concentration forcopper was at or just above the detection limit of 10 µg/l throughout the mainstem. In 1982,zinc values approached 50 µg/l from RM 9.8 to RM 2.9. Dischargers in this segment includedthe Elyria WWTP and the USS/KOBE Steel complex. In 1992, zinc readings were near thedetection limit of 10 µg/l from RM 14.3 to RM 8.4. Concentrations increased to 18 µg/l at RM5.3 and remained near that level throughout the balance of the mainstem.
French Creek• Water quality in the lower 3.2 miles of French Creek has remained essentially unchanged since
1982. Nitrate values were higher in 1992, but ammonia-N and phosphorus concentrationswere much lower. Heavy metal values were similar. Dissolved oxygen readings were muchhigher in 1992 than in 1982.
Plum Creek• Water quality in Plum Creek in 1992 was very similar to data collected during a survey in
1987. The only differences were increased dissolved oxygen levels and decreased ammonia-Nconcentrations at the site below the Oberlin WWTP. A major upgrade of the Oberlin WWTPwas completed in 1989.
68

DSW/1992-12-8 1992 Black River June 13, 1996
0
0.5
1
1.5
2
2.5
3
3.5
4Phosphorus (mg/l)
73 75 77 79 81 83 85 87 89 91
1 mg/l IJC effluent target
Year
0
5
10
15
20
25
Ammonia-N (mg/l)
73 75 77 79 81 83 85 87 89 91Year
Area of possibleWQC exceedences
Area of probable WQC exceedences
0
10
20
30
40
50
60Lead (ug/l)
73 75 77 79 81 83 85 87 89 91
Area of possibleWQC exceedences
Area of probableWQC exceedences
Year
0
50
100
150
200
250
300
350Zinc (ug/l)
73 75 77 79 81 83 85 87 89 91Year
Area of possibleWQC exceedences
Area ofprobableWQC exceedences
0
50
100
150
200
250
Copper (ug/l)
73 75 77 79 81 83 85 87 89 91Year
Area of possible WQC exceedences
Area of probable WQC exceedences
Figure 24. Monthly sampling results from fixed monitoring station at Ford Road(RM 9.8) for ambient concentrations phosphorus, ammonia-N, lead,zinc, and copper from 1973 through 1992.
69

DSW/1992-12-8 1992 Black River June 13, 1996
0
0.5
1
1.5
1 mg/l IJC effluent target
Phosphorus (mg/l)
73 75 77 79 81 83 85 87 89 91Year
0
1
2
3
4
5Ammonia-N (mg/l)
73 75 77 79 81 83 85 87 89 91
Area of possibleWQC exceedences
Area ofprobableWQC exceedences
Year
0
1
2
3
4
5TKN (mg/l)
73 75 77 79 81 83 85 87 89 91Year
Figure 25. Monthly sampling results from fixed monitoring stationat Cascade Park (RM 14.95) for ambientconcentrations phosphorus, ammonia-N, and TKNfrom 1973 through 1992.
70

DSW/1992-12-8 1992 Black River June 13, 1996
Sediment Chemistry Trends (1982 vs. 1992)
• Ohio EPA sampled five mainstem sites in 1982. An Ekman dredge was used to collect thesamples. Sites were located from RM 3.8 to RM 1.8 and at the mouth of French Creek.Twenty organic compounds, primarily PAHs and VOCs, and seven heavy metals wereincluded in the analysis. Two organic compounds were found above detection limits, tolueneat the mouth of French Creek and naphthalene downstream from the USS/KOBE 002 outfall,the former coke oven outfall . All other organic results were below detection limits. Most ofthe metals results were classified as highly elevated per the Kelly and Hite (1984) classificationsystem. Metals concentrations gradually increased from upstream to downstream.
• US EPA-Eastern District Office sampled 13 sites on the mainstem in 1992. A core samplerwas used to collect the samples. Their survey area covered RM 5.5 to RM 2.35 concentratingon the portion of the river that had been dredged by USS/KOBE Steel Company. Sampleswere collected using core samplers. Samples were analyzed for heavy metals, BNAs, VOCs,PCBs, and pesticides. Sample analysis was done at US EPA contract labs. Ohio EPAsampled three additional mainstem sites, four harbor/breakwall sites, three sites each on theWest and East Branches, and single sites on French Creek, Willow Creek, and the East Forkof the East Branch. Parameter coverage included heavy metals, BNAs, PCBs, and pesticidesat the harbor/breakwall and Black River mouth sites and heavy metals at the other sites. Metalsresults are presented in Appendix Table C-3. Organic results are presented in Appendix TableC-4.
• Unquantifiable amounts of naphthalene, benzo(a) anthracene, benzo(a)pyrene, toluene, ethylbenzene, and total xylenes were found throughout the US EPA study area.
• Improvements in analytical capabilities and sampling techniques are a part of the reason thatthese compounds were detected in 1992 and not in 1982. The 1982 samples were collectedusing an Ekman dredge which scooped samples from the upper two to three inches of thesubstrate while the 1992 US EPA samples were collected using coring devices which couldbore as deep as three feet. Thus these results must be interpreted with these cautions.
• There was little change in the metals results. Sites that were classified as heavily polluted in1982 generally remained so in 1992. There was no pattern as to where the more contaminatedsediments were found. High metals concentrations were found throughout the segment (RM5.5-2.35) The 1992 sample from the mouth of French Creek also showed highly elevatedlevels of cadmium, chromium, iron, lead, and zinc. In 1982, cadmium, iron, and zinc wereconsidered highly elevated.
Fish Tissue Trend Analysis
• The type of historical samples (whole-body and multi-species composites) and the loweranalytical detection levels now utilized call for care in making direct comparisons between the1992 data and the historical record. The lack of historical analytical data for metals alsoprecludes comparisons for those parameters.
• The number of PCB and pesticide compounds found in the 1992 fish tissue samples and theirconcentrations have decreased from those reported in earlier collections. Other prioritypollutant concentrations decreased from historical levels. No quantifiable PAHs or BNAswere identified in the 1992 samples.
71

DSW/1992-12-8 1992 Black River June 13, 1996
• The presence of several hydrocarbon compounds in the 1992 samples is likely due to the lowerdetection levels and analytical methods now utilized. These tentatively identified compounds(TICs) were probably not analyzed for previously and thus were not identified in historicalcollections.
Macroinvertebrate Community Trends (Table 9, Figures 19 &20)
Black River Mainstem• A long-term fixed station is located on the Black River at RM 14.7. Sampling at this site from
1977 to 1982 found primarily poor community performance. Starting in 1986 the communitygradually improved until 1991 when an exceptional community was present. The 1992sampling confirmed the improved community which was attributed to the elimination ofindustrial discharges due to plant closures, WWTP tie-ins, improved industrial pretreatmentand decreases in CSO discharges. The 1982 intensive survey documented a slightimprovement downstream from the fixed station into the fair range. This slight recovery wasinterrupted downstream from the Elyria WWTP discharge which drove the community backinto the poor range. The 1992 data in this area documented significant water resourceimprovement subsequent to upgrades at the Elyria WWTP. Macroinvertebrate communityperformance was in the good range.
French Creek• The macroinvertebrate communities in 1982 were evaluated as good upstream (ICI=40 at RM
3.2) and downstream (qualitative samples only at RM 0.5) from the French Creek WWTP(RM 2.8) with no detectable impact from the WWTP. The 1992 data likewise did notdocument an impact from the WWTP. However, the upstream community in 1992 wassignificantly degraded compared to results from 1982. Metals contamination from a recentlyconstructed fly ash landfill upstream from this site was the most likely cause of this decline.
West Branch Black River• The communities in the lower reach of the West Branch were evaluated in 1982 as marginally
fair (ICI=14) at RM 4.2 and poor (ICI=2) at RM 0.1. Communities in the same area in 1992demonstrated a modest improvement at RM 4.2 (ICI=22) and a substantial improvement at RM0.1 (ICI=28). The continued violation of the ICI biocriterion at the uppermost of these sitessuggested continued impairment from urban nonpoint sources of pollution (primarily failingon-site treatment systems). The improving trend at the downstream site was attributed to theelimination of industrial discharges due to plant closure, improved industrial pretreatment,WWTP tie-ins, decreases in CSO discharges due to upgrades at the Elyria WWTP, and theextension of a major interceptor sewer line.
Plum Creek• The 1987 community evaluation of Plum Creek assessed the upstream community at RM 7.0
as marginally fair due to intermittent flow and enrichment. The community declined frommarginally good (RM 3.2) upstream from the Oberlin WWTP (RM 3.0) to poor downstreamfrom the WWTP (RM 2.9) due to chlorination and organic enrichment from sewage sludge.The community recovered to the fair range at RM 0.8 but appeared to still be impacted from theWWTP. The 1992 data documented significant water resource improvement since recentupgrades at the Oberlin WWTP. The uppermost site was much the same and still appearedsimilarly impacted by periodic intermittent stream flows and possible nonpoint source pollutioninfluences.
72

DSW/1992-12-8 1992 Black River June 13, 1996
East Branch Black River• The communities in the lower reach of the East Branch were evaluated in 1982 as good at RM
3.1 and poor (ICI=6) at RM 0.2. The 1992 data documented significant water resourceimprovement at the lower site which was attributed to decreases in CSO discharges.
Fish Community Trends (Table 9, Figures 21, 22 & 23)
Black River Mainstem• Significant trends in improvement were observed in the mainstem portion of the Black River. A
total of sixteen sites were sampled in 1992. All sites were evaluated as fair to good and at ornear attainment of the WWH criteria for the IBI and MIwb. In the 1982 survey eleven siteswere sampled. Conditions were evaluated then as very poor to fair. None of the sites werewithin attainment of the WWH criteria. Changes in the ADV values for 1982/1992 were.IBI =1215/202 and MIwb = 1240/20 in the free flowing sections and IBI = 1021/17 and MIwb =1165/135 in the estuary portion. The total number of river miles attaining for all of themainstem 1982/1992 were FULL = 0/6.4, PARTIAL = 0/5.6, and NON = 13.2/1.4 A 1977survey, conducted by students of Dr. Andrew White, corroborated the results of the 1982survey. The three 1977 sites scored from fair to poor.
• The composition of the fauna realized improvements in six of the twelve metrics evaluated. Thetotal number of species, number of sunfish species, percentage of top carnivores, andpercentage of insectivores all increased while the percent tolerant species and percent omnivoresdecreased. In general, the metrics comprised of sucker species, intolerant species, round-bodied suckers, simple lithophiles, DELT anomalies, and the relative number of individuals didnot improve. Considerable potential improvement still exists for the Black River fishcommunity. Some of the improvements are likely to come with time as the system continues torecover from changes which have already been implemented.
French Creek• Fish communities in French Creek improved to full attainment of the IBI and MIwb criteria
downstream of the French Creek WWTP. Historically, all sites in French Creek violated thecriteria. The site immediately upstream of the WWTP remained in violation of the criteria. Thedata from this site indicate the presence of a toxic impact possibly from an upstream fly ashdisposal facility.
West Branch• The most downstream site in the West Branch showed improvement between 1982 and 1992.
The site at the upstream edge of Elyria remained similar to the 1982 survey results. Acomparison of 1992 and 1982 West Branch fish communities outside the immediate area ofElyria was not possible as biological samples were not taken in the upper reaches during 1982.Upstream of Elyria, when comparing the 1992 survey to the 1977 results of White (NOACAunpublished data), a declining trend in community condition was evident. All sites upstream ofElyria scored lower in 1992 than in 1977. Again, as in the East Branch, the cause of thedeclining communities appears to be silt and turbidity from agricultural practices which areprevalent throughout the West Branch subbasin. In general, all IBI metrics made somecontribution to the deterioration of the index scores.
Plum Creek• Improvement in the Plum Creek fish community was recorded at RM 0.9, the furthest most
downstream site where the IBI criteria were exceeded. All other sites in this stream basinviolated the criteria. The improvement at RM 0.9 was the consequence of Oberlin WWTPupgrades. The continued criteria violation were due to NPS runoff, agricultural upstream of
73

DSW/1992-12-8 1992 Black River June 13, 1996
Oberlin and urban within.
East Branch• Little change has occurred in the stream section within the Elyria municipal area since 1982.
The area sampled in 1992 scored the same general level of IBI and MIwb as in the 1982survey. A comparison of 1992 and 1982 East Branch fish communities outside the immediatearea of Elyria was not possible as biological samples were not taken in the upper reaches during1982. In comparing the 1992 survey with the 1977 survey (NOACA unpublished data) theEast Branch appears to be declining in quality especially in the segment upstream of Grafton.The level of turbidity and bedload sediments in this area indicates that the declining biologicalcommunities are the result of agricultural runoff. Community level changes occurred primarilyin the tolerant species and omnivore metrics which both increased in percentage they comprisedof the total fish community.
Area of Degradation Values (ADV)
• The Area of Degradation Value (ADV) is a numerical value calculated for each biological index(IBI, MIwb, ICI) which quantifies the area that each index falls below the applicable WQScriterion (see Methods section; page 16). Decreases in ADV scores are an indication ofimproving biological performance. The greater the ADV score the more impaired biologicalconditions are, while an ADV of zero is an indication that no degradation exists in terms ofbiocriteria. Within the Black River basin ADV scores are high (Table 9). The highest ADVscores (IBI = 3142, MIwb = 2970, ICI = 629) and the greatest number of stream miles notattaining the WWH use designation in 1992 (27.3 miles) were recorded from the West Branch.Most of the NON attainment in this portion of the basin was a consequence of nonpoint sourcepollution originating from agricultural activities. In contrast ADVs and miles not meetingcriteria were much less in the East Branch (IBI = 1497, MIwb = 305, ICI = 0 and 9.4 miles inNON attainment). An extensive comparison of the trends from 1982 to 1992 in the East andWest Branches is not possible because a greater area of the two streams was sampled in 1992.In the downstream sections of the streams that were sampled in both 1982 and 1992, ADVsremained approximately the same with some improvement displayed in the West Branch.
• In the mainstem of the Black River 1992 ADV scores were much lower and showedconsiderable improvement over the 1982 survey results (Table 9). Ecologically, the mainstemhas two distinct areas, a free-flowing upper portion and a Lake Erie affected (estuarine) lowerportion. In the free flowing portion ADVs were IBI = 202, MIwb = 20, and ICI = 0. Onlyone mile fell into the NON attainment category. In the Lake Erie affected area ADV scoreswere IBI = 17, MIwb = 135, and ICI = 111. It should be noted here that the biological criteriafor the estuary area of Lake Erie are interim and thus are only illustrative of general conditionand possible trends in the area studied. For the ICI there are no 1982 values for the estuary andthus no historical trend assessment is possible. For the IBI, MIwb, and ICI in the free flowingsection ADV values for 1982 were 1215, 1240, and 427 respectively. In comparison to the1992 results, a considerable change was evident. For the estuarine area the 1982 ADVs wereIBI = 1021 and MIwb = 1165. Again, a considerable change (in a positive direction) wasevident. In terms of miles attaining/not attaining WWH criteria, in 1982 all 13.2 miles of themainstem (both free flowing and lake affected) were classified as in NON attainment. In 19926.4 miles was in FULL attainment, 5.6 miles in PARTIAL attainment, and 1.4 miles in NONattainment (out of a total of the 13.4 miles sampled).
• In French Creek an improvement in fish communities was observed while macroinvertebratesdeclined. The 1982/1992 ADV results were IBI = 346/286, MIwb = 480/145, and ICI = 0/91.Overall use attainment in this stream was improved. FULL attainment occured in 0.5 miles of
74

DSW/1992-12-8 1992 Black River June 13, 1996
stream, PARTIAL attainment in 0.5 miles of stream and NON attainment in 2.3 miles. In1982 these numbers were 0.0 FULL, 0.0 PARTIAL, and 3.3 NON.
• The only other stream in the survey area that had sufficient data to allow the calculation ofADVs was Plum Creek. The MIwb was not applicable to this stream as the drainage area isless than twenty square miles. All historical Plum Creek biological data are from 1987. TheICI showed no degradation while the IBI had an ADV of 824. Miles of attainment were 0.1FULL, 1.0 PARTIAL, and 6.2 NON. Problems in Plum Creek were the result of habitatimpacts from bedload sediments derived from urban and agricultural nonpoint runoff. Artificialsubstrates, used to sample macroinvertebate populations, are not normally affected by bedloadsediments and thus can demonstrate attainment of the ICI in areas where water column impactsare low or non-existent while, fish communities are more reliant on substrate quality and thussensitive to bedload sediments.
Table 9. Area of Degradation (ADV) statistics for the Black River study area, 1992 (calculated usingecoregion criteria as the background community performance).
____________________________________________________________________________________
_Biological Index Scores___ ____ADV Statistics_____ _____Attainment Status (miles)_____Stream Upper Lower Mini- Maxi- ADV/ Poor/VP Index RM RM mum mum ADV Mile ADV FULL PARTIAL NON Poor/VP____________________________________________________________________________________
Black River (WWH designation)1992IBI 15.0 8.3 26 40 202 30.1 3 2.8 3.5 1.0 1.0MIwb 6.8 9.0 20 3.0 0ICI 40 40 0 0 01982IBI 15.6 6.6 18 20 1215 202.5 434 0 0 9.1 9.1MIwb 3.9 5.0 1240 206.7 108ICI 2 18 1501 166.8 283
Black River (Interim Estuary WWH designation)1992IBI 5.8 0.1 25 35 17 3.0 0 3.6 2.1 0.4 0.4MIwb 7.5 10.1 135 20.5 0ICI 12 34 111 19.5 01982IBI 5.8 0 12 27 1021 176.0 494 0 0 6.1 5.8MIwb 1.0 6.6 1165 200.9 129ICI N/A N/A N/A N/A N/A
French Creek (WWH designation)1992IBI 3.2 0.4 18 30 286 102.1 99 0.5 0.5 2.3 2.3MIwb 5.5 7.3 145 58.9 0ICI 22 32 91 32.5 01982IBI 3.2 0.1 19 32 346 11.6 119 0 0 3.3 2.9MIwb 3.1 5.4 480 51.8 47ICI 40 40 0 0 0
____________________________________________________________________________________
75

DSW/1992-12-8 1992 Black River June 13, 1996
Table 9. (cont.)____________________________________________________________________________________
_Biological Index Scores___ ____ADV Statistics_____ _____Attainment Status (miles)_____Stream Upper Lower Mini- Maxi- ADV/ Poor/VP Index RM RM mum mum ADV Mile ADV FULL PARTIAL NON Poor/VP____________________________________________________________________________________
East Branch (WWH designation)1992
IBI 41.5 0.1 25 42 1497 36.2 121 12.9 19.8 9.4 9.4MIwb 6.5 8.7 305 7.4 0ICI 30 48 0 0 01982IBI 1.7 0.2 28 31 159 106.0 0 0 0 2.3 0.8MIwb 7.0 7.7 80 53.3 0ICI 6 6 192 128.0 0West Branch (WWH designation)1992IBI 41.7 0.1 17 35 3142 75.5 396 7.8 7.2 27.3 21.7MIwb 5.2 7.6 2970 71.4 146ICI 22 54 629 15.1 01982IBI 2.8 0.1 18 24 450 166.7 120 0 0 3.4 3.4MIwb 4.7 5.9 435 161.1 32ICI 2 14 1004 244.9 176
Plum Creek (WWH designation)1992IBI 7.0 0.8 20 35 824 132.9 260 0.1 1.0 6.2 5.7MIwb N/A N/A N/A N/A N/AICI 34 44 0 0 0
Plum Creek (WWH designation)1987IBI 7.0 0.9 20 22 904 143.5 337 0.0 0.0 6.3 6.3MIwb N/A N/A N/A N/A N/AICI N/A N/A N/A N/A N/A
__________________________________________________________________________________
76
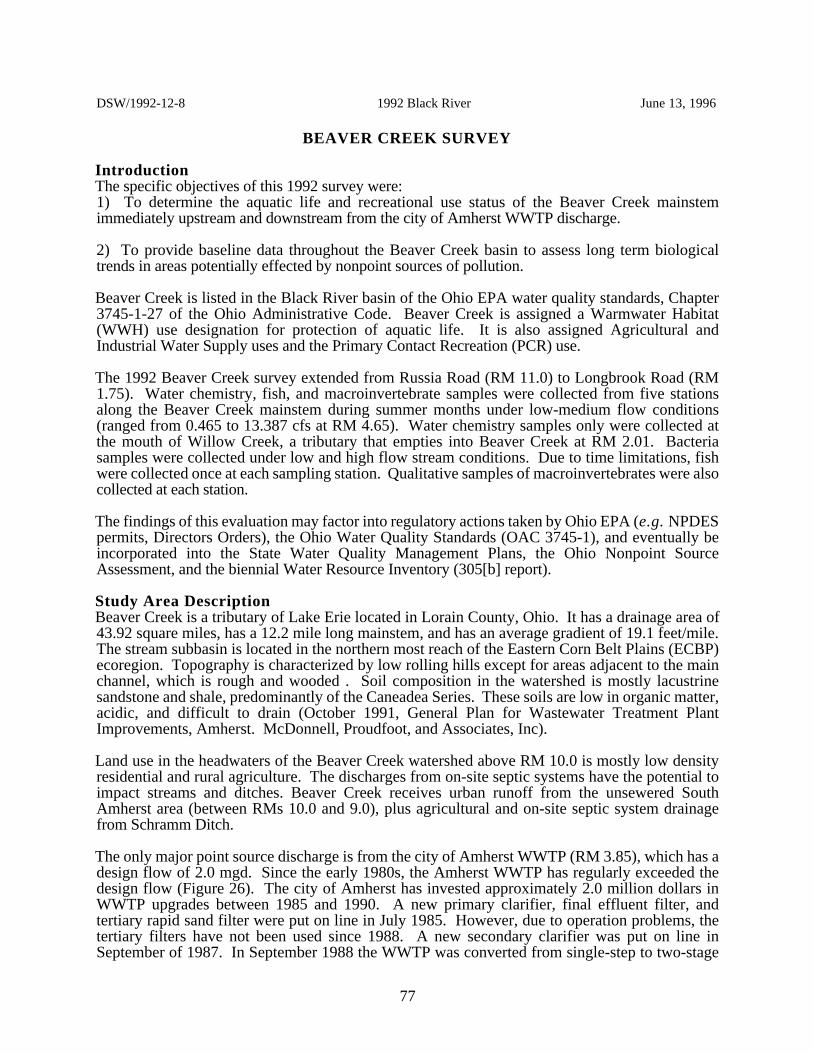
DSW/1992-12-8 1992 Black River June 13, 1996
BEAVER CREEK SURVEY
Introduction The specific objectives of this 1992 survey were:1) To determine the aquatic life and recreational use status of the Beaver Creek mainstemimmediately upstream and downstream from the city of Amherst WWTP discharge.
2) To provide baseline data throughout the Beaver Creek basin to assess long term biologicaltrends in areas potentially effected by nonpoint sources of pollution.
Beaver Creek is listed in the Black River basin of the Ohio EPA water quality standards, Chapter3745-1-27 of the Ohio Administrative Code. Beaver Creek is assigned a Warmwater Habitat(WWH) use designation for protection of aquatic life. It is also assigned Agricultural andIndustrial Water Supply uses and the Primary Contact Recreation (PCR) use.
The 1992 Beaver Creek survey extended from Russia Road (RM 11.0) to Longbrook Road (RM1.75). Water chemistry, fish, and macroinvertebrate samples were collected from five stationsalong the Beaver Creek mainstem during summer months under low-medium flow conditions(ranged from 0.465 to 13.387 cfs at RM 4.65). Water chemistry samples only were collected atthe mouth of Willow Creek, a tributary that empties into Beaver Creek at RM 2.01. Bacteriasamples were collected under low and high flow stream conditions. Due to time limitations, fishwere collected once at each sampling station. Qualitative samples of macroinvertebrates were alsocollected at each station.
The findings of this evaluation may factor into regulatory actions taken by Ohio EPA (e.g. NPDESpermits, Directors Orders), the Ohio Water Quality Standards (OAC 3745-1), and eventually beincorporated into the State Water Quality Management Plans, the Ohio Nonpoint SourceAssessment, and the biennial Water Resource Inventory (305[b] report).
Study Area DescriptionBeaver Creek is a tributary of Lake Erie located in Lorain County, Ohio. It has a drainage area of43.92 square miles, has a 12.2 mile long mainstem, and has an average gradient of 19.1 feet/mile.The stream subbasin is located in the northern most reach of the Eastern Corn Belt Plains (ECBP)ecoregion. Topography is characterized by low rolling hills except for areas adjacent to the mainchannel, which is rough and wooded . Soil composition in the watershed is mostly lacustrinesandstone and shale, predominantly of the Caneadea Series. These soils are low in organic matter,acidic, and difficult to drain (October 1991, General Plan for Wastewater Treatment PlantImprovements, Amherst. McDonnell, Proudfoot, and Associates, Inc).
Land use in the headwaters of the Beaver Creek watershed above RM 10.0 is mostly low densityresidential and rural agriculture. The discharges from on-site septic systems have the potential toimpact streams and ditches. Beaver Creek receives urban runoff from the unsewered SouthAmherst area (between RMs 10.0 and 9.0), plus agricultural and on-site septic system drainagefrom Schramm Ditch.
The only major point source discharge is from the city of Amherst WWTP (RM 3.85), which has adesign flow of 2.0 mgd. Since the early 1980s, the Amherst WWTP has regularly exceeded thedesign flow (Figure 26). The city of Amherst has invested approximately 2.0 million dollars inWWTP upgrades between 1985 and 1990. A new primary clarifier, final effluent filter, andtertiary rapid sand filter were put on line in July 1985. However, due to operation problems, thetertiary filters have not been used since 1988. A new secondary clarifier was put on line inSeptember of 1987. In September 1988 the WWTP was converted from single-step to two-stage
77

DSW/1992-12-8 1992 Black River June 13, 1996
trickling filters for ammonia removal; a new chlorine contact tank was also installed. The tricklingfilter media was replaced in October, 1990.
Since 1988, occasional NPDES permit violations for TSS, BOD, and ammonia-N have beenreported. No CSOs exist in the Amherst WWTP sewerage system, however, by-passes at threepump stations are possible. The city of Amherst and the State of Ohio reached a consent decree inMay of 1991 over final NPDES discharge limits. Additional improvements to the treatment ofwastewater are included in the 1991 agreement.
The estimated summer Q30-10 flow (May-Nov) of Beaver Creek just above the Amherst WWTP is0.18 cfs. The Amherst WWTP design flow is 3.09 cfs, thus, under low stream flow conditions,the Amherst WWTP represents about 94% of the total flow in Beaver Creek. The discharge fromthree small WWTPs enters Beaver Creek between RM's 7.0 and 5.0 (Pinecrest STP (0.033 mgd;RM 6.9); Westwood MHP (0.08 mgd; RM 5.72,1.1); and Ohio Turnpike Plaza #5 (0.150 mgd;RM 5.25;1.3)). This stream segment also receives urban runoff from the city of Amherst.
Willow Creek empties into Beaver Creek at RM 2.01. This tributary receives urban runoff fromthe city of Amherst, discharge from the Amherst MHP WWTP (0.046 mgd; RM 2.15), dischargefrom numerous small commercial WWTPs, and agricultural runoff.
Historical water chemistry data for Beaver Creek is limited to the monthly self monitoring data thathas been collected by the city of Amherst. A biological site survey of Beaver Creek was conductedby the Ohio EPA, Northeast District Office on October 5, 1977. Fish and macroinvertebrates werecollected at two stations, one immediately above the WWTP (about RM 4.0) and a second atLongbrook Road at RM 1.75. Fish were collected using a seine, macroinvertebrates werecollected using a Surber Sampler. The results of the 1977 survey suggested that the AmherstWWTP, perhaps in combination with other sources, was having an adverse effect on both fish andmacroinvertebrates.
Summary and Conclusions
Water ChemistryAnalysis of water chemistry data collected along the mainstem of Beaver Creek in 1992 showedrelatively good water quality with only a few inconsequential violations of the total iron 1.0 mg/lstandard throughout the basin (5 of 18 total samples). Samples were collected under low tomedium flow conditions. Flow values at RM 4.65 on the sample dates were: July 6 (0.465 cfs);July 27(13.387cfs); September 15 (3.03 cfs). A dissolved oxygen value of 3.25 mg/l wasrecorded at the most upstream station (RM 11.0) at a time when the stream flow was intermittant.This number is below the daily minimum WQS dissolved oxygen criteria of 4.0 mg/l.
There was a significant increase in the concentrations of COD and nitrate-N immediately below theAmherst WWTP (Figures 27). No water quality standards exist for these parameters. Ammonia-N also increased below the WWTP, but the concentrations were well below toxic levels. Resultsof continuous dissolved oxygen measurements collected immediately above and below the AmherstWWTP showed a decrease of about 1 mg/l from an average of 8.5 mg/l to 7.5 mg/l (Figure 28).No values were below 6.0 mg/l at the two stations below the WWTP at RM stations 2.9 and 1.75.
Results of fecal coliform sampling showed violations throughout the basin under high stream flowconditions on September 21, 1992. Under lower flow conditions on October 7, 1992 the highestlevel of fecal coliform (29,000/100 ml) was found at RM 4.65, above the Amherst WWTPdischarge. On the same day, very low fecal coliform counts were found at RM 7.0, above the
78

DSW/1992-12-8 1992 Black River June 13, 1996
Middleridge Road bridge, thus the source(s) of contamination on October 7th was limited to thesection of Beaver Creek between RMs 7.0 and 4.65. Potential sources in the area include on-sitehome/commercial septic tank systems, the Westwood MHP WWTP, and the Ohio Turnpike Plaza#5 WWTP. Monthly fecal coliform data collected by the city of Amherst in 1991 and 1992 alsoshows consistently higher levels of fecal coliform in Beaver Creek above the WWTP than below(Figure 28).
Biological Communities and Stream HabitatAnalysis of biological data at the most upstream station along Beaver Creek (RM 11.0) indicated apoor fish community (IBI = 24; Table 10, Figure 29) associated with a marginally goodmacroinvertebrate community. This station is potentially impacted by agricultural runoff andscattered on-site septic system discharges. Only five species of fish were collected at RM 11.0,with low relative numbers (120). Grass Pickerel was the most common species collected. Thisspecies is associated with low gradient streams that have extensive macrophyte growth.
Although the stream reach had good overall habiat quality (QHEI = 61.0), it was observed to becompletely dry during the smmer of 1992. This intermittant flow condition could exert asignificant negative affect on the fish community, even though the overall habitat quality asmeasured by the QHEI was sufficient to support a WWH fish community. Low dissolved oxygen(3.25 mg/l) was also measured at RM 11.0, most likely due to low gradient and decay of algae andother aquatic plants.
A total of 40 qualitative macroinvertebrate taxa were collected at RM 11.0 including 8 EPT taxa.Predominant taxa were the mayfly genus Stenonema, the pulmonate snail genus Physella, andvarious hemiptera taxa. Seven different mayfly taxa were collected. This is the only station wherestoneflies (genus Perlesta) were collected. The overall narrative rating for macroinvertebrates wasmarginally good. However, based on the poor performance of the fish community, RM 11.0 wasin NON attainment of the WWH use designation. Results of biological sampling at the next downstream station at RM 7.0, which is below the SouthAmherst unsewered area, continued to show a marginally good community of macroinvertebrates.A total of 36 qualitative taxa were collected. Predominant taxa were the mayfly genera Stenomemaand Isonychia and the water penny beetle species (Psephenus herrick). The overall narrativerating for macroinvertebrates was the same as RM 11.0, marginally good. Thus it did not appearthat the South Amherst unsewered area was having a significant impact on the benthicmacroinvertebrate community.
The fish community at RM 7.0 improved (IBI score of 32), however this value is still below theECBP ecoregion potential of 40 IBI points. A total of nine species of fish were collected. RM7.0 station had the highest relative proportion of sensitive fish (29.5%), which would suggest thattoxic pollutants are not a problem at this site. Continuuous flow was observed at RM 7.0throughout the survey. The QHEI at this station was 71.5, which indicated that some factor otherthan overall habitat quality is responsible for the lack of attainment of fish at this station. Non-point source pollution and urban runoff from the South Amherst area is a likely cause of nonattainment for fish at the RM 7.0. Based on a fair fish community and a marginally goodmacroinvertebrate community, the overall use attainment rating was (PARTIAL) at RM 7.0.
The next two sample stations (RM 4.65 and 2.95) were located above and below the city ofAmherst WWTP discharge, which empties into Beaver Creek at RM 3.85. Results from RM4.65 and 2.95 indicated that the city of Amherst WWTP was having a significant negative impacton the fish and macroinvertebrate communities of Beaver Creek. The number and types of speciessensitive to pollutants was sharply reduced at RM 2.95, immediately downstream from the
79

DSW/1992-12-8 1992 Black River June 13, 1996
Amherst WWTP discharge. The total number of qualitative macroinvertebrate taxa declined from36 to 18 (Figure 29). Caddisflies, a group of macroinvertebrates that show sensitivity to chlorine,were completely eliminated at the RM 2.95 station. The number of pollution sensitive EPT taxawas reduced from 9 to 2. Predominant macroinvertebrate taxa at RM 4.65, above the AmherstWWTP discharge, were the mayfly genera Stenonema and Caenis the crayfish species Orconectessanbornii sanbornii. Predominant taxa below the Amherst WWTP at RM 2.95 were flatworms,aquatic segmented worms, and various tolerant midge taxa. Crayfish numbers were greatlyreduced at the RM 2.95 station. The overall macroinvertebrate evaluation was marginally goodabove the WWTP and poor below the WWTP. The near absence of sensitive species indicated atoxic effect on the macroinvertebrate community.
The fish community above the WWTP at the RM 4.65 station was in the fair range, (IBI = 34),however, the fish community immediately below the WWTP showed poor performance (IBI =24). The percent of sensitive fish species was reduced from 13% to 0.2% (reduction in rainbowdarters and smallmouth bass). Although the fish community below the Amherst WWTP showed asignificant reduction in the IBI, the relative number of fish doubled at the downstream station (623to 1301/0.3 m), an indication of organic enrichment. The overall aquatic life attainment of BeaverCreek dropped from PARTIAL attainment at RM 4.65 to NON attainment at RM 2.95. Given theclose proximity of the Amherst WWTP to the RM 2.95 station, and the lack of any othersignificant sources of pollutants, the discharge from the Amherst WWTP is the most likely causeof the biological degradation observed at RM 2.95.
Partial biological recovery was observed at the most downstream station (RM 1.75). The numberof macroinvertebrate EPT taxa increased to 5 and the total number of qualitative macroinvertebratetaxa increased to 22, however, the overall macroinvertebrate community remained poor. The fishcommunity remained in the poor range with no recovery of the darter and smallmouth basspopulations found above the Amherst WWTP. An IBI of 26 and MIwb 6.7 indicated NONattainment of the WWH aquatic life use at RM 1.75.
In addition to the Amherst WWTP discharge, the station at RM 1.75 also receives urban runofffrom the city of Amherst, and is below the confluence of Willow Creek, the largest tributary ofBeaver Creek. The Amherst MHP WWTP and numerous unpermitted semi-public commercialentities discharge to Willow Creek.
Results of effluent bioassay tests conducted in 1992 for the Amherst WWTP using fatheadminnows (Pimephales promelas) and Ceriodaphnia dubia showed conflicting results. No toxicitywas observed in March 1992, however an August 1992 sample showed 100% mortality of C.dubia in one grab sample and 25% of the P. promelas showed loss of equilibrium in a 24-hourcomposite effluent sample. The source of the August 1992 toxicity is unknown; all metals andammonia-N were well below acutely toxic concentrations, and all samples were dechlorinatedprior to testing. Although twelve tentatively identified non-priority semivolatile organic chemicalswere found in the August 1992 effluent sample, their potential toxic effect is unknown. Becauseno adverse effect was observed in the mixing zone sample, it is unlikely that the results of theAugust 1992 bioassay tests help explain the significant adverse effects on biological communitiesobserved in Beaver Creek downstream from the WWTP discharge.
Analysis of Beaver Creek water chemistry data submitted by the city of Amherst suggests that onepotential source of instream toxicity is from residual chlorine, which has been detected in BeaverCreek at concentrations 100 times above the chronic water quality criteria (WWH 30 day averagechlorine WQS = 18 µg/l). The current NPDES effluent limit for residual chlorine at AmherstWWTP is 500 µg/l, and monthly data indicate that the WWTP maintains residual chlorineconcentrations in the 400-500 µg/l range. Under critical low flow conditions, the Amherst WWTP
80

DSW/1992-12-8 1992 Black River June 13, 1996
represents about 94% of the total flow in Beaver Creek below RM 3.85, thus the potential existsfor significant chlorine toxicity to aquatic life in Beaver Creek below the Amherst WWTPdischarge. The biological impact observed at RM 2.95 during this 1992 survey may well be due,at least in part, to high levels of instream residual chlorine.
In summary, the present day impact of the Amherst WWTP on the biological communities ofBeaver Creek appears to be a mixture of the toxic effect of chlorine and organic enrichment (mostlikely nitrogenous compounds and oxygen demanding wastes).
Status of Aquatic Life UsesBeaver Creek shows NON attainment (Table 10) of the WWH aquatic life use at the mostheadwater station (RM 11.0), due to a combination of intermittent flow, low dissolved oxygen,low gradient, and runoff from non-point source pollutant. This NON attainment status most likelyextends upstream for 1.2 river miles to the headwaters at RM 12.2.
The aquatic life status from RM 11.0 to RM 7.0 is UNKNOWN (4 river miles), however, BeaverCreek shows PARTIAL attainment of aquatic life from RM 7.0 to where to city of AmherstWWTP discharges at RM 3.85 (a total of 3.15 river miles).
Below the city of Amherst WWTP, there is a significant decline in biological diversity. Both fishand macroinvertebrate communities were judged to be in the poor range and the stream showedNON attainment of aquatic life potential. The impact continues to RM 1.75, which is 2.10 rivermiles below the Amherst WWTP. The aquatic life status from RM 1.75 to the mouth of BeaverCreek is unknown.
In summary, of the total 12.2 river miles in Beaver Creek, the aquatic life attainment status isUNKNOWN for 5.75 miles, PARTIAL for 3.15 miles, and NON attainment for 3.3 miles.
Recommendations
The results of the 1992 biological survey indicate a potential toxic effect on the fish andmacroinvertebrates downstream from the city of Amherst WWTP discharge, most likely due toexcessive residual chlorine at levels well above water quality criteria. It is recommended that thecity of Amherst WWTP add de-chlorination to eliminate the discharge of residual chlorine duringsummer months, or that some alternative method of disinfection be found.
The results of the 1992 bacteria survey indicate elevated fecal coliform bacteria under low flowbetween RM 7.0 and 4.65. The source(s) of these bacteria should be identified.
Future Monitoring Needs
Beaver Creek should be monitored in 1997 at the stations upstream and downstream from theAmherst WWTP to determine potential recovery of biological communities. Additional bacteriasampling under low stream flow conditions should be conducted to identify sources. Morestations upstream from RM 7.0 need to be evaluated to determine the appropriate recreational use.
81

DSW/1992-12-8 1992 Black River June 13, 1996
0
100
200
300
400
500
50 th percentile
95 th percentile
AMHERST WWTP
TS
S (k
g/d)
0
100
200
300
400
50 th percentile
95 th percentile
AMHERST WWTP
BO
D5 (k
g/d)
Changed to CBOD in 1990
0
1
2
3
4
81 82 83 84 85 86 87 88 89 90 91 92
50 th percentile
95 th percentile
AMHERST WWTP
Flo
w (m
gd)
WWTP Design Flow
Year
Figure 26. Average annual flow and loadings for TSS and BOD5for the Amherst WWTP 1981-1992.
82

DSW/1992-12-8 1992 Black River June 13, 1996
20
25
30
35
40
45
50
55
CO
D (m
g/l)
Amherst WWTP
75 th percentile reference sites
0
0.2
0.4
0.6
0.8
To
tal-P
(m
g/l)
75 thpercentile reference sites
Amherst WWTP
3
4
5
6
7
8
9
DO
(mg/l)
Amherst WWTP
minimum
minimum 24 hour average
0
0.05
0.1
0.15
0.2
NH
3-N (m
g/l)
Lab Detection Limit
Amherst WWTP
75 th Percentile Reference Sites
0
2
4
6
8
10
12
12 10 8 6 4 2 0
NO
3-N +
NO
2-N (m
g/l)
River Mile
Amherst WWTP
95 th percentile reference sites
200
300
400
500
600
12 10 8 6 4 2 0
TD
S (m
g/l)
75 th percentile reference sites
River Mile
Amherst WWTP
Figure 27. Concentrations of selected chemicals from grab water samples for the Beaver Creekmainstem by river mile during the 1992 survey.
83
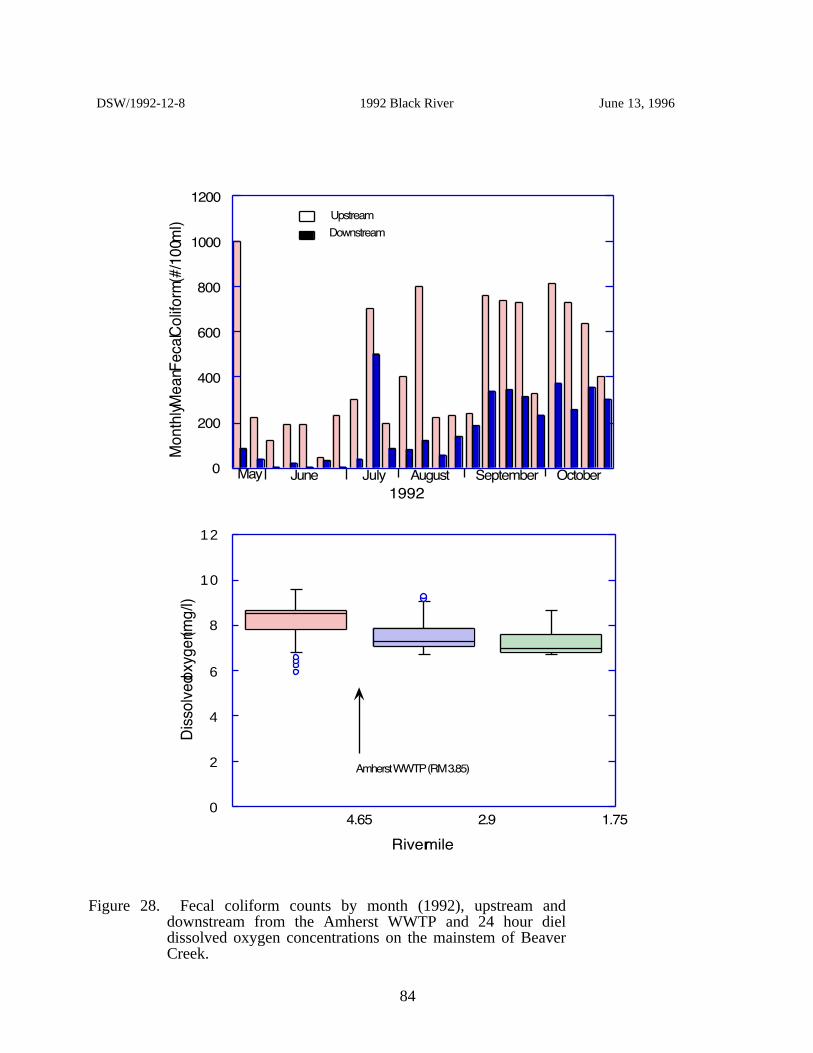
DSW/1992-12-8 1992 Black River June 13, 1996
0
200
400
600
800
1000
1200
Month
ly M
ean Feca
l Colif
orm
(#/1
00 m
l)
May June July August September October
1992
Upstream
Downstream
0
2
4
6
8
10
12
4.65 2.9 1.75
Dis
solv
ed oxy
gen (m
g/l)
River mile
Amherst WWTP (RM 3.85)
Figure 28. Fecal coliform counts by month (1992), upstream anddownstream from the Amherst WWTP and 24 hour dieldissolved oxygen concentrations on the mainstem of BeaverCreek.
84

DSW/1992-12-8 1992 Black River June 13, 1996
0
2
4
6
8
10
15
20
25
30
35
40
45
EPT Taxa
Qualitative Taxa
Num
ber o
f EP
T Taxa
Num
ber of Qu
alita
tive Ta
xa
Amherst WWTP
10
20
30
40
50
60
IBI
WWH criterion
Amherst WWTP
0
2
4
6
8
10
12
024681012
MIw
b
River Mile
WWH criterion
Amherst WWTP
Figure 29. Macroinvertebrate community EPT taxa and qualitative taxa(upper figure) and fish community IBI and MIwb results forBeaver Creek mainstem during 1992.
85

DSW/1992-12-8 1992 Black River June 13, 1996
Table 10. Aquatic life use attainment status for the Exceptional/Modified/Warmwater Habitat(WWH) use designation in Beaver Creek based on data collected during June -September 1992.
______________________________________________________________________________
River Mile Mod. Attainment Attainment(Fish/Ivt) IBI Iwb ICIa QHEIb Status Comments______________________________________________________________________________
Beaver Creek (1992)
11.0/11.0 24* n/a MG 61.0 NON Habitat effects7.0/7.0 32* n/a MG 71.5 PARTIAL Dst. S. Amherst4.65/4.65 34* 7.6* MG 70.5 PARTIAL Ust. Amherst WWTP2.95/2.95 24* 6.2* P 68.5 NON Dst. Amherst WWTP1.75/1.75 26* 6.7 P 70.0 NON Dst. Willow Creek
______________________________________________________________________________
Ecoregion Biocriteria: E. Corn Belt Plains (ECBP).INDEX - Site Type WWH EWH MWHd
IBI - HW/Wading 40 50 24Mod. Iwb - Wading 8.3 9.4 5.8
______________________________________________________________________________
* - significant departure from interim biocriteria; poor and very poor results are underlined.ns - nonsignificant departure from interim biocriteria for WWH or EWH (4 IBI or ICI units; 0.5 Iwb units).na - MIwb does not apply to sites <20 sq.mi. drainage area.a - Narrative evaluation used in lieu of ICI (E=Exceptional; G=good; MG=Marginally good; F=Fair; P=Poor;
VP=Very Poor).b - Qualitative Habitat Evaluation Index (QHEI) values based on the new version (Rankin 1989).c - Attainment status based on one organism group is parenthetically expressed.
86

DSW/1992-12-8 1992 Black River June 13, 1996
Table 11. Sampling locations (water chemistry-C, benthos-B, fish-F) in the Beaver Creek studyarea, 1992.
______________________________________________________________________________
Stream/ Type ofRiver Mile Sampling Latitude/Longitude Landmark Quad Map______________________________________________________________________________
Beaver Creek
11.0 C,B,F 41°20'18"/82°14'40" Russia Rd Oberlin7.0 C,B,F 41°22'50"/82°14'25" MiddleRidge Rd Lorain4.65 C,B,F 41°24'08"/82°14'00" West Martin St Lorain3.85 E 41°24'33"/82°13'54" WWTP Amherst Lorain2.70 C,B,F 41°25'00"/82°13'32" Cooper Foster Lorain1.75 C,B,F 41°25'34"/82°13'59" Longbrook Rd Lorain
Willow Creek
7.0 C 41°25'32"/82°13'40" Kolbe Rd Lorain_____________________________________________________________________________
Table 12. Exceedences of Ohio EPA Warmwater Habitat criteria (OAC 3745-1) for chemical /physical parameters measured in the Beaver Creek study area, 1992.
______________________________________________________________________________
Stream Name River Mile Violation: Parameter (value)______________________________________________________________________________
Beaver Creek 11.00 Dissolved Oxygen (3.25)4.65 Fecal coliform (29000, 13600)2.90 Fecal coliform (72600, 3250)1.75 Fecal coliform (41800)
Iron (5 of 18 samples (28%) exceeded 1.0 mg/l throughout the study area.
______________________________________________________________________________
87

DSW/1992-12-8 1992 Black River June 13, 1996
Table 13. Stream characteristics and significant identified pollution sources in the Beaver Creekbasin study area.
______________________________________________________________________________
Stream: Beaver CreekLength: 12.2 miles
Average Fall: 19.1 foot/mile
Drainage area: 43.93 square miles
Non Point Pollution Sources:Agricultural, Urban runoff,unsewered urban, septic systems
Point Sources:Major NPDES: Amherst WWTPMinor NPDES: Westwood MHP WWTP
Ohio Turnpike Plaza 5 WWTPPinecrest Apt WWTP
______________________________________________________________________________
88

DSW/1992-12-8 1992 Black River June 13, 1996
References
Fausch, D.O., Karr, J.R. and P.R. Yant. 1984. Regional application of an index of bioticintegrity based on stream fish communities. Trans. Amer. Fish. Soc. 113:39-55.
Gammon, J.R. 1976. The fish populations of the middle 340 km of the Wabash River. Tech.Report No. 86. Purdue University. Water Resources Research Center, WestLafayette, Indiana. 73 pp.
Gammon, J.R., A. Spacie, J.L. Hamelink, and R.L. Kaesler. 1981. Role of electrofishing inassessing environmental quality of the Wabash River. pp. 307-324. In: Ecologicalassessments of effluent impacts on communities of indigenous aquatic organisms.ASTM STP 703, J.M. Bates and C.I. Weber (eds.). Philadelphia, PA.
Hughes, R. M., D. P. Larsen, and J. M. Omernik. 1986. Regional reference sites: a method forassessing stream pollution. Env. Mgmt. 10(5): 629-635.
Karr, J.R. 1981. Assessment of biotic integrity using fish communities. Fisheries 6 (6): 21-27.
Karr, J.R. and D.R. Dudley. 1981. Ecological perspective on water quality goals. Env. Mgmt.5(1): 55-68.
Kelly, M. H., R. L. Hite. 1984. Evaluation of Illinois stream sediment data: 1974-1980. IllinoisEnvironmental Protection Agency, Division of Water Pollution Control. Springfield,Illinois.
Limpach, C. W., 1993. Black River ripaian wildlife census summer-fall, 1992 Lorain County,Ohio. 61 pp. unpublished manuscript.
Ohio Department of Natural Resources. 1960. Gazetteer of Ohio streams. Ohio Dept. NaturalResources, Division of Water, Ohio Water Plan Inventory Report No. 12.
Ohio Environmental Protection Agency. 1987b. Biological criteria for the protection of aquaticlife: Volume II. Users manual for biological field assessment of Ohio surface waters.Division of Water Quality Monitoring and Assessment, Surface Water Section,Columbus, Ohio.
Ohio Environmental Protection Agency. 1989a. Addendum to biological criteria for the protectionof aquatic life: Users manual for biological field assessment of Ohio surface waters.Division of Water Quality Planning and Assessment, Surface Water Section,Columbus, Ohio.
Ohio Environmental Protection Agency. 1989b. Biological criteria for the protection of aquaticlife: Volume III. Standardized biological field sampling and laboratory methods forassessing fish and macroinvertebrate communities. Division of Water Quality Planningand Assessment, Columbus, Ohio.
Ohio Environmental Protection Agency. 1989c. Ohio EPA policy for implementing chemicalspecific water quality based effluent limits and whole effluent toxicity controls inNPDES permits. Divisions of Water Pollution Control and Water Quality Planning andAssessment, Columbus, Ohio.
89

DSW/1992-12-8 1992 Black River June 13, 1996
Ohio Environmental Protection Agency. 1990. A preliminary assessment of Ohio’s Lake Erie fishcommunities. Division of Water Quality Planning and Assessment, Columbus, Ohio.
Ohio Environmental Protection Agency. 1992. Ohio water resource inventory. Volume I:Summary, Status, & Trends. Division of Water Quality Planning and Assessment,Columbus, Ohio.
Omernik, J. M. 1988. Ecoregions of the conterminous United States. Ann. Assoc. Amer.Geogr. 77(1): 118-125.
Rankin, E.T. 1989. The qualitative habitat evaluation index (QHEI): rationale, methods, andapplication. Division of Water Quality Planning and Assessment, Columbus, Ohio.
Rankin, E.T. and C.O. Yoder. 1991. Calculation and uses of the area of degradation value(ADV). Division of Water Quality Planning and Assessment, Columbus, Ohio.
Simpson, K.W. 1980. Abnormalities in the tracheal gills of aquatic insects collected from streamsreceiving chlorinated or crude oil waste. Freshwater Biology 10: 581-583.
Trautman, Milton B. 1981. The Fishes of Ohio. Ohio State University Press, Columbus, Ohio.782 pp.
90

DSW/1992-12-8 1992 Black River June 13, 1996
Appendix tables:
Table C-1a. Values for the 1992 Black River study area by site and date for temperature (0C), pH (S.U.), dissolved oxygen (ppm),conductivity (umhos/cm), arsenic (µg/l), cadmium (µg/l), calcium (mg/l), and chromium (µg/l).
____________________________________________________________________________________________________
River river mile Date temp. pH DO Cond. As Cd Ca Cr____________________________________________________________________________________________________
Black River RM 0.01 92/07/08 23.0 8.01 6.8 403 < 2 <2.0 40 <30Black River RM 0.01 92/08/06 21.5 7.70 6.9 350 < 2 0.3 38 <30Black River RM 0.01 92/08/12 23.7 8.00 6.6 422 < 2 0.2 38 <30Black River RM 0.01 92/09/09 21.5 7.50 5.7 403 < 2 <0.2 41 <30Black River RM 0.01 92/09/17 21.5 7.60 6.4 401 < 2 <0.2 39 <30Black River RM 0.01 92/10/01 17.5 7.40 6.3 250 2 <0.2 42 <30Black River RM 1.05 92/07/08 23.0 7.85 4.5 480 < 2 <0.2 48 <30Black River RM 1.05 92/08/06 21.0 7.80 7.0 470 < 2 <0.2 47 <30Black River RM 1.05 92/08/12 24.5 7.90 6.6 515 2 <0.2 52 <30Black River RM 1.05 92/09/09 22.0 7.30 4.1 518 < 2 0.2 48 <30Black River RM 1.05 92/09/17 21.0 7.50 4.6 490 2 0.2 46 <30Black River RM 1.05 92/10/01 18.0 7.60 6.1 300 < 2 <0.2 47 <30Black River RM 1.84 92/07/08 23.0 7.68 3.9 543 < 2 0.2 50 <30Black River RM 1.84 92/08/06 21.5 7.90 7.1 466 < 2 <0.2 52 <30Black River RM 1.84 92/08/12 24.8 7.80 5.5 575 3 <0.2 57 <30Black River RM 1.84 92/09/09 22.3 7.40 4.6 536 4 0.3 49 <30Black River RM 1.84 92/09/17 21.0 7.50 4.7 523 2 0.2 49 <30Black River RM 1.84 92/10/01 17.9 7.70 6.2 337 3 <0.2 49 <30Black River RM 2.9 92/07/08 24.5 7.83 5.4 650 < 2 <0.2 54 <30Black River RM 2.9 92/08/06 22.0 7.80 7.4 440 < 2 <0.2 52 <30Black River RM 2.9 92/08/12 25.8 8.00 7.6 610 3 <0.2 60 <30Black River RM 2.9 92/09/09 23.3 7.50 5.7 530 2 <0.2 50 <30Black River RM 2.9 92/09/17 22.5 7.50 5.7 572 < 2 0.3 52 <30Black River RM 2.9 92/10/01 17.1 7.75 6.9 400 2 <0.2 51 <30Black River RM 3.7 92/07/08 25.0 8.31 8.7 900 < 2 <0.2 68 <30Black River RM 3.7 92/08/06 19.8 7.80 8.4 447 3 <0.2 61 <30Black River RM 3.7 92/08/12 9.5 7.80 24.5 790 3 0.3 67 <30Black River RM 3.7 92/09/09 21.2 7.50 6.7 585 < 2 <0.2 51 <30Black River RM 3.7 92/09/17 21.0 7.70 7.0 575 < 2 <0.2 57 <30Black River RM 3.7 92/10/01 17.0 8.15 7.5 455 2 <0.2 51 <30Black River RM 4.2 92/07/08 23.5 8.55 12.7 1000 < 2 0.3 70 <30Black River RM 4.2 92/08/06 20.5 7.80 8.3 570 2 <0.2 64 <30Black River RM 4.2 92/08/12 23.7 7.80 7.8 685 2 <0.2 70 <30Black River RM 4.2 92/09/09 21.0 7.50 6.9 590 < 2 <0.2 59 <30Black River RM 4.2 92/09/17 21.5 7.80 7.8 575 < 2 0.2 58 <30Black River RM 4.2 92/10/01 13.5 8.05 9.7 430 2 0.2 61 <30Black River RM 5.3 92/07/08 22.0 8.80 14.4 1100 2 0.5 66 <30Black River RM 5.3 92/08/06 18.0 7.80 8.7 480 2 0.2 56 <30Black River RM 5.3 92/08/12 23.0 8.20 8.0 635 2 <0.2 67 <30Black River RM 5.3 92/09/09 20.0 7.70 7.4 590 < 2 0.2 52 <30Black River RM 5.3 92/09/17 21.5 7.80 7.8 575 < 2 <0.2 57 <30Black River RM 5.3 92/10/01 13.0 8.10 9.5 450 2 0.2 61 <30Black River RM 8.35 92/07/08 21.2 8.10 9.8 1024 < 2 0.5 67 <30Black River RM 8.35 92/08/06 19.0 7.90 8.5 451 2 <0.2 54 <30Black River RM 8.35 92/08/12 21.8 8.30 8.4 643 < 2 <0.2 68 <30Black River RM 8.35 92/09/09 19.5 8.00 8.3 520 0.2 50 <30Black River RM 8.35 92/09/17 19.0 8.20 8.4 525 < 2 <0.2 55 <30Black River RM 8.35 92/10/01 10.0 8.30 9.9 460 2 0.3 59 <30____________________________________________________________________________________________________
91

DSW/1992-12-8 1992 Black River June 13, 1996
Table C-1a. (cont.)____________________________________________________________________________________________________
River river mile Date temp. pH DO Cond. As Cd Ca Cr____________________________________________________________________________________________________Black River RM 9.8 92/07/08 21.5 8.10 9.0 1150 < 2 0.5 66 <30Black River RM 9.8 92/08/06 19.0 7.70 8.1 446 2 <0.2 54 <30Black River RM 9.8 92/08/12 22.0 8.25 8.2 702 < 2 <0.2 70 <30Black River RM 9.8 92/09/09 19.7 7.90 8.3 550 0.3 52 <30Black River RM 9.8 92/09/17 19.0 8.10 7.8 700 < 2 <0.2 56 <30Black River RM 9.8 92/10/01 11.0 8.20 9.4 600 < 2 0.3 61 <30Black River RM 11.5 92/07/08 22.0 8.45 10.6 563 < 2 0.4 70 <30Black River RM 11.5 92/08/06 18.8 7.50 8.5 400 < 2 <0.2 52 <30Black River RM 11.5 92/08/12 22.0 8.37 8.2 515 < 2 <0.2 69 <30Black River RM 11.5 92/09/09 19.6 7.80 8.3 270 0.3 48 <30Black River RM 11.5 92/09/17 18.0 8.30 8.2 390 < 2 <0.2 54 <30Black River RM 11.5 92/10/01 10.0 8.30 10.0 360 3 0.2 61 <30Black River RM 14.95 92/07/08 22.0 8.70 10.3 598 < 2 0.2 76 <30Black River RM 14.95 92/08/06 18.5 7.00 8.8 381 < 2 <0.2 52 <30Black River RM 14.95 92/08/12 22.5 8.32 7.9 545 < 2 <0.2 71 <30Black River RM 14.95 92/09/09 19.8 8.00 7.8 390 <0.2 48 <30Black River RM 14.95 92/09/17 19.0 8.30 8.1 400 3 <0.2 55 <30Black River RM 14.95 92/10/01 11.0 8.30 9.5 360 2 0.3 62 <30Buck Creek RM 0.95 92/07/08 17.0 8.00 4.6 1110 2 <0.2 82 <30Buck Creek RM 0.95 92/08/12 17.0 8.30 5.7 510 2 <0.2 89 <30Buck Creek RM 0.95 92/09/09 16.0 8.00 5.4 520 < 2 <0.2 90 <30Buck Creek RM 0.95 92/09/30 8.0 7.80 6.4 440 < 2 1.1 85 <30Charlemont Creek RM 0.5 92/07/08 17.0 7.70 4.0 860 3 0.2 98 <30Charlemont Creek RM 0.5 92/08/12 18.0 8.00 6.4 660 < 2 <0.2 94 <30Charlemont Creek RM 0.5 92/09/09 17.0 8.10 7.1 590 < 2 <0.2 83 <30Charlemont Creek RM 0.5 92/09/30 8.0 7.90 8.5 505 < 2 <0.2 83 <30Charlemont Creek RM 0.6 92/07/08 18.0 8.00 5.4 740 2 <0.2 72 <30Charlemont Creek RM 0.6 92/08/12 18.0 8.10 5.2 660 < 2 <0.2 97 <30Charlemont Creek RM 0.6 92/09/09 17.0 8.10 7.6 505 < 2 <0.2 82 <30Charlemont Creek RM 0.6 92/09/30 8.0 8.00 8.6 300 < 2 <0.2 83 <30E. FK. E. BR. RM 1.6 92/07/08 21.8 8.00 9.0 1550 2 0.3 90 <30E. FK. E. BR. RM 1.6 92/08/12 19.0 7.80 8.0 918 < 2 <0.2 87 <30E. FK. E. BR. RM 1.6 92/09/09 20.0 8.00 8.6 1140 < 2 0.6 92 <30E. FK. E. BR. RM 1.6 92/09/30 10.0 8.00 8.7 750 2 0.7 89 <30E. FK. E. BR. RM 2.67 92/07/08 22.5 8.40 5.7 908 < 2 <0.2 92 <30E. FK. E. BR. RM 2.67 92/08/12 18.0 8.00 9.4 520 < 2 <0.2 74 <30E. FK. E. BR. RM 2.67 92/09/09 19.2 8.50 12.3 800 < 2 <0.2 85 <30E. FK. E. BR. RM 2.67 92/09/30 8.0 8.20 10.0 395 < 2 <0.2 78 <30E.Br.Black R. RM 0.36 92/07/08 22.5 8.50 6.4 690 < 2 0.2 76 <30E.Br.Black R. RM 0.36 92/08/12 23.0 8.36 7.2 545 < 2 0.3 71 <30E.Br.Black R. RM 0.36 92/09/09 20.5 7.80 7.0 364 < 2 0.5 45 <30E.Br.Black R. RM 0.36 92/10/01 11.0 8.30 9.1 380 2 0.6 63 <30E.Br.Black R.. RM 3.07 92/07/08 20.7 7.90 6.6 460 < 2 <0.2 54 <30E.Br.Black R.. RM 3.07 92/08/12 21.0 8.08 7.7 574 < 2 <0.2 79 <30E.Br.Black R.. RM 3.07 92/09/09 19.5 8.00 7.8 400 2 <0.2 46 <30E.Br.Black R.. RM 3.07 92/10/01 10.0 8.30 9.6 380 < 2 <0.2 68 <30E.Br.Black R.. RM 5.2 92/07/08 21.1 7.30 6.8 458 2 <0.2 49 <30E.Br.Black R.. RM 5.2 92/08/12 23.5 8.20 9.8 612 < 2 <0.2 79 <30E.Br.Black R.. RM 5.2 92/09/09 19.1 8.00 6.9 390 < 2 <0.2 51 <30E.Br.Black R.. RM 5.2 92/09/30 12.0 8.10 9.6 480 2 <0.2 66 <30____________________________________________________________________________________________________
92

DSW/1992-12-8 1992 Black River June 13, 1996
Table C-1a. (cont.)____________________________________________________________________________________________________
River river mile Date temp. pH DO Cond. As Cd Ca Cr____________________________________________________________________________________________________E.Br.Black R.. RM 6.0 92/07/08 21.2 7.40 6.9 424 < 2 <0.2 46 <30E.Br.Black R.. RM 6.0 92/08/12 23.3 8.10 8.5 612 < 2 <0.2 82 <30E.Br.Black R.. RM 6.0 92/09/09 20.0 8.00 6.8 380 2 <0.2 49 <30E.Br.Black R.. RM 6.0 92/09/30 12.5 8.10 9.5 495 2 <0.2 66 <30E.Br.Black R.. RM 10.5 92/07/08 21.8 7.70 9.2 398 < 2 <0.2 47 <30E.Br.Black R.. RM 10.5 92/08/12 24.7 8.40 10.1 600 2 <0.2 73 <30E.Br.Black R.. RM 10.5 92/09/09 19.5 8.20 8.5 445 < 2 <0.2 57 <30E.Br.Black R.. RM 10.5 92/09/30 12.0 8.10 10.0 500 < 2 <0.2 72 <30E.Br.Black R.. RM 11.3 92/07/08 21.8 7.50 7.5 397 4 <0.2 50 <30E.Br.Black R.. RM 11.3 92/08/12 22.7 8.20 8.9 570 < 2 <0.2 72 <30E.Br.Black R.. RM 11.3 92/09/09 19.0 8.10 7.7 410 < 2 <0.2 55 <30E.Br.Black R.. RM 11.3 92/09/30 12.0 8.10 9.8 480 3 <0.2 73 <30E.Br.Black R.. RM 18.94 92/07/08 20.8 7.50 5.9 602 3 <0.2 70 <30E.Br.Black R.. RM 18.94 92/08/12 21.9 7.90 6.6 570 < 2 <0.2 79 <30E.Br.Black R.. RM 18.94 92/09/09 19.1 8.00 6.3 575 < 2 <0.2 73 <30E.Br.Black R.. RM 18.94 92/09/30 11.0 7.90 8.5 480 2 <0.2 74 <30E.Br.Black R.. RM 32.42 92/07/08 21.1 7.70 5.4 806 < 2 <0.2 93 <30E.Br.Black R.. RM 32.42 92/08/12 21.8 7.80 6.5 540 < 2 <0.2 73 <30E.Br.Black R.. RM 32.42 92/09/09 19.5 7.90 6.2 760 3 <0.2 90 <30E.Br.Black R.. RM 32.42 92/09/30 11.0 7.90 8.4 520 2 <0.2 81 <30E.Br.Black R.. RM 41.45 92/07/08 20.7 7.70 8.0 826 < 2 <0.2 104 <30E.Br.Black R.. RM 41.45 92/08/12 21.0 7.90 7.3 612 2 <0.2 87 <30E.Br.Black R.. RM 41.45 92/09/09 19.5 8.00 7.5 800 < 2 0.2 101 <30E.Br.Black R.. RM 41.45 92/09/30 10.5 8.00 8.7 570 < 2 <0.2 88 <30French Creek RM 0.54 92/07/08 19.2 8.12 8.9 862 < 2 <0.2 70 <30French Creek RM 0.54 92/08/12 21.5 8.07 7.1 851 < 2 <0.2 86 <30French Creek RM 0.54 92/09/09 18.8 8.00 8.7 630 < 2 <0.2 75 <30French Creek RM 0.54 92/10/01 9.0 8.30 9.0 700 < 2 <0.2 82 <30French Creek RM 3.2 92/07/08 20.5 8.13 8.4 931 < 2 <0.2 87 <30French Creek RM 3.2 92/08/12 20.5 8.13 8.1 801 2 <0.2 85 <30French Creek RM 3.2 92/09/09 18.5 8.00 8.7 700 < 2 <0.2 84 <30French Creek RM 3.2 92/10/01 8.0 8.50 9.5 600 2 <0.2 87 <30Plum Creek RM 0.83 92/07/08 18.0 8.10 7.8 900 2 <0.2 77 <30Plum Creek RM 0.83 92/08/12 18.0 8.00 7.8 800 < 2 <0.2 80 <30Plum Creek RM 0.83 92/09/09 18.0 8.00 7.6 750 < 2 <0.2 81 <30Plum Creek RM 0.83 92/09/30 10.0 8.00 9.6 650 < 2 <0.2 77 <30Plum Creek RM 3.19 92/07/08 19.0 8.20 7.9 770 2 <0.2 77 <30Plum Creek RM 3.19 92/08/12 18.0 8.10 6.9 690 < 2 <0.2 87 <30Plum Creek RM 3.19 92/09/09 17.0 8.10 7.5 610 2 <0.2 87 <30Plum Creek RM 3.19 92/09/30 8.0 8.20 9.7 520 < 2 <0.2 97 <30Plum Creek RM 7.0 92/07/08 12.0 7.60 1.7 920 5 <0.2 108 <30Plum Creek RM 7.0 92/08/12 13.0 7.70 1.5 850 5 <0.2 107 <30Plum Creek RM 7.0 92/09/09 16.0 7.80 3.9 580 3 <0.2 76 <30Plum Creek RM 7.0 92/09/30 8.0 7.70 8.0 530 3 <0.2 83 <30W. FK. E. BR. RM 4.13 92/07/08 21.9 8.00 9.9 663 < 2 <0.2 68 <30W. FK. E. BR. RM 4.13 92/08/12 21.0 8.30 10.3 500 < 2 <0.2 57 <30W. FK. E. BR. RM 4.13 92/09/09 19.0 8.40 10.8 575 < 2 <0.2 65 <30W. FK. E. BR. RM 4.13 92/09/30 8.5 8.10 10.1 465 < 2 <0.2 70 <30W.Br.Black R. RM 0.24 92/07/08 21.6 8.00 6.7 575 < 2 <0.2 69 <30W.Br.Black R. RM 0.24 92/08/12 21.5 7.3 545 < 2 <0.2 74 <30____________________________________________________________________________________________________
93

DSW/1992-12-8 1992 Black River June 13, 1996
Table C-1a. (cont.)____________________________________________________________________________________________________
River river mile Date temp. pH DO Cond. As Cd Ca Cr____________________________________________________________________________________________________W.Br.Black R. RM 0.24 92/09/09 18.7 8.00 8.0 400 2 <0.2 53 <30W.Br.Black R. RM 0.24 92/10/01 10.0 8.10 8.8 332 3 <0.2 59 <30W.Br.Black R. RM 4.18 92/07/08 20.7 8.00 7.7 494 < 2 <0.2 74 <30W.Br.Black R. RM 4.18 92/08/12 21.8 7.70 7.4 573 < 2 <0.2 75 <30W.Br.Black R. RM 4.18 92/09/09 19.5 7.80 7.4 364 2 <0.2 56 <30W.Br.Black R. RM 4.18 92/10/01 11.0 8.00 6.7 360 2 <0.2 63 <30W.Br.Black R. RM 14.39 92/07/08 19.0 8.30 7.0 600 2 <0.2 76 <30W.Br.Black R. RM 14.39 92/08/12 19.0 8.30 6.8 630 2 <0.2 95 <30W.Br.Black R. RM 14.39 92/09/09 18.0 8.20 6.5 460 < 2 <0.2 69 <30W.Br.Black R. RM 14.39 92/09/30 9.0 8.10 8.0 392 2 <0.2 73 <30W.Br.Black R. RM 25.3 92/07/08 18.0 8.00 6.1 700 3 <0.2 83 <30W.Br.Black R. RM 25.3 92/08/12 18.0 8.10 6.1 680 < 2 <0.2 97 <30W.Br.Black R. RM 25.3 92/09/09 17.0 8.20 7.5 500 2 <0.2 78 <30W.Br.Black R. RM 25.3 92/09/30 8.0 7.90 8.6 465 < 2 <0.2 80 <30W.Br.Black R. RM 41.67 92/07/08 16.0 8.10 5.6 700 < 2 <0.2 110 <30W.Br.Black R. RM 41.67 92/08/12 18.0 8.20 6.3 610 < 2 <0.2 103 <30W.Br.Black R. RM 41.67 92/09/09 16.0 8.10 6.3 600 < 2 <0.2 106 <30W.Br.Black R. RM 41.67 92/09/30 8.0 7.80 8.8 500 < 2 <0.2 102 <30Wellington Creek RM 10.83 92/07/08 19.0 8.00 1.7 510 6 <0.2 177 <30Wellington Creek RM 10.83 92/08/12 17.0 7.90 4.4 600 2 <0.2 88 <30Wellington Creek RM 10.83 92/09/09 18.0 7.90 9.3 430 4 <0.2 64 <30Wellington Creek RM 10.83 92/09/30 8.0 7.80 8.2 355 4 <0.2 62 <30Wellington Creek RM 13.09 92/07/08 19.0 8.70 2.5 387 4 <0.2 77 <30Wellington Creek RM 13.09 92/08/12 18.0 7.90 4.4 590 < 2 <0.2 81 <30Wellington Creek RM 13.09 92/09/09 17.0 8.10 5.9 370 4 <0.2 52 <30Wellington Creek RM 13.09 92/09/30 9.0 7.90 7.3 305 4 <0.2 52 <30Willow Creek RM 2.85 92/07/08 18.2 7.70 6.9 552 6 <0.2 65 <30Willow Creek RM 2.85 92/08/12 20.0 7.68 5.5 446 < 2 <0.2 53 <30Willow Creek RM 2.85 92/09/09 18.5 7.90 6.0 430 4 <0.2 58 <30Willow Creek RM 2.85 92/10/01 8.0 7.70 7.9 425 3 <0.2 61 <30____________________________________________________________________________________________________
94

DSW/1992-12-8 1992 Black River June 13, 1996
Table C-1b. Values for the 1992 Black River study area by site and date for copper (µg/l), lead (µg/l), magnesium (mg/l), nickel(µg/l), zinc (µg/l), hardness (mg/l), cBOD 5 (mg/l), and COD (mg/l).
____________________________________________________________________________________________________
River river mile Date Cu Pb Mg Ni Zn Hardness cBOD5 COD____________________________________________________________________________________________________Black River RM 0.01 92/07/08 <10 <2 10 <40 <10 141 <10Black River RM 0.01 92/08/06 <10 <2 10 <40 25 136 2.0 25Black River RM 0.01 92/08/12 <10 <2 <40 11 136 1.3 23Black River RM 0.01 92/09/09 12 3 10 <40 30 144 1.1 27Black River RM 0.01 92/09/17 <10 <2 10 <40 18 139 1.4 24Black River RM 0.01 92/10/01 <10 <2 11 <40 <10 150 1.1 13Black River RM 1.05 92/07/08 <10 <2 13 <40 <10 173 <10Black River RM 1.05 92/08/06 <10 <2 11 <40 18 163 1.4 24Black River RM 1.05 92/08/12 <10 <2 13 <40 10 183 2.6 33Black River RM 1.05 92/09/09 <10 4 11 <40 22 165 32Black River RM 1.05 92/09/17 <10 3 12 <40 15 164 1.1 24Black River RM 1.05 92/10/01 <10 3 12 <40 <10 167 <1.0 14Black River RM 1.84 92/07/08 <10 <2 13 <40 20 178 <10Black River RM 1.84 92/08/06 <10 <2 12 <40 <10 179 <1.0 26Black River RM 1.84 92/08/12 <10 <2 14 <40 <10 200 1.8 30Black River RM 1.84 92/09/09 <10 4 12 <40 21 172 <1.0 32Black River RM 1.84 92/09/17 <10 2 12 <40 13 172 1.0 26Black River RM 1.84 92/10/01 <10 2 12 <40 11 172 <1.0 15Black River RM 2.9 92/07/08 <10 <2 15 <40 <10 197 <10Black River RM 2.9 92/08/06 <10 <2 13 <40 <10 183 <1.0 34Black River RM 2.9 92/08/12 <10 <2 15 <40 <10 212 2.1 34Black River RM 2.9 92/09/09 <10 4 11 <40 15 170 <1.0 34Black River RM 2.9 92/09/17 <10 5 14 <40 22 187 1.4 21Black River RM 2.9 92/10/01 <10 2 14 <40 12 185 1.0 15Black River RM 3.7 92/07/08 <10 <2 23 42 <10 265 16Black River RM 3.7 92/08/06 <10 <2 15 <40 <10 214 <1.0 26Black River RM 3.7 92/08/12 <10 3 18 <40 11 241 3.6 34Black River RM 3.7 92/09/09 <10 3 12 <40 15 177 <1.0 27Black River RM 3.7 92/09/17 <10 2 14 <40 11 200 1.0 26Black River RM 3.7 92/10/01 <10 <2 13 <40 12 181 1.0 18Black River RM 4.2 92/07/08 <10 4 23 <40 <10 270 26Black River RM 4.2 92/08/06 <10 6 13 <40 11 213 2.9 38Black River RM 4.2 92/08/12 <10 4 19 <40 <10 253 1.8 28Black River RM 4.2 92/09/09 <10 3 13 <40 18 201 2.0 36Black River RM 4.2 92/09/17 <10 3 15 <40 <10 207 1.1 26Black River RM 4.2 92/10/01 <10 <2 19 <40 <10 231 <1.0 28Black River RM 5.3 92/07/08 <10 <2 30 <40 <10 288 13Black River RM 5.3 92/08/06 <10 <2 14 <40 <10 197 2.9 36Black River RM 5.3 92/08/12 <10 <2 19 <40 41 246 1.5 31Black River RM 5.3 92/09/09 <10 <2 14 <40 13 187 <1.0 40Black River RM 5.3 92/09/17 <10 <2 17 <40 13 212 1.6 28Black River RM 5.3 92/10/01 <10 <2 20 <40 <10 235 <1.0 15Black River RM 8.35 92/07/08 <10 <2 31 <40 <10 295 19Black River RM 8.35 92/08/06 <10 <2 15 <40 <10 197 1.6 31Black River RM 8.35 92/08/12 <10 <2 20 <40 <10 252 1.8 32____________________________________________________________________________________________________
95

DSW/1992-12-8 1992 Black River June 13, 1996
Table C-1b. (cont.)____________________________________________________________________________________________________
River river mile Date Cu Pb Mg Ni Zn Hardness cBOD5 COD____________________________________________________________________________________________________Black River RM 8.35 92/09/09 <10 2 14 <40 <10 182 <1.0 29Black River RM 8.35 92/09/17 <10 <2 16 <40 <10 203 <1.0 20Black River RM 8.35 92/10/01 <10 <2 18 <40 <10 221 <1.0 15Black River RM 9.8 92/07/08 <10 <2 32 <40 <10 297 18Black River RM 9.8 92/08/06 <10 2 15 <40 <10 197 33Black River RM 9.8 92/08/12 <10 <2 21 <40 <10 261 33Black River RM 9.8 92/09/09 10 4 15 <40 15 192 1.1 30Black River RM 9.8 92/09/17 <10 <2 19 <40 11 218 1.0 24Black River RM 9.8 92/10/01 <10 <2 22 <40 <10 243 14Black River RM 11.5 92/07/08 <10 <2 23 <40 <10 270 23Black River RM 11.5 92/08/06 <10 <2 14 <40 <10 187 28Black River RM 11.5 92/08/12 <10 <2 18 <40 <10 246 34Black River RM 11.5 92/09/09 10 2 12 <40 <10 169 <1.0 22Black River RM 11.5 92/09/17 <10 <2 14 <40 <10 192 1.2 26Black River RM 11.5 92/10/01 <10 <2 16 <40 <10 218 17Black River RM 14.95 92/07/08 <10 <2 23 <40 <10 284 19Black River RM 14.95 92/08/06 <10 2 14 <40 <10 187 27Black River RM 14.95 92/08/12 <10 <2 18 <40 <10 251 32Black River RM 14.95 92/09/09 <10 <2 12 <40 <10 169 <1.0 25Black River RM 14.95 92/09/17 <10 <2 14 <40 <10 195 1.2 22Black River RM 14.95 92/10/01 <10 <2 16 <40 <10 221 15Buck Creek RM 0.95 92/07/08 <10 4 21 <40 <10 291 22Buck Creek RM 0.95 92/08/12 11 <2 24 <40 14 321 34Buck Creek RM 0.95 92/09/09 <10 <2 23 <40 <10 319 21Buck Creek RM 0.95 92/09/30 <10 <2 24 <40 <10 311 22Charlemont Creek RM 0.5 92/07/08 <10 <2 31 <40 <10 372 44Charlemont Creek RM 0.5 92/08/12 <10 2 27 <40 46 346 32Charlemont Creek RM 0.5 92/09/09 <10 <2 23 <40 13 302 23Charlemont Creek RM 0.5 92/09/30 <10 <2 26 <40 <10 314 25Charlemont Creek RM 0.6 92/07/08 <10 <2 25 <40 <10 283 18Charlemont Creek RM 0.6 92/08/12 <10 <2 29 <40 11 362 32Charlemont Creek RM 0.6 92/09/09 <10 <2 22 <40 11 295 23Charlemont Creek RM 0.6 92/09/30 <10 <2 24 <40 <10 306 13E. FK. E. BR. RM 1.6 92/07/08 <10 <2 24 <40 13 324 20E. FK. E. BR. RM 1.6 92/08/12 <10 <2 22 <40 <10 308 30E. FK. E. BR. RM 1.6 92/09/09 59 10 27 <40 56 341 24E. FK. E. BR. RM 1.6 92/09/30 19 8 24 <40 23 321 <10E. FK. E. BR. RM 2.67 92/07/08 <10 <2 31 <40 <10 357 12E. FK. E. BR. RM 2.67 92/08/12 <10 <2 23 <40 <10 279 <1.0 26E. FK. E. BR. RM 2.67 92/09/09 <10 <2 29 <40 <10 332 <1.0 20E. FK. E. BR. RM 2.67 92/09/30 <10 <2 23 <40 <10 289 <1.0 10E.Br.Black R. RM 0.36 92/07/08 <10 <2 24 <40 <10 289 24E.Br.Black R. RM 0.36 92/08/12 <10 <2 18 <40 <10 251 38E.Br.Black R. RM 0.36 92/09/09 <10 2 11 <40 <10 158 30E.Br.Black R. RM 0.36 92/10/01 <10 <2 17 <40 11 227 13E.Br.Black R.. RM 3.07 92/07/08 <10 <2 16 <40 <10 201 19____________________________________________________________________________________________________
96

DSW/1992-12-8 1992 Black River June 13, 1996
Table C-1b. (cont.)____________________________________________________________________________________________________
River river mile Date Cu Pb Mg Ni Zn Hardness cBOD5 COD____________________________________________________________________________________________________E.Br.Black R.. RM 3.07 92/08/12 <10 <2 19 <40 <10 276 37E.Br.Black R.. RM 3.07 92/09/09 <10 <2 12 <40 <10 164 33E.Br.Black R.. RM 3.07 92/10/01 <10 <2 18 <40 <10 244 17E.Br.Black R.. RM 5.2 92/07/08 <10 <2 14 <40 <10 180 19E.Br.Black R.. RM 5.2 92/08/12 <10 <2 20 <40 22 280 34E.Br.Black R.. RM 5.2 92/09/09 <10 <2 13 <40 <10 181 39E.Br.Black R.. RM 5.2 92/09/30 <10 <2 18 <40 <10 239 18E.Br.Black R.. RM 6.0 92/07/08 <10 <2 12 <40 <10 164 21E.Br.Black R.. RM 6.0 92/08/12 <10 <2 21 <40 <10 291 30E.Br.Black R.. RM 6.0 92/09/09 <10 <2 13 <40 <10 176 39E.Br.Black R.. RM 6.0 92/09/30 <10 <2 18 <40 <10 239 12E.Br.Black R.. RM 10.5 92/07/08 <10 <2 12 <40 <10 167 21E.Br.Black R.. RM 10.5 92/08/12 <10 <2 18 <40 <10 256 30E.Br.Black R.. RM 10.5 92/09/09 <10 <2 16 <40 <10 208 32E.Br.Black R.. RM 10.5 92/09/30 <10 <2 19 <40 <10 258 15E.Br.Black R.. RM 11.3 92/07/08 <10 <2 19 <40 <10 203 20E.Br.Black R.. RM 11.3 92/08/12 <10 <2 18 <40 <10 254 1.1 29E.Br.Black R.. RM 11.3 92/09/09 <10 <2 16 <40 <10 203 <1.0 27E.Br.Black R.. RM 11.3 92/09/30 <10 <2 19 <40 <10 261 1.0 15E.Br.Black R.. RM 18.94 92/07/08 <10 <2 20 <40 <10 257 31E.Br.Black R.. RM 18.94 92/08/12 <10 <2 20 <40 <10 280 36E.Br.Black R.. RM 18.94 92/09/09 10 <2 21 <40 13 269 32E.Br.Black R.. RM 18.94 92/09/30 <10 <2 20 <40 <10 267 12E.Br.Black R.. RM 32.42 92/07/08 <10 <2 27 <40 <10 343 18E.Br.Black R.. RM 32.42 92/08/12 <10 <2 18 <40 <10 256 15E.Br.Black R.. RM 32.42 92/09/09 <10 <2 25 <40 <10 328 32E.Br.Black R.. RM 32.42 92/09/30 <10 <2 21 <40 <10 289 11E.Br.Black R.. RM 41.45 92/07/08 <10 <2 27 <40 10 371 20E.Br.Black R.. RM 41.45 92/08/12 <10 <2 21 <40 <10 304 40E.Br.Black R.. RM 41.45 92/09/09 <10 <2 27 <40 <10 363 26E.Br.Black R.. RM 41.45 92/09/30 <10 <2 23 <40 <10 314 21French Creek RM 0.54 92/07/08 <10 <2 18 <40 <10 249 23French Creek RM 0.54 92/08/12 <10 <2 19 <40 78 293 46French Creek RM 0.54 92/09/09 10 <2 15 <40 19 249 30French Creek RM 0.54 92/10/01 <10 <2 18 <40 <10 279 13French Creek RM 3.2 92/07/08 <10 <2 24 <40 <10 316 30French Creek RM 3.2 92/08/12 <10 <2 18 <40 <10 286 33French Creek RM 3.2 92/09/09 15 <2 17 <40 116 280 31French Creek RM 3.2 92/10/01 <10 <2 19 <40 <10 295 14Plum Creek RM 0.83 92/07/08 <10 <2 19 <40 15 271 16Plum Creek RM 0.83 92/08/12 <10 <2 21 <40 30 286 45Plum Creek RM 0.83 92/09/09 <10 <2 20 <40 13 285 18Plum Creek RM 0.83 92/09/30 <10 <2 21 <40 11 279 17Plum Creek RM 3.19 92/07/08 <10 <2 24 <40 <10 291 21Plum Creek RM 3.19 92/08/12 <10 <2 24 <40 22 316 27Plum Creek RM 3.19 92/09/09 <10 <2 22 <40 14 308 24____________________________________________________________________________________________________
97

DSW/1992-12-8 1992 Black River June 13, 1996
Table C-1b. (cont.)____________________________________________________________________________________________________
River river mile Date Cu Pb Mg Ni Zn Hardness cBOD5 COD____________________________________________________________________________________________________Plum Creek RM 3.19 92/09/30 <10 <2 26 <40 <10 349 14Plum Creek RM 7.0 92/07/08 <10 <2 64 <40 <10 533 20Plum Creek RM 7.0 92/08/12 <10 <2 62 <40 15 522 24Plum Creek RM 7.0 92/09/09 <10 <2 28 <40 <10 305 24Plum Creek RM 7.0 92/09/30 <10 <2 35 <40 <10 351 22W. FK. E. BR. RM 4.13 92/07/08 <10 <2 20 <40 <10 252 19W. FK. E. BR. RM 4.13 92/08/12 <10 <2 17 <40 <10 212 29W. FK. E. BR. RM 4.13 92/09/09 <10 <2 21 <40 <10 249 26W. FK. E. BR. RM 4.13 92/09/30 <10 <2 22 <40 <10 265 15W.Br.Black R. RM 0.24 92/07/08 <10 <2 21 <40 <10 259 22W.Br.Black R. RM 0.24 92/08/12 <10 <2 19 <40 <10 163 34W.Br.Black R. RM 0.24 92/09/09 <10 2 13 <40 <10 186 24W.Br.Black R. RM 0.24 92/10/01 <10 <2 15 <40 <10 209 14W.Br.Black R. RM 4.18 92/07/08 <10 <2 20 <40 <10 267 20W.Br.Black R. RM 4.18 92/08/12 <10 <2 19 <40 15 266 37W.Br.Black R. RM 4.18 92/09/09 <10 3 14 <40 <10 197 30W.Br.Black R. RM 4.18 92/10/01 <10 <2 16 <40 27 223 14W.Br.Black R. RM 14.39 92/07/08 <10 <2 20 <40 <10 272 16W.Br.Black R. RM 14.39 92/08/12 <10 <2 25 <40 18 340 40W.Br.Black R. RM 14.39 92/09/09 <10 <2 18 <40 12 246 22W.Br.Black R. RM 14.39 92/09/30 <10 <2 20 <40 10 265 19W.Br.Black R. RM 25.3 92/07/08 <10 <2 25 <40 <10 310 22W.Br.Black R. RM 25.3 92/08/12 <10 <2 27 <40 12 353 32W.Br.Black R. RM 25.3 92/09/09 <10 <2 21 <40 17 281 21W.Br.Black R. RM 25.3 92/09/30 <10 <2 23 <40 <10 294 53W.Br.Black R. RM 41.67 92/07/08 <10 <2 31 <40 <10 402 15W.Br.Black R. RM 41.67 92/08/12 <10 <2 30 <40 <10 381 30W.Br.Black R. RM 41.67 92/09/09 <10 <2 28 <40 13 380 21W.Br.Black R. RM 41.67 92/09/30 <10 <2 28 <40 13 370 20Wellington Creek RM 10.83 92/07/08 <10 <2 69 <40 <10 726 25Wellington Creek RM 10.83 92/08/12 <10 <2 29 <40 12 339 41Wellington Creek RM 10.83 92/09/09 <10 <2 19 <40 17 238 23Wellington Creek RM 10.83 92/09/30 <10 <2 19 <40 <10 233 21Wellington Creek RM 13.09 92/07/08 <10 <2 28 <40 29 308 28Wellington Creek RM 13.09 92/08/12 <10 <2 26 <40 <10 309 39Wellington Creek RM 13.09 92/09/09 <10 <2 15 <40 20 192 28Wellington Creek RM 13.09 92/09/30 <10 <2 16 <40 <10 196 22Willow Creek RM 2.85 92/07/08 <10 <2 19 <40 <10 241 28Willow Creek RM 2.85 92/08/12 <10 <2 12 <40 <10 182 49Willow Creek RM 2.85 92/09/09 22 <2 15 <40 <10 207 36Willow Creek RM 2.85 92/10/01 <10 <2 15 <40 <10 214 16___________________________________________________________________________________________________
98

DSW/1992-12-8 1992 Black River June 13, 1996
Table C-1c. Values for the 1992 Black River study area by site and date for chloride (mg/l), cyanide (µg/l), NO2-NO3 (mg/l), NO2(mg/l), NH3 (mg/l), total Kjeldahl nitrogen (mg/l), oil and grease (mg/l), and phosphorus (mg/l), total desolved solids(mg/l), total suspended solids (mg/l), and fecal colliform bacteria (#/100 ml).
___________________________________________________________________________________________________
River river mile Date Chloride NO2-NO3 NH3 O+G TDS Fec coliCN NO2 TKN Phos TSS
____________________________________________________________________________________________________Black River RM 0.01 92/07/08 1.91 0.06 0.14 0.4 0.07 243 10Black River RM 0.01 92/08/06 20 1.17 0.05 <0.05 0.6 0.08 202 14Black River RM 0.01 92/08/12 21 1.19 0.04 0.16 0.5 0.12 226 8Black River RM 0.01 92/09/09 25 1.19 0.19 0.30 0.8 0.06 246 23Black River RM 0.01 92/09/17 23 < 5 1.00 0.11 0.37 0.9 0.07 224 20Black River RM 0.01 92/10/01 30 1.05 0.04 1.81 2.1 0.11 262 25 300000Black River RM 1.05 92/07/08 3.11 0.14 0.36 0.7 0.11 320 12Black River RM 1.05 92/08/06 26 1.49 0.06 0.07 0.8 0.10 274 12Black River RM 1.05 92/08/12 32 1.81 0.06 0.08 0.8 0.06 320 16Black River RM 1.05 92/09/09 34 1.52 0.36 0.10 0.9 0.09 310 32Black River RM 1.05 92/09/17 31 < 5 1.43 0.24 0.12 0.8 0.12 294 33Black River RM 1.05 92/10/01 30 1.43 0.07 0.21 0.7 0.15 280 16 340Black River RM 1.84 92/07/08 2.91 0.14 0.45 0.9 0.14 330 42Black River RM 1.84 92/08/06 31 1.62 0.06 <0.05 0.7 0.14 304 18Black River RM 1.84 92/08/12 41 2.22 0.07 0.10 0.8 0.08 376 20Black River RM 1.84 92/09/09 34 1.55 0.28 0.07 0.7 0.10 326 40Black River RM 1.84 92/09/17 33 < 5 1.59 0.27 <0.05 1.0 0.17 310 27Black River RM 1.84 92/10/01 33 1.82 0.07 0.23 0.8 0.16 310 22Black River RM 2.9 92/07/08 4.59 0.14 0.31 0.9 0.08 410 16Black River RM 2.9 92/08/06 32 1.64 0.06 <0.05 0.7 0.14 298 20Black River RM 2.9 92/08/12 49 2.54 0.07 0.08 0.9 0.07 408 31Black River RM 2.9 92/09/09 36 1.68 0.23 0.07 0.9 0.11 332 28Black River RM 2.9 92/09/17 40 < 5 2.07 0.18 0.06 0.8 0.16 946 82Black River RM 2.9 92/10/01 38 2.39 0.06 0.20 0.9 0.14 338 34Black River RM 3.7 92/07/08 7.92 0.12 0.16 1.2 0.08 596 19Black River RM 3.7 92/08/06 34 7.66 0.05 <0.05 0.6 0.12 336 25Black River RM 3.7 92/08/12 63 3.35 0.04 <0.05 0.8 0.08 468 53Black River RM 3.7 92/09/09 44 2.47 0.07 0.09 0.8 0.09 356 38Black River RM 3.7 92/09/17 49 < 5 2.64 0.06 <0.05 1.0 0.13 372 36Black River RM 3.7 92/10/01 38 2.24 0.06 0.17 0.9 0.14 342 20Black River RM 4.2 92/07/08 7.00 0.14 0.06 1.4 27.6 0.09 678 18Black River RM 4.2 92/08/06 59 1.22 0.06 0.08 0.8 0.08 394 24Black River RM 4.2 92/08/12 64 3.05 0.03 <0.05 0.7 0.07 466 16Black River RM 4.2 92/09/09 61 3.69 0.07 0.06 0.9 1.18 0.06 440 21Black River RM 4.2 92/09/17 55 < 5 3.55 0.06 <0.05 1.0 0.11 410 27Black River RM 4.2 92/10/01 93 3.72 < 0.02 0.05 0.9 0.12 452 16 1000Black River RM 5.3 92/07/08 11.50 0.04 <0.05 1.0 0.09 770 31Black River RM 5.3 92/08/06 29 1.41 0.05 <0.05 0.6 0.10 320 38Black River RM 5.3 92/08/12 56 3.02 0.02 <0.05 0.6 0.06 446 12Black River RM 5.3 92/09/09 48 4.99 0.08 <0.05 0.7 0.11 418 24Black River RM 5.3 92/09/17 55 < 5 3.49 0.03 <0.05 0.8 0.11 406 28Black River RM 5.3 92/10/01 57 4.09 < 0.02 <0.05 0.7 0.13 461 16 590Black River RM 8.35 92/07/08 11.60 0.03 <0.05 1.2 0.10 794 24Black River RM 8.35 92/08/06 31 1.53 0.05 <0.05 0.6 0.16 308 46___________________________________________________________________________________________________
99

DSW/1992-12-8 1992 Black River June 13, 1996
Table C-1c. (cont.)___________________________________________________________________________________________________
River river mile Date Chloride NO2-NO3 NH3 O+G TDS Fec coliCN NO2 TKN Phos TSS
____________________________________________________________________________________________________Black River RM 8.35 92/08/12 52 3.32 0.02 <0.05 0.6 0.06 464 12Black River RM 8.35 92/09/09 43 3.84 0.03 <0.05 0.9 0.13 406 22Black River RM 8.35 92/09/17 50 < 5 3.08 0.02 <0.05 0.7 0.10 388 24 310Black River RM 8.35 92/10/01 52 3.29 < 0.02 0.05 0.9 0.14 426 10 1900Black River RM 9.8 92/07/08 12.70 0.03 <0.05 1.2 0.10 830 20Black River RM 9.8 92/08/06 30 1.59 0.05 <0.05 0.6 0.08 310 50Black River RM 9.8 92/08/12 4.68 < 0.02 <0.05 0.6 0.90 498 14Black River RM 9.8 92/09/09 52 6.53 0.03 <0.05 1.0 0.12 470 25Black River RM 9.8 92/09/17 5 5.30 0.03 <0.05 1.0 0.14 461 10 1500Black River RM 9.8 92/10/01 5.43 < 0.02 0.05 0.7 0.15 494 8 2650Black River RM 11.5 92/07/08 4.11 0.03 <0.05 1.1 0.12 486 34Black River RM 11.5 92/08/06 22 0.99 0.06 <0.05 0.5 0.16 278 54Black River RM 11.5 92/08/12 0.94 0.02 <0.05 0.6 0.07 396 14Black River RM 11.5 92/09/09 0.94 0.03 <0.05 0.8 0.14 302 26Black River RM 11.5 92/09/17 26 0.97 0.03 <0.05 0.8 0.13 296 16 3100Black River RM 11.5 92/10/01 0.96 < 0.02 <0.05 0.6 0.11 336 12 9800Black River RM 14.95 92/07/08 3.94 0.06 0.05 1.0 0.13 513 21Black River RM 14.95 92/08/06 24 0.99 0.06 <0.05 0.5 0.20 280 64Black River RM 14.95 92/08/12 0.91 0.03 <0.05 0.6 <0.05 400 16Black River RM 14.95 92/09/09 0.95 0.04 <0.05 0.9 0.14 306 30Black River RM 14.95 92/09/17 25 1.10 0.13 <0.05 0.7 0.12 310 17 6100Black River RM 14.95 92/10/01 0.96 < 0.02 0.08 0.6 0.14 332 21 9800Buck Creek RM 0.95 92/07/08 0.21 0.04 0.30 0.7 0.08 1010 5Buck Creek RM 0.95 92/08/12 0.68 0.05 <0.05 0.8 <0.05 394 6Buck Creek RM 0.95 92/09/09 1.14 0.04 <0.05 0.7 <0.05 472 8Buck Creek RM 0.95 92/09/30 0.45 < 0.02 <0.05 0.5 0.08 412 5Charlemont Creek RM 0.5 92/07/08 15.60 0.51 0.61 2.3 2.33 892 21Charlemont Creek RM 0.5 92/08/12 2.95 0.16 <0.05 1.0 0.39 518 20Charlemont Creek RM 0.5 92/09/09 1.91 0.04 0.07 0.7 0.17 482 12Charlemont Creek RM 0.5 92/09/30 3.52 0.21 0.18 1.1 0.71 510 8 1050Charlemont Creek RM 0.6 92/07/08 1.96 0.08 0.05 0.6 0.23 572 51Charlemont Creek RM 0.6 92/08/12 0.42 0.07 <0.05 0.8 0.07 508 22Charlemont Creek RM 0.6 92/09/09 0.38 < 0.02 <0.05 0.6 <0.05 460 19Charlemont Creek RM 0.6 92/09/30 0.28 < 0.02 <0.05 0.6 <0.05 450 10 340E. FK. E. BR. RM 1.6 92/07/08 5.20 0.11 1.35 2.6 1.59 994 5E. FK. E. BR. RM 1.6 92/08/12 3.54 0.02 <0.05 0.5 0.58 660 5E. FK. E. BR. RM 1.6 92/09/09 4.12 0.02 <0.05 0.8 0.82 758 5E. FK. E. BR. RM 1.6 92/09/30 3.94 < 0.02 <0.05 0.8 0.47 650 5 730E. FK. E. BR. RM 2.67 92/07/08 <0.10 < 0.02 <0.05 0.4 0.65 666 5E. FK. E. BR. RM 2.67 92/08/12 54 0.11 < 0.02 <0.05 0.3 <0.05 464 5E. FK. E. BR. RM 2.67 92/09/09 69 <0.10 0.02 <0.05 0.3 <0.05 578 5E. FK. E. BR. RM 2.67 92/09/30 55 <0.10 < 0.02 <0.05 0.4 <0.05 484 5 1700E.Br.Black R. RM 0.36 92/07/08 2.28 0.09 <0.05 1.0 0.13 530 14E.Br.Black R. RM 0.36 92/08/12 0.88 0.03 <0.05 0.6 0.08 387 20E.Br.Black R. RM 0.36 92/09/09 0.82 0.06 0.14 0.9 0.15 294 20E.Br.Black R. RM 0.36 92/10/01 0.92 < 0.02 0.07 0.7 0.14 366 12 3350___________________________________________________________________________________________________
100

DSW/1992-12-8 1992 Black River June 13, 1996
Table C-1c. (cont.)___________________________________________________________________________________________________
River river mile Date Chloride NO2-NO3 NH3 O+G TDS Fec coliCN NO2 TKN Phos TSS
____________________________________________________________________________________________________E.Br.Black R.. RM 3.07 92/07/08 3.52 0.05 <0.05 0.8 0.14 378 6E.Br.Black R.. RM 3.07 92/08/12 0.91 0.02 <0.05 0.5 1.54 408 14E.Br.Black R.. RM 3.07 92/09/09 0.81 0.04 0.09 0.9 0.17 300 24E.Br.Black R.. RM 3.07 92/10/01 0.87 < 0.02 0.05 0.7 0.13 374 6 3400E.Br.Black R.. RM 5.2 92/07/08 3.80 0.04 <0.05 0.9 0.20 338 16E.Br.Black R.. RM 5.2 92/08/12 0.91 0.03 <0.05 0.6 0.08 442 12E.Br.Black R.. RM 5.2 92/09/09 0.93 0.04 <0.05 0.8 0.15 314 21E.Br.Black R.. RM 5.2 92/09/30 0.86 < 0.02 <0.05 0.6 0.14 372 11 2650E.Br.Black R.. RM 6.0 92/07/08 3.98 0.04 0.05 0.8 0.22 324 20E.Br.Black R.. RM 6.0 92/08/12 0.86 0.04 <0.05 0.5 0.09 462 14E.Br.Black R.. RM 6.0 92/09/09 0.80 0.05 0.05 0.7 0.13 287 27E.Br.Black R.. RM 6.0 92/09/30 0.82 < 0.02 <0.05 0.6 0.13 372 14 1300E.Br.Black R.. RM 10.5 92/07/08 5.00 0.11 0.07 0.7 0.16 312 24E.Br.Black R.. RM 10.5 92/08/12 0.61 < 0.02 <0.05 0.6 0.09 406 12E.Br.Black R.. RM 10.5 92/09/09 0.60 0.06 0.33 0.9 0.07 338 14E.Br.Black R.. RM 10.5 92/09/30 0.88 < 0.02 <0.05 0.6 0.19 392 13E.Br.Black R.. RM 11.3 92/07/08 5.29 0.11 0.06 0.7 0.13 310 46E.Br.Black R.. RM 11.3 92/08/12 31 0.66 0.02 <0.05 0.5 0.09 416 16E.Br.Black R.. RM 11.3 92/09/09 24 0.55 0.03 <0.05 0.6 <0.05 312 20E.Br.Black R.. RM 11.3 92/09/30 30 0.73 < 0.02 <0.05 0.6 <0.05 10 610E.Br.Black R.. RM 18.94 92/07/08 4.14 0.06 0.07 0.8 0.14 438 43E.Br.Black R.. RM 18.94 92/08/12 0.53 < 0.02 <0.05 0.4 0.09 442 32E.Br.Black R.. RM 18.94 92/09/09 0.47 0.03 0.05 0.5 <0.05 408 28E.Br.Black R.. RM 18.94 92/09/30 0.58 < 0.02 <0.05 0.5 0.10 386 11 570E.Br.Black R.. RM 32.42 92/07/08 1.60 0.04 0.12 0.6 0.10 610 50E.Br.Black R.. RM 32.42 92/08/12 1.61 0.07 <0.05 0.8 0.08 420 28E.Br.Black R.. RM 32.42 92/09/09 0.42 0.03 <0.05 0.6 0.08 526 24E.Br.Black R.. RM 32.42 92/09/30 0.66 < 0.02 <0.05 0.5 0.10 428 11E.Br.Black R.. RM 41.45 92/07/08 2.50 0.02 <0.05 0.8 0.10 654 34E.Br.Black R.. RM 41.45 92/08/12 1.56 0.03 <0.05 0.5 0.10 508 16E.Br.Black R.. RM 41.45 92/09/09 0.48 0.03 <0.05 0.5 <0.05 572 6E.Br.Black R.. RM 41.45 92/09/30 0.98 < 0.02 <0.05 0.4 0.12 482 5French Creek RM 0.54 92/07/08 13.00 0.03 0.06 1.4 0.16 622 12French Creek RM 0.54 92/08/12 11.80 0.32 0.68 4.2 0.13 600 5French Creek RM 0.54 92/09/09 68 3.19 0.03 <0.05 0.9 0.13 506 6French Creek RM 0.54 92/10/01 9.71 < 0.02 <0.05 0.9 0.15 588 5 840French Creek RM 3.2 92/07/08 14.50 0.46 0.10 2.2 0.16 704 16French Creek RM 3.2 92/08/12 7.80 0.52 2.26 4.7 0.09 580 10French Creek RM 3.2 92/09/09 80 3.29 0.05 <0.05 1.0 0.21 570 7French Creek RM 3.2 92/10/01 4.62 < 0.02 <0.05 0.7 0.16 548 5 1150Plum Creek RM 0.83 92/07/08 21.80 0.03 <0.05 0.8 0.31 668 5Plum Creek RM 0.83 92/08/12 12.60 0.03 <0.05 1.0 0.19 576 19Plum Creek RM 0.83 92/09/09 70 9.04 0.03 <0.05 0.8 0.32 578 5Plum Creek RM 0.83 92/09/30 10.90 < 0.02 <0.05 0.8 0.26 602 5 770Plum Creek RM 3.19 92/07/08 <0.10 0.02 <0.05 0.6 0.08 580 5Plum Creek RM 3.19 92/08/12 0.18 < 0.02 <0.05 0.5 <0.05 466 6___________________________________________________________________________________________________
101

DSW/1992-12-8 1992 Black River June 13, 1996
Table C-1c. (cont.)___________________________________________________________________________________________________
River river mile Date Chloride NO2-NO3 NH3 O+G TDS Fec coliCN NO2 TKN Phos TSS
____________________________________________________________________________________________________Plum Creek RM 3.19 92/09/09 34 0.40 < 0.02 0.05 0.6 0.06 470 5Plum Creek RM 3.19 92/09/30 <0.10 < 0.02 <0.05 0.5 <0.05 514 5 880Plum Creek RM 7.0 92/07/08 0.16 0.05 1.60 1.8 0.28 770 6Plum Creek RM 7.0 92/08/12 0.18 0.02 0.20 0.5 <0.05 642 6Plum Creek RM 7.0 92/09/09 0.14 < 0.02 <0.05 0.7 0.08 435 5Plum Creek RM 7.0 92/09/30 <0.10 < 0.02 0.15 0.6 0.09 510 5 2150W. FK. E. BR. RM 4.13 92/07/08 1.86 < 0.02 <0.05 0.6 0.05 416 5W. FK. E. BR. RM 4.13 92/08/12 0.53 < 0.02 <0.05 0.5 <0.05 366 5W. FK. E. BR. RM 4.13 92/09/09 <0.10 0.02 <0.05 0.5 <0.05 390 5W. FK. E. BR. RM 4.13 92/09/30 0.29 < 0.02 <0.05 0.5 0.06 392 5W.Br.Black R. RM 0.24 92/07/08 7.20 0.13 0.08 1.3 0.07 450 9W.Br.Black R. RM 0.24 92/08/12 0.98 0.03 <0.05 0.7 <0.05 420 13W.Br.Black R. RM 0.24 92/09/09 0.97 0.04 0.06 0.8 0.11 322 34W.Br.Black R. RM 0.24 92/10/01 1.10 < 0.02 0.05 0.6 0.12 330 22 11400W.Br.Black R. RM 4.18 92/07/08 7.09 0.11 0.11 1.0 0.08 452 14W.Br.Black R. RM 4.18 92/08/12 1.08 0.03 <0.05 0.6 0.08 422 34W.Br.Black R. RM 4.18 92/09/09 0.86 0.04 0.09 1.0 0.16 324 63W.Br.Black R. RM 4.18 92/10/01 1.20 0.02 0.14 0.6 0.15 352 44 3950W.Br.Black R. RM 14.39 92/07/08 2.43 0.04 <0.05 0.7 0.11 448 33W.Br.Black R. RM 14.39 92/08/12 0.93 0.02 <0.05 0.6 <0.05 460 28W.Br.Black R. RM 14.39 92/09/09 0.74 0.02 0.07 0.7 0.07 392 32W.Br.Black R. RM 14.39 92/09/30 0.87 < 0.02 <0.05 0.6 0.13 394 16 880W.Br.Black R. RM 25.3 92/07/08 4.11 0.07 <0.05 0.8 0.60 566 38W.Br.Black R. RM 25.3 92/08/12 0.94 0.02 <0.05 0.6 0.16 548 14W.Br.Black R. RM 25.3 92/09/09 1.13 0.05 <0.05 0.8 0.12 444 18W.Br.Black R. RM 25.3 92/09/30 1.60 0.04 0.06 0.8 0.26 464 7 500W.Br.Black R. RM 41.67 92/07/08 0.75 0.06 0.06 0.5 <0.05 632 10W.Br.Black R. RM 41.67 92/08/12 0.32 0.02 <0.05 0.5 0.08 532 6W.Br.Black R. RM 41.67 92/09/09 0.41 0.02 <0.05 0.5 <0.05 530 6W.Br.Black R. RM 41.67 92/09/30 0.23 < 0.02 0.06 0.6 <0.05 506 5Wellington Creek RM 10.83 92/07/08 0.24 0.04 0.24 0.8 0.13 462 6Wellington Creek RM 10.83 92/08/12 1.52 0.06 0.07 0.8 0.07 485 5Wellington Creek RM 10.83 92/09/09 0.59 0.05 <0.05 1.0 0.08 374 5Wellington Creek RM 10.83 92/09/30 0.74 0.02 0.09 0.6 0.12 242 5Wellington Creek RM 13.09 92/07/08 <0.10 < 0.02 <0.05 0.7 0.05 328 5Wellington Creek RM 13.09 92/08/12 0.84 0.05 <0.05 0.7 <0.05 434 10Wellington Creek RM 13.09 92/09/09 0.41 0.04 <0.05 1.0 0.06 324 12Wellington Creek RM 13.09 92/09/30 0.47 < 0.02 0.05 0.7 0.08 286 5Willow Creek RM 2.85 92/07/08 0.40 0.03 0.28 1.0 0.51 490 32Willow Creek RM 2.85 92/08/12 1.82 0.04 <0.05 0.9 0.23 330 14Willow Creek RM 2.85 92/09/09 0.87 0.04 0.05 0.8 0.22 338 12Willow Creek RM 2.85 92/10/01 1.09 < 0.02 0.45 1.2 0.32 372 19 5200
____________________________________________________________________________________________________
102
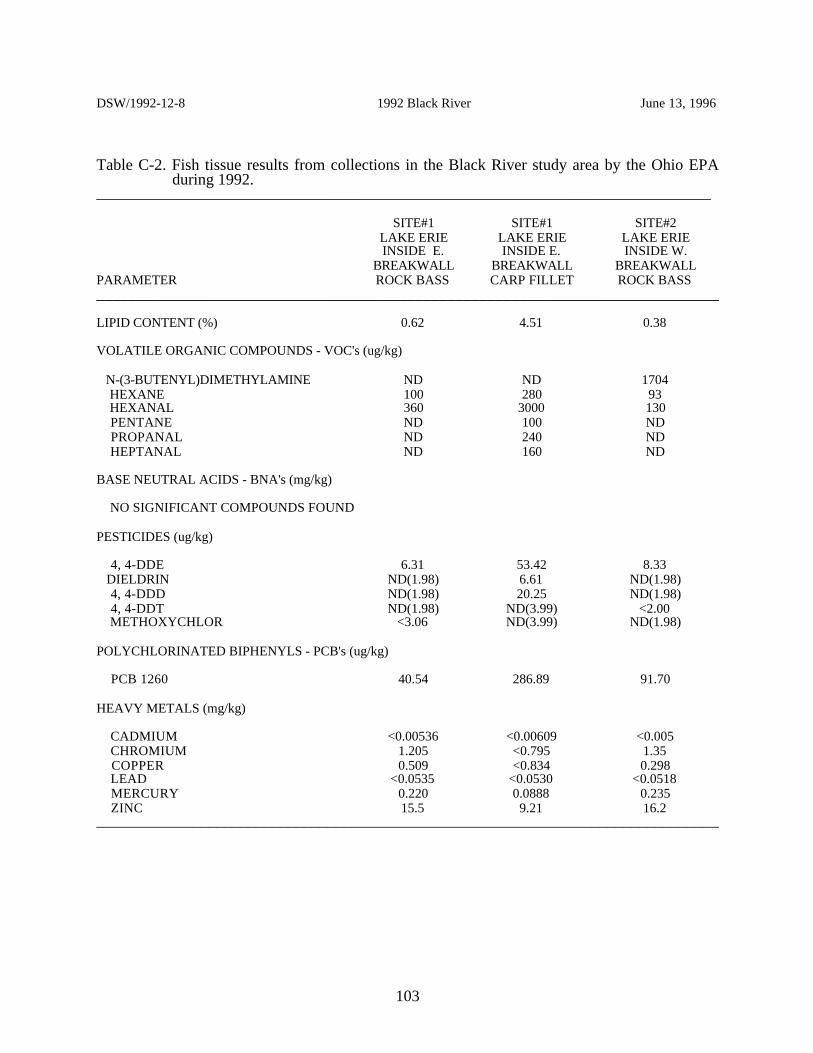
DSW/1992-12-8 1992 Black River June 13, 1996
Table C-2. Fish tissue results from collections in the Black River study area by the Ohio EPAduring 1992.
_____________________________________________________________________________
SITE#1 SITE#1 SITE#2LAKE ERIE LAKE ERIE LAKE ERIEINSIDE E. INSIDE E. INSIDE W.
BREAKWALL BREAKWALL BREAKWALLPARAMETER ROCK BASS CARP FILLET ROCK BASS______________________________________________________________________________
LIPID CONTENT (%) 0.62 4.51 0.38
VOLATILE ORGANIC COMPOUNDS - VOC's (ug/kg)
N-(3-BUTENYL)DIMETHYLAMINE ND ND 1704 HEXANE 100 280 93 HEXANAL 360 3000 130 PENTANE ND 100 ND PROPANAL ND 240 ND HEPTANAL ND 160 ND
BASE NEUTRAL ACIDS - BNA's (mg/kg)
NO SIGNIFICANT COMPOUNDS FOUND
PESTICIDES (ug/kg)
4, 4-DDE 6.31 53.42 8.33 DIELDRIN ND(1.98) 6.61 ND(1.98) 4, 4-DDD ND(1.98) 20.25 ND(1.98) 4, 4-DDT ND(1.98) ND(3.99) <2.00 METHOXYCHLOR <3.06 ND(3.99) ND(1.98)
POLYCHLORINATED BIPHENYLS - PCB's (ug/kg)
PCB 1260 40.54 286.89 91.70
HEAVY METALS (mg/kg)
CADMIUM <0.00536 <0.00609 <0.005 CHROMIUM 1.205 <0.795 1.35 COPPER 0.509 <0.834 0.298 LEAD <0.0535 <0.0530 <0.0518 MERCURY 0.220 0.0888 0.235 ZINC 15.5 9.21 16.2______________________________________________________________________________
103

DSW/1992-12-8 1992 Black River June 13, 1996
Table C-2 . (cont.)______________________________________________________________________________
SITE#2 SITE#2 SITE#2LAKE ERIE LAKE ERIE LAKE ERIEINSIDE W. INSIDE W. INSIDE W.
BREAKWALL BREAKWALL BREAKWALLPARAMETER LM BASS CARP FILLET WHOLE CARP______________________________________________________________________________
LIPID CONTENT (%) 0.90 7.75 13.52
VOLATILE ORGANIC COMPOUNDS - VOC's (ug/kg)
ACETALDEHYDE ND 109 ND PENTANE ND 91 154 METHYLCYCLOPENTANE ND 109 ND PROPANAL 93 182 250 HEXANE 130 873 1212 HEXANAL 519 1491 1923 a-METHYLCYCLOHEXANE ND ND 115
BASE NEUTRAL ACIDS - BNA's (mg/kg)
NO SIGNIFICANT COMPOUNDS FOUND
PESTICIDES (ug/kg)
4, 4-DDE 13.77 54.07 106.09 DIELDRIN 2.45 9.57 6.75 4, 4-DDD 5.54 22.44 50.33 4, 4-DDT <2.88 ND(3.98) ND(3.98)
POLYCHLORINATED BIPHENYLS - PCB's (ug/kg)
PCB 1248 ND(9.91) ND(19.90) 71.20 PCB 1260 91.65 301.00 624.46
HEAVY METALS (mg/kg)
CADMIUM <0.00550 <0.00540 0.112 CHROMIUM 0.825 <0.811 1.32 COPPER 0.256 0.635 1.26 LEAD <0.0550 <0.0541 0.220 MERCURY 0.115 0.0662 <0.0175 ZINC 11.9 10.1 90.1______________________________________________________________________________
104

DSW/1992-12-8 1992 Black River June 13, 1996
Table C-2. (cont.)______________________________________________________________________________
SITE#3 SITE#3 SITE#3BLACK RIVER BLACK RIVER BLACK RIVER
ERIE AVE. ERIE AVE. ERIE AVE.RM 1.05 RM 1.05 RM 1.05
PARAMETER BR BULLHEAD LM BASS MED LM BASS LG______________________________________________________________________________
LIPID CONTENT (%) 4.31 0.38 0.39
VOLATILE ORGANIC COMPOUNDS - VOC's (ug/kg)
PENTANE 96 ND ND PROPANAL 231 ND ND HEXANE 519 ND ND HEXANAL 1019 ND 115
BASE NEUTRAL ACIDS - BNA's (mg/kg)
NO SIGNIFICANT COMPOUNDS FOUND
PESTICIDES (ug/kg)
4, 4-DDE 68.87 7.03 11.15 DIELDRIN 15.18 ND(1.97) ND(1.99) 4, 4-DDD 33.35 2.60 4.21 4, 4-DDT 4.04 ND(1.97) <2.39
POLYCHLORINATED BIPHENYLS - PCB's (ug/kg)
PCB 1248 ND(19.80) ND(9.86) ND(9.94) PCB 1260 397.42 45.94 99.76
HEAVY METALS (mg/kg)
CADMIUM <0.00503 <0.00550 <0.00528 CHROMIUM 0.788 1.07 0.844 COPPER 0.381 0.349 0.359 LEAD <0.0508 <0.0549 <0.0528 MERCURY 0.0683 0.130 0.150 ZINC 9.99 13.5 11.0______________________________________________________________________________
105

DSW/1992-12-8 1992 Black River June 13, 1996
Table C-2. (cont.)______________________________________________________________________________
SITE#3 SITE#4 SITE#4BLACK RIVER BLACK RIVER BLACK RIVER
ERIE AVE. Upst Turn Basin Upst Turn BasinRM 1.05 RM 2.9 RM 2.9
PARAMETER Carp/Goldfish Br Bullhead Carp Fillet______________________________________________________________________________
LIPID CONTENT (%) 1.94 4.31 2.53
VOLATILE ORGANIC COMPOUNDS - VOC's (ug/kg)
a-METHYLCYCLOHEXANE 212 ND ND ACETIC ACID, ANHYDRIDE 500 ND ND HEXANE 115 353 ND HEXANAL 423 216 2600 PROPANAL ND ND 100
BASE NEUTRAL ACIDS - BNA's (mg/kg)
NO SIGNIFICANT COMPOUNDS FOUND
PESTICIDES (ug/kg)
4, 4-DDE 25.52 55.87 31.53 DIELDRIN ND(4.00) 13.08 4.90 4, 4-DDD 6.71 32.68 13.68
POLYCHLORINATED BIPHENYLS - PCB's (ug/kg)
PCB 1248 ND(20.02) 48.98 39.92 PCB 1260 47.03 244.20 67.94 HEAVY METALS (mg/kg)
CADMIUM <0.00551 <0.00556 <0.00556 CHROMIUM 1.27 <0.833 1.32 COPPER 0.799 0.289 0.681 LEAD <0.0551 <0.0556 <0.0556 MERCURY 0.0216 0.0362 0.0467 ZINC 12.0 7.64 13.6 _________________________________________________________________
106

DSW/1992-12-8 1992 Black River June 13, 1996
Table C-2. (cont.)_____________________________________________________________________________
SITE#4 SITE#4 SITE#5BLACK RIVER BLACK RIVER BLACK RIVER
UPST TURN BASINUPST TURN BASIN ADJ D2 LANDFILLRM 2.9 RM 2.9 RM 5.3
PARAMETER WHOLE CARP LM BASS LM BASS______________________________________________________________________________
LIPID CONTENT (%) 4.50 0.26 0.36
VOLATILE ORGANIC COMPOUNDS - VOC's (ug/kg)
a-METHYLCYCLOHEXANE 208 ND ND PENTANE 358 ND ND PENTANAL 264 ND ND PROPANAL 396 ND ND HEPTANAL 208 ND ND HEXANAL ND 481 ND
BASE NEUTRAL ACIDS - BNA's (mg/kg)
NO SIGNIFICANT COMPOUNDS FOUND
PESTICIDES (ug/kg)
4, 4-DDE 86.09 6.46 3.01 DIELDRIN 7.08 ND(2.00) ND(1.97) 4, 4-DDD 29.90 ND(2.00) ND(1.97) METHOXYCHLOR ND(3.96) <2.09 ND(1.97)
POLYCHLORINATED BIPHENYLS - PCB's (ug/kg)
PCB 1248 65.14 ND(9.99) ND(9.87) PCB 1260 432.15 24.53 10.00
HEAVY METALS (mg/kg)
CADMIUM 0.0940 <0.00532 <0.00558 CHROMIUM 1.18 1.04 1.17 COPPER 0.637 0.356 0.351 LEAD 0.297 <0.0532 <0.0558 MERCURY 0.0540 0.0794 0.102 ZINC 44.3 11.4 11.4______________________________________________________________________________
107

DSW/1992-12-8 1992 Black River June 13, 1996
Table C-2. (cont.)_____________________________________________________________________________
SITE#5 SITE#5 SITE#6BLACK RIVER BLACK RIVER E BR BLK RIVER
ADJ D2 LANDFILL ADJ D2 LANDFILL WASHINGTON STRM 5.3 RM 5.3 RM 0.3
PARAMETER WHOLE CARP CARP FILLET LM BASS______________________________________________________________________________
LIPID CONTENT (%) 6.14 2.25 0.71
VOLATILE ORGANIC COMPOUNDS - VOC's (ug/kg)
PENTANE 100 167 ND PROPANAL 140 117 ND HEXANE 700 183 ND HEXANAL 5600 2833 360 HEPTANAL ND 100 ND
BASE NEUTRAL ACIDS - BNA's (mg/kg)
NO SIGNIFICANT COMPOUNDS FOUND
PESTICIDES (ug/kg)
4, 4-DDE 91.43 39.05 9.77 DIELDRIN 12.00 4.23 ND(3.90) 4, 4-DDD 63.12 10.94 ND(3.90)
POLYCHLORINATED BIPHENYLS - PCB's (ug/kg)
PCB 1248 58.02 44.53 ND(19.49) PCB 1260 318.06 131.81 ND(19.49) HEAVY METALS (mg/kg)
CADMIUM 0.264 <0.00538 <0.00546 CHROMIUM 1.23 1.45 4.34 COPPER 1.20 0.578 0.409 LEAD 0.137 <0.0538 <0.0546 MERCURY 0.0425 0.0845 0.167 ZINC 62.6 11.0 9.82______________________________________________________________________________
108

DSW/1992-12-8 1992 Black River June 13, 1996
Table C-2. (cont.)_____________________________________________________________________________
SITE#6 SITE#6 SITE#6E BR BL R. E BR BL R. E BR BL R.
Washington St. Washington St. Washington St.RM 0.3 RM 0.3 RM 0.3
PARAMETER WHOLE CARP CARP FILLET Y BULLHEAD______________________________________________________________________________
LIPID CONTENT (%) 3.40 1.49 1.36
VOLATILE ORGANIC COMPOUNDS - VOC's (ug/kg)
M-XYLENE* 208 ND(172) ND(196) PROPANAL 302 86 ND HEXANE 321 ND 118 HEXANAL 5849 2414 275 HEPTANAL 208 ND ND
BASE NEUTRAL ACIDS - BNA's (mg/kg)
NO SIGNIFICANT COMPOUNDS FOUND
PESTICIDES (ug/kg)
4, 4-DDE 43.51 12.19 10.11 DIELDRIN 6.42 ND(3.94) ND(3.96) 4, 4-DDD 12.16 ND(3.94) ND(3.96) METHOXYCHLOR ND(4.00) 5.17 ND(3.96)
POLYCHLORINATED BIPHENYLS - PCB's (ug/kg)
PCB 1248 100.98 44.52 ND(19.78) PCB 1260 66.18 ND(19.69) 35.21 HEAVY METALS (mg/kg)
CADMIUM 0.185 <0.00745 0.0171 CHROMIUM 1.34 1.05 1.01 COPPER 1.52 0.745 0.392 LEAD 0.167 <0.0552 <0.0560 MERCURY 0.0321 0.0729 0.103 ZINC 67.4 12.2 8.60______________________________________________________________________________
109

DSW/1992-12-8 1992 Black River June 13, 1996
Table C-2. (cont.)_____________________________________________________________________________
SITE#7 SITE#7 SITE#7E BR BL R. E BR BL R. E BR BL R.FULLER RD FULLER RD FULLER RD
RM 3.07 RM 3.07 RM 3.07PARAMETER WHOLE CARP CARP FILLET SM BASS______________________________________________________________________________
LIPID CONTENT (%) 3.52 0.52 0.52
VOLATILE ORGANIC COMPOUNDS - VOC's (ug/kg)
ACETALDEHYDE 109 ND ND PROPANAL 509 ND ND BUTANAL 145 ND ND PENTANAL 309 ND ND HEPTANAL 309 ND ND HEXANAL ND 632 ND
BASE NEUTRAL ACIDS - BNA's (mg/kg)
NO SIGNIFICANT COMPOUNDS FOUND
PESTICIDES (ug/kg)
4, 4-DDE 36.46 8.09 6.78 DIELDRIN 9.97 ND(4.00) ND(1.99) 4, 4-DDD 6.84 ND(4.00) ND(1.99) 4, 4-DDT <4.77 ND(4.00) 2.04 POLYCHLORINATED BIPHENYLS - PCB's (ug/kg)
PCB 1260 20.80 ND(19.98) ND(9.93) HEAVY METALS (mg/kg)
CADMIUM 0.0349 <0.00509 <0.00562 CHROMIUM 1.28 0.865 1.15 COPPER 1.98 0.878 0.320 LEAD <0.0558 <0.0509 <0.0562 MERCURY 0.0744 0.132 0.252 ZINC 76.8 9.31 10.4______________________________________________________________________________
110

DSW/1992-12-8 1992 Black River June 13, 1996
Table C-2. (cont.)_____________________________________________________________________________
SITE#7 SITE#8 SITE#8E BR BL R. W BR BL R. W BR BL R.FULLER RD UPST W 3RD St UPST W 3RD St
RM 3.07 RM 1.3 RM 1.3PARAMETER ROCK BASS CARP FILLET Y BULLHEAD______________________________________________________________________________
LIPID CONTENT (%) 0.52 1.41 1.66
VOLATILE ORGANIC COMPOUNDS - VOC's (ug/kg)
ACETIC ACID, ANHYDRIDE 365 ND ND CARBAMIC ACID 212 ND ND HEXANE 96 ND ND HEXANAL 154 1462 170
BASE NEUTRAL ACIDS - BNA's (mg/kg)
NO SIGNIFICANT COMPOUNDS FOUND
PESTICIDES (ug/kg)
4, 4-DDE 4.30 9.61 15.95 4, 4-DDD ND(2.00) ND(3.99) 5.57 POLYCHLORINATED BIPHENYLS - PCB's (ug/kg)
PCB 1248 ND(9.98) 110.59 61.06 PCB 1260 ND(9.98) 29.70 64.78
HEAVY METALS (mg/kg)
CADMIUM <0.00546 <0.00556 <0.00562 CHROMIUM 0.873 1.31 1.21 COPPER 0.300 0.486 0.489 LEAD <0.0546 <0.0556 <0.0562 MERCURY 0.226 0.220 0.275 ZINC 15.0 10.4 8.40______________________________________________________________________________
111

DSW/1992-12-8 1992 Black River June 13, 1996
Table C-2. (cont.)
_____________________________________________________________________________
SITE#9 SITE#9 SITE#9W BR BL R. W BR BL R. W BR BL R.RUSSIA RD RUSSIA RD RUSSIA RD
RM 4.2 RM 4.2 RM 4.2PARAMETER LM BASS CARP FILLET WHOLE CARP______________________________________________________________________________
LIPID CONTENT (%) 0.50 0.94 3.19
VOLATILE ORGANIC COMPOUNDS - VOC's (ug/kg)
HEXANE 100 ND ND HEXANAL 360 720 4800 PROPANAL ND ND 260 3-METHYL-PENTANE ND ND 340 a-METHYLCYCLOHEXANE ND ND 180 HEPTANAL ND ND 220
BASE NEUTRAL ACIDS - BNA's (mg/kg)
NO SIGNIFICANT COMPOUNDS FOUND
PESTICIDES (ug/kg)
4, 4-DDE 3.50 10.44 25.05 DIELDRIN ND(1.98) ND(3.94) 4.15 4, 4-DDD ND(1.98) 11.39 19.35
POLYCHLORINATED BIPHENYLS - PCB's (ug/kg)
PCB 1260 ND(9.91) ND(19.69) 60.60
HEAVY METALS (mg/kg)
CADMIUM <0.00554 <0.00561 0.0465 CHROMIUM <0.832 <0.842 2.19 COPPER 0.286 0.533 1.17 LEAD <0.0555 <0.0561 0.0637 MERCURY 0.549 0.148 0.101 ZINC 10.5 10.2 65.5______________________________________________________________________________
NOTES:
ND = Not Detectable. Detection limits, if applicable, are given in parentheses.
No detection limits are given for tentatively identified VOC’s, which are determined from GC/MSpeaks. Names listed represent the best fit as determined by library identification by computer. Thename listed is not necessarily the name of the actual compound.Detection limits are based on sample weight, final extract volume, and dilution.All reported VOC’s are non-priority pollutant tentatively identified compounds, with the exceptionof the one asterisked (*) compound.
112

DSW/1992-12-8 1992 Black River June 13, 1996
Table C-3. Concentrations of heavy metals in sediments of the Black River study area, 1992. Allparameter concentrations were ranked based on a stream sediment classificationsystem described by Kelly and Hite (1984). Samples were collected by Ohio EPA andUS EPA-EDO.
______________________________________________________________________________
RiverMile As Cd Cr Cu Fe Pb Zn______________________________________________________________________________
Black River Mainstem14.95 12.3c 14.4d 24.1c 41.1b 23100c 88.4d 120c
10.1 10.9b 1.08c 15.8b 23.5a 20700b 29.6b 118c
5.5 9.6b 3.6 d 39.2d 58b 29700c 43.7c 199d
5.3 17.4d 87.8d 723e 58b 45800e 202e 2060e
4.85 8.6b 3.2 d 39.2d 55.1b 30500c 39.0c 189d
3.8 12.0c 5.9 d 76.3 e 70.4c 44300d 73.9d 273d
3.55 10.8c 1.9c 35.9c 50.4b 38800d 50.5c 174d
3.45 19.5d 3.5 d 39.0d 61.3c 35700d 47.2c 211d
3.4 14.9c 1.4c 37.7c 58.1b 34600d 47.1c 193d
3.3 12.2c 2.4 d 39.5d 58.6b 34000d 44.3c 204d
3.2 12.8c 2.0 d 39.1d 60.8c 40900d 87.1d 202d
3.1 12.6c 2.2 d 38.4d 59.5b 35700d 52.7c 210d
3.0 10.6b 1.2c 29.6c 49.4b 28900c 46.5c 170d
2.58 14.1c 2.7 d 36.2c 57.3b 35000d 46.5c 209d
2.35 13.2c 3.4 d 43.4d 64.2c 37500d 60.0d 236d
0.01 10.5b 0.84b 14.0a 17.4a 18500b 31.4b 103c
French Creek3.2 14.9c 2.88d 59.5d 54.7b 33500d 61.5d 203d
West Branch41.6 9.83b .30a 10.1a 13.4a 14200a 15.8a 49.1a
25.3 2.02a .06a 6.32a 3.85a 4550a <15.8a 25.0a
4.2 10.1b .226a 14.5a 39.6b 21400b 29.3b 77.0a
East Branch18.9 10.4b .133a 11.4a 10.9a 17000a 19.1a 59.5a
11.3 13.6c .07a 13.7a 8.34a 22000b 16.7a 49.4a
0.3 5.48a 3.01d 17.1b 24.9a 9220a 46.3c 88.6b
East Fork of the East Branch2.67 16.1c .10a 12.4a 12.5a 32000c 24.8a 74.9a
Willow Creek2.85 12.4c .157a 10.2a 6.27a 15000a 22.4a 73.6a
Harbor-west side of east breakwall16.8HP 1.36** 26.7MP 32.8MP 29800HP 42.6MP 192MP
------------------------------------------------------------------------------------------------------------------------------------------------------------
113

DSW/1992-12-8 1992 Black River June 13, 1996
Table C-3. (cont.)______________________________________________________________________________
RiverMile As Cd Cr Cu Fe Pb Zn______________________________________________________________________________
Harbor-east side of west breakwall12.6HP 0.91** 16.7N 18.8N 19000MP 27.2N 124MP
Lake Erie-west side of west breakwall12.7HP 1.65** 37.1MP 34.4MP 51100HP 47.8MP 188MP
Lake Erie-east of the confined disposal facility (CDF)8.49HP 0.80** 13.5N 15.7N 16700N 32.9N 183MP
EOLP Least Impacted Sites Mean (12 sites)7.67 0.18 8.23 10.86 17,900 11.6860.3______________________________________________________________________________aNon-elevated; b Slightly elevated; c Elevated; d Highly elevated; e Extremely elevated
Note: The Kelly and Hite classification system addresses relative concentrations but does notdirectly assess toxicity.
US EPA guidelines: (used in this table for the harbor and Lake Erie sites)**lower limits not establishedN non-pollutedMP moderalty pollutedHP heavily polluted
114

DSW/1992-12-8 1992 Black River June 13, 1996
Table C-4. Concentration (mg/kg dry weight) of Base-Neutral-Acid Compounds in the sediments ofthe Black River study area, 1992.a
_____________________________________________________________________________
LocationRiver Phenol 2-Methyl 4-Methyl 2,4-Dimethyl- Napth 2-Methylnap-Mile phenol phenol phenol alene thalene_____________________________________________________________________________
Black River5.5 --- --- --- --- --- ---5.3 --- --- --- --- --- ---4.85 --- --- 1.2 --- --- ---3.8 --- --- --- --- 4J ---3.55 --- --- --- --- .13J .05J3.45 --- --- --- --- 1.1 .55J3.4 --- --- --- --- .42J .09J3.3 --- --- --- --- .12J .03J3.2 --- --- --- --- .85 .14J3.1 --- --- --- --- .1J ---3.0 --- --- .13J --- .1J ---2.58 --- --- --- --- .22J ---2.35 --- --- --- --- .14J ---0.01 --- --- --- --- --- ---
French Creek3.2 --- --- --- --- --- ---
Harbor-west side of east breakwall--- --- --- --- --- ---
Harbor-east side of west breakwall--- --- --- --- --- ---
Lake Erie-west side of west breakwall--- --- --- --- --- ---
Lake Erie-east of the confined disposal area (CDF)--- --- --- --- --- ---
_______________________________________________________________________________________________a J = Estimated Value (compound is present but is less than sample quantitation limit) --- indicates the compound was not found in the sampleA total of 65 Priority Pollutant BNA's were analyzedFor TIC's: The number in ( ) indicates the number of TIC's found up to a maximum of 21 TIC J's = concentration found assuming a 1:1 response
115
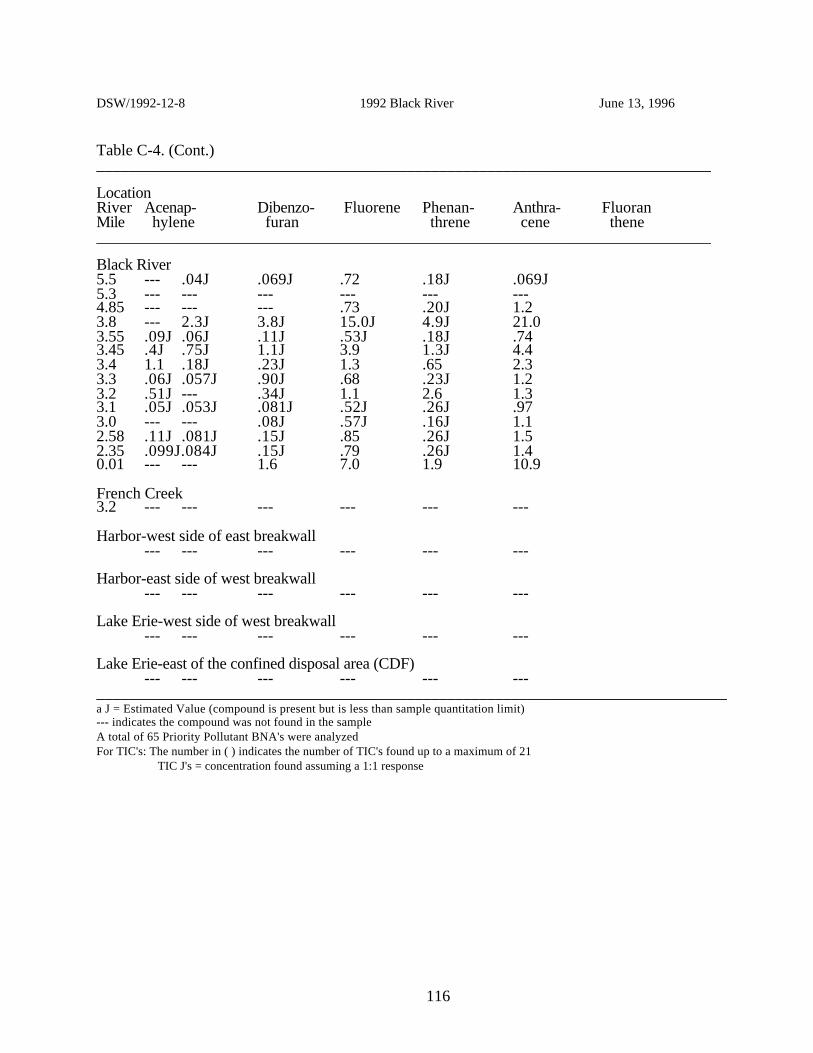
DSW/1992-12-8 1992 Black River June 13, 1996
Table C-4. (Cont.)_____________________________________________________________________________
LocationRiver Acenap- Dibenzo- Fluorene Phenan- Anthra- FluoranMile hylene furan threne cene thene_____________________________________________________________________________
Black River5.5 --- .04J .069J .72 .18J .069J5.3 --- --- --- --- --- ---4.85 --- --- --- .73 .20J 1.23.8 --- 2.3J 3.8J 15.0J 4.9J 21.03.55 .09J .06J .11J .53J .18J .743.45 .4J .75J 1.1J 3.9 1.3J 4.43.4 1.1 .18J .23J 1.3 .65 2.33.3 .06J .057J .90J .68 .23J 1.23.2 .51J --- .34J 1.1 2.6 1.33.1 .05J .053J .081J .52J .26J .973.0 --- --- .08J .57J .16J 1.12.58 .11J .081J .15J .85 .26J 1.52.35 .099J.084J .15J .79 .26J 1.40.01 --- --- 1.6 7.0 1.9 10.9
French Creek3.2 --- --- --- --- --- ---
Harbor-west side of east breakwall--- --- --- --- --- ---
Harbor-east side of west breakwall--- --- --- --- --- ---
Lake Erie-west side of west breakwall--- --- --- --- --- ---
Lake Erie-east of the confined disposal area (CDF)--- --- --- --- --- ---
_______________________________________________________________________________a J = Estimated Value (compound is present but is less than sample quantitation limit)--- indicates the compound was not found in the sampleA total of 65 Priority Pollutant BNA's were analyzedFor TIC's: The number in ( ) indicates the number of TIC's found up to a maximum of 21 TIC J's = concentration found assuming a 1:1 response
116

DSW/1992-12-8 1992 Black River June 13, 1996
Table C-4. (Cont.)_____________________________________________________________________________
LocationRiver PyreneBenzo(a)- Chrysene bis(2- Di-n- Benzo-Mile Anthracene Ethyl-hexyl) Octyl (b)Fluor-
Phthalate Phthalateanthene_____________________________________________________________________________
Black River5.5 1.5 .67J .78 1.2 .11J5.3 1.9J .79J .78J 3.5J ---4.85 1.2 .59J .75 .90 ---3.8 15.0J 7.4J 6.8J 17.0J ---3.55 1.1 .43J .66 .54 .55J3.45 4.2 2.0J 1.8J .91J ---3.4 3.7 2.5 2.4 1.3 ---3.3 1.4 .47J .74 .89 ---3.2 2.5 2.3 2.0 1.1 ---3.1 1.1 .50J .55J .74J ---3.0 .95 .44J .49J .71 ---2.58 1.4 .68 .76 .82 ---2.35 1.4 .66J .73 .94 ---0.01 4.7 2.2 3.3 1.5 --- 5.2
French Creek3.2 --- --- --- --- --- ---
Harbor-west side of east breakwall--- --- --- --- --- ---
Harbor-east side of west breakwall--- --- --- --- --- ---
Lake Erie-west side of west breakwall--- --- --- --- --- ---
Lake Erie-east of the confined disposal area (CDF)--- --- --- --- --- 0.9
_______________________________________________________________________________a J = Estimated Value (compound is present but is less than sample quantitation limit) --- indicates the compound was not found in the sampleA total of 65 Priority Pollutant BNA's were analyzedFor TIC's: The number in ( ) indicates the number of TIC's found up to a maximum of 21 TIC J's = concentration found assuming a 1:1 response
117

DSW/1992-12-8 1992 Black River June 13, 1996
Table C-4. (Cont.)_____________________________________________________________________________
LocationRiver Benzo(k)- Benzo(a)- Indeno Dibenz(a,h) Benzo TIC's-Mile Fluor- Pyrene 1(,2,3-cd) Anthracene (g,h,i)
anthene Perylene_____________________________________________________________________________
Black River5.5 .63J .64J --- --- ---5.3 --- --- --- --- .73J4.85 .62J .64J .31J --- .30J3.8 2.4J 6.7J 4.3J --- 4.2J3.55 .57 .54 .29J --- .28J3.45 1.4J 1.9J .85J --- .69J3.4 3.2 3.1 2.1 .37J 1.83.3 .81 .57J .39J --- .38J3.2 2.8 2.2 1.4 --- 1.23.1 .55J .52J .28J --- .753.0 .21J .50J .16J --- .27J2.58 .49J .72 .50J .86J .32J2.35 .37J .79 .45J .99J .37J0.01 3.6 1.7 --- 2.3
French Creek3.2 --- --- --- ---
Harbor-west side of east breakwall--- --- --- ---
Harbor-east side of west breakwall--- --- --- ---
Lake Erie-west side of west breakwall--- --- --- ---
Lake Erie-east of the confined disposal area (CDF)--- --- --- ---
______________________________________________________________________________a J = Estimated Value (compound is present but is less than sample quantitation limit) --- indicates the compound was not found in the sampleA total of 65 Priority Pollutant BNA's were analyzedFor TIC's: The number in ( ) indicates the number of TIC's found up to a maximum of 21 TIC J's = concentration found assuming a 1:1 response
118

DSW/1992-12-8 1992 Black River June 13, 1996
Table C-5. Concentration (µg/kg dry weight) of PCB’s and Pesticide Compounds in the sedimentsof the Black River study area, 1992.a
_____________________________________________________________________________
LocationRiver 4-4'-DDE 4-4'DDT Aroclor AroclorMile 1248 1260_____________________________________________________________________________
Black River5.5 7.5J 5.3J --- ---5.3 41J --- --- ---4.85 10 4.8J --- ---3.8 --- --- --- ---3.55 11J --- --- ---3.45 13J 7.8J --- ---3.4 13J 11J --- ---3.3 8.5 3.8J --- ---3.2 17J 8.5J --- ---3.1 3.3J 1.4J --- ---3.0 12J 5.9J --- ---2.58 13J 7.7J --- ---2.35 --- --- --- ---0.01 6.21 3.42 --- ---
French Creek3.2 6.55 6.47 --- ---
Harbor-west side of east breakwall3.21 --- --- ---
Harbor-east side of west breakwall2.29 --- --- ---
Lake Erie-west side of west breakwall0.70 --- --- ---
Lake Erie-east of the confined disposal area (CDF)2.07 --- --- ---
_______________________________________________________________________________a J = Estimated Value (compound is present but is less than sample quantitation limit)--- indicates the compound was not found in the sampleA total of 27 Priority Pollutant Pesticide/PCBCompounds were analyzed
119

DSW/1992-12-8 1992 Black River June 13, 1996
Table C-6. Concentration (µg/kg dry weight) of Volatile Compounds in the sediments of the BlackRiver study area, 1992.a
_____________________________________________________________________________
LocationRiver Carbon 1,1-Di- 1,2-Di- 2-Buta- 1,1,1-Tri- BenzeneMile Disulfide chloro- chloro- none chloro-
ethene ethene ethane_____________________________________________________________________________
Black River5.5 --- --- --- 13J --- ---5.3 --- --- --- 20J --- ---4.85 --- --- --- 31 --- ---3.8 --- --- --- 38 --- ---3.55 --- --- --- 17J --- ---3.45 --- --- --- 9J --- ---3.4 --- --- --- --- --- ---3.3 --- --- --- 13J --- ---3.2 --- --- --- 13J --- ---3.1 --- --- --- --- --- ---3.0 --- --- --- --- --- ---2.58 --- --- --- 3J --- ---2.35 --- --- --- 19J --- ---0.01
French Creek3.2
Harbor-west side of east breakwall
Harbor-east side of west breakwall
Lake Erie-west side of west breakwall
Lake Erie-east of the confined disposal area (CDF)_______________________________________________________________________________a J = Estimated Value (compound is present but is less than sample quantitation limit)--- indicates the compound was not found in the sampleA total of 34 Priority Pollutant Volatile Compounds were analyzedFor TIC's: The number in ( ) indicates the number of TIC's found up to a maximum of 21 TIC J's = concentration found assuming a 1:1 response
120

DSW/1992-12-8 1992 Black River June 13, 1996
Table C-6. (Cont.)_____________________________________________________________________________
LocationRiver Tetra- Toluene Chloro- Ethyl Total TICSMile chloro- benzene Benzene Xylenes
ethene_____________________________________________________________________________
Black River5.5 --- 13J --- --- ---5.3 --- --- --- --- ---4.85 --- 34 --- --- ---3.8 --- 3J --- --- ---3.55 --- 3J --- --- ---3.45 --- 12J --- 3J 5J3.4 --- 4J --- --- ---3.3 --- 2J --- --- ---3.2 --- 2J --- --- ---3.1 --- 23J --- --- ---3.0 --- 5J --- --- ---2.58 --- 5J --- --- ---2.35 --- 3J --- --- 2J0.01
French Creek3.2
Harbor-west side of east breakwall
Harbor-east side of west breakwall
Lake Erie-west side of west breakwall
Lake Erie-east of the confined disposal area (CDF)_______________________________________________________________________________a J = Estimated Value (compound is present but is less than sample quantitation limit--- indicates the compound was not found in the sampleA total of 34 Priority Pollutant Volatile Compounds were analyzedFor TIC's: The number in ( ) indicates the number of TIC's found up to a maximum of 21 TIC J's = concentration found assuming a 1:1 response Table C-3
121

DSW/1992-12-8 1992 Black River June 13, 1996
Table C-7. Status of CSO and SSO points associated with the city of Elyria in 1992.______________________________________________________________________________
City of Elyria Collection System Overflows
Location/Type Status______________________________________________________________________________Gulf Road @ Dilworth (SSO) Inactive
Glenwood St. @ Washington (SSO) Inactive
Columbus @ St. Clair (CSO) No Action
Washington Ave. @ Bridge (CSO) No Action(north bank)
Washington Ave. @ Bridge (CSO) Leakage fixed(south bank)
12th Street near Middle Ave. (CSO) No Action
12th Street near Middle Ave. (SSO) Rehabilitated in 1993
Middle Ave. @ 12th (CSO) No Action
Floradale siphon head chamber (SSO) Inactive
West River Rd. @ Turnpike (SSO) Inactivesiphon head chamber
West Bridge St. bridge (SSO) Inactive
West River Rd. between Hazel (SSO) Inactiveand Turner Streets
Dewey Avenue @ Lorain Blvd. (CSO) No Action
Bond St. @ Jefferson St. Alley (CSO) No Action
Foster Ave. between Lake Ave. (SSO) Eliminatedand Adams Street
Furnace St. @ Florence Ct. (CSO) Eliminated
Lake Ave. @ bridge (south bank) (SSO) Inactive
Cascade Ct. @ Lake Ave. (CSO) Eliminated
Lake Ave. @ Tremont St. (CSO) No Action
Fourth Street @ West Avenue (CSO) No Action
West Ave. @ Barres Lane (SSO) Inactive
West Ave. @ Fifth St. (CSO) No Action
______________________________________________________________________________
122

DSW/1992-12-8 1992 Black River June 13, 1996
Table C-7. (Cont.)______________________________________________________________________________
City of Elyria Collection System Overflows
Location/Type Status______________________________________________________________________________
West Ave. @ Elyria H.S. (CSO) No Action
West Ave. @ Ninth St. (CSO) No Action
West Ave. between Oberlin Rd. (SSO) Inactiveand 18th St.
East Ave. @ Fourth St. (CSO) Inactive
East Ave. @ Fourth St. (SSO) No Actionsiphon head chamber
Fifth St. @ East Ave. (CSO) No Action
Sixth St. @ East Ave. (CSO) No Action
East Ave. @ Seventh St. (SSO) Rehabilitated in 1993
East Ave. @ Seventh St. (SSO) Rehabilitated in 1993
Seventh St. @ East Ave. (CSO) No Action
Eighth St. @ East Ave. (CSO) Rehabilitated in 1993
East Ave. @ Eighth St. (SSO) Rehabilitated in 1993
East Ave. between Eighth St. (SSO) Rehabilitated in 1993and Eighth Place
Ninth St. @ East Ave. (CSO) No Action
Gates Ave. @ East Ave. (CSO) No Action
Howe St. East Ave. (CSO) No Action
George St. @ East Ave. (CSO) No Action
Wooster St. (mid) (CSO) No Action
Wooster St. E. of East Ave. (CSO) No Action
1241 East Ave. (CSO) No Action
East Ave. @ George St. (CSO) No Action
East Ave. @ Depot St. (CSO) No Action
Temple Ct. @ East Ave. (CSO) No Action
______________________________________________________________________________
123

DSW/1992-12-8 1992 Black River June 13, 1996
Table C-7. (Cont.)______________________________________________________________________________
City of Elyria Collection System Overflows
Location/Type Status______________________________________________________________________________
Holly Lane @ East Ave. (CSO) No Action
Third St. @ Chestnut St. (CSO) No Action
Second St. @ Water St. (CSO) No Action
Broad St. @ Water St. (CSO No Action
Lincoln @ Blaine (SSO) No Action
East River St. between Smith Ct. (SSO) No Actionand E. Bridge St.
Buckeye St. @ East River St. (CSO) No Action
East River St. @ Denison Ave. (SSO) No Action
East River St. @ Riverdale Ct. (SSO) No Action
East River St. @ Columbia Ave. (SSO) No Action
Sherman St. @ Harvard Ave. (SSO) No Action
Sherman St. @ Cornell Ave. (SSO) No Action
Sherman St. @ Denison Ave. (SSO) No Action
Sherman St. @ Columbia Ave. (SSO) No Action
Park Ave. @ Kenyon Ave. (SSO) No Action
Park Ave. @ Oxford Ave. (SSO) No Action
Park Ave. @ Cambridge Ave. (SSO) No Action
Park Ave. @ Princeton Ave. (SSO) No Action
Park Ave. @ Eastern Hts. Ave. (SSO) No Action
Park Ave. @ Harvard Ave. (SSO) No Action
Park Ave. @ Cornell Ave. (SSO) No Action
Park Ave. @ Denison Ave. (SSO) No Action
Park Ave. @ Columbia Ave. (SSO) No Action
______________________________________________________________________________
124

DSW/1992-12-8 1992 Black River June 13, 1996
Table C-7. (Cont.)______________________________________________________________________________
City of Elyria Collection System Overflows
Location/Type Status______________________________________________________________________________Columbia Ave. between Park Ave. (SSO) No Actionand Garford Ave.
Garford Ave. @ Columbia Ave. (SSO) No Action
Denison Ave. between Park Ave. (SSO) No Actionand Garford Ave.
Fairlawn @ Harvard (SSO) Plugged in 1993
Fairlawn @ Cornell (SSO) Plugged in 1993
Winkles @ Clark (SSO) Inactive
Woodland Ave. @ Foster St. (SSO) Eliminated
Woodland Ave. @ Spruce St. (SSO) Eliminated
Woodland Ave. @ Oak St. (SSO) Eliminated
Woodland Ave. @ Walnut St. (SSO) Eliminated
High St. @ Adams St. (SSO) Eliminated
High St. between Lake Ave. and RR (SSO) Eliminated
840 Livermore (SSO) Eliminated
NW corner Salem & Salem (SSO) Inactive
Gulf Rd. @ Lafayette St. (SSO) Inactive
West River Rd. @ W. Third St. (SSO) Rehabilitated in 1993
Turner St. Alley (SSO) Rehabilitated in 1993
Turner St. @ siphon head chamber (SSO) Rehabilitated in 1993
West end of West Sixth St. (SSO) Rehabilitated in 1993
Between West Sixth St. and Earl Ct. (SSO) Rehabilitated in 1993
West end of Earl Ct. (SSO) Rehabilitated in 1993
Cross St. between Mound St. (SSO) No Actionand Quincy St.
Overbrook Rd. @ West Rd. (SSO) Rehabilitated in 1993
______________________________________________________________________________
125

DSW/1992-12-8 1992 Black River June 13, 1996
Table C-7. (Cont.)______________________________________________________________________________
City of Elyria Collection System Overflows
Location/Type Status______________________________________________________________________________
Winkles south of Cleveland St. (SSO) Rehabilitated in 1993
West Eighth St. Pump Station Improved
Elizabeth St. Pump Station Improved
Mound St. Pump Station Improved
Tannery St. Pump Station Improved
Water St. Pump Station Improved
West River Rd. Pump Station Improved
Pinewood Dr. Pump Station Improved
Greenfield Estates Pump Station Improved
Holiday Inn Pump Station Eliminated
Locust St. Pump Station Improved______________________________________________________________________________
126

DSW/1992-12-8 1992 Black River June 13, 1996
Table C-8. Status of Combined Sewer Overflow points associated with the city of Lorain in1992.
______________________________________________________________________________
City of Lorain Collection System Overflows to the Black River
Location/Type Status______________________________________________________________________________
Idaho Pump Station Unknown
East Ave. & E. 22nd St. Unknown
Broadway & W. 17th St. Unknown
Broadway & W. 12th St. Unknown
Broadway & W. 8th St. Unknown
First Street Siphon Unknown
City of Lorain Collection System Overflows to Lake Erie
Location/Type Status _____________________________________________________________________________
Leavitt Rd. & Grace St. Unknown
Oberlin Ave. & W. 17th St. Unknown
Oberlin Ave. & W. 5th St. Unknown
Hamilton Ave. & 20th St. Unknown
Hamilton Ave. & 19th St. Unknown
Washington Ave. & W. 20th St Unknown
Washington Ave. & W. 5th St. Unknown
Oakdale Ave. & W. 23rd St. Unknown
Oakdale Ave. & W. 18th St. Unknown
Reid Ave. & W. 23rd St. Unknown
Reid Ave. & W. 22nd St. Unknown
Reid Ave. & W. 20th St. Unknown
"G" St. & Euclid Ave. Unknown
E. Erie Ave. & Kansas Ave. Unknown______________________________________________________________________________
127

DSW/1992-12-8 1992 Black River June 13, 1996
Table C-9. Black River basin Waste Water Treatment plants and associated design flows in 1992.______________________________________________________________________________
Black River Basin WWTPs
WWTP Design Flow (mgd),______________________________________________________________________________
Lorain - East 15.00
Elyria 13.00
French Creek 7.50
Oberlin 0.50
Grafton 0.75
Wellington 0.75
Lodi 0.34
LaGrange 0.16______________________________________________________________________________
128