Embed Size (px)
Citation preview

INSTITUTE FOR AGRICULTURE AND FISHERIES RESEARCH
ANKERSTRAAT 1
B-8400 OOSTENDE, BELGIUM
TEL. 059 34 22 50 - FAX 059 33 06 29
WWW.ILVO.VLAANDEREN.BE
ANIMAL SCIENCES UNIT – RESEARCH AREA FISHERIES
Van Hoey Gert, Delahaut Vyshal,
Derweduwen Jozefien, Devriese
Lisa, Dewitte Bavo, Hostens Kris,
Robbens Johan
Chemical monitoring
and Product Technology
Bio-Environmental
Research group
ILVO MEDEDELING 109
February 2012
Biological and chemical effects of the disposal of dredged material in the Belgian Part of the North Sea (licensing period 2010-2011)

2

3
INSTITUTE FOR AGRICULTURE AND FISHERIES RESEARCH
ANKERSTRAAT 1
B-8400 OOSTENDE, BELGIUM
TEL. 059 34 22 50 - FAX 059 33 06 29
WWW.ILVO.VLAANDEREN.BE
ANIMAL SCIENCES UNIT – RESEARCH AREA FISHERIES
ILVO-MEDEDELING 109
Biological and chemical effects of the disposal of dredged material in the Belgian Part of the North Sea (licensing period 2010-2011)

4
Acknowledgments We wish to thank everybody who has contributed to this project and especially the following persons:
- The crew of the research vessel Belgica and Zeeleeuw for their assistance during the sampling campaign.
- Bart Goes, Hans Hillewaert, Jan Wittoeck, Ellen Pecceu, Mattias Bossaer, Lode Jacobs and Marc Van Ryckeghem for sample processing and analyses.
Contact
Dr. Gert Van Hoey, Senior scientist
Institute for Agriculture and Fisheries Research
Animal Sciences Unit – Fisheries Research Area
Ankerstraat 1
B-8400 Oostende, Belgium
Tel. 059 56 98 47 - Fax 059 33 06 29
Copy of the information is allowed with correct referencing:
Van Hoey G., Delahaut, V., Derweduwen J., Devriese L., Dewitte B., Hostens K., Robbens
J. 2011. Biological and chemical effects of the disposal of dredged material in the Belgian Part of
the North Sea (licensing period 2010-2011). ILVO-mededeling 109
Aansprakelijkheidsbeperking Deze publicatie werd door het ILVO met de meeste zorg en nauwkeurigheid opgesteld. Er wordt evenwel geen enkele
garantie gegeven omtrent de juistheid of de volledigheid van de informatie in deze publicatie. De gebruiker van deze publicatie ziet af van elke klacht tegen het ILVO of zijn ambtenaren, van welke aard ook, met betrekking tot het gebruik van de via deze publicatie beschikbaar gestelde informatie.
In geen geval zal het ILVO of zijn ambtenaren aansprakelijk gesteld kunnen worden voor eventuele nadelige gevolgen die voortvloeien uit het gebruik van de via deze publicatie beschikbaar gestelde informatie.

5
CONTENTS 1 Summary .................................................................................................................................................... 7
2 Introduction ............................................................................................................................................. 11
3 Long-term impact of dredged material dumping on the benthic habitats in the Belgian Coastal Zone . 13
3.1 Introduction ..................................................................................................................................... 13
3.2 Material and Method ...................................................................................................................... 14
3.2.1 Description of the study area .................................................................................................. 14
3.2.2 Sampling method ..................................................................................................................... 17
4.2.3 Data analysis ............................................................................................................................ 17
3.3 Results ............................................................................................................................................. 19
3.3.1 Habitat characterization of the dumping sites and control stations ....................................... 19
3.3.2 Long-term pattern (1980-2008); focus on station 7101 .......................................................... 23
3.3.3 Impact at the disposal sites ..................................................................................................... 24
3.3.3.1 Dumping site Nieuwpoort ................................................................................................... 24
3.3.3.2 Dumping site Br&W Oostende ............................................................................................ 25
3.3.3.3 Dumping site Br&W Zeebrugge-Oost .................................................................................. 26
3.3.3.4 Dumping site Br&W S2 ........................................................................................................ 27
3.3.3.5 Dumping site Br&W S1 ........................................................................................................ 27
3.4 Discussion ........................................................................................................................................ 28
3.4.1 Impact of dumping of dredged material on the benthic fauna. .............................................. 28
3.4.2 Evaluation of the monitoring strategies. ................................................................................. 31
3.4.3 Conclusion ............................................................................................................................... 32
4 Biological and chemical status analyze of the disposal of dredged material in the Belgian Part of the
North Sea: period 2009-2010. ......................................................................................................................... 34
4.1 Introduction ..................................................................................................................................... 34
4.2 Material and method ....................................................................................................................... 34
4.2.1 Study area ................................................................................................................................ 34
4.2.2 Sampling and data analysis ...................................................................................................... 36
4.2.2.1 Macrobenthos ..................................................................................................................... 36
4.2.2.2 Epibenthos and demersal fish ............................................................................................. 37
4.2.2.3 Chemical contaminants in sediment and biota ................................................................... 38
4.2.2.4 Biological Effects of Contaminants: Fish diseases and parasites ......................................... 40
4.2.2.5 Biological Effects of Contaminants: EROD activity as biochemical indicator of xenobiotic
substance accumulation. ..................................................................................................................... 41
4.3 Results ............................................................................................................................................. 43
4.3.1 Sedimentology ......................................................................................................................... 43
4.3.1.1 Sedimentological characteristics ......................................................................................... 43
4.3.1.2 Chemical contamination in sediment .................................................................................. 47
4.3.2 Macrobenthos ......................................................................................................................... 57
4.3.2.1 Patterns in Benthic characteristics ...................................................................................... 57
4.3.2.2 Benthic indicator (BEQI) ...................................................................................................... 62
4.3.2.3 Conclusion ........................................................................................................................... 63
4.3.3 Epibenthos and demersal fish ................................................................................................. 64
4.3.3.1 Habitat characterisation ...................................................................................................... 64
4.3.3.2 EPIBENTHOS ........................................................................................................................ 66

6
4.3.3.3 DEMERSAL FISH ................................................................................................................... 70
4.3.3.4 Conclusion Epibenthos and demersal fish ........................................................................... 75
4.3.4 Chemical contamination in biota............................................................................................. 77
4.3.4.1 Introduction ......................................................................................................................... 77
4.3.4.2 Dumping site BR&W Zeebrugge Oost .................................................................................. 78
4.3.4.3 Dumping site BR&W S1 ....................................................................................................... 80
4.3.4.4 Dumping site BR&W S2 ....................................................................................................... 82
4.3.4.5 Dumping site BR&W Oostende ........................................................................................... 84
4.3.4.6 Dumping site BR&W Nieuwpoort ........................................................................................ 86
4.3.4.7 Overview dumping sites ...................................................................................................... 87
4.3.4.8 Conclusion ........................................................................................................................... 88
4.3.5 Biological Effects of Contaminants: Fish diseases and parasites ............................................. 89
4.3.5.1 Introduction ......................................................................................................................... 89
4.3.5.2 Results and Discussion ......................................................................................................... 90
4.3.5.3 Conclusions .......................................................................................................................... 97
4.3.6 Biological Effects of Contaminants: EROD activity as biochemical indicator of xenobiotic
substance accumulation .......................................................................................................................... 98
4.3.6.1 Introduction ......................................................................................................................... 98
4.3.6.2 Results and discussion ......................................................................................................... 99
4.3.6.3 Conclusion ......................................................................................................................... 101
5 An exploration of the biological life in the dredging areas ................................................................... 102
5.1 Introduction ................................................................................................................................... 102
5.2 Material and Method .................................................................................................................... 102
5.2.1 Sampling ................................................................................................................................ 102
5.2.2 Biological analysis .................................................................................................................. 103
5.3 Results ........................................................................................................................................... 104
5.3.1 Macrobenthos ....................................................................................................................... 104
5.4 Conclusion ..................................................................................................................................... 106
6 Optimalization of the sampling strategy in the routine monitoring program ...................................... 107
6.1 Introduction ................................................................................................................................... 107
6.2 Short versus long epibenthos-fish tracks ...................................................................................... 107
6.2.1 Introduction ........................................................................................................................... 107
6.2.2 Material and methods ........................................................................................................... 108
6.2.3 Results ................................................................................................................................... 109
6.2.4 Conclusion ............................................................................................................................. 111
6.3 Fixed versus live sieving ................................................................................................................. 112
6.4 Quality control macrobenthos analysis (accreditation) ................................................................ 114
7 REFERENCES ........................................................................................................................................... 115
8 ANNEX 1 ................................................................................................................................................. 118

7
1 Summary
It is important to investigate the effects of dumping of dredged material in the marine
environment from ecosystem perspective, because it could lead to different responses of the
ecosystem. Therefore, the regular dredging program from ILVO Fisheries is evaluating the impact
of these dumping activities at different levels by looking at: i) differences in biological
characteristics of the ecosystem components macrobenthos, epibenthos and demersal fish ii) the
(bio)accumulation of contaminants in the marine ecosystem as investigated by chemical analysis
of sediment and different biota species iii) biological effects of pollutants on marine organisms as
indicated by the prevalence of fish diseases and by the measurement of enzymatic EROD
activities in the liver of juvenile dab. We also conducted a study on the long term impact of
dredged material dumping on the benthic habitats in the Belgian Coastal Zone. Secondly, we
explored the benthic life in the dredging area’s itself. Thirdly, we investigated the effect of some
adaptations in the ecological sampling strategy of the routine monitoring program.
Long term impact of dredged material dumping on the benthic habitats
A long term analysis of changes in the benthic habitat characteristics in relation to the
dumping intensity is executed at the five dumping sites. At ILVO, a benthic sampling program is
running from 1978 onwards and changed strongly over this period, with a clear impact/control
sampling strategy at each dumping site in the last years (2004 onwards). Previously, only a
monitoring point inside the dumping zone Br&W S2 is followed up. Based on the multivariate
analysis, we detected a transition in species assemblage. This changes in species composition
can be attributed to the absence of mud loving species in the recent period. The average density
and species richness were also significantly lower in the latest period (‘01-‘08) compared to the
previous ones (’85-’90; ’93-’00). These observed patterns coincide with a decrease in the
dumping intensity in the recent period (’01-’08). We can conclude that dumping at Br&W S2 has a
small positive effect, by supply of mud and organic matter to the more sandy environment. This
species enrichment pattern at Br&W S2 is observed again in the monitoring of 2010 (see further).
The dumping activities at the five disposal sites have lead to benthic habitat changes at
dumping site Br&W S1, while at the other sites, the benthic community seems to cope with the
existing dumping regime. Especially in naturally more impoverished areas (dumping site Br&W
Zeebrugge-Oost & Br&W Oostende), the impact is less pronounced than in more vulnerable
benthic habitats (e.g. Abra alba habitat or sandy environments). We suggest that if an impact is
detected, this is mainly related to the physical burial of the organisms (smothering, incorporation),
or to the properties of the dredged-disposal (mud in more sandy areas), both causing habitat
modifications.
Biological and chemical status of the disposal sites in the Belgian Part of the North Sea:
2009-2010
Biological status
The ecological status of the macrobenthos at the different disposal sites is evaluated with
the benthic indicator BEQI. The observed patterns confirm those of the previous years. The
8
medium to high dumping intensity at Br&W Oostende and Br&W Zeebrugge Oost has no effect on
the macrobenthic community. At dumping site Nieuwpoort however, the macrobenthic
characteristics showed a high variability which could not be attributed to the low dumping activity.
At Br&W S1, where the highest dumping activities occur, a steady loss of Abra alba habitat could
still be observed in the dumping area. The tube building polychaete Owenia fusiformis however,
has exponentially increased in the surrounding area. Despite the ‘good status’ of Br&W S2, some
remarkable changes in the macrobenthic community appeared. The benthic characteristics of the
samples indicate an enrichment of the Northern samples with mud ‘loving’ species, whereas the
samples in the western part are more impoverished (lower diversity). If this could be attributed to
the higher dumping intensities over the period 2009 (focus on Northern part) – 2010 (focus on
Western part) than in previous years is not unambiguous. Still, this should be confirmed by further
detailed analyses.
For the epibenthic and demersal fish fauna, no effects of dumping were clearly visible. This
could be explained by the fact that most of those species have a high mobility and are able to flee
from the dumping sites. Another possibility is the fact that the statistical power (due to a low
number of samples caused by a switch in sampling strategy) was too low to detect any possible
effects. Nevertheless, some significant differences in the epibentic and demersal fish
characteristics occurred, probably due to a temporary dominance of certain species (e.g. starfish,
brittlestar and goby) and/or by the natural variability of the habitat (e.g. dumping site Nieuwpoort).
For future research, it is advisable to investigate the effect of dumping on certain functional or
sensitive species.
Chemical status
Sediment Assessment
During the period 2009-2010, only small variations between impact and control assessment
are observed for the measured parameters heavy metals, PCBs and pesticides. No major
differences between the diverse dumping areas are noticed based on the assessment of
sediment samples. Nevertheless, the levels of lead and PCBs must be followed in future since
EAC values (OSPAR, MSFD, Belgisch Staatsblad) were approached or even exceeded at both,
impact and control sites. Other measured heavy metals and persistent organic pollutants do not
approach the formulated EAC values.
Accumulation of Pollutants in Marine Organisms
Chemical analysis was performed on diverse sentinel species to assess the
(bio)accumulation level of persistent organic pollutants and heavy metals. Due to the
omnipresence in the marine environment and relevance in the ecosystem, mainly starfish and
brown shrimp were used to evaluate the chemical health status of the different dumping sites.
Based on the accumulated levels of POPs and heavy metals in marine biota species during
2009-2010, it can be concluded that differences in contamination between control and impact
areas for dredge disposal sites are limited. The PAH levels were slightly elevated on the impact
areas of dredge deposit sites Br&W Zeebrugge Oost, Br&W Oostende and Br&W S1 compared to
the control areas. Based on the assessment of accumulation, dumping site Br&W Oostende could
be distinguished from the other dumping sites based on higher levels of contamination in starfish.

9
Biological Effects of Pollutants
Externally visible fish diseases (e.g. ulcers, skeletal deformations, nodules, lymphocystis)
and parasite infection were used as parameter for environmental stress and environmental health
status. Most anomalies were due to parasitical infections and did show high variation in spatial
and temporal distribution. The observed prevalence of Glugea stephani and Acanthochondria
cornuta in the period 2009-2010 (the dumping site vs the coastal reference zone) was remarkably
higher compared to the mean prevalence over the period 2000-2010. These diseases must be
followed strictly in future .
Secondly, the biomarker EROD (7-ethoxyresorufin O-deethylase) activity is used as an
indicator of xenobiotic substance accumulation in the flatfish dab (OSPAR indicator). The EROD
induction in the liver of juvenile dab is clearly visible during winter and early spring, while during
summer and autumn only a background level is recorded. During the period 2009-2010, no
significant higher EROD activity on impact sites versus control sites was observed.
An exploration of the biological life in the dredging areas
One of the aspects that was not studied in the previous decade was the biological life in the
dredging areas, especially in the gullies towards the harbor of Zeebrugge and the harbor itself. 48
benthic taxa were recorded in the dredging areas of Zeebrugge, whereof 27 (56%) taxa were only
recorded once. Most taxa were found in the gullies towards Zeebrugge and only a few taxa (9;
Cirratulidae spp, Oligochaeta spp, Nephtys juvenile, Mytilus edulis, Streblospio benedicti, Abra
alba, Macoma balthica, Anthzoa spp, Crangon crangon) in the harbor itself. Not one of the
observed species was a rare taxon within the benthic fauna on the BPNS. We can conclude that
the dredging areas around Zeebrugge were characterised by a very poor benthic community,
except for the ‘Vaargeul 1’ area. Input of benthic animals from the dredging areas towards the
dumping areas is possible, but should not lead to species enrichments in the dumping zones, due
to the low densities and species richness in the dredging areas.
Optimalization of the sampling strategy in the routine monitoring program
In the period 2009-2011, we invested in the optimalization of the ecological sampling
strategy of the routine monitoring program at the dredge disposal sites. This was carried out to
standardize the analysis according to European directives (e.g. MSFD) and to make the
monitoring time and cost efficient. We adjusted the sampling protocol of the epibenthos and fish
tracks (shortening of the duration) and the benthic sieving procedure (alive instead of fixated).
Finally, we introduced quality assurance in the macrobenthos analysis (ISO 16665:2005) by
achieving a BELAC accreditation certificate under ISO17025 norm.
Concerning the changes in the duration of the epibenthos and fish tracks, we observed that
the rate of overestimation or underestimation varied between tracks and between species groups.
This difference plays no part when tracks of similar kind (short) are taken and compared within
the same time frame. A clear advantage of using short tracks in the dredge disposal research is
the fact that the tracks fit within the borders of the dumping site. Like this, side effects are
minimized and the short tracks seem to result in more reliable density and diversity estimates of
the area.

10
Sieving alive has a clear negative influence on the density and species richness of the
samples, compared to sieving fixed. Based on analyses, we can trust that data retrieved when
sieving alive on a 0.5 + 1mm sieve is comparable with data retrieved for fixed sieving. Therefore,
we can consider that this switch in sieving procedure will have a minor influence on the long term
trend analysis at the benthic control stations. Since sieving with two sieves is only used at a
certain subset of stations, we have to use conversion factors for analyzing a long term trend at
the other stations.
Perspectives
In the ecological monitoring program, we will keep the current monitoring strategy, because
it seems suitable to evaluate changes within the dumping area and its surroundings. By high
dumping intensities, leading to habitat modifications, a clear impact is detected on the overall
benthic characteristics (density, diversity). In the future, it is advisable to investigate the possible
loss of the ecosystem functioning by this habitat modifications, by using functional traits analysis.
Secondly, we have to consider the possibility to determine a critical boundary of dumping intensity
leading to a certain impact.
In the chemical monitoring program, it will be a necessity to investigate the general toxicity
of the environment. General toxicity tests will give information about the presence and
bioavailability of toxic compounds in the environment. In addition to the assessment of fish
diseases, it would be of main importance to monitor the general health of fish species, e.g.
gonadosomatic index (GSI), quality index method (QIM), liver glycogen content (LGC), liver-
somatic index (LSI), condition index (k), etc.

11
2 Introduction
Dredging and dumping of dredged material is one of the major human activities in the
coastal area of the Belgian part of the North Sea (BPNS). This activity is necessary to maintain
the accessibility for ships within and towards the Belgian harbors (Nieuwpoort, Oostende,
Blankenberge and Zeebrugge). The main dredging works in Belgium are executed in the harbor
of Zeebrugge and in its access channel. The dredged material is dumped at five dumping sites in
the coastal area of the BPNS: 1) dumping site Br&W S1, 2) dumping site Br&W Zeebrugge Oost,
3) dumping site Br&W S2, 4) dumping site Br&W Oostende and 5) dumping site Nieuwpoort
(Figure 11). The dumping intensity at the five sites differs considerably within the study period,
and depends on their position with respect to the dredging zones. Br&W S1 and Br&W Zeebrugge
Oost were the most intensively used sites, with nearby 5 million tons dry matter at average per
year. There was a moderate use of the dumping site Br&W S2 and Br&W Oostende, varying
between 500.000 and 1 million tons dry matter per year. The dumping intensities were lowest at
Nieuwpoort, and varied around 100.000 tons dry matter per year.
Figure 1. The potential environmental impacts of marine dredged material disposal – a conceptual model with indication of the research focus points in the ILVO monitoring program (adapted from Elliott & Hemingway, 2002)
It is important to investigate the effects of dumping of dredged material in the marine
environment from ecosystem perspective, because it could lead to different responses of the
ecosystem . The dumping itself has its consequences on the state of the water column and the
seabed. The main effects within the water column lead to changes in the turbidity, which could be
responsible for changes in the primary production and the release of materials (contaminants and
organic material (Figure 1). The sediment input towards the seabed leads to habitat
creation/modification, smothering of the fauna and changes in bathymetry. A side effect could be
the influx of organisms, especially when the fauna in the dredging area is different from the
dumping area.
12
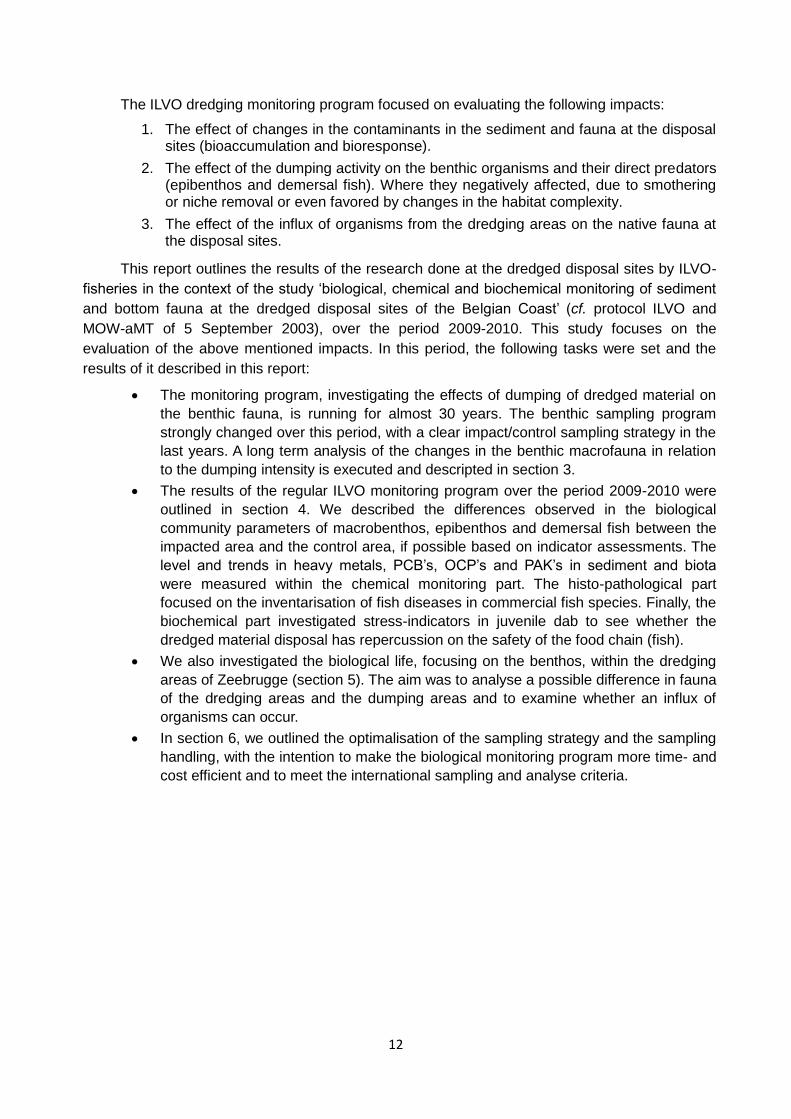
The ILVO dredging monitoring program focused on evaluating the following impacts:
1. The effect of changes in the contaminants in the sediment and fauna at the disposal sites (bioaccumulation and bioresponse).
2. The effect of the dumping activity on the benthic organisms and their direct predators (epibenthos and demersal fish). Where they negatively affected, due to smothering or niche removal or even favored by changes in the habitat complexity.
3. The effect of the influx of organisms from the dredging areas on the native fauna at the disposal sites.
This report outlines the results of the research done at the dredged disposal sites by ILVO-
fisheries in the context of the study ‘biological, chemical and biochemical monitoring of sediment
and bottom fauna at the dredged disposal sites of the Belgian Coast’ (cf. protocol ILVO and
MOW-aMT of 5 September 2003), over the period 2009-2010. This study focuses on the
evaluation of the above mentioned impacts. In this period, the following tasks were set and the
results of it described in this report:
The monitoring program, investigating the effects of dumping of dredged material on
the benthic fauna, is running for almost 30 years. The benthic sampling program
strongly changed over this period, with a clear impact/control sampling strategy in the
last years. A long term analysis of the changes in the benthic macrofauna in relation
to the dumping intensity is executed and descripted in section 3.
The results of the regular ILVO monitoring program over the period 2009-2010 were
outlined in section 4. We described the differences observed in the biological
community parameters of macrobenthos, epibenthos and demersal fish between the
impacted area and the control area, if possible based on indicator assessments. The
level and trends in heavy metals, PCB’s, OCP’s and PAK’s in sediment and biota
were measured within the chemical monitoring part. The histo-pathological part
focused on the inventarisation of fish diseases in commercial fish species. Finally, the
biochemical part investigated stress-indicators in juvenile dab to see whether the
dredged material disposal has repercussion on the safety of the food chain (fish).
We also investigated the biological life, focusing on the benthos, within the dredging
areas of Zeebrugge (section 5). The aim was to analyse a possible difference in fauna
of the dredging areas and the dumping areas and to examine whether an influx of
organisms can occur.
In section 6, we outlined the optimalisation of the sampling strategy and the sampling
handling, with the intention to make the biological monitoring program more time- and
cost efficient and to meet the international sampling and analyse criteria.

13
3 Long-term impact of dredged material dumping on the benthic habitats
in the Belgian Coastal Zone
This chapter was made by Vyshal Delahaut in function of his master thesis in Marine and Lacustrine Science (academic year 2009-2010) and slightly adapted for this report.
3.1 Introduction
Approximately 11,000,000 tonnes dry matter (TDM) of sediments are disposed yearly at five
designated dumping sites on the Belgian part of the North Sea (BPNS). The majority of these
sediments derive from the so called maintenance dredging works. These are carried out on a
regular basis and are necessary to keep the ports, harbours and channels functional for shipping
traffic. To a lesser extent, sediments emerge from capital dredging works, as a result of
deepening of channels and ports, or the construction of pipelines and cables. An alternative for
dumping the dredged material at sea, is to use the sediments for beneficial purposes, such as
shoreline stabilization, erosion control, construction material, .... (Paipai et al., 2003); which is not
a common practice on the BPNS.
International agreements, such as the London convention (1972), the OSPAR convention,
the Environmental Impact Assessment Directive (97/11/EEC), the Habitat and Species Directive,
the Wild Birds Directive (79/409/EEC) and Strategic Environmental Assessment Directive
(85/337/EEC) have to be taken into account before licenses for the disposal of dredged material
at sea are granted. The legal basis for these activities on the BPNS can be found in the “MMM-act
of 20 January 1999 on the protection of the marine environment in maritime areas under Belgian
jurisdiction”. The procedure to obtain authorization to dump dredged-material is summarized in
the Royal Decree of 12 March 2000.
Macrobenthic species are closely associated with the sediment and play an important role
in marine ecosystems. They have been found to clearly reflect environmental changes in and
near the bottom of the sea (Bilyard, 1987). Therefore, they have been shown to serve as valuable
bio-indicators to monitor human activities, such as the disposal of dredged-material (Wildish and
Thomas, 1985; Bilyard, 1978; Soule et al., 1988; Rees et al., 1992; Simonini et al., 2005; Rees et
al., 2006). A possible impact may be merely of a physical nature, since organisms get buried
immediately after a dumping event (cf. changes in foraging capacity, mobility,...; Morton, 1977).
Additionally, the properties of the dumped sediments (e.g. mud content, median grain size), could
contribute to a biological impact (Maurer et al., 1981; Maurer et al., 1982; Maurer et al., 1983).
Chemical contamination of the sediments, organic enrichment or increased turbidity, has also
been shown to affect the benthic organisms (Delvalls T. A. et al., 2004; Ware et al., 2009; Essink,
1999) (Figure 1). Since benthic species differ in susceptibility towards disturbance, the results of
impact evaluation studies will be determined by the benthic community present at a given
dumping site. More specifically it is indicated that species assemblages, adapted to a certain
degree of stress, will recover faster after a disturbance event than assemblages occurring in an
unstressed environment. The former ones are usually characterised by life-history traits,
facilitating the recolonisation process (opportunistic species) (Bolam et al., 2003). The sampling
design (number of samples and the degree of coverage of the study area) and the selected
parameters contribute to the reliability of the obtained results. All these factors, together with the

14
natural variability of the benthic communities, need to be taken into account, when a conclusion
regarding the impact is drawn.
The ILVO (Institute for Agriculture and Fisheries Research) has a monitoring program to
follow up disposal activities at the BPNS. Since 1979, two annual sampling campaigns are carried
out, providing a large set of biological and sediment data, which were used for this study. We
distinguish three sampling strategies in the history of the monitoring program. From 1979 until
2003, samples were taken at a limited number of stations on the BPNS. Each of these stations
functioned as a reference station for nearby disposal sites, although not all disposal sites were
operational. One exception is dumping site S2, since it already had a monitoring point inside the
dumping zone since 1979. In 2004-2005, the former strategy was exchanged towards a control-
impact strategy. From then onwards, each dumping site had one internal station (=disposal
station) and one or two stations outside (=nearby-reference station) the dumping area. At the
same time, additional sampling continued at the previously used reference stations. Since 2006,
the sampling intensity was markedly increased, and each disposal site nowadays has 7 disposal
and 4 to 6 nearby-reference stations.
The aim of this section is to address two main questions:
I. What is the relationship between the degree of dumping intensity on the one hand and the
presence and diversity of the marine benthos on the other hand?
a. At long-term scale (e.g. the natural patterns or shifts over long-term)
b. On Control/impact design scale.
II. Do the different sampling designs have a different capacity in reflecting a possible impact
of the dumping activity? Where the selected reference stations optimal for impact evaluation?
3.2 Material and Method
3.2.1 Description of the study area
The Belgian part of the North Sea (BPNS) has a surface area of 3454 km² and is situated in
the southern part of the North Sea. Average depths are approx. 20 meters, with maximal depths
of 35 meters. The main current has a SW-NE direction and turns into the open ocean. The area
exhibits a high geomorphologic diversity (Degraer et al., 2008) due to the presence of a series of
sandbanks orientated parallel to the coastline. This results in a wide variety of sediment types.
Previous studies showed that this abiotic diversity create for the benthic ecosystem, a set of four
macrobenthic habitats; the Abra alba habitat, the Nephtys cirrosa habitat, the Ophelia limacina
habitat and the Macoma balthica habitat, which are mainly linked to certain sediment
characteristics (cf. grain size and mud content,...; Van Hoey et al., 2004; Degraer et al., 2008).
This section focused on the dredged disposal sites situated in the coastal area of the BPNS.
The samples used in this study were collected from (1) stations associated with current
designated dumping sites (Nieuwpoort, Br&W Oostende, Br&W Zeebrugge Oost, Br&W S1 and
Br&W S2) (2) stations associated with two former dumping sites (S3 and R4) and (3) 12 coastal
reference stations on the BPNS (Table 1, Figure 2). The sampling of each station did not start at
15
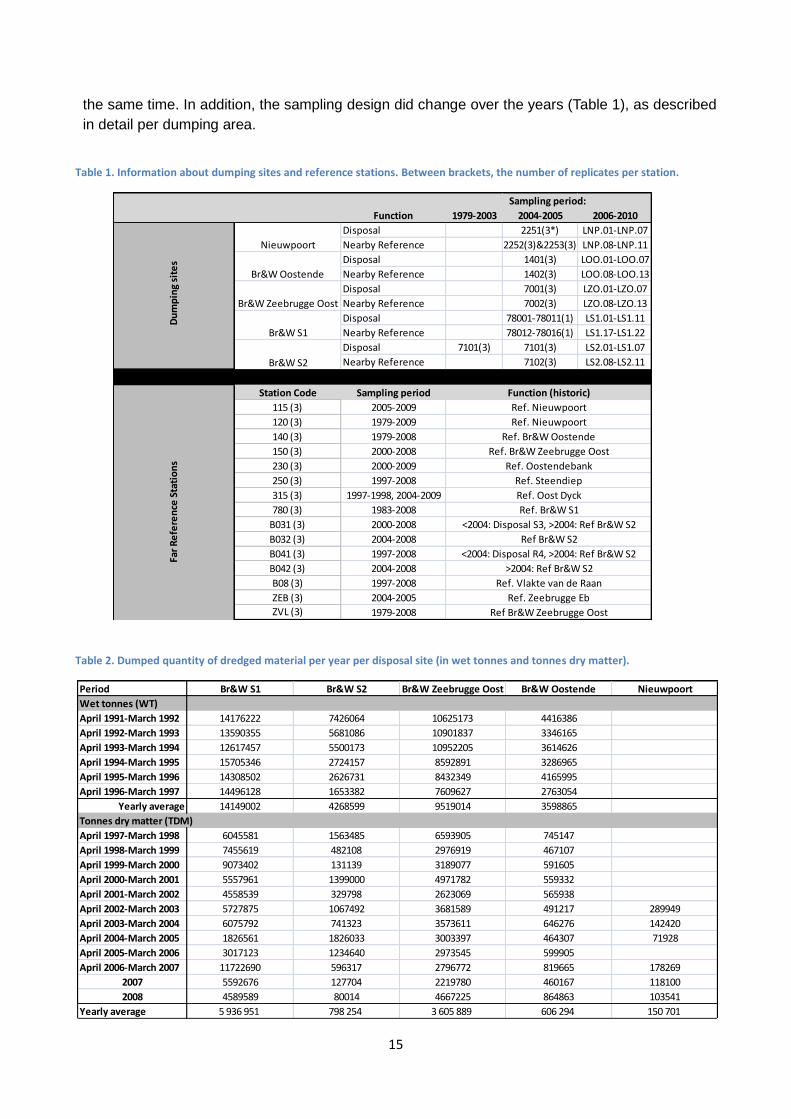
the same time. In addition, the sampling design did change over the years (Table 1), as described
in detail per dumping area.
Table 1. Information about dumping sites and reference stations. Between brackets, the number of replicates per station.
Table 2. Dumped quantity of dredged material per year per disposal site (in wet tonnes and tonnes dry matter).
Function 1979-2003 2004-2005 2006-2010
Disposal 2251(3*) LNP.01-LNP.07
Nearby Reference 2252(3)&2253(3) LNP.08-LNP.11
Disposal 1401(3) LOO.01-LOO.07
Nearby Reference 1402(3) LOO.08-LOO.13
Disposal 7001(3) LZO.01-LZO.07
Nearby Reference 7002(3) LZO.08-LZO.13
Disposal 78001-78011(1) LS1.01-LS1.11
Nearby Reference 78012-78016(1) LS1.17-LS1.22
Disposal 7101(3) 7101(3) LS2.01-LS1.07
Nearby Reference 7102(3) LS2.08-LS2.11
Station Code Sampling period
115 (3) 2005-2009
120 (3) 1979-2009
140 (3) 1979-2008
150 (3) 2000-2008
230 (3) 2000-2009
250 (3) 1997-2008
315 (3) 1997-1998, 2004-2009
780 (3) 1983-2008
B031 (3) 2000-2008
B032 (3) 2004-2008
B041 (3) 1997-2008
B042 (3) 2004-2008
B08 (3) 1997-2008
ZEB (3) 2004-2005
ZVL (3) 1979-2008
Ref. Br&W Zeebrugge Oost
Ref. Oostendebank
Ref. Steendiep
Ref. Oost Dyck
Far
Re
fere
nce
Sta
tio
ns
Ref. Vlakte van de Raan
Ref. Zeebrugge Eb
Ref Br&W Zeebrugge Oost
Ref. Br&W S1
<2004: Disposal S3, >2004: Ref Br&W S2
Ref Br&W S2
<2004: Disposal R4, >2004: Ref Br&W S2
>2004: Ref Br&W S2
Function (historic)
Ref. Nieuwpoort
Ref. Nieuwpoort
Ref. Br&W Oostende
Sampling period:
Du
mp
ing
site
s
Nieuwpoort
Br&W Oostende
Br&W Zeebrugge Oost
Br&W S1
Br&W S2
Period Br&W S1 Br&W S2 Br&W Zeebrugge Oost Br&W Oostende Nieuwpoort
Wet tonnes (WT)
April 1991-March 1992 14176222 7426064 10625173 4416386
April 1992-March 1993 13590355 5681086 10901837 3346165
April 1993-March 1994 12617457 5500173 10952205 3614626
April 1994-March 1995 15705346 2724157 8592891 3286965
April 1995-March 1996 14308502 2626731 8432349 4165995
April 1996-March 1997 14496128 1653382 7609627 2763054
Yearly average 14149002 4268599 9519014 3598865
Tonnes dry matter (TDM)
April 1997-March 1998 6045581 1563485 6593905 745147
April 1998-March 1999 7455619 482108 2976919 467107
April 1999-March 2000 9073402 131139 3189077 591605
April 2000-March 2001 5557961 1399000 4971782 559332
April 2001-March 2002 4558539 329798 2623069 565938
April 2002-March 2003 5727875 1067492 3681589 491217 289949
April 2003-March 2004 6075792 741323 3573611 646276 142420
April 2004-March 2005 1826561 1826033 3003397 464307 71928
April 2005-March 2006 3017123 1234640 2973545 599905
April 2006-March 2007 11722690 596317 2796772 819665 178269
2007 5592676 127704 2219780 460167 118100
2008 4589589 80014 4667225 864863 103541
Yearly average 5 936 951 798 254 3 605 889 606 294 150 701

16
Disposal site Nieuwpoort (Nieuwpoort, Figure 2) is situated between Nieuwpoort and
Oostende, 8 kilometers offshore. It has a diameter of 1500 meters and is used since 2002. With a
yearly average dumping amount of merely 113,798 (+46,046) tonnes of dry matter (TDM) over
the period 2002-2008, it is also the least used disposal site of the BPNS (Table 2). The disposed
sediments derive from the harbor of Nieuwpoort and its access channel. The history of the
monitoring program at this site consists of no impact monitoring before 2004, followed by a
control/impact design afterwards (1 impact/2 control samples in 2004-2005 and 7 impact/4 control
samples in 2006-2008). The selected far reference stations for dumping site Nieuwpoort in the
monitoring program were 120 and 115, situated in the “Westdiep area” (Table 1, Figure 2).
Disposal site Oostende (Br&W Ooostende, Figure 2) is situated just outside the harbour at 4
kilometers from the coast and has a diameter of 1500 meter. During the last eight years this
dumping site has moved twice (in 2002 and 2004). Over the period 1997-2008, the disposal site
Oostende received an average yearly amount of dredged disposal of 606,294 (+40,027) TDM
(Table 2). Sediments derive from maintenance dredging works, such as the deepening of the
access channel to Oostende or the harbor itself. Intensity maps of 2004-2008 indicate that the
sediments are not disposed evenly, but that the majority is dumped at the south-western part
(ANNEX 1). The history of the monitoring program at this site consist of no impact monitoring
before 2004, followed by a control/impact design afterwards (1 impact/1 control sample in 2004-
2005 and 7 impact/6 control samples in 2006-2008). The selected far reference stations for Br&W
Oostende in the monitoring program was 140 (Table 1, Figure 2), which was relocated to the west
in 2002.
Dumping site Zeebrugge Oost (Br&W Zeebrugge Oost, Figure 2) is situated nearby the
harbor of Zeebrugge at the eastern site, 2 km offshore and has a diameter of 1500 meter. The
dumped sediments mainly derive from the harbors of Zeebrugge or Blankenberge. With an
average of 3,605,889 (+356,766) TDM (Table 2)) of sediments yearly (based on data from the
years 1997-2008), dumping site Zeebrugge Oost is the second most used dumping site. The
western part received more sediments than the eastern part over the period 2004-2008 (ANNEX
1). The history of the monitoring program at this site consists of no impact monitoring before
2004, followed by a control/impact design afterwards (1 impact/1 control in 2004-2005 and 7
impact/6 control in 2006-2008). The selected far reference stations for Br&W Zeebrugge Oost in
the monitoring program were 150 and ZVL (Table 1, Figure 2).
Dumping site Br&W S2 (Figure 2) is situated on the western part of the “Vlakte van de
Raan”, nearly 11 km offshore. The legally permitted dumping area has the shape of a semi-circle,
with a radius of 1500 meter. The sediments are derived from “Pas van Zand”, the “Central part of
the outer harbor of Zeebrugge”, “Scheur Oost” and “Scheur West”. With an average dumping
amount of 798,254 (+174,254) TDM (Table 2)) yearly (based on data from 1997-2008), this site is
used to a lesser extent as compared to the other disposal sites. According to intensity maps of
2004-2008 (ANNEX 1), the dumped sediments are more or less equally distributed over the
disposal area. The history of the monitoring program at this site consist of long-term monitoring at
station 7101 (LS2-01) (since 1980), which is located at the border of the dumping site, followed by
a control/impact design from 2004 (1 impact/1 control sample in 2004-2005 and 7 impact/4
control samples in 2006-2008). Since 2004, the stations B031, B032, B041 and B042 are
selected as the far reference stations for Br&W S2 (Table 1, Figure 2). The first two served as
impact and control stations for the former back-up dumping site S3, while the latter two were
impact and control stations for back-up dumping site R4, but both were never used.

17
Dumping site Br&W S1 is situated at a distance of 17 kilometers off the coast (Figure 2) and
has a diameter of 3000 meters. The location of S1 is changed over the years towards the gully of
the Akkaert bank. The site mainly receives sediments from “Pas van Zand”, the “Central part of
the outer harbor of Zeebrugge”, “Scheur Oost” and “Scheur West”. This site is very frequently
used (average yearly amount: 5,936,951 +754,238 TDM, based on data from 1997–2008, Table
2). Dumping intensity maps show that the south-western part has been used more often during
certain years, while the distribution of sediments occurred more equally during some other years
(ANNEX 1). The dumping site has been sampled applying a detailed control-impact strategy since
autumn 2004 (11 impact/5 control samples), whereas no monitoring was executed in the previous
years. The 5 nearby-control stations were positioned more nearby the dumping area in 2006. The
station 780 and 120 were selected as the far reference stations for Br&W S1.
3.2.2 Sampling method
Macrobenthos can be defined as organisms that spend most part of their life in the
sediment, and that are retained on a 1 mm-meshed sieve. Table 1 shows the number of samples
taken at each station (number between brackets). Macrobenthic samples were collected with a
Van Veen grab (0.1 m²) on board of the marine vessel, the Belgica. They were immediately fixed
with an 8% formaldehyde seawater solution. The samples were afterwards sieved on a 1mm
sieve. The residue was stained with eosin in order to facilitate further sorting. Species were
identified to the lowest, possible taxonomic level (species) and counted.
A separate Van Veen sample was taken at each station for granulometric analysis and
chemical analysis of the sediment for the period 1979-2005. Since 2006 a single Perspex® core
was taken from each Van Veen sample for further particle size analysis. These samples were
dried in an oven at 60°C. From 1979 to 2006, a sieve tower was used for sediment analyses.
Since 2007, sediment analyses were conducted using the Malvern Mastersizer 2000 analyzer
following a standardized protocol.
4.2.3 Data analysis
The species dataset was standardized by lumping some species (Cirratulidae spp., Spio
spp., Anthozoa spp.), and reduced by excluding species that did not belong to the macrobenthos
sensu strictu (e.g. Mysida). Nematoda were excluded because of inadequate sampling
techniques for quantifying meiofauna.
The multivariate analyses were performed by using version 6 of the PRIMER software
package (Plymouth Routines In Multivariate Ecological Research, Clarke and Gorley, 2006). Prior
to specific analyses, the few outlier samples (10) were identified and removed by conducting a
non-metric Multi-Dimensional Scaling (nmMDS). Biological data was fourth-root transformed and
the resulting dataset was used to create a Bray-Curtis similarity matrix. In order to create
significantly different groups for further analyses, a group average cluster analysis with SIMPROF
test (Similarity profile, test for structure in the data) was performed. Characteristic species for the
different clusters were identified using the SIMPER function (Similarity/distance percentages,

18
species/variable contributions). Analysis of similarity (ANOSIM) was used to detect possible
differences in species composition within and between the sampled locations for four possible
structuring factors (cluster name, year, season (winter, autumn) and station type (impact, nearby
and far away control stations)). In addition, a 2-d ordination plot from the nmMDS’s provided a
visual representation.
Figure 2. Map of the study area. Red squares represent the disposal and nearby-reference stations of the period 2004-2005 (in most cases identical to one of the disposal and nearby reference stations of the period 2006-2008). Black squares represent the first set of nearby –reference stations of dumping site S1.

19
Univariate analyses were executed with the software package R, version 2.10.1. The
parameters used were; density, species number (S) and Hill’s (1973) diversity and eveness
indices (N1 and N2), computed from the standardized dataset. ANOVA analyses were carried out
in order to detect significant differences in space and time. Post-hoc analysis was performed with
the TukeyHSD-test. To meet the assumptions for parametric analysis, data was log-transformed
where needed. If assumptions for parametric tests were not met, a Kruskal-Wallis test was
performed, followed by the Wilcoxon-test when the former did identify significant p-values.
Finally, the Benthic Ecosystem Quality Index (BEQI, www.beqi.eu) was used to scale the
relationship between dumping intensity and the degree of impact. The BEQI level 3 analyses
were based on the parameters, total density (ind/ m²), number of species and similarity (Bray-
Curtis similarity of fourth-root transformed density data). For this analysis, the disposal stations
were compared with the two types of references stations (nearby-reference and far-reference).
Together with the BEQI-analysis, a power assessment was performed. The power gives an
indication of the chance to detect an impact, when there is one and is defined as 1-β ( β is the
probability of a type II-error). The result of this post-hoc power analysis will depend on the
variance, the effect size and the choice of the level of significance (here set at 0.05%) (Van Hoey
et al., 2007).
3.3 Results
3.3.1 Habitat characterization of the dumping sites and control stations
In this section, the habitat type of the dumping sites and the overall reference stations was
determined based on their biological and sediment characteristics. The linking between the
dumping sites and possible reference stations was previously based on a subjective assignment
(Table 1). Therefore, this analysis is necessary to correctly compare dumping sites with similar (=
with the same benthic habitat type) far-reference stations.
Figure 3. MDS-plot of cluster groups.
The cluster obtained from the hierarchical cluster analysis on the fourth root transformed
density dataset was sliced at the 18.5%-similarity level, resulting in 11 cluster groups. Analysis of
similarity confirmed that these groups were significantly different from each other regarding their

20
species composition (ANOSIM R: 0.661 [p:0.1%]). Subsequently the known benthic habitat types
(Van Hoey et al., 2004; Degraer et al.,2008) could be linked to the cluster groups based on their
specific characteristics for the parameters; density, number of species, characteristic species
(SIMPER) and the sediment characteristics (median grain size and mud content) (Table 3). There
were three main sample groups (3b, 4 and 5a) central in the MDS plot, while these of the other
eight groups were more diffused on the graph (Figure 3). A short description of the characteristics
of each cluster group is given in Table 3 and described below:
Cluster 3b has samples characterised by high densities (2056 + 40 ind/m2) and a high
average number of species (+ 18 species/sample). Species playing an important role for this
cluster are Nephtys species, Spiophanes bombyx, Scoloplos armiger and Abra alba. Mainly
sediments with fine sands (grain size: 187 + 24 µm) were found at the corresponding stations and
had a relative low mud content (11 + 3%). Based on these characteristics we could define cluster
3b as Abra alba habitat.
In cluster 4, the dominance of the polychaete Nephtys cirrosa and Scoloplos armiger as well
as the moderate density (328 + 225 ind/m2) and low species number (+ 7 species/sample) was
the main reason for assigning this cluster to the Nephtys cirrosa habitat. This was confirmed by
the relative high median grain size (223 + 25 µm) and very low mud content (3+1%).
Cluster 5a, the moderate densities (615 + 21 ind/m2), low number of species (+ 6
species/sample) and the dominant presence of Cirratulidae species and Nephtys hombergii are
typical biological features for the third habitat type on the BPNS namely; the Macoma balthica
habitat. Also the very fine sand fraction (median grain size: 123 + 12 µm) and high mud contents
(45 + 8%) are characteristic for this type of habitat.
Cluster 1 was considered as an outlier group, because the biological parameters nor the
sediment characteristics could clearly link these samples towards a certain habitat type.
Samples of cluster 2, scattered in the MDS plot, are characterised as Macoma balthica
habitat, due to the low density (76 + 9 ind/m2), and low number of species (+ 3 species/sample),
the very fine sediments (median grain size: 86 + 10 µm) and the high mud content (58 + 10%).
The characteristic species of this group were Spiophanes bombyx, Nephtys spec., Diastylis
rathkei, Barnea candida, Polydora spec.
The few samples from cluster 3a were characterised by rather low densities (242 + 10
ind/m2) and a low number of species (+ 5 species/sample). The main species found in this
samples were three polychaetes species (Nephtys hombergi, Nephtys cirrosa and Magelona
johnstoni), the bivalve Spisula subtruncata and Bathyporeia species. Sediments are characterised
by fine sands (median grain size 155 +18 µm) with mud contents (22 + 4%). This cluster group
shows correspondence with the Abra alba habitat.
The samples of cluster 5b are characterised by a rather low density (307 + 16 ind/m2) and a
low number of species (+ 6 species/sample). Nevertheless, the presence of the bivalve Abra alba,
the median grain size (154 + 19 ind/m2) and the relatively high mud content (23 + 4%) refer to an
Abra alba habitat.
Cluster 6 contains samples which reflect a low average density (148 + 14 ind/m2) and a low
averaged species number (+ 6 species/sample). The characteristic species composition;
Oligochaetes species, Spiophanes bombyx, Nephtys cirrosa and Scoloplos armiger, the median

21
grain size (269 + 31µm) and the low mud content (8 + 2%) suggest to link this cluster to a Abra
alba- Nephtys cirrosa transition habitat.
Samples from cluster 7 did represent stations with a high density (6710 + 59 ind/m2) and
moderate species numbers (+ 12 species/sample). The species found characteristic for this
cluster are Petricola pholadiformis and Capitella spec., typical for a Macoma balthica habitat. Also
the associated low median grain size (83 + 11µm) and the high mud content (56 + 11%) confirms
this assumption.
Cluster 8a did contain samples with a rather low average density of organisms (164 + 13
ind/m2) and a low number of species (+ 6/sample). Characteristic species for this cluster were
Capitella sp. and Scoloplos armiger. These biological features, together with the average median
grain size (183 +18 µm) and relatively high mud content (19 + 4%), indicated a Macoma balthica-
Abra alba transition habitat.
8b is a cluster of samples with a very low density of organisms (71 ind/m2) and a low
number of species. The most dominant species group found here were Oligochaetes. Sediment
characteristics showed a high median grain size (241+23 µm) and moderate mud contents
(12+3%). The position of the samples on the MDS plot was the main reason for linking this cluster
with the Macoma baltica habitat.
The dumping sites and its reference stations could be linked to a certain habitat type based
on the number of samples of each disposal site associated with a certain cluster/habitat type.
Consequently, disposal site Nieuwpoort was linked to the Abra alba habitat (96.84% of the
samples were found within clusters with this habitat type). The Macoma balthica-cluster groups
comprised 87.38% of the Br&W Oostende samples and 86.81% of the Br&W Zeebrugge Oost
samples. Therefore the dumping sites Zeebrugge Oost and Oostende were recognized as
Macoma balthica habitat. Disposal site Br&W S2 was identified as Nephtys cirrosa habitat
because this cluster existed out of 50.22% of the samples from this site. At first this assumption
may not seem correct, because 44% of the other Br&W S2-samples were found within and Abra
alba cluster. A closer look revealed that 98% of these samples were taken before 2004. This may
indicate a shift in community structure and will be explained in section 3.3.2. Regarding dumping
site Br&W S1, the samples were not uniformly associated with one habitat type. Of the 161
samples collected at this site, 25.47% were found within Abra alba habitat, 44% in Nephtys
cirrosa habitat, 14.29% in Macoma balthica habitat and 10.56% and 3.10% in resp. the Abra alba-
Nephtys cirrosa and Macoma balthica-Abra alba transition habitats (Table 3). This habitat
heterogeneity can be caused by the dumping activity (see further), but is partly naturally due to its
position along the gully bank gradient (Abra alba habitat in gully, switching towards Nephtys
cirrosa habitat at the bank).
Overall control stations ascribed to Abra alba habitat are the following: 115 (86.96%), 120
(98.68%), 230 (71.43%), 250 (66.67%), 780 (97.62%) and B08 (60.61%) (Table 3). In the
Macoma balthica-clusters, the far reference station ZVL (89.58%) was the only one with a
significant amount of samples belonging to this habitat type. Finally, the reference stations found
for the Nephtys cirrosa habitat are the following: 315(97.50%), B031(89.80%), B032(96.30%),
B041(67.16%) and B042(100%).

22
Table 3. Characterization of the cluster groups by the parameters: density (ind/m²), Average # species (/sample), SIMPER species, average median grain size (µm), average mud content (% < 63µm). The stations and amount of replicates (between brackets) per cluster group is listed.
group 2 group 3a group 5b group 6 group 7 group 8a group 8b
HabitatMacoma
balthicaAbra alba Abra alba
Nephtys
cirrosa-Abra
alba
Macoma
balthica
Macoma
balthica-Abra
alba
Macoma
balthica
Density (ind/m²) 76+9 242+10 307+16 148+14 6710+59 164+13 71+7
# species (/sample) 3 5 6 6 12 6 4
Spiophanes
bombyx
Nephtys
hombergiiAbra alba
Scoloplos
armiger
Petricola
pholadiformisCapitella Oligochaeta
NephtysSpisula
subtruncataNephtys Microphthalmus Polydora Spio Macoma balthica
Diastylis rathkei Bathyporeia Macoma balthica Oligochaeta Corophium Oligochaeta
Barnea candida Nephtys cirrosaSpisula
subtruncata
Spiophanes
bombyxAlitta succinea
Magelona
johnstoni
PolydoraMagelona
johnstoniSpio Nephtys cirrosa Capitella
Scoloplos
armiger
Median grain size (µm) 86+10 155+18 154+19 269+31 83+11 183+18 241+23
Mud content (<63µm) 58+10 22+4 23+4 8+2 56+11 19+4 12+3
120(2) B08(1) 140(9) 140(1) 115(20) B08(36) 115(2) B032(26) 115(1) LNP(2) 120(5) 140(3) 140(7) 150(1) 150(11)
140(2) LS1(3) LS1(3) 250(1) 120(145) LNP(90) 140(1) B041(45) 140(6) LOO(87) 140(26) 150(3) B031(3) LOO(2) 315(1)
150(4) LS2(7) ZEB(2) B041(2) 140(21) LOO(9) 150(16) B042(27) 150(8) LS1(11) 780(1) B08(12) B08(3) LS1(10) B08(1)
250(1) LZO(9) ZVL(7) LS1(2) 230(5) LS1(30) 230(2) B08(9) 702(2) LS2(4) B041(6) LNP(2) ZVL(51) LS2(2) LOO(1)
B031(2) ZEB(2) LS2(9) 250(11) LS2(89) 250(5) LNP(1) B041(1) LZO(72) B08(1) LS1(17) LNP(7) LZO(2) LS1(5)
B032(1) ZVL(8) ZVL(1) 780(122) LZO(1) 315(39) LOO(4) B08(3) ZEB(1) LS1(2) ZVL(2) ZVL(1) LZO(5)
780C(3) ZVL(2) 702(3) LS1(34) ZVL(69) LS2(2) LNP(1) ZVL(2)
B041(13) 710(3) LS2(114) ZVL(1) LNP(12)
780(3) LZO(2)
B031(44) ZEB(4)
45+8
Stations (# Samples)
Nephtys
Oligochaeta
Macoma balthica
Nephtys hombergii
123+12
group 5a
Macoma
balthica
615+21
6
Cirratulidae
11+3
group4
Nephtys
cirrosa
328+18
8
Nephtys cirrosa
Nephtys
Spio
Magelona
johnstoni
Scoloplos armiger
223+25
3+1
Spiophanes
bombyx
Abra alba
Scoloplos armiger
Nephtys hombergii
187+24
group 3b
Abra alba
2056+40
18
Nephtys
SIMPER species
outlier group
group 1
102 +8
3
Microphthalmus
Pectinaria koreni
Gastrosaccus
spinifer
Nephtys
Bathyporeia
elegans
243+18
20+4

23
3.3.2 Long-term pattern (1980-2008); focus on station 7101
Figure 4. a) the average density with standard error at LS2-01 in the three periods; b) the average species richness; c) the average median grain size and mud content; d) CAP analysis of the species composition with delineation of the three periods; e) the dumping intensity at dumping site LS2 over the period 1990-2008 in tons dry matter. * significant difference
Station 7101 (LS2-01) is sampled already over a period of 30 years, which makes a
long term analysis suitable. This station is situated at the border of the dumping site and
could be a proxy for the natural and anthropogenic (dumping) changes in the benthic habitat
characteristics in this part of the BPNS. The multivariate CAP analysis (Figure 4d) indicates
a transition in species assemblage over the years. We can roughly distinguish 3 temporal
assemblages (period ’85-’90; ’93-’00; ’01-’08). The average density (Figure 4a) and species
richness (Figure 4b) were significantly lower in the latest period compared to the previous
ones. The changes in species composition can be attributed to the absence of mud loving
species in the recent period, as Abra alba, Nephtys hombergii, Spisula subtruncata,
Capitella and Tellina fabula. The dominant species in the recent period were Nephtys
cirrosa, Ensis directus, Scoloplos armiger and Bathyporeia guilliamsoniana, which were
species characteristic for more sandy sediments. When comparing the sediment over the
different periods, we did not find any significant changes but nevertheless a decreasing
trend in mud content is visible from 4 to 2% (Figure 4c). This little change in mud content
leads already to a transition from the more diverse Abra alba habitat to the less diverse
Nepthys cirrosa habitat (Van Hoey et al., 2004). Simultaneously, dumping intensity
**
a b
c
d
e

24
decreased under the 1 million tons (Figure 4e), which is an indication that the amount of
dumped muddy sediments is decreased. This prevents recruitment of ‘mud loving’ species,
causing a decrease in the benthic diversity coinciding with the decrease in dumping.
3.3.3 Impact at the disposal sites
Impact evaluation is done by using the impact and control samples belonging to the
same habitat type for each dumping site. Only for Br&W S1, the control samples of the Abra
alba and the Nephtys cirrosa habitat are used.
3.3.3.1 Dumping site Nieuwpoort
Figure 5. Density and diversity at dumping site Nieuwpoort in winter and autumn over the period 2004-2008.
The species composition did not differ significantly between the years 2004 and 2005,
but there was found a small difference between the years over the period 2006-2008
(ANOSIM: R: 0.1 [p:0.1%]). Over both periods there was a seasonal difference in species
composition (e.g. period 2006-2008; ANOSIM: R:0.114 [p:0.1%]). In general, the univariate
parameters density and species number shown the same patterns (Figure 5). The values of
the univariate parameters were higher in autumn compared to winter. No significant
differences were seen between the disposal, nearby- and far reference stations over the
investigated period with regard to the parameters density, species number and diversity for
dumping site Nieuwpoort. Only a significant difference in species composition between the
nearby-reference station and the far-reference station was found (e.g. ANOSIM: R: 0.234 [p:
0
2000
4000
6000
8000
Dis
po
sal
NR
ef
FRre
f
Dis
po
sal
NR
ef
FRre
f
Dis
po
sal
NR
ef
FRre
f
Dis
po
sal
NR
ef
FRre
f
Dis
po
sal
NR
ef
FRre
f
2004 2005 2006 2007 2008
Ave
rage
de
nsi
ty (
ind
/m2
)
Year - Station type
Density winter
05
1015202530354045
Dis
po
sal
NR
ef
FRre
f
Dis
po
sal
NR
ef
FRre
f
Dis
po
sal
NR
ef
FRre
f
Dis
po
sal
NR
ef
FRre
f
Dis
po
sal
NR
ef
FRre
f
2004 2005 2006 2007 2008
Ave
rage
S /
Ave
rage
N1
Year - Station type
Diversity winterS N1
05
1015202530354045
Dis
po
sal
NR
ef
FRre
f
Dis
po
sal
NR
ef
FRre
f
Dis
po
sal
NR
ef
FRre
f
Dis
po
sal
NR
ef
FRre
f
Dis
po
sal
NR
ef
FRre
f
2004 2005 2006 2007 2008
Ave
rage
S /
Ave
rage
N1
Year - Station type
Diversity autumnS N1
0
2000
4000
6000
8000
Dis
po
sal
NR
ef
FRre
f
Dis
po
sal
NR
ef
FRre
f
Dis
po
sal
NR
ef
FRre
f
Dis
po
sal
NR
ef
FRre
f
Dis
po
sal
NR
ef
FRre
f
2004 2005 2006 2007 2008
Ave
rage
de
nsi
ty (
ind
/m2
)
Year - Station type
Density autumn

25
0.1%]). Dumping intensity was low over the years 2004-2008 (maximum of 178,289 TDM)
and absent in 2005 (Table 2).
3.3.3.2 Dumping site Br&W Oostende
The species composition did not differ between the years 2004-2005, nor a
difference between the seasons within this period was detected. Over the period 2006-
2008, both the factor year and season were found to be structuring factors based on the
species composition (ANOSIM: R: 0.088 [p:0.1%]). Species composition differed between
the disposal-and nearby-reference stations on the one hand and the far-reference stations
on the other hand (e.g. Disposal-FRef; ANOSIM: R: 0.168 [p:0.1%]), but this was only the
case for the period 2004-2005. Regarding the univariate parameters (density, number of
species and diversity) there was not seen any significant difference between the three
station types. An exception was autumn 2008, when far-reference station ZVL appeared to
be characterized by a significant lower number of species and diversity than the stations at
the dumping site (e.g. number of species at the disposal vs. far-reference stations, p:
0.0362). Generally, a lower density was seen at all the three station types in autumn 2008,
with respect to the other years (Figure 6). The dumping intensity at this site was relatively
low over the years 2004-2005, with a maximum of 864,863 TDM in 2008 (Table 2).
Figure 6. Density and diversity at dumping site Oostende in winter and autumn over the period 2004-2008.
0
1000
2000
3000
4000
Dis
po
sal
Nre
f
FRe
f
Dis
po
sal
Nre
f
FRe
f
Dis
po
sal
Nre
f
FRe
f
Dis
po
sal
Nre
f
FRe
f
Dis
po
sal
Nre
f
FRe
f
2004 2005 2006 2007 2008
Ave
rage
de
nsi
ty (
ind
/m2
)
Year - Station type
Density winter
0
2
4
6
8
10
12
14
Dis
po
sal
Nre
f
FRe
f
Dis
po
sal
Nre
f
FRe
f
Dis
po
sal
Nre
f
FRe
f
Dis
po
sal
Nre
f
FRe
f
Dis
po
sal
Nre
f
FRe
f
2004 2005 2006 2007 2008
Ave
rage
S /
Ave
rage
N1
Year - Station type
Diversity winterS N1
0
1000
2000
3000
4000
Dis
po
sal
Nre
f
FRe
f
Dis
po
sal
Nre
f
FRe
f
Dis
po
sal
Nre
f
FRe
f
Dis
po
sal
Nre
f
FRe
f
Dis
po
sal
Nre
f
FRe
f
2004 2005 2006 2007 2008
Ave
rage
de
nsi
ty (
ind
/m2
)
Year - Station type
Density autumn
0
2
4
6
8
10
12
14
Dis
po
sal
Nre
f
FRe
f
Dis
po
sal
Nre
f
FRe
f
Dis
po
sal
Nre
f
FRe
f
Dis
po
sal
Nre
f
FRe
f
Dis
po
sal
Nre
f
FRe
f
2004 2005 2006 2007 2008
Ave
rage
S /
Ave
rage
N1
Year - Station type
Diversity autumnS N1
26
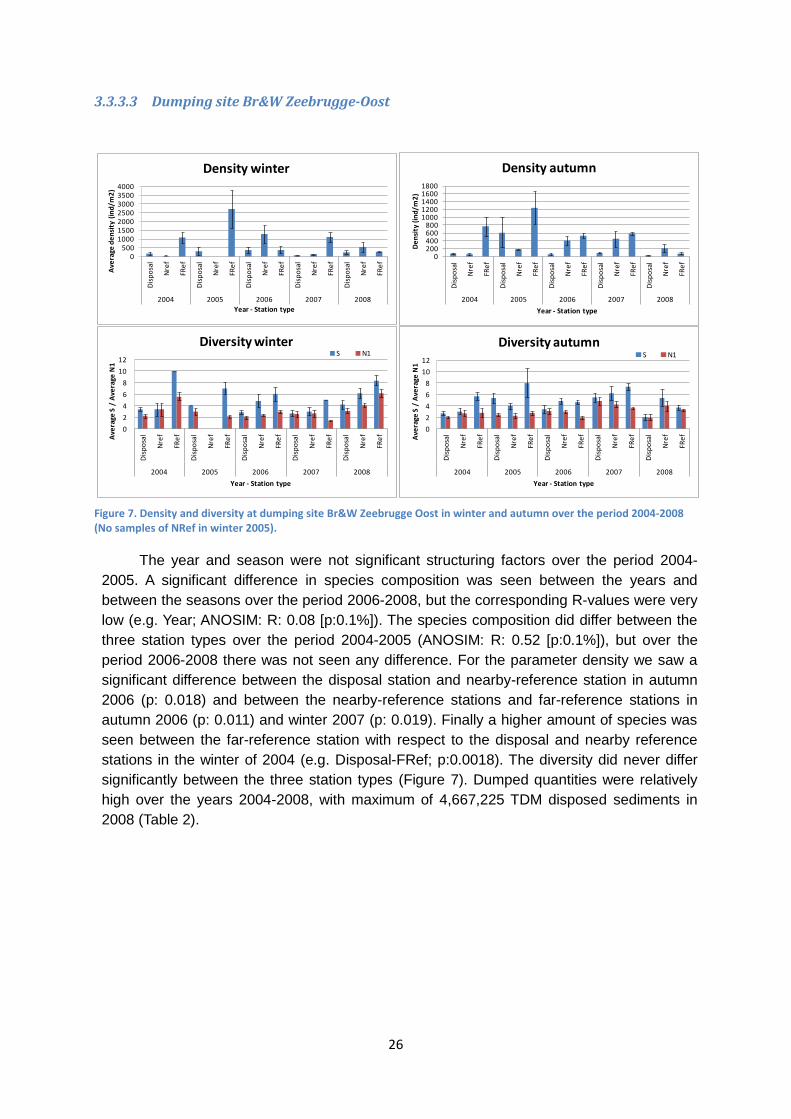
3.3.3.3 Dumping site Br&W Zeebrugge-Oost
Figure 7. Density and diversity at dumping site Br&W Zeebrugge Oost in winter and autumn over the period 2004-2008 (No samples of NRef in winter 2005).
The year and season were not significant structuring factors over the period 2004-
2005. A significant difference in species composition was seen between the years and
between the seasons over the period 2006-2008, but the corresponding R-values were very
low (e.g. Year; ANOSIM: R: 0.08 [p:0.1%]). The species composition did differ between the
three station types over the period 2004-2005 (ANOSIM: R: 0.52 [p:0.1%]), but over the
period 2006-2008 there was not seen any difference. For the parameter density we saw a
significant difference between the disposal station and nearby-reference station in autumn
2006 (p: 0.018) and between the nearby-reference stations and far-reference stations in
autumn 2006 (p: 0.011) and winter 2007 (p: 0.019). Finally a higher amount of species was
seen between the far-reference station with respect to the disposal and nearby reference
stations in the winter of 2004 (e.g. Disposal-FRef; p:0.0018). The diversity did never differ
significantly between the three station types (Figure 7). Dumped quantities were relatively
high over the years 2004-2008, with maximum of 4,667,225 TDM disposed sediments in
2008 (Table 2).
0500
1000150020002500300035004000
Dis
po
sal
Nre
f
FRe
f
Dis
po
sal
Nre
f
FRe
f
Dis
po
sal
Nre
f
FRe
f
Dis
po
sal
Nre
f
FRe
f
Dis
po
sal
Nre
f
FRe
f
2004 2005 2006 2007 2008
Ave
rage
de
nsi
ty (
ind
/m2
)
Year - Station type
Density winter
0
2
4
6
8
10
12
Dis
po
sal
Nre
f
FRe
f
Dis
po
sal
Nre
f
FRe
f
Dis
po
sal
Nre
f
FRe
f
Dis
po
sal
Nre
f
FRe
f
Dis
po
sal
Nre
f
FRe
f
2004 2005 2006 2007 2008
Ave
rage
S /
Ave
rage
N1
Year - Station type
Diversity winterS N1
0200400600800
10001200140016001800
Dis
po
sal
Nre
f
FRe
f
Dis
po
sal
Nre
f
FRe
f
Dis
po
sal
Nre
f
FRe
f
Dis
po
sal
Nre
f
FRe
f
Dis
po
sal
Nre
f
FRe
f
2004 2005 2006 2007 2008
De
nsi
ty (
ind
/m2
)
Year - Station type
Density autumn
0
2
4
6
8
10
12
Dis
po
sal
Nre
f
FRe
f
Dis
po
sal
Nre
f
FRe
f
Dis
po
sal
Nre
f
FRe
f
Dis
po
sal
Nre
f
FRe
f
Dis
po
sal
Nre
f
FRe
f
2004 2005 2006 2007 2008
Ave
rage
S /
Ave
rage
N1
Year - Station type
Diversity autumnS N1

27
3.3.3.4 Dumping site Br&W S2
Figure 8. Density and diversity at dumping site Br&W S2 in winter and autumn over the period 2004-2008.
At dumping site Br&W S2, the factor year was considered as a significant structuring
parameter over both periods; 2004-2005 (ANOSIM: R: 0.109 [p:0.1%]) and for 2006-2008
(ANOSIM: R: 0.093 [p:0.1%]). Also a significant difference between the two seasons was
seen in both periods, but was more pronounced for the years 2004-2005 (ANOSIM: R:
0.109 [p:0.1%]). No significant differences were seen between the three station types
regarding their species composition, density, species number or diversity (Figure 8). A
notable observation was the high macrobenthic density and species numbers within all
three station types in the autumn of 2005. Dumping intensities were high in 2004 (1,826,033
TDM) and in 2005 (1,234,640 TDM), but had a tremendous decrease in the years 2006-
2008 (Table 2).
3.3.3.5 Dumping site Br&W S1
For the period 2006-2008 the species composition was significantly different between
the corresponding years, but the R-value was very low (ANOSIM: R: 0.035 [p: 0.1%]).
Season was a significant structuring factor regarding the species composition over both
periods, but the R-values were again very low (2004-2005: ANOSIM: R: 0.047 [p:0.4%] and
for 2006-2008: ANOSIM: R:0.037 [p: 0.2%]). Species composition over the period 2004-
2005 was the same for the disposal and nearby-reference stations, but differed between
disposal and far-reference stations (ANOSIM: R: 0.163 [p: 0.1%]). Over period 2006-2008
disposal and far-reference (ANOSIM: R: 0.282 [p: 0.1%]) stations also differed and
additionally there was seen a significant difference between disposal and nearby-reference
stations (ANOSIM: R: 0.282 [p: 0.1%]). In general, a significant lower value for the disposal
02468
10121416
Dis
po
sal
NR
ef
FRe
f
Dis
po
sal
NR
ef
FRe
f
Dis
po
sal
NR
ef
FRe
f
Dis
po
sal
NR
ef
FRe
f
Dis
po
sal
NR
ef
FRe
f
2004 2005 2006 2007 2008
Ave
rage
S /
Ave
rage
N1
Year - Station type
Diversity winterS N1
0
200
400
600
800
1000
1200
Dis
po
sal
NR
ef
FRe
f
Dis
po
sal
NR
ef
FRe
f
Dis
po
sal
NR
ef
FRe
f
Dis
po
sal
NR
ef
FRe
f
Dis
po
sal
NR
ef
FRe
f
2004 2005 2006 2007 2008
Ave
rage
de
nsi
ty (
ind
/m2
)
Year - Station type
Density winter
0
200
400
600
800
1000
1200
Dis
po
sal
NR
ef
FRe
f
Dis
po
sal
NR
ef
FRe
f
Dis
po
sal
NR
ef
FRe
f
Dis
po
sal
NR
ef
FRe
f
Dis
po
sal
NR
ef
FRe
f
2004 2005 2006 2007 2008
Ave
rage
de
nsi
ty (
ind
/ m
2)
Year - Station type
Density autumn
02468
10121416
Dis
po
sal
NR
ef
FRe
f
Dis
po
sal
NR
ef
FRe
f
Dis
po
sal
NR
ef
FRe
f
Dis
po
sal
NR
ef
FRe
f
Dis
po
sal
NR
ef
FRe
f
2004 2005 2006 2007 2008
Ave
rage
S /
Ave
rage
N1
Year - Station type
Diversity autumnS N1
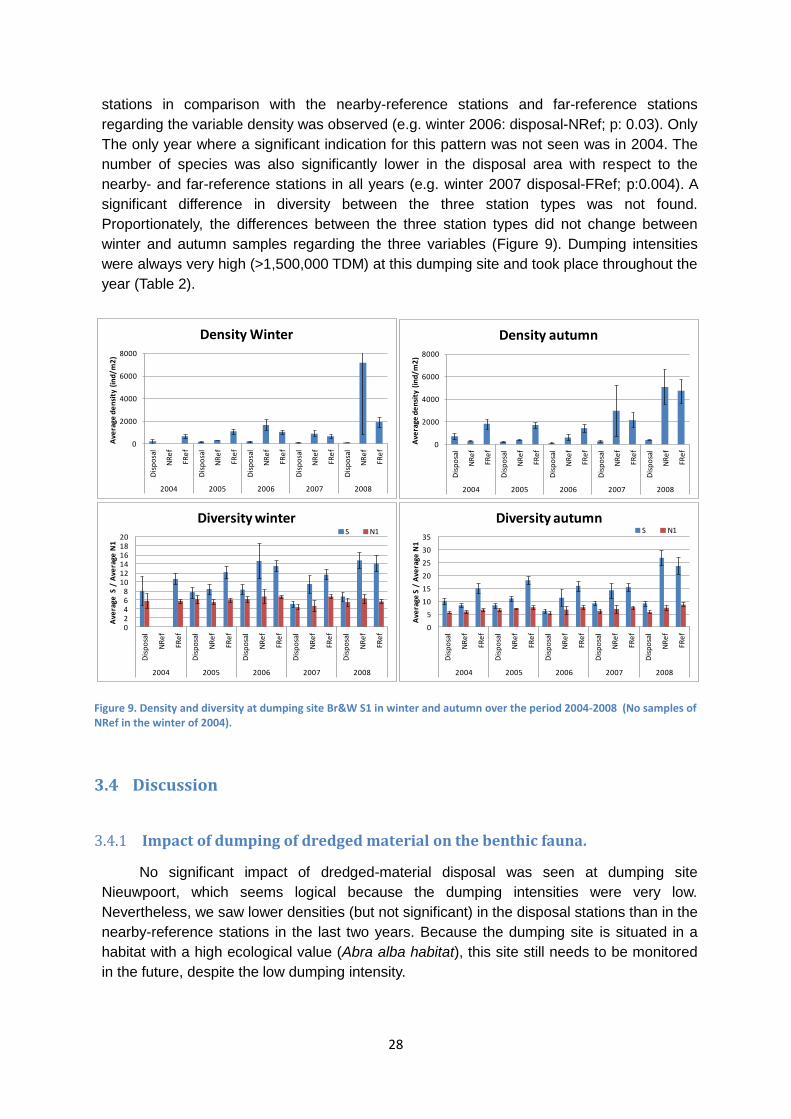
28
stations in comparison with the nearby-reference stations and far-reference stations
regarding the variable density was observed (e.g. winter 2006: disposal-NRef; p: 0.03). Only
The only year where a significant indication for this pattern was not seen was in 2004. The
number of species was also significantly lower in the disposal area with respect to the
nearby- and far-reference stations in all years (e.g. winter 2007 disposal-FRef; p:0.004). A
significant difference in diversity between the three station types was not found.
Proportionately, the differences between the three station types did not change between
winter and autumn samples regarding the three variables (Figure 9). Dumping intensities
were always very high (>1,500,000 TDM) at this dumping site and took place throughout the
year (Table 2).
Figure 9. Density and diversity at dumping site Br&W S1 in winter and autumn over the period 2004-2008 (No samples of NRef in the winter of 2004).
3.4 Discussion
3.4.1 Impact of dumping of dredged material on the benthic fauna.
No significant impact of dredged-material disposal was seen at dumping site
Nieuwpoort, which seems logical because the dumping intensities were very low.
Nevertheless, we saw lower densities (but not significant) in the disposal stations than in the
nearby-reference stations in the last two years. Because the dumping site is situated in a
habitat with a high ecological value (Abra alba habitat), this site still needs to be monitored
in the future, despite the low dumping intensity.
0
2000
4000
6000
8000
Dis
po
sal
NR
ef
FRe
f
Dis
po
sal
NR
ef
FRe
f
Dis
po
sal
NR
ef
FRe
f
Dis
po
sal
NR
ef
FRe
f
Dis
po
sal
NR
ef
FRe
f
2004 2005 2006 2007 2008
Ave
rage
de
nsi
ty (
ind
/m2
)
Density Winter
02468
101214161820
Dis
po
sal
NR
ef
FRe
f
Dis
po
sal
NR
ef
FRe
f
Dis
po
sal
NR
ef
FRe
f
Dis
po
sal
NR
ef
FRe
f
Dis
po
sal
NR
ef
FRe
f
2004 2005 2006 2007 2008
Ave
rage
S /
Ave
rage
N1
Diversity winterS N1
0
2000
4000
6000
8000
Dis
po
sal
NR
ef
FRe
f
Dis
po
sal
NR
ef
FRe
f
Dis
po
sal
NR
ef
FRe
f
Dis
po
sal
NR
ef
FRe
f
Dis
po
sal
NR
ef
FRe
f
2004 2005 2006 2007 2008
Ave
rage
de
nsi
ty (
ind
/m2
)
Density autumn
0
5
10
15
20
25
30
35
Dis
po
sal
NR
ef
FRe
f
Dis
po
sal
NR
ef
FRe
f
Dis
po
sal
NR
ef
FRe
f
Dis
po
sal
NR
ef
FRe
f
Dis
po
sal
NR
ef
FRe
f2004 2005 2006 2007 2008
Ave
rage
S /
Ave
rage
N1
Diversity autumnS N1

29
Although the moderate dumping intensities at Br&W Ooostende, we did not notice a
negative effect of dumping activities at disposal site Oostende. This can be explained by the
poor benthic community, occurring in this area (Macoma balthica habitat). Most species
were adapted to a certain amount of stress and to the muddy environments, and are known
to recover relatively fast (Bolam et al., 2003).
We did not indicate any significant effects of dumping over the period 2004-2008 at
disposal site Br&W S2. The dumping area is characterised as a Nephtys cirrosa habitat,
with sandy sediments and a low mud content. Therefore, we expect a negative effect of the
dumping of muddy sediments, but although dumping intensities decreased since 2006, we
did not see any reaction of the macrobenthic community. Nevertheless, we saw indications
for a possible change in community structure at dumping site Br&W S2, reflected by the
patterns observed at the long-term station 7101. The samples taken during the period 1980-
2002, indicate that this area is more related with the Abra alba habitat, while the samples
taken after 2003 suggest a Nephtys cirrosa habitat. A study by Van Hoey et al (2003),
discovered that a transition from an Abra alba community towards a Nephtys cirrosa
community is characterised by a decrease in the mud content (switch between 2-4%). Since
this very small change in the mud content and the median grain size was seen, this can be
the reason for the switch. This switch can be related to the decrease in the dumping
intensity over the years (the pattern is partly biased due to the switch in units (WT vs TDM)
and the related conversion over time). Nevertheless, it seems that dumping site Br&W S2
was more used in the past than in recent years, possibly reflected in less supply of mud and
organic content towards the more sandy environment. It has been shown that dredged-
disposal containing a certain amount of organic matter could have a positive effect on the
diversity and density of the macrobenthic organisms (Stutterheim, 2002; Essink, 1999). If
more muddy sediments with a high mud content were dumped before 2002, this could
explain the observed pattern. Generally, increased fishing intensity could also have a
destructive effect on the macrobenthos and consequently result in a poor community of only
opportunistic species, but we do not have data to confirm this hypothesis. Since the long-
term analysis at station ZVL, also indicated lower densities over the recent years, we also
consider that large-scale processes (e.g. change in bottom currents or change in input by
the Westerschelde) could have influenced the shift around the period 2000-2003.
At dumping site Br&W Zeebrugge Oost, there was no clear indication for an
effect of dumping on our disposal stations with respect to our control stations (NRef and
FRef). The only significant difference between the disposal and nearby-reference stations in
the autumn of 2006, is probably related to the additional dumping of capital dredged-
material (401,944 TDM). As for disposal site Oostende, the presence of a, by nature poor,
Macoma balthica community, might be an explanation why we could not detect any effect on
the disposal stations. Also the fact that our nearby-reference stations can be affected by
some dumping events, and consequently minimizing/masking the impact, need to be
considered.
Dumping site Br&W S1 is the most used dumping site in the years 2004-2008
and this was also observed in the results of our analyses. The impact of the high dumping
amounts had a clear effect on the macrobenthos community at our disposal stations. 2004
missed significant values indicating an impact, but this can be explained by the lower
amounts of dredged material disposed in that year (1,826,561 TDM), which could be a sign

30
that quick recover of parts of the benthic community is possible. The dumping site Br&W S1
is located on a natural gradient of the gully-bank system of the Vlakte van de Raan.
Therefore, this site is characterised in the deeper part as Abra alba habitat, whereas the top
shows more affinity with the Nephtys cirrosa habitat, in the natural situation (Van Hoey et al,
2009). The former normally knows a rich diversity and high densities (Van Hoey et al.,
2004). An event of disturbance such as dumping, will therefore be clearly indicated as a
decrease in density and/or species richness. The dumping at Br&W S1 creates changes in
the bathymetry and habitat characteristics, which is reflected by the scattered benthic
community characteristics in this area (samples belonging to different cluster/habitat
groups). This shows that the environment is not stable and that mainly opportunistic benthic
species can occur here. As shown on the intensity maps (ANNEX 1), the dumped
sediments are not always equally spread (higher intensity in the western part than in the
eastern part). We saw a trend of lower densities and species numbers at points which
received more dredged-material, but the differences were not significant. As suggested in
Van Hoey et al. (2009), this is probably due to the fact that currents transport a certain
amount of the sediments during the dumping procedure, before they settle down.
Figure 10. Relation between the dumping intensity and the BEQI scores for the parameters similarity (species composition), number of species and density. The BEQI overall score is the average of those three parameters. The trend line is a Polynomial order 3, with indication of the R² score.
The impact evaluation can be summarized by the use of a benthic indicator (BEQI,
level 3). Therefore, we calculate an EQR score, which scales the difference in benthic
parameters between the impact and control samples between 0 (bad status) and 1 (high
status). The EQR score is calculated separately for each season and year with enough
data, between 2004-2008. The difference between impact and control is calculated within
each season and year to avoid temporal trends and to minimize cumulative effects. The
indicator shows a clear relation between the yearly dumping intensity (maintenance and
capital dredging) and its impact on the health of the benthic habitat (Figure 10). We can
R² = 0.754
R² = 0.4919
R² = 0.779
R² = 0.8169
0
0.2
0.4
0.6
0.8
1
0 2000000 4000000 6000000 8000000 10000000 12000000
E
Q
R
Dumping quantity (Tonnes Dry Matter)
BEQI EQR scores versus dumping intensity
Similarity
Number of species
Density
Average EQR score

31
conclude that yearly dumping intensities, exceeding values of about 2,000,000 TDM, start to
affect the benthic characteristics (corresponding with moderate to poor BEQI-values). The
effect was smaller for the parameter number of species, than for density.
Literature provides a lot of explanations for the impact of dredged-disposal on the
benthic communities (Windom, 1976; Morton, 1977; Elliot et al., 2002). In the particular
case of the five Belgian disposal sites, we exclude large effects of chemicals, since there
are specific regulations, which prohibit dumping of heavily polluted sediments and because
ILVO-reports (Lauwaert et al., 2008; Lauwaert et al., 2009., Van Hoey et al., 2009) did not
mention differences in contamination between disposal- and reference stations. Differences
in organic matter have come up already as possible explanations (cf. Br&W S2 and Br&W
Zeebrugge Oost), but knowledge about the Belgian coastal zone learns us, that the area is
characterised by relatively high levels of organic matter, especially nearby the river-mouth of
the river Schelde. Therefore, a positive contribution of the disposed sediments in increasing
the organic matter is less likely, although we won’t exclude a short-term effect. We suggest
that if we see an impact, this is mainly related to the physical burial of the organisms, or to
the properties of the dredged-disposal. When benthic organisms are buried under a certain
amount of sediments, their feeding capacity will get altered or their mobility will decrease
(Morton, 1977). Some species will be more resistant to direct burial than others, depending
on their capacity to migrate upwards through the sediments. The sediment properties of the
dredged material will mainly be responsible for the effect, when they are obviously different
from the sediment characteristics of the dumping site. Dredged disposal usually has a high
mud content, and will therefore have a higher chance to cause an effect in by nature, sandy
environments.
3.4.2 Evaluation of the monitoring strategies.
Table 4. Power related to the overall BEQI-scores.
The results from the BEQI-analysis did also provide us a good way to evaluate our
two sampling designs (Table 4). Beside the scores for the parameters, we also obtained an
indication for the power of our analyses, based on the number of samples taken at the
disposal stations on the one hand and at the reference stations (nearby + far- reference) on
the other hand. A high power means that the chance to make a type II-error (we do not
detect an impact when there is one) is low. We consider a power classified as moderate as

32
acceptable and giving a rather confident assessment. Very poor classification means that
the results were not trustable.
We can conclude that the efficiency of the two designs differs between the dumping
sites, caused by the difference in dumping intensity and the characteristic habitat type of the
area. A dumping site in a diverse habitat, like Nieuwpoort, apparently does not require a real
extensive sampling design (cf. 2006-2008) as long as the dumping intensity stays low. We
already seemed to have enough control and impact samples over the years 2004-2005 to
get a moderate power of our analyses. If the area is characterised by poor benthic
characteristics, like at Br&W Ooostende and Br&W Zeebrugge Oost (Macoma balthica
habitat), probably more samples or relocation of stations is needed to avoid type II errors
(cf. low power of overall BEQI-scores,Table 4). Nevertheless, the detection of a possible
impact will remains difficult due to resistance and the fast recovery of the opportunistic
species. When the separation between nearby-and far-reference stations will proceed in the
future, it is suggested to sample more far-reference stations for Macoma balthica habitats
(instead of only ZVL). We see that when the dumping site is not uniformly chararcterized by
one benthic community, a design comprising both benthic habitats will lead to reliable
results (cf. Br&W S1). Regarding dumping site Br&W S2, the decision to enlarge the
sampling intensity (1disposal/1 nearby reference stations to 7 disposal/4 nearby-reference
stations) has positively affected the power of the overall BEQI-scores (Table 4).
The characterization of the stations and dumping sites (cf. section 3), revealed that
four far-reference stations (780C, ZEB, 150 and 140) could not be linked to a certain
habitat, based on their biological and sediment characteristics. The samples of 780C were
found within the Abra alba cluster, but this station was sampled only once and therefore not
taken up in our analyses. The station Zeebrugge eb (ZEB), did not cluster within one
specific habitat and is probably not a good reference station. Also station 150 was found
within the clusters of all the three habitat types and is not a good reference for Br&W
Zeebrugge Oost, as originally considered (Table 1). Finally, the long-term station 140 was
found within the Abra alba cluster (71.23% of the samples) based on the community
analysis, but expert opinion did not recognise this station as a good reference station for an
Abra alba habitat. Since the station was originally sampled as reference for Br&W
Ooostende (Macoma balthica habitat), it is now recommended to reconsider whether to
proceed sampling station 140 or not. The other far reference stations were considered as
very useful for the dredge disposal assessment of the different dumping sites.
3.4.3 Conclusion
We can conclude that dumping activities have resulted in benthic habitat changes at
dumping site Br&W S1. Whereas at the other dumping sites, the benthic community can
scope the existing dumping regime. At Br&W S1, mainly the rich Abra alba community is
affected, normally dominating the gully stations in the disposal area. At Br&W S2, it is
possible that dumping has had a small positive effect, by supply of mud and organic matter
to the more sandy environment (indicated by the switch between Abra alba and Nephtys
cirrosa habitat). At dumping site LNP, with lowest dumping intensity, there was no impact.
And finally, the dumping activity at site Br&W Zeebrugge Oost and Br&W Oostende had a
smaller effect on the benthos, due to the more natural poor benthic environment.

33
Nevertheless, it needs to be kept in mind that this is a control/impact study, without
knowledge about the natural situation, before the dumping activities started. Therefore, the
characterization of the dumping sites might not be fully realistic as the dumping events
could already have changed the original habitat and nearby environment. The relation
between the benthos indicator BEQI and the dumping intensity shows that a benthic
community seems to be affected from an average dumping regime of 2.000.000 tons dry
matter a year. Based on this analyses, roughly 2.000.000 tons, regardless the surface area
where it is dumped on, is proposed as critical boundary. It has to be mentioned that this
critical boundary can differ for each habitat type. In other words, it is possible that a sandy
or fine muddy sand habitat is more sensitive to it than a muddy habitat (Macoma balthica
habitat), as some results show, but more detailed investigation is needed. This critical
boundary needs to be seen as a boundary where the natural benthic recolonisation and
recruitment cannot compensate for the loss of benthos due to smothering by the dumping of
dredged material.

34
4 Biological and chemical status analyze of the disposal of dredged
material in the Belgian Part of the North Sea: period 2009-2010.
4.1 Introduction
In this section, the results of the routine biological and chemical monitoring at the five
dumping sites on the BPNS were described for the years 2009-2010. Firstly, we analyzed
the sedimentology at the five sites, with indication of the sedimentological characteristics
(mud content, median grain size) and the pollution (PCBs, PAHs, heavy metals, …) in the
sediments. Secondly, we described and evaluated the difference or correspondence in
biological characteristics of the ecosystem components macrobenthos, epibenthos and
demersal fish between the dumping sites and the nearby control area. Thirdly, the
(bio)accumulation of contaminants in the marine ecosystem is investigated by chemical
analysis on different biota species. Finally, the biological effects of pollutants on marine
organisms is investigated by the assessment of the prevalence of fish diseases and by the
measurement of enzymatic EROD activities in the liver of juvenile dab. The observed
patterns at the disposal sites were evaluated with indicators and threshold values as
defined in Belgian or European legislation (e.g. Marine Strategy Framework Directive).
4.2 Material and method
4.2.1 Study area
All sampling locations were distributed in the shallow coastal zone of the Belgian Part
of the North Sea (BPNS; limited to approximately 20 km offshore), since all dumping sites
are situated in this zone (Figure 11). The impact samples are situated in the five dumping
sites, while control samples are situated just outside the dumping sites and on some overall
monitoring locations in the close surroundings (Figure 11). Table 5 give an overview of the
stations used per dumping site, resp. as impact or control station for the assessment of
macrobenthos and epibenthos and demersal fish.
There were changes introduced in the sampling strategy for epibenthos and demersal
fish, as well as for the macrobenthos. The changes introduced were done to increase the
confidence of the impact assessment. More details about the effect of the changes in the
sampling program on the evaluation is outlined in chapter 6. For the epibenthos and
demersal fish monitoring, the following adaptations were introduced:
A shortening of the tracks to get a better spatial resolution in the analysis. The
length of the fish tracks (3500m) is too long to fit within the delineation of the
dumping sites, whereby fauna of within and aside the dumping site was
collected.
At dumping site S1, two tracks were taken in 2010 within the dumping site to
cover the natural spatial variability within this area.
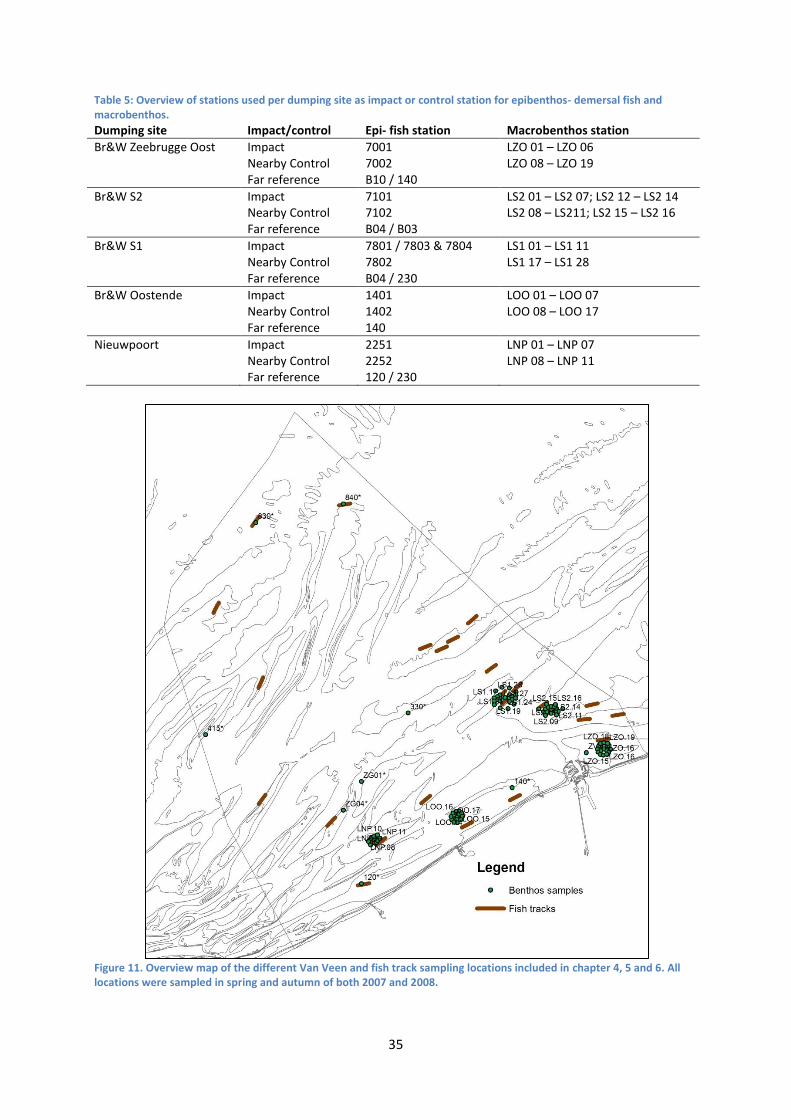
35
Table 5: Overview of stations used per dumping site as impact or control station for epibenthos- demersal fish and macrobenthos.
Dumping site Impact/control Epi- fish station Macrobenthos station
Br&W Zeebrugge Oost Impact 7001 LZO 01 – LZO 06 Nearby Control 7002 LZO 08 – LZO 19 Far reference B10 / 140
Br&W S2 Impact 7101 LS2 01 – LS2 07; LS2 12 – LS2 14 Nearby Control 7102 LS2 08 – LS211; LS2 15 – LS2 16 Far reference B04 / B03
Br&W S1 Impact 7801 / 7803 & 7804 LS1 01 – LS1 11 Nearby Control 7802 LS1 17 – LS1 28 Far reference B04 / 230
Br&W Oostende Impact 1401 LOO 01 – LOO 07 Nearby Control 1402 LOO 08 – LOO 17 Far reference 140
Nieuwpoort Impact 2251 LNP 01 – LNP 07 Nearby Control 2252 LNP 08 – LNP 11 Far reference 120 / 230
Figure 11. Overview map of the different Van Veen and fish track sampling locations included in chapter 4, 5 and 6. All locations were sampled in spring and autumn of both 2007 and 2008.

36
4.2.2 Sampling and data analysis
4.2.2.1 Macrobenthos
4.2.2.1.1 SAMPLING
Macrobenthos can be defined as the organisms that live for most part of their life in
the sediment, and that are retained on a 1mm-meshed sieve. At the stations in the dumping
sites, one sample was taken. The macrobenthos was sampled with a Van Veen grab
(0.1 m²), and sieved on a 1mm sieve. Afterwards, the sample was fixed with an 8 %
formaldehyde seawater solution and stained with eosin to facilitate sorting afterwards.
Species were identified to species level when possible and counted. The macrobenthos
monitoring (sampling, processing and analyzing) is executed following the ISO standard
(ISO 16665:2005(E)) (“Water quality – Guidelines for quantitative sampling and sample
processing of marine soft-bottom macrofauna”). This procedure is under accreditation since
24/05/2011 under the BELAC ISO17025 norm (ILVO-DIER-ANIMALAB;
CertificaatN°:BELAC T-315).
From each Van Veen sample, a Perspex core was taken for sediment analyses.
These samples were dried at 60°C and analyzed with a Malvern Mastersizer 2000 following
a standardized protocol. Depth and position of each sample were also registered during the
campaigns.
Figure 12. Picture of Van Veen grab and macrobenthic sample
4.2.2.1.2 STATISTICAL ANALYSIS
The species dataset was standardized by lumping some species (Cirratulidae spp,
Spio spp, Anthozoa spp), and reduced by excluding species that did not belong to the
macrobenthos sensu strictu (e.g. Mysidacea). Nematoda were excluded because of
inadequate sampling techniques for quantifying meiofauna.
The calculated univariate parameters were: density (ind./m²), biomass (Wet
Weight/m²) and number of species (N0). All analyses were performed within PRIMERv6
(Plymouth Routines in Multivariate Ecological Research; Clarke & Gorley, 2006). The
univariate parameters per sample within and around each dumping side is mapped with
GIS.
To scale the degree of impact, due to the dumping activities, a benthic index, the
Benthic Ecosystem Quality Index (level 3), is used (Van Hoey et al., 2007; Ysebaert et al., in

37
prep; www.beqi.eu). The BEQI was designed to evaluate the deviation in density, biomass,
number of species and species composition between the impact and the control area.
4.2.2.2 Epibenthos and demersal fish
4.2.2.2.1 SAMPLING
Demersal fish fauna and epibenthos can be defined as organisms living on or in close
association with the seafloor, and that are caught representatively and efficiently with a
beam trawl. Both ecosystem components were sampled with an 8-meter beam trawl ,
equipped with a fine-meshed shrimp net (stretched mesh width 22mm in the codend) and a
bolder-chain but no tickler chains (to minimize the environmental damage) (Figure 13). The
net was dragged during 30 minutes at an average speed of 4 knots over the bottom. As
such, an average distance of 3500 m was covered. This sampling method was used up to
2009. Since 2010, the tracks (short tracks) are half as long as the original tracks (long
tracks) so the sampling distance and time is 1750m and 15 minutes (see chapter 7). Data
were recorded on time, start and stop coordinates trajectory and sampling depth in order to
enable a correct conversion towards sampled surface units. The fish tracks were positioned
following depth contours that run parallel to the coastline, thereby minimizing the depth
variation within a single track.
Figure 13. An 8-meter beam trawl with a fine-meshed shrimp net and a bolder chain.
The complete catch was sorted using a rinsing and sieving machine. As such, three
fractions were obtained: a coarse fraction with mainly larger fish, adult starfishes and sea
urchins; a shrimp fraction with mainly crustaceans, ophiuroids and smaller fishes and a fine
fraction with mollusks and sea anemones. From these fractions, all fish, except gobies,
were identified, measured and/or counted on board. After fish elimination, representative
subsamples (2 to 10l) from each fraction were taken for epibenthos analyses. For a number
of tows, the epibenthos (except gobies and small and/or rare species) subsamples were
processed on board as well; for other tows, the subsamples were frozen for further
laboratory analyses. Rare or peculiar species/individuals were stored for further reference
or investigation.

38
4.2.2.2.2 STATISTICAL ANALYSIS
The net contents were divided into ‘demersal fish’ and ‘epifauna’. These ecosystem
components were dealt with separately concerning density, biomass (epibenthos only),
diversity and community structure. Furthermore, from the epibenthos dataset, the
polychaetes Nereis and Nepthys were deleted, ascidians and the barnacle Balanus, since
these species were not representatively sampled. Gobiidae, belonging to the order of
Perciformes, were treated separately due to their abundance and local importance.
The community structure of epifauna and demersal fish was analysed using the
multivariate techniques non-metric available in Primer v6 (Plymouth Routines in Multivariate
Ecological Research; Clarke & Gorley, 2006). These analyses were based on 4th root
transformed and reduced datasets of frequency of occurrence and density. Based on the
multivariate results, structuring factors were determined. Since a different sampling method
(short versus long tracks) was used in 2009 and 2010, analyses were conducted per year.
The number of individuals per sample and per species was converted to number of
individuals per 1000m² (density). Biomass was expressed as grams of wet weight (WW) per
1000m² and diversity was evaluated based on the expected number of species (ES) and N1
(Hill, 1973). Statistical differences between the parameters were calculated with
Permutational MANOVA, an extend of Primer v6.
4.2.2.3 Chemical contaminants in sediment and biota
4.2.2.3.1 SAMPLING
Sediment samples (Table 6) were taken at different stations both inside and outside
the dredge spoil disposal sites. Sampling stations more distant from the dumping sites are
equally foreseen, as the silt is spread rapidly and distant from the original dumping point.
Especially for chemicals which are known to strongly bind to silt, this spread is important.
Analysis of sediment included grain size distribution, organic carbon content, carbonate
content and analysis of CBs (chlorobiphenyls), chlorinated pesticides and metals on the fine
fraction (< 63 µm). Results for sediment are always expressed on a dry weight (d.w.) basis.
Table 6. Overview of the stations used as impact and control for the chemical analysis on sediment and biota.
Dumping site Impact/control Biota Sediment
Br&W Zeebrugge Oost Impact 7001 LZO 01 – LZO 06 Control B10 LZO 08 – LZO 13 Control 150/ZVL/ZEB
Br&W S2 Impact 7101 LS2 01 – LS2 07 Control B07 LS2 08 – LS211 Control B04 B031/B041
Br&W S1 Impact 7801 LS1 01 – LS1 11 Control 7802 LS1 17 – LS1 22 Control 350 780/B08/B031/B032
Br&W Oostende Impact 1401 LOO 01 – LOO 07 Control 140 LOO 08 – LOO 13 Control 140/ZVL
Nieuwpoort Impact 2251 LNP 01 – LNP 07 Control 120 LNP 08 – LNP 11 Control 230 120/230

39
The biota species used for chemical analysis are starfish, sea anemone, bivalves,
crustaceans (brown shrimp, swimming crab and hermit crab) and fish (dragonet, goby and
hooknose). Assessment of marine biota included the analysis of PCBs, chlorinated
pesticides, metals and PAHs. All results for biota are expressed on a wet weight (w.w.)
basis. Table 6 gives the sampled tracks at the dumping sites.
4.2.2.3.2 ANALYSIS
Metal analysis was carried out by CODA (Centre for Research in Veterinary and
Agrochemistry, Tervuren). Metals were solubilised from sediment using a mixture of nitric
acid, hydrofluoric acid and perchloric acid, as prescribed by QUASIMEME (Quality
Assurance in Marine Environmental Monitoring in Europe), followed by a dilution step and
quantification. Al and Fe were analysed as major components in sediments using ICP-AES
(Inductively Coupled Plasma – Atomic Emission Spectrophotometry). As, Cr, Cu, Ni, Pb, Zn
(in mg/kg) and Cd (in µg/kg) were quantified using ICP-MS (Mass Spectrometry) and Hg
(in µg/kg) was analysed using gold amalgamation (AMA) followed by AFS (Atomic
Fluorescence Spectrophotometry). All measurements were completed on the fine sediment
fraction (<63 µm). Reference materials were included in analysis batches, and the lab
successfully participated in international inter-calibration exercises. Metal assessment in
biota was completed by the same lab, but Al and Ni were not quantified, and the applied
pretreatment was different. Biota samples were extracted with nitric acid at high
temperature by microwave digestion in pressure bombs. For final analysis, the same
techniques as for sediments were applied.
PAHs were extracted from biota using hexane after a methanol-KOH digest, followed
by clean-up with alumina oxide. After concentration of the sample at low temperature
(30 °C) under a gentle nitrogen flow, samples were analysed with HPLC and fluorescence
detection. The recovery of the procedure was checked with a 6-methylchrysene internal
standard, and every batch included a blank and a reference sample. The participation in
intercalibration exercises yields good results for some 95 % of the determinants. Following
PAHs were quantified: acenaphtene, acenaphtylene, anthracene, benzo-a-anthracene,
benzo-b-fluoranthene, benzo-k-fluoranthene, benzo-g,h,i-perylene, benzo-a-pyrene,
chrysene, dibenz-a,h-anthracene, indeno-1,2,3(c,d)-pyrene, fluoranthene, fluorene,
phenantrene and pyrene. All concentrations are expressed as µg/kg w.w.
For quantification of CBs and chlorinated pesticides, different extraction methods were
used for sediment and biota. For sediments, typically 3 grams were extracted by hexane-
acetone (v:v% 75:25) in a soxhlet for 6 hour, followed by desulphurisation using TBA
(tetrabutyl ammonium sulphate), and solvent was largely evaporated at 30 °C under a
gentle nitrogen stream. On biota samples, a fat extraction was generally performed by using
a Bligh and Dyer extraction (chloroform-methanol). For bivalves except mussels, a Smedes
extraction was applied. The fat content was determined by weighing after solvent
evaporation.

40
The clean-up of biota and sediment extracts were achieved by bringing the extract
onto an alumina oxide column, and eluted with hexane. Subsequently, the elution was
concentrated to 0.7ml. Afterwards, a fractionation was achieved using a silica column.
The CBs were eluted by hexane, as well as HCB (hexachlorobenzene) and p,p’-DDE
(dichlorodiphenylethylene). The remaining pesticides were eluted with hexane-diethylether
(v:v% 90:10). After concentration, the samples were spiked with TCN
(tetrachloronaphtalene) as analytical recovery standard, and diluted up to 1 ml for analysis.
Quantification was done with a GC equipped with ECD (Electron Capture Detector).
The CB run included IUPAC numbers 28, 31, 52, 101, 105, 118, 138, 153, 156 and 180;
HCB and p,p’-DDE. The pesticide run included alpha-HCH (Hexachlorocyclohexane),
gamma-HCH, aldrin, transnonachlor, dieldrin, p,p’-DDD (dichlorodiphenyldichloroethane)
and p,p’-DDT (trichloro-diphenyldichloroethane). All results are expressed in µg/kg.
Reference and blanks samples were systematically included in all batches, and
participation in international intercalibration exercises was done several times a year. For
ease of interpretation of large data sets, concentrations of CBs might be summed (Sum of
10 CBs: IUPAC 28, 31, 52, 101, 105, 118, 153, 156, 180), the same is the case for sum
DDT, including DDD, DDE and DDT values.
The normal distribution of the data was verified by the Kolmogorov-Smirnov Test and
by Q-Q plots. Impact and control assessments on sediments for the different dumping sites
are statistically evaluated using T-tests for independent samples.
4.2.2.4 Biological Effects of Contaminants: Fish diseases and parasites
4.2.2.4.1 SAMPLING
The Belgian Part of the North Sea was divided in different areas through assembling
of the results of similar zones. The first sampled zone (Impact Zone) includes the dredge
spoil dumping sites: Nieuwpoort, Br&W Oostende, Br&W Zeebrugge Oost, Br&W S1 and
Br&W S2. The results for some additional sites, studied in the context of other monitoring
programmes, were integrated in this study as reference zones. A first reference zone
includes the coastal reference sites of the BPNS (Reference Zone 1/ coastal reference
area): Westdiep, Oostende bank, Oostdyck, Buitenratel and Kwintebank. A second
reference zone includes reference sites in open sea of the BPNS (Reference Zone 2/
offshore reference area): Scharrebank, Bligh bank, Fairybank, the Hinderbanken and other
open sea points.
In some areas, the sampling size of certain fish species was still too small and not
representative for the overall observed prevalence of the diseases. This is definitely the
case for the coastal areas during spring 2010. Therefore, no overall observed prevalence
was calculated and the results were not included in this report. Only sample sizes larger
than 100 fishes are considered as representative. For each zone, all fish larger than 15 cm
are collected.

41
4.2.2.4.2 ANALYSIS
The selected organisms should be abundant and exhibit diseases which are easily
recognized. Dab (Limanda limanda) is an appropriate organism to use in monitoring
programs for fish pathology because of its demersal location and low mobility (Bucke et al.,
1996). However, in the examined zones, dab was not always sufficiently present. Therefore,
the monitoring was extended to most of the commercial flatfish species: dab (Limanda
limanda), plaice (Pleuronectes platessa), Dover sole (Solea solea) and flounder (Platichthys
flesus). Roundfish species were chosen as additional organisms for disease monitoring:
whiting (Merlangius merlangus), bib (Trisopterus luscus) and cod (Gadus morhua). The
main focus was put on disease monitoring of the flatfish dab and the round fish whiting. The
fishes were examined for the presence of the following diseases: skin ulcers, skeletal
deformities (including scoliosis, lordosis, and vertebral compression), pigmentation,
lymphocystis, papilloma, liver nodules and the following parasites: Cryptocotyle lingua,
Clavella sp., Acanthochondria cornuta, Lepeophtheirus pectoralis, Lernaeocera branchialis,
Glugea stephani and Anisakis sp (Figure 14).
Figure 14. Pictures of the diseases and parasites: Pigmentation, Glugea sp., Stephanostomum sp., Lernaeocera sp. Epidermal papilloma, Anisakis sp. and Lepeoptheirus sp.
4.2.2.5 Biological Effects of Contaminants: EROD activity as biochemical indicator of
xenobiotic substance accumulation.
4.2.2.5.1 INTRODUCTION
The effects of contaminating substances (PCBs, PAHs, …) in living organisms can be
studied through the upregulation of enzymatic activities involved in biotransformation of
pollutants following their binding on the aryl hydrocarbon receptor (ArH receptor).
Upregulated enzyme activities may serve as ‘early warning’ signals for pollution. Here, the
biochemical biomarker EROD (7-ethoxyresorufin O-deethylase) activity is used as an
indicator of xenobiotic substance accumulation in the flatfish dab. Assessment of the EROD
activity is one of the required indicators of pollution by the Joint Assessment and Monitoring
Programme (JAMP) under the coordination of OSPAR.

42
4.2.2.5.2 SAMPLING
The study area for monitoring the biological effects of contaminants comprises the
main dredge spoil dumping sites: Nieuwpoort, Br&W Oostende, Br&W Zeebrugge Oost,
Br&W S1 and Br&W S2 and three preference zones (Westdiep, Steendiep and Raan). If
possible, the same control zones as for macro- and epibenthos monitoring were used.
When insufficient sampling material was present, control zones could be expanded. The
main goal of biochemical monitoring is a follow-up of the introduction of contaminants by
dredge spoil disposal and the biological effects on biota of these contaminants.
Biochemical monitoring uses liver homogenates of small dab Limanda limanda (9-
13 cm), caught in their natural environment. Dab is an appropriate organism because it is a
demersal fish with a low mobility. However, the decreasing trend in the appearance of small
dabs on the BPNS forms a major problem for the assessment of the biochemical EROD
activity. Large sampling sizes are needed to use this biomarker in an integrated monitoring
strategy.
4.2.2.5.3 ANALYSIS
Dab livers were excised and homogenised in a homogenisation buffer using a Potter-
Elvjeghem homogenisation device. The homogenate was centrifuged to remove fat and
debris, and the supernatant was used for EROD activity measurement. An ¼ dilution was
made for the assessment of the protein concentration, needed to normalize the EROD
activity results. EROD activity was measured using a fluorescence spectrophotometer to
quantify kinetics of the conversion of ethoxy-resorufin (non fluorescent) to resorufin
(fluorescent). A bicinchoninic acid (BCA) protein assay was used to determine the protein
level of the supernatans (Smith et al. 1985). The BCA protein assay is based on the
colorimetric detection of bicinchoninic acid using a spectrophotometer (UV-VIS). EROD
activities are reported in (pmol)/(min.mg protein).
The EROD assay is based on the method of Burke & Mayer (1974). ICES guidelines
are used for the assessment of the EROD activity in dab liver (Stagg & McIntosh, 1998).
The protocol was adapted and participation in an inter-laboratory proficiency test organised
by BEQUALM (Biological Effects Quality Assurance in Monitoring Programs) proved good
analysis.
Normal distribution of the data was examined by the Kolmogorov-Smirnov Test and by
Q-Q plots. The influence of sex on the EROD assay was evaluated using an non-parametric
Mann-Whitney U test (p<0.05). Impact and control assessments are statistically evaluated
by Kruskal-Wallis tests (p<0.05).
Besides the EROD assay, it is possible to assess other alkoxy resorufin deethylase
(AROD) activities; e.g. methoxyresorufin-O-deethylase (MROD) activity and
pentoxyresorufin-O-deethylase (PROD) activity. The MROD and EROD assays are CYP1A1
mediated deethylations, while the PROD assay deals with a CYP2B mediated deethylation.
In all three AROD assays, the different substrates are converted to the fluorescent resorufin.
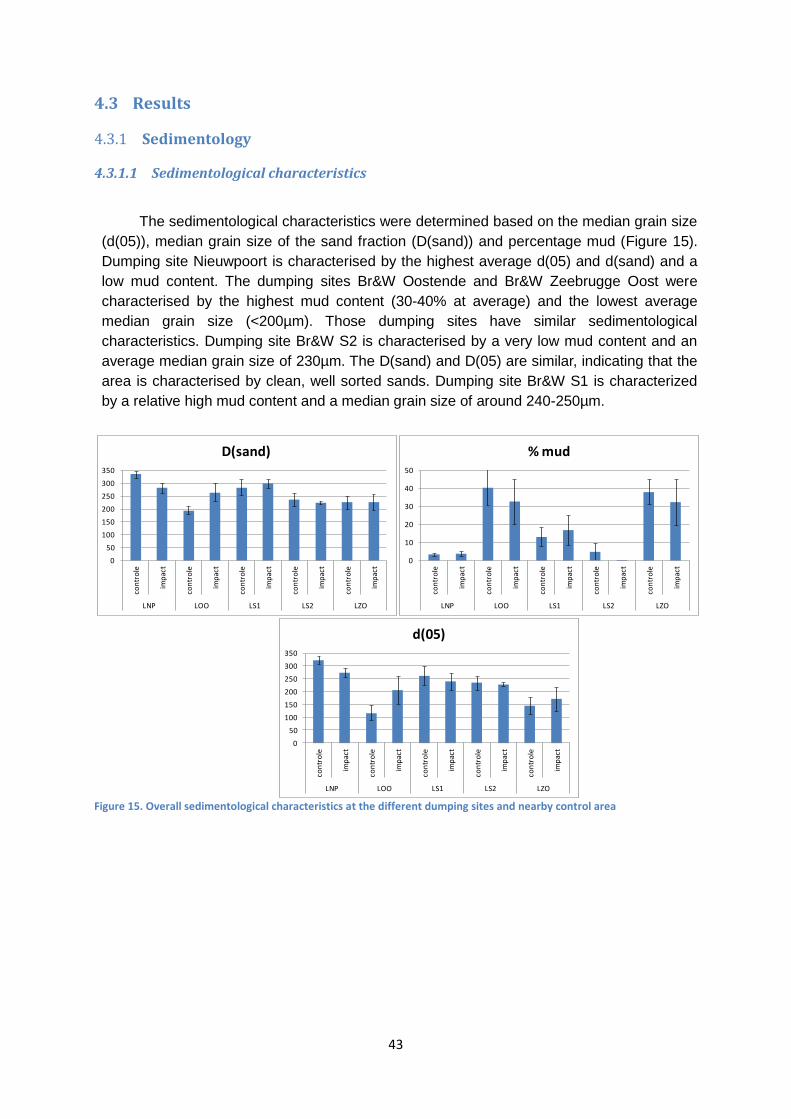
43
4.3 Results
4.3.1 Sedimentology
4.3.1.1 Sedimentological characteristics
The sedimentological characteristics were determined based on the median grain size
(d(05)), median grain size of the sand fraction (D(sand)) and percentage mud (Figure 15).
Dumping site Nieuwpoort is characterised by the highest average d(05) and d(sand) and a
low mud content. The dumping sites Br&W Oostende and Br&W Zeebrugge Oost were
characterised by the highest mud content (30-40% at average) and the lowest average
median grain size (<200µm). Those dumping sites have similar sedimentological
characteristics. Dumping site Br&W S2 is characterised by a very low mud content and an
average median grain size of 230µm. The D(sand) and D(05) are similar, indicating that the
area is characterised by clean, well sorted sands. Dumping site Br&W S1 is characterized
by a relative high mud content and a median grain size of around 240-250µm.
Figure 15. Overall sedimentological characteristics at the different dumping sites and nearby control area
0
50
100
150
200
250
300
350
con
tro
le
imp
act
con
tro
le
imp
act
con
tro
le
imp
act
con
tro
le
imp
act
con
tro
le
imp
act
LNP LOO LS1 LS2 LZO
d(05)
0
10
20
30
40
50
con
tro
le
imp
act
con
tro
le
imp
act
con
tro
le
imp
act
con
tro
le
imp
act
con
tro
le
imp
act
LNP LOO LS1 LS2 LZO
% mud
0
50
100
150
200
250
300
350
con
tro
le
imp
act
con
tro
le
imp
act
con
tro
le
imp
act
con
tro
le
imp
act
con
tro
le
imp
act
LNP LOO LS1 LS2 LZO
D(sand)

44
4.3.1.1.1 DUMPING SITE NIEUWPOORT
Figure 16. Map of dumping site Nieuwpoort with visualization of the median grain size and mud content of the samples. In the right figure, also the dumping intensity of 2009 and 2010 is visualized (increased intensity scale from yellow-green-blue to red).
The sedimentology at the dumping site Nieuwpoort is different in its Northern part
compared to the Southern part (Figure 16). The median grain size is highest in the Northern
part, whereas the mud content is lower there. This is maybe partly natural, but can also
partly related to the dumping activity, which is most frequently situated in the Southern part.
4.3.1.1.2 BR&W OOSTENDE
The sedimentological characteristics at Br&W Oostende are very variable (Figure 17).
The samples with the highest mud content and lowest median grain size were found at the
southern border and in the Northern part of the dumping site. In the southern part of the
dumping site, the median grain size of the samples are higher, with a relative high mud
content. The sedimentology at this site can be defined as muddy.
Median grain size (µm) Mud content (percentage)Legend
bagger_sed_2010(2)
mud__63µm
0% - 2.0%
2.0% - 5.0%
5.0% - 20.0%
20.0% - 100.0%
Dumping_Br&W_ed50
s1_circle_ed50
s2_ed50
noordzee
bagger_sed_2010(2)
mud__63µm
0% - 2.0%
2.0% - 5.0%
5.0% - 20.0%
20.0% - 100.0%
Legend
Dumping_Br&W_ed50
s1_circle_ed50
s2_ed50
noordzee
bagger_sed_2010(2)
d_05_
0 µm - 150.0 µm
150.0 µm - 210.0 µm
210.0 µm - 300.0 µm
300.0 µm - 426.0 µm
Nieuwpoort
± ±

45
Figure 17. Map of dumping site Br&W Oostende with visualization of the median grain size and mud content of the samples. In the right figure, also the dumping intensity of 2009 and 2010 is visualized (increased intensity scale from yellow-green-blue to red).
4.3.1.1.3 BR&W S1
The samples in the southeastern part of the dumping site Br&W S1 are characterised
by a low mud content, except a few just outside the site (Figure 18). In the Western part, the
sedimentological characteristics are very variable, especially in mud content. This can be
caused by the very frequently dumping activities in this part of the dumping site Br&W S1.
Figure 18. Map of dumping site Br&W S1 with visualization of the median grain size and mud content of the samples. In the right figure, also the dumping intensity of 2009 and 2010 is visualized (increased intensity scale from yellow-green-blue to red).
Median grain size (µm) Mud content (percentage)Legend
bagger_sed_2010(2)
mud__63µm
0% - 2.0%
2.0% - 5.0%
5.0% - 20.0%
20.0% - 100.0%
Dumping_Br&W_ed50
s1_circle_ed50
s2_ed50
noordzee
bagger_sed_2010(2)
mud__63µm
0% - 2.0%
2.0% - 5.0%
5.0% - 20.0%
20.0% - 100.0%
Legend
Dumping_Br&W_ed50
s1_circle_ed50
s2_ed50
noordzee
bagger_sed_2010(2)
d_05_
0 µm - 150.0 µm
150.0 µm - 210.0 µm
210.0 µm - 300.0 µm
300.0 µm - 426.0 µm
Br&W Oostende
± ±
Median grain size (µm) Mud content (percentage)
Legend
bagger_sed_2010(2)
mud__63µm
0% - 2.0%
2.0% - 5.0%
5.0% - 20.0%
20.0% - 100.0%
Dumping_Br&W_ed50
s1_circle_ed50
s2_ed50
noordzee
bagger_sed_2010(2)
mud__63µm
0% - 2.0%
2.0% - 5.0%
5.0% - 20.0%
20.0% - 100.0%
Legend
Dumping_Br&W_ed50
s1_circle_ed50
s2_ed50
noordzee
bagger_sed_2010(2)
d_05_
0 µm - 150.0 µm
150.0 µm - 210.0 µm
210.0 µm - 300.0 µm
300.0 µm - 426.0 µm
Br&W S1
± ±

46
4.3.1.1.4 BR&W S2
Figure 19. Map of dumping site Br&W S2 with visualization of the median grain size and mud content of the samples. In the right figure, also the dumping intensity of 2009 and 2010 is visualized (increased intensity scale from yellow-green-blue to red).
The mud content of the samples in and outside the dumping site Br&W S2 is very low,
except for 1 sample (Figure 19). Therefore, the median grain size of the samples is very
similar (around 210µm). This area can be characterised as a ‘clean’ sandy area. This
sedimentological observations are contradictory with the higher dumping intensity in 2009-
2010 at this side, especially in the western part.
4.3.1.1.5 BR&W ZEEBRUGGE OOST
Figure 20. Map of dumping site Br&W Zeebrugge Oost with visualization of the median grain size and mud content of the samples. In the right figure, also the dumping intensity of 2009 and 2010 is visualized (increased intensity scale from yellow-green-blue to red).
Median grain size (µm) Mud content (percentage)Legend
bagger_sed_2010(2)
mud__63µm
0% - 2.0%
2.0% - 5.0%
5.0% - 20.0%
20.0% - 100.0%
Dumping_Br&W_ed50
s1_circle_ed50
s2_ed50
noordzee
bagger_sed_2010(2)
mud__63µm
0% - 2.0%
2.0% - 5.0%
5.0% - 20.0%
20.0% - 100.0%
Legend
Dumping_Br&W_ed50
s1_circle_ed50
s2_ed50
noordzee
bagger_sed_2010(2)
d_05_
0 µm - 150.0 µm
150.0 µm - 210.0 µm
210.0 µm - 300.0 µm
300.0 µm - 426.0 µm
Br&W S2
± ±
Median grain size (µm) Mud content (percentage)
Legend
bagger_sed_2010(2)
mud__63µm
0% - 2.0%
2.0% - 5.0%
5.0% - 20.0%
20.0% - 100.0%
Dumping_Br&W_ed50
s1_circle_ed50
s2_ed50
noordzee
bagger_sed_2010(2)
mud__63µm
0% - 2.0%
2.0% - 5.0%
5.0% - 20.0%
20.0% - 100.0%
Legend
Dumping_Br&W_ed50
s1_circle_ed50
s2_ed50
noordzee
bagger_sed_2010(2)
d_05_
0 µm - 150.0 µm
150.0 µm - 210.0 µm
210.0 µm - 300.0 µm
300.0 µm - 426.0 µm
Br&W Zeebrugge Oost
± ±

47
The samples outside the dumping site Br&W Zeebrugge Oost are characterised by a
high mud content and a low median grain size, except 2 samples in the south and 2
samples in the northeast (Figure 20). Within the dumping site, the samples in the eastern
part are characterised by a higher mud content compared to those in the western part. The
highest dumping frequency is observed in the western part, characterised by the highest
sediment variability.
4.3.1.1.6 CONCLUSION
As we compare the sediment maps and the dumping intensity maps, we can conclude
that the sediment characteristics of the samples within the area with the highest dumping
intensity are more heterogeneous. The mud content, the main dredged material at most
sites, is not obvious higher compared to the samples elsewhere within a dumping site. It is
in some cases the opposite, that the samples further away, mostly in line with the mean
current direction are characterised by the highest mud content. Therefore, it seems that the
muddy material is deposited in a more wider area than the dumping spot itself.
4.3.1.2 Chemical contamination in sediment
4.3.1.2.1 INTRODUCTION
The chemical contaminants PAHs, CBs and chlorinated pesticides are known to be
strongly associated with sediment, while being almost absent in the water phase. They
mainly attach to the fine fraction while coarse particles present only few active spots.
Metals, especially these known as toxic to marine life, can also be found mainly in sediment
or suspension.
Metals analysed comprise Al and Fe, as major constituents (in %), As, Cr, Cu, Ni, Pb
and Zn (in mg/kg) and finally the most toxic Cd and Hg (in µg/kg), all expressed on a dry
weight (d.w.) basis of the fine fraction (<63 µm). Since results for Al and Fe varied very little,
data are not shown.
CBs are always present in measurable quantities, and results are shown as sum of 10
CBs (IUPAC numbers 28, 31, 52, 101, 105, 118, 138, 153, 156 and 180). Pesticide
concentrations are quite low, except for DDT and breakdown products DDE and DDD (only
pp’ isomers), presented as sum of DDT. Values for alpha-HCH and gamma-HCH are close
to or below LOD values, and rarely exceed 0.2 µg/kg d.w., the same holds for
transnonachlor and HCB. It must be stated that HCB is present in the vast majority of the
samples at a concentration of 0.1 µg/kg. Aldrin, dieldrin and endrin are never detected.
The normal distribution of the data was verified by the Kolmogorov-Smirnov Test and
by Q-Q plots. Impact and control assessments on sediments for the different dumping sites
are statistically evaluated using T-tests for independent samples.

48
4.3.1.2.2 DUMPING SITE BR&W ZEEBRUGGE OOST
For evaluation of chemical variation on this dumping site, the presence of the Scheldt
as an important source has to be taken into consideration. This dumping area is
characterized by very muddy sediments (average mud content comprises 20% of
sediment).
Heavy Metals
Figure 21 present the heavy metal content (Cd, Hg, Cu and Pb) of sediment samples
of deposit site Br&W Zeebrugge Oost. During 2009-2010, the observed concentrations are
generally higher in the impact zone compared to the control area. In spring 2010, this
difference between impact and control area was significantly for cadmium and mercury,
followed by a reduction in concentrations in autumn.
Figure 21. A) Average concentration and standard error for Cd and Hg in sediment samples of Br&W Zeebrugge Oost. Concentrations are expressed in µg/kg d.w.; B) Average concentration and standard error for Cu and Pb in sediment samples of Br&W Zeebrugge Oost. Concentrations are expressed in mg/kg d.w. Impact en Control are presented for each season. (S09: spring 2009, A09: autumn 2009, S10: spring 2010, A10: autumn 2010)
Chlorinated Biphenyls CBs
Figure 22. Average concentrations and standard errors for the sum of 10 CBs in sediment on dumping site Br&W Zeebrugge Oost. Concentrations are expressed in µg/kg d.w. Impact en Control are presented for each season. (S09: spring 2009, A09: autumn 2009, S10: spring 2010, A10: autumn 2010)
With exception of autumn 2010, the detected CB concentrations in sediments of Br&W Zeebrugge Oost are higher for impact compared to control sites (Figure 22). Pesticide concentrations (DDT) found on Br&W Zeebrugge Oost support the same trend. The seasonal variation in CB content could be neglected.
0
100
200
300
400
500
600
700
S09 A09 S10 A10
µg/
kg d
.w.
Br&W Zeebrugge Oost
Cd - IMPACT
Cd - CONTROL
Hg - IMPACT
Hg - CONTROL
0
10
20
30
40
50
60
70
S09 A09 S10 A10
mg/
kg d
.w.
Br&W Zeebrugge Oost
Cu - IMPACT
Cu - CONTROL
Pb - IMPACT
Pb - CONTROL
0
2
4
6
8
10
12
S09 A09 S10 A10
µg/
kg d
.w.
Br&W Zeebrugge Oost
IMPACT CONTROL

49
4.3.1.2.3 DUMPING SITE BR&W SI
This dumping site is located at a larger distant from the Scheldt estuary, but close to
an intensive shipping lane. It is important to mention the patchiness of the seafloor on
deposit site Br&W S1. On this site, the mud concentration is occasionally lower on the
impacted sites versus the control sites, which could make the interpretation of the results
more difficult.
Heavy Metals
No major differences are noticed between the impact and control area of dumping site
Br&W S1, and the seasonal variation on sediment pollution is negligible (Figure 23).
Figure 23. A) Average concentration and standard error for Cd and Hg in sediment samples of Br&W S1. Concentrations are expressed in µg/kg d.w.; B) Average concentration and standard error for Cu and Pb in sediment samples of Br&W S1. Concentrations are expressed in mg/kg d.w. Impact en Control are presented for each season.
Chlorinated Biphenyls CBs
With exception of autumn 2010, CB concentrations are higher at control zones
compared to impact zones (Figure 24). In agreement, the DDT concentrations are slightly
elevated on control sites (Figure 25). This trend could be supported by the very patchy
seafloor and the possible higher mud concentrations on control sites compared to impact
sites, originated by the sedimentation of dumped material. CB concentrations of sediments
on dumping area Br&W S1 (and on Br&W S2) are lower compared to the other dumping
sites, although this is not the case for DDT pesticides. Standard errors are remarkably
higher for the control sites. By a Kruskal-Wallis statistical test, CB concentrations were
found significantly higher during autumn 2010 for impact and control areas compared to the
other seasons. Therefore, follow up in 2011-2012 is important.

50
Figure 24. Average concentrations and standard errors for the sum of 10 CBs in sediment on dumping site Br&W S1. Concentrations are expressed in µg/kg d.w. Impact en Control are presented for each season.
Figure 25. Average concentrations and standard errors for the sum of 10 DDT in sediment on dumping site Br&W S1. Concentrations are expressed in µg/kg d.w. Impact en Control are presented for each season.
4.3.1.2.4 DUMPING SITE BR&W S2
The dumping site Br&W S2 is located quite near to the Scheldt estuary, so its influence has to be considered. Br&W S2 sediments are characterised as more sandy, with a very small mud content. Heavy Metals
No trend between control and impact could be observed on dumping site Br&W S2
based on the metal content (Figure 26). During spring 2010, a significant higher cadmium
concentration was observed in the impact area. This was also the case on dumping site
Br&W Zeebrugge Oost, which is also located near to the Scheldt estuary.

51
Figure 26. A) Average concentration and standard error for Cd and Hg in sediment samples of Br&W S2. Concentrations are expressed in µg/kg d.w.; B) Average concentration and standard error for Cu and Pb in sediment samples of Br&W S2. Concentrations are expressed in mg/kg d.w. Impact en Control are presented for each.
Chlorinated Biphenyls CBs
In agreement with the results on metals on dumping site Br&W S2, no significant trend
between impact and control could be observed during 2009-2010 based on CB content
(Figure 27). Standard errors were rather elevated, caused by the patchiness of the seafloor.
Pesticide (DDT) fluctuations on dumping site Br&W S2 are consistent with the CB
fluctuations. The seasonal variation in CB content could be neglected.
Figure 27. Average concentrations and standard errors for the sum of 10 CBs in sediment on dumping site Br&W S2. Concentrations are expressed in µg/kg d.w. Impact en Control are presented for each season.
4.3.1.2.5 DUMPING SITE OOSTENDE
This dumping site is more distant from major polluting sources, and the intensity of
dredged spoil disposal is rather low. This is reflected in very complete sampling and
comparability of averaged data is good. Dumping site Br&W Oostende is characterised by
muddy sediments.

52
Heavy Metals
With exception of spring 2009, a higher metal concentration (Cd, Hg, Cu & Pb) is
measured on impact sites compared to control sites of dumping area Br&W Oostende
(Figure 28). Consistent standard errors are obtained. No significant seasonal variation is
observed.
Figure 28. A) Average concentration and standard error for Cd and Hg in sediment samples of Br&W Oostende. Concentrations are expressed in µg/kg d.w.; B) Average concentration and standard error for Cu and Pb in sediment samples of Br&W Oostende. Concentrations are expressed in mg/kg d.w. Impact en Control are presented for each season.
Chlorinated Biphenyls CBs
Figure 29. Average concentrations and standard errors for the sum of 10 CBs in sediment on dumping site Br&W Oostende. Concentrations are expressed in µg/kg d.w. Impact en Control are presented for each season.

53
Figure 30. Average concentrations and standard errors for the sum of DDT in sediment on dumping site Br&W Oostende. Concentrations are expressed in µg/kg d.w. Impact en Control are presented for each season.
No significant differences in CB concentrations are observed between impact on control sites, independent of the season (Figure 29). During 2009 and 2010, a higher DDT content is observed on the impact sites of dumping area Br&W Oostende compared to the control sites (Figure 30).
4.3.1.2.6 DUMPING SITE NIEUWPOORT
This dumping site is distant from major polluting sources and influenced by Atlantic
water advection through the Channel. The intensity of dredged spoil disposal is rather low,
which is reflected in very complete sampling. This dumping area is characterised by fine
sandy sediments with a somewhat lower mud content.
Heavy Metals
Given that this dumping site is not intensively used, higher values might be caused by
old dredged spoil or by older sediments that were replaced. Only a limited variation between
impact and control was observed (Figure 31). Seasonal influence could be neglected. The
smaller standard errors point at a less patchy seafloor.
Figure 31. A) Average concentration and standard error for Cd and Hg in sediment samples of dumping site Nieuwpoort. Concentrations are expressed in µg/kg d.w.; B) Average concentration and standard error for Cu and Pb in sediment samples of dumping site Nieuwpoort. Concentrations are expressed in mg/kg d.w. Impact en Control are presented for each season.

54
Chlorinated Biphenyls CBs
Taking into account the low dumping activity, relatively high CB concentrations are
obtained on dumping site Nieuwpoort (Figure 32). For autumn 2010, CB concentrations at
the impact areas were higher than at the control areas More important, by far the highest
DDT concentrations are observed at this site compared to other dumping sites. In 2010, an
average concentration of >4 µg/kg d.w. was observed on the impact sites, while on the
other dumping sites, concentrations of ≤1 µg/kg d.w. were recorded.
Figure 32. Average concentrations and standard errors for the sum of 10 CBs in sediment on dumping site Nieuwpoort. Concentrations are expressed in µg/kg d.w. Impact en Control are presented for each season.
4.3.1.2.7 OVERVIEW DUMPING SITES
To assess the chemical differences amongst the dumping sites, the sampling period
‘autumn 2010’ was selected and the levels of contamination were evaluated. This is
illustrated by the levels of CBs and Pb in the sediment samples of the dumping areas during
autumn 2010 (Figure 33). Based on the results of sediment analysis, only minor differences
between the dumping sites could be observed.
Figure 33. Levels of CBs and Pb in sediment samples during autumn 2010 for the Impact and Control sites of the different dumping sites. Concentrations are expressed in µg/kg w.w. for the sum of CBs. Concentrations are expressed in mg/kg w.w. for Pb.
0
2
4
6
8
10
12
14
16
Br&W ZO Br&W S1 Br&W S2 Br&W OO Nieuwpoort
CB
µg
/kg
d.w
.
PCB
IMPACT CONTROL
0
5
10
15
20
25
30
35
40
45
Br&W ZO Br&W S1 Br&W S2 Br&W OO Nieuwpoort
Pb
mg
/kg
d.w
.
Pb
IMPACT CONTROL

55
4.3.1.2.8 CONCLUSION
Based on the results of 2009-2010, only small differences between impact and control
assessments are observed. For dumping sites Br&W Zeebrugge Oost and Br&W Oostende,
impact levels are slightly elevated compared to control levels. When there is a large
difference in patchiness at a dumping site, larger standard deviations could be observed.
However, no major differences between dumping sites were noticed. Influences by season
are small, still it is important to take into account the sampling period before using data in
monitoring.
Environmental assessment criteria (EAC) according to OSPAR, MSFD (Task group 8,
Joint Report) and Belgisch Staatsblad can be used to interpret the observed levels of
pollution. Consequently, monitoring data can be scored according to the EAC as presented
in Table 7. If the assessed level of a specific pollutant reaches the EAC level it is indicated
in red, if the level is lower, it is indicated as green. The EAC values for the heavy metals
cadmium and lead introduced by the MSFD are clearly more strict compared to the EAC
values of OSPAR and Belgisch Staatsblad. The observed levels of Cd and Pb on each site
clearly exceed those EAC values of MFSD, while this is definitely not the case for the other
EAC values. An similar observation could be made for the PCBs 118 and 153 by Belgisch
Staatsblad and PCB 118 by MSFD. Based on the OSPAR monitoring criteria, only
incidentally overrange levels of Pb and PCBs are observed (Table 7). Nevertheless, the
levels of lead and CBs must be followed in future. Other measured heavy metals and
persistent organic pollutants do not approach the formulated EAC values. It will be
necessary to complete this table with monitoring results of the Belgian Part of the North Sea
(BPNS) during the upcoming years. A major remark concerns the availability and relevance
of environmental assessment criteria. Extra attention must be paid to the development of
those EAC, which will be relevant for monitoring on the BPNS.

56
Table 7. Assessment criteria for sediment analysis according to OSPAR, MSFD and Belgisch Staatsblad (GREEN = OK according to EAC, RED = value above)
Dumping site Nieuwpoort Br&W Oostende Br&W S1 Br&W S2 Br&W Zeebrugge Oost
2009 2010 2009 2010 2009 2010 2009 2010 2009 2010
S A S A S A S A S A S A S A S A S A S A
I C I C I C I C I C I C I C I C I C I C I C I C I C I C I C I C I C I C I C I C
SEDIMENT
OSPAR
Cd
Hg
Pb
Cu
MFSD
Cd
Hg
Pb
Belgisch Staatsblad
Cd
Hg
Pb
Cu
OSPAR
∑7 CB
pp-DDE
MFSD CB118
CB153
Belgisch Staatsblad
CB118
CB153
pp-DDE
pp-DDT
1 OSPAR, Quality Status Report 2000, Region II Greater North Sea 2 MSFD Marine Strategy Framework Directive, Task Group 8, Contaminants and pollution effects. Law et al. 2010. 3 Belgisch Staatsblad N° 209, vrijdag 9 juli 2010

57
4.3.2 Macrobenthos
4.3.2.1 Patterns in Benthic characteristics
Figure 34. Benthic characteristics at the different dumping sites and near-by control area.
The differences in benthic characteristics (number of species, density, biomass,
diversity) between the samples (year 2010) in the impacted and nearby control area for
the different dumping areas were visualized in Figure 34. The highest number of
species and diversity is recorded at the dumping site Nieuwpoort. Dumping site Br&W
Zeebrugge Oost is characterised by the lowest diversity. The density and biomass is
highest at dumping site Nieuwpoort, both in impact and control samples. At dumping
site Br&W S1, the density and biomass is only high in the control samples. At the other
dumping sites, the density and biomass is much lower and not significant different
between impact and control samples. Only at site S1, significant difference between
0
5
10
15
20
25
30
35
40
con
tro
le
imp
act
con
tro
le
imp
act
con
tro
le
imp
act
con
tro
le
imp
act
con
tro
le
imp
act
LNP LOO LS1 LS2 LZO
Number of species, S
0
5000
10000
15000
20000
25000
con
tro
le
imp
act
con
tro
le
imp
act
con
tro
le
imp
act
con
tro
le
imp
act
con
tro
le
imp
act
LNP LOO LS1 LS2 LZO
Density
0
100
200
300
400
500
600
con
tro
le
imp
act
con
tro
le
imp
act
con
tro
le
imp
act
con
tro
le
imp
act
con
tro
le
imp
act
LNP LOO LS1 LS2 LZO
Biomass, WW
0.00
2.00
4.00
6.00
8.00
10.00
12.00
14.00
con
tro
le
imp
act
con
tro
le
imp
act
con
tro
le
imp
act
con
tro
le
imp
act
con
tro
le
imp
act
LNP LOO LS1 LS2 LZO
Diversity, N1
0
5
10
15
20
25
con
tro
le
imp
act
con
tro
le
imp
act
con
tro
le
imp
act
con
tro
le
imp
act
con
tro
le
imp
act
LNP LOO LS1 LS2 LZO
Number of species, ES(100)
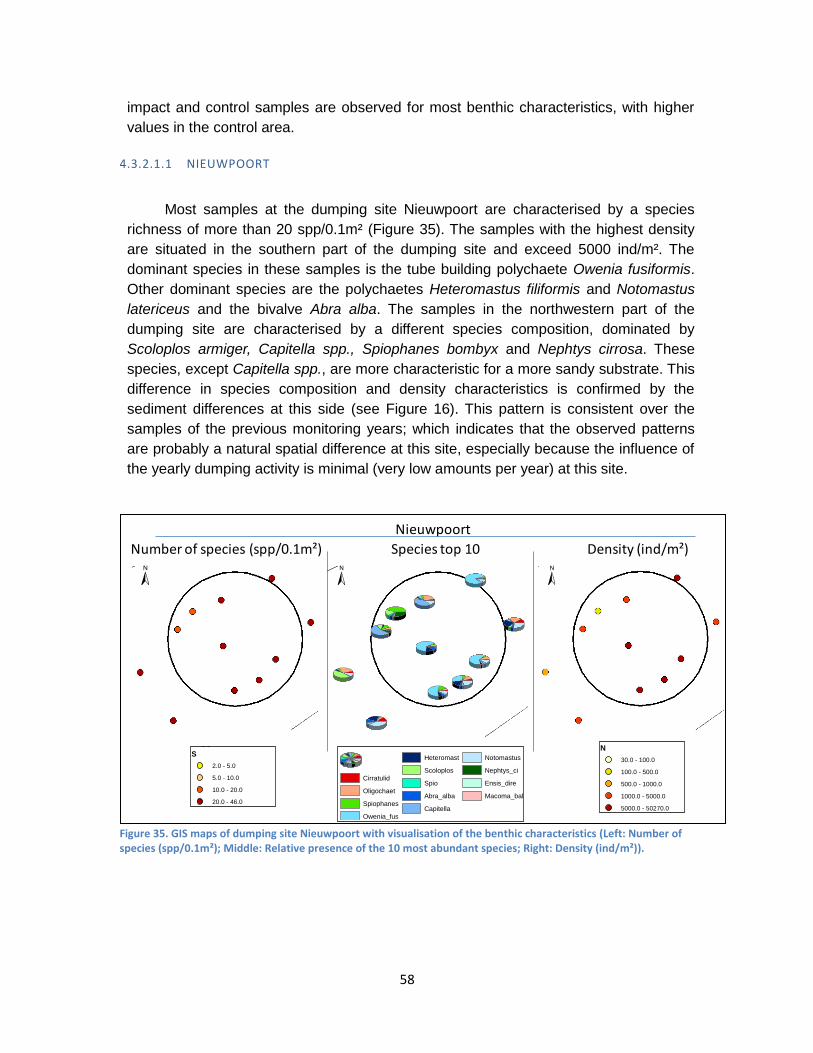
58
impact and control samples are observed for most benthic characteristics, with higher
values in the control area.
4.3.2.1.1 NIEUWPOORT
Most samples at the dumping site Nieuwpoort are characterised by a species
richness of more than 20 spp/0.1m² (Figure 35). The samples with the highest density
are situated in the southern part of the dumping site and exceed 5000 ind/m². The
dominant species in these samples is the tube building polychaete Owenia fusiformis.
Other dominant species are the polychaetes Heteromastus filiformis and Notomastus
latericeus and the bivalve Abra alba. The samples in the northwestern part of the
dumping site are characterised by a different species composition, dominated by
Scoloplos armiger, Capitella spp., Spiophanes bombyx and Nephtys cirrosa. These
species, except Capitella spp., are more characteristic for a more sandy substrate. This
difference in species composition and density characteristics is confirmed by the
sediment differences at this side (see Figure 16). This pattern is consistent over the
samples of the previous monitoring years; which indicates that the observed patterns
are probably a natural spatial difference at this site, especially because the influence of
the yearly dumping activity is minimal (very low amounts per year) at this site.
Figure 35. GIS maps of dumping site Nieuwpoort with visualisation of the benthic characteristics (Left: Number of species (spp/0.1m²); Middle: Relative presence of the 10 most abundant species; Right: Density (ind/m²)).
Number of species (spp/0.1m²) Species top 10 Density (ind/m²)
Legend
Dumping_Br&W_ed50
s1_circle_ed50
s2_ed50
noordzee
bagger_2010
S
2.0 - 5.0
5.0 - 10.0
10.0 - 20.0
20.0 - 46.0
Legend
Dumping_Br&W_ed50
s1_circle_ed50
s2_ed50
noordzee
bagger_2010
N
30.0 - 100.0
100.0 - 500.0
500.0 - 1000.0
1000.0 - 5000.0
5000.0 - 50270.0
Nieuwpoort
Legend
Dumping_Br&W_ed50
s1_circle_ed50
s2_ed50
noordzee
Cirratulid
Oligochaet
Spiophanes
Owenia_fus
Heteromast
Scoloplos
Spio
Abra_alba
Capitella
Notomastus
Nephtys_ci
Ensis_dire
Macoma_bal
± ± ±

59
4.3.2.1.2 BR&W OOSTENDE
Figure 36. GIS maps of dumping site Br&W Oostende with visualisation of the benthic characteristics (Left: Number of species (spp/0.1m²); Middle: Relative presence of the 10 most abundant species; Right: Density (ind/m²)).
The benthic samples at dumping site Br&W Oostende are characterised by a very
low number of species, especially in the southwestern part (Figure 36). The samples in
the Northern part are containing a higher species richness. One sample (LOO.14),
outside the dumping area in the east is characterised by a high species richness and
density, due to the presence of the tube-building polychaete O. fusiformis. The most
dominant species in and around the dumping site are Macoma balthica, Cirratulidae
spp and Oligochaeta spp. Those opportunistic species are very characteristic for muddy
sediments. The benthic density of those samples is mainly low, but slightly higher inside
the dumping site compared to the samples around the site.
4.3.2.1.3 BR&W S1
The benthic characteristics of the samples in and around the dumping site of
Br&W S1 are very different (Figure 37). First, some samples outside the dumping site in
the Northeast and one in the Southwest are strongly dominated by young individuals of
the tube building polychaete O. fusiformis (between the 35410- 46280 ind/m²). This is
the highest measured density of this species for the moment on the BPNS. Those
samples are also characterised by the highest species richness. Second, the samples
within the dumping site are characterised by a variable species richness and species
composition. Some samples are characterised by species of sandy substrates, as
Number of species (spp/0.1m²) Species top 10 Density (ind/m²)
Legend
Dumping_Br&W_ed50
s1_circle_ed50
s2_ed50
noordzee
bagger_2010
S
2.0 - 5.0
5.0 - 10.0
10.0 - 20.0
20.0 - 46.0
Legend
Dumping_Br&W_ed50
s1_circle_ed50
s2_ed50
noordzee
bagger_2010
N
30.0 - 100.0
100.0 - 500.0
500.0 - 1000.0
1000.0 - 5000.0
5000.0 - 50270.0
Br&W Oostende
Legend
Dumping_Br&W_ed50
s1_circle_ed50
s2_ed50
noordzee
Cirratulid
Oligochaet
Spiophanes
Owenia_fus
Heteromast
Scoloplos
Spio
Abra_alba
Capitella
Notomastus
Nephtys_ci
Ensis_dire
Macoma_bal
± ± ±
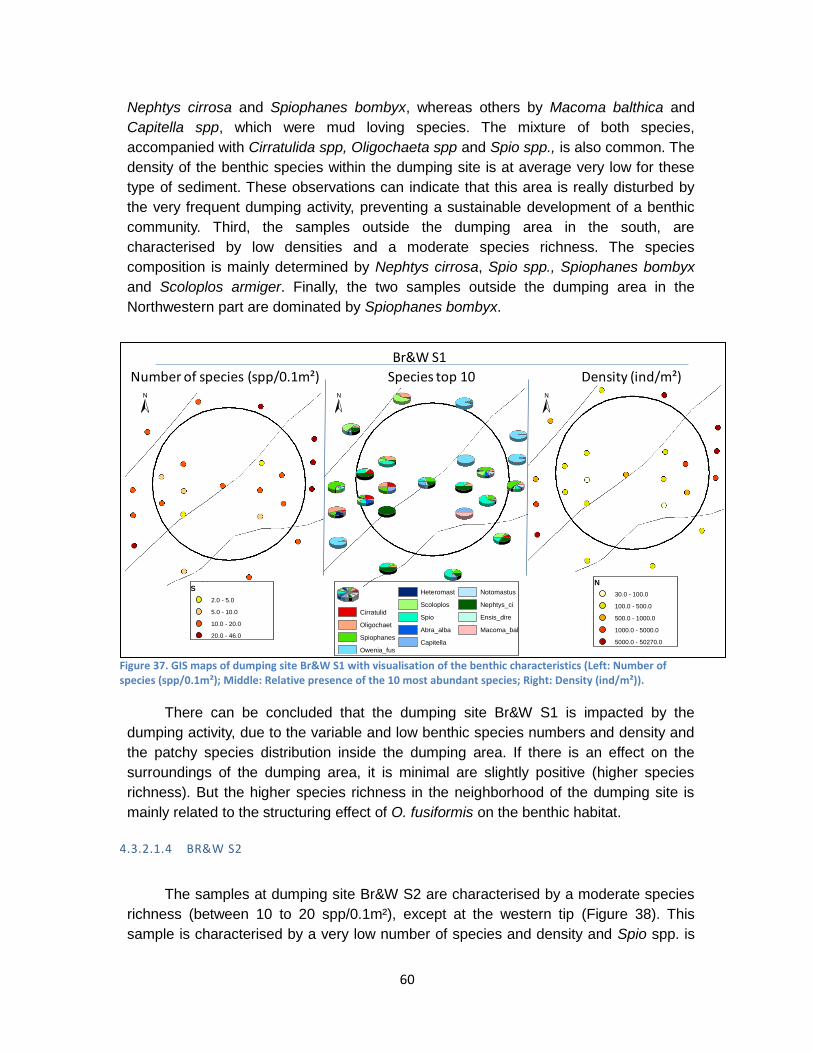
60
Nephtys cirrosa and Spiophanes bombyx, whereas others by Macoma balthica and
Capitella spp, which were mud loving species. The mixture of both species,
accompanied with Cirratulida spp, Oligochaeta spp and Spio spp., is also common. The
density of the benthic species within the dumping site is at average very low for these
type of sediment. These observations can indicate that this area is really disturbed by
the very frequent dumping activity, preventing a sustainable development of a benthic
community. Third, the samples outside the dumping area in the south, are
characterised by low densities and a moderate species richness. The species
composition is mainly determined by Nephtys cirrosa, Spio spp., Spiophanes bombyx
and Scoloplos armiger. Finally, the two samples outside the dumping area in the
Northwestern part are dominated by Spiophanes bombyx.
Figure 37. GIS maps of dumping site Br&W S1 with visualisation of the benthic characteristics (Left: Number of species (spp/0.1m²); Middle: Relative presence of the 10 most abundant species; Right: Density (ind/m²)).
There can be concluded that the dumping site Br&W S1 is impacted by the
dumping activity, due to the variable and low benthic species numbers and density and
the patchy species distribution inside the dumping area. If there is an effect on the
surroundings of the dumping area, it is minimal are slightly positive (higher species
richness). But the higher species richness in the neighborhood of the dumping site is
mainly related to the structuring effect of O. fusiformis on the benthic habitat.
4.3.2.1.4 BR&W S2
The samples at dumping site Br&W S2 are characterised by a moderate species
richness (between 10 to 20 spp/0.1m²), except at the western tip (Figure 38). This
sample is characterised by a very low number of species and density and Spio spp. is
Number of species (spp/0.1m²) Species top 10 Density (ind/m²)
Legend
Dumping_Br&W_ed50
s1_circle_ed50
s2_ed50
noordzee
bagger_2010
S
2.0 - 5.0
5.0 - 10.0
10.0 - 20.0
20.0 - 46.0
Legend
Dumping_Br&W_ed50
s1_circle_ed50
s2_ed50
noordzee
bagger_2010
N
30.0 - 100.0
100.0 - 500.0
500.0 - 1000.0
1000.0 - 5000.0
5000.0 - 50270.0
Br&W S1
Legend
Dumping_Br&W_ed50
s1_circle_ed50
s2_ed50
noordzee
Cirratulid
Oligochaet
Spiophanes
Owenia_fus
Heteromast
Scoloplos
Spio
Abra_alba
Capitella
Notomastus
Nephtys_ci
Ensis_dire
Macoma_bal
± ± ±

61
the dominant species. The density of the samples at the dumping site and its
surroundings is very variable. There is an indication that the samples in the western
part are characterised by the lowest densities. This coincide with the fact that this part
of the dumping side is frequently used over the period 2009-2010 for dumping dredged
material. The samples are varying in species composition and follow a clear distribution
pattern, with dominance of the bivalve Ensis directus in the Southern part and the
dominance of the bivalve Abra alba in the Northern part. The northern part is also
characterised by species characteristic for more muddy conditions, as Spio spp., Abra
alba and Cirratulidae spp. Higher mud content in the sediment samples was not
observed in this area, except for one (see Figure 19).
Figure 38. GIS maps of dumping site Br&W S2 with visualisation of the benthic characteristics (Left: Number of species (spp/0.1m²); Middle: Relative presence of the 10 most abundant species; Right: Density (ind/m²)).
4.3.2.1.5 BR&W ZEEBRUGGE OOST
The samples in and around the dumping area of Br&W Zeebrugge Oost are
characterised by a low number of species and density (Figure 39). A few samples
outside the dumping area has a higher benthic density (> 5000ind/m²). The area is
clearly dominated by Cirratulidae spp., Oligochaeta spp and Macoma balthica. In a few
samples also the presence of the tube building polychaete Owenia fusiformis is
observed. At this side, it seems that the dumping area and its surroundings are
characterised by the same benthic characteristics. The samples (control + impact)
located in the western part of this area tend to be characterised by a lower number of
species and density compared to the samples in the eastern part.
Number of species (spp/0.1m²) Species top 10 Density (ind/m²)
Legend
Dumping_Br&W_ed50
s1_circle_ed50
s2_ed50
noordzee
bagger_2010
S
2.0 - 5.0
5.0 - 10.0
10.0 - 20.0
20.0 - 46.0
Legend
Dumping_Br&W_ed50
s1_circle_ed50
s2_ed50
noordzee
bagger_2010
N
30.0 - 100.0
100.0 - 500.0
500.0 - 1000.0
1000.0 - 5000.0
5000.0 - 50270.0
Br&W S2
Legend
Dumping_Br&W_ed50
s1_circle_ed50
s2_ed50
noordzee
Cirratulid
Oligochaet
Spiophanes
Owenia_fus
Heteromast
Scoloplos
Spio
Abra_alba
Capitella
Notomastus
Nephtys_ci
Ensis_dire
Macoma_bal
± ± ±

62
Figure 39. GIS maps of dumping site Br&W Zeebrugge Oost with visualisation of the benthic characteristics (Left: Number of species (spp/0.1m²); Middle: Relative presence of the 10 most abundant species; Right: Density (ind/m²)).
4.3.2.2 Benthic indicator (BEQI)
Table 8. Evaluation of the difference between control and impact samples in autumn 2010 at the five dumping sites for the ecosystem component macrobenthos. The values represent the BEQI-index, the colors the status(blue: high; green: good; yellow: moderate; orange: poor; red: bad).
BEQI Dumping site Nieuwpoort
Br&W Oostende
Br&W S1 Br&W S2 Br&W Zeebrugge
Oost
Density 0.37 0.81 0.06 0.75 0.77
Biomass 0.97 0.88 0.08 0.68 0.76
Similarity 0.58 0.66 0.38 0.56 0.49
Species 1 0.73 0.45 1 0.74
Average 0.73 0.77 0.24 0.75 0.68
The ecological status of the macrobenthos at the different disposal sites is
evaluated with the benthic indicator BEQI, which weighed the difference in the
parameters density, biomass, species composition (Bray-Curtis similarity) and number
of species between the set of impact and control samples (Table 8).
Based on the BEQI evaluation, only dumping site Br&W S1, gives a score ‘poor’
for the status of the macrobenthos. This can mainly be attributed to the very low scores
for density and biomass, which are much higher in the control samples compared to the
impact samples. This difference is caused by the dominance of the tube building
Number of species (spp/0.1m²) Species top 10 Density (ind/m²)
Legend
Dumping_Br&W_ed50
s1_circle_ed50
s2_ed50
noordzee
bagger_2010
S
2.0 - 5.0
5.0 - 10.0
10.0 - 20.0
20.0 - 46.0
Legend
Dumping_Br&W_ed50
s1_circle_ed50
s2_ed50
noordzee
bagger_2010
N
30.0 - 100.0
100.0 - 500.0
500.0 - 1000.0
1000.0 - 5000.0
5000.0 - 50270.0
Br&W Zeebrugge Oost
Legend
Dumping_Br&W_ed50
s1_circle_ed50
s2_ed50
noordzee
Cirratulid
Oligochaet
Spiophanes
Owenia_fus
Heteromast
Scoloplos
Spio
Abra_alba
Capitella
Notomastus
Nephtys_ci
Ensis_dire
Macoma_bal
± ± ±

63
polychaete Owenia fusiformis in the control samples, with densities up to 46.000
ind/m². At this dumping site, the diversity (number of species) was also lower in the
impacted area compared to the surroundings.
On average, the status of the macrobenthos is good at the dumping site
Nieuwpoort. The lower score for density and similarity can be attributed to the
dominance of Owenia fusiformis in the impacted area.
At dumping site Br&W Oostende and Br&W Zeebrugge Oost, the benthic
parameters deviate not between the impacted area and the surroundings. The
evaluation of the parameters density and biomass is less confident because the high
variability between the individual samples. Both areas are characterised by a higher
heterogeneity in their sedimentological and biological characteristics.
At dumping site Br&W S2, the macrobenthos status was good, which indicates
that there is no significant difference observed between the impact samples and the
control samples. Nevertheless, some remarkable differences are observed between the
samples. The benthic characteristics of the samples indicate an enrichment of the
Northern samples with mud ‘loving’ species, whereas the samples in the western part
are more impoverished (lower diversity). At this side, the invasive alien species Ensis
directus was rather dominant. If this could be attributed to the higher dumping
intensities over the period 2009-2010 than in previous years is not unambiguous. From
the dumping intensity maps could be derived that the dumping in 2009 was
concentrated in the Northern part, whereas in 2010 it was in the western part.
4.3.2.3 Conclusion
The patterns observed at the five dumping sites in autumn 2010 confirm those of
previous years. At the dumping sites Br&W Oostende and Br&W Zeebrugge Oost,
naturally characterised by an instable, sandy mud and a poor benthic community, the
medium to high dumping intensity does not really affect the benthic life. The variability
in the benthic characteristics at dumping site Nieuwpoort is more likely natural, and is
not related to the low dumping intensity. The changes in the benthic characteristics at
site Br&W S1 are still the result of the loss of Abra alba habitat within the dumping area.
This side is subjected to the highest dumping intensities over the period 2009-2010,
especially in 2009 and contribute to those ecological changes. Despite, the good status
at dumping site Br&W S2, some remarkable differences in benthic characteristics were
observed between the western and northern part of the side, which can have a link with
the dumping activity over the period 2009-2010.

64
4.3.3 Epibenthos and demersal fish
4.3.3.1 Habitat characterisation
For the sampling campaigns and analyses in the previous years, the position of
the impact and control stations have been determined by expert judgement. Also, a
number of overall monitoring stations have been assigned as control stations. To know
whether those overall monitoring stations actually are appropriate as control stations for
the accompanying impact stations, an objective habitat characterisation was
conducted. A cluster- and MDS-analysis (see Figure 40) of the epibenthos data
revealed five epibenthic clusters on a similarity level of 50%. Cluster 2, 4a and 4b show
high affinity with the ‘coastal 1’-group defined in Vandendriessche et al. (In prep.). The
assemblage of this group is characterised by high densities and diversity. Further,
cluster 5 corresponds well with the ‘coastal 2’-group, which is typified by intermediate
densities and diversity. Cluster 1 matches well with the ‘coastal 3’-group, which is
characterised by low densities and diversity. The density, number of species, most
distinctive species and samples per cluster are visualised in Table 9.Table 9.
Characteristic epibenthic species and community parameters for the defined clusters.
Figure 40. Multidimensional Scaling (MDS) plot of the epibenthic data of 2009-2010 with indication of the different biological clusters.
The habitat characterisation makes it possible to gain a clear insight into the
relation between samples and habitat type. The overall monitoring stations and the
impact stations which are clustering together are typified by the same habitat type. So,
these overall monitoring stations can function as control stations for the corresponding
Transform: Fourth root
Resemblance: S17 Bray Curtis similarity
cluster2
4a
5
1
4b
3
2D Stress: 0.19

65
impact stations. Table 10 gives an overview of the dumping sites, impact stations,
control stations and overall monitoring stations which function as control stations.
Table 9. Characteristic epibenthic species and community parameters for the defined clusters.
cluster 1 2 3 4a 4b 5
habitat coastal 3 coastal 1 coastal 1 coastal 1 coastal 2 Density (ind/m²)
89±127
2037±1251
216
1083±810
2357±1392
314±351
Number of species
10
17
7
9
9
9
SIMPER species
Ophiura ophiura Macoma balthica Crangon crangon Asterias rubens
O. ophiura C. crangon A. rubens Ophiura albida
C. crangon A. rubens Liocarcinus holsatus Ensis
O. ophiura A. rubens C. crangon Pagurus bernhardus
C. crangon O. ophiura A. rubens L. holsatus
C. crangon O. ophiura L. holsatus A. rubens
samples ft140(3) C ft1401(2) I ft1402(2) C ft7001(3) I ft7002(2) C
ft120(3) C ft1401(1) I ft2251(3) I ft2252(3) C 230(1) C ft7801(2) I ft7802(4) C
ft1402(1) C ft120(2) C ft230(4) C ft7802(1) C ftB03(1) C ft B07(1)C
ft140(1) C ft230(2) C ft7002(1) C ft7101(2) I ft7102(2) C ft7802(1) C ft7803(1) I ftB03(1) C ftB07(2) C ftB10(2) C
ft 140(2) C ft1402(1) C ft7001(2) I ft7002(2) C ft7101(2) I ft7102(2) C ft7803(2) I ft7804(3) I ftB04(5) C ftB07(2) C ftB10(2) C
Table 10. Overview of the impact stations, control stations and overall monitoring stations per dumping site, for epibenthos and demersal fish.
Nieuwpoort Br&W Oostende
Br&W Zeebrugge Oost
Br&W S1
Br&W S2
Impact stations ft2251
ft1401
ft7001 ft7803 ft7804
ft7101
Control station ft2252
ft1402 ft7002 ft7802 ft7102
Overall monitoring stations
ft120 ft230
ft140 ft140 ftB07 ftB10
ftB04 ft230
ftB04 ftB03
Similar analyses were conducted for the demersal fish data. The patterns in the
fish dataset were not explicitly present as in the epibenthic dataset. However, we could
distinguish a global consistency between both data sets. Therefore and for practical
reasons, the same control stations were applied for both, epibenthos and demersal fish.
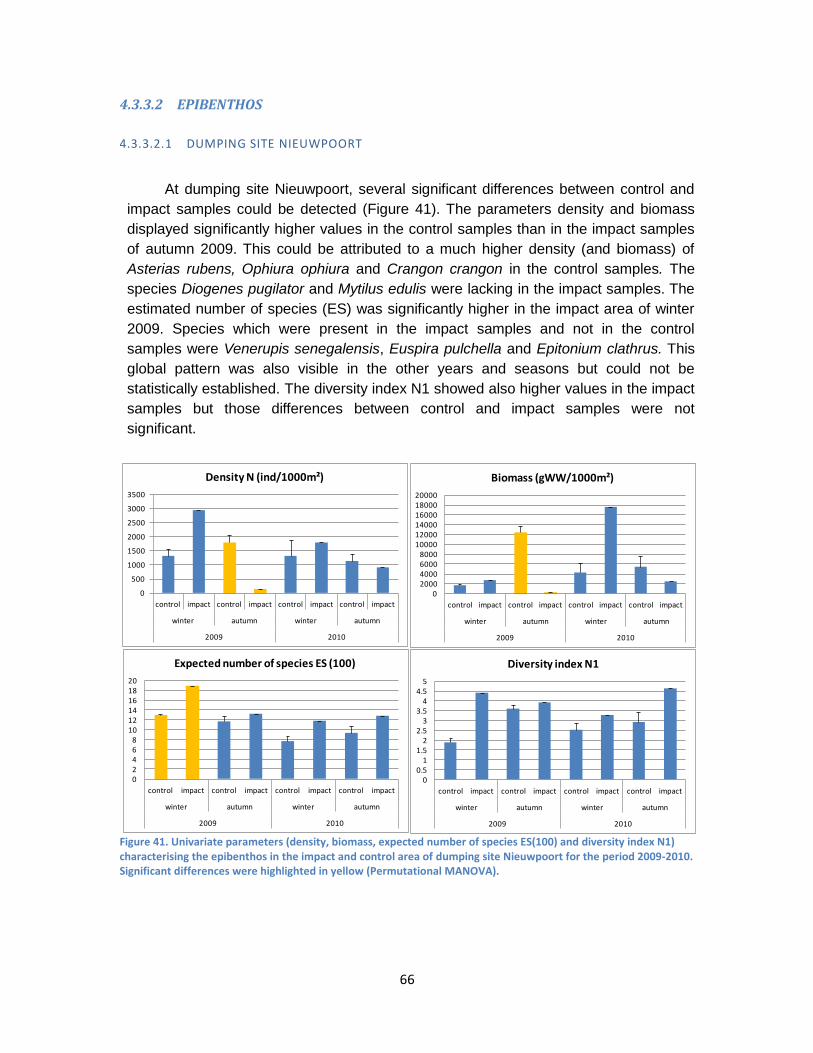
66
4.3.3.2 EPIBENTHOS
4.3.3.2.1 DUMPING SITE NIEUWPOORT
At dumping site Nieuwpoort, several significant differences between control and
impact samples could be detected (Figure 41). The parameters density and biomass
displayed significantly higher values in the control samples than in the impact samples
of autumn 2009. This could be attributed to a much higher density (and biomass) of
Asterias rubens, Ophiura ophiura and Crangon crangon in the control samples. The
species Diogenes pugilator and Mytilus edulis were lacking in the impact samples. The
estimated number of species (ES) was significantly higher in the impact area of winter
2009. Species which were present in the impact samples and not in the control
samples were Venerupis senegalensis, Euspira pulchella and Epitonium clathrus. This
global pattern was also visible in the other years and seasons but could not be
statistically established. The diversity index N1 showed also higher values in the impact
samples but those differences between control and impact samples were not
significant.
Figure 41. Univariate parameters (density, biomass, expected number of species ES(100) and diversity index N1) characterising the epibenthos in the impact and control area of dumping site Nieuwpoort for the period 2009-2010. Significant differences were highlighted in yellow (Permutational MANOVA).
0
500
1000
1500
2000
2500
3000
3500
control impact control impact control impact control impact
winter autumn winter autumn
2009 2010
Density N (ind/1000m²)
02000400060008000
100001200014000160001800020000
control impact control impact control impact control impact
winter autumn winter autumn
2009 2010
Biomass (gWW/1000m²)
02468
101214161820
control impact control impact control impact control impact
winter autumn winter autumn
2009 2010
Expected number of species ES (100)
00.5
11.5
22.5
33.5
44.5
5
control impact control impact control impact control impact
winter autumn winter autumn
2009 2010
Diversity index N1

67
4.3.3.2.2 BR&W OOSTENDE
At dumping site Br & W Oostende, no impact samples were available in autumn
2010. A significant density difference between control and impact samples was
observed in winter 2009 (Figure 42). Particularly O. ophiura was responsible for this
pattern because of its higher abundance in the control samples. C. crangon however,
was more common in the impact area. For the parameters biomass, ES(100) and N1,
no significant effect of dumping was detected. Nevertheless, there was a higher
diversity (ES(100) and N1) in the impact samples of 2009 and a lower diversity in the
impact samples of 2010.
Figure 42. Univariate parameters (density, biomass, expected number of species ES(100) and diversity index N1) characterising the epibenthos in the impact and control area of Br & W Oostende for the period 2009-2010. Significant differences were highlighted in yellow (Permutational MANOVA).
4.3.3.2.3 BR&W S1
For dumping site Br&W S1, no significant effect of dumping on density, biomass,
expected number of species and diversity index N1 could be established (Figure 43).
However, lower densities and biomass values are visible in the impact areas for the last
three seasons. This pattern is mainly caused by the species O. ophiura and A. rubens
which occurred in higher densities in the control areas. In winter 2009, winter 2010 and
autumn 2010, the graph of the expected number of species (ES(100)) shows lower
0
500
1000
1500
2000
2500
3000
3500
control impact control impact control impact
winter autumn winter
2009 2010
Density N (ind/1000m²)
0
1000
2000
3000
4000
5000
6000
7000
8000
9000
control impact control impact control impact
winter autumn winter
2009 2010
Biomass (gWW/1000m²)
0
2
4
6
8
10
12
14
16
18
control impact control impact control impact
winter autumn winter
2009 2010
Expected number of species ES (100)
0
1
2
3
4
5
6
7
control impact control impact control impact
winter autumn winter
2009 2010
Diversity index N1

68
values in the impact samples than in the control samples. Species like Echinocardium
cordatum and Liocarcinus depurator were responsible for this pattern because of their
absence in the impact samples.
Figure 43. Univariate parameters (density, biomass, expected number of species ES(100) and diversity index N1) characterising the epibenthos in the impact and control area of Br&W S1 for the period 2009-2010.
4.3.3.2.4 BR&W S2
At dumping site Br&W S2, there were no significant effects of dumping on the
parameters density, biomass, expected number of species ES(100) and diversity index
N1 (Figure 44). But again, slightly lower density and biomass values were recorded in
the impact samples. In winter 2009, mainly C. crangon and Ensis sp. were responsible
for the higher control values. In autumn 2009, L. holsatus and A. rubens, in autumn
2010 C. crangon and O. ophiura and in winter 2010 O. ophiura, A. rubens and Pagurus
bernhardus were more common species in the control samples than in the impact
samples. The graph of the expected number of species and the diversity index N1
revealed no particular pattern.
0
500
1000
1500
2000
2500
3000
3500
control impact control impact control impact control impact
winter autumn winter autumn
2009 2010
Density N (ind/1000m²)
0
2
4
6
8
10
12
14
16
control impact control impact control impact control impact
winter autumn winter autumn
2009 2010
Expected number of species ES(100)
0
2000
4000
6000
8000
10000
12000
control impact control impact control impact control impact
winter autumn winter autumn
2009 2010
Biomass (gWW/1000m²)
0
0.5
1
1.5
2
2.5
3
3.5
4
control impact control impact control impact control impact
winter autumn winter autumn
2009 2010
Diversity index N1

69
Figure 44. Univariate parameters (density, biomass, expected number of species ES(100) and diversity index N1) characterising the epibenthos in the impact and control area of Br&W S2 for the period 2009-2010.
4.3.3.2.5 BR&W ZEEBRUGGE OOST
In the dumping area Br&W Zeebrugge Oost, only one parameter was significantly
affected by the dredging activities, i.e. biomass in winter 2009 (Figure 45). The control
area displayed more biomass than the impact area, due to O. ophiura, C. crangon and
Macoma balthica which were more abundant. Although the biomass and density
differences between control and impact samples (mainly caused by A. rubens) were
visibly more explicit in the other seasons (see Figure 45, these differences were not
statistically significant. The other parameters ES(100) and N1 were again not
influenced by the dredging.
0
500
1000
1500
2000
2500
3000
3500
4000
4500
control impact control impact control impact control impact
winter autumn winter autumn
2009 2010
Density (ind/1000m²)
0
2
4
6
8
10
12
control impact control impact control impact control impact
winter autumn winter autumn
2009 2010
Expected number of species ES (100)
0
2000
4000
6000
8000
10000
12000
14000
16000
18000
control impact control impact control impact control impact
winter autumn winter autumn
2009 2010
Biomass (gWW/1000m²)
0
0.5
1
1.5
2
2.5
3
3.5
4
control impact control impact control impact control impact
winter autumn winter autumn
2009 2010
Diversity index N1
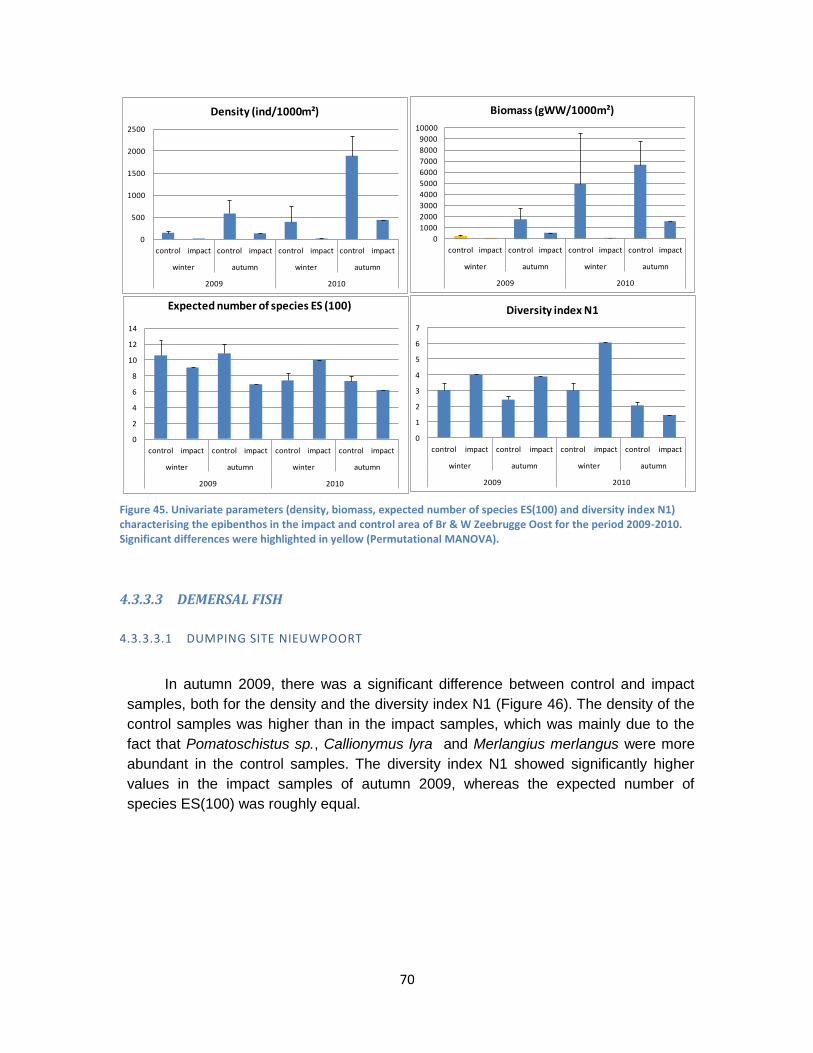
70
Figure 45. Univariate parameters (density, biomass, expected number of species ES(100) and diversity index N1) characterising the epibenthos in the impact and control area of Br & W Zeebrugge Oost for the period 2009-2010. Significant differences were highlighted in yellow (Permutational MANOVA).
4.3.3.3 DEMERSAL FISH
4.3.3.3.1 DUMPING SITE NIEUWPOORT
In autumn 2009, there was a significant difference between control and impact
samples, both for the density and the diversity index N1 (Figure 46). The density of the
control samples was higher than in the impact samples, which was mainly due to the
fact that Pomatoschistus sp., Callionymus lyra and Merlangius merlangus were more
abundant in the control samples. The diversity index N1 showed significantly higher
values in the impact samples of autumn 2009, whereas the expected number of
species ES(100) was roughly equal.
0
500
1000
1500
2000
2500
control impact control impact control impact control impact
winter autumn winter autumn
2009 2010
Density (ind/1000m²)
0
2
4
6
8
10
12
14
control impact control impact control impact control impact
winter autumn winter autumn
2009 2010
Expected number of species ES (100)
0
1000
2000
3000
4000
5000
6000
7000
8000
9000
10000
control impact control impact control impact control impact
winter autumn winter autumn
2009 2010
Biomass (gWW/1000m²)
0
1
2
3
4
5
6
7
control impact control impact control impact control impact
winter autumn winter autumn
2009 2010
Diversity index N1

71
Figure 46. Univariate parameters (density, expected number of species ES(100) and diversity index N1) characterising the demersal fish in the impact and control area of dumping site Nieuwpoort for the period 2009-2010. Significant differences were highlighted in yellow (Permutational MANOVA).
4.3.3.3.2 BR&W OOSTENDE
For dumping site Br & W Oostende, again no impact samples were available in
autumn 2010. For the other seasons, a general trend is visible for the three parameters.
The higher values in the impact area (except N1 in winter 2010) could mainly be
attributed to the higher abundance of Pomatoschistus sp. (Figure 47). However, this
trend could not statistically be established and therefore is not significant.
0
20
40
60
80
100
120
140
160
control impact control impact control impact control impact
winter autumn winter autumn
2009 2010
Density N (ind/1000m²)
0
2
4
6
8
10
12
14
16
control impact control impact control impact control impact
winter autumn winter autumn
2009 2010
Expected number of species ES (100)
0
1
2
3
4
5
6
7
8
control impact control impact control impact control impact
winter autumn winter autumn
2009 2010
Diversity index N1

72
Figure 47. Univariate parameters (density, expected number of species ES(100) and diversity index N1) characterising the demersal fish in the impact and control area of Br & W Oostende for the period 2009-2010.
4.3.3.3.3 BR&W S1
Dumping site Br&W S1 revealed no significant patterns for density and ES(100)
(Figure 48). Nevertheless, in autumn 2009, density values were higher in the impact
samples due to a higher abundance of Pleuronectes platessa and Limanda Limanda. In
autumn 2010, Clupea harengus was responsible for the higher values in the control
samples. The diversity index N1 showed a significant difference between the control
and impact samples of winter 2009, with higher diversity values in the impact area.
0
5
10
15
20
25
30
35
control impact control impact control impact
winter autumn winter
2009 2010
Density N (ind/1000m²)
0
2
4
6
8
10
12
14
16
18
control impact control impact control impact
winter autumn winter
2009 2010
Expected number op species ES (100)
0
1
2
3
4
5
6
7
8
control impact control impact control impact
winter autumn winter
2009 2010
Diversity index N1

73
Figure 48. Univariate parameters (density, expected number of species ES(100) and diversity index N1) characterising the demersal fish in the impact and control area of Br&W S1 for the period 2009-2010. Significant differences were highlighted in yellow (Permutational MANOVA).
4.3.3.3.4 BR&W S2
Analogously with epibenthos, demersal fish was not significantly affected by the
dredging activities at Br&W S2 (Figure 49). Nevertheless, the values for density and
ES(100) were consequently lower in the impact area, except for the density in winter
2010. A species that was present in the control samples and not in the impact samples,
in autumn was Sprattus sprattus. In winter, the absence of C. harengus and M.
merlangus in the impact samples was notable.
0
20
40
60
80
100
120
control impact control impact control impact control impact
winter autumn winter autumn
2009 2010
Density N (ind/1000m²)
0
2
4
6
8
10
12
14
16
18
control impact control impact control impact control impact
winter autumn winter autumn
2009 2010
Expected number of species ES (100)
0
1
2
3
4
5
6
7
8
9
10
control impact control impact control impact control impact
winter autumn winter autumn
2009 2010
Diversity index N1
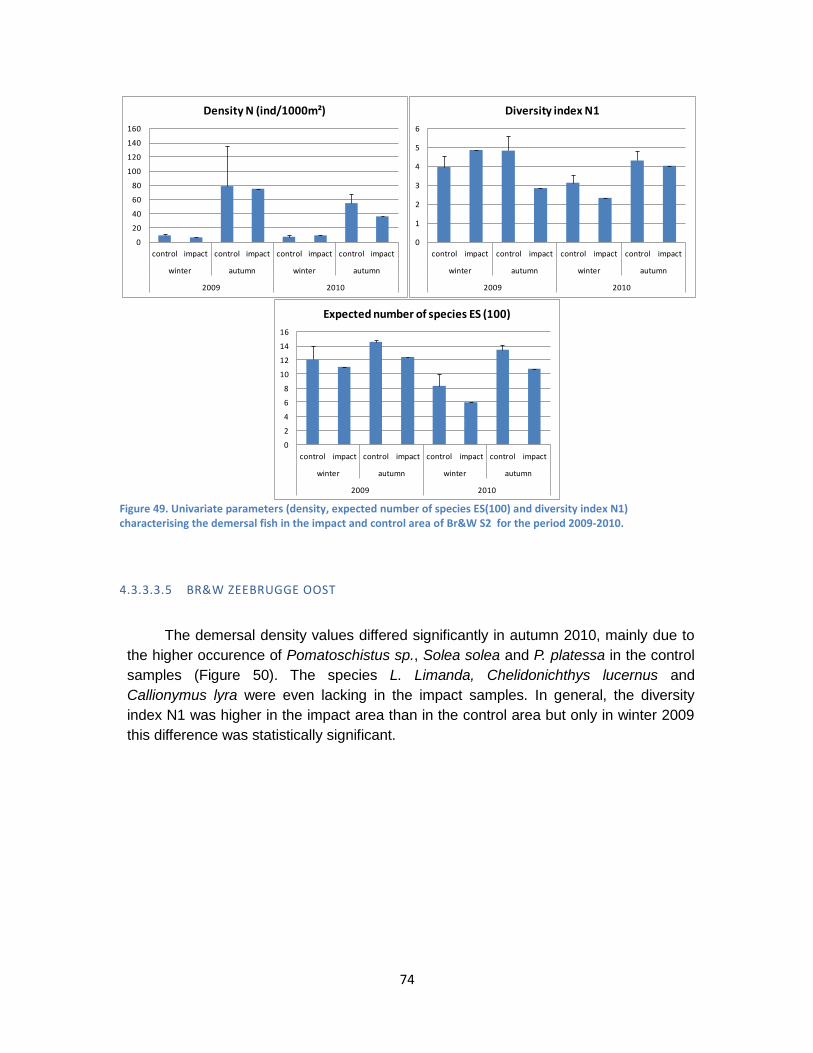
74
Figure 49. Univariate parameters (density, expected number of species ES(100) and diversity index N1) characterising the demersal fish in the impact and control area of Br&W S2 for the period 2009-2010.
4.3.3.3.5 BR&W ZEEBRUGGE OOST
The demersal density values differed significantly in autumn 2010, mainly due to
the higher occurence of Pomatoschistus sp., Solea solea and P. platessa in the control
samples (Figure 50). The species L. Limanda, Chelidonichthys lucernus and
Callionymus lyra were even lacking in the impact samples. In general, the diversity
index N1 was higher in the impact area than in the control area but only in winter 2009
this difference was statistically significant.
0
20
40
60
80
100
120
140
160
control impact control impact control impact control impact
winter autumn winter autumn
2009 2010
Density N (ind/1000m²)
0
2
4
6
8
10
12
14
16
control impact control impact control impact control impact
winter autumn winter autumn
2009 2010
Expected number of species ES (100)
0
1
2
3
4
5
6
control impact control impact control impact control impact
winter autumn winter autumn
2009 2010
Diversity index N1

75
Figure 50. Univariate parameters (density, expected number of species ES(100) and diversity index N1) characterising the demersal fish in the impact and control area of Br & W Zeebrugge Oost for the period 2009-2010. Significant differences were highlighted in yellow (Permutational MANOVA).
4.3.3.4 Conclusion Epibenthos and demersal fish
The ecological status of the epibenthos and demersal fish was also evaluated for
the five dumping sites. To know whether dumping activities had an impact on density,
biomass, estimated number of species (ES) and diversity index N1, a Permutational
MANOVA-analysis was conducted.
At dumping site Nieuwpoort, several significant differences between control and
impact samples could be detected. Concerning the epibenthos, the parameters density
and biomass displayed significantly higher values in the control samples than in the
impact samples of autumn 2009. This could be attributed to a much higher density (and
biomass) of the starfish Asterias rubens in the control samples. The estimated number
of species (ES) was significantly higher in the impact samples of winter 2009. This
pattern was also visible in the other years and seasons but could not be statistically
established. For the demersal fish, there was a significant difference between control
and impact samples of autumn 2009, both for the density and the diversity index N1.
The density of the control samples was higher than the impact samples, which was
mainly due to the fact that gobies (Pomatoschistus sp.), dragonet (Callionymus lyra)
0
10
20
30
40
50
60
70
80
control impact control impact control impact control impact
winter autumn winter autumn
2009 2010
Density N (ind/1000m²)
0
2
4
6
8
10
12
14
16
control impact control impact control impact control impact
winter autumn winter autumn
2009 2010
Expected number of species ES (100)
0
1
2
3
4
5
6
7
8
control impact control impact control impact control impact
winter autumn winter autumn
2009 2010
Diversity index N1

76
and whiting (Merlangius merlangus) were more abundant in the control samples. The
diversity index N1 showed higher values in the impact samples.
Table 11. Evaluation of the differences between control and impact samples in the period 2009-2010, for the five dumping sites and for the ecosystem components epibenthos and demersal fish. Red = significant difference; green = no significant difference.
Dumping site Nieuwpoort
Br&W Oostende
Br&W S1 Br&W S2 Br&W Zeebrugge
Oost
2009 2010 2009 2010 2009 2010 2009 2010 2009 2010
W A W A W A W A W A W A W A W A W A W A
EPIBENTHOS
Density
Biomass
ES
N1
DEMERSAL FISH
Density
ES
N1
In the dumping area of Br&W Oostende, a significant epibenthic density
difference between control and impact samples was observed in the winter of 2009.
Particularly the brittlestar Ophiura ophiura was responsible for this pattern, because of
its higher abundance in the control samples. The demersal fish community showed no
conspicuous changes as a result of the dumping activities.
Dumping sites Br&W S1 and Br&W S2 revealed no appreciable effects of
dumping on epibenthos and demersal fish. The values of density, biomass and species
richness were in most cases lower (but not significant) in the impact area than in the
control area. Species like starfish A. rubens and brittlestar O. ophiura are present in
lower densities in the impact area. The heart urchin Echinocardium cordatum and the
blue-leg swimming-crab Liocarcinus depurator were even absent in the impact area.
For demersal fish however, the diversity index N1 was significantly higher in the Br&W
S1 impact samples in winter 2009.
For dumping site Br&W Zeebrugge Oost, the epibenthic biomass data showed a
significant difference between the control and impact samples in winter 2009. Again,
this difference could be explained by a higher abundance of the brittlestar O. ophiura in
the control samples. The demersal density values differed significantly in autumn 2010,
mainly due to the higher occurence of gobies (Pomatoschistus sp.) in the control

77
samples. The diversity index N1 was significantly higher in the impact zone in winter
2009.
There is no clearly visible effect of dumping on the epibenthic and demersal fish
fauna. This can mainly be attributed to the fact that most species have a high mobility
and are able to avoid the dumping stress. The significant p-values (Table 11) can be
explained by the temporary dominance of certain species (starfish, brittlestar, goby)
and/or by the natural variability of the habitat (e.g. dumping site Nieuwpoort). Based on
this analysis, a small effect of dumping on the higher trophic level of epibenthos and
demersal fish cannot be excluded, because the number of samples per sampling event
is too low to have sufficient statistical power. A way to reach a higher power is by
combining data of several sampling events, which is not possible over the period 2009-
2010 due to a switch in sampling strategy. Since dumping had no or a minor effect on
the epibenthos and demersal fish community, it is advisable to investigate the effect of
dumping on certain functional or sensitive species.
4.3.4 Chemical contamination in biota
4.3.4.1 Introduction
For chemical analysis, species of interest must be limited in mobility, sufficiently
present in the catch, important in the ecosystem and potential accumulators of
pollutants. Clams, starfish, sea anemone, several crustaceans (brown shrimp,
swimming crab and hermit crab) and fish (dragonet, goby and hooknose) are selected.
In general, bivalves show the highest concentrations of persistent organic pollutants
(POPs), due to filter feeding, the lack of sophisticated detoxification pathways and their
living inside the sediment. Due to the inconsistent occurrence of bivalve species on the
different dredge spoil desposit areas, those results were not presented in graphs, only
discussed within the text.
The abundance of certain species influenced the reporting approach on the
dumping sites. Depending on the sample content on each dumping site, specific key
species are selected. Different species were not pooled. In this case, the results are not
influenced by the abundance or absence of certain species. Mainly data from autumn
2009 and autumn 2010 are reported. The most abundant key species are starfish and
brown shrimp, which will be reported more frequently compared to other species.
Although results are not presented in detail, all datasets have been screened, in
order to exclude unambiguous results. For chemical analysis, biota species must be
alive on the specific locations. The absence of the species on certain spots is indicative
for disturbance, although that does not mean the sludge poses a risk from the chemical
point of view. As stated in the Materials and Methods section, results of analysis are
expressed on a wet weight (w.w.) basis.

78
Concerning the contamination by PAHs, the results are shown as sum of 16 (US
EPA) PAHs as proposed by the OSPAR guidelines (acenaphthylene, acenaphthene,
fluorene, phenanthrene, anthracene, fluoranthene, pyrene, triphenylene,
benzo(a)anthracene, chrysene, benzo(b)fluoranthene, benzo(k)fluoranthene,
benzo(a)pyrene, dibenzo(a,h)anthracene, benzo(g,h,i)perylene and indeno (1,2,3-
cd)pyrene).
Metals analyzed comprise Fe, Cr, Zn and Cu (in µg/g) and Cd, Pb and Hg (in
µg/kg), all expressed on a wet weight (w.w.) basis.
CBs are always present in measurable quantities, and results are shown as sum
of 10 CBs (IUPAC numbers 28, 31, 52, 101, 105, 118, 138, 153, 156 and 180).
Pesticide concentrations are quite low, except for DDT and breakdown products DDE
and DDD (only pp’ isomers), presented as sum of DDT. Values for alpha-HCH and
gamma-HCH are close to or below LOD values, the same holds for transnonachlor and
HCB. Aldrin, dieldrin and endrin were never detected.
4.3.4.2 Dumping site BR&W Zeebrugge Oost
4.3.4.2.1 POLYCYCLIC AROMATIC HYDROCARBONS (PAH)
Figure 51. Concentration of PAHs (sum of 16 EPA PAHs) in starfish and brown shrimp during autumn 2009 and autumn 2010 on Impact and Control sites of dumping area Br&W Zeebrugge Oost. Concentrations are expressed in µg/kg w.w. Impact and Control are presented for each data set. (A09: autumn 2009, A10: autumn 2010)
Highest levels of PAHs are definitely found in bivalves, more specific in the
bivalve species Macoma balthica (17-29 µg/kg w.w.). Results on bivalves are not
presented due to small sampling sizes and the occurrence of diverse bivalve species.
Figure 51 represents the PAH content in starfish and shrimp during autumn 2009 and
2010, for control and impact sites. Starfish accumulate more PAHs compared to the

79
brown shrimp. For each data set, somewhat elevated levels are found in the key
species of impact sites compared to those on the control sites.
4.3.4.2.2 CHLORINATED BIPHENYLS (CB)
Figure 52 shows an analogue graph for the PCB content of brown shrimp and
starfish. In agreement with PAHs, starfish tend to accumulate more CBs compared to
brown shrimp.
In disagreement with the levels of CBs on sediments of dumping site Br&W
Zeebrugge Oost, the CB levels are not elevated in the impact areas compared to the
control areas. The levels of pesticide content of both species on this dumping site
describe a similar pattern. The highest concentrations CBs (>60 µg/kg w.w.) and DDTs
(>2 µg/kg w.w.) were found in hermit crab during autumn 2009. For each dumping area,
the highest CB and DDT levels are found in hermit crab.
Figure 52. Concentration of CBs (sum of 10 CBs) in starfish and brown shrimp during autumn 2009 and autumn 2010. Concentrations are expressed in µg/kg w.w. Impact and Control are presented for each data set on the dumping site Br&W Zeebrugge Oost.
4.3.4.2.3 HEAVY METALS
In the sampled sediments of dumping area Br&W Zeebrugge Oost, metal
concentrations were elevated at impact sites compared to the control sites. This is
reflected by the Cu and Pb concentrations in biota (Figure 53 A). Contrary, Cd and Hg
levels in control areas equal or slightly exceed the levels in impact areas (Figure 53 B).

80
Figure 53. A) Cu and Pb concentration in starfish and brown shrimp during autumn 2009 and autumn 2010 on dumping site Br&W Zeebrugge Oost. Concentrations are expressed in µg/kg w.w. for Pb and in 10-1 µg/kg for Cu.; B) Cd and Hg concentration in starfish and brown shrimp during autumn 2009 and autumn 2010 on dumping site Br&W Zeebrugge Oost. Concentrations are expressed in µg/kg w.w. Impact and Control are presented for each data set.
4.3.4.3 Dumping site BR&W S1
4.3.4.3.1 POLYCYCLIC AROMATIC HYDROCARBONS (PAH)
Figure 54. Concentration of PAHs (sum of 16 EPA PAHs) in brown shrimp during the period 2009-2010. Concentrations are expressed in µg/kg w.w. Impact and Control areas of dredge deposit area Br&W S1 are presented for each season. (S09: spring 2009, S10: spring 2010).
On dredge deposit site Br&W S1, the levels of PAH in diverse marine biota
species are elevated on impact areas compared to control areas. This is reflected in
Figure 54 via the level of PAHs in brown shrimp. This trend was also observed for other
species, e.g. starfish. PAH concentrations in epibenthos species show a seasonal
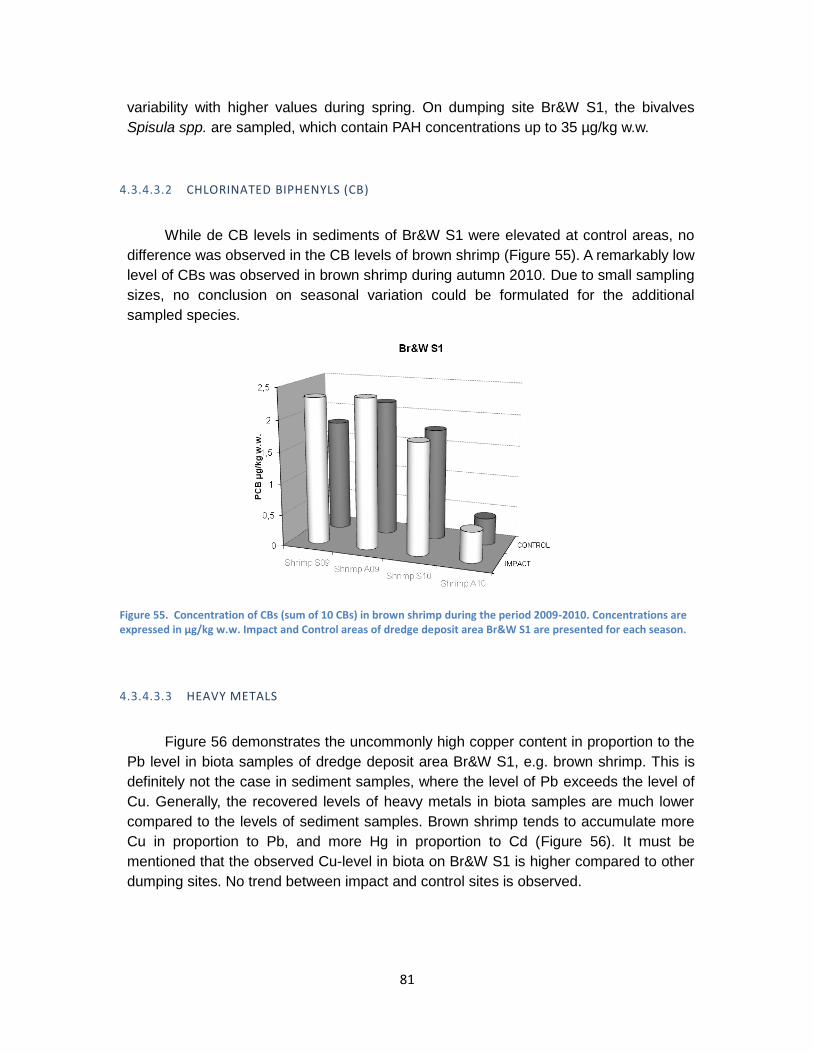
81
variability with higher values during spring. On dumping site Br&W S1, the bivalves
Spisula spp. are sampled, which contain PAH concentrations up to 35 µg/kg w.w.
4.3.4.3.2 CHLORINATED BIPHENYLS (CB)
While de CB levels in sediments of Br&W S1 were elevated at control areas, no
difference was observed in the CB levels of brown shrimp (Figure 55). A remarkably low
level of CBs was observed in brown shrimp during autumn 2010. Due to small sampling
sizes, no conclusion on seasonal variation could be formulated for the additional
sampled species.
Figure 55. Concentration of CBs (sum of 10 CBs) in brown shrimp during the period 2009-2010. Concentrations are expressed in µg/kg w.w. Impact and Control areas of dredge deposit area Br&W S1 are presented for each season.
4.3.4.3.3 HEAVY METALS
Figure 56 demonstrates the uncommonly high copper content in proportion to the
Pb level in biota samples of dredge deposit area Br&W S1, e.g. brown shrimp. This is
definitely not the case in sediment samples, where the level of Pb exceeds the level of
Cu. Generally, the recovered levels of heavy metals in biota samples are much lower
compared to the levels of sediment samples. Brown shrimp tends to accumulate more
Cu in proportion to Pb, and more Hg in proportion to Cd (Figure 56). It must be
mentioned that the observed Cu-level in biota on Br&W S1 is higher compared to other
dumping sites. No trend between impact and control sites is observed.
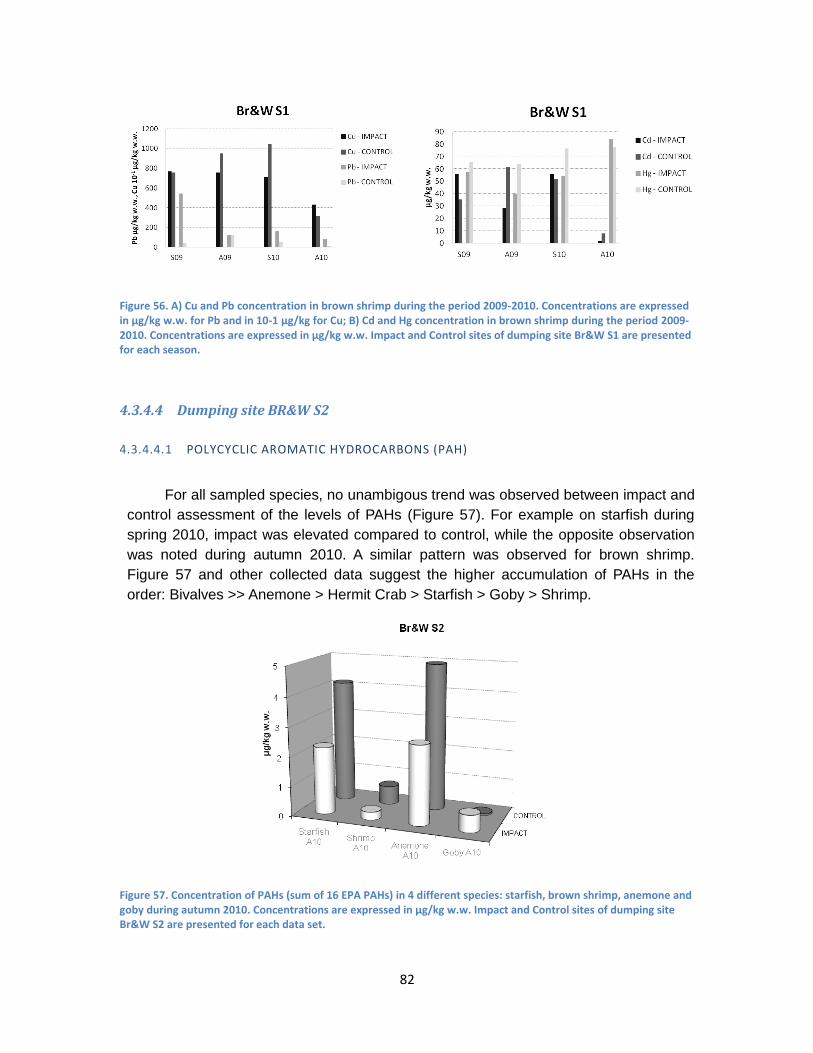
82
Figure 56. A) Cu and Pb concentration in brown shrimp during the period 2009-2010. Concentrations are expressed in µg/kg w.w. for Pb and in 10-1 µg/kg for Cu; B) Cd and Hg concentration in brown shrimp during the period 2009-2010. Concentrations are expressed in µg/kg w.w. Impact and Control sites of dumping site Br&W S1 are presented for each season.
4.3.4.4 Dumping site BR&W S2
4.3.4.4.1 POLYCYCLIC AROMATIC HYDROCARBONS (PAH)
For all sampled species, no unambigous trend was observed between impact and
control assessment of the levels of PAHs (Figure 57). For example on starfish during
spring 2010, impact was elevated compared to control, while the opposite observation
was noted during autumn 2010. A similar pattern was observed for brown shrimp.
Figure 57 and other collected data suggest the higher accumulation of PAHs in the
order: Bivalves >> Anemone > Hermit Crab > Starfish > Goby > Shrimp.
Figure 57. Concentration of PAHs (sum of 16 EPA PAHs) in 4 different species: starfish, brown shrimp, anemone and goby during autumn 2010. Concentrations are expressed in µg/kg w.w. Impact and Control sites of dumping site Br&W S2 are presented for each data set.

83
4.3.4.4.2 CHLORINATED BIPHENYLS (CB)
The CB content at impact sites at Br&W S2 was not higher than at control areas,
in agreement with the results on sediments of dredge deposit area Br&W S2. The same
observations could be made for the pesticide levels in biota on Br&W S2. Figure 58
illustrates the CB levels in different biota species on dumping site Br&W S2 during
autumn 2010.
Figure 58. Concentration of CBs (sum of 10 CBs) in 4 different species: starfish, brown shrimp, anemone and goby during autumn 2010. Concentrations are expressed in µg/kg w.w. Impact and Control are presented for each data set.
4.3.4.4.3 HEAVY METALS
In biota species of dumping site Br&W S2, no difference between the level of
heavy metals on control and impact sites could be observed and no trend could be
noticed (Figure 59).
Figure 59. A) Cu and Pb concentration in starfish, brown shrimp, anemone and goby during autumn 2010. Concentrations are expressed in µg/kg w.w. for Pb and in 10-1 µg/kg for Cu; B) Cd and Hg concentration in starfish, brown shrimp, anemone, goby during autumn 2010. Concentrations are expressed in µg/kg w.w. Impact and Control sites of Br&W S2 are presented for each season.

84
4.3.4.5 Dumping site BR&W Oostende
4.3.4.5.1 POLYCYCLIC AROMATIC HYDROCARBONS (PAH)
Elevated levels of PAHs are observed on anemone, shrimp and goby on impact
sites of dumping site Br&W Oostende (Figure 60). The highest PAH content noted in
the period 2009-2010 was observed in Macoma balthica during spring 2009 on the
impact area of dredge deposit area Br&W Oostende (48.5 µg/kg w.w.).
Figure 60. Concentration of PAHs (sum of 16 EPA PAHs) in brown shrimp and anemone during autumn 2009 and autumn 2010. Concentrations are expressed in µg/kg w.w. Impact and Control sites of dumping site Br&W Oostende are presented for each data set.
4.3.4.5.2 CHLORINATED BIPHENYLS (CB)
In sediment, no differences between CB concentrations at impact and control
areas of dumping site Br&W Oostende were noted. For CB levels in biota, starfish and
goby reveal higher concentrations on impact sites of Br&W Oostende while for brown
shrimp and anemone, impact levels equal control levels (Figure 61). Analogue
observations are made for the DDT levels in the different biota species.

85
Figure 61. Concentration of CBs (sum of 10 CBs) in brown shrimp and anemone during autumn 2009 and autumn 2010. Due to extraction difficulties, no anemone sample was analysed for the impact site in autumn 2010. Concentrations are expressed in µg/kg w.w. Impact and Control sites of dredge deposit area Br&W Oostende are presented.
4.3.4.5.3 HEAVY METALS
In contrast to the results on sediment, no elevated metal levels in biota are
observed on the impact sites of Br&W Oostende compared to control sites (Figure 62).
Figure 62. A) Cu and Pb concentration in brown shrimp and sea anemone during autumn 2009 and autumn 2010. Concentrations are expressed in µg/kg w.w. for Pb and in 10-1 µg/kg for Cu.; B) Cd and Hg concentration in brown shrimp and sea anemone during autumn 2009 and autumn 2010. Concentrations are expressed in µg/kg w.w. Impact and Control sites of dumping area Br&W Oostende are presented for each data set.

86
4.3.4.6 Dumping site BR&W Nieuwpoort
4.3.4.6.1 POLYCYCLIC AROMATIC HYDROCARBONS (PAH)
No trend was observed in the PAH content of biota on impact and control sites of
dumping area Nieuwpoort. Figure 63 represents the PAH level in starfish during the
period 2009-2010. No clear seasonal variation was observed.
Figure 63. Concentration of PAHs (sum of 16 EPA PAHs) in starfish during the period 2009-2010. Concentrations are expressed in µg/kg w.w. Impact and Control sites of dumping area Nieuwpoort are presented for each season.
4.3.4.6.2 CHLORINATED BIPHENYLS (CB)
Figure 64. Concentration of CBs (sum of 10 CBs) in starfish during the period 2009-2010. Concentrations are expressed in µg/kg w.w. Impact and Control sites of dumping area Nieuwpoort are presented for each season.

87
Though relatively high CB and DDT concentrations are found in the sediment of
dumping area Nieuwpoort, CB and DDT levels in biota are not exceptionally high
compared to the other dumping sites. A seasonal variation of CB and DDT levels is
established (Figure 64). In contrast to the higher impact levels on sediment of dumping
site Nieuwpoort during autumn 2009 and 2010, impact sites did not reveal higher CB
levels in biota compared to control sites (Figure 64).
4.3.4.6.3 HEAVY METALS
Only the cadmium concentration in starfish was elevated in impact areas of
dumping area Nieuwpoort compared to the control areas (Figure 65). Especially for Cd,
a seasonal variation is observed in agreement with the results on sediments of
dumping area Nieuwpoort. The Cd level was exceptionally high on impact sites during
spring 2009. The Cu level in starfish caught on impact sites during spring 2010 was
higher compared to the control sites and compared to the other sampling periods.
Figure 65. A) Cu and Pb concentration in starfish during the period 2009-2010. Concentrations are expressed in µg/kg w.w. for Pb and in 10-1 µg/kg for Cu.; B) Cd and Hg concentration in brown starfish during the period 2009-2010. Concentrations are expressed in µg/kg w.w. Impact and Control sites of dumping area Nieuwpoort are presented for each season.
4.3.4.7 Overview dumping sites
To assess the differences between the dumping sites based on the accumulation
of contaminants in marine biota species, starfish was selected as key species and the
sampling period ‘autumn 2010’ was considered. As discussed above, no difference
between the dumping sites could be observed based on sediment chemistry. Based on
the accumulation of contaminants, a clearly higher level of CBs and Pb was observed
in starfish of dumping site Br&W Oostende compared to the other dumping sites
(Figure 66). This trend could be observed in a lower extend for PAHs, Hg and Cu.

88
Figure 66. Levels of CBs and Pb in sediment samples during autumn 2010 for the Impact and Control sites of the different dumping sites. Concentrations are expressed in µg/kg w.w. for the sum of CBs. Concentrations are expressed in mg/kg w.w. for Pb.
4.3.4.8 Conclusion
Based on the accumulated levels of POPs and heavy metals in marine biota
species during 2009-2010, it can be concluded that differences in contamination
between control and impact areas for dredge disposal sites are limited. No difference
was noted for CB concentrations while for PAH levels, slightly elevated concentrations
were noted at the impact areas of the dumping sites Br&W Zeebrugge Oost, Br&W
Oostende and Br&W S1. For heavy metals, elevated concentrations of Cu and Pb were
detected at the impact sites of Br&W Zeebrugge Oost and Cd at the impact sites of
Nieuwpoort. Based on the assessment of accumulation, dumping site Br&W Oostende
could be distinguished from the other dumping sites based on higher levels of
contamination in starfish.
The assessed levels of persistent organic pollutants or heavy metals in biota are
obviously influenced by the investigated species. As mentioned before, very high levels
of PAHs are found in bivalves, while for example high levels of PCBs are recovered in
hermit crabs.
In agreement with the assessment on sediments, it would be of main interest to
compare the results on biota with environmental assessment criteria (EAC) from
OSPAR/MFSD (Joint Report, Task group 8)/Belgisch Staatsblad. To illustrate, Table
12presents the assessment criteria and the score (green or red) according to OSPAR/
Belgisch Staatsblad for blue mussel. It is not possible to compare the results on other
biota species, e.g. starfish, goby, hooknose, other bivalves, hermit crab, etc., since
those EAC values do not exist for those marine biota species. Table 12 indicates the
over range levels of Pb and Hg in mussel tissue of dumping area Nieuwpoort according
to OSPAR.
0
5
10
15
20
25
30
Br&W ZOBr&W S1
Br&W S2Br&W OO
Nieuwpoort
CB
s µ
g/k
g w
.w.
CBs
IMPACT CONTROL
0
100
200
300
400
500
600
Br&W ZOBr&W S1
Br&W S2Br&W OO
Nieuwpoort
Pb
µg
/kg
w.w
.
Pb
IMPACT CONTROL

89
Table 12. assessment criteria for mussel according to OSPAR and Belgisch Staatsblad. (Colour colde: green = value OK according to EAC, red = value too high) for the control area of dumping site Nieuwpoort during autumn 2010.
Dumping site Nieuwpoort
2010
A
C
Blue mussel
OSPAR Pyrene
Benzo(a)pyrene
Cd
Pb
Cu
Hg
pp-DDE
∑7 CB
Belgisch Staatsblad
Hg
Hexachlorbenzen 1 OSPAR, Quality Status Report 2000, Region II Greater North Sea 2 Belgisch Staatsblad N° 209, vrijdag 9 juli 2010
4.3.5 Biological Effects of Contaminants: Fish diseases and parasites
4.3.5.1 Introduction
Nowadays, it is generally accepted that the investigation of externally visible fish
diseases may provide information on the occurrence of environmental stress. As a
consequence, the study of the prevalence and distribution of diseases and parasites of
wild marine fish became an essential part of integrated monitoring programmes to
screen for the effects of environmental changes and marine pollution (Thain et al.,
2008; Lang et al., 2002).
The aim of this epidemiological study is to monitor and compare the prevalence of
contamination associated diseases and parasites of demersal fish on dredge spoil
disposal sites and some reference zones on the Belgian Part of the North Sea (BPNS).
Therefore, an important number of infectious and parasitical anomalies of the
epidermis, the gills and the mouth of several fish species were recorded.
In this section the observed prevalence of contamination associated diseases and
parasites during the spring and autumn of 2009 and 2010 are discussed. The diseases
and parasites of fish were determined according to the ICES Training guide for
identification (1996).
Dab (Limanda limanda) was chosen as primary fish species for monitoring,
because it is a demersal fish with small mobility (Bucke et al., 1996). Dab is an
abundant species and exhibits diseases which are easily recognised. The roundfish
Whiting (Merlangius merlangus) was selected as additional species for monitoring.
In zones were dab has a limited abundance, other commercial flatfish species
can be used: plaice (Pleuronectes platessa), flounder (Platichtys flesus) and Dover sole

90
(Solea solea). Disease monitoring on roundfish was extended to pouting (Trisopterus
luscus) and cod (Gadus morhua). Due to the limited abundance and/or the lack of
external diseases, species as sole, flounder and cod were not longer used for disease
monitoring in 2010. If results on plaice, flounder, cod, pouting or sole are mentioned, it
will only point to results from 2009.
As mentioned in the Materials and Methods, the Belgian Part of the North Sea
was divided into different areas through assembling of the results of similar zones:
impact area, coastal reference area and offshore reference area.
4.3.5.2 Results and Discussion
4.3.5.2.1 INFECTIONS, NODULES AND DEFORMATIONS
This part discusses the overall observed prevalence of skeletal deformations,
ulceration, epidermal papilloma, liver nodules, lymphocystis and pigmentation.
Especially ulcers, skeletal deformations, nodules and lymphocystis can provide
valuable information on changes in the environmental health and may act as an ‘alarm
bell’.
Pathologically important diseases of the skin (fins and eyes included), the gills
and liver were not or rarely observed on the BPNS.
Skeletal deformations were only registered on dab and whiting with a very small
prevalence (max 1% prevalence). Higher prevalence is observed in coastal areas
compared to offshore areas, no difference could be detected between the dredge
deposit zones and the coastal reference zone.
Ulcerations are easy to locate and can be clearly seen. They are mostly
associated with bacterial infections. Acute, healing and healed ulcerations were found
on dab, whiting and plaice (2009) at very low frequencies. Geographic variations in
occurrence are observed on the BPNS. On the dredge dumping sites a maximal
observed prevalence of 0.82 % could be reported on dab in the autumn of 2009. No
major difference could be observed between the dredge deposit zones and the
reference areas.
Lymphocystis has a viral aetiology (Iridovirus). The nodules are the result of
hypertrophy of connective tissue cells. During the last years, an overall decreasing
trend in the occurrence of Lymphocystis on dab has established in the North Sea. On
the BPNS, Lymphocystis is not detected since 2007.
Epidermal papilloma could only be detected on dab and were all stage 1 lesions
(less than 4 lesions per individual). Important skin papillomas were never observed on
the BPNS. The cause of papilloma on the skin of marine fishes is unknown, but a viral
aetiology is assumed. On the dumping zone, the highest observed prevalence (0.2%)

91
was noticed in 2009. From 2004 to 2010, a declining trend in the overall prevalence on
dab was observed on the BPNS (Figure 67). Remarkably, on the offshore reference
zone the overall observed prevalence appeared to be increasing again (1.84 %) during
2010. This was not the case in the coastal zones or impact zones, where no increase
was observed during 2010.
Figure 67. The overall observed prevalence per year of epidermal papilloma on dab and liver nodules on dab and whiting on the BPNS (2004-2010).
Liver nodules were observed in dab and cod (2009). The sampling size of cod
was too small to calculate the observed prevalence on the separate sampling areas. At
de dredge dumping zone an overall observed prevalence of 0.27% was obtained on
dab and in de the second reference zone a similar prevalence (0.29%) was observed in
2009. No considerable difference could be observed between the different geographic
areas. No liver nodules were observed in 2010. Generally, a continuing general
downward trend in prevalence is apparent in the North Sea (Figure 67).
Hyper-melanisation was not observed on dab or other flatfish species during the
years 2009-2010. Pigmentation was detected in dab, sole, flounder and plaice in all
monitored zones. Often, the sampling sizes were too small to calculate the overall
observed prevalence. The highest observed prevalence on plaice (8.16 %) was found
during the spring of 2010 and on dab (5.56 %) during the autumn of 2009, both in the
second reference zone (offshore). Long-term prevalence data (2000-2010) for dab
revealed no important difference between the zones. In the dredge disposal zone, the
trend appeared to be increasing during the last three years.
0.0
0.2
0.4
0.6
0.8
1.0
1.2
1.4
1.6
2004 2005 2006 2007 2008 2009 2010
Year
% O
bserv
ed
Pre
vale
nce
Epidermal Papilloma on Dab
Liver Nodules on Dab
Liver Nodules on Whiting

92
4.3.5.2.2 PARASITES
Most of the parasitical infections are relatively innocent when they are present at
low numbers. The results show that the infection rates can vary considerably in space
and time. The most common parasites on dab include Acanthochondria cornuta,
Glugea stephani and Stephanostomum baccatum, while the most widespread parasites
on whiting consist of Cryptocotyle lingua, Lernaeocera branchialis and Clavella sp.
It is problematic to define background levels or environmental assessment criteria
for fish disease data due to the natural variation in disease prevalence on a temporal
and regional scale. As a consequence, long-term prevalence data is used as a
guideline. In this report, long-term prevalence data from 1996 until 2010 was used
(whiting and dab). The overall observed long-term prevalence of fish disease on the
BPNS was introduced by a poster presentation on the PRIMO 16 conference (Devriese
et al., 2011). Overall prevalence peaks were detected with intervals of a few years,
depending on the investigated parasitical infection.
PARASITES ON FLATFISH
The overall observed prevalence of the trematode Stephanostomum baccatum
was very low in the reference zones, and the individual infection rate was low (1 to 2
parasites per fish). This trematode was not observed on the dredge deposit zones
during 2009 and 2010. And since 2003, a higher prevalence is observed in coastal
reference sites compared to dredge disposal sites.
Lepeoptheirus pectoralis was found on dab, plaice and especially on flounder.
Due to the small sampling size of flounder, no prevalence is calculated. A low overall
observed prevalence is obtained on dab, depending on the season and sampling
location, with the highest occurrence (3.27 %) during spring 2010 in the offshore
reference zone. From 2009 to 2010, a small increase in prevalence is observed on all
areas, mainly in the offshore reference zone (Figure 68).

93
Figure 68. Overall observed prevalence of Lepeoptheirus spp. on dab during the period 2000-2010 in coastal sites. (Sampling sizes were too small during 2003 -only dumping zone-, 2004, 2005)
Externally attached copepods, such as Acanthochondria spp. on flatfish, are
considered harmless. Especially flounder is host to these crustaceans, but the sampling
size per zone was too small to consider the observed prevalence. On dab, a maximal
prevalence of 9.56% was observed during autumn 2009 on the dredge dumping zone.
The assembled data on Acanthochondria spp. show a higher prevalence during autumn
compared to spring. The abundance of Acanthochondria spp. increased clearly during
2009 and 2010, particularly in coastal areas (Figure 69). Considering mean prevalence
data of the years 2000-2010 (Figure 70) the occurrence was higher in coastal areas
(2.89 %), especially in the dumping zones (3.37 %), compared to the more offshore
zones (1.88 %). During 2010, no difference between the dumping sites and the coastal
reference sites was observed.
0
1
2
3
2000 2002 2004 2006 2008 2010
% o
ve
rall
ob
se
rve
d p
reva
len
ce
Lepeoptheirus pectoralisLimanda limanda
Dumping Zone Reference Zone 1

94
Figure 69. Overall observed prevalence of Acanthochondria spp. on dab during the period 2000-2010 in coastal sites. (Sampling sizes were too small during 2003 -only dumping zone-, 2004, 2005)
Figure 70. The mean observed prevalence of 2 different parasitical infections (Acanthochondria spp. and Glugea spp.) on dab over the years 2000-2010. The overall observed prevalence for the dredge disposal sites is separately given for 2009 and 2010.
The parasite of the intestines, Glugea stephani, was mainly present on dab. The
highest prevalence (18.18 %) was observed on the dumping sites in autumn 2010. A
higher occurrence of the parasite during autumn compared to spring was noticed. The
assembled data of the years 2000-2010 on Glugea stephani reveal an overall
increasing trend in coastal areas (Figure 71). Mean prevalence data of the period 2000-
Acanthochondria
Limanda limanda
0
1
2
3
4
5
6
7
8
2000 2002 2004 2006 2008 2010
% o
ve
rall
ob
se
rve
d p
rev
ale
nc
e
Dumping Zone Reference Zone 1
Limanda limanda
2000-2010
10.53
3.37
9.42
2.89
6.43
1.88
0
2
4
6
8
10
12
14
16
18
20
Glugea stephani Acanthocondria comuta
% o
vera
ll o
bserv
ed
pre
vale
nce
Dumping zone
Reference zone 1
Reference zone 2
2009 Dumping zone
2010 Dumping zone
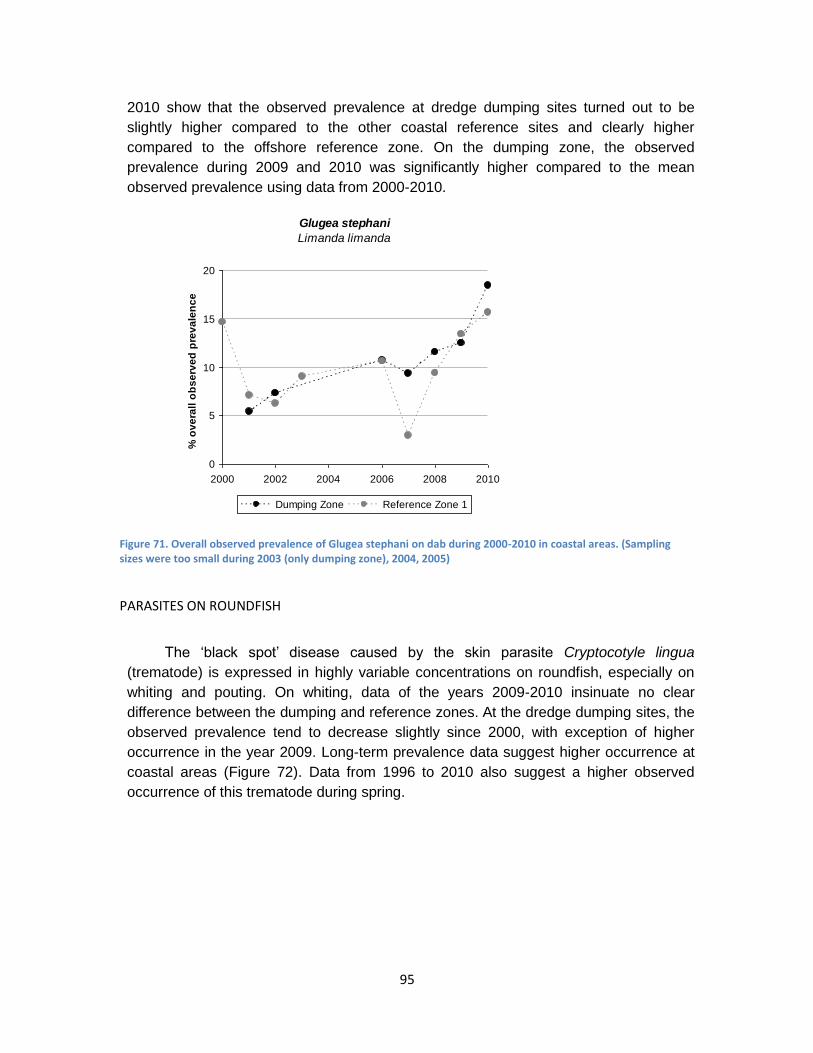
95
2010 show that the observed prevalence at dredge dumping sites turned out to be
slightly higher compared to the other coastal reference sites and clearly higher
compared to the offshore reference zone. On the dumping zone, the observed
prevalence during 2009 and 2010 was significantly higher compared to the mean
observed prevalence using data from 2000-2010.
Figure 71. Overall observed prevalence of Glugea stephani on dab during 2000-2010 in coastal areas. (Sampling sizes were too small during 2003 (only dumping zone), 2004, 2005)
PARASITES ON ROUNDFISH
The ‘black spot’ disease caused by the skin parasite Cryptocotyle lingua
(trematode) is expressed in highly variable concentrations on roundfish, especially on
whiting and pouting. On whiting, data of the years 2009-2010 insinuate no clear
difference between the dumping and reference zones. At the dredge dumping sites, the
observed prevalence tend to decrease slightly since 2000, with exception of higher
occurrence in the year 2009. Long-term prevalence data suggest higher occurrence at
coastal areas (Figure 72). Data from 1996 to 2010 also suggest a higher observed
occurrence of this trematode during spring.
Glugea stephani
Limanda limanda
0
5
10
15
20
2000 2002 2004 2006 2008 2010
% o
ve
rall
ob
se
rve
d p
rev
ale
nc
e
Dumping Zone Reference Zone 1

96
Figure 72. the mean observed prevalence of 3 different parasites on whiting over the years 2000-2010. The overall observed prevalence for the dredge disposal sites is separately given for 2009 and 2010.
The harmless externally attached copepod Clavella sp. Is generally more
widespread at offshore areas. On whiting, the highest observed prevalence (14.74%)
was obtained at the offshore reference area during spring 2009. Long-term prevalence
data confirmed the higher occurrence of Clavella sp. at offshore areas, especially
during spring (Figure 73). No considerable difference could be observed between the
dredge deposit zone and the coastal reference zone. Data from 1996-2010 confirm an
undulating prevalence pattern during the years (Figure 73), which is typical for most
parasitic infections. As a consequence, a decrease of prevalence is observed during
2009 and 2010 compared to 2007 and 2008. The predicted prevalence could be used
as assessment criteria for parasitic disease monitoring. Similar models are formulated
for the other parasitic diseases.
Figure 73. Observed prevalence of Clavella sp. on whiting during 1996-2010 and the predicted prevalence using Solver until 2020.
Merlangius merlangus
2000-2010
0
2
4
6
8
10
12
14
Cryptocotyle lingua Clavella sp. Lernaeocera branchialis
% o
ve
rall o
bs
erv
ed
pre
va
len
ce
Dupmping zone
Reference zone 1
Reference zone 2
2009 Dumping zone
2010 Dumping zone
Clavella sp.
0
2
4
6
8
10
12
14
1996
1998
2000
2002
2004
2006
2008
2010
2012
2014
2016
2018
2020
% o
bs
erv
ed
pre
va
len
ce
Model

97
The parasitical copepod, Lernaeocera branchialis was noted on the three
observed roundfish species: whiting, cod and pouting. The occurrence varied according
to species, sampling zone and period. The elevated prevalence in coastal zones was
confirmed by data from 2009-2010 as well as by the long-term prevalence data. A
slightly higher prevalence in the dumping area compared to the coastal reference zone
could be deduced from the mean prevalence 2000-2010 (Figure 72).
4.3.5.3 Conclusions
Severe diseases such as skin ulcers, nodules, skeletal malformations and
lymphocystis, which might indicate effects of pollution, are rare on the investigated
zones of the BPNS. The overall trend for these diseases appeared to be decreasing in
the North Sea. No significant differences could be detected on the basis of the data
between the dredge dumping sites and the reference zones. Because the overall
prevalence of those diseases is very low, examination of histopathological liver lesions
in flatfish may provide additional information about the condition of the dredge disposal
sites in future.
Most of the observed anomalies were due to parasitical infections. The presence
of these parasites showed considerable variation in spatial and temporal distribution.
Parasites such as Cryptocotyle lingua, Clavella sp. and Lernaeocera branchialis
are more abundant during spring, in contrast to Glugea stephani and Acanthochondria
cornuta which are more widespread during autumn. Long-term prevalence data from
1996 until 2010 showed undulating prevalence patterns during the years for all
examined parasitical infections. Models can be formulated to predict the prevalence of
those diseases in future. Those models can be used as assessment criteria to interpret
monitoring data.
Parasites such as Lernaeocera branchialis, Cryptocotyle lingua, Acanthochondria
cornuta and Glugea stephani have a larger prevalence in coastal areas compared to
the more offshore sites. As a consequence of the spatial variation, the dredge disposal
sites must be compared to the coastal reference sites. For the period 2000-2010,
Glugea stephani and Acanthochondria cornuta on dab and Lernaeocera branchialis on
whiting showed a slightly higher prevalence on the dumping sites compared to the
coastal reference sites, while Stephanostomum baccatum and Lepeoptheirus pectoralis
on dab and Cryptocotyle lingua on whiting showed the opposite trend.
In future, the obtained data should be compared with the long-term prevalence
data. Significant differences in prevalence between coastal reference zones and dredge
deposit areas and between long-term prevalence data and recent data must be
examined thoroughly and followed in future.

98
Finally, it is important to remind the effect of migration on the observed species.
Based on the migratory properties, flat fish species were chosen as monitoring
organism. The results can, especially for roundfish, be influenced by migration. As a
result, the data rather reflects the health condition of a big area instead of smaller
zones like the dredge deposit zones. Nevertheless, some important regional differences
in parasitical affection could be observed.
In upcoming surveys, only results on the main species whiting and dab will be
gathered. Due to the small sampling size, flounder, Dover sole, cod, pouting and plaice
will not be used for the assessment of contaminant associated fish diseases. If the
sampling size allows, dab species will be divided in two subgroups (15-19 cm and 20-
24 cm) according to the ICES guidelines.
Recently, histopathological liver lesions in flatfish have been recommended as
one of the methods to be used for biological effect monitoring under the OSPAR Joint
Assessment and Monitoring Programme (JAMP). This research strategy could provide
additional or complementary information on contaminant associated fish diseases.
In addition to the assessment of fish diseases, the general health of fish species
(e.g. gonadosomatic index GSI, quality index method QIM, liver glycogen content LGC,
liver-somatic index LSI, condition index k,…) will be monitored during future sampling
surveys.
4.3.6 Biological Effects of Contaminants: EROD activity as biochemical
indicator of xenobiotic substance accumulation
4.3.6.1 Introduction
Studying the possible harmful effects of pollutants present in the marine
environment on biota species is an essential research topic in environmental
monitoring. In this part, the relationship between the dumping of dredge spoil with
associated pollutants and the biological effect of those pollutants on local fish
populations is investigated. It is of major interest to identify if pollutants effect the
biological activity of marine organisms or if they are transformed/metabolized and
excreted.
The effects of contaminating substances (PCBs, PAHs, …) in living organisms
can be studied through the upregulation of enzymatic activities involved in
biotransformation of pollutants following their binding on the aryl hydrocarbon receptor
(ArH receptor). Upregulated enzyme activities may serve as ‘early warning’ signals for
pollution. Here, the biochemical biomarker EROD (7-ethoxyresorufin O-deethylase)
activity is used as an indicator of xenobiotic substance accumulation in the flatfish dab
(Limanda limanda). Assessment of the EROD activity is one of the required indicators

99
of pollution by the Joint Assessment and Monitoring Programme (JAMP) under the
coordination of OSPAR.
ILVO participated to the OSPAR expert group ‘Study Group for the Integrated
Monitoring and Biological Effects’ (SGIMC) to define the assessment criteria for the
EROD assay for Atlantic cod, flounder, dab and plaice by using EROD data submitted
in ICES database.
4.3.6.2 Results and discussion
4.3.6.2.1 EROD ACTIVITY IN DAB LIVER
To assess the induction in EROD activity, the livers of juvenile dab were excised
and homogenized. The small livers of juvenile dab may assumed to be homogeneous
in contrast to the livers of larger dab. This assumption was confirmed by analyzing
different parts of large and small dab livers during 2009-2010. Besides, on juvenile dab
no significant difference (α=0.05) was obtained between EROD results on male and
female dab and therefore the EROD results for male and female dab were pooled into
one group.
The seasonal model of the EROD induction shows a peak during late winter/early
spring. This peak is inversely correlated with the concentrations of POP’s in liver fat.
The obtained EROD data clearly demonstrate the EROD induction during late
winter/early spring, while only a background level is recorded during autumn. This is
illustrated by the EROD induction in dab liver during the four sampling campaigns of
2009-2010 on a reference site (Figure 74).
Figure 74. The EROD activity, expressed as pmol/(min.mg protein) measured on juvenile dab caught on a control site during spring 2009 – autumn 2009 – spring 2010 – autumn 2010.
Due to the small sampling sizes of juvenile dab during 2009-2010, no overview of
EROD activities on dab of the different dumping sites could be proposed. The EROD
EROD activity in Dab liver on Control site during spring and autumn 2009 and 2010
DATA overzicht 2009 2010.sta 81v*120c
Median
25%-75%
Non-Outlier Range
Outliers
Extremes
S09 A09 S10 A10
Sampling period
-200
0
200
400
600
800
1000
1200
1400
ER
OD
activity (
pm
ol)/(
min
*mg
pro
tein
)
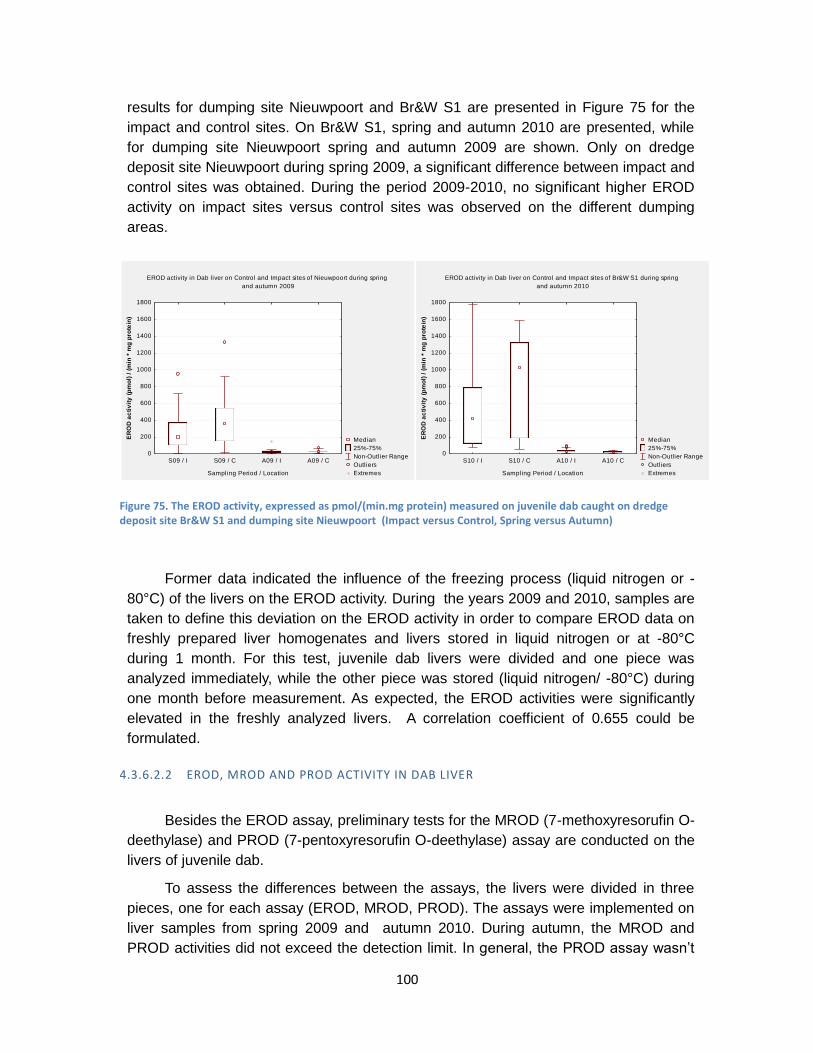
100
results for dumping site Nieuwpoort and Br&W S1 are presented in Figure 75 for the
impact and control sites. On Br&W S1, spring and autumn 2010 are presented, while
for dumping site Nieuwpoort spring and autumn 2009 are shown. Only on dredge
deposit site Nieuwpoort during spring 2009, a significant difference between impact and
control sites was obtained. During the period 2009-2010, no significant higher EROD
activity on impact sites versus control sites was observed on the different dumping
areas.
Figure 75. The EROD activity, expressed as pmol/(min.mg protein) measured on juvenile dab caught on dredge deposit site Br&W S1 and dumping site Nieuwpoort (Impact versus Control, Spring versus Autumn)
Former data indicated the influence of the freezing process (liquid nitrogen or -
80°C) of the livers on the EROD activity. During the years 2009 and 2010, samples are
taken to define this deviation on the EROD activity in order to compare EROD data on
freshly prepared liver homogenates and livers stored in liquid nitrogen or at -80°C
during 1 month. For this test, juvenile dab livers were divided and one piece was
analyzed immediately, while the other piece was stored (liquid nitrogen/ -80°C) during
one month before measurement. As expected, the EROD activities were significantly
elevated in the freshly analyzed livers. A correlation coefficient of 0.655 could be
formulated.
4.3.6.2.2 EROD, MROD AND PROD ACTIVITY IN DAB LIVER
Besides the EROD assay, preliminary tests for the MROD (7-methoxyresorufin O-
deethylase) and PROD (7-pentoxyresorufin O-deethylase) assay are conducted on the
livers of juvenile dab.
To assess the differences between the assays, the livers were divided in three
pieces, one for each assay (EROD, MROD, PROD). The assays were implemented on
liver samples from spring 2009 and autumn 2010. During autumn, the MROD and
PROD activities did not exceed the detection limit. In general, the PROD assay wasn’t
EROD activity in Dab liver on Control and Impact sites of Nieuwpoort during spring
and autumn 2009
Median
25%-75%
Non-Outlier Range
Outliers
Extremes
S09 / I S09 / C A09 / I A09 / C
Sampling Period / Location
0
200
400
600
800
1000
1200
1400
1600
1800
ER
OD
ac
tiv
ity
(p
mo
l) /
(m
in *
mg
pro
tein
)
EROD activity in Dab liver on Control and Impact sites of Br&W S1 during spring
and autumn 2010
Median
25%-75%
Non-Outlier Range
Outliers
Extremes
S10 / I S10 / C A10 / I A10 / C
Sampling Period / Location
0
200
400
600
800
1000
1200
1400
1600
1800
ER
OD
ac
tiv
ity
(p
mo
l) /
(m
in *
mg
pro
tein
)

101
suitable on dab livers, the induction of PROD activity was often too small for
measurement. The MROD and EROD data showed a similar trend, but the EROD
activity was about 14.7 times higher compared to the MROD activity (Figure 76). In
conclusion, the EROD activity is definitely the most effective assessment on dab liver.
Figure 76. The EROD, MROD and PROD activity in dab liver on different sampling sites during spring 2009
4.3.6.3 Conclusion
On the dumping areas, no significant difference between impact and control sites
could be observed based on the enzymatic EROD activity during 2009-2010.
Although the measurement of the enzymatic EROD activity is an important tool to
assess the effects of anthropogenic activities, the sample sizes are often too small to
allow statistical interpretation, especially during spring. The biochemical EROD assay
depends on different parameters such as season, water temperature, size of the fish,
maturity of the fish, sex of the fish, ... and could be difficult to interpret. It is of main
interest to keep searching for other biomarkers (genomic or biochemical) on relevant
abundant species. Recently, the first efforts were made to develop a genomic
biomarker on starfish.

102
5 An exploration of the biological life in the dredging areas
5.1 Introduction
One of the aspects, that was not looked after in the previous decade was the
biological life in the dredging areas, especially in the gullies towards the harbor of
Zeebrugge and the harbor itself. This is necessary to make a comparison between the
fauna in the dredged material and those occurring on the dumping sites. Species
occurring in the dredging areas can be transported to the dumping areas and locally
enrich the fauna if they survive (Figure 1). This should have a minor effect for the
dumping areas on the Belgian Part of the North Sea, because the dredging areas are
expected to be characterised by a poor faunal composition.
5.2 Material and Method
5.2.1 Sampling
Figure 77. Map of the Zeebrugge area with indication of the benthic samples taken in 2007 and 2011.
®

103
Benthic samples were taken in two different years (2007 and 2011). In the first
year (2007), mainly samples in the harbor of Zeebrugge were taken, whereas in 2011,
most samples were originated from the gullies towards the harbor (Pas van ‘t Zand,
Scheur, Vaargeul 1).
The samples in december 2007 were taken on board of the Brandaris in
coincidence with the sediment monitoring program of the harbors and their entrances
(Lauwaert et al., 2008). At 13 of the 42 sampling points an extra benthic sample with a
Van Veen grab (12L) was taken (Figure 77).
In February 2011, a benthic sampling program was executed to monitor the
gullies towards the harbor of Zeebrugge. Therefore, a Van Veen grab (22L) was taken
at 12 sampling points, which were distributed over this area (Figure 77). No biota were
found in the samples ZBH6 and BagG11.
All the samples were sieved over a 1mm sieve to extract the benthic fauna. The
samples of 2007 were sieved after fixation, whereas those of 2011 were sieved alive.
5.2.2 Biological analysis
Species were identified to species level when possible and counted. The
macrobenthos sampling and analysis protocol is based on the ISO 16665:2005
standard (“Water quality – Guidelines for quantitative sampling and sample processing
of marine soft-bottom macrofauna”). From each Van Veen sample, a Perspex core was
taken for sediment analyses. These samples were dried at 60°C and analyzed with a
Malvern Mastersizer 2000 following a standardized protocol. Depth and position of
each sample were also registered during the campaigns.
The species dataset was standardized by lumping some species (Cirratulidae
spp, Spio spp, Anthozoa spp), and reduced by excluding species that did not belong to
the macrobenthos sensu strictu (e.g. Mysidacea). Nematoda were excluded because of
inadequate sampling techniques for quantifying meiofauna. By this standardization, two
more stations were than characterised by the absence of benthic fauna (ZBH8,
BagG12).
Cluster analysis by group average sorting based on a Bray-Curtis similarity
dataset (fourth root transformed) was used as multivariate analysis. This cluster
analysis was complemented with a SIMPROF test (Similarity profile, test for structure in
the data) to define the significant different groups within the cluster analysis. The
clustering was visualized using a non-metric Multi Dimensional Scaling analysis (MDS).
A SIMPER analysis (Similarity/distance percentages, species/variable contributions)
was performed to examine the contribution of each species to the average similarity
within a cluster group. Factors structuring the observed multivariate pattern were tested
with ANOSIM analysis (Analysis of similarities). All multivariate analyses were

104
performed within PRIMERv6 (Plymouth Routines in Multivariate Ecological Research;
Clarke & Gorley, 2006).
The calculated univariate parameters were: density (ind./m²), biomass (Wet
Weight/m²) and number of species (N0).
5.3 Results
5.3.1 Macrobenthos
48 benthic taxa were recorded in the dredging areas of Zeebrugge, whereof 27
(56%) taxa were only recorded once (Table 13). Most taxa were found in the gullies
towards Zeebrugge and only a few taxa (9; Cirratulidae spp, Oligochaeta spp, Nephtys
juvenile, Mytilus edulis, Streblospio benedicti, Abra alba, Macoma balthica, Anthzoa
spp, Crangon crangon) in the harbor itself. 58% of the taxa belongs to the phylum
Polychaeta, whereas 19% to the Mollusca. Taxa of the Crustacea and Echinodermata
has a contribution of 10%.
Not one of the observed species was a rare taxon within the benthic fauna on the
BPNS. Most species were common within the Abra alba and/or Macoma balthica
habitat (Van Hoey et al., 2004). Only the bivalve Mytilus edulis is more characteristic for
hard-substratum and the specimens found in our samples were mostly recruits. Those
were temporally settled or washed-out from the hard substrate around the harbor.
Table 13. Species list of the samples taken in the dredging areas of Zeebrugge harbor. The species in grey were also found in the harbor itself.
Species name Phylum # samples Tot. density (ind/m²) Species name Phylum # samples Tot. density (ind/m²)
Cirratulidae spp. Polychaeta 16 4625 Ophiura albida Echinodermata 1 130
Oligochaeta spp. Polychaeta 12 2632 Tellina fabula Mollusca 1 93
Nephtys juv. Polychaeta 9 1020 Ophiura juv. Echinodermata 1 93
Mytilus edulis Mollusca 8 392 Spisula subtruncata Mollusca 1 93
Owenia fusiformis Polychaeta 7 3173 Abludomelita obtusata Crustacea 1 74
Streblospio benedicti Polychaeta 6 2630 Ensis directus Mollusca 1 40
Abra alba Mollusca 5 4668 Microphthalmus similis Polychaeta 1 40
Nephtys hombergii Polychaeta 5 195 Pholoe minuta Polychaeta 1 37
Macoma balthica Mollusca 4 129 Lanice conchilega Polychaeta 1 20
Anthozoa spp. Cnidaria 4 86 Sthenelais boa Polychaeta 1 19
Heteromastus filiformis Polychaeta 4 70 Eteone flava Polychaeta 1 19
Ophiura ophiura Echinodermata 3 94 Glycera juv. Polychaeta 1 19
Mediomastus fragilis Polychaeta 2 141 Echinocardium cordatum Echinodermata 1 19
Notomastus latericeus Polychaeta 2 140 Phyllodoce mucosa Polychaeta 1 19
Scoloplos armiger Polychaeta 2 84 Magelona spp. Polychaeta 1 19
Petricola pholadiformis Mollusca 2 80 Venerupis senegalensis Mollusca 1 19
Capitella spp. Polychaeta 2 30 Asterias rubens Echinodermata 1 10
Crangon crangon Crustacea 2 29 Gammarus salinus Crustacea 1 10
Glycera spp. Polychaeta 2 29 Gastrosaccus spinifer Crustacea 1 10
Eunereis longissima Polychaeta 2 29 Ophelia spp. Polychaeta 1 10
Pectinaria koreni Polychaeta 2 29 Nephtys longosetosa Polychaeta 1 10
Kurtiella bidentata Mollusca 1 593 Polydora cornuta Polychaeta 1 10
Spiophanes bombyx Polychaeta 1 204 Malmgreniella castanea Polychaeta 1 10
Pariambus typicus Crustacea 1 130 Spio spp. Polychaeta 1 10

105
There is a clear pattern in the benthic community characteristics in the dredging
areas of Zeebrugge (Figure 78). In the central gully within the harbor of Zeebrugge
almost no benthic individuals (max 1) were found. Two samples (ZBH16 and ZBH2)
within a corner of the harbor were characterised by a higher species richness,
respectively 7 and 5 spp./0.054m²), whereas in the other samples the species richness
was very low. The highest number of species, densities and biomass were found in
‘Vaargeul 1, especially at station ZBS41 (32 spp./0.054m²; 13981 ind./m²; 1124 g/m²
Wet weight). The samples in the ‘Scheur’ area showed a low species richness and a
moderate density. The high density spot within the harbor of Zeebrugge (ZBH16) is
caused by the presence of the spionid Streblospio benedicti.
Figure 78. Map with indication of the number of species (S, top-left hand corner), density (N, bottom-left hand corner), biomass (bottom-right hand corner) and the cluster groups (top-right hand corner).
Most samples shows a high affinity with each other and were grouped in cluster C
(C1, C2 and C3) (Figure 79). This cluster is characterised by the presence of
Cirratulidae spp., Oligochaeta spp. and Nephtys juveniles. The samples of this cluster
were localized in the ‘Scheur’ area and within the harbor of Zeebrugge. Within this
cluster C, we recognized on a higher similarity level, three sub-clusters, which were not
significantly different regarding the SIMPROF analysis. These sub-clusters shows a
deviation between the samples located within the harbor and those of the ‘Scheur’
area.
Cluster A is characterised by the presence of Mytilus edulis and the samples were
located in the central part of the harbor and in the entrance gully.

106
Cluster B is characterised by one sample (ZBH 10), containing one taxa (Nephtys
juvenile). Cluster D, contains two samples which were characterised by the highest
diversity (especially ZBS 41) and were located in ‘Vaargeul 1’ area. The three species
mainly characterizing this cluster were Abra alba, Cirratulidae spp. and Eunereis
longissima.
Figure 79. MDS plot of the benthic samples with indication of the four simprof cluster groups.
5.4 Conclusion
We can conclude that the dredging area’s around Zeebrugge were characterised
by very poor benthic community characteristics, except the ‘Vaargeul 1’ area. Input of
benthic animals from the dredging areas towards the dumping areas is possible, but
should not lead to species enrichments in the dumping zones, due to the low densities
and species richness in the dredging areas.
a
b
c1
c2
c3
d
BagG1
BagG10
BagG2
BagG3BagG4
BagG5
BagG6
BagG7
BagG8
BagG9ZBH 10
ZBH 14
ZBH 16
ZBH 2
ZBH 20
ZBH 22ZBH 26
ZBS 30
ZBS 35
ZBS 41
ZBS 45
2D Stress: 0.15

107
6 Optimalization of the sampling strategy in the routine
monitoring program
6.1 Introduction
In the period 2009-2011, we invested in the optimalisation of the sampling
strategy of the routine monitoring program at the dredge disposal sites. This was
carried out to standardize the analysis according to European directives and to make
the monitoring time and cost efficient. The first is necessary because the ecological and
environmental status of the marine waters will be evaluated following the guidelines of
the Water Framework Directive and Marine Strategy Framework Directive. Therefore,
the monitoring programs of every Member state has to be adapted in the near future
towards these guidelines. ILVO started this process of monitoring standardisation in the
previous years. Secondly, monitoring programs are costly and time consuming,
especially biological ones. Therefore, some sampling protocols were adapted to collect
similar data within less time.
In this section, the changes to the sampling protocols of the routine monitoring program
of ILVO were outlined and discussed:
- The changes in the duration of the epibenthos and fish tracks from 30 minutes
towards 15 minutes.
- Sieving of the macrobenthos samples alive instead of fixated.
- Introduction of quality assurance in the macrobenthos analysis (ISO
16665:2005) to achieve a BELAC accreditation certificate under ISO17025
norm.
6.2 Short versus long epibenthos-fish tracks
6.2.1 Introduction
When evaluating the previous campaigns, it became clear that an adaptation of
the sampling method, and more precisely the length and the number of a fish track,
was needed. The cause for this specific adaptation was twofold:
- The length of the fish tracks (3500m) was too long to fit within the delineation
of the dumping sites, whereby fauna within and aside the dumping site was
collected.
- Local effects within the dumping sites are hard to detect using long tracks,
since all fauna over a length of 3500m are pooled in a single catch and
information about the small-scale ‘patchiness’ of fauna is largely lost. A

108
shortening of the tracks and an increase in the number of tracks would result
in a higher spatial resolution in the analysis, which would decrease the
detection level of local changes.
However, when implementing shortened fish tracks in the monitoring program, the
confidence of such tracks was first tested experimentally during the autumn campaign
of 2009 (Vandendriessche et al., 2010). Secondly, both track types were taken at some
monitoring stations on the BPNS during the monitoring activities of 2010. The analysis
of both campaigns is shown in this section.
6.2.2 Material and methods
Table 14. List of epibenthic and demersal fish tracks used for testing the difference between short and long tracks, within different time periods (years and seasons).
Epibenthos and demersal fish were sampled with an 8-meter beam trawl,
equipped with a fine-meshed shrimp net (stretched mesh width 22mm in the codend)
and a bolder-chain but no tickler chains (to minimize the environmental damage)
(Figure 13). For the long tracks, the net was dragged during 30 minutes at an average
speed of 4 knots over the bottom. As such, an average distance of 3500 m was
covered. The short tracks are half as long as the original tracks (long tracks) so the
sampling distance and time is 1750m and 15 minutes (see chapter 7). Both track types
were taken aside each other. Data were recorded on time, start and stop coordinates
trajectory and sampling depth in order to enable a correct conversion towards sampled
surface units. The fish tracks were positioned following depth contours that run parallel
to the coastline, thereby minimizing the depth variation within a single track.
Station year season Station year season
ft120 2010 winter ft7802 2010 winter
ft140 2010 winter ft820 2009 autumn
autumn ft830 2010 winter
ft215 2009 autumn autumn
2010 winter ft840 2010 winter
autumn autumn
ft230 2009 autumn ftB04 2010 winter
2010 winter autumn
autumn ftB07 2010 autumn
ft315 2010 autumn ftB10 2010 autumn
ft340 2010 winter ftWT2 2009 autumn
autumn ftWT3 2009 autumn
ft415 2010 autumn ftWT5 2009 autumn
ft421 2010 winter ftWT9 2009 autumn

109
The test was done for different locations, distributed on the Belgian Part of the
North Sea and at different time periods (2009 & 2010 and for winter and autumn) (Table
14; Figure 11).
The complete catch was sorted using a rinsing and sieving machine. As such,
three fractions were obtained: a coarse fraction with mainly larger fish, adult starfishes
and sea urchins; a shrimp fraction with mainly crustaceans, ophiuroids and smaller
fishes and a fine fraction with mollusks and sea anemones. From these fractions, all
fish, except gobies, were identified, measured and/or counted on board. After fish
elimination, representative subsamples (2 to 10l) from each fraction were taken for
epibenthos analyses. For a number of tows, the epibenthos (except gobies and small
and/or rare species) subsamples were processed on board as well; for other tows, the
subsamples were frozen for further laboratory analyses.
The net contents were divided into ‘demersal fish’ and ‘epifauna’. These
ecosystem components were dealt with separately concerning density, biomass
(epibenthos only), diversity and community structure. Furthermore, from the epibenthos
dataset, the polychaetes were deleted, ascidians and the barnacle Balanus, since
these species were not representatively sampled. Gobiidae, belonging to the order of
Perciformes, were treated separately due to their abundance and local importance. The
number of individuals per sample and per species was converted to number of
individuals per 1000m² (density). Biomass was expressed as grams of wet weight
(WW) per 1000m² and diversity was evaluated based on the number of species.
6.2.3 Results
6.2.3.1.1 EFFECT ON DENSITY
Comparison of fish density and epifaunal density showed that the standardisation
of short tracks to number or weights per 1000m² resulted in an underestimation of fish
densities (average 7%) and epifaunal densities (average 36%) compared to the long
tracks (Figure 80). The rate of overestimation or underestimation varied between tracks
and between species groups. Large differences in the estimates of epibenthic densities
were found at stations situated in the coastal area (ft120, ft230, ft215). The difference is
much lower for tracks on sandy bottoms situated more offshore. The most common
epibenthic species groups (Crangonidae, Paguridae, Portunidae, Asteriidae and
Ophiuridae) are characterised by an underestimation of the density by taking long
tracks (Table 15). This underestimation is the highest for sea stars (Asteridae) with a
value of 148%. The most common demersal fish species groups (Pleuronectidae,
Soleidae, Callionymidae, Gobiidae) are underestimated by long fish tracks (Table 15).
This underestimation is on average very low for Callionymidae.
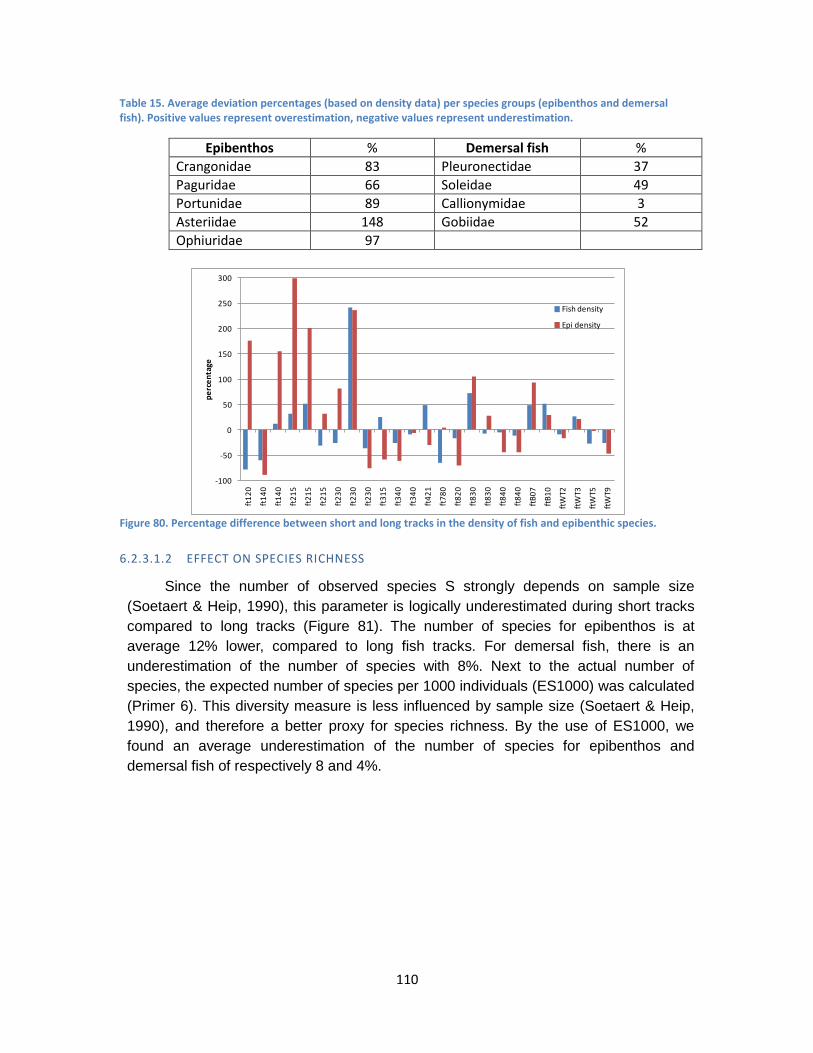
110
Table 15. Average deviation percentages (based on density data) per species groups (epibenthos and demersal fish). Positive values represent overestimation, negative values represent underestimation.
Epibenthos % Demersal fish %
Crangonidae 83 Pleuronectidae 37
Paguridae 66 Soleidae 49
Portunidae 89 Callionymidae 3
Asteriidae 148 Gobiidae 52
Ophiuridae 97
Figure 80. Percentage difference between short and long tracks in the density of fish and epibenthic species.
6.2.3.1.2 EFFECT ON SPECIES RICHNESS
Since the number of observed species S strongly depends on sample size
(Soetaert & Heip, 1990), this parameter is logically underestimated during short tracks
compared to long tracks (Figure 81). The number of species for epibenthos is at
average 12% lower, compared to long fish tracks. For demersal fish, there is an
underestimation of the number of species with 8%. Next to the actual number of
species, the expected number of species per 1000 individuals (ES1000) was calculated
(Primer 6). This diversity measure is less influenced by sample size (Soetaert & Heip,
1990), and therefore a better proxy for species richness. By the use of ES1000, we
found an average underestimation of the number of species for epibenthos and
demersal fish of respectively 8 and 4%.
-100
-50
0
50
100
150
200
250
300
ft1
20
ft1
40
ft1
40
ft2
15
ft2
15
ft2
15
ft2
30
ft2
30
ft2
30
ft3
15
ft3
40
ft3
40
ft4
21
ft7
80
ft8
20
ft8
30
ft8
30
ft8
40
ft8
40
ftB
07
ftB
10
ftW
T2
ftW
T3
ftW
T5
ftW
T9
pe
rce
nta
ge
Fish density
Epi density

111
Figure 81. Percentage difference between short and long tracks in the number of species for fish and epibenthic species
Reduction of work load per track?
The average volume of the catch was reduced from 125 liters in the standard
tracks to 75 liters in the short tracks, which corresponds with an average reduction of
41% (range 10% - 64%). In the case of reasonably small catches that are entirely
processed, the workload on board is obviously reduced. In the case of large catches,
such as de ones at station 230, the subsampling procedure (including the use of a
rinsing and sieving machine) was applied to both track types, and the amount of
organisms to be processed remained identical. In this case, only the tow duration and
the covered distance were reduced.
6.2.4 Conclusion
The rate of overestimation or underestimation varied between tracks and between
species groups. For the offshore tracks, a better correspondence between estimates
was found compared to the coastal tracks. It seems that in areas with high epibenthic
densities (coastal area), the net attained to be filled up, which influenced the net
efficiency. Therefore, short tracks gives a better density estimate compared to long
tracks. Estimations of diversity of short tracks are reliable, providing that the
appropriate measure (expected number of species) is used. Detailed analyses of
diversity (e.g. drafting species lists), however, should be based on longer tracks.
For subsequent analyses, the occurrence of overestimations or underestimations
compared to standard tracks, should be taken into account. Additionally, indices which
do not depend on sample size should be adopted. This difference plays no part when
tracks of similar kind (short) are taken and compared at the same time. A clear
advantage of using short tracks in the dredge disposal research is the fact that the
tracks fit within the borders of the dumping site. Like this, side effects are minimalised
-60
-50
-40
-30
-20
-10
0
10
20
30
40
ft1
20
ft1
40
ft1
40
ft2
15
ft2
15
ft2
15
ft2
30
ft2
30
ft2
30
ft3
15
ft3
40
ft3
40
ft4
21
ft7
80
ft8
20
ft8
30
ft8
30
ft8
40
ft8
40
ftB
07
ftB
10
ftW
T2
ftW
T3
ftW
T5
ftW
T9
Pe
rce
nta
ge
fish S
epi S
112
and the short tracks seem to result in reliable density and diversity estimates of the
area.
6.3 Fixed versus live sieving
6.3.1.1.1 INTRODUCTION
One of the elements that often varies among macrobenthic studies is the sieving
procedure: sieving alive versus sieving after fixation. Before 2010, the ILVO monitoring
programs used sieving after fixation as sieving procedure. This is not common in
European macrobenthos monitoring and results in the use of high volumes of the
carcinogenic formaldehyde. Therefore, from 2010 onwards, we switched to sieving
alive. This difference in sieving procedure has its consequences on diversity, species
densities and community structure (Degraer et al., 2007). Diversity indices and the
density of some species, mainly small, interstitial polychaetes, were negatively
impacted. No major impact on the community composition was found.
Due to the effect of the sieving procedure on the benthic characteristics, we
tested if sieving alive on a 0.5mm + 1mm sieve compensates for the loss of species. It
is expected that a smaller mesh size sieve could nullify the loss of specimens due to
sieving alive (Degraer et al., 2007). This is important to know whether a change on
long-term basis is caused by a change in sampling procedure.
In this section, we investigated the difference between sieving alive, sieving on 2
sieves (0.5mm+1mm) and sieving fixed, for some long-term monitoring stations.
6.3.1.1.2 MATERIAL AND METHOD
In winter and autumn 2010 6 replicate samples (whereof 3 were sieved fixed and
the other three were sieved alive on a 1mm and 0.5mm sieve) were taken at some
stations (120, 140, 330, 415, 830, 840, ZG01, ZG04, ZVL),. The species were identified
to species level when possible and counted. The macrobenthos sampling and analysis
protocol is based on the ISO 16665:2005 standard.
The dataset was standardised and the univariate parameters number of species,
density and biomass (wet weight) were calculated. The statistical differences in those
benthic parameters between the three sieving procedures was tested with a one-way
PERMANOVA (PRIMER6).
6.3.1.1.3 RESULTS
A difference in the benthic parameters between the three sieving procedures was
found. There was a decrease in average number of species, density and biomass from
sieving fixed over sieving alive with 0.5+1mm sieve towards sieving alive on a 1mm
sieve only. An average loss of 29% for diversity and 34% for density was detected when
sieving alive compared to sieving fixed. There was also an average loss of 8% for

113
diversity and 16% for density when there is sieving alive on a 0.5+1mm sieve compared
to sieving fixed.
Table 16. Permanova results (p level) for the parameter density, number of species (N0), biomass and species composition (ssp com) between the three sieving procedures. The non-significant results (p level >0.05).
N0 / Density
Fixed Alive
0.5+1mm Alive 1mm
Biomass/ Spp com
Fixed Alive
0.5+1mm Alive 1mm
Fixed 0.4833 0.0014
Fixed 0.8373 0.0199
Alive 0.5+1mm
0.6551 0.0039
Alive
0.5+1mm 0.6975 0.2423
Alive 1mm
0.0012 0.0019
Alive 1mm
0.7271 1
There was no statistical difference between sieving fixed and sieving alive on a
0.5+1mm sieve for the parameters number of species and density (Table 16). Sieving
alive on 1mm sieve gives significant lower results for the benthic parameters compared
to the other methods. For the parameter biomass (wet weight), there was no significant
difference between the sieving procedures. For the species composition there was only
a significant difference between the fixed sieving procedure and the sieving alive on a
1mm sieve procedure.
6.3.1.1.4 CONCLUSION
Sieving alive has a clear negative influence on the density and species richness
of the samples, compared to sieving fixed. Therefore, caution is needed, in particular in
habitats dominated by small, interstitial and/or larger, slender polychaetes. Larger
polychaetes, polychaetes with obvious head capsules and appendages and more rigid
species, such as amphipods and bivalves, are less prone to the impact (Degraer et al.,
2007). Based on the analysis on the effect of the sieving procedure on the benthic
characteristics in the main benthic habitats, we can trust that data retrieved when
sieving alive on a 0.5 + 1mm sieve is comparable with data retrieved for fixed sieving.
Therefore, we can consider that this switch in sieving procedure will have a minor
influence on the long term trend analysis at the benthic control stations. Since sieving
with two sieves is only used at a certain subset of stations, we have to use conversion
factors at the other stations for analyzing a long term trend.

114
6.4 Quality control macrobenthos analysis (accreditation)
A standardization and harmonization of the analysis procedures between the
European countries is necessary, due to the requirements of the European
environmental legislation (KRW, MSFD) and its monitoring. Due to the fact that
macrobenthos is considered as an important ecosystem element for environmental
monitoring in different directives, it is necessary to follow the international standards.
Therefore, we adopted the ISO 16665:2005 standard for macrobenthos analysis
(“Water quality – Guidelines for quantitative sampling and sample processing of marine
soft-bottom macrofauna”). This guideline was already adapted in our benthic
monitoring, except for the quality control and traceability of the samples procedure. A
way to fill this in is to obtain an accreditation for certain analyses and lab working. In
2010-2011, our microscopy lab and macrobenthos analyses have been accreditated
under BELAC ISO17025 norm (ILVO – DIER – ANIMALAB; CertificaatN°: BELAC T-
315). This label is obtained on 24/05/2011. For the extern control of the counting and
determination, we participate in the BEQUALM/NMBAQC scheme (UK).

115
7 REFERENCES Bijkerk, R. a. V. D., J.A., . 1998. Onderzoek op stortlocatie Kimstergat. Koeman en Bijkerk B.V. Rapportnr. 98-24. Bilyard, G. R. 1987. The value of benthic infauna in marine pollution monitoring. Marine Pollution Bulletin 18:581-585. Bolam, S.G.,Rees L.H., Minimizing Impacts of Maintenance Dredged Material Disposal in the Coastal Environment: A Habitat Approach. Environmental Management 32, No. 2, pp. 171–188. Bolam, S. G., M. Schratzberger, and P. Whomersley. 2006. Macro- and meiofaunal recolonisation of dredged material used for habitat enhancement: Temporal patterns in community development. Marine Pollution Bulletin 52:1746-1755. Burke M.D. and Mayer R.T. Ethoxyresorufin: direct fluorimetric assay of a microsomal O-dealkylation which is preferentially inducible by 3-methylcholanthrene. Drug Metabolism and Disposition, 2, 583-588. (1974). Bucke D., Vethaak D., Lang T., Mellergaard S. Common diseases and parasites of fish in the North Atlantic: Training guide for identification. ICES TIMES N°19. (1996) Clarke, K.R., Gorley, R.N., 2006. PRIMER v6: User ManualTutorial. PRIMER-Plymouth. Degraer, S., E. Verfaillie, W. Willems, E. Adriaens, M. Vincx, and V. Van Lancker. 2008. Habitat suitability modelling as a mapping tool for macrobenthic communities: An example from the Belgian part of the North Sea. Continental Shelf Research 28:369-379. DelValls, T. A., A. Andres, M. J. Belzunce, J. L. Buceta, M. C. Casado-Martinez, R. Castro, I. Riba, J. R. Viguri, and J. Blasco. 2004. Chemical and ecotoxicological guidelines for managing disposal of dredged material. TrAC Trends in Analytical Chemistry 23:819-828. Devriese L., Bekaert K., Hoffman S., Cooreman K., Robbens J. Patterns and Prevalence of Fish Diseases on the Belgian Part of the North Sea, Poster Presentation on PRIMO16, may 2011, CA USA. Elliot, M.; Hemingway, K.L. et al. (2002). Links between fish and other trophic levels, in: Elliot, M.; Hemingway, K. (2002). Fishes in estuaries. pp. 124-216 Essink, 1999 K. Essink, Ecological effects of dumping of dredged sediments: options for management, Journal of Coastal Conservation 5 (1999), pp. 69–80 European Commission, 1979 European Commission, 1979. Council Directive 79/409/EEC on the Conservation of Wild Birds. Official Journal of the European Communities L 103. European Commission, 1985 European Commission, 1985. Council Directive 85/337/EEC on the Assessment of the Effects of Certain Public and Private Projects on the Environment. Official Journal of the European Communities L 175. European Commission, 1992 European Commission, 1992. Council Directive 92/43/EEC on the Conservation of Natural Habitats of Wild Fauna and Flora. Official Journal of the European Communities L 206. European Commission, 1997 European Commission, 1997. Council Directive 97/11/EEC Amending Directive 85/337/EEC on the Assessment of the Effects of Certain Public and Private Projects on the Environment. Official Journal of the European Communities L 073. European Commission, 2006 European Commission, 2006. Council Directive 2000/60/EC Establishing a Framework for Community Action in the Field of Water Policy. Official Journal of the European Communities L 327. Hill, 1973 M.O. Hill, Diversity and evenness: a unifying notation and its consequences, Ecology 54 (2) (1973), pp. 427–432

116
Lang T. Fish disease surveys in environmental monitoring: the role of ICES. ICES Marine Science Symposia, 215, 202-212 (2002) Lauwaert B., B. K., Berteloot M., Debacker A., Derweduwen J.. Fettweis M., Hillewaert H., Hoffman S., Hostens K., Martens C., Michielsen T., Parmentier K., Robbens J., VanHoey G., Verwaest T. . 2009. Syntheserapport over de effecten op het mariene milieu van baggerspeciestortingen (vergunningsperiode 2008-2009). Lauwaert B., B. K., Berteloot M., Brauwer D., Fettweis M., Hillewaert H., Hoffman S., Hostens K., Mergaert K., Moulaert I., Parmentier K., Vanhoey G., Verstraeten J. 2008. Syntheserapport over de effecten op het mariene milieu van baggerspeciestortingen (vergunningsperiode 2006-‘08). London Convention. 1972, Waste-specific guidelines for Dredged Material. Maurer, D., Keck, R.T., Tinsman, J.C., Leathem, W.A., . 1980 Vertical migration and mortality of benthos in dredged material: part I-Mollusca. . Marine Environmental Research 5:301-317 Maurer, D., R. T. Keck, J. C. Tinsman, and W. A. Leathem. 1981. Vertical migration and mortality of benthos in dredged material: Part II--crustacea. Marine Environmental Research 5:301-317. Maurer, D., R. T. Keck, J. C. Tinsman, and W. A. Leathem. 1982. Vertical migration and mortality of benthos in dredged material: Part III--polychaeta. Marine Environmental Research 6:49-68. Morton, J. W. 1977. Ecological effect of dredging and dredge spoil disposal: a literature review. Technical papers of the US Fish and Wildlife Service 94:33 S., Washington, DC. "MMM" act (act of 20 January 1999 on the protection of the marine environment in sea areas under Belgian jurisdiction, 27pp OSPAR, 2008 OSPAR, 2008. Literature Review on the Impacts of Dredged Material Disposal at Sea. Biodiversity Series No. 362, 54pp. Paipai, E., A. Brigden, and C. Wooldridge. 2000. Guidelines for port environmental management. Pages 197-206 in C. A. Brebbia and J. Olivella, editors. Maritime Engineering and Ports Ii. Wit Press, Southampton. Rees, H. L., Rowlatt, S.M., Limpenny, D.S., Rees, E.I.S., Rolfe, M.S. 1992. Benthic Studies at Dredged Material Disposal Sites in Liverpool Bay. Aquatic Environmental Monitoring Report, Lowestoft 28, 1-21. Rees, H. L.,Boyd, S. E.,Schratzberger, M.,Murray, L. A.2006. Role of benthic indicators in regulating human activities at sea. Environmental Science & amp. 9, 496-508. Simonini, R., I. Ansaloni, F. Cavallini, F. Graziosi, M. Iotti, G. M. N'Siala, M. Mauri, G. Montanari, M. Preti, and D. Prevedelli. 2005. Effects of long-term dumping of harbor-dredged material on macrozoobenthos at four disposal sites along the Emilia-Romagna coast (Northern Adriatic Sea, Italy). Marine Pollution Bulletin 50:1595-1605. Smith, P.K., Krohn, R.I., Hermanson, G.T., Mallia, A.K., Gartner, F.H., Provenzano, M.D., Fujimoto, E.K., Goeke, N.M., Olson, B.J., Klenk, D.C., 1985. Measurement of protein using bicinchoninic acid. Analytical Biochemistry, 150, 76-85. Soule D.F., K. G. S. 1988. Marine Organisms as Indicators. Springer. Stagg R. and McIntosh A. Biological effects of contaminants: Determination of CYP1A-dependent mono-oxygenase activity in dab by fluorimetric measurement of EROD activity. ICES TIMES N°23. (1998) Stutterheim, S. 2002. Van Noord tot Noordwest: Een studie naar de berging van baggerspecie op loswallen. RIKZ/2002.047. Thain J.E., Vethaak A.D., Hylland K. Contaminants in marine ecosystems: developing an integrated indicator framework using biological-effect techniques. ICES Journal of Marine Science, 65, 1508-1514 (2008)

117
Van Hoey, G.; Drent, J.; Ysebaert, T.; Herman, P. (2007). The Benthic Ecosystem Quality Index (BEQI), intercalibration and assessment of Dutch coastal and transitional waters for the Water Framework Directive: Final report. NIOO Rapporten, 2007-02. NIOO. 244 pp. Van Hoey, G., Hostens, K., Parmentier, K., Bekaert, K., De Backer, A., Derweduwen, J., Devriese, L., Hillewaert, H., Hoffman, S., Pecceu, E., Vandendriessche, S., Wittoeck, J. 2009. Biological and chemical effects of the disposal of dredged material in the Belgian Part of the North Sea (period 2007-2008). ILVO report. Van Hoey, G., S. Degraer, and M. Vincx. 2004. Macrobenthic community structure of soft-bottom sediments at the Belgian Continental Shelf. Estuarine, Coastal and Shelf Science 59:599-613. Widdows ,J ., Fieth, P., Worral, C.M., 1979. Relationship between seston, available food and feeding achtivity in the common mussel Mytulis edulis. Marine Biology 50, 195-207. Ware, S., Bolam, S.G., Rees, H.L., 2009. Impact and recovery associated with the deposition of capital dredging at UK disposal sites: Lessons for future licensing and monitoring. Marine Pollution Bulletin 60, 79-90. Wildish, D. J. and M. L. H. Thomas. 1985. Effects of dredging and dumping on benthos of Saint-John harbor, Canada. Marine Environmental Research 15:45-57.

118
8 ANNEX 1
Annex 1.Dumping intensity maps of the disposal sites (2004-2008):
- Maps of “2004”, “2005” and “2006 ” are based on point observations.
- Maps of “2007” and “2008” are based on polygons
- For 2006; only S1-data was available

119

120
Verantwoordelijke uitgever: Instituut voor Landbouw- en Visserijonderzoek Eenheid Landbouw & Maatschappij
Burg. Van Gansberghelaan 115, bus 2 B-9820 Merelbeke Tel. 09 272 23 40
Website: http://www.ilvo.vlaanderen.be/LenM/
Deze publicatie is te verkrijgen bij: Gert Van Hoey E-mail: [email protected]
Foto’s voorpagina: ILVO
Wettelijk Depot: D/2008/10.970


![GHENT UNIVERSITY [In cooperation with ILVO]emmichel/Tempus-visit... · 0.09±0.02 to 0.54±0.29 mg kg −1 Comparison with literature data: foliar treatment of wheat with Na 2SeO](https://img.pdfslide.us/doc/110x75/5fbb95fd868ed5458174be12/ghent-university-in-cooperation-with-ilvo-emmicheltempus-visit-009002.jpg)