Embed Size (px)
Citation preview

BIOL121, Ecology, Genetics, & EvolutionDetailed course note by Luan DangInstructor: Wayne GoodeyTextbook: Campbell & Reece, Biology, 6th Edition
Note: all images mentioned here will have their position in the book and their filename. Their title might have been changed by me to sound catchier or easier to understand.
Hiuck! Hi y'all! I are GeekStone, now second year undergrad at B.C. University. I are write this course note. I are quite evolved for my time y' know.Course synopsis: go for it. (In progress)
Jump to topic (bookmark list)(In progress)
DETAILED COURSE NOTESept 4, 2002 First day of class
Admin stuff- Group project announcement
Sept 6, 2002 How science is done
About the scientific method- Observations: are made to gain more
understanding on a subject and whose merit depends on previous understandings.

You may be surprised, but the English court actually received reports of 15-legged, 5-eyed, fire breathing lizards keenly "observed" in Africa by an exploration party. (misc2.jpg)
- Explanations: there is never one X answer for an X question; there are X, M, Z, V potential explanations, called hypotheses.
- Evaluation: testing by experiment science works not by proving, but disproving, as Sherlock Holmes said, “When you have eliminated the impossible, whatever remains, however improbable, must be the truth.”
- More evaluation: in science, the test must be repeatable and must yield results consistent with the predictions made by the hypothesis.
- Theory: after surviving extensive testing, a hypothesis may be considered “ripe” and be accepted as right. Yet no theory is ever exhaustive; history has proven that corrections will always be made, and widely accepted theories may be mowed down later with the light of more accurate observations and data inputs by newer instruments. If you believed in high school that the world has 3-D, prepare to be proven wrong by Einstein.
Experimental design
Figure 39.4 Phototropism experiment, step by step (fig394.jpg)
There will be figure studies all around BIOL121. They are simply just figures from the textbook. Why? When you spend around a hundred on a book, it is a waste to use example images elsewhere. Most figs used were up to date with your 6th edition text, but some were from the 5th. Figure 39.4 means figure 4 of chapter 39. Still can’t find that number? Just be patient and look around a bit.
Phototropism is the bending of plants toward light.Experiment to determine the mechanism of phototropism
Control: The factor being tested is left at the treatment level normally encounter in the specimen's natural habitat. All other conditions are kept the same as the testing specimens to ensure that any changes observed are caused by only the factor being tested.
Hypothesis: only the tip of the coleoptile can sense light direction. (H.1) Testing: Supporting hypothesis
Tip removed: the coleoptile doesn’t bend, suggested that hypothesis 1 is right. Tip covered with opaque cap: no light passes thru → no bending, confirm H.1 Tip covered by transparent cap: light passes thru → bending, confirm H.1
Disproving null hypothesis Base covered by opaque shield: tip exposed → normal bending; the base does not
sense light, confirm H.1. Hypothesis 2: bending response occurs below the tip.
Tip separated by mica → tip exposed, yet no bending; light is sensed, but a signal must travel downward from the tip, and it cannot pass thru impermeable mica.
Hypothesis 3: the signal is a biochemical one, so it cannot pass through a membrane. The signal turns out to be auxin, a plasma membrane hormone that weakens the
cellulose wall of cells on the far side of the light, allowing them to elongate. This figure is also an illustration of scale in the scientific method. When designing an experiment, it is important to choose the appropriate scale. You can start from a large, visible scale like the change in the whole plant, then move done to parts of the plant, the tip/body/stem/root/leaf..., and then to the plants biochemistry. Our hypothesis gets more and more specific as our scale gets smaller
The day ends.
Sept 9 th , 2002
Ecology: The study of how organisms interact in the environment.

Concepts in Ecology:- Scale:
Spatial: The dimensions of an experimental organism; the boundary of a population or community... All scale is only meaningful if there is a point of reference.
E.g. All right, Ontario is 60 km away, but away from what? Without a frame of reference, a measurement is meaningless. Same for a map without a scale bar. Luckily, the scale we are concerned with in ecology is no smaller than some nanometers (10-9 m, for some viruses) and no bigger than Earth’s diameter (~107 m, for the biosphere)
Temporal: time/frequency/repeating patternsE.g. unlike most animal of its size, human lives really long and grows really slow too.
- Characterization: Classifying life By genetic similarity and common origin (functional definition of species). By morphology/behavior features (descriptive definition).
Figure 1.10 Canis lupus, a taxonomic scheme of the wolf (fig110.jpg)
“Biodiversity is a hallmark of life... Evolution is the key to understanding this biological diversity.” (Campbell, p.9)
The taxonomic scheme consists of groups contain within more comprehensive groups. Species that are closely related are placed in the same genus; genera are grouped into families, and so on...
- Interaction: never look at just one organism alone; look at its community type and the interactions within it.
1. Interaction determines behavior.2. Interaction can be...
Btw species Btw individuals of the same species
- Wolf distribution:1. Wolf used to appear throughout N. America and N. Asia, but now scattered for various reasons. Not only is “wolf” placed on the classification scheme, it is also placed on the ecological one. This means that wolf does not exist in isolation but in a very complex network of interaction with many types of prey and competitors, other wolfs and other species of predator. They are also affected by the weather, quality of habitat, and random catastrophic natural events.
That is, wolf must be seen in its environment; if you have seen a wolf once in the zoo, you cannot say you know “wolf.”
Definitions: Community is an assemblage of populations of different species in an area of habitat. Population is the collective appearance of one species in an area of habitat. Biome refers to a set of environmental conditions and is defined as one of the major
types of ecosystems; e.g. coniferous forests, deserts, and grasslands. Biomes determine climate/ soil/ rainfall/ temperature... Thus biomes define the specific characteristic of the organism in a community. Interspecific interaction is between members of different species.
Figure 53.1 Interaction diagram (fig531.jpg not scanned)

Competition (-/-) can be inter- or intraspecific.▪ You go to the Pit Pub, there’s only ONE hamburger left.
Another hungry guy is on the way; both of you run; you fight the guy for the burger. The loser gets nothing but a fight; whoever wins has won the meal for a cost.
Predation (+/-) between different species.▪ You eat the hamburger: fatal cost for the beef, protein benefit
for you. Mutualism (+/+) between different species.
▪ Rhizobium bacteria in leguminous root nodules fixed nitrogen, part of which used by the tree; the tree protects the rhizobia from oxygen, which oxidize the very fragile Nitrogenase enzyme; both are happy.
Commensalism (+/0) interactions in which one species benefit from the other, while causing almost no harm nor good to the other. (Darwinian fitness-wise)
▪ There are disputes about the existence of this kind of interaction, since it is much easier to measure a positive or negative effect, whereas there is no way to prove “zero effect.”
- Interaction can change1. Over time, this topic will get more coverage later
in Evolution.2. With the introduction of new species
Figure 50.7 Introduced exotic species, the African honeybee (fig507.jpg)
Spread of the African honeybee in the Americas since 1956
Read page 1097. This fig is explained extensively in the book and will be mentioned again with more detail.
The day ends.
Sept 11, 2002 Abiotic forces
Environmental factors affecting organisms’ habitat Moisture (precipitation) Temperature
Are the two most important climatic factors in species distribution.Each species has different needs and tolerance for temperature and moisture due
to there morphology and biochemistry.Other more complex conditions are combinations of the above in different ways.
Rock and Soil (substrate), etc.Soil moisture, texture, and nutrient content – It affects the plant distribution of
an area.And because plants are the primary producer, plant distribution affects the
distribution of other organisms as well. Amount of light
Why is light so important?Definition: Primary Production is that of Photosynthesis Activity.

When primary production is affected, every other activity is affected as well.
→ Air circulationThe wind, air circulation, and air temperature is also important to the
distribution of organisms.E.g. it helps the dispersion of spores and seeds. It is also an important influence of climate.
Figure 50.10 climograph of major kinds of ecosystems (fig5010.jpg) Different ranges of annual mean temperature and precipitation reflects different biomes in
different geographical regions. The ranges overlapped! Nothing strange, this fig actually oversimplified things by showing
the means. In reality, two regions with the same mean rainfall may have completely different rainfall distribution. E.g. 4 seasons vs. 2 (near the equator). Also, there are other factors operating in addition to temperature and rainfall.
Different climates happen in different areas in different times! Another excuse for the overlapping. E.g. monsoon rain in India when it’s hot in Madagascar, and vice versa. (I'm not completely sure of this example)
Geography review The figures here are only to help you understand the basic mechanisms operating these abiotic
factors. They will not be tested. What you need to know in this section is be able to explain a case of distribution based on
those abiotic factors.
Figure 50.12 Seasons and temperature (fig5012.jpg not scanned)The 23.5o tilt of the Earth on its axis causes some regions to receive more or less sunlight as the Earth revolves around the sun. This is just to brush up on your geography and will not be tested. Skim through page 1102.
Figure 50.13 Global air circulation and precipitation (fig5013.jpg not scanned) The movement of air by heating and the movement of the earth are factors that constitute to
the overall global air circulation and wind patterns. This in turn affects precipitation and temperature.
Read page 1103 Again, this will not be tested.
Local and seasonal effects on climate - Read Textbook p.1102: Ocean currents influence the climate along the
coasts of continents by heating or cooling overlying air masses, which may then pass across the land.
- The oceans and large inland bodies of water tend to moderate the climate of nearby terrestrial environment.
- Mountains: south-facing slopes in the N. Hemisphere receive more sunlight than north-facing slopes different organisms.
- Mountains affect rainfall.
Figure 50.14 Mountains Affect Rainfall (fig5014.jpg)- Vancouver and the Okanagan – air moves in from the Pacific Ocean.- At the windward side of the elevation, much precipitation occurs. Vancouver gets the name
“boring city” from this rain.- Moist air from the ocean has already lost most moisture, and now descends to central BC and
sucks up all moisture there, creating a much dryer/ hotter rain shadow.- If you don’t like BC, you can enjoy desert summer and icebox winter in Alberta, the leeward side.

Lake ecology is easily affected by local and seasonal climate changes.
Figure 50.15 Lake Ecology (fig5015.jpg) Keep in mind: cold water oxygenates better.
organisms constantly consume oxygen in water Spring and autumn: there is a turnover in the body of water, bringing oxygenated water from
the surface to the bottom and nutrient-rich water from the bottom up. Winter: There is a thin layer of ice on the surface of the lake. Only the middle layer of the
lake contains the highest oxygen concentration. Because most organisms don’t thrive at freezing temperatures, most photosynthesis happens in the middle layer.
Summer: there is a sharp thermocline separating the upper layer of high temperature and the lower layer of very cold bottom water, as solar radiation can’t penetrate deep under the top layer.
Thus, it's not surprising that lake communities changes dramatically over seasons.Ocean ecology, on the contrary, is affected very little by surrounding changes.
Figure 50.22 Zones in ocean ecology (fig5022.jpg) Keep in mind:
- The ocean bed is mostly flat plain, not volcanoes.- The ocean’s average depth is 3000 m.- Ocean temperature changes very little regardless of outside condition due to its sheer size
and depth, so little convection occurs. The zonation of ocean ecology is quite stable over the seasons.
- The photic zone, where light shines to, could reach 1000 m in theory, but in reality is usually less than 200 m and very often less than 20 m.
- Go scuba diving and see for yourself. Very little photosynthesis actually happens beyond this depth.
- Deep-water organisms are mostly scavengers feeding from the detritus, dead/ waste matter, falling from the upper layer.
The moral: the oceans are NOT nearly as productive as were claimed to be (more on this in later lectures). Do not expect endless food from the seas.
An overview of ecosystem (community) dynamics - The first law of thermodynamic, law of conservation of energy.- Energy can only changes from one system to another or one form to another; some energy is
always lost as heat, the most randomized form of energy.- High-energy forms, such as light, eventually become heat, which dissipates into space.- Nutrient is recycled, but energy is not, the only way ecosystem kept running is because of a
constant supply of energy, the sun.- Organisms use energy for maintaining body temperature, vaporizing water, movement, and
structure. (light energy, for example, is turned into more organized chemical bonding energy)

Figure 54.1 Basic ecosystem dynamics (fig541b.jpg)
Detritivores: microorganisms that decompose dead/ waste matter (e.g. dead remains, feces, fallen leaves, and wood) for energy.
Decomposer plays a central role in material cycling. They return unused (dead) organic nutrients to primary producers as inorganic nutrients.
Read page 1199.
- End of the day
Sept 13, 2002 Ecosystem dynamics – energy and nutrients
The efficiency of energy use by organisms- Only 1% of light energy is ever caught by organisms.- Organisms are quite inefficient in handling energy, but only on a relative scale.- Let’s take a caterpillar for example, Figure 54.10 (fig5410.jpg not scanned) shows the energy
partitioning within a link of the food chain.
Figure 54.12, 54.13 Food chain Pyramids (fig5412.jpg, fig5413.jpg not scanned)54.12 – Pyramids of biomass
- Also see Fig 54.11, an idealized pyramid of net production.- Florida bog – there is a sharp decrease in biomass at successively higher trophic
levels.- English Channel – This seems improbable, a small standing crop of primary
producers supports a larger standing crop of primary consumers. Inverted biomass pyramid.
This is because of phytoplankton's short turnover time (p.1207) – reproduces at phenomenal rate and are consumed rapidly. Biomass is kept at a small number in dynamic equilibrium.

On the contrary, in a tree (in Florida), only the leaves are edible, thus primary production and consumption is kept at a steady small rate, while biomass (of the trees) is large and stable.
Efficiency: is relative organisms only have to be efficient enough to beat their neighbor/competitors and maintain an equilibrium population under predation
Ecology of Population, the pyramid of numbers- In a stable ecosystem, biomass is mostly constant.- An ecosystem can change drastically in biomass.
1. Oscillating change: change by season2. Irregular change: Disturbances
E.g. agriculture, a population can increase in biomass from zero to very high and drop to zero again in a matter of months.
Figure 54.14 Should we become vegans? (fig5415.jpg) It is much more efficient in terms of energy. Read page 1208.Consequences: Industrialized ("Western") human behavior causes a very large "ecological footprint," which likely usurps resources from, or even destroys outright many
species and communities.
- The day’s over
Sept 16, 2002 Ecosystem dynamics (continued)
Biomass continued from last lecture, and primary production of different ecosystem
Notes: You may be very tired and bored so far, but from now the course starts to get exciting once we go into community structure. The names of the figures are getting really long too, so stick around.
Figure 54.3 Primary Production of Different Ecosystems (fig543.jpg)- First thing, this figure is not a very good one, as there was no biomass; productivity must be stated
in term of biomass to have meanings (turnover rate). And a system with high productivity does not necessarily have a high biomass and vice versa. You don’t need to have a CEO’s income to have good money in your bank account.
- The sea, though having a really small net primary production per meter square, actually constitutes the highest percentage of total primary production with its huge area.
The moral: energy flows bottom-up in a pyramid scheme.
Community structure
Picture 1_17 – A food network

C1 C2 *** very strong interaction** strong interaction* weak interaction
This is a very rudimental model of a food network;H1 H1 life’s more complicated than that pal.
*** (We’re talking hundreds/thousands of species)
P1 P2 P3 P4
- If there is NOT a resource overlap, there’s no competition. But if there is, chances are there’s still no significant competition as organisms may have different modes of resource usage, esp. bacteria, or the resource may be abundant enough to sustain both consumers. Resource manipulation (experiment) is always needed to confirm an interaction.
Question: What happens if C2 is removed? The food chain is held in check by fierce competition and top-down control (predation) to
ensure no species overeats othersand the limited resources of the lowest level (but we can't tell anything about water/nutrients
availability to the Producers in the above figure.)
Picture 1_18 Theoretical food network (figure 53.14 supplement)
2nd Carnivore
1st Carnivore
Herbivore
Primary Producer
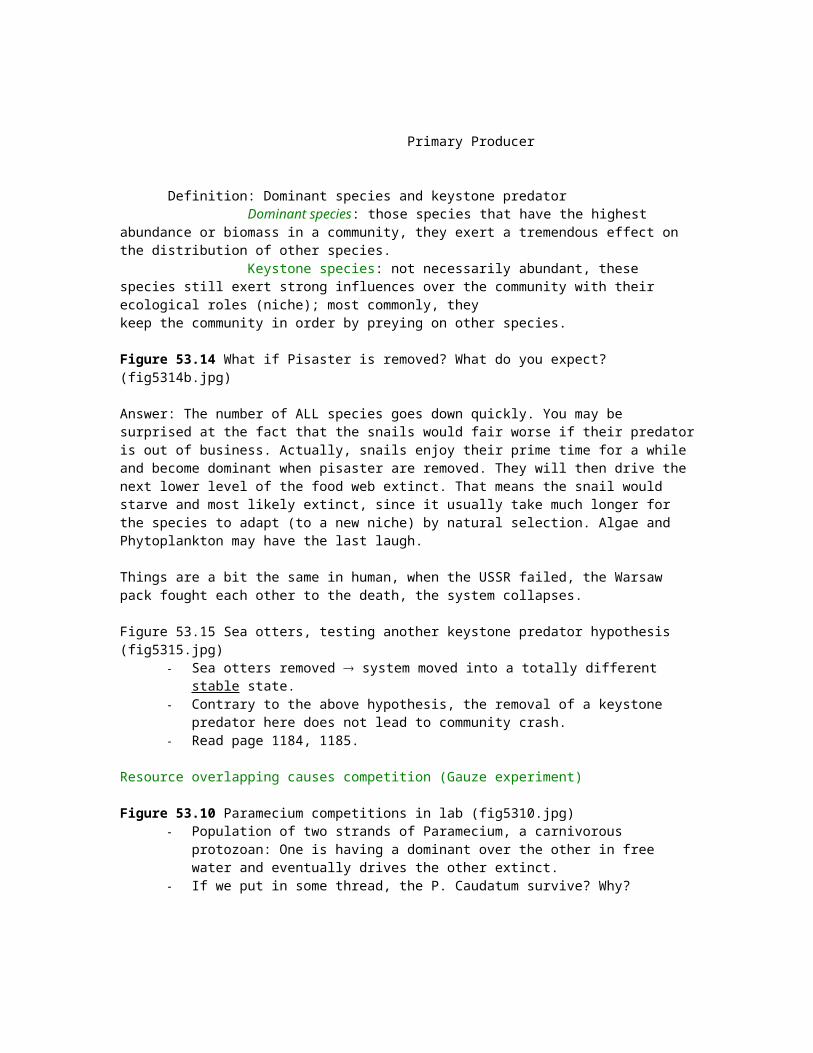
Definition: Dominant species and keystone predator Dominant species: those species that have the highest abundance or biomass in a
community, they exert a tremendous effect on the distribution of other species. Keystone species: not necessarily abundant, these species still exert strong influences
over the community with their ecological roles (niche); most commonly, they keep the community in order by preying on other species.
Figure 53.14 What if Pisaster is removed? What do you expect? (fig5314b.jpg)
Answer: The number of ALL species goes down quickly. You may be surprised at the fact that the snails would fair worse if their predator is out of business. Actually, snails enjoy their prime time for a while and become dominant when pisaster are removed. They will then drive the next lower level of the food web extinct. That means the snail would starve and most likely extinct, since it usually take much longer for the species to adapt (to a new niche) by natural selection. Algae and Phytoplankton may have the last laugh.

Things are a bit the same in human, when the USSR failed, the Warsaw pack fought each other to the death, the system collapses.
Figure 53.15 Sea otters, testing another keystone predator hypothesis (fig5315.jpg) Sea otters removed system moved into a totally different stable state. Contrary to the above hypothesis, the removal of a keystone predator here does not lead to
community crash. Read page 1184, 1185.
Resource overlapping causes competition (Gauze experiment)
Figure 53.10 Paramecium competitions in lab (fig5310.jpg) Population of two strands of Paramecium, a carnivorous protozoan: One is having a dominant
over the other in free water and eventually drives the other extinct. If we put in some thread, the P. Caudatum survive? Why?
Paramecium is, like human, can hide from enemies. The thread is a place for the P. Caudatum to chicken out. Not exactly, it just are a place
where food are trapped and P. Caudatum can eat without competition from the "stronger" strand. Coexistence is only possible with the presence an outside force, such as a continuous input of energy from a really abundant primary producer. Otherwise, the niche principle says that organisms tend to divide up space and time, like our paramecia did.
Figure 53.3 Resource partitioning in a group of lizards (fig533.jpg corrupted, rescan from Biology 6th edition)
The different species of lizard assume different niches to avoid resource conflict. In this figure, "niche" is distinguished mainly in terms of habitats. The scale is pretty delicate here, the change in habitat only involve a few meters, and a total
of seven species.
Definition: Resource partitioning: one species (the less competitive) in competition will evolve enough through natural selection to use a different set of resource, assuming a different niche to coexist in a community.
Figure 53.2 Barnacles (fig53.2.jpg) Read page 1177. Testing a competitive exclusion hypothesis. The species whose fundamental and realized niches are the same is the stronger competitor
(potential niche unaffected by the other organism)Definition: Potential Niche without competition
Realized Niche with competition
The day is over.

Sept 18, 2002 Ecosystem dynamics (continued) – Niche
Niche "If an organism's habitat is its address, the niche is that habitat plus the organism's occupation." (Eugene Odum)
Definition: ecological niche: the sum total of a species use of the biotic and abiotic resources in its environment.
Niche, on a large scale of evolutionary time, determines the distribution of species.
Niche is like lifestyle; your niche, for example, involves whether you drink Coke or Pepsi, major in Biology or Political Science, stay in a house or a bachelor suite, watch Pokemon, want to (and be able to) beat your classmate to that vibrant cheerleader, etc.
Figure 53.4 Finches in the Galapagos (fig534.jpg)
Sympatric: same homeland G. Fortis's beak is bigger. G. Fullinosa's beak is much smaller. Why there is such differentiation?
Allopatric: different homelands for G. Fortis and G. Fullinosa beak depth is very similar, almost the same for the two species.
Similarly-sized beak seems to occur only when there's no competition. In another way, competition stimulates species to evolve apart to avoid being driven extinct.
Home assignment: Is there any unstated assumption in this Fig, or is the observation of these two cases (sympatric/allopatric) conclusive? Honestly, Wayne just confused me on this one when he just said it, so I'll explain a little. Actually he just turned 180° and makes you do an experimental design question.
(E.g. The type and size of the nuts in these islands may be all different. You may have hard nuts that forces G. Fullinosa to evolve bigger beak, while smaller/softer nuts in another island may induce smaller G. Fortis beak; there are tons of possible answers.)
I) Nutrients Circulation in the Ecosystem

Nutrient, beside energy, is a part of Niche.
Figure 37.6 Soil water n' mineral availability (fig37.6.jpg) This figure is more about the physiological working of plant roots, but nonetheless you could
still look at it ecologically, at the interspecific interaction between plant and bacteria. Plants live in mutualism with nitrogen fixing bacteria and compete with denitrifying bacteria.
The interaction goes as far as the plant letting rhizobium to occupy root hair, forming root nodules connected to the vascular tissue. The plant also prevents oxygen from inhibiting the bacteria by leghemoglobin (leg signifies Legume).
Homework: Why plant itself can't fix N2 even when endowed with genes of those organisms that can do this? (Current experiments on this line fail almost 100%)
Figure 54.15 Forms of nutrients, a general model of nutrient cycling (fig5415.jpg)
Read page 1209.
Figure 54.16 the water cycle (fig5416.jpg) Water moves in a cycle
mostly by abiotic forces, so human cannot mess this up (I hope, at least not yet).
Read 1210-1212.
Figure 54.17 Carbon movements (fig5417.jpg)
The largest reservoir of C is the ocean sediment.
The largest recycler of C is detritus decomposition by bacteria. (releasing CO2); the second is plant.
The cat and the rabbit in the Fig is overrated, animal respiration plays only a minimal role in recycling C.
Carbon moves easily as CO2, but movement is scarce in the atmosphere. This movement is very important. A small change in C level can affect community structure
greatly, as carbon is the most important organic molecule, the building block for all biomolecules.
Figure 54.18 The Nitrogen cycle (fig5418.jpg) Plant assimilate Nitrogen from the environment by 2 sources:
Decomposition—bacteria turn organic N into inorganic N. N2 fixation. Decomposition constitutes 100 times the amount of N being fixed from the
atmosphere. There is a very tight recycling of Nitrogen in the biosphere.
The flow rate of nitrogenous material is much smaller (at about a 1/ 700 ratio) than the amount in plant/ organism at any given moment.
Figure 54.19 The phosphorus cycle (fig5419.jpg) Phosphorus is even harder to get than Nitrogen and is recycled even more tightly. Question o' the day: Why did organisms evolved to use it as a major bioelement?
By now you must have noticed that Wayne always ends his lectures with impossible questions whose answers he sometimes admits that even he doesn't know. They make good research topics though.
Sept 20, 2002 Ecosystem dynamics – niche (continued)
II) Is nutrient unlimited?
Figure 54-1 Nutrient Enrichment Sargasso Sea (fig541.jpg) This is a very productive area, but it lacks some nutrients. An experiment is conducted to
determine what nutrient is lacking. C-14 isotope uptake by cultures measures primary production. Experiments shows that nutrient limitations are very specific and sometimes unexpected (in
this case, iron) However, an ecology student must always look at experimental design with critical eyes. This
experiment once again shows the inherent flaw of field testing; there's just no way to control how the powdered nutrient disperse and myriads of other factors.
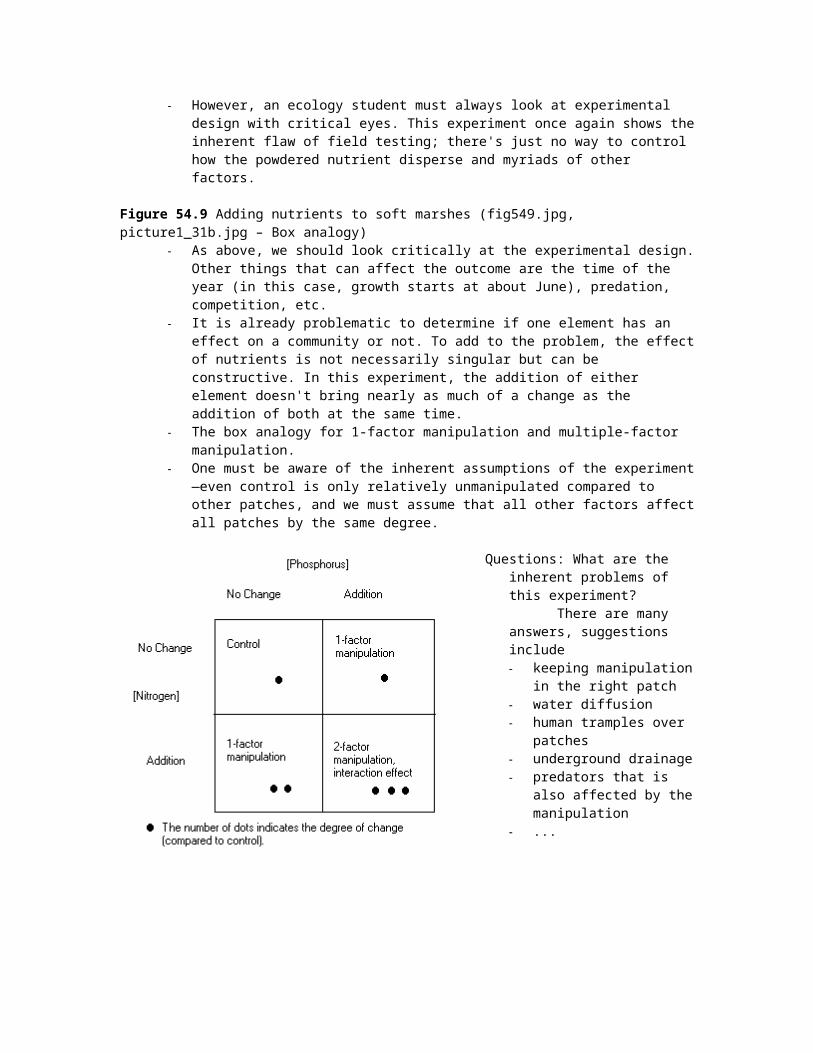
Figure 54.9 Adding nutrients to soft marshes (fig549.jpg, picture1_31b.jpg – Box analogy) As above, we should look critically at the experimental design. Other things that can affect the
outcome are the time of the year (in this case, growth starts at about June), predation, competition, etc.
It is already problematic to determine if one element has an effect on a community or not. To add to the problem, the effect of nutrients is not necessarily singular but can be constructive. In this experiment, the addition of either element doesn't bring nearly as much of a change as the addition of both at the same time.
The box analogy for 1-factor manipulation and multiple-factor manipulation. One must be aware of the inherent assumptions of the experiment—even control is only
relatively unmanipulated compared to other patches, and we must assume that all other factors affect all patches by the same degree.
Questions: What are the inherent problems of this experiment?
There are many answers, suggestions include keeping manipulation in the
right patch water diffusion human tramples over patches underground drainage predators that is also affected
by the manipulation ...

Human affecting community structure
Where is the fine-line between fertilizer and pollution?
Figure 54.26 Increase in atmospheric carbon dioxide and temperature from 1958-2000 (fig5426.jpg) Read page 1249.
Figure 50.16 Beech Trees, current and predicted range (fig5016.jpg) Plants can actually "run" away from changes in its habitat to avoid extinction. Of course, they
do so by seed/ spore dispersion, not by actual "running" ^_^ Overlap zone – this zone will retain the old condition; it is the overlapping between the
potential future range and the current range. Future range – theoretically, beech trees will survive in this zone, but it is just a potential,
since it takes hundreds of years for trees to cover such a distance. A more thorough explanation of the "speed" of those beech trees is in the textbook (p. 1105).
Current range – beech trees are likely to disappear in this region in the future. They may have a chance if they evolve fast enough to adopt a new niche, but that process usually takes a very long time.
Figure 54.21 Nutrient runoff by deforestation and natural recovery (fig5421.jpg) NO3- is normally very tightly recycled. If we design an experiment that involve cutting down all trees in an area, then measure
nitrogen runoff on a very large temporal scale, spanning many years, the runoff level will go up very high soon after the community broke apart, but eventually will come to a halt.
Nitrate runoff level may actually returns to near the original level. Other vegetations must be holding Nitrate. What interesting is that it takes a many more years for the community to grow back anywhere near the original, thus Nitrogen storage in the community at that time is much smaller than it originally was. The rate of recycling, however, was the same, regardless of the biomass.
Figure 54-23 Distribution of acid precipitation (fig5423.jpg) Acidification occurs because of a disruption in the N, S cycle. Lakes and soil normally have a natural buffer against acidification, and this buffer is also
recoverable. Thus only the disruptions caused by human are becoming too much for the natural buffers to
handle. In a way, this is similar to an uncontrolled experiment. The damage caused by acid precipitation is very hard, if not impossible, to measure.
Figure 54-25 DDT and the accumulative effect of pollutant (fig5425.jpg) An organic molecule that can dissolve in fat will flow like nutrients up the food web and
become more and more concentrated at higher levels.
Figure 53.23 Human impact on species richness in land birds (fig5323.jpg)Read this section near the end of chapter 53 for a thorough explanation.A notable point is that the less human development, colonization in an area, the more species of
birds there are.
Ecology of PopulationsIn case y' are still

sleeping, we are movin' away from communities and are now dealing with populations by itself.
Forces influencing populations
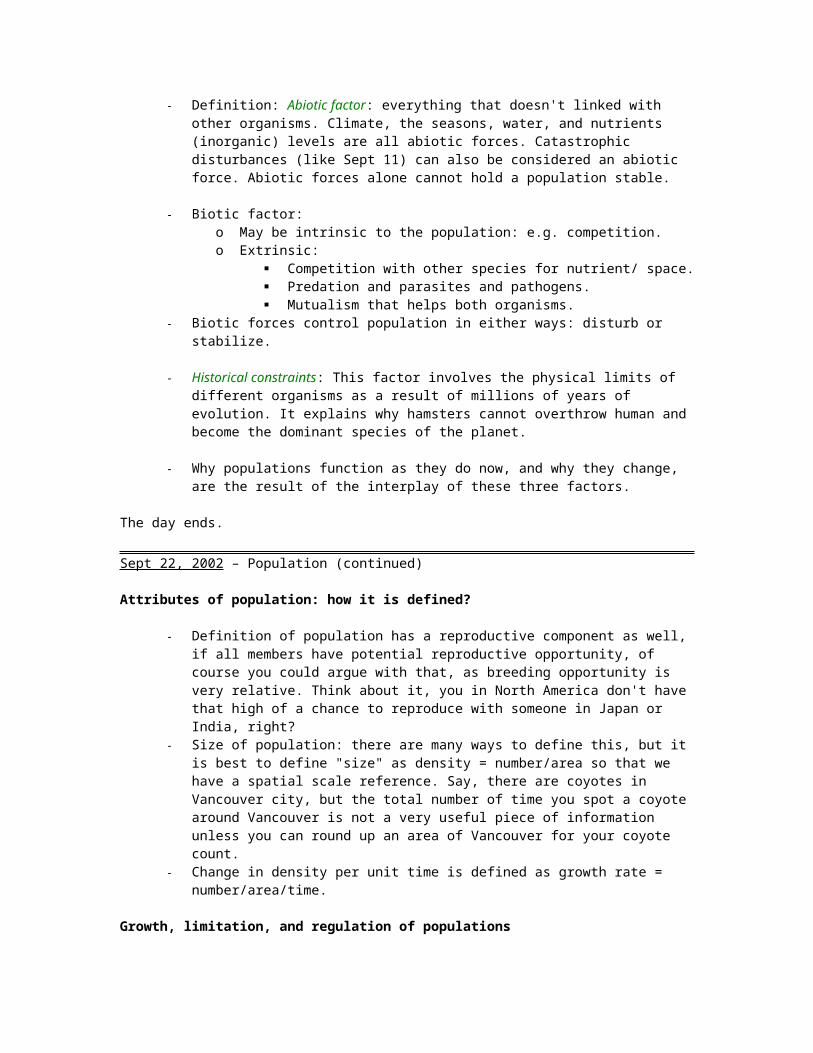
Definition: Abiotic factor: everything that doesn't linked with other organisms. Climate, the seasons, water, and nutrients (inorganic) levels are all abiotic forces. Catastrophic disturbances (like Sept 11) can also be considered an abiotic force. Abiotic forces alone cannot hold a population stable.
Biotic factor: o May be intrinsic to the population: e.g. competition.o Extrinsic:
Competition with other species for nutrient/ space. Predation and parasites and pathogens. Mutualism that helps both organisms.
Biotic forces control population in either ways: disturb or stabilize.
Historical constraints: This factor involves the physical limits of different organisms as a result of millions of years of evolution. It explains why hamsters cannot overthrow human and become the dominant species of the planet.
Why populations function as they do now, and why they change, are the result of the interplay of these three factors.
The day ends.
Sept 22, 2002 – Population (continued)
Attributes of population: how it is defined?
Definition of population has a reproductive component as well, if all members have potential reproductive opportunity, of course you could argue with that, as breeding opportunity is very relative. Think about it, you in North America don't have that high of a chance to reproduce with someone in Japan or India, right?
Size of population: there are many ways to define this, but it is best to define "size" as density = number/area so that we have a spatial scale reference. Say, there are coyotes in Vancouver city, but the total number of time you spot a coyote around Vancouver is not a very useful piece of information unless you can round up an area of Vancouver for your coyote count.
Change in density per unit time is defined as growth rate = number/area/time.
Growth, limitation, and regulation of populations
I) Models of population growth – Exponential versus Logistic When looking at either model, one must always remember that this is concerning a population
in isolation, with controlled habitat and resources (ideally, in a lab). Real growth models taken from field experiments normally don't look anything like either
theoretical models. That is because of inter-specific interaction and varying abiotic forces. Yet

if we take these interactions and abiotic changes into consideration, we can pick out portions of the theoretical models in a real growth model of one population. (vice versa, by comparing it to the portions found in the model of the other populations sharing the same community, we can induce the interactions btw these populations).
In real life, there is also mechanical growth—emigration and immigration—that further affect the growth model.
The only way to determine the kind of growth in a real model is, of course, through manipulation of the system. (experiment)
Don't worry; there will be a fig about real growth model later.
Figure 52.8 Exponential growth (fig528.jpg not scanned) Rate of change dN/dt = constant x N, the rate of growth of a population gets proportionally
higher as the population density increases. Exponential growth cannot be sustained forever; eventually, growth will come to a halt, and
population density normally crashes just as quickly as they grew. Exponential growth usually applies to bacteria in lab condition.
Figure 52.11 Population density changes over time (Picture1_39b.jpg) In most real life situations, resource limitation and social stress leads to the logistic growth
model.
The
population seems to be approaching a stable K, the max density for an organism in a certain environment.
The logistic growth model is also known as the sigmoidal growth model.
Population density become stable as N (N at equilibrium) = K.

The day ends.
Sept 25, 2002 – Population (continued)
Growth Models (continued) We construct the graphs of growth rate versus time and population density for the logistic
model, as the growth rate changes with time AND the instantaneous density. For today's lecture, think of this scenario. You are really rich, and you really like mice. You
build a really big house for mice; the size is big, but finite. You put in initially a great supply of food and water, but the supply is finite. You prepare the ground simulating natural mouse habitat with the best possible knowledge of biology, there is not any other species, but the mouse house will be left without further sanitary care. That is because you go to UBC to listen to Wayne's lectures, and you never have time to put in new supply or renovate your mouse house...
Picture 1_40 – growth vs. density When N K, population density become stable.
Initially,
conditions are best for growth, so why growth rate is so low? At N = K, when N is at its upper limit, why is growth rate so low (zero in fact)? Why does growth rate reaches its peak somewhere in the middle of the graph?
The growth equation, dN/dt = R x N ((K – N)/K) with R being the individual growth rate, is controlled by two factors, thus equals zero at either extremes, where one of them is zero.
The ideal condition is best for growth, but that means individual growth. Ideal can only be achieved in laboratory paradise, where no mortals defile the sacred purity of the medium, but if there is no initial population, no matter how high individual growth is, population growth rate (dN/dt) is zero.
At somewhere in the middle of the graph, individual growth rate is relatively high, and the number of individual is also relatively high, the population growth rate is max. (Ok, I know
my narrative is lame, but don't expect to prove this mathematically. The relation btw the variables here can only be determined by experiment)
Picture 1_41 – growth vs. time Now there is a disruption in the growth model, after the population reaches K, the density is
suddenly (artificially) doubled (think of you suddenly buy a truck load of mice and dump them all down the mouse house via a chute). We are trying to determine why growth rate drops to zero at K and the population stabilizes.
T1 and t2 is the points of time before and after the addition of mice, and are very close together.
After the drastic changes, several types of outcome could result. It all depends on sanitary (if an epidemic breaks out, destroying most mice), or competition and social stress (playing a stabilizing role), as mice
a) Compete for food, b)
eat/kill/trample weaker mice out of frustration.
An interesting outcome is when the resulting population changing as a sin curve wrapping around K. The population is not approaching K, but periodically going over and under K, coming closer and closer to equilibrium (K) with each subsequent period.
You can look at the situation from another angle, the growth versus density graph.
Picture 1_42 – growth vs. density stabilization This curve only models the situation of sinusoidal change.

Right at time t2 the
instantaneous growth rate is negative and very large.
We could see N going back and forth orbiting and getting closer to K
Growth rate is alternatively positive and negative—increasing and decreasing—to bring N to equilibrium.
In real life, however, the "epidemic" scenario is more likely, and a population that increased drastically tends to crash drastically too.
The day ends.
Sept 27, 2002 – Group project day
Question officially assigned to groups.
Oct 2, 2002 – Experimental Design Review.
Discussion topic: Biol 140 plug Biol 140 used to be available for all UBC
students and was highly recommended. However, it has recently been restricted to a certain group of science students just because of ERROR001: low in resource.
You may think it is good news. It isn't. Take Biol 140! It helps, no matter what
field you go to – a message by Wayne n' GeekStone Co. Ltd.
I) Elements of experimental design

The scientific method is not a rigid step-by-step process, although the figure in Chapter 1 of the textbook may give you such an impression.
1) Observation: recognizing patterns and formulating a hypothesis to explain the patterns.2) Responsible variables: change certain variables and see if the observation changes. Variable(s)
responsible for changes in a certain observation is the independent variable; the observation that is changed is the dependent variable. In order to see how the independent and dependent variables relate, we set different treatments (values) for different variables.
3) Control: a group that does not receive any treatment.4) Methodology: in experimental design, it is the technical aspect, things such as size of plot, size of
individual plant, size of sample, metering the amount of change in the variables... Two important aspects of methodology:
a. Replication: Sample size, how many plants to be tested, how many plots, etc. Such replication within an experiment is to ensure that a certain outcome was not caused by a chance event. The more samples to be tested, the less accident would occur.
b. Repetition: An experiment done in a certain area in a certain time may not necessarily reflect a true relationship between certain factors and others, as, for example, plants grow differently in spring and autumn. Extensive experiments in different settings help confirm a hypothesis.
5) Prediction: If a hypothesis is correct predicted outcome in manipulated plots AND control does not change. However, if control also changes, something else must have affected the plots.
a. Prediction can be a statement (above)b. Or a graphical model.
In this example, the predicted model is the inverse parabola; real observation are the "X"s
This kind of real data is close enough to be supportive of our prediction, but is of course inconclusive.
A hypothesis that survived extensive testing would be termed a theory.
II) Problems in experimental design Changes can be because of the mutual effects of many factors (Fig 54.9) The experimenter never know what factor(s) is (are) important in advance. Lab conditions may lack factors of field test. Think of how green house tomato, hold by
chains, could grow very high, while field tomato normally grows in vines on the ground. There is neither wind nor light competition in the lab; there is on the field, so growing high is impossible and fatal.
On the contrary, you cannot control all the variables in the field. If you spread powdered iron on an area of the Sargasso sea and monitor phytoplankton population, how do you know if a large part of that iron will not drift to a supposedly unmanipulated (control) plot by the currents, which effectively travel across the length of the oceans.
All methodology design involves assumptions. The purpose of methodology is to make sure that different sets of samples undergo the same conditions except for the variable(s) being controlled. We students of this course need not to concern too much on the details of methodology, but we must be able to address some issues qualitatively on the mid-term.
The day ends.
Oct 4, 2002 Population Ecology – population growth (continued)
II) Individual Growth Rate A population has its own growth rate, but a population is formed by a collection of
individuals, those individuals have their own growth rates, which depend only on their different physiology. This growth rate is also affected by the degree of "crowdedness" inside the population, the population density. In turn, the population density is affected by large scale ecological factors. Population density and individual growth rate both affects a population's growth (above, Picture 1_40).
Intrinsic growth rate: growth rate per capita, individual growth.
Individual growth is NOT exactly the healthiness of an individual, though very closely dependent on it. Rather intrinsic growth rate is the reproductive capability per individual.
o e.g. at Neq = K, 1 mature male and 1 mature female together produces on average 1 surviving and fertile male and female, who also breed, in their reproductive cycle. There is no net growth or decline, therefore dN/dt = 0.
Intrinsic and population growth rates are linked closely to each other Birth and death are individual events, but their rates govern the rate of population growth.
On the graph of R versus N, the intrinsic growth rate actually started at point 1, the maximum R is impossible to achieved, as just one mouse in the house would perturb the condition from ideal.
Another notable fact is that at ideal condition, individual growth rate is projected to be highest, but dN/dt is actually zero, because there isn't any initial population.
Intrinsic Growth Rate is defined as dN/dt x N-1. Its ideal value is termed Rmax and is theoretical. Actual intrinsic growth Ra always < Rmax.
Exponential Growth: dN/dt = RaN (Ra is species/condition specific)
Logistic Growth:dN/dt = RmaxN((K-N)/K)
III) Population Growth Regulation: Ra equals the difference between birth and death rate (per capita) of a population. (We could
see with the "mice couple" analogy in the above figure.)

Population is stabilized by either an increasing death rate or a decreasing birth rate with increasing population density.
About how Birth and Death rate regulate population density, this figure should be self explanatory. About the lousy coloring, don't blame me; blame MS Paint for not having an undo command for changing palettes (should've used Photoshop anyway).
Hey, as I took the time to draw this fig, it would be a shame if you did not get the point right because I didn't explain, so ok. If Birth rate increases (or Death rate decreases) with N, a population will either grow exponentially when it increases a bit over Neq or plummet to extinction when it drops a bit below Neq.
Both situations are DISASTROUS and usually do not happen. When Birth rate decreases (or Death rate increases) with N, a population will tend to RETURN to Neq if it increases or drops from Neq. The population is stabilized around an Neq value.
Definition: K – Carrying Capacity: "Maximum population size that a particular environment can support at a particular time with no degradation of the habitat." K is not fixed but depends on space, time, and resources.
Neq is NOT K – the equilibrium density is always lower than K.
Homework Question: WHY is Neq lower than K?
The day ends.
MIDTERM MATERIAL!
Neq

As of term 1 of the 2002 – 2003 academic year, when I took this course, the midterm will cover everything we've done so far.
Oct 6, 2002 Population regulation (continued) & Life History
III) Population regulation in the real world A note on looking at population curves: these curves do not tell the reason of death.
Population fluctuation is usually the result of multiple factors. The old theory of PR states that outside forces normally act to stabilize a population, but
observation in long-term field experiment seems to show the contrary, population density is usually anything but stable.
Many populations exhibit seemingly random fluctuations. Many other populations, however, exhibit a cyclic pattern in growth and decline.
Figure 52.19 Population cycles of snowshoe hares and lynx (Fig5219.jpg)The book already has very good coverage on this fig so read page 1167.A notable point in this and all similar figs:
Lynx reproduce periodically without anticipating a hare crash. In fact, when lynx population starts to skyrocket, the hare population has already stopped growing and started crashing.A population with slow reproductive cycle reacts slowly with a favorable change in its surroundings; when it starts to reproduce and grow, the good change may already be gone.A growth is often short and is always followed by a crash. There is no ideal exponential or logistic growth in nature.
Life History
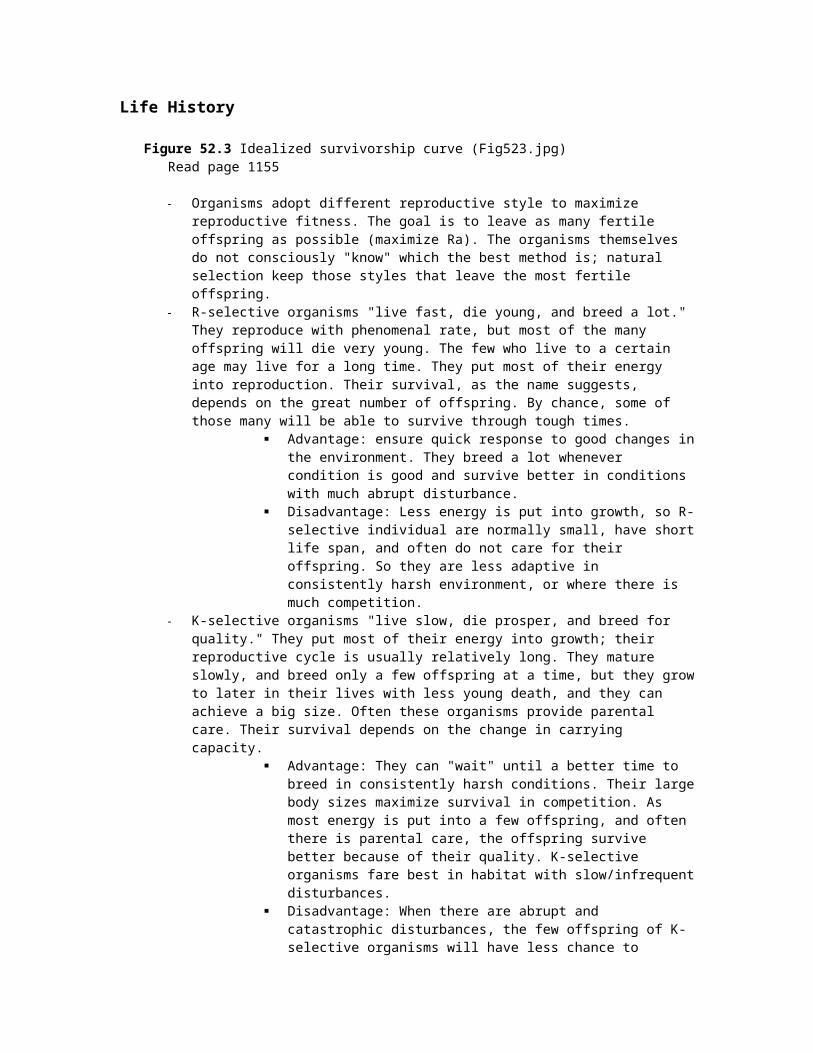
Figure 52.3 Idealized survivorship curve (Fig523.jpg)Read page 1155
Organisms adopt different reproductive style to maximize reproductive fitness. The goal is to leave as many fertile offspring as possible (maximize Ra). The organisms themselves do not consciously "know" which the best method is; natural selection keep those styles that leave the most fertile offspring.
R-selective organisms "live fast, die young, and breed a lot." They reproduce with phenomenal rate, but most of the many offspring will die very young. The few who live to a certain age may live for a long time. They put most of their energy into reproduction. Their survival, as the name suggests, depends on the great number of offspring. By chance, some of those many will be able to survive through tough times.
Advantage: ensure quick response to good changes in the environment. They breed a lot whenever condition is good and survive better in conditions with much abrupt disturbance.
Disadvantage: Less energy is put into growth, so R-selective individual are normally small, have short life span, and often do not care for their offspring. So they are less adaptive in consistently harsh environment, or where there is much competition.
K-selective organisms "live slow, die prosper, and breed for quality." They put most of their energy into growth; their reproductive cycle is usually relatively long. They mature slowly, and breed only a few offspring at a time, but they grow to later in their lives with less young death, and they can achieve a big size. Often these organisms provide parental care. Their survival depends on the change in carrying capacity.
Advantage: They can "wait" until a better time to breed in consistently harsh conditions. Their large body sizes maximize survival in competition.

As most energy is put into a few offspring, and often there is parental care, the offspring survive better because of their quality. K-selective organisms fare best in habitat with slow/infrequent disturbances.
Disadvantage: When there are abrupt and catastrophic disturbances, the few offspring of K-selective organisms will have less chance to survive to the next reproductive cycle. And they also react slower to favorable changes.
These reproductive styles co-evolved and inter-related in a sophisticated way. There is not an organism that is purely r or K-selective.
The day ends.
Oct 11, 2002 Population Regulation (continued)
I) Population Regulation in Human
Figure 52.20 Human Population Growth (Fig5220.jpg)Read page 1168
Homework Question: Why does human population only start to grow exponentially in the last 200 years, although human has been around for as long as at least 5-times the x-axis of Figure 52.20?
For a general idea, human has always been K-selective, before key events like the industrial revolution, the human species has little or no control over its habitat, which is always changing. The various disturbances (diseases, predators, the weather...) keep the population low. Since the advent of modern technology, the new social systems and healthcare advancement ensure a much more favorable and stable habitat for human growth, hence the bacteria-style log curve.
Figure 52.22 Age Structure (Fig5222.jpg)Read page 1170
Figure 52.21 Demographic Transition in Sweden and Mexico (Fig5221.jpg) Read page 1169 With time, countries starting with high birth and death rate will likely have low death rate, but
their birth rate will still be high compare to the death rate, (because of better healthcare, living standard...) Birth rate declines in a more variable manner than death rate.
Figure 52.23 Ecological Footprint (Fig5223.jpg) Read page 1171

A simple definition of EF is the total area required to support a person (includes resource, mining, food...)
Countries vary greatly in their EF, small countries have small ecological capacity, but some of those countries have relatively high EF. (Japan...)
II) Population Limiting Factors
Population Limiting Factors are density dependent, just like birth and death rate. (In fact, those factors create the trends in growth rate we examined before)
Survivorship decreases at high population density due mainly to social stress, assuming abundant food, water...
Fecundity decreases at high population density. For a given area, survivorship will come back to a constant value no matter what density a
population starts with.
Figure 52.14 Fecundity of Plaintain and song sparrow. (Fig5214.jpg) Read page 1164.
Figure 52.5 Cost of reproduction in female red deer (Fig525.jpg) Read page 1157. No matter how old a female is, more reproduction more mortality. Most female don't breed before age 4, 5; most male not before 8 or 9, and most also stop
breeding at 11. Why the males do not try to reproduce sooner (asking more precisely, why did natural
selection favor breeding late in male)? One possible explanation is that older males have more chance of reproducing with a female, and the young may be healthier.
The day ends.
Oct 14, 2002 Reproduction
Reproduction
Hiuck y' all, this are GeekStone presentin' ye host Wayne Goodey and today's
academic discussion topic SEX OR NO SEX!!!
YESS!Disadvantageous, sex it
is, I say

Seriously, sex is not really advantageous in inheritance, but Homework question: Why do many successful organisms use it?
Also seriously, I don't think this is a very good question (though Wayne asked it) for this chapter. We would study evolution later, and the answer to this question would only make sense once we understand natural selection to a certain depth. Say, to think of all those weird variations and forms that organisms have adopted (that do NOT seem beneficial at all in our human view), to think of geothermal blood worms and Venus flytraps, SEX is not that unexplainable at all.
Figure 23.15 The twofold disadvantage of sex (Fig2315.jpg) A 1/2 "dilution" effect of genes with each sexually reproduced generation: your son/daughter
is only 1/2. Remember, reproductive success means maximizing the number of your likeness in the population. With sex, your offspring become less genetically identical to you with time.
Sexual production involve finding mate, courting mate (in many species), and competing for mate (in many species, especially fierce in human :). In fact, sex costs a lot of your energy that could be put into asexual reproduction.
Actually, sex does have its advantage, it allows for much greater genetic variations than have ever been possible with mutation only. Even some unicellulars use a sex-like exchange of genetic information (e.g. recombination, transformation, syngamy...)
The day ends.
Oct 16, 2002 – Reproduction (continued)
III) Life history, again.
Definition: Allocation – the use of an individual's energy budget for growth or reproduction.Because energy, like money in the bank, is limited.A discussion of energy allocation between r-selective and K-selective organism can be
found above.
Figure 52.6 European kestrels, probability of survival after raising a modified brood. (Fig526.jpg) Normally, if we sample 100 breeder this year, about 60 would survive next year. If we add nestling (baby kestrels) to enlarge a brood, more energy is spent, more risk is
involved in flying out for food, survival is much lower in the next winter. A smaller brood energy is saved at the cost of fewer babies. Why female survive better with a larger brood?
Both female and male provide parental care, but during incubation, the female stays back and only the male looks for food, spending more energy and take more risk.
The female is bigger than the male. Male put more effort into a catch.
Usually, both male and female of any species don't put 100% energy into 1 breed. It seems stupid that an individual breeds one clutch and dies, but that's exactly what happen in some species, e.g. salmons, freshwater eels. Then what are the factors that lead to different reproduction styles?
Three questions to answer before having babies! When to start reproducing? (Wait 'til the bachelor degree or do it since high
school sophomore, your choice.) How often to breed? (Breed slowly or get an extra job and stay up 'til 3am,
your choice.) Clutch size? How many to breed in an episode? (Twin? Triplet? A million?)

All organisms try to maintain a balance between immediate energy investment in offspring (breed/care) and the potential to survive and breed in the future.
High survival, fewer offspring <> Balance <> Low survival, more offspringThe ultimate purpose for this balance, the only time-honored value in natural selection, is reproductive
success. All organisms try to leave as many fertile offspring as possible.
Life Cycles You don't need to remember the details in this section of the lecture.
I) Key attributes of life cycles: All life cycles are cyclic. There are optional pathways (in the main cyclic pathway) or totally different pathways to
complete a life cycle, e.g. endospore formation in Gm+ bacteria. Organisms choose different pathways depends on its surroundings.
Polymorphic – all organisms change the structure/behavior of their bodies in life cycles they change niche in different stages of their life cycles, interact differently to the ecosystem.
Alternation of generation – most life cycles involve an alternation between two body forms: diploid (2n) haploid (n) diploid...
II) Types of life cycles:
Figure 13.5 Life cycles differing in the timing of meiosis and fertilization (Fig135.jpg) Read page 238
Figure 28.13 Malaria-causing Plasmodium (Fig2813.jpg) Read page 557
The day ends.
Oct 18, 2002 Reproduction (continued)
Review of mitosis and meiosis Read page 235 – 243, study figure 13.5 (Fig135.jpg), 13.6 (Fig136.jpg), 13.9 (Fig139.jpg),
13.10 (Fig1310.jpg). You don't need to remember details, but you must understand how meiosis causes
independent assortment of the chromosomes, and how crossing-over creates genetic variation in offspring. Meiosis happens only in sexual reproduction.
Sexual Reproduction Genetic information is exchanged from one individual to another. Some bacteria that reproduce by fission (mitosis) also have mechanism for exchanging
genetic material, e.g. homologous recombination, transformation (gene acquisition), conjugation...
Only a small portion of all species reproduce sexually:
Conjugation and recombination is considered sexual

but there are no distinguishable male and female. Organisms that use these methods can also reproduce asexually.
Paramecium can undergo conjugation to exchange a plasmid, but eventually it reproduces by mitosis.
Definition: Syngamy: fusion of nuclei. -gamy: can be used to indicate chromosomes or whole nuclei.
Cytokinesis: splitting of the cytoplasm, not necessarily couples mitosis.
Mitosis: a nuclear division process. Mitosis often couples cytokinesis, but the two are not equal.
You will meet these terms in those chapter 13 figs.
Modes of sexual reproduction: Different species determine the sexes differently. Several models are shown in fig 15.8.
Figure 15.8 Some chromosomal system of sex determination (Fig158.jpg) Read page 276.
Definition: Homogametic sex: XX (the female in human)Heterogametic sex: XY (the male in human)
The heterogametic sex determines the sex of the offspring. King Henry VIII killed his wife because she couldn't bear for him a male heir; he was wrong. It was him who was responsible for their not having a boy.
Except for the haplo-diploid system (insect), in all other systems, where a sex chromosome is used, male and female have all the autosomes the same; only the sex chromosomes are different.
All of these systems lead to different gene dilution effects.
The day ends.
Oct 20, 2002 Reproduction – Life cycles (continued)
You don't need to know the details of these life cycles, but you have to read the book for a general understanding. You need to know where to apply the attributes of life cycles (above) and discuss the life history aspect of a given life cycle (which phase is K- or r-selective, and why?)
Organisms alternate between generations to cope with changing environmental conditions. Usually, one of the two phases (n or 2n) involves gathering energy for growth (K-selective),
the other for reproduction (r-selective). These figs show different examples of alternation of generation.
Figure 28.30 The life cycle of cellular slime mold (Fig2830.jpg) Read page 572. Dispersal, of spores or spore fragments, is extremely instrumental to R-selective species. This slime mold reproduces asexually when nutrients are scarce in the home habitat. Dispersal
is used to find places elsewhere with more nutrients; a lot of spore must be produced; this phase is r-selective.
When there are more nutrients, slime mold reproduces sexually. The benefit of sexual reproduction is not apparent like that of asexual reproduction.

Figure 28.21 The Life cycle of Laminaria (Fig2821.jpg) Read page 564. Sexual reproduction is only possible when conditions are right, since intertidal habitat is
harsh. The diploid multicellular stage, the body is large and produce by meiosis (sexual) The haploid stage is also multicellular, but only consists of small aggregation of cells.
Figure 29.16 The Life cycle of Polytrichum, a moss (Fig2916.jpg) Read page 586. Contrary to Fig 28.21, the haploid phase in this fig is big and lives long. The diploid phase is
a parasite on the haploid and only serves to produce spores.
Figure 30.13, 30.17 Structure of a Flower (Fig3013.jpg; Fig3017.jpg) Except for the yellow ovule, all cells shown in the fig are 2n. Dispersal phase is a seed (2n). The seed is much more K-selective compared to spore; it has protection and a food reservoir.
Figure 31.12 Mushroom, the dikaryon (Fig3112.jpg) Read page 625. This life cycle has 3 stages: haploid, diploid, and dikaryotic phase, where a cell has 2 haploid
nuclei but no syngamy occurs. In basidiomycete, the dikaryon, not haploid or diploid, grow to a large size, the mushroom.
Definition: Plasmogamy: cell walls fuse but nuclei don't.Karyogamy: 2 haploid nuclei in a dikaryon fuse into a diploid nucleus, which then
undergoes meiosis.
Now, the assistant-host GeekStone proudly present to you...... One big example of alternation of generation that you boys n' girls all know about... ... A male and his sperms...The main moral is that although you always think of human as K-selective, the sperms (n) are very r-
selective, millions of them are ejected, but only one survive (normally) and grow to a baby (2n). And although you may argue that eggs are much larger and, therefore, more k-selective than sperms, it is still unicellular and very r-selective compared to the adult female body.
Figure 13.4 The human life cycle (Fig134.jpg) Read page 238
The day ends.
Oct 22, 2002 – Genetics
Often you read notes to save time. But for the genetics portion of the course, I recommend the book, not the lecture notes, as the main source of information. The book covers the exact same theories as the lecture notes, but with much more details and illustrations. The content of the recommended chapters will be tested in detail, which you won't find enough in any lecture note. Therefore, the notes
for this section only contain relevant example problems or things not found in the book but are also core studies for this course (and will be tested)—namely, experimental design and the scientific method.
Genetics and Inheritance

I) History of genetics Read page 247, 248, 428—431, for background information, this material will not be
specifically tested. Mendel's and Morgan's experiments are two classic cases of experimental design that should
be studied carefully, especially the aspects of scale and choice of test subject.
Genetics is a new science, with ugly history. The science itself bears no guilt, but human have misused it many times for the purpose of controlling others. American slavery and Adolf Hitler's Nazism have one thing in common, the notion that one race of human is superior to another. Racial purification sometimes happened very close to home, in the form of euthanasia, immigration quotas, segregation, and forced "relocation" based on race. You could find all of those in Canadian history if you dig deeply enough. Of course we now know that any claims of racial superiority are bogus also thanks to genetics. In fact, genetic variations between different races are usually even smaller than that between individuals of the same races.
II) Mendel's experiment Before studying Mendel, it should be remembered that all observations are of morphology.
Chromosomes, Genes, and the genetic basis of mitosis, meiosis, and gene expression are still 80 years or so away. In order to appreciate the beauty of Mendel's experiment, you must pretend you don't know any of Biology 11, 12. You don't even know the word gene and chromosome. In fact, in this experiment you can just think of gene and chromosome as the same thing, and call it heritable factor.
Observation: Mendel saw that pea have either white or purple flowers. Sometimes when he crossed white
and purple, the results either contain a portion of white and purple, or all purple. Mendel thus decided to make reliable pure breed strands by cutting away the stamens to prevent self-fertilization, transferring pollen from white to purple-flwr trees, and then covered the flowers; after many generations, he obtained reliable purple and white-flwr trees that, when self-fertilize, always create purple n' white flwr.
(Why this happens is not known at that time. An assumption must be made that these trees are in fact pure-breed.)
Mendel cross the pure-breed purple and white flower trees the resulting offspring generation (from now on will be called F1 (Filial 1), the parent generation is called P) all have purple flower. It is simple to explain this with Biol 12 knowledge, but we are in the 19th century, so let's have a little 19th century biology background.
Most biology at the time consists of natural theology, which you can read more about in page 428-429.
Inheritance is nothing new at the time, people knows for ages that "like begets like," and puppy dogs always have one trait or another similar to their parents.
There is no unifying mechanism proposed for inheritance. The most popular theory at the time is the "blending" theory, which dictates
that traits are transferred quantitatively, purple plus white equals "slight purple."
Clearly, Mendel's cross shows anything but a blending of purple and white. Furthermore, it could be hypothesized that if blending occurs, the trait white and purple have
totally disappeared, only "slight purple" remains. With time, all pea plants would tend to have the same "slight purple" flower.
Mendel did a second cross between the F1 plants to determine if white has disappeared. White appears in the F2 generation, the above hypothesis is disproved evidence against
blending.

Observation: The ratio of the F2 pea plants are 1/4 white and 3/4 purple. Remember that we don't know
anything about dominance or independent assortment. There must be away to conserve traits.
To solve the conservation problem Mendel made an ingenious hypothesis: traits are transferred by units, not quantities.
Another hypothesis: when a plant contains two units of different traits (purple/white flwr), one trait will be dominant, and the plant will show the dominant (purple) trait.
Replication: Mendel experimented with very large sample size, as you could see from Figure 14.1,
hundreds, sometimes thousands of pea plants were observed and documented. It took him many years to form his theory.
Mendel repeated his experiments many times and with different traits (Fig 14.1), and he documented many other traits.
III) Independent assortment & Beyond Mendel Read chapter 14, 15, study every Figs.
Definition: Locus: the position on a chromosome occupied by a particular gene.Allele: different forms of a gene on a locus.Genotype: what genes are present (e.g. PP, Pp, pP, pp)Phenotype: observable manifestation of the genotype, can be either morphological, biochemical, or behavioral. (e.g. white flwr, purple flwr)
The law of independent assortment of chromosome (chapter 14) can be induced by doing crosses with multiple traits.
The above Mendelian experiment has these underlying assumptions: Each trait is controlled by one locus. Each locus has only two alleles. The loci assorted independently.We already knew from reading that only chromosome assorts independently, not loci. Mendel's assumed that "heritable factors" assorted independently, so we must assume that all of the loci Mendel studied lay on different chromosomes. It seems like pure luck that Mendel chose those seven traits that did assort independently. Had he chose two loci that were near each other on one chromosome, he would not have the evident to prove his theory, and inheritance as we now know it may not been discovered?
When performing a dihybrid (2 traits) or multihybrid cross, we must make assumptions based on these factors:
Are these loci close together? Are they on the same chromosome? Is there any locus on the sex chromosome?
o How many alleles are on each of those loci (complete or incomplete or co-dominance)?
o How many loci are controlling each of those traits?o How does each loci (if multiple loci) control the trait (is it polygeny or
epistasis or pleiotropy)?
Note: These are also the steps you would have to take to solve test problems, so study the workings of these assumptions closely and test different solutions when tackle a genetic/pedigree question. Parallel
to covering the official syllabus, the second main objective of this course is to teach the scientific method, a way of thinking.
The three lasts assumptions are the reason why the blending theory was brought up. Human skin color, for example, varies with degree because it is controlled by many loci. There is not a complete black or white skin (except for albino persons, those who had their pigment-coding genes shut off either by mutation or an epistatic gene).
Also, a black and a white person may have a child with "middle-range" skin color. Even though blending is now consider wrong and you may think of the people who believed in it as lame, but it must always be remembered that such a theory was made based on real observations, and at that time the entire field of genetics were still in the dark. Mendel's experiment was a triumph of the scientific method because it successfully disproved a hypothesis and offered another one that was in line with more real observations.
Note: Even though this course has a syllabus and no official "second main objective," Wayne is the one teaching the course and also the one making your exam, so I advise you familiarize yourself with the scientific method. And by the way, if you want to go further in science, it is crucial.
The day ends.
Oct 25, 2002 Genetics – Post Mendelian/problem solving (continued)
Today's lecture is only a briefer explanation of what already covered in chapter 14. Read chapter 14, study all Figs.
The day ends.
Oct 28, 2002 Genetics – Post Mendelian/problem solving (continued)
Today's lecture is a briefer explanation of independent assortment (in chapter 14), and linked gene (chapter 15).
Probabilistic approach to a sample crossing question
Figure 14.7 testing two hypotheses for segregation in a dihybrid cross. (Fig147.jpg) Cross true-breeding YYRR (yellow-round) and yyrr (green-wrinkled), the F1 generation must
be YyRr, cross the YyRr plants.
There are two hypotheses: Dependent assortment: the two loci are assorted together, YR and yr would
be inherited as 1 unit; the F2 plant will be of parent phenotype (yellow-round & green-wrinkled).
Independent assortment: the two loci are assorted independently, Y, R, r, and r are inherited as units, and all random combinations of two alleles can appear in the F2 plants: YY, Yy, yY, yy – RR, rr, rR, Rr.
Use probability to predict the phenotypic ratio in F2 plants:
Dependent assortment:
The probability for having a YR chromosome in the gamete is 1/2, same for a yr gamete.

Because of random mating, the probability of having, say, an YRyr zygote is 1/2 x 1/2 = 1/4
The probability of having an Y_R_ zygote is 1/4 + 1/4 + 1/4 = 3/4 3/4 F2 plant have Yellow-round phenotype.
Independent assortment:
Cross YyRr with YyRr
The probability of a Y or y gamete is 1/2, of a R or r gamete is also 1/2,
The probability of a YY, yY, Yy, yy zygote are all 1/4 the probability of a Y_ zygote is 3/4, a yy zygote is 1/4
" RR, rR, Rr, rr " 1/4 " a R_ zygote is 3/4, a rr zygote is 1/4
Because of independent assortment:The probability of an Y_R_ zygote = P (Y_) x P (R_) = 3/4 x 3/4 = 9/16
of an yyR_, or Y_rr zygote = 1/4 x 3/4 = 3/16 of an yyrr zygote = P(yy) x P(rr) = 1/4 x 1/4 = 1/16
A 9:3:3:1 phenotypic ratio, this ratio holds for every dihybrid cross with the same assumption as Mendel's experiment.
Note: this is also the method you should use in the test, crossing each trait (locus) independently and then calculate the probability for two traits. The Figure below will explain in detail how the above method is based on probability.

Now, let's cross AaBbCc with AaBbCc
For a trihybrid cross, the possible numbers of outcome are 2^6 = 64
The probability for AA, aA, Aa, aa... are all 1/4 Probability of an A_, B_, C_ gamete is 3/4, of an aa, bb, cc gamete is 1/4
Probability of: A_B_C_ Plant = 3/4 x 3/4 x 3/4 = 27/64A_B_cc Plant = 3/4 x 3/4 x 1/4 = 9/64A_bbcc Plant = 3/4 x 1/4 x 1/4 = 3/64aabbcc Plant = 1/4 x 1/4 x 1/4 = 1/64aaB_cc Plant = 3/64aaB_C_ Plant = 9/64A_bbC_ Plant = 9/64aabbC_ Plant = 3/64
Probability of all outcomes equals one 27 + 27 + 9 + 1 = 64
Linked Genes In the above dihybrid cross, had the two loci been on the same chromosome, and had they
been very close together, they would be inherited together and dependent assortment results. You should have read in the book that a portion of the offspring will not have parent phenotype because of recombination. For the test, you don't need to know the definition of recombination frequency, but you must understand that when two loci are very far apart in one chromosome, their frequency of recombination approaches 50%, and the two genes assort nearly independently.
Sex-linked Genes Read page 277 In the XY system (e.g. human), the X chromosome carries most sex-linked genes while the Y
chromosome is very degenerative and doesn't carry most of the sex-linked genes; sometimes sex-linked genes are also called X-linked genes.

Therefore, male offspring (XY) almost never receive any sex-linked trait from the father. A male with a recessive allele on his X chromosome will have the recessive phenotype, as the
Y chromosome does not contain any allele to be expressed (and dominate the recessive).
Definition: a Carrier: For a recessive trait, a heterozygous individual, carrying a dominant and a recessive allele
The day ends.
Oct 30, 2002 – Genetics – modes of inheritance
IV) Epistasis, Polygeny, Pleiotropy, incomplete dominance and co-dominance This lecture is a briefer explanation of the respective topics in chapter 14. So read it.
Note: For multiple alleles per locus, each individual still only have 2 alleles per locus, because there are only 2 homologous chromosomes. In a population, however, 3 or more alleles may be present. This is not true in some bacteria, which may have several loci—each carries 2 alleles—of the same gene in their genomes, but such exceptions are not tested.
homework question:
Note to Wayne: I'll do this question here, but if you think it's better not to give out the key in an online note, just delete this portion. I don't have the real key for this problem either so you have to look at it to see if I've covered all possible cases or not.
Grey is pure-breed, then cross pure grey with Yellow (P generation), the F1 offspring is 1:1 yellow and grey. Cross two P yellow mice; the offspring is 2:1 yellow and grey. Determine the genotype of the P yellow mice and the mode of inheritance.
Preliminary Assumption: There is no indication of sex-linking. There are only 2 distinct phenotypes, so neither polygeny nor incomplete dominance. Only 1 trait (fur color) is observed, so no need to concern about pleiotropy (even if there is).
1) Assume 1 locus controlling the trait and 2 alleles per locus: one Yellow, one Grey.
2) In the second cross, yellow-yellow white. The P yellow is not pure-breed, or epistasis is involved and the yellow is pure breed with
genotype YYGg, assuming Yellow is dominant and the dominant epistatic allele G allow yellow color, gg mice are grey.

3) If epistasis is involved, then the P grey mouse (pure) must have the phenotype yygg, when cross with an YYGg mouse will produce 1:1 YyGg (yellow) and Yygg (grey).
4) Cross 2 YYGg mice will create a 1:1:1:1 ratio of genotype: YYGG (yellow), YYGg (yellow), YYgG (yellow), and YYgg (grey).
5) If the assumption at 1 holds, then the genotype of the P yellow must be Yy, the second cross will also create a 1:1:1:1 genotype ratio: YY (yellow), yY (yellow), Yy (yellow), and yy (grey). The first cross with a yy mouse will also create a 1:1 genotype ratio Yy (Yellow) or yy (grey).
6) Either case 4 or 5 is consistent with the observation, but where is the 1 YYGG or YY mouse in F2?
7) Our preliminary assumptions may be wrong. There may be incomplete dominance. In fact, the easiest way to explain the missing homozygous dominant mice (in either case 4 or 5) is that a disease annihilates all of them; the only things that survive are carriers (incomplete dominant heterozygous) and pure-breed recessive.
The day ends.
Nov 1, 2002 – Genetics – modes of inheritance (continued)
Today's lecture is a continuation of the last lecture, so just read chapter 14.
How different mode of inheritance work? Read chapter 17 to have a basic understanding of how genes are express, you don't need to
remember the details. Epistasis: (Fig1411.jpg) The epistatic gene code for an enzyme that catalyses the synthesis of
a precursor molecule for a certain process (e.g. the synthesis of brown/black pigments in mice). If the epistatic gene is turned off, no enzyme is produced, the whole process is stopped. Epistasis: "stop from above;" it is similar to stopping someone watering plants by stepping on the hose.
Misc – Figure 14.11 supplement
2 1

Polygeny: Several loci are expressed at the same time, each contribute a "dose" of its protein into determining the phenotype.
Pleiotropy: The gene is a regulator gene that controls the rate of various other enzymatic genes.
Homework Question: You all know of the Human Genome Project. Recently scientists successfully decoded all of the human genome. They know all the A, T, C, and Gs of 3 persons. But you all know from chapter 17 that it would be much harder to determine how all those genes control our traits. It used to be believed that the human genome consists of about 100K genes. New info now says that there are only about 30K. Everybody rejoiced. Is this turn of event really good news? (There's no simple way to answer this question really, it's either good or bad; but basically use what you learn in chapter 14 and this lecture to answer.)
The day ends.
Nov 4, 2002 Genetics – mutations
Note: this part is very sketchy because I was writing during term 1 final exams; will be edited in the end.
V) Mutations
Chromosomal mutations: Read page 279-281 (chapter 15)
Point Mutations: Read page 323-325 (chapter 17)
Note: Point mutation is the ultimate source for genetic variation. Even though recombination and chromosomal mutations create large variations by changing the arrangements of genes, it is point mutation that create different versions of a gene, and eventually, different genes.
Learn all of these Figs
Figure 17.24 Categories and consequences of point mutations (Fig1724.jpg) Read page 323.
Figure 16.17 Nucleotide excision repair of DNA damage (Fig1617.jpg) Read page 299.
Figure 15.11 Meiotic nondisjunction (Fig1511.jpg) Read page 279.
Figure 14.15 Pleiotropic Effects of the sickle-cell allele in a homozygote (Fig1415.jpg) Read page 262-263.
Figure 23.10 Mapping malaria and the sickle-cell allele (Fig2310.jpg) Read page 456 (must read Figure 14.15 first to understand) Heterozygous advantage are one of the reason that recessive alleles, especially that of a
potentially lethal trait like sickle-cell, have perpetuated through evolution and are sometimes present with unusually high frequency in a population.
Note: be careful not to confuse frequency-dependent selection (of a phenotype in a population) and density-dependent population control. They are totally different things and must not be confused in the test.

Figure 17.23 A point mutation causes sickle-cell anemia (Fig17.23.jpg) Read page 322.
Figure 19.7 Gene Expression Control in Eukaryotic Cells (Fig197.jpg) Read page 362-364 for your information, don't memorize for the test. Read chapter 16, this is for test.
Figure 1.8 Feedback Regulation (Fig18.jpg) Read page 8-9. This concept is rampant in biology courses of any shapes and sizes, so I recommend you
understand it thoroughly.
Note: remember that chapter 1 is in the test.
VI) Molecular application: Gene Therapy
1) Overview of Gene Therapy:
Figure 20.1 How bacterial plasmids are used to clone gene, an overview (Fig201.jpg) Read page 376-377
Figure 20.16 One type of gene therapy procedure (Fig2016.jpg)
2) The Risks of Gene Therapy: Read page 394
Why gene therapy has not worked that well as predicted? Wayne gave us this analogy to better understand such a risk: You have this nice car running
on gasoline, one day you want a natural gas-powered car because you want to feel good saving the earth and it's the trend anyway. So you pop open the hood of the car, take out the engine and after a while, made it into a natural-gas motor, you put it back into the car, but the car does not go anywhere. You wonder why things do not work even though you are a technical genius (supposedly) and the motor was done right. Why? Simply because everything else in the car is still designed for a gasoline system and not one running on natural gas. Say, the fuel injection system works with gasoline, but not natural gas, so no fuel is pumped into the engine.
Gene expression is a system of interactions and may not work if modified
separately. How can the activity of the transferred gene be controlled so that cells make
appropriate amounts of product at the right time and place. Is the insertion of therapeutic genes affecting other cell functions? Should we remove unwanted alleles? Will these alleles become beneficial
or even crucial later on in human evolution, when the conditions change?
The day ends.
Nov 6, 2002 – Genetics – Sample problems (continued)
These "problem" lectures technically do not belong anywhere, so I don't number the headlines.
Pedigree Analysis:

More sample problems for you to crunch.
Find everyone's genotype for the disease traitAssumptions: Only 1 trait is involved no pleiotropy, 2 distinct phenotypes (affected/unaffected) very unlikely involve polygeny or epistasis, Sex-linkage may be involved.
1) So there's one locus, assuming two alleles for this locus, the pedigree suggests that normal is dominant – N.
2) If Affected was dominant – A, then both P1 parents must be homozygous recessive aa, then their F1 offspring couldn't be affected.
3) The F1 offspring of P1 have an affected (nn) individual, thus both parent must have an n allele in order to give an n gamete. P1 genotype, so both of them are Nn.
4) Then all normal the F1 offspring are N_, but the female who marries the son of the P2 couple must be a carrier (Nn), because their F2 offspring have an affected individual. That F1 son must also be carrier to contribute his n gamete.
5) Of the F2 offspring, the affected male is nn, the two unaffected females are N_. Either of the P2 parents must be Aa (there must be at least 1 A and 1 a allele in P2).
6) Is our assumptions correct? Had there been sex-linkage, case 2 still holds, so the disease trait must still be recessive. So the P1 male must have NY genotype (as the N allele is on the sex chromosome, and Y usually does not contain x-linked genes). He cannot contribute an n gamete. The female can contribute at most 1 n gamete, so there couldn't be an affected individual in the F1 offspring there is no sex-linkage.
So here is the key.
-----------Probability
of 3 affected child: 1/4 x 1/4 x 1/4 = 1/64
of at least 1 affected
child: (1/4 x 3/4 x 3/4) x 3 + (1/4 x 1/4 x 3/4) x 3 + 1/64 = 9/64 x 4 + 1/64 = 37/64 of at least 1 normal child: (3/4 x 1/4 x 1/4) x 3 + (3/4 x 3/4 x 1/4) x 3 + (3/4 x 3/4 x 3/4) =
63/64Note: the easy way if you had already familiar with probability is 1 – 1/64 = 63/64.
P1 P2
F1
F2

VII) Population genetics
1) The Hardy-Weinberg Equilibrium Read page 447-449; remember the assumptions clearly.Definition: the Hardy-Weinberg Equilibrium states that allele frequency does not change from generation to generation in non-evolving population.
Shuffling a deck of cards repeatedly does not produce more Aces than Jacks. A non-evolving population is one satisfying these five assumptions: Very large population size: In a population of finite size, especially if that size is
small, genetic drift, the chance fluctuation of the gene pool, will cause change in gene frequency.
No migration: Gene flow, the transfer of alleles between populations due to the movement of individuals or gametes, can increase the frequency of any genotype that is in high frequency among the immigrants.
No mutation: By changing one allele into another, mutations change the gene pool. Random mating: If individuals pick mates with certain genotypes, then the random
mixing of gametes required for H-W equilibrium does not occur. No natural selection: Differential survival and reproductive success of genotypes will
alter their frequencies and may cause a detectable deviation from frequencies predicted by H-W equilibrium
The equation (p+ q) 2 = 1 only holds when all the assumptions are met. Phenotype and allele frequency is not the same. If you know the frequency of alleles, you can determine what a population looks like
phenotypically by using probability.
Figure 23.3 The Hardy-Weinberg Equilibrium (Fig233.jpg)
Note: o If you are interested, the H-W equation is nothing more than probability: the sum of
all possible outcomes is 1, the reason for the notion p2, q2, and pq is the multiplication rule—the probability of, say, one p and one q gamete.
o Remember, equation (p + q)2 only works for only 2 allele (p/q)o Equilibrium of more than 2 alleles is NOT tested, but if you are interested, you can
prove the equation the same way (e.g. p2 + q2 + r2 + pq + qr + pr = 1)
2) Evolution breaks the H-W EquilibriumIn a population only a representative sample breeds.
For what good is the Hardy-Weinberg theorem? It predicts what the gene pool would be like if all the assumptions are met, but its benefit comes in because in reality, those assumptions are NEVER met. By measuring changes to the gene pool over time, we can determine how different deviations from the H-W assumptions affect the gene pool.
A population at H-W equilibrium is not involved, because it is assumed that mating is random and the population size is very large, so literally everyone has the same chance to breed.
In reality, only a representative sample breed, passing on certain allele to the next generation.
Definition: Evolution is a generation-to-generation change in a population's frequencies of alleles. In its smallest scale (allele freq), it is termed microevolution.
Two main causes of evolution: Genetic drift: Change in allele frequency due to chance. Read page 450, 451
Figure 23.4 Genetic drift (Fig234.jpg)

E.g. A fire kills of 90% of all snakes in a forest. Logically, the allele with the highest frequency will be in more snakes, and will have a better chance of surviving, but as this is a chance occurrence, the allele remained might be the more ill-adapted one. Also, an ill-adapted (harmful) but recessive allele has the ability to be perpetuated through evolution in the form of carriers, people who bear the recessive genes but exhibit the dominant phenotype. The recessive gene may survive a catastrophic event and establish itself after that.
Figure 23.5 Bottleneck effect (Fig235.jpg)
Natural Selection: Change in allele frequency because certain biotic or abiotic factor(s) favor (or not favor) certain phenotypic traits. Certain traits are eliminated with time either by the factor(s) itself or are overwhelmed by environmentally-favored traits in competitions. We will come back to this later.
Figure 23.13 Directional selection in Galapagos finch (Fig2313.jpg) Read page 458-460 Plants that make bigger seeds typically grow better in dry weather (maybe because bigger
seeds resist desiccation better) plant is directionally selected by weather. Finch with bigger beak have advantage when there are a lot of big seeds Finch beak size is
directionally selected by seed size. In dry years, finches do not grow bigger beaks, but statistically, the ratio of bigger beak
increases because finches with smaller beaks die out or are competed with for space. After a bottleneck, the genotype with higher probability density has the higher chance of surviving.
Figure 23.12 Other types of selections (Fig2312.jpg) Read page 456. Directional selection Diversifying selection Stabilizing selection
The day ends.
Nov 8th, 2002 – Genetics (continued)
I) Genetics of populations: Read chapter 23 to finish.
II) Sample problems This problem is already covered in the above lecture.
The day ends.
Nov 13, 2002 – Evolution – Patterns
Finally, we have reached the last topic of this course: Evolution. There are three things about evolution we must learn – the Patterns, Processes, and Applications. Similar to the last topic, the best studying approach is to read the book as your main source of information, the note as your source for special points not covered in the book, concept traps that students usually fall into, and sample problems. As you could see, our time in Biol 121 is drawing quickly to an end, and Evolution is a very long topic. Brace yourself.
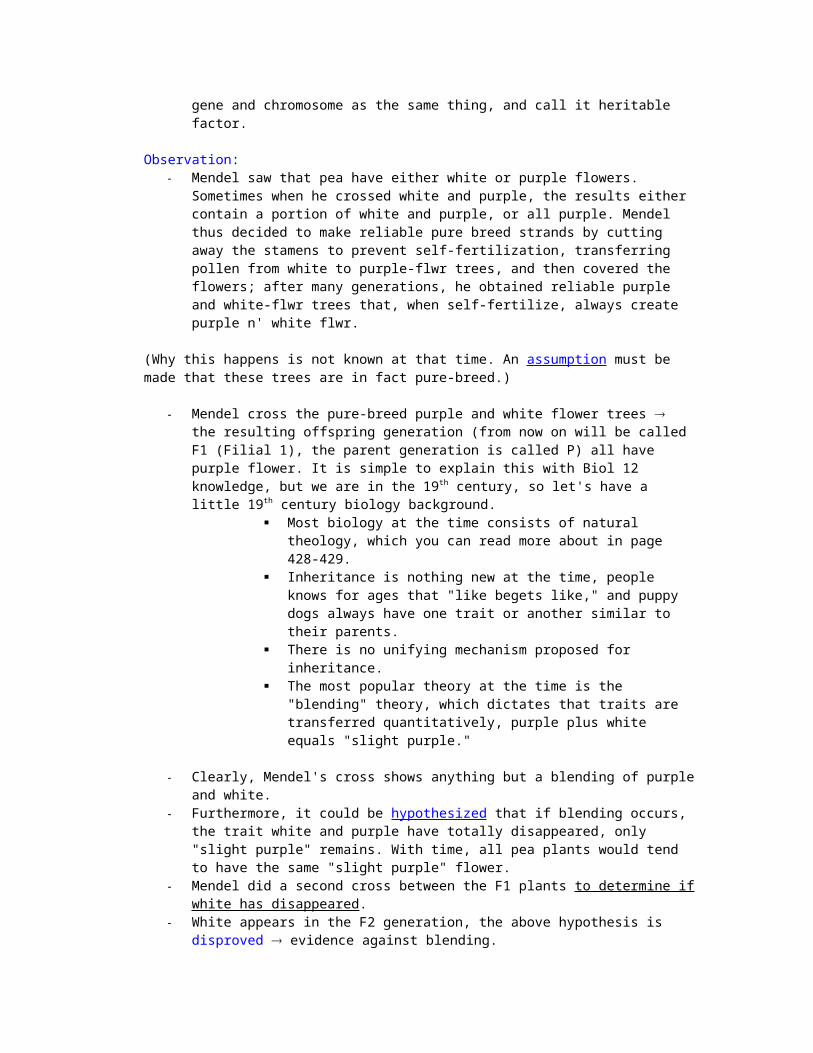
I) Patterns of Evolution:
Definition (again): Evolution change in gene frequency. Convergence: Species from different evolutionary branches come to resemble one
another if they have similar ecological roles (as natural selection favors similar features). Read page 440, 495-496 Divergence: speciation from a common ancestor. (Note to Wayne: I'm unsure if this short definition is enough), Read page 468-475 Adaptive Radiation: species migrate to occupy new habitats and niches, usually after the habitats are free from competition after a mass extinction.
1) Evolution due to geographic change
Figure 25.3 Continental Drift (fig253.jpg)
The continents are not fixed but drift about Earth's surface like passengers on great plate of crust floating on the hot, underlying mantle.
Continental drift is a major geographic factor correlated to the spatial distribution of life and evolutionary episodes of mass extinctions and explosive increase in biodiversity
250 million years ago, the continents all joined into a big landmass called Pangaea Once isolated species now come together, compete, and co-evolved; a great many went
extinct. The ocean basin expanded; sea level went down; a major portion of coastal habitat
destroyed. Large spans of land with less shore lines promotes harsher, drier, and more erratic inland
climate. Heavy extinctions reshaped biodiversity, but in a way create tremendous opportunities for
those taxonomic groups that lived through. 180 million years ago, the Mesozoic era, the continent starts to break up
Geographic separation on a colossal scale took place; each continent became a separate evolutionary arena.
Continental drift actually explained some difficult evolution questions, such as why similar fossils of the same time periods are found in areas separated by oceans, say, Brazil and West Africa.
Below: Nothofagus, or the "Southern Beech," is native to South America, but fossils and other species are found far away including the Antarctic, and Australia/New Zealand/New Guinea, strong evidence that these landmasses used to join at the coast line. The separate evolution (and convergence) of marsupial mammal in Australia and
eutherian mammal elsewhere might be due to this continental separation.
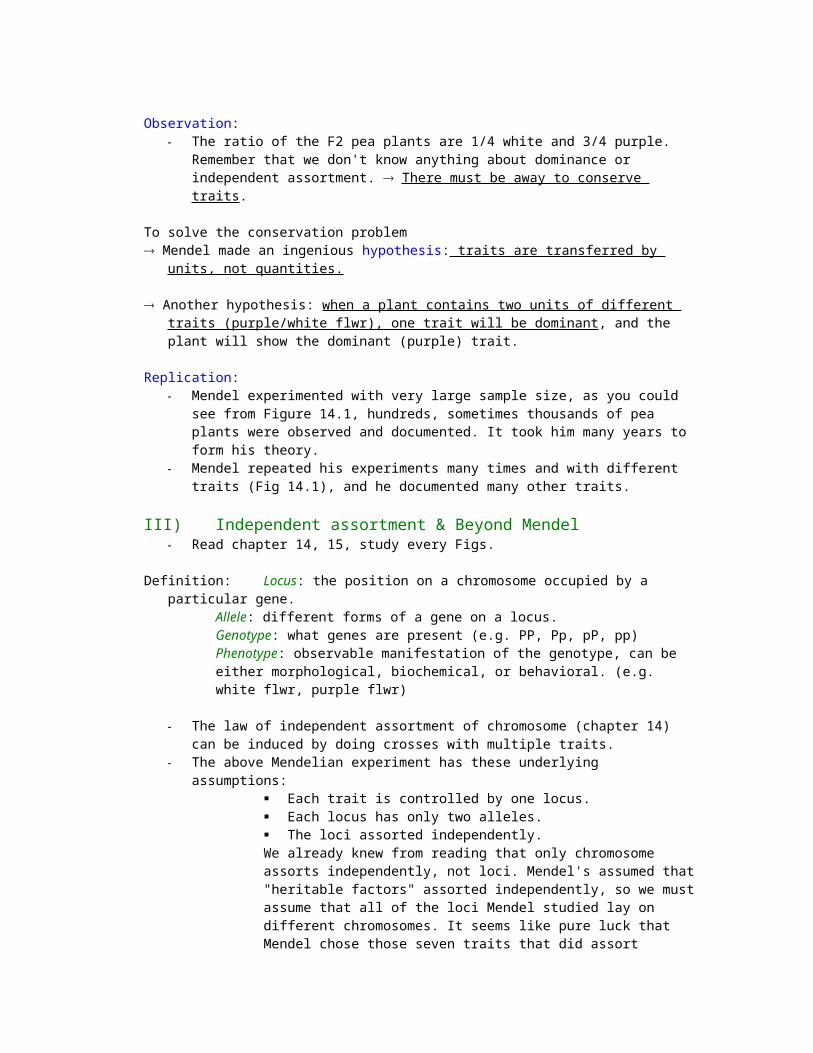
Figure 22.3 Sedimentary rocks and fossil deposit (fig223.jpg) Fossil records
are very powerful tools in tracing evolutionary history.
Fossil remains are the only mean of tracing (old) evolutionary patterns associate with geographic change, such as above.
Fossil records indicate the relative abundance of species (and groups) as fossils of abundant species existed for a long time is more likely to be found.
River brings sediment to the ocean, adding on older sediment layer-
by-layer, thus fossil records often indicate the relative time-line of a species. Fossil records, though powerful, are never complete and may be inaccurate.
A major portion of the biodiversity at a point in time was never preserved as fossil. An organism must die at the right time and place for the environmental condition to favor
fossilization. The fossil can then be destroyed by erosion, volcanic/seismic activities, or pressure from
superimposed strata. If not destroyed, the fossil must be exposed by erosion in order to be discoverable. Finally, it takes chances for someone to actually find it.
Figure 26.1 Phylogenetic tree (fig261.jpg) Read page 492-496; 511-515, it's more detailed than I can ever summarize here. An interesting point to note: the evolution of diverse and complex life forms is a strong
support for the theory that the Earth is really old.
Questions o' the day: Why is the Precambrian era really long?A possible reason is because in this era, the mechanisms for evolutions are pretty limited, so it
takes an awfully long time to produce enough change to justify a new era. Why so? Before the oldest animal fossils, the only living things are bacteria. Even before that, the only mechanism for biological evolution is random chemical chain reactions (pp. 511, 512). When complicated biomolecules and
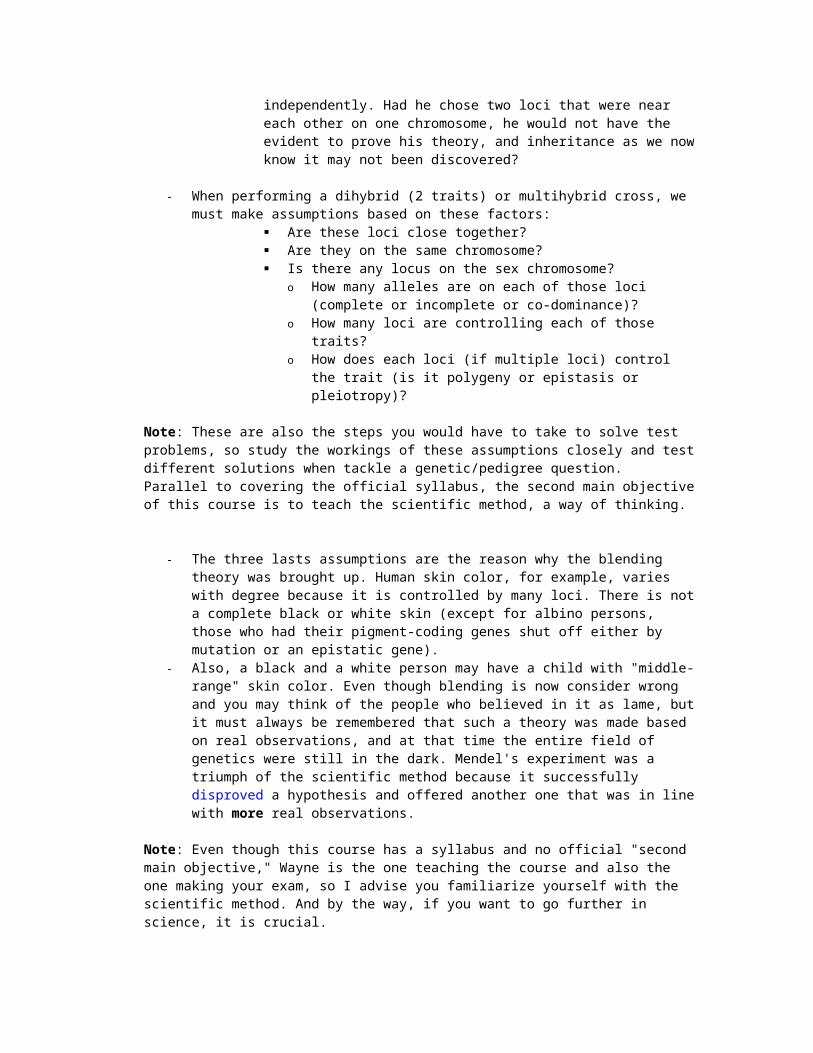
structures have been created, evolution sped up but still slow because the only mean for bacteria to evolve is through genetic mutations, which more often than not detrimental, not beneficial, to survival. However, endosymbiosis now might also account for evolution (e.g. evolution of eukaryotes). Only when genetic recombination is available have the rate of evolution skyrocketed. (it also seems that the appearance of an oxygen-rich atmosphere is a prerequisite for more complex/multicellular biostructures, and that takes really long)
Figure 26.2 Evolutionary history (fig262.jpg) → same as fig261
2) Homology and Analogy
Figure 34.32 Similar animals may not be related (fig3432.jpg) These marsupial and eutherian (placental) mammals, though look alike, have evolved
separately to have similar features. These similarities arise from convergent evolution because these mammals might have
experienced similar environmental conditions that favor certain similar traits. Analogy is similarities that arise from convergent evolution and not from a genetic basis. Homology is the similarities that arise from a common ancestor. However, homology and analogy are very relative terms; any two analogous organisms are
homologous to some degree. For example, it is hypothesized that the evolution of marsupial began first in North
America; they reached Australia through South America by migration, and finally start to evolve separately from the Mesozoic era when the continent separate. The mammals on the rest of the world evolved separately into eutherian mammals.
**I change the flow of the note a bit, putting here the Modes of Speciation Diagram which won't be talked about until near the end of the course (3 lectures before the final). I think it's more understandable to fit this under Patterns of Evolution.
3) Modes of Speciation: (misc22.jpg)
Allopatric speciation: A population forms a new species while geographically isolated from its parent population. Gene flow is interrupted between the two populations. Also the different location place different natural selective pressures on the two populations; and the two evolve separately until they no longer can interbreed even with the geographic barrier removed.
Parapatric speciation: A more extreme form of allopatric speciation, in which only a small portion is isolated from the original population. It is much more likely that genetic drift and natural selection will cause significant changes in the gene pool for small populations. It must be remembered that this form of speciation do not happen easily, for more often than not a small pioneer
population will go extinct rather than speciate.

One hypothesis for the evolution of reproductive barrier between two populations evolving in different condition is pleiotropy. One gene may affect both behavior and reproduction (pre- or postzygotic barrier) at the same time.
Sympatric speciation: Speciation without the need of the geographic barrier. It requires the emergence of some type of reproductive barrier that isolates the gene pool of a subset from the parent population. In plant, the best understood mechanism of sympatric speciation is hybridization of closely-related species and/or errors during cell division that lead to polyploidy.
Peripatric speciation: sympatric speciation resulting from a subset of the population becoming reproductively isolated because of a switch of habitat, food source, or other resources not used by the parent population ( e.g. fig-eating wasps), or the emergence of a rigid mating preference of females for males having a certain trait (form) (e.g. Figure 24.16 Cichlid population in Lake Victoria (optional)) (Note to Wayne: I'm not really sure of this term because it was not in the book)
Faulty meiosis→ unreduced 2ngametes.
Self-fertilize
Polyploidy: this material may be tested in detail. Autopolyploidy: faulty meiosis creating unreduced 2n gametes that could self-fertilize (with
each other in self-pollination), creating a tetraploid with 4 sets of chromosomes, these plants can mate with each other because as long as the number of chromosome sets are even, harmful effects to the offspring don't often occur. However, they can't mate with the parent plants because the 3n offspring would be sterile as unpaired chromosomes leads to abnormal meiosis. A postzygotic barrier is set up.
Allopolyploidy: cross breeding between two different species creating offspring with abnormal number of chromosome sets, who cannot mate due to faulty meiosis, but by chance, these cross-breed offspring may be more vigorous and viable than the parent species, thus propagate themselves by vegetative growth (most plants can grow to a full scale individual from just a severed part).
4) Does natural selection favor speciation? Most likely no, the occasion for change in gene frequency between two populations from the
same origin are most often chance occurrences. The reproductive barriers are set up only as a side-effect of evolution in different ecological roles. When the two populations are brought together, it is not that natural selection favor the persistence of such barriers, but there is no advantage for either population not to have the barrier.
However, it is also true that some closely-related species still can interbreed, and if the interbreeding provides a better survival advantage, the alleles for (partial) reproductive barriers would eventually be removed.
Figure 24.9 Break in the gene flow (fig249.jpg corrupted, rescan in page 470, Biology 6th Edition) This is an example of a ring species, the situation where gradual geographic zonation of
closely related populations on their various stage of divergence from a common ancestor. This is allopatric speciation in progress.
In this figure, the salamanders only interbreed in a limited area around the boundaries of the habitats of different populations. Genetic differences accumulate slowly around the ring until the populations in the southern-most areas of the ring do not hybridize even though their ranges overlapped. These two populations, the large-blotched and the Monterey salamander can be considered two different species.
Tetraploid (4n)
self-fertilize or mate with other 4n.
Postzygotic barrier established. Speciation completed.

5) The divergent tendency of evolution
Figure 34.41 Two hypotheses to the modern human (fig3441.jpg) The multiregional hypothesis, though advocated by racial supremacist and, especially, the
Nazi, is more likely bogus from an evolutionary point-of-view. The simple reason is that with 4 human population evolving separately in different locations, occupying different niches, the chance is very slim for the 4 population to evolve into very genetically similar human populations that can interbreed.
In fact, genetic differences in member of different ethnic origin are usually smaller than the variations of individuals of the same "race."
Natural selection does have a tendency to diverge; and separation and extinction is more likely than many separate lines of evolution coming to the same point.
Figure 24.24 The branched evolution of horses (fig2424.jpg) This figure is constructed from fossil evidence of surviving and extinct species of horse. As we could see, the majority of the branches were cut off almost in a random fashion. If we draw a line tracing the evolution pathway to the modern horse, we create an illusion that
evolution tend toward larger-size and adaptations for grazing, but we miss the point that this branch of modern horse is only a surviving twig of a bush with many divergent trends.
Great phenotypic change can occur in short evolutionary processes, as the change of even one allele can lead to the change in one phenotypic trait
(misc19.jpg)
Does evolution has a goal? Most likely no, as we could see from the horse diagram, the particular pathway that led to the
modern horse was favored among a great many branches of divergence. Evolution most favors the traits that are most beneficial to reproductive success for the time being, enhancing the frequency of that trait's allele(s) in the next generations. As environmental (and social for some species) conditions changes, this favorable criteria changes also.
Human, though graceful in form and mind (I do love the human form and mind and see it as some of the most beautiful thing nature's created), is merely the result of adaptive evolution that has allowed him/her to escape from predators and hunt more prey, becoming the keystone species on the planet.
Question of the day: Do you think that human will continue to evolve? Will any speciation occur? Or has the human population stop evolving? If so, why?

The day ends.
Nov 15, 2002 – Evolution – Patterns – Homology vs. Analogy (continued)
Here are some example of analogy create superficial similarities between far-related organisms, while homologous, closer-related organisms, may seem very different in morphology
**The three pictures above are supplemental explanation that I put in for Wayne's diagram.**Notice how the barnacle, though look more akin to the clam, actually contains features closer to a
lobster, its mantle is segmented longitudinally (notice the red arrow at the tergum); and the six biramous appendages near the mouthpart (blue arrow) is homologous to the arthropod's legs.
(misc18, 29, 30, 31.jpg)

Analogy: similarity arose in structures sharing the same function.Homology: similarity arose in structures sharing the same origin.
Both Homology and Analogy are relative terms, every species are homologous to some extend. Two structures can be both homologous and analogous.
Bat and Bird wing serve the same function and arise from a common ancestor → both homo and analogous
Bat wing and human arm, though sharing the same ancestor, do not serve the same function, so isn't analogous
The diversity of life and periods of mass extinction
Figure 25.5 Periods of mass extinction (fig255.jpg) Note that this figure is constructed from fossil data, so only vertebrate or those mollusks that
left shells behind can leave fossils. From the number and diversity of fossil found, the relative biodiversity of a period can be determined. So this fig may be quite incorrect.
The Permian extinction is the biggest, with 95% of all species wiped out, after that diversity blooms as the surviving species occupied the freed territory and resources, assuming new niches and divergently evolved.
Extinctions are generally very random, but there seems to be a pattern, after a long period of diversity and growth, eventually resources and territory would become scarce, competition more fierce; or abiotic condition would trigger mass extinctions.
Note: the reason for the extinction rate in the Precambrian period to be even higher than the peek of the Permian extinction is because at that time, there are not that many species.
Figure 24.24 The branched evolution of horses (fig2424.jpg) Already covered in last lecture, (belongs to both the speciation (microevolution) and this large
scale topic.)
**A case of analogy vs. homology – Genetic differences between several bird species

Question o' the day: Is the stork closer to the ibis or the vulture? Explain your answer in term of homology and analogy.
Note to the graphic editor: Like a figure below, this fig should be silhouetted out until a mouse click; the silhouetted
part is the key.
The day ends.
Nov 18, 2002 Evolutionary Pattern (continued from Nov 13)
Discussion topic: A little talk about scienceBefore going through this lecture, Wayne talked about something interesting. Is science objective? Is a theory in science an absolutely sincere attempt to emulate life to the greatest degree of truth? Unfortunately, NO. Let's consider this case of scientific fallacy.
Figure 47.1 An early theory about the sperm's structure (fig471.jpg)

Preformation theory: a fully formed baby inside a cell-sized structure; and the egg, about a hundred times bigger, only serves as a shell and a food source for the embryo to grow. Obviously, this model appeals to the male chauvinist pigs among us, I don't mean anyone in this class or outside, but believe me, this used to be the standard of a time. Despite the rampant evidence of kids bearing resemblance to mom, this bogus hypothesis still stand for a while. WHY? Because the bias of the people that create science. Science, do not provide any hard fact, it is a collection of things that people want to believe in and try to prove.
How this is related to our courses? Wayne said that biology is not a bunch of fact that you remember like when you prepared for the provincial exam, feel free to dive into the concept, use them to explain other concept. That is why we learn by the figures and not a systematic list of fact like a traditional biology course.
II) Embryology Observing the different stages of an embryo in various animals shows similarities that indicate
patterns of evolution; also, it is a strong evidence that all species are related to a common ancestor at some point.
Guess which is the human/fish/shark/amphibian embryo.
Note to the graphic editor: I intended to present this fig in the same way that Wayne presented it but didn't have enough time, it's actually a full fig and 2 silhouettes; please makes the silhouettes 1, 2 disappear with a mouse click to reveal the fig and reappear in full at the third click.
Why did the same feature persist in very morphologically different species for vast period of evolutionary time? Because there wasn't a whole lot of pressure of natural selection inside the mother's uterus, so there is no special survival advantage for any kinds of genetic variation. Because genetic variations happen few and far between, the frequency for these

mutant alleles are very small, or might disappear after some generations.→ embryonic features are very conservative across species.
Mechanisms of Evolution
Historical context:
2000 years ago, Plato and Aristotle tried to explain the evolution of life. Plato believed in two worlds, a real world that is ideal and eternal and an illusory world of imperfection that we perceive through our senses. Evolution therefore would be counterproductive or unnecessary. Aristotle proposes a scale of nature where creatures in order of complexity occupy; evolution does not happen here. Up to Darwin's time, the Christian ideology fortified the belief in Creation, and biology of the time was dominated by natural theology, a philosophy that tied biology with discovering the Creator's plan for all living beings. Linnaeus built on this idea by inventing taxonomy, the science of categorizing all living creatures into a system of increasingly general groups.
Yet Linnaeus created taxonomy with Creationism in mind, his purpose was to document God's creations, not explaining them... By that time, the data and evidence for evolution were already quite available, but no unifying theory had been proposed that would explain all of those phenomena.
And God said "Let Darwin be!" and all are put in gears...
Figure 22.5 The voyage of the HMS Beagle (fig225.jpg) Read page 432.
Among Darwin's observations, these are the most important. Why are there related but diverse species in areas separated by long stretch of sea, e.g. the
Galapagos Islands and their mainland? Why are the organisms so different in different climates, terrains; Darwin was impressed by
the immense biological/cultural diversity of the regions he had been to. Darwin also saw that organisms never grow exponentially, limited resource means that only
certain individual survive over time. Those who died off are those who are ill-adapted to the environment. Organisms in a population vary, and some of the variations are inherited.
Figure 22.12 Insecticide resistance survival (fig22.12) With each wave of pesticide, some of the bugs with genes that help resist the pesticide
survive. These bugs may not have arisen after the pesticide spray, but the allele might have been in the population before. These alleles may also decrease survivalship in normal

circumstances, but in the pressure put down by human, this allele become dominant, and the next generation of bugs will contain more immune individuals. Variations and continued pressure will "fine tune" the resistant allele through many generations because the less immune ones are outclassed by the more immune variations. Repeated use of different type of pesticide to "fix" the problem will eventually create a more serious problem of multi-resistant bugs.
→ Extinction by natural selection is the main mechanism creating biodiversity.
Figure 21.14 Diversity of hoofed mammals over revolutionary time (fig2114.jpg) The two orders are different in their digestive system. Perissodactyl has simple digestive
systems while Artiodactyl has complex digestive systems. As the food source changes, probably with climate change, we observe the succession of the
dominant order (in term of diversity). Natural selection favors not any particular direction of evolution, but only the trait that is
adaptable with the situation at a point of time.
Figure 3.9 Vestigial structures in whale, the pelvic girdle (fig39.jpg) Just like the embryonic feature, the pelvic girdle in whales has not been selected-out, even
though it is not needed at all in marine life, because it doesn't present any significant disadvantage in survivalship, there is no pressure to select out this structure.
This vestigial (trace) structure is a strong evidence that whale is related to land mammals. As science work by disproving, this is also a strong evidence for the Darwinian view of
evolution.The persistence of the pelvic girdle support the counter hypothesis that "If there is no natural
selection (and extinction of the ill-adapted variants), a structure will not evolve."
The day ends.
Nov 20 2002 – Mechanisms of evolution – natural selection (continued)
Today's discussion topic: a truly faithful translation of the phrase "survival of the fittest"
There's no absolute "fittest" trait, it only means the best adapted for reproductive success at a certain time.
Survival is measured in reproductive success, how well your set of alleles perpetuate from generation to generation.
If you are as strong as Hercules, as smart as Einstein, and as rich as Bill Gate, but you are sterile, you are still toast according to Darwin.
Speciation:
I) Modes of speciation; this topic technically belongs here, but I covered it in Patterns to clarify the flow of the figures. (go to bookmark)
II) Figure 24.5 Reproductive barriers between different species (fig245.jpg) Read page 466, 467 for full explanation of each barrier, this material may be examinable in
detail.Prezygotic barrier: before the fertilization of gametes to form the zygote
Habitat isolation: populations live in different habitats and do not meet. Behavioral isolation: little or no sexual attraction between male and female.
of a set of genotype, not individual
only for one point of time (at the present)

Temporal isolation: mating or flowering happens at different season or time in different species.
Mechanical isolation: structural difference in the genitalia or flowers prevents proper copulation (intercourse/insemination) or pollination.
Gametic isolation: female and male gametes fail to attract each other or are unviable.Postzygotic barrier: after fertilization
Reduced hybrid viability: hybrids zygote often fails to develop or fail to reach sexual maturity.
Reduced hybrid fertility: hybrids often can't produce functional gametes. Hybrid breakdown: hybrids are often sterile or hybrid crosses with other hybrids or parent
species have reduced fertility or viability.
Definition: Chimaeras: defined as an organism with cells from different species. Although individually, those cells are genetically different.
These organisms are not considered in our discussion of speciation (because they cannot be considered under the normal basis of genetic difference).
Species definition: When defining a species, we often refer to the morphological characteristics, but in nature, so many species are very closely related and are so similar that it would be impractical to keep a descriptive system of definition. The functional definition of a species is in term of reproduction. Two populations are of different species when they cannot interbreed and produce viable hybrids even when sharing the same location and/or similar niches. The different ethnicities of humankind, though very diverse in appearance, but behind those superficial differences, we belong to the same species of Homo sapiens, defined by the ability to interbreed.
Other mechanisms of evolution Beside the main mechanism of natural selection,
Genetic drift: go to bookmarkGroup selection: in brief, traits that are good for survival of a group (non-kin only, not to be confused with kin-selection, where members of a group share a large part of their genotype) is preserved through natural selection because they confer a survival advantage so great for a group that it override the tendency toward individual selfishness, even though such traits may be somewhat detrimental to individual fitness.
The day ends.
Nov 22, 2002 – Mechanisms of evolution (continued)
More history:At Darwin's time, the dominant theory of evolution was "transformism" or Lamarckian Selection.
Lamarck was a creationist, and he reasoned that after Creation, there must have been much change. Lamarck and Darwin both reason on an inherent force in an organism for changes. But Lamarck believed that whatever improved in an adult would be passed on to the offspring. In other words, character acquired by adults is passed to the offspring. You now see well enough that you don't automatically get your mom's bachelor degree and such unless you study for it yourself. But still, transformism explains very well the evolution of culture. We are learning in this 1 term course the knowledge that took nigh a hundred years to construct.
Historical constraint is another main factor affecting evolution
Come back to Figure 3.9 Vestigial structure in whale A question that needs answering is even though whale has no use for the pelvic girdle as the
back leg had been selected out in time to reduce drag. Why didn't the girdle go away? We know that because there is no reason not to have the pelvic girdle. So that trace of a distant

ancestor does not disappear. Evolution is always subjected to the limits of the past; there will never be a true perfect organism.
If a trait is not outright favor or oppressed by living condition, it stays the same.
A question: we all know that all mammals had their ancestors living in water. Some mammals actually came back to the water, but why these mammals do not redevelop gills?
Historical constraint also represents a force of change; it means that it's very hard to turn back evolution.
It's easy to make a mutation or a change in the order of genes due to recombination. But a trait in the past can't be recreate because it takes many million years of changes to create that trait, so it's not probable for such an orderly reverse changes to occur.
Adaptation also adds to the irreversibility of evolution → because a structure had been used for a different function, even if orderly reverse mutation had occurred (suppose that...), a whale that has gills again will not breathe for long but will freeze to death as they are warm blooded.
The origin of life – **this topic still belongs under Mechanisms, but is a bigger-picture view Read page 516-521, you don't need to know this in detail for the final.
Figure 26.9 Pasteur's experiment (fig269.jpg) Read page 517.
Figure 26.10 The Miller-Urey experiment (fig2610.jpg) Read page 518.
The origin of biodiversityDefinition: Parsimony (the Occam's razor): is the method of constructing cladograms (phylogenetic
trees) in which the simplest pathway is chosen whenever there are several alternative explanations for a certain evolutionary pattern.However, parsimony fails to explain those patterns that involve analogy of non-homologous structures, where two far-related branch on the cladogram experience the same selective pressure, and separately evolved similar structures which are not genetically related.
Figure 25.16 Parsimony and the analogy-versus homology pitfall (fig2516.jpg)
The simpler explanation for four-chambered heart in mammal and bird is that they share the same common ancestor, and further evolution changes the structure of the aortic arch of the bird's or mammal's heart so that they are different. The more complex explanation, with more assumption and less probability of occurrence, is that four-chambered heart evolved separately in bird and mammal from a common ancestor with two-chambered heart.
The second explanation is the one most supported by research evidence.
Figure 12.20 Comparing the hearts of birds and mammals (fig1220.jpg)

Supplement for figure 12.20 (misc23) The analogous circulatory system of birds and mammalsWe could se that the heart of bird is closer to that of reptile, not mammal. Notice (the blue arrows)
how the left subclavian artery of bird are very close to that of reptile, and the only difference in the heart's structure is the existence of 2 aortic trunks. The systemic arch in mammals, not only is to the left (while bird's is to the right), but is also much different structurally, the systemic arch is now not one of three main branches from the aortic trunk, but it is the one main branch from the aortic trunk, the carotid and subclavian arteries are sub-branches from the arch.
The day ends.
Nov 25, 2002 Origin of life (continued)
And today's discussion topic: Is selfishness good or bad? Answer in terms of natural selection.The answer; selfishness is good, very good. Selfishness works when it comes to preserving your genotype to the next generation. How successful you are in life is not measured by how much you are respected, how much you contributed to the world. It all comes down to how reproductively successful you are.Cheating, stealing for money, lead a promiscuous private life (for offspring), and kill other people (eliminating competition) are all good practice under these criteria.

**Of course we believe in good faith that none of us in this class do those things, but then another question came up. Does human culture, created by human consciousness, violate the law of nature? Does human ethic conflict with human instinct? Or is there a natural selection reason that favors ethical, selfless behavior? (That is also the question o' the day)
Taxonomy/Cladistics – categorizing life based on common ancestors
I) Categorization based on metabolic diversity
Figure 27.13 Some major groups of prokaryotes (fig2713.jpg) Read description in page 536. This is only an illustration for this section. You don't need to remember the detail characteristics of each group for this course (it's for
Biol 112).
Figure 28.6 The three domains of life are related, traditional hypothesis (fig286.jpg)Figure 28.7 The above figure, alternative hypothesis (fig287.jpg)
Both hypotheses agreed upon the evolution of mitochondria (animal) and plastids (plant) in eukaryote by the
endosymbiosis of cyanobacteria in fermenting heterotrophic cells. In the alternate hypothesis the relationship that led to the mitochondria and plastids is more
complex, many stages (secondary/tertiary) of endosymbiosis can occurs, in which, several cells live as endosymbiont inside a big eukaryotic cell.
Also, there is more exchange of traits in the three domains than traditionally thought. So bacterial diversity also contribute to increasing archaea and eukaryotic diversity.

Figure 28.5 Secondary endosymbiosis, illustrated (fig285.jpg)
The origin of algal diversity: The plastid having several layers of membrane originate from a heterotroph engulfing
(forming symbiosis) with a cyanobacterium; this primary endosymbiosis is in turned engulfed by another heterotroph, forming secondary endosymbiosis.
Even tertiary endosymbiosis may also occur. After being inside Alga ABC for many generations the original primary endosymbiotic alga
AB lost most of its structures except the plastid, simply because the plastids now contribute to the overall fitness of alga ABC while the nucleus and other features of AB no longer serves reproductive purpose but present physiological problems or at least consume more resources, so the variants that lack these AB traces thrives.
Occasionally, in certain algae, traces of the nucleus of the ancient independent primary endosymbiont are still visible. These traces, similar to the vestigial pelvic girdle in whales, were not pressured by natural selection.
Figure 28.8 Tentative phylogeny of eukaryote (fig288.jpg) It was thought traditionally that Diplomonadida, Parabasala, Euglenozoa, and Alveolata
belong to the same group; same for Stramenopila/Rhodophyta, and Mycetozoa/Fungi. It was found later that biodiversity was much more complicate than once thought.
It's a good idea to end this topic by reminding that the nature of Biol 121 as a course is to teach not a load of factual details but a way of thinking, the skill to apply concept to explain biology phenomena on the big picture.
Biodiversity – Lost and Replacement
Extinction patterns
(misc10.jpg)The landmark event at 245 million years
ago was the Permian mass extinction, the largest mass extinction ever occurred. As could be seen on the figure, there is a replacement of the abundant (dominant) type of hard-shelled marine organisms. (I don't use the word groups here because bivalves belong to the phylum Mollusca and Brachiopoda is a phylum unto itself).
We may never know for sure the mechanism by which this succession took place, but judging from the abruptness of the replacement, the reason must be one of change in the environment, food type for example.
Natural selection favors brachiopods before the Permian extinction but changes to favor bivalves almost right after the Permian extinction.
Why is there a replacement?

Adaptive radiation: after a mass extinction, resources and territory are abundant and open for the surviving organism to migrate, move in and assume new ecological roles. The new environments and niches will force different natural selective pressure on organisms, leading to a bloom of diversification. However...Genetic drift: go to bookmark; ...during the extinction, by chance, those survival member of the brachiopods may not be well-adapted to the open opportunities to come (the better adapted may not be adapted during the extinction period and all died off), thus becoming less diverse or stays at the same diversity as right after the extinction.
Adaptive radiation happens not only after a mass extinction but also when species move in to occupied new territories. That was what happened for the finches on the different islands of Galapagos.
As discussed above, there is a limit to adaptive radiation, the faster diversity blooms after a mass extinction or the availability of new resources, the faster it will stop, and biodiversity seems to follow a bloom/crash pattern just like population growth.
(misc12.jpg) – an interesting figure.Why did dinosaur go extinct 65 million
years ago? A hypothesis says that it was because of a change in food type and the emergence of new insect parasites. The key event was the bloom in diversity in flowering plants, with harder woods reducing digestive efficiency of herbivorous dinosaurs (primary consumers) and the appearance of more new types of insects following the flower plants. This argument has a large flaw; as insects diversify very quickly, it would take much less than 55 million years (from 120 million years ago) for insects to diversify and become abundant enough to pressure the dinosaur to extinction.
Human and extinction – also belongs to the Application/conservation issue topicWe only discuss this topic very briefly. The main point: Recently, human has disrupted this pattern by movement of species, destruction of natural habitats, and overexploitation; accelerating the extinction. Human movement of species: read page 1229-1230 Habitat destruction: read page 1228 Overexploitation: read page 1231-1232
The day ends.
End of the Evolutionary Biology section

Nov 27, 2002 Behavioral biology
**Today is the last day of class.
Discussion: Course recapTopics already covered: Ecology: communities, population growth, niches, life-history, energy, nutrients, and
organisms' interactions. Reproduction: biodiversity of life cycles, competition and cooperation, reproductive fitness,
genetic variations: mutations and crossovers. Genetics: Mendel's experiment, post-Mendelian genetics and molecular applications,
population genetics: equilibrium, change in allele frequency. Evolution: patterns of biodiversity in space and time, mechanisms of evolution: natural
selection, microevolution (gene-frequency, speciation, and extinction on population level), macroevolution (adaptive radiation & mass extinction). Biogeography and conservation (brief coverage)
Animal behavior:Definition: behavior means much
more than the dictionary definition suggests. It can refer to plant or animal, bacteria, and all other forms of life. It can be either visible muscular expressions, growth, or biochemical change. Complex behavior occurs both in adult and infant stage of life, though the earlier behavior are mostly unnoticeable physiological responses. Behavior is in many ways similar to an organism's niche, so most of the material covered here is very similar to what we have learned so far.
Behavior has a genetic basis Especially in non-human species, evolutionary theory can be applied very well to explain
behavior. An organism has physiological, morphological, and behavioral traits grafted in their genotype.
All of those traits are subjected to genetic variation: mutation, recombination, genetic drift, and natural selection.
The behavior most beneficial for survival and reproduction at a point of time is favored by natural selection.
As a population moves to different territories and assumes different niches, behavioral traits changes with morphological and physiological traits by natural selection.
Behavior – Nature or Nurture? Given that behavioral guidelines, at least to some degree, are developed the genome by
natural selection; the tantalizing question of Nature or Nurture still remains. Obviously, the grizzly above, who is trying to climb into the car in search for food, didn't behave out of its

genetic programming, as evolutionary changes happens slowly, there's no way for bears to evolve a reaction with cars in a few generations.
For example: we will try to explain why I suddenly feel an urge to beat you with a stick (real example)
The question has two levels: Individual (proximate) question: Interaction → what
happened to me today that made me mad? Physiology → what's
going wrong in my body (biochemical) that made me mad? Experience → was I raised
in violence? Was I taught to hit people?> Interaction and physiology are two aspects of the
individual question that involve no conscious thoughts and judgments. They are called mechanical question. I passively reacted to the environment by the changes in my body.
> Experience involves conscious thoughts and judgments. This is called a learning or developmental question. When a kid, did everybody encourage me when I started hitting them with a stick? Learning by encouragement is also called conditioning, in which a behavior not inherited genetically but is encouraged (among other members (adults) of a species) that it is adopted by every growing individual.
Ultimate (evolutionary) question: Historical constraint → look back in the history of Homo sapiens, why did we always try to invent
better and better way of killing each other? Is there a genetic basis to violent behavior that simply limits our capacity for peace?
> For a species as a whole, a behavior question is a question of history spanning its own evolutionary timeline.
> The ultimate question is basically how a behavior increase Darwinian fitness, as only those alleles that promote reproductive success will perpetuate themselves through increased frequency in the population. However, this functional (reproductive) definition assumes the ultimately genetic basis of all behavior.
We end this example by a remark about the scientific process. Scientific questions must always be stratified because real situation are often too complex to analyze from one point-of-view. It is often the case that a proximate question is asked in the present, and the answer found for that question is used to induce the ultimate question's answer.
An example of learning influencing an innate behavior: Velvet monkeys give alarm calls when eagles threaten the pack; that behavior is
developmentally fixed, so infant monkeys also give calls, but they do so often indiscriminately when seeing almost any birds.
They improve with age, though; at adulthood, these monkeys only give alarm for two specific species of eagle.
The mechanism by which infants learn how to give the right call probably includes experiencing the behavior of other members of the group. For instance, if the infant gives a false alarm, the adults are silent; but if it gives a right alarm, another member of the group will almost immediately give another call, and the whole pack will response. The social confirmation helps it to learn when to make the right call.
The same thing happens as human babies perfecting his/her smile (innate behavior) when mom and other adults smiles back.

An example of purely innate behavior: Read from page 1123 – 1128 about the fixed action pattern. Birds seem to practice to fly by flapping their wings when they were young. But in an
experiment, infant birds were raised in contraption that restrict any wing movement, the wings are released when their normal kin starts flying, and the restrained birds fly right away without any training.
We can thus attribute the development of flying ability to innate neuromuscular maturation.
Imprinting – learning and innate behavior interaction: Read page 1129, 1130. Imprinting: learning that is specific to a time period. Nobel Prize winner Konrad Lorenz has shown in his studies that instinctively, chicks follow
the first object they see and consider it (or him/her) their mother. This mother-offspring bonding is critical to the survival of the chicks and reproductive fitness of the parents. It establishes care between parent and chicks, and also determines the features in individuals that the chicks will seek to mate with.
But learning is involved in a sense, because the chicks do not have an absolute sense of "who" or "what" is their mother. They choose the first object, whether it is Konrad Lorenz, you, or your alarm clock.
→ Both factors, genotype and habitat (learning), contributes to determining behavior. Learning helps perfecting behavior, but ultimately, all behaviors have a deep basis in natural selection and improving Darwinian fitness.
Biodiversity and the range of animal behavior Skim the entire chapter 51.
The year ends, good luck on your finals; you will need plenty of it.
APPENDIX A: GLOSSARY
Go to bookmark.
APPENDIX B: COURSE READING LIST
Go to bookmark.
APPENDIX C: FIGURE LIST
Go to bookmark.
Acknowledgement I want to thank instructor Wayne Goodey for being a great teacher, and for giving me his teaching material for use and reference, Artemis and the editors for their graphical redesign, and Dr. David Ng. of the Advanced Molecular Biology Laboratory for coordinating TLEF Outreach. Also Celia D., my classmate, provided me with some of her notes for comparison.
References
Note: please remove the notes in the final version; they are only to facilitate the editor.
Campbell, N.A. and Reece, J.B. 2002. Biology, Sixth Edition. Benjamin/Cummings Publishing Company, Inc.

Note: required textbook for this course.
Department of Marine Resource, April 29, 2003. A teacher's guide to marine life of the gulf of Maine. http://www.state.me.us./dmr/rm/aquarium/teachers_guide/sample_pages_of_teachers_guide.htm Note: file misc31.jpg.
Monahan, F. May. 1, 2003. ANAK, a cartoon. http://www.franktoons.com/ Note: the cavegeek host was edited from caveman characters from Frank's Monahan cartoon.
Petri, Robert, Petri, May 1, 2003. Ocean Driven, a ThinkQuest Challenge 1999 entry. http://library.thinkquest.org/26153/marine/arthro.htm Note: file misc29.jpg, misc30.jpg.
Reece, J.B. and Mitchell, L.G. 1999. Biology, Fifth Edition, Benjamin/Cummings Publishing Company, Inc. Note: some extra figures not in 6th edition.
Yellowstone Bear World, May 3, 2003. Bear World wildlife photo gallery. www.yellowstonebearworld.com/ Note: file misc32.jpg.


![Unofficial reading version of the admission and approval regulations for ... - TU … · 2017-06-20 · Unofficial reading version in consideration of: ... October 2014 (AMBl [Gazette]](https://img.pdfslide.us/doc/110x75/5f76f68f89072717737c27c9/unofficial-reading-version-of-the-admission-and-approval-regulations-for-tu.jpg)