Embed Size (px)
Citation preview

BIOL 4240Field Ecology

How many?
“Estimates of abundance themselves are not valuable, and a large book filled with estimates of the abundance of every species on earth as of January 1, 1998 would be a good conversation piece but not science”. Krebs 1999 p17
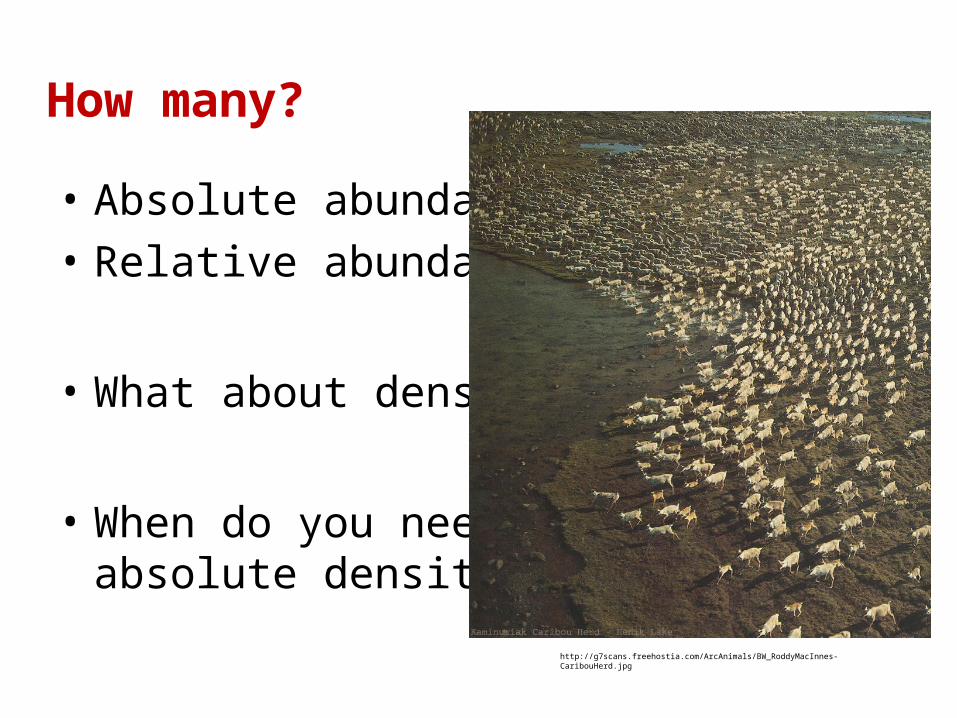
• Absolute abundance• Relative abundance
• What about density?
• When do you need absolute density?
How many?
http://g7scans.freehostia.com/ArcAnimals/BW_RoddyMacInnes-CaribouHerd.jpg
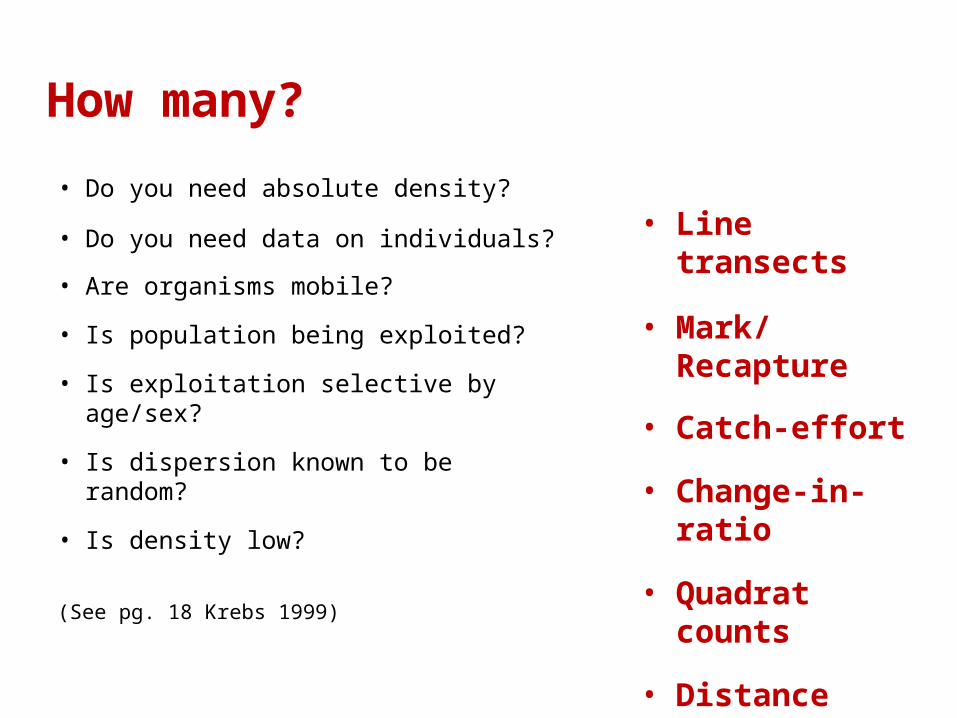
• Do you need absolute density?
• Do you need data on individuals?
• Are organisms mobile?
• Is population being exploited?
• Is exploitation selective by age/sex?
• Is dispersion known to be random?
• Is density low?
(See pg. 18 Krebs 1999)
How many?
• Line transects
• Mark/Recapture
• Catch-effort
• Change-in-ratio
• Quadrat counts
• Distance methods
How many?
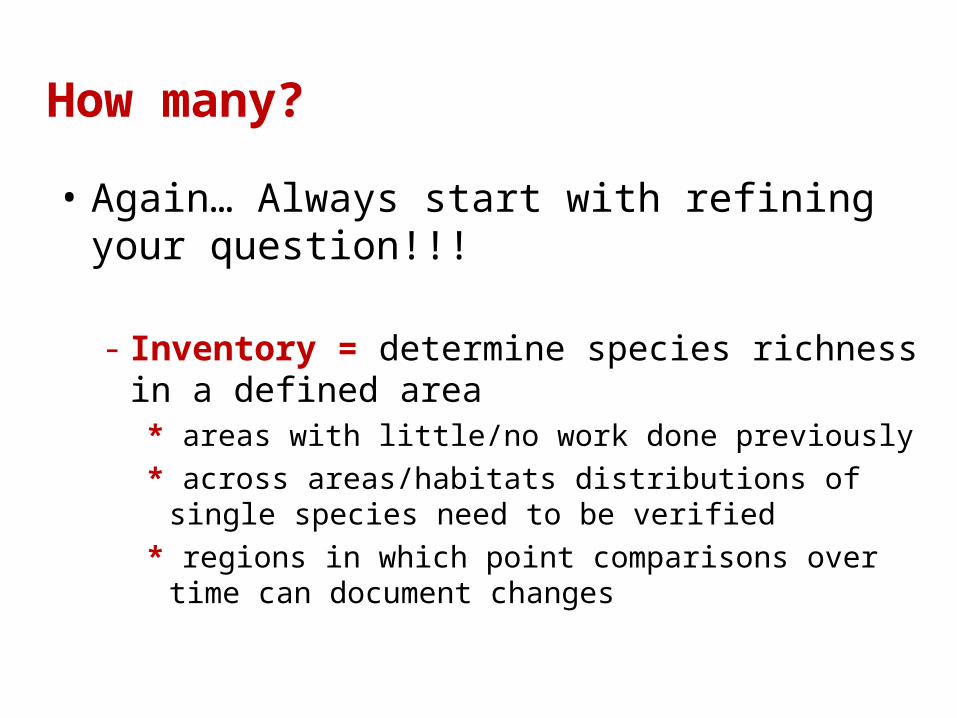
• Again… Always start with refining your question!!!
- Inventory = determine species richness in a defined area
* areas with little/no work done previously* across areas/habitats distributions of single species need
to be verified* regions in which point comparisons over time can
document changes
How many?
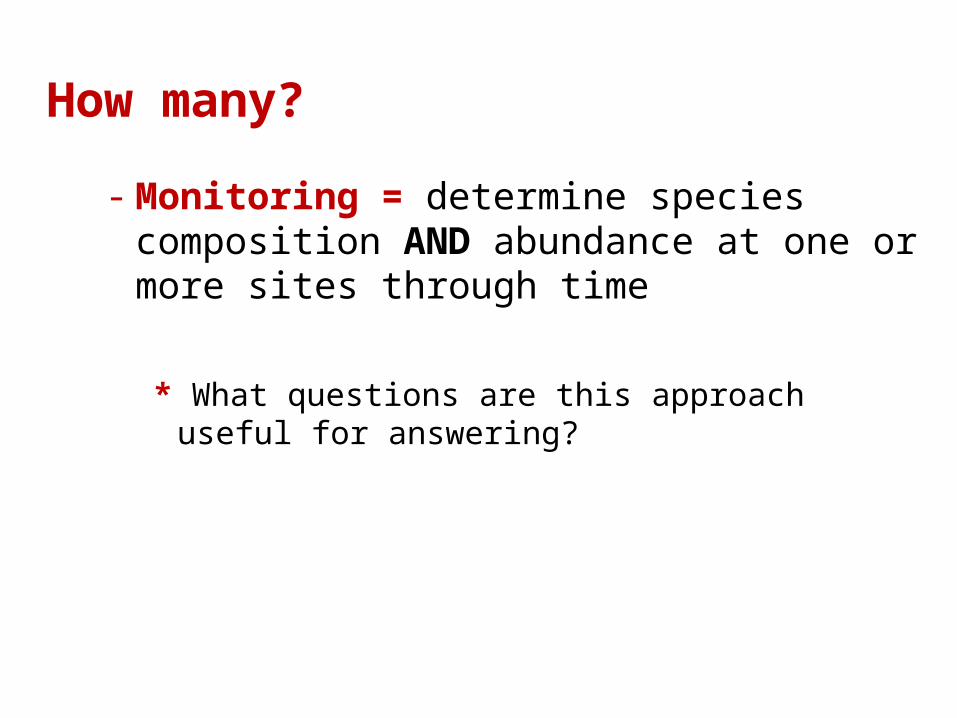
- Monitoring = determine species composition AND abundance at one or more sites through time
* What questions are this approach useful for answering?
How many?
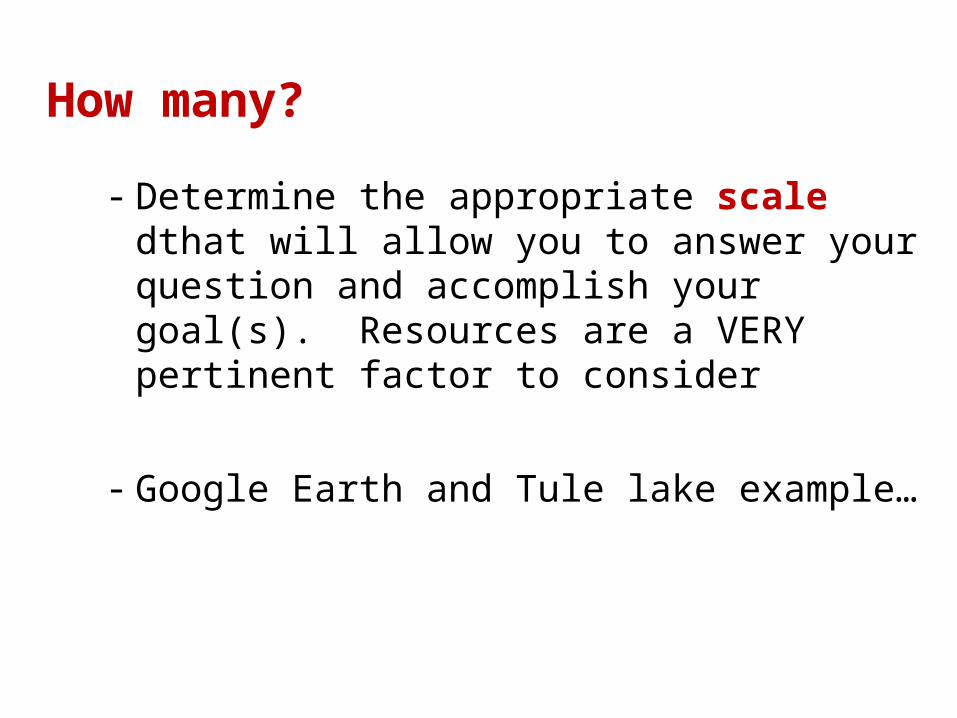
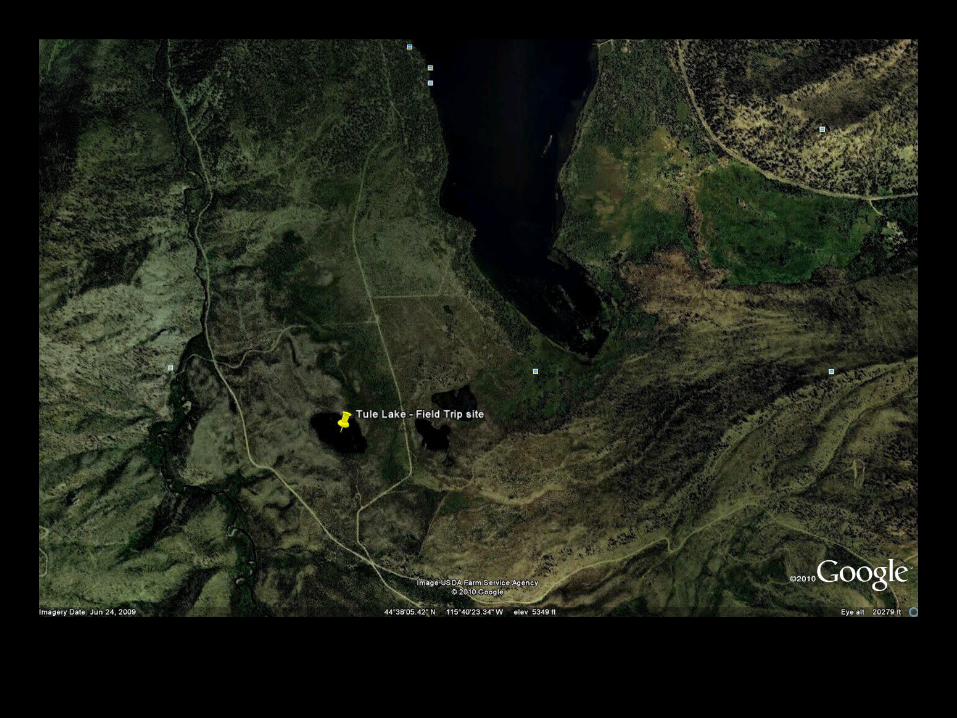
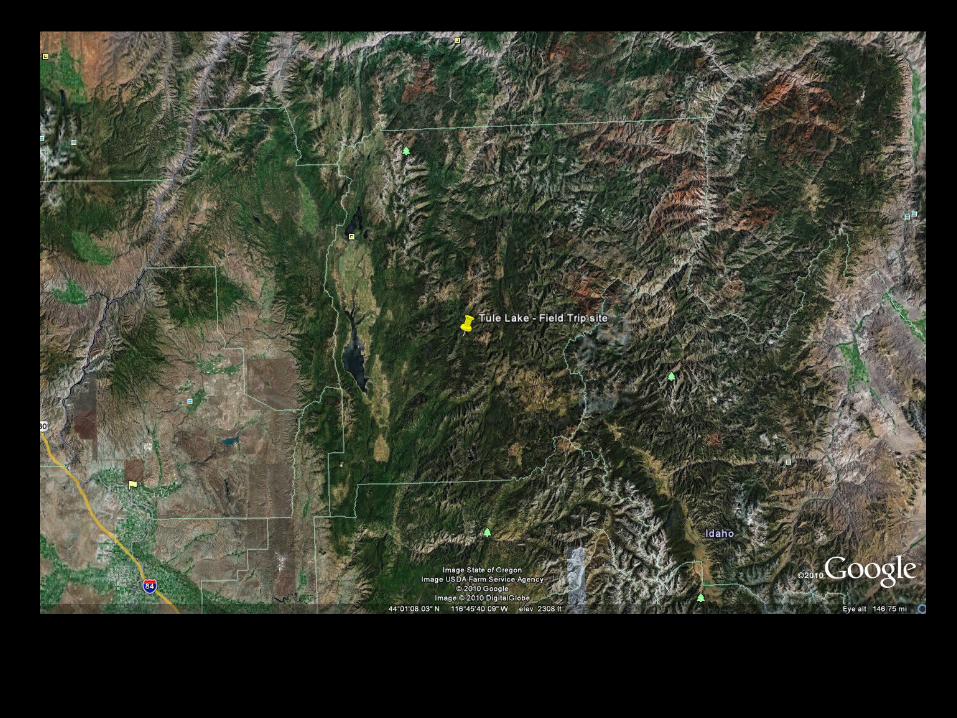
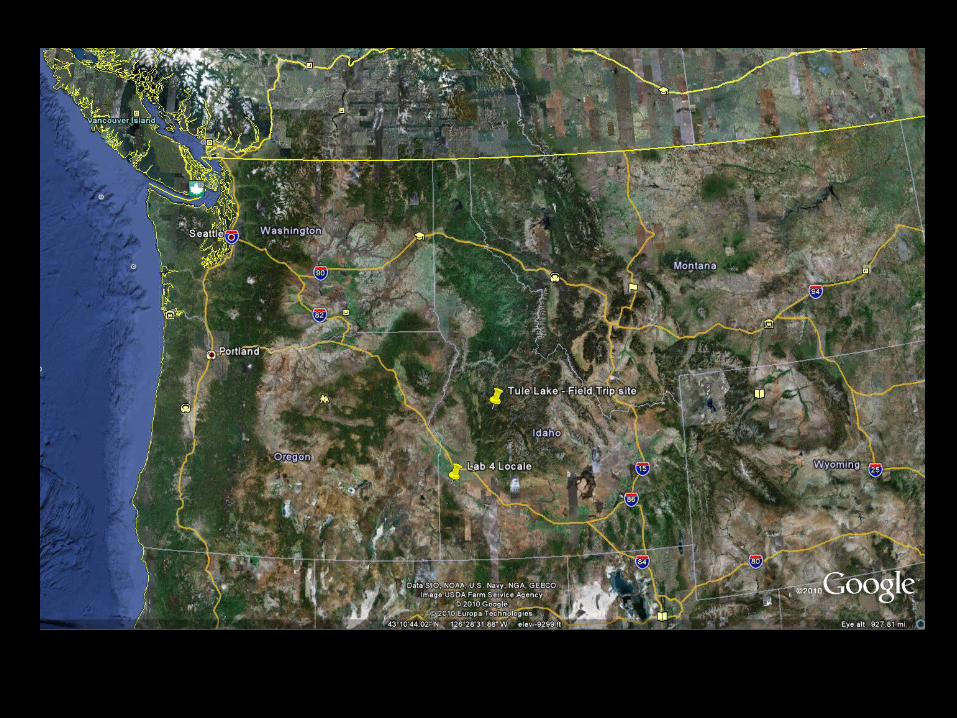
- Determine the appropriate scale dthat will allow you to answer your question and accomplish your goal(s). Resources are a VERY pertinent factor to consider
- Google Earth and Tule lake example…
How many?
- Be SURE you are methodical with your sampling scheme…
- Regular- Random
- * Blocked or stratified - Haphazard- Understand the limitations of each and justify your
choice.
How many?
- Be SURE you have sufficient replication!!!
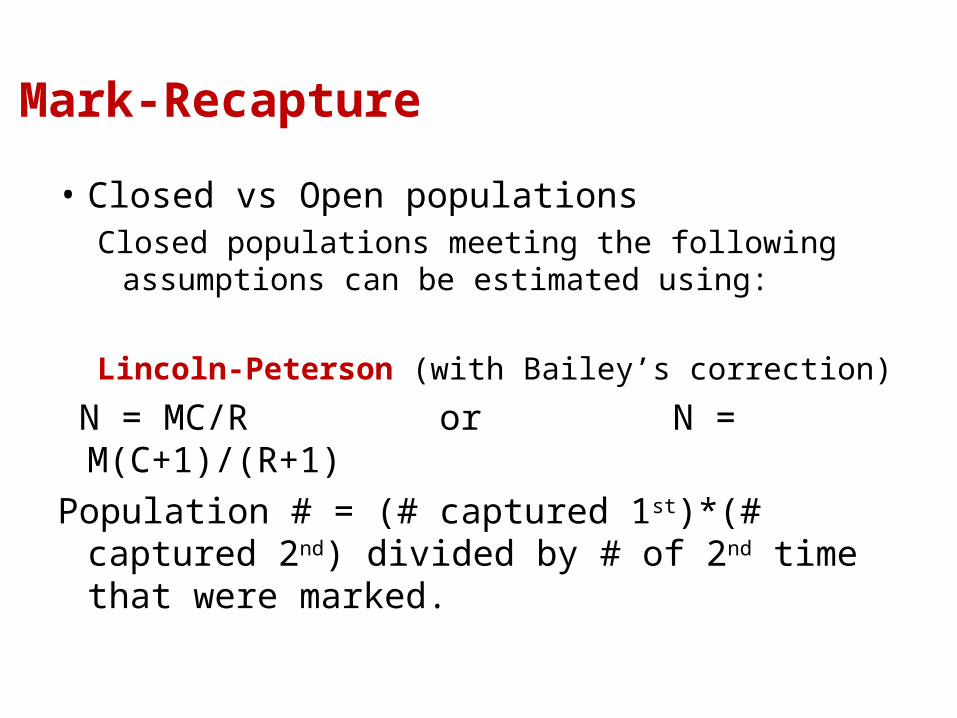
• Closed vs Open populationsClosed populations meeting the following
assumptions can be estimated using:
Lincoln-Peterson (with Bailey’s correction)
N = MC/R or N = M(C+1)/(R+1)Population # = (# captured 1st)*(# captured 2nd)
divided by # of 2nd time that were marked.
Mark-Recapture
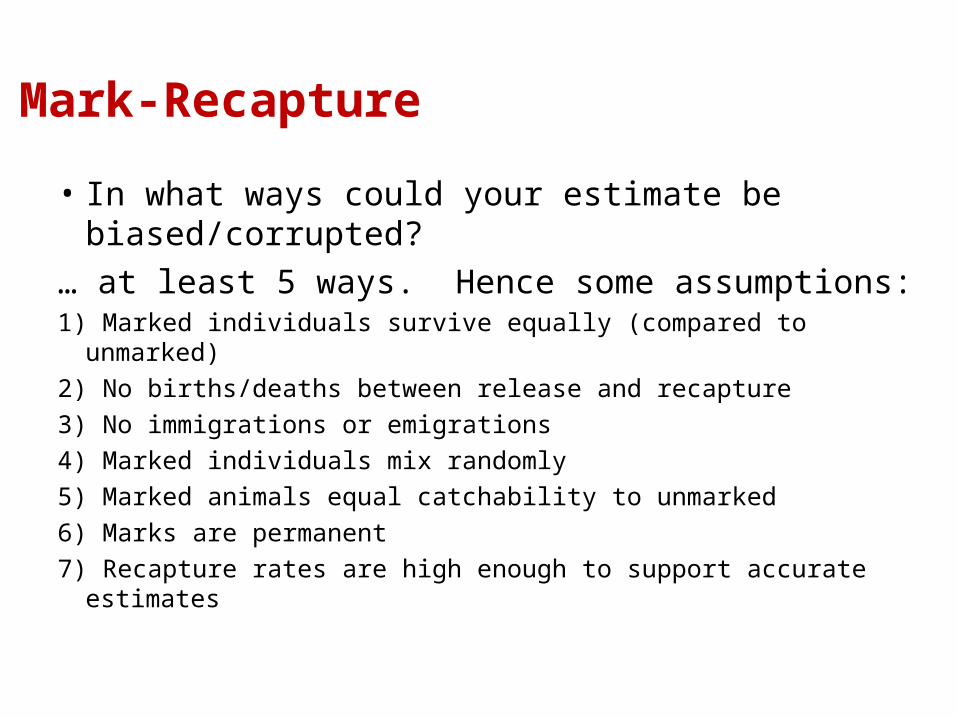
• In what ways could your estimate be biased/corrupted?
… at least 5 ways. Hence some assumptions:1) Marked individuals survive equally (compared to unmarked)2) No births/deaths between release and recapture3) No immigrations or emigrations4) Marked individuals mix randomly5) Marked animals equal catchability to unmarked6) Marks are permanent7) Recapture rates are high enough to support accurate estimates
Mark-Recapture
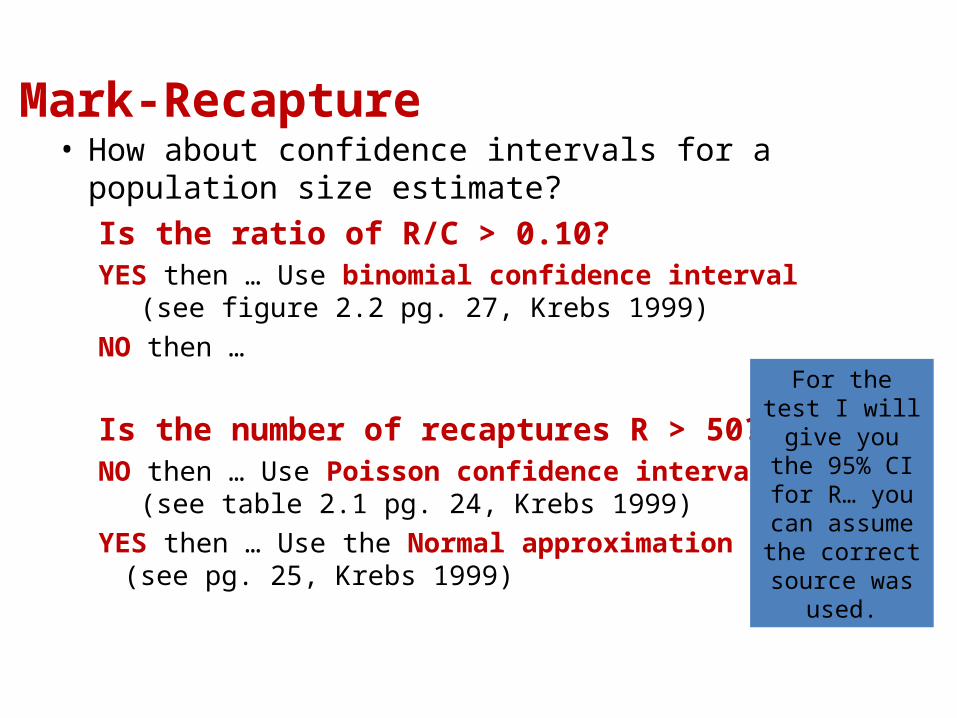
Mark-Recapture• How about confidence intervals for a population size estimate?
Is the ratio of R/C > 0.10?YES then … Use binomial confidence interval
(see figure 2.2 pg. 27, Krebs 1999)NO then …
Is the number of recaptures R > 50?NO then … Use Poisson confidence intervals
(see table 2.1 pg. 24, Krebs 1999)YES then … Use the Normal approximation
(see pg. 25, Krebs 1999)
For the test I will give you
the 95% CI for R… you can assume the
correct source was used.
Mark-Recapture
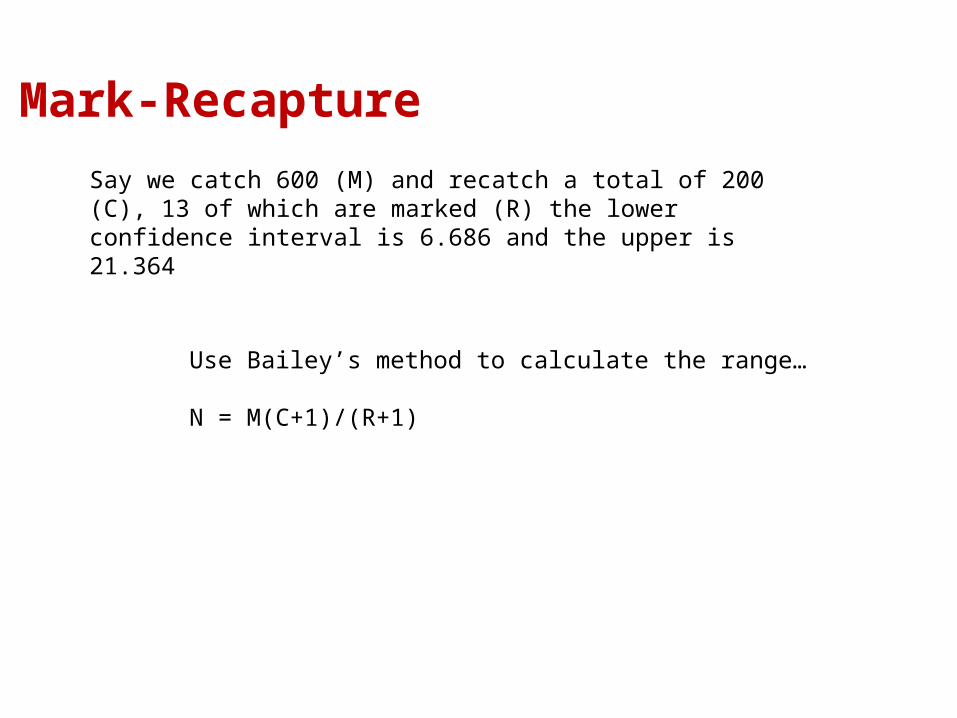
Use Bailey’s method to calculate the range…
N = M(C+1)/(R+1)
Say we catch 600 (M) and recatch a total of 200 (C), 13 of which are marked (R) the lower confidence interval is 6.686 and the upper is 21.364
• When there are more than two capture events… you can useSchnabel …
or Schumacher & Eschmeyer
Mark-Recapture
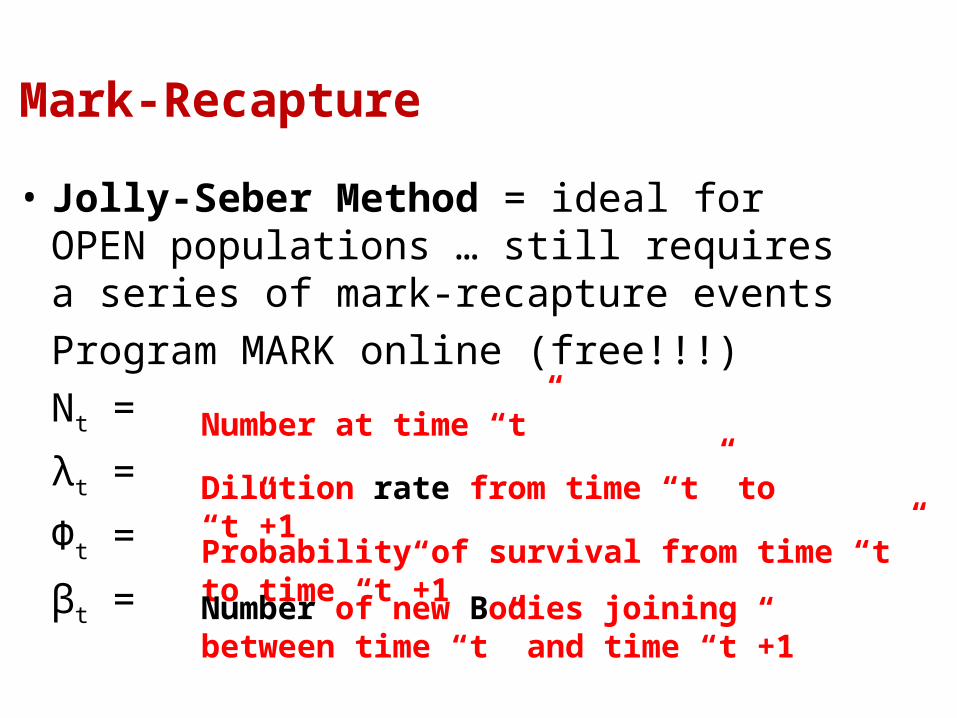
• Jolly-Seber Method = ideal for OPEN populations … still requires a series of mark-recapture events
Program MARK online (free!!!)Nt =
λt =
Фt =
βt =
Mark-Recapture
Number at time “t”
Dilution rate from time “t” to “t”+1
Probability of survival from time “t” to time “t”+1
Number of new Bodies joining between time “t” and time “t”+1
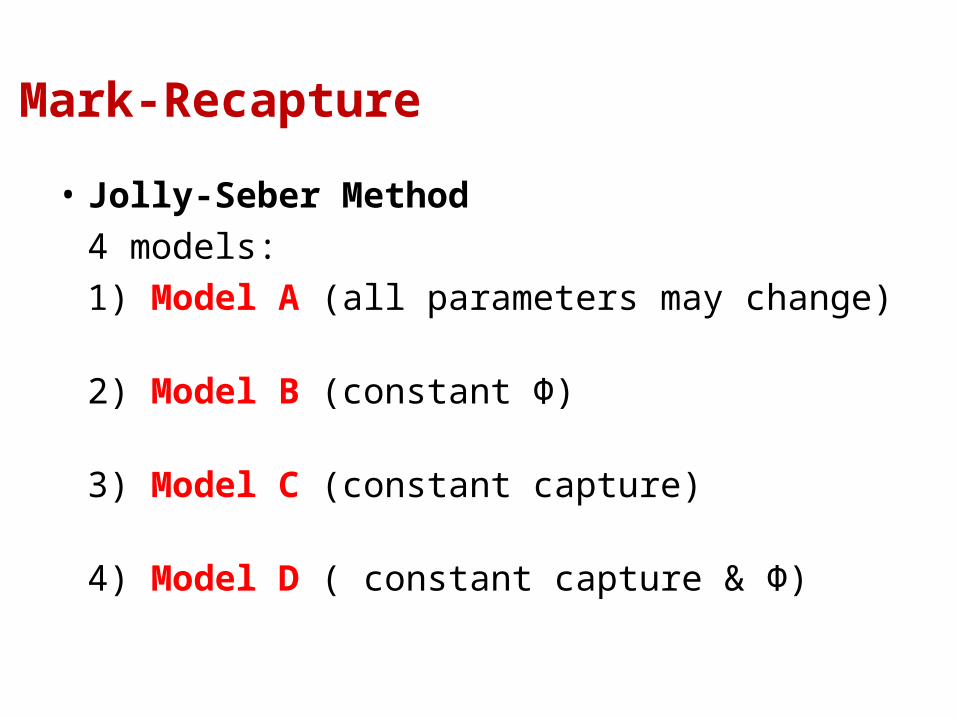
• Jolly-Seber Method 4 models:1) Model A (all parameters may change)
2) Model B (constant Ф)
3) Model C (constant capture)
4) Model D ( constant capture & Ф)
Mark-Recapture
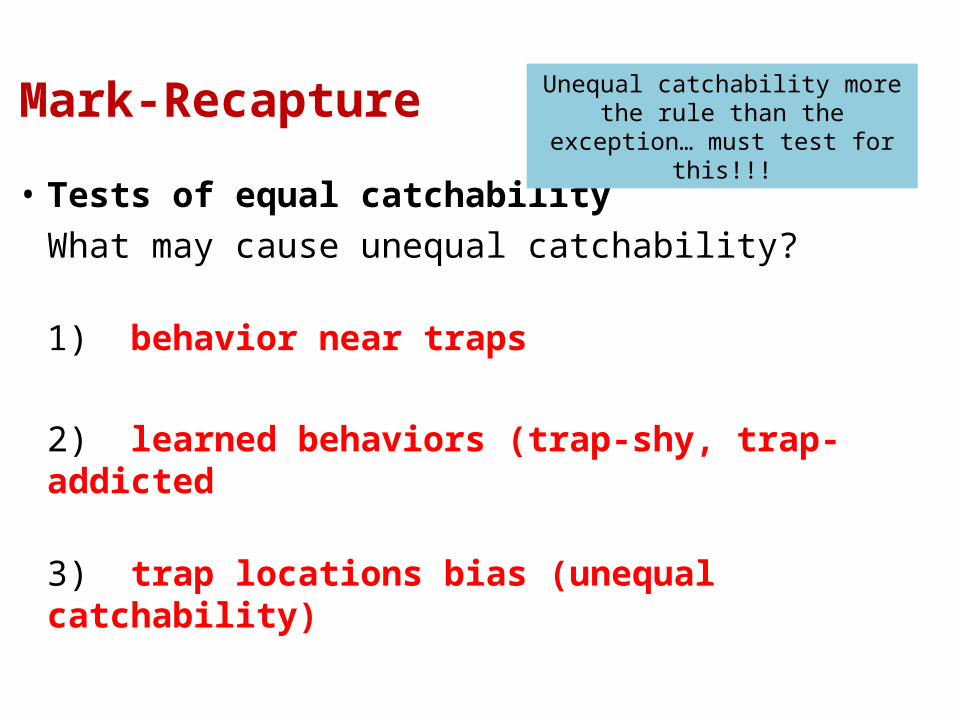
• Tests of equal catchabilityWhat may cause unequal catchability?
1) behavior near traps
2) learned behaviors (trap-shy, trap-addicted
3) trap locations bias (unequal catchability)
Mark-Recapture Unequal catchability more the rule than the exception… must test for
this!!!
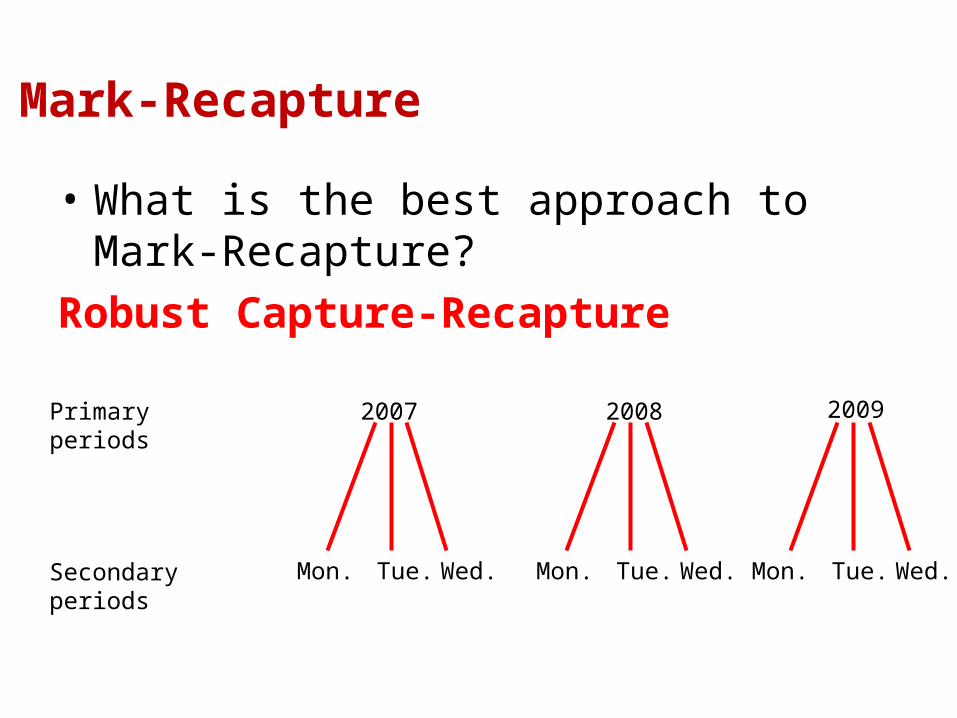
• What is the best approach to Mark-Recapture?
Robust Capture-Recapture
Mark-Recapture
Primary periods
Secondary periods
2007 2008 2009
Mon. Tue. Wed. Mon. Tue. Wed. Mon. Tue. Wed.
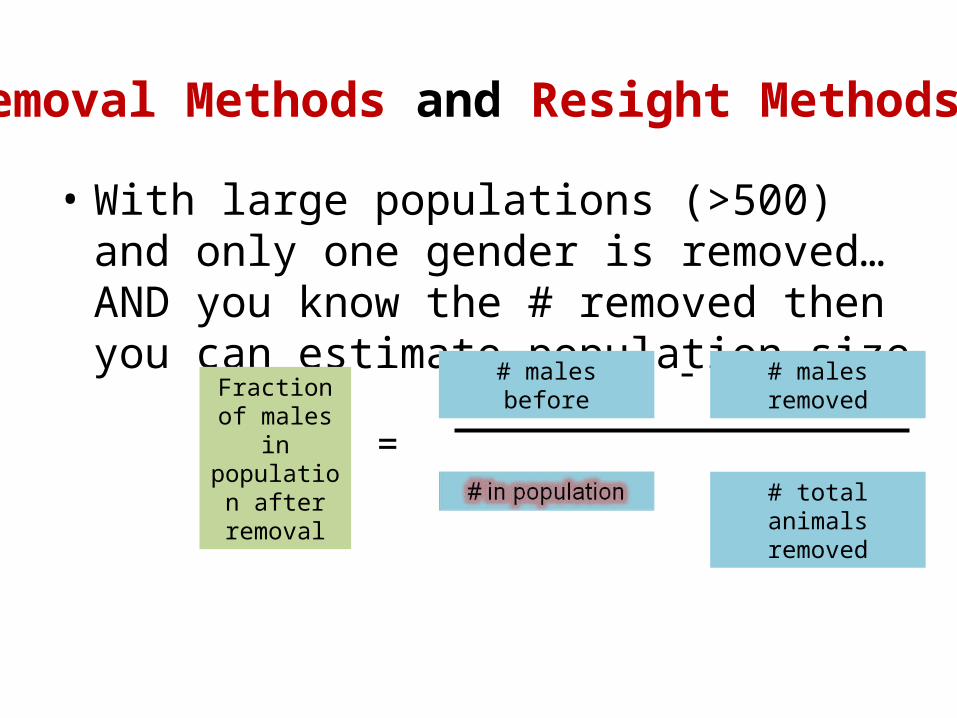
• With large populations (>500) and only one gender is removed… AND you know the # removed then you can estimate population size
Removal Methods and Resight Methods
Fraction of males in
population after
removal
=
# males before # males removed-
# total animals removed
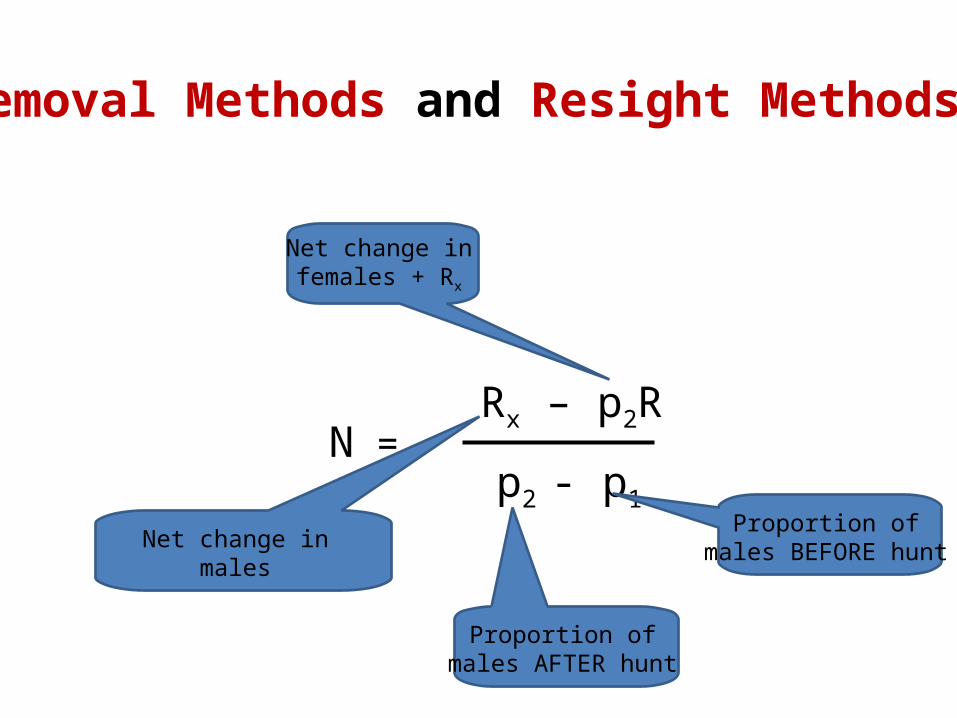
Removal Methods and Resight Methods
=NRx – p2R
Net change in males
Net change in females + Rx
p2 - p1
Proportion of males AFTER hunt
Proportion of males BEFORE hunt
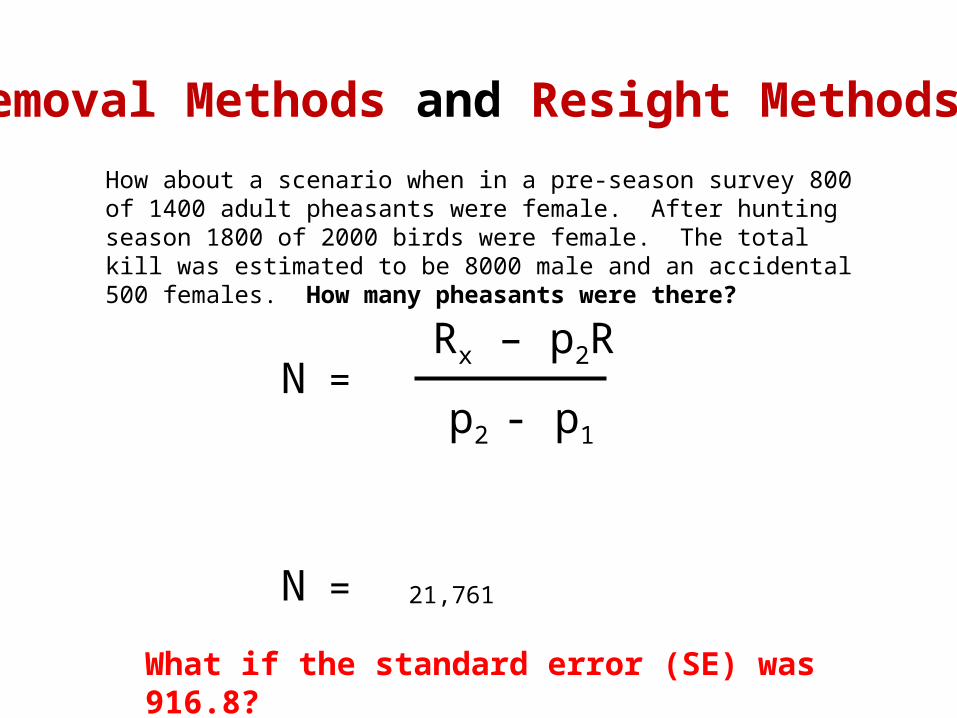
Removal Methods and Resight Methods
=NRx – p2R
p2 - p1
How about a scenario when in a pre-season survey 800 of 1400 adult pheasants were female. After hunting season 1800 of 2000 birds were female. The total kill was estimated to be 8000 male and an accidental 500 females. How many pheasants were there?
21,761N =
What if the standard error (SE) was 916.8?
Catch-Effort Methods
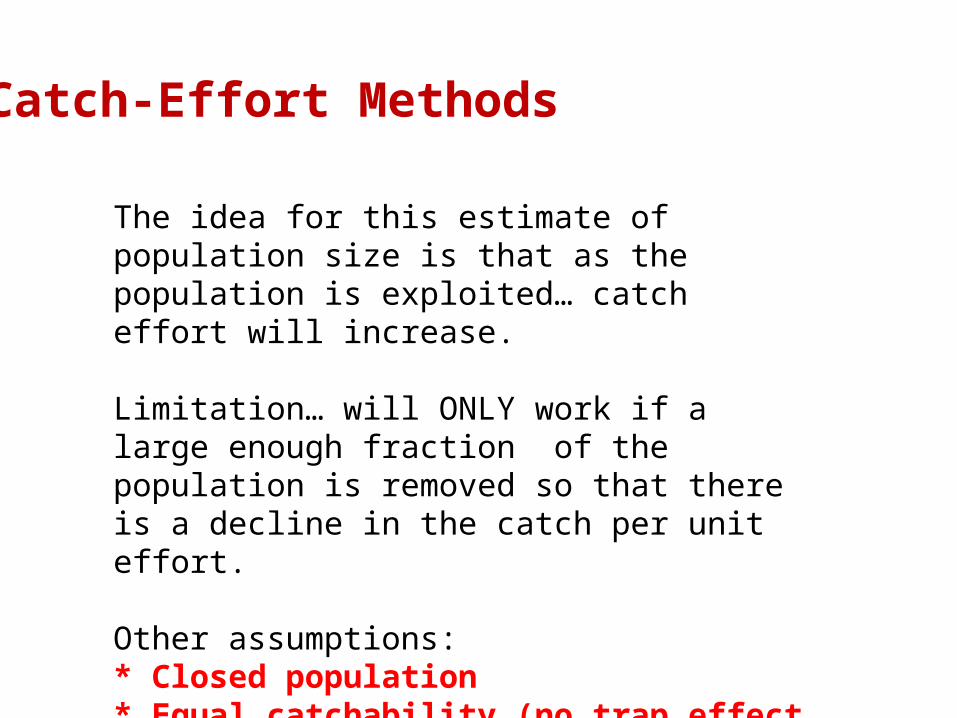
The idea for this estimate of population size is that as the population is exploited… catch effort will increase.
Limitation… will ONLY work if a large enough fraction of the population is removed so that there is a decline in the catch per unit effort.
Other assumptions:* Closed population* Equal catchability (no trap effect etc.)
Catch-Effort Methods
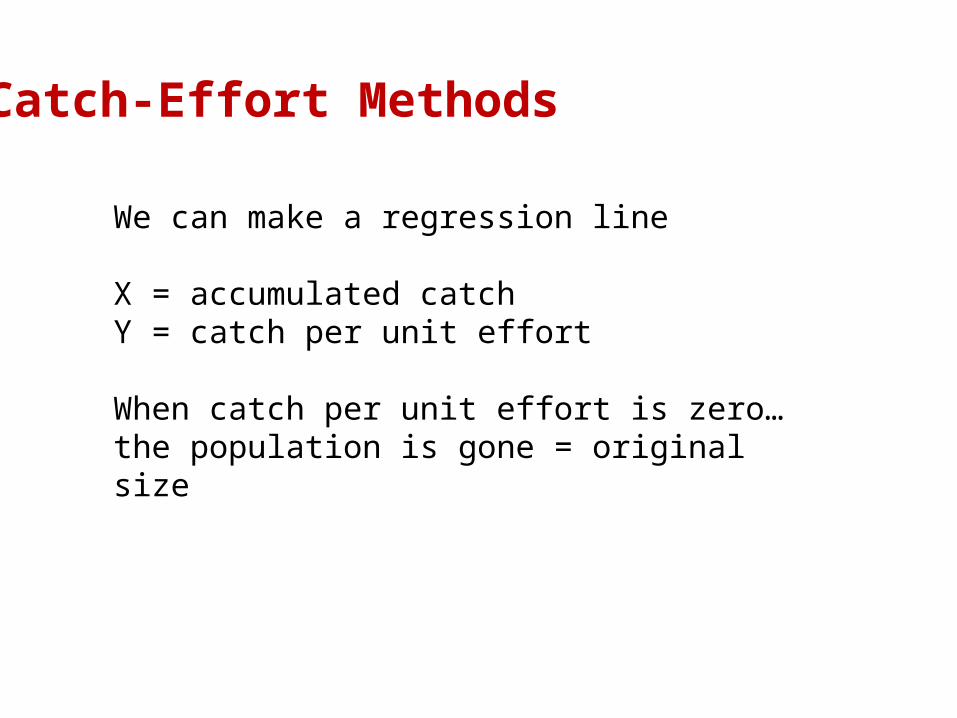
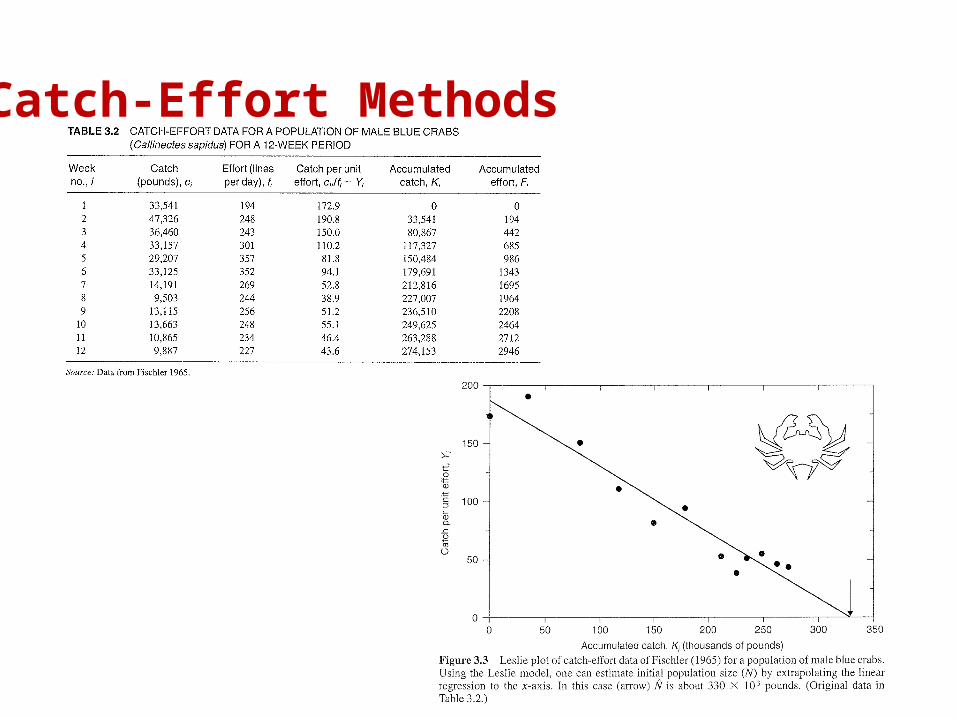
We can make a regression line
X = accumulated catchY = catch per unit effort
When catch per unit effort is zero… the population is gone = original size
Catch-Effort Methods
Resight Methods
This can be used for telemetry studies or other scenarios when the animals can be recognized as previously captured WITHOUT recapture.
Use the software MARK or NOREMARK
Assumptions… •All tagged animals stay in study area
and
* The number of tagged animals stays constant
Enumeration Methods
MNA = Minimum number alive
When would you want to use this method?
Almost always better to use a closed population model of Jolly-Seber.
Boundary Strip Methods
If you are trying to determine density you need to know abundance (like we’ve been doing) AND area…
Not always straight forward…
Boundary Strip Methods
Accommodate by creating a boundary to reflect the “effective trapping area”
How to estimate appropriate boundary size?!?
•½ movement radius
• account for home range size*calculate home range size*compute ratio of grid size to home range size*use computer modeling
Nested Grids Methods
Another way is to use Nested grids
Need:• At least 4 nested grids necessary…• Uniform distribution of animals• Closed population• Equal catchability
Trapping Web Methods
Can also use a spoked-wheel (web)
Need:• 15-20 spokes• 8-12 traps per home range at center of web• Trap every animal at center of web• Equal catchability• Need for n = or > 60