Embed Size (px)
Citation preview
Calcium SensorsDOI: 10.1002/anie.200900071
Bioinspired Colorimetric Detection of Calcium(II) Ions in Serum UsingCalsequestrin-Functionalized Gold Nanoparticles**Sunghyun Kim, Jeong Won Park, Dongkyu Kim, Daejin Kim, In-Hyun Lee, and Sangyong Jon*
The calcium(II) ion is the most abundant cation in the body,and participates in various biological activities such as skeletalmineralization, blood coagulation, neurotransmission, excita-tion of skeletal and cardiac muscle, and stimulus-mediatedhormone secretion.[1] Blood calcium levels range from 2.1 mm
to 2.6 mm in healthy humans; this level is strictly maintainedand varies by 3% at most. Severe fluctuations in calciumlevels are associated with many diseases. For instance, thecommon causes of hypercalcemia are primary hyperparathyr-oidism, malignant tumors, and hyperthyroidism.[2] Therefore,the accurate and fast estimation of blood calcium levels is ofgreat importance.
Several techniques are available to assess blood calciumlevels; these include atomic absorption spectroscopy, the useof ion-selective electrodes, and chromophore-based spectro-photometric methods.[3–5] Both the atomic absorption and ion-selective electrode detection methods are, however, compli-cated and require both expensive instruments and carefulmaintenance. Chromophore-based spectrophotometric meth-ods often lack selectivity; artifactually high readings that arisefrom the presence of other divalent metals such as Mg2+ inblood samples may be problematic.[6] Nevertheless, chromo-phore-based spectrophotometry is the most widely usedmethod to detect calcium ions because of its simplicity.Recently, gold nanoparticle (GNP) based colorimetric detec-tion has been devised for a variety of targets including metalions,[7, 8] DNA,[9] bacterial toxins,[10] proteins,[11] and enzymeactivity.[12] The aggregation of ligand-functionalized GNPsupon binding to a target results in a colorimetric response thatis indicated by broadening and shifting of a surface plasmonresonance peak. Colorimetric methods are convenient andattractive because the color changes can be easily discernedwith the naked eye, hence there is no need for any
instrumentation. To date, few attempts have been made todetect Ca2+ ions using GNPs. Lactose-functionalized GNPsthat undergo self-aggregation by Ca2+ ion mediated inter-actions between the carbohydrate moieties were first used forCa2+ ion detection; a colorimetric change resulted fromaggregation.[13] However, the linear dynamic ranges ofdetectable Ca2+ ion concentration were 10–35 mm or 0.8–2.0 mm, which lie outside the blood calcium level of 2.2–2.6 mm.[14] To overcome this limitation, we developed abioinspired GNP-based colorimetric calcium sensor thatshows high specificity, can distinguish between normal andabnormal calcium levels with the naked eye, and works underphysiological conditions.
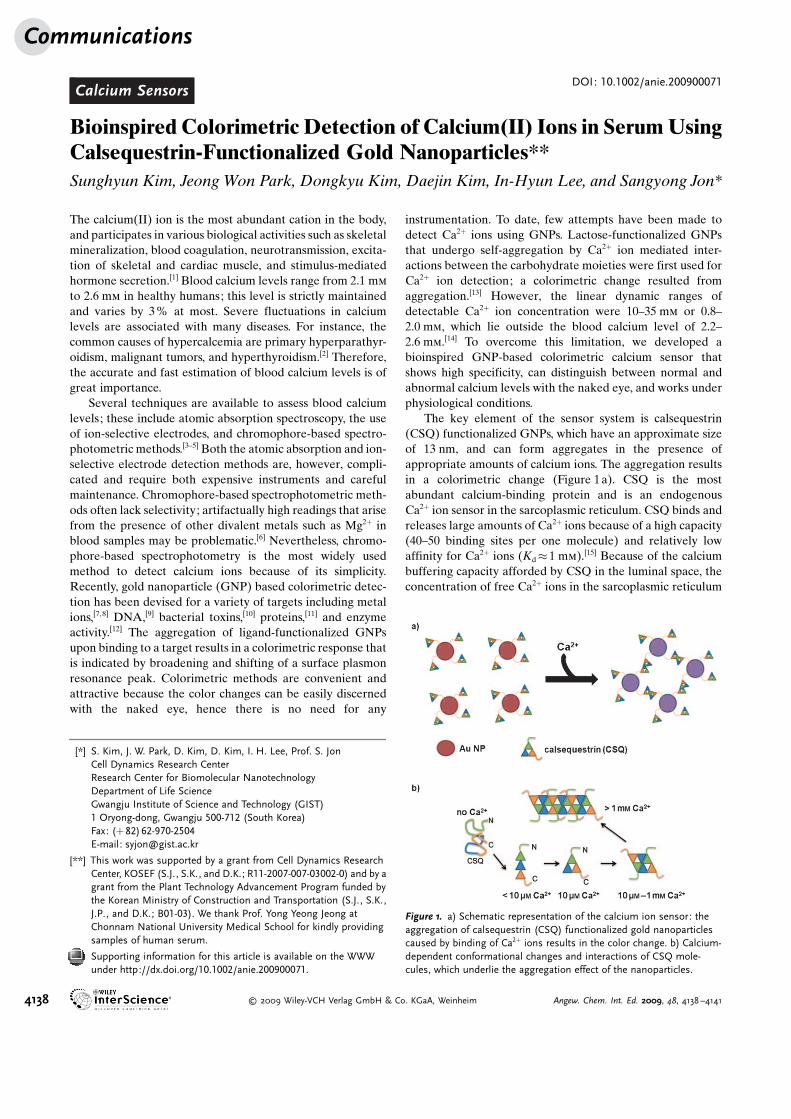
The key element of the sensor system is calsequestrin(CSQ) functionalized GNPs, which have an approximate sizeof 13 nm, and can form aggregates in the presence ofappropriate amounts of calcium ions. The aggregation resultsin a colorimetric change (Figure 1a). CSQ is the mostabundant calcium-binding protein and is an endogenousCa2+ ion sensor in the sarcoplasmic reticulum. CSQ binds andreleases large amounts of Ca2+ ions because of a high capacity(40–50 binding sites per one molecule) and relatively lowaffinity for Ca2+ ions (Kd� 1 mm).[15] Because of the calciumbuffering capacity afforded by CSQ in the luminal space, theconcentration of free Ca2+ ions in the sarcoplasmic reticulum
Figure 1. a) Schematic representation of the calcium ion sensor: theaggregation of calsequestrin (CSQ) functionalized gold nanoparticlescaused by binding of Ca2+ ions results in the color change. b) Calcium-dependent conformational changes and interactions of CSQ mole-cules, which underlie the aggregation effect of the nanoparticles.
[*] S. Kim, J. W. Park, D. Kim, D. Kim, I. H. Lee, Prof. S. JonCell Dynamics Research CenterResearch Center for Biomolecular NanotechnologyDepartment of Life ScienceGwangju Institute of Science and Technology (GIST)1 Oryong-dong, Gwangju 500-712 (South Korea)Fax: (+ 82)62-970-2504E-mail: [email protected]
[**] This work was supported by a grant from Cell Dynamics ResearchCenter, KOSEF (S.J. , S.K., and D.K.; R11-2007-007-03002-0) and by agrant from the Plant Technology Advancement Program funded bythe Korean Ministry of Construction and Transportation (S.J., S.K.,J.P., and D.K.; B01-03). We thank Prof. Yong Yeong Jeong atChonnam National University Medical School for kindly providingsamples of human serum.
Supporting information for this article is available on the WWWunder http://dx.doi.org/10.1002/anie.200900071.
Communications
4138 � 2009 Wiley-VCH Verlag GmbH & Co. KGaA, Weinheim Angew. Chem. Int. Ed. 2009, 48, 4138 –4141
can be maintained below 1 mm. CSQ undergoes a conforma-tional change as a function of Ca2+ ion concentration(Figure 1b). In the absence of Ca2+ ions, CSQ adopts anunfolded form. When the Ca2+ ion concentration graduallyincreases from 10 mm to 0.01–1 mm, the randomly coiled CSQcondenses into a compact monomer, which subsequentlyundergoes dimerization and then polymerization (Fig-ure 1b).[16] We expected that CSQ-functionalized GNPsmight form aggregates through CSQ-induced dimerizationor polymerization above a threshold Ca2+ ion concentration,thus resulting in a red-to-blue color change that arises fromchanges in the surface plasmon resonance upon GNP binding.
Cysteine-mediated protein immobilization on a goldsurface has been widely explored.[17] Therefore, we geneticallyengineered human cardiac muscle CSQ to contain twocysteine residues at the C terminus (see the SupportingInformation). This modified CSQ was immobilized ontoGNPs with an average diameter of 13 nm by incubation in anaqueous solution of excess (200-fold) modified CSQ for 12 h.Unbound CSQ was removed by repeated washing andcentrifugation. The overall negative charge of CSQ (iso-electric point pI = 4.2) at physiological pH values allowed theresulting GNPs to be well-dispersed in aqueous solution; noaggregation was observed.
The color change of the GNP-based sensor in the presenceof Ca2+ ions was monitored by UV/Vis spectroscopy (Fig-ure 2a). When Ca2+ ions (5 mm) were added to CSQ–GNPconjugates dispersed in tris(hydroxymethyl)aminomethanehydrochloride (Tris-HCl; 20 mm, pH 7.0) at room temper-
ature, the color of the solution began to change to purple, anda precipitate eventually appeared. UV/Vis spectroscopyshowed that the plasmon band at 530 nm moved to 575 nmbecause of the calcium-mediated aggregation (the TEMimage of aggregated particles after incubation with 5 mm
Ca2+ is shown in Figure S1 in the Supporting Information).This result suggests that the CSQ on the surface of GNPschanged conformation upon addition of Ca2+ ions, and theCSQ molecules became able to oligomerize or otherwiseinteract, which led to aggregation. To examine whether thecalcium-mediated CSQ–CSQ interaction is reversible, anexcess of ethylenediaminetetraacetate (EDTA; 50 mm) was
added to the aggregate. The aggregated material immediatelyreturned to the original red-colored, dispersed state, as alsoconfirmed by the UV/Vis spectrum, which showed the returnof the initial plasmon peak at 530 nm. This aggregation/dispersion cycle could be repeated up to three times(Figure 2b).
The ion selectivity of the CSQ–GNPs was evaluated usinga variety of metal ions that might interfere with Ca2+ iondetection in biological samples, including divalent ions (Mg2+,Zn2+, Cu2+, Mn2+, Ni2+, Hg2+, Cd2+, Ba2+, and Sr2+) andmonovalent ions (K+ and Na+). Human blood contains Ca2+
(2.14–2.56 mm), K+ (3.50–5.10 mm), Mg2+ (385–544 mm), andNa+ (136–145 mm). The levels of other metal ions in blood arevery low, ranging from nanomolar to micromolar concen-trations (Zn2+, ca. 30 mm ; Sr2+, ca. 400 nm ; and Ba2+,ca. 500 nm). We used ion concentrations much higher thanthose in blood in our selectivity test: Mg2+ (5 mm), K+
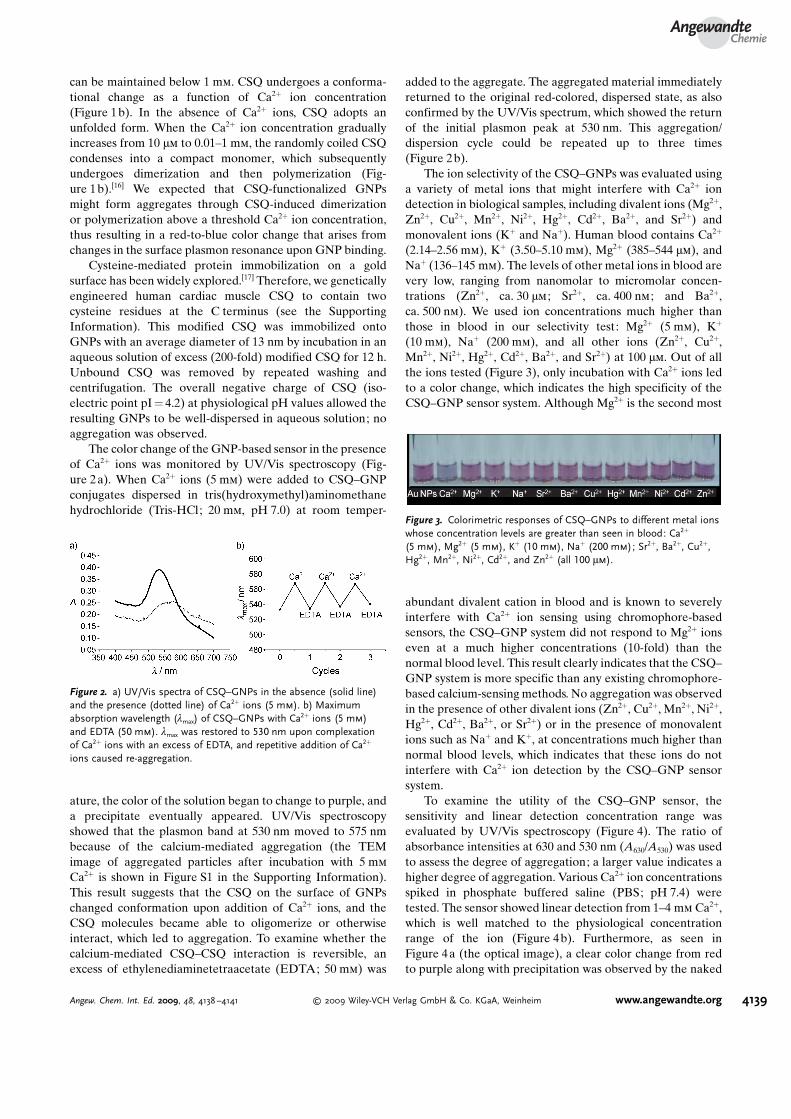
(10 mm), Na+ (200 mm), and all other ions (Zn2+, Cu2+,Mn2+, Ni2+, Hg2+, Cd2+, Ba2+, and Sr2+) at 100 mm. Out of allthe ions tested (Figure 3), only incubation with Ca2+ ions ledto a color change, which indicates the high specificity of theCSQ–GNP sensor system. Although Mg2+ is the second most
abundant divalent cation in blood and is known to severelyinterfere with Ca2+ ion sensing using chromophore-basedsensors, the CSQ–GNP system did not respond to Mg2+ ionseven at a much higher concentrations (10-fold) than thenormal blood level. This result clearly indicates that the CSQ–GNP system is more specific than any existing chromophore-based calcium-sensing methods. No aggregation was observedin the presence of other divalent ions (Zn2+, Cu2+, Mn2+, Ni2+,Hg2+, Cd2+, Ba2+, or Sr2+) or in the presence of monovalentions such as Na+ and K+, at concentrations much higher thannormal blood levels, which indicates that these ions do notinterfere with Ca2+ ion detection by the CSQ–GNP sensorsystem.
To examine the utility of the CSQ–GNP sensor, thesensitivity and linear detection concentration range wasevaluated by UV/Vis spectroscopy (Figure 4). The ratio ofabsorbance intensities at 630 and 530 nm (A630/A530) was usedto assess the degree of aggregation; a larger value indicates ahigher degree of aggregation. Various Ca2+ ion concentrationsspiked in phosphate buffered saline (PBS; pH 7.4) weretested. The sensor showed linear detection from 1–4 mm Ca2+,which is well matched to the physiological concentrationrange of the ion (Figure 4b). Furthermore, as seen inFigure 4a (the optical image), a clear color change from redto purple along with precipitation was observed by the naked
Figure 2. a) UV/Vis spectra of CSQ–GNPs in the absence (solid line)and the presence (dotted line) of Ca2+ ions (5 mm). b) Maximumabsorption wavelength (lmax) of CSQ–GNPs with Ca2+ ions (5 mm)and EDTA (50 mm). lmax was restored to 530 nm upon complexationof Ca2+ ions with an excess of EDTA, and repetitive addition of Ca2+
ions caused re-aggregation.
Figure 3. Colorimetric responses of CSQ–GNPs to different metal ionswhose concentration levels are greater than seen in blood: Ca2+
(5 mm), Mg2+ (5 mm), K+ (10 mm), Na+ (200 mm); Sr2+, Ba2+, Cu2+,Hg2+, Mn2+, Ni2+, Cd2+, and Zn2+ (all 100 mm).
AngewandteChemie
4139Angew. Chem. Int. Ed. 2009, 48, 4138 –4141 � 2009 Wiley-VCH Verlag GmbH & Co. KGaA, Weinheim www.angewandte.org

eyes when Ca2+ concentration changed from 2.4 to 3.5 mm.This result suggests that the sensor may distinguish betweennormal (2.4 mm) and hypercalcemic (3.5 mm) conditionsfrequently found in patients with malignancies. Encouragedby these findings, we applied the sensor to detect Ca2+ ions inphysiological samples. Ca2+ ions in human serum exit in theforms of unbound (free Ca2+ ions) and complexed withproteins (mostly albumin) in an approximately equal ratio. Itis also known that the bound, complexed Ca2+ ions can bereleased by lowering the pH value to 3. In our experiment,fetal bovine serum (FBS) and rat serum were tested as modelsof human serum. For the preparation of hypercalcemiasamples, additional Ca2+ ions at determined concentrationswere spiked into each FBS and rat serum containing a normallevel of Ca2+ ions. To measure the total Ca2+ ion concentrationin the serum, FBS and rat serum containing various concen-trations of Ca2+ were treated with HCl to adjust the pH valueto 2 and release the bound Ca2+ ions, followed by filtrationusing a spin filter of 10 kDa pore size to remove proteins. ThepH value of the resulting filtrate was restored the physio-logical value using Tris buffer (1m, pH 8.5) before Ca2+ iondetection using the CSQ–GNPs sensor. The total Ca2+ ionconcentration in each filtrate was measured by using aninductively coupled plasma optical emission spectrometer(ICP-OES), which revealed that hypocalcemic (1.3 mm forboth FBS and rat serum), normal (2.6 mm for FBS; 2.3 mm forrat serum), and hypercalcemic (3.3 mm, 4.0 mm, and 4.6 mm
for FBS; 3.1 mm and 4.1 mm for rat serum) samples wereprepared. With the CSQ–GNPs sensor system, no color
change was seen from the hypocalcemic and normal samples,whereas the color changed from red to purple and finally clearprecipitation was clearly seen from hypercalcemia levels(Figure 4c,e for FBS and rat serum, respectively).
Similar to Ca2+ ion detection in PBS (Figure 4b), UV/Visspectroscopy measurements led to clear differences in theratio of absorption intensities at 630 and 530 nm only withhypercalcemic samples (Figure 4d, f for FBS and rat serum,respectively). Encouraged by these results, we tested whetherthe CSQ–GNPs work with real human serum in a preliminarytrial. The CSQ–GNPs showed a clear color change from pinkto purple with a hypercalcemic patient sample (3.0 mm; seeFigure S2 in the Supporting Information), which indicatedthat our system has potential for use in practical Ca2+ ionsensors. This result indicates that the CSQ–GNPs system candistinguish between normal and abnormal (hypercalcemia)calcium levels under the physiological conditions by thenaked eye without the aid of any instruments.
In conclusion, we have developed a simple and rapidcolorimetric method for the detection of Ca2+ ions with highspecificity using calsequestrin-functionalized GNPs. Thetechnique does not require specialized equipment becausetest results can be easily seen by the naked eye. Unlike mostchemical chromophore-based Ca2+ ion sensors that show poorselectivity for Ca2+ ions over Mg2+ ions and other divalentcations, the CSQ–GNP sensor shows high specificity for Ca2+
ions. More importantly, the CSQ–GNP sensor can alsodistinguish between normal and abnormal (hypercalcemia)Ca2+ ion levels in serum, by showing a clear color change fromred to purple along with precipitation for abnormal Ca2+ ionlevels. This bioinspired sensing system, which allows visual-ization of changes in blood calcium levels, may be useful inthe detection or monitoring of several diseases associatedwith hypercalcemia, such as malignant tumors.
Received: January 6, 2009Revised: April 7, 2009Published online: May 7, 2009
.Keywords: blood serum · calcium · calsequestrin ·nanostructures · sensors
[1] A. H. Gowenlock, J. R. McMurray, D. M. McLanchlan, Varley�sPractical Clinical Biochemistry, 6th ed., CRC Pr I Llc, London,2002, pp. 601 – 602.
[2] a) M. F. Carroll, D. S. Schade, Am. Fam. Physician 2003, 67,1959 – 1966; b) T. P. Jacobs, J. P. Bilezikian, J. Clin. Endocrinol.Metab. 2005, 90, 6316 – 6322; c) M. M. Shepard, J. W. Smith, Am.J. Med. Sci. 2007, 334, 381 – 385.
[3] a) A. Zettner, P. Seiigson, Clin. Chem. 1964, 10, 869 – 890; b) J. P.Cali, G. N. Bowers, Jr., D. S. Young, Clin. Chem. 1973, 19, 1208 –1213; c) W. G. Robertson, R. W. Marshall, CRC Crit. Rev. Clin.Lab. Sci. 1979, 11, 271 – 304.
[4] G. N. George, Jr., C. Brassard, S. F. Sena, Clin. Chem. 1986, 3218,1437 – 1447.
[5] a) V. Harold, M. D. Connerty, R. Anglis, B. S. Briggs, Am. J. Clin.Pathol. 1966, 45, 290 – 296; b) H. J. Gitelman, Anal. Biochem.1967, 18, 521 – 531; c) C. M. Corns, Anal. Clin. Biochem. 1987,24, 591 – 597; d) N. O. Leary, A. Pembroke, P. F. Duggan, Clin.
Figure 4. a) Colorimetric responses of CSQ–GNPs to different Ca2+ ionconcentrations (0, 2.4, and 3.5 mm) in PBS (pH 7.4). b) A630/A530 ofCSQ–GNPs systems at various Ca2+ ion concentrations (1, 2, 2.5, 3.5,4.5, and 5.5 mm) in PBS. c) Colorimetric responses of CSQ–GNPs todifferent total calcium ion concentrations (1.3, 2.6, 3.3, 4.0, and4.6 mm) prepared from FBS. d) A630/A530 of CSQ–GNPs systems atvarious Ca2+ ion concentrations of FBS (1.3, 2.3, 2.9, 3.2, and 4.5 mm).e) Colorimetric responses of CSQ–GNPs to different calcium ionconcentrations (1.3, 2.3, 3.1 and 4.1 mm) prepared from rat serum.f) A630/A530 of CSQ–GNPs systems at various Ca2+ ion concentrationsof rat serum (1.3, 2.3, 3.1, and 4.1 mm).
Communications
4140 www.angewandte.org � 2009 Wiley-VCH Verlag GmbH & Co. KGaA, Weinheim Angew. Chem. Int. Ed. 2009, 48, 4138 –4141

Chem. 1992, 38, 904 – 908; e) E. Chapoteau, B. P. Czech, W.Zazulak, A. Kumar, Clin. Chem. 1994, 39, 1820 – 1824.
[6] C. M. Corns, C. J. Ludman, Ann. Clin. Biochem. 1987, 24, 345 –351.
[7] a) J. Liu, Y. Lu, Chem. Mater. 2004, 16, 3231 – 3238; b) Y. Kim,R. C. Johnson, J. T. Hupp, Nano Lett. 2001, 1, 165 – 167; c) J. S.Lee, M. S. Han, C. A. Mirkin, Angew. Chem. 2007, 119, 4171 –4174; Angew. Chem. Int. Ed. 2007, 46, 4093 – 4096; d) C. C.Huang, H. T. Chang, Chem. Commun. 2007, 1215 – 1217; e) A. J.Reynolds, A. H. Haines, D. A. Russell, Langmuir 2006, 22,1156 – 1163; f) W. Yang, J. J. Gooding, Z. He, Q. Li, G. Chen, J.Nanosci. Nanotechnol. 2007, 7, 712 – 716.
[8] a) Y. Zhou, S. Wang, K. Zhang, X. Jiang, Angew. Chem. 2008,120, 7564 – 7566; Angew. Chem. Int. Ed. 2008, 47, 7454 – 7456;b) J. M. Slocik, J. S. Zabinski, Jr., D. M. Phillips, R. R. Naik,Small 2008, 4, 548 – 551; c) D. Aili, K. Enander, J. Rydberg, I.Nesterenko, F. Bjorefors, L. Baltzer, B. Liedberg, J. Am. Chem.Soc. 2008, 130, 5780 – 5788.
[9] a) M. S. Han, A. K. R. Lytton-Jean, B.-K. Oh, J. Heo, C. A.Mirkin, Angew. Chem. 2006, 118, 1839 – 1842; Angew. Chem. Int.Ed. 2006, 45, 1807 – 1810; b) J. J. Storhoff, R. Elghanian, R. C.Mucic, C. A. Mirkin, R. L. Letsinger, J. Am. Chem. Soc. 1998,120, 1959 – 1964; c) J. J. Storhoff, A. A. Lazarides, R. C. Mucic,C. A. Mirkin, R. L. Letsinger, G. C. Schatz, J. Am. Chem. Soc.2000, 122, 4640 – 4650.
[10] a) C. L. Schofield, A. H. Haines, R. A. Field, D. A. Russell,Langmuir 2006, 22, 6707 – 6711; b) C. L. Schofield, R. A. Field,D. A. Russell, Anal. Chem. 2007, 79, 1356 – 1361.
[11] a) J.-M. Nam, C. S. Thaxton, C. A. Mirkin, Science 2003, 301,1884 – 1886; b) D. G. Georganopoulou, L. Chang, J.-M. Nam,
C. S. Thaxton, E. J. Mufson, W. L. Klein, C. A. Mirkin, Proc.Natl. Acad. Sci. USA 2005, 102, 2273 – 2276; c) C.-C. Huang, Y.-F. Huang, Z. Cao, W. Tan, H.-T. Chang, Anal. Chem. 2005, 77,5735 – 5741; d) V. Pavlov, Y. Xiao, B. Shlyahovsky, I. Willner, J.Am. Chem. Soc. 2004, 126, 11768 – 11769; e) S. I. Stoeva, J.-S.Lee, J. E. Smith, S. T. Rosen, C. A. Mirkin, J. Am. Chem. Soc.2006, 128, 8378 – 8379.
[12] a) Y. Choi, N.-H. Ho, C.-H. Tung, Angew. Chem. 2007, 119, 721 –723; Angew. Chem. Int. Ed. 2007, 46, 707 – 709; b) W. Zhao, W.Chiuman, J. C. Lam, M. A. Brook, Y. Li, Chem. Commun. 2007,3729 – 3731.
[13] J. M. de la Fuente, G. B. Africa, C. R. Teresa, R. Javier, C. Javier,R. Asuncion, P. Soledad, Angew. Chem. 2001, 113, 2317 – 2321;Angew. Chem. Int. Ed. 2001, 40, 2257 – 2261.
[14] A. J. Reynolds, A. H. Haines, D. A. Russell, Langmuir 2006, 22,1156 – 1163.
[15] a) D. H. Maclennan, P. T. S. Wong, Proc. Natl. Acad. Sci. USA1971, 68, 1231 – 1235; b) N. Ikemoto, G. M. Bhatnagar, B. Nagy,J. Gergely, J. Biol. Chem. 1972, 247, 7835 – 7837; c) B Cozens,R. A. Reithmeier, J. Biol. Chem. 1984, 259, 6248 – 6252; d) N. A.Bearda, D. R. Laverb, A. F. Dulhunty, Prog. Biophys. Mol. Biol.2004, 85, 33 – 69.
[16] a) S. Wang, W. R. Trumble, H. Liao, C. R. Wesson, A. K.Dunker, C. H. Kang, Nat. Struct. Biol. 1998, 5, 476 – 483;b) H. J. Park, S. Wu, A. K. Dunker, C. H. Kang, J. Biol. Chem.2003, 278, 16176 – 16182.
[17] J. M. Lee, H. K. Park, Y. Jung, K. Kim, S. O. Jung, B. H. Chung,Anal. Chem. 2007, 79, 2680 – 2687.
AngewandteChemie
4141Angew. Chem. Int. Ed. 2009, 48, 4138 –4141 � 2009 Wiley-VCH Verlag GmbH & Co. KGaA, Weinheim www.angewandte.org