Embed Size (px)
Citation preview
Bio 242 | Cellular and Molecular Biology
Page 1 of 28 Bioinformatics Tutorial (rev. 10‐2016)
Bio 242
BIOINFORMATICS TUTORIAL
Bio 242 α‐Amylase Lab Sequence
Sequence Searches: BLAST
Sequence Alignment: Clustal Omega
3d Structure & 3d Alignments
DO NOT REMOVE FROM LAB.
DO NOT WRITE IN THIS DOCUMENT. A pdf of this document is available on the bio 242 website.
Acknowledgements
The Bates Bioinformatics Tutorial was originally developed as part of the Collaborative Technologies Development project. David Asanuma ('09) created the site under the guidance of Nancy Kleckner, Associate Professor of Biology, and Michael Hanrahan, Assistant Director of Research and Curricular Computing. Revision of the content is performed annually by Greg Anderson and Carolyn Lawson to keep the document up to date with the website.
Bio 242 | Cellular and Molecular Biology
Page 2 of 28 Bioinformatics Tutorial (rev. 10‐2016)
Bioinformatics Tutorial
Bioinformatics is the acquisition, storage, arrangement, identification, analysis, and communication of information related to biology. The term was coined in 1990 with the use of computers in DNA sequence analysis. Think of it as the “theoretical” branch of molecular biology – like the relationship of theoretical physics to the general field of physics.
Now that you have obtained information about some of the chemical properties of α‐amylase, in this exercise you will be comparing the molecular structure of the enzyme among the three (or more!) species. The tutorial will guide you through finding the gene sequences using both the Entrez search and BLAST tools, and then comparing them using the Clustal Omega tool.
You will be using the DNA and protein sequence on‐line databases that are the core of bioinformatics. There are two general types of sequence databases: Primary databases contain experimental results in an accessible format, but are not sequences that are a population consensus. DDBJ, EMBL, and GenBank are primary databases. Secondary databases are curated to reflect consensus sequences from multiple experiments and usually use the primary databases as their sources.
Abbreviations DDBJ – DNA Databank of Japan EMBL – European Molecular Biology Laboratory NCBI – National Center for Biotechnology Information BLAST – Basic local alignment search tool
The standard sequence format is called FASTA. All FASTA sequences start with a definition line which consists of:
a unique identification number (the accession number) the version number of the sequence the length of the sequence molecule type (DNA or mRNA) taxonomic division (for instance, INV = invertebrate) last release date source organism
Every coding sequence also has a unique protein number assigned to it, starting with AA.
Reference sequences (which undergo continuing curation) are the most complete and up‐to‐date and always start with NT for DNA, NM for mRNA, or NP for protein. Hint – these are the ones you want to use if possible.
Sequence Search Introduction
Entrez
Entrez is a data retrieval system developed by the National Center for Biotechnology Information (NCBI) that provides integrated access to a wide range of data domains, including literature, nucleotide and protein sequences, complete genomes, three‐dimensional structures, and more. Entrez includes powerful search features that retrieve not only the exact search results but also related records within a data domain that might not be retrieved otherwise and associated records across data domains. These features enable us to gather previously disparate pieces of an information puzzle for a topic of interest.

Bio 242 | Cellular and Molecular Biology
Page 3 of 28 Bioinformatics Tutorial (rev. 10‐2016)
Effective and powerful use of Entrez requires an understanding of the available data domains, the variety of data sources and types within each domain, and Entrez’s advanced search features. This tutorial uses corn (Zea mays) alpha‐amylase to demonstrate the wide variety of information that we can rapidly gather for a single gene. The numbers noted in the search results will of course change over time as the databases grow. The same techniques shown here can be used for any topic of interest.
The search goals are to:
Identifying representative, well annotated protein amino acid sequence records for several plant and animal amylases, using Entrez search and BLAST, to compare using CLUSTAL Omega multiple sequence alignment tool;
Retrieve associated literature/citations for each accession record (species aa sequence) used;
Identify conserved domains within the protein;
Find a resolved three‐dimensional structure for the enzymes you used, or, in their absence, identify structures with homologous sequence;
Perform VAST alignments of 3d structures of plant and animal amylases to visualize where similarities and differences occur.
Let’s get started!
Go to the NCBI website http://www.ncbi.nlm.nih.gov by entering the URL in the address field of your browser.
After accessing the NCBI website, you may now search for corn alpha‐amylase sequences in either the nucleotide or protein databases by selecting one or the other from the Database dropdown menu. Other points of interest on the NCBI Home Page are the PubMed link, which allows you to search for journal articles on the structure and function of alpha‐amylases, and the BLAST link, which allows you to search for nucleotide or protein sequences with similarity to your sequence of interest.
For now, make sure you are at the NCBI home page (click on the NCBI icon in the upper left of the NCBI page to be sure), and choose "Protein" from the search drop‐down databases menu. Type "Zea mays alpha‐amylase" in the line below. These selections are illustrated in Figure 1 (next page).
Click "Search" to proceed.

Bio 242 | Cellular and Molecular Biology
Page 4 of 28 Bioinformatics Tutorial (rev. 10‐2016)
Figure 1. NCBI home page from which Entrez searches of many databases can be performed. You will choose to search the Protein database.
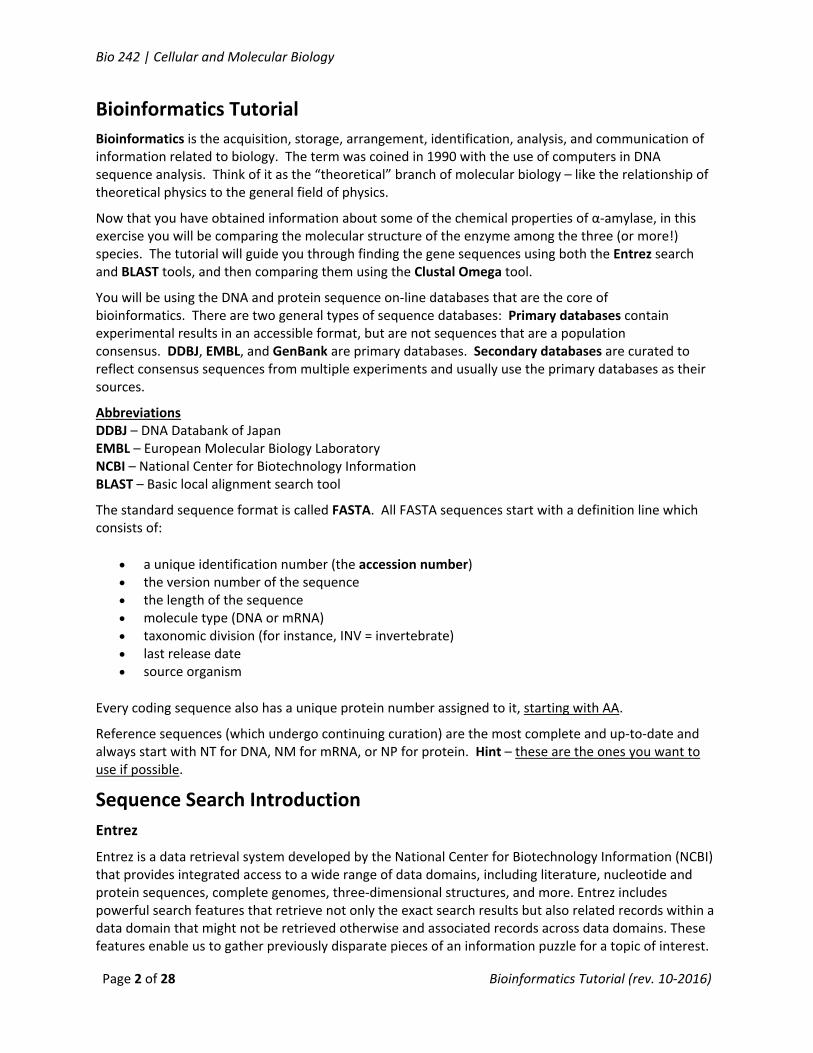
Search results: Fig. 2 shows a typical results page for this search. Yours should look similar, but might be a little different depending on what new information has arrived since the screen shot was made. The sequence of interest has the accession number (identifier) AAA50161. It is highlighted in the screen shot. How do you know this is the one you want? Click on the accession number and study the page that comes up. It should be identical to the one shown in Fig. 3.
Figure 2. Typical search results page for protein sequences.
Bio 242 | Cellular and Molecular Biology
Page 5 of 28 Bioinformatics Tutorial (rev. 10‐2016)
Figure 3. Typical record for a typical accession number record.
In Figure 3, take note of the DEFINITION, SOURCE and ORGANISM, AUTHORS of the sequence, and the TITLE and JOURNAL name of the article published about it. If you don’t already have this article, you can retrieve it simply by clicking on the PUBMED number (in the live window) and print the PDF version. Then find your way back to the results page.
Bio 242 | Cellular and Molecular Biology
Page 6 of 28 Bioinformatics Tutorial (rev. 10‐2016)
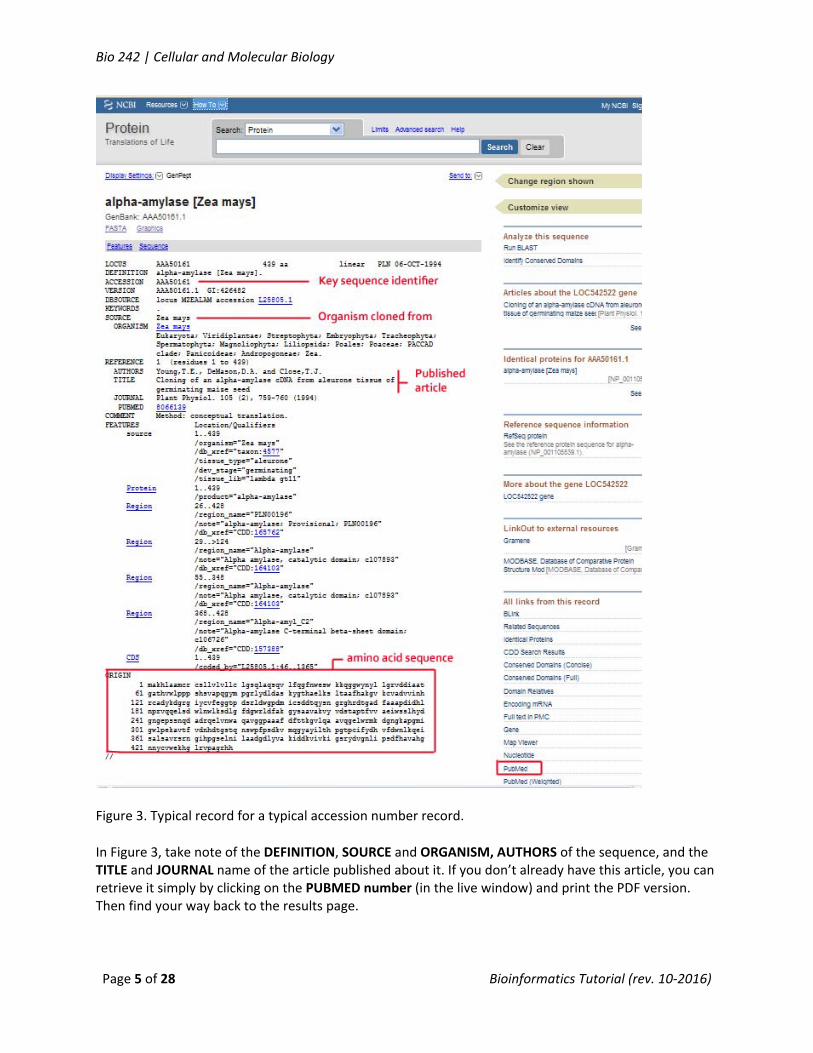
Skip down through the FEATURES and note the ORIGIN section, which gives you the amino acid sequence of your protein. This is the sequence we’ll use in a BLAST search, but the default format is not particularly helpful. All further processing of the sequence information requires that the sequence be in FASTA format.
FASTA Format: Conversion of the sequence to a universal format
Scroll to the top of your results page and note the Display drop‐down box with "GenPept" selected. The GenPept format is the default setting and gives you all of the information we discussed above. However, the FASTA format is more useful for BLAST searches and alignments of sequences. Select FASTA from the menu as illustrated in Fig 4.
Your results should appear like the screen shot in Fig. 5. You now see less information: just the accession number followed by a brief descriptor, and the amino acid sequence preceded by some identifying information.
Figure 4. Click FASTA to convert the sequence to proper format for further searching.
Figure 5. FASTA conversion results.
In the live window, highlight and copy the complete amino acid sequence along with the identifying information (>gi|426482…). From your start menu bring up NotePad and paste the FASTA sequence into the window. You will use this sequence in a BLAST search to identify other amino acid sequences in the NCBI databases with similarity to your sequence. Note that many of the relevant analysis tools that can use this sequence information are linked down the right side of the NCBI page. Once you are comfortable using these tools, you can work more efficiently. Minimize NotePad to return to the NCBI website.
Bio 242 | Cellular and Molecular Biology
Page 7 of 28 Bioinformatics Tutorial (rev. 10‐2016)
Protein BLAST Introduction
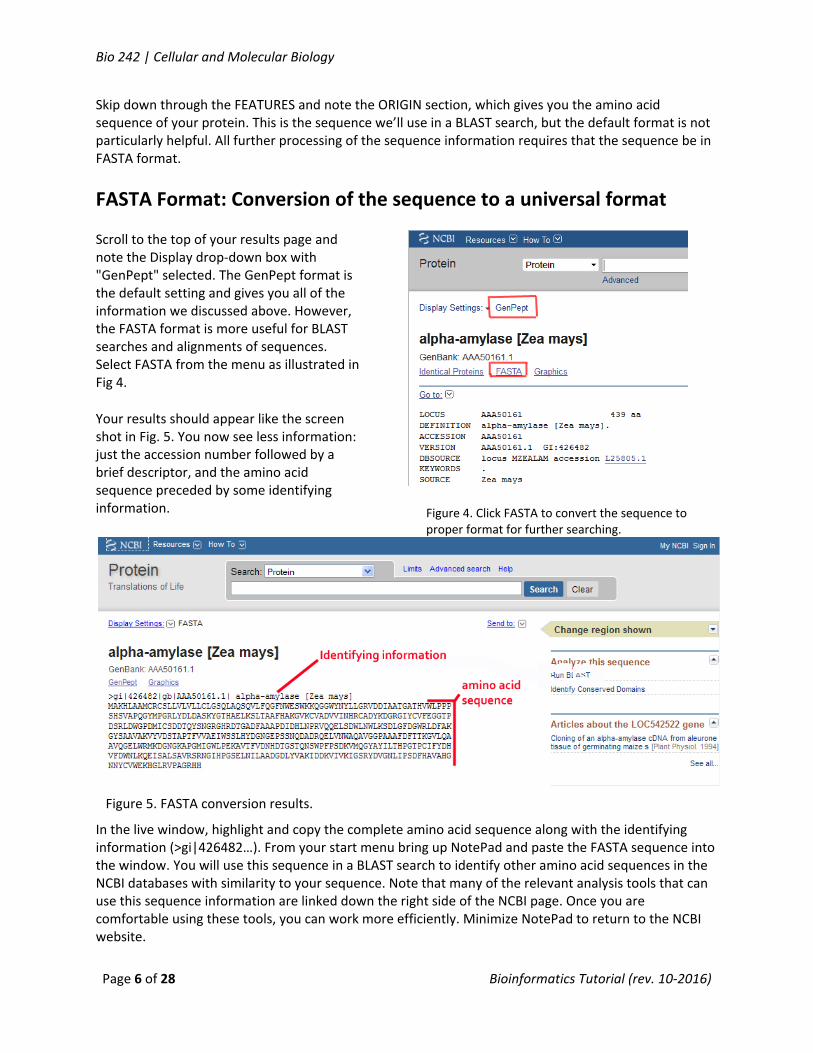
To access the BLAST page, in your live window, click on the NCBI icon in the upper left of the page (this takes you to the home page). Click on BLAST in the Popular Resources menu. The BLAST options are summarized as a flow chart (Fig. 6); choose Protein BLAST. Table 1 explains what the BLAST options do.
Figure 6. Basic BLAST search options.
Table 1. Explanation of BLAST program functions for the rest of us.
BLAST PROGRAM Further details
nucleotide blast or blastn Compares a nucleotide query sequence against a nucleotide sequence database.
protein blast (or blastp) Compares an amino acid query sequence against a protein sequence database.
blastx Compares a nucleotide query sequence translated in all reading frames against a protein sequence database. You could use this option to find potential translation products of an unknown nucleotide sequence.
tblastn Compares a protein query sequence against a nucleotide sequence database dynamically translated in all reading frames.
tblastx
Compares the six‐frame translations of a nucleotide query sequence against the six‐frame translations of a nucleotide sequence database. Please note that the tblastx program cannot be used with the nr database on the BLAST Web page because it is computationally intensive.
Bio 242 | Cellular and Molecular Biology
Page 8 of 28 Bioinformatics Tutorial (rev. 10‐2016)
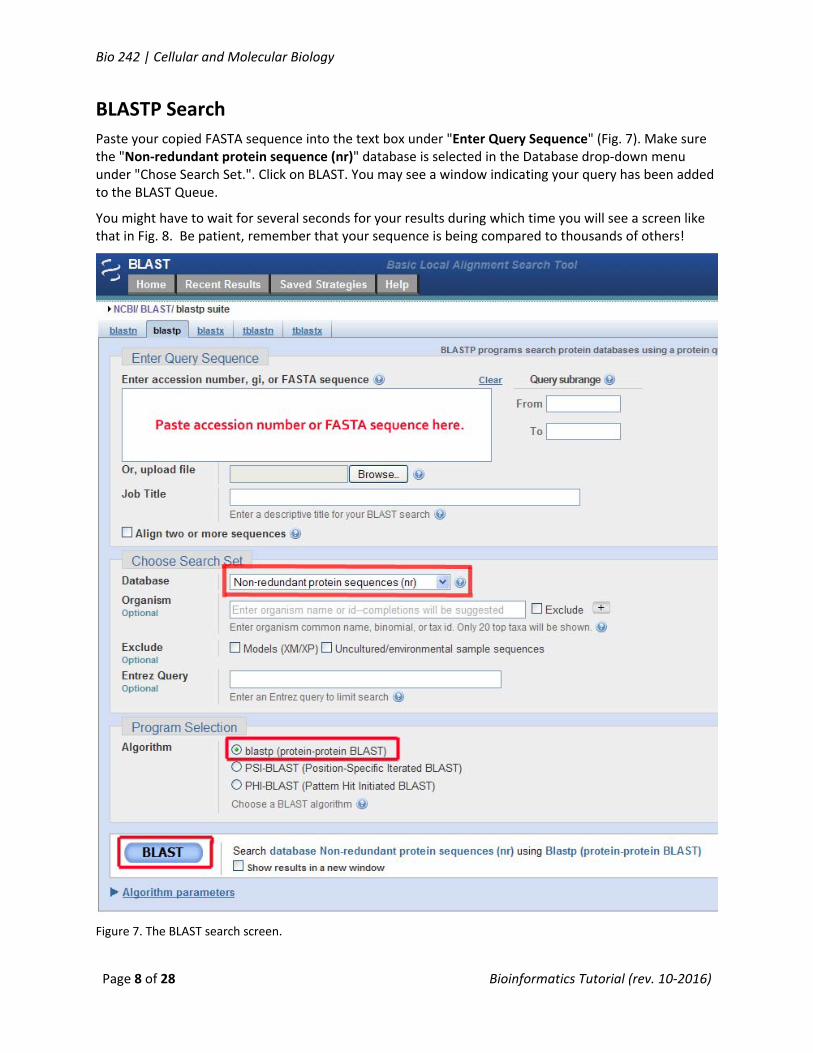
BLASTP Search
Paste your copied FASTA sequence into the text box under "Enter Query Sequence" (Fig. 7). Make sure the "Non‐redundant protein sequence (nr)" database is selected in the Database drop‐down menu under "Chose Search Set.". Click on BLAST. You may see a window indicating your query has been added to the BLAST Queue.
You might have to wait for several seconds for your results during which time you will see a screen like that in Fig. 8. Be patient, remember that your sequence is being compared to thousands of others!
Figure 7. The BLAST search screen.
Bio 242 | Cellular and Molecular Biology
Page 9 of 28 Bioinformatics Tutorial (rev. 10‐2016)
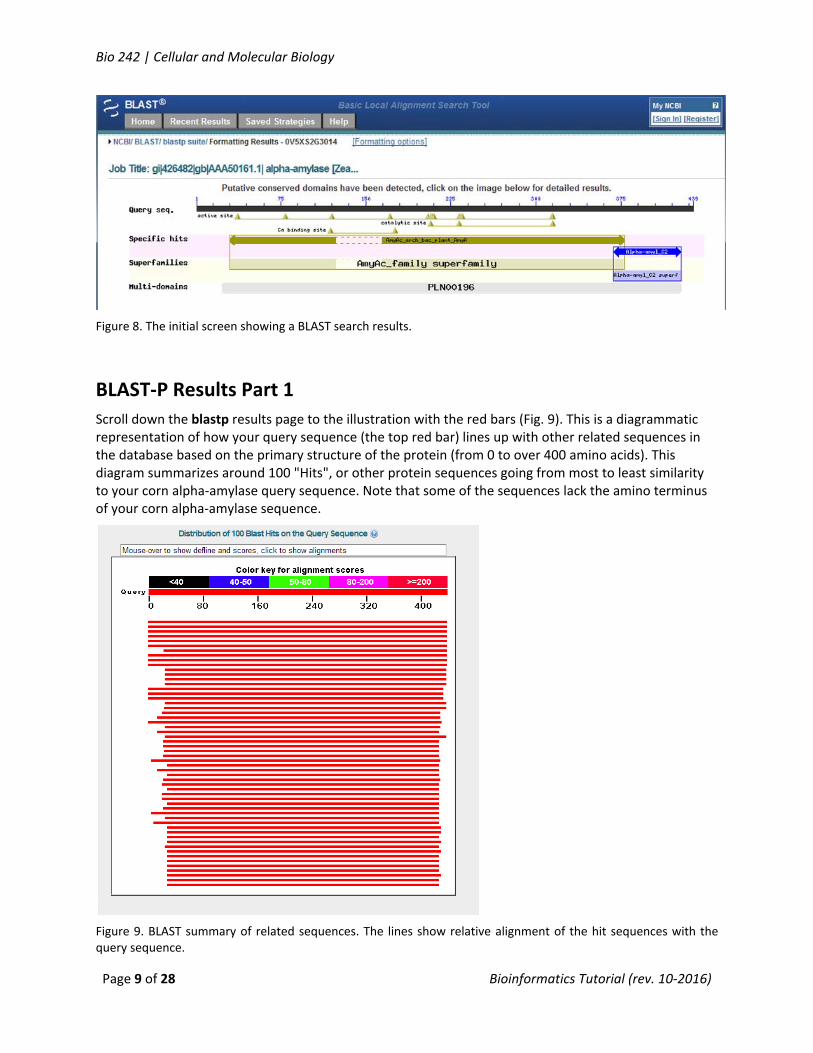
Figure 8. The initial screen showing a BLAST search results.
BLAST‐P Results Part 1
Scroll down the blastp results page to the illustration with the red bars (Fig. 9). This is a diagrammatic representation of how your query sequence (the top red bar) lines up with other related sequences in the database based on the primary structure of the protein (from 0 to over 400 amino acids). This diagram summarizes around 100 "Hits", or other protein sequences going from most to least similarity to your corn alpha‐amylase query sequence. Note that some of the sequences lack the amino terminus of your corn alpha‐amylase sequence.
Figure 9. BLAST summary of related sequences. The lines show relative alignment of the hit sequences with the query sequence.
Bio 242 | Cellular and Molecular Biology
Page 10 of 28 Bioinformatics Tutorial (rev. 10‐2016)
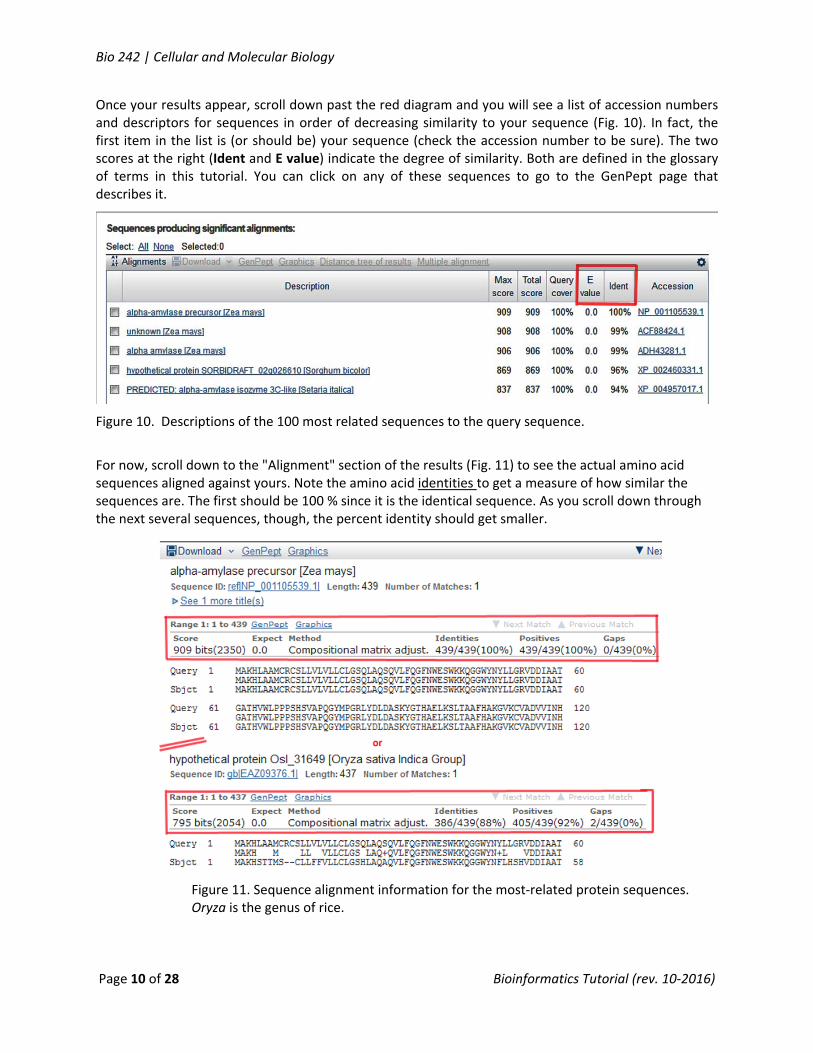
Once your results appear, scroll down past the red diagram and you will see a list of accession numbers and descriptors for sequences in order of decreasing similarity to your sequence (Fig. 10). In fact, the first item in the list is (or should be) your sequence (check the accession number to be sure). The two scores at the right (Ident and E value) indicate the degree of similarity. Both are defined in the glossary of terms in this tutorial. You can click on any of these sequences to go to the GenPept page that describes it.
Figure 10. Descriptions of the 100 most related sequences to the query sequence.
For now, scroll down to the "Alignment" section of the results (Fig. 11) to see the actual amino acid sequences aligned against yours. Note the amino acid identities to get a measure of how similar the sequences are. The first should be 100 % since it is the identical sequence. As you scroll down through the next several sequences, though, the percent identity should get smaller.
Figure 11. Sequence alignment information for the most‐related protein sequences. Oryza is the genus of rice.
Bio 242 | Cellular and Molecular Biology
Page 11 of 28 Bioinformatics Tutorial (rev. 10‐2016)
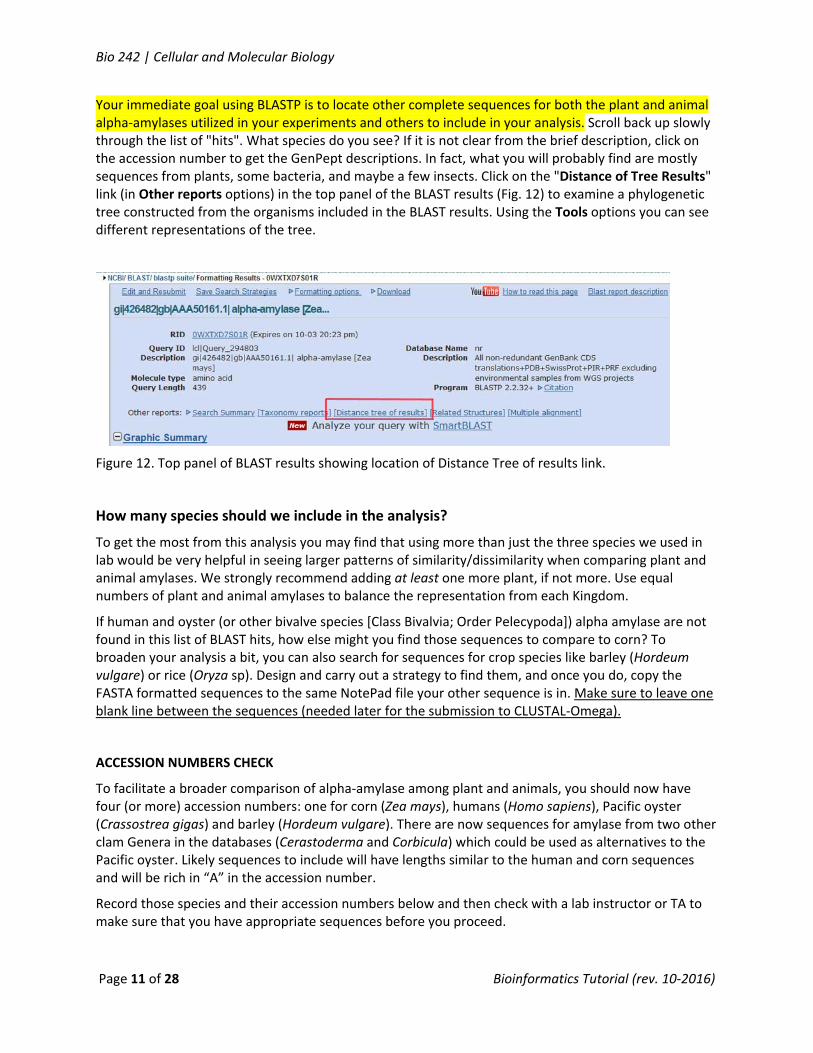
Your immediate goal using BLASTP is to locate other complete sequences for both the plant and animal alpha‐amylases utilized in your experiments and others to include in your analysis. Scroll back up slowly through the list of "hits". What species do you see? If it is not clear from the brief description, click on the accession number to get the GenPept descriptions. In fact, what you will probably find are mostly sequences from plants, some bacteria, and maybe a few insects. Click on the "Distance of Tree Results" link (in Other reports options) in the top panel of the BLAST results (Fig. 12) to examine a phylogenetic tree constructed from the organisms included in the BLAST results. Using the Tools options you can see different representations of the tree.
Figure 12. Top panel of BLAST results showing location of Distance Tree of results link.
How many species should we include in the analysis?
To get the most from this analysis you may find that using more than just the three species we used in lab would be very helpful in seeing larger patterns of similarity/dissimilarity when comparing plant and animal amylases. We strongly recommend adding at least one more plant, if not more. Use equal numbers of plant and animal amylases to balance the representation from each Kingdom.
If human and oyster (or other bivalve species [Class Bivalvia; Order Pelecypoda]) alpha amylase are not found in this list of BLAST hits, how else might you find those sequences to compare to corn? To broaden your analysis a bit, you can also search for sequences for crop species like barley (Hordeum vulgare) or rice (Oryza sp). Design and carry out a strategy to find them, and once you do, copy the FASTA formatted sequences to the same NotePad file your other sequence is in. Make sure to leave one blank line between the sequences (needed later for the submission to CLUSTAL‐Omega).
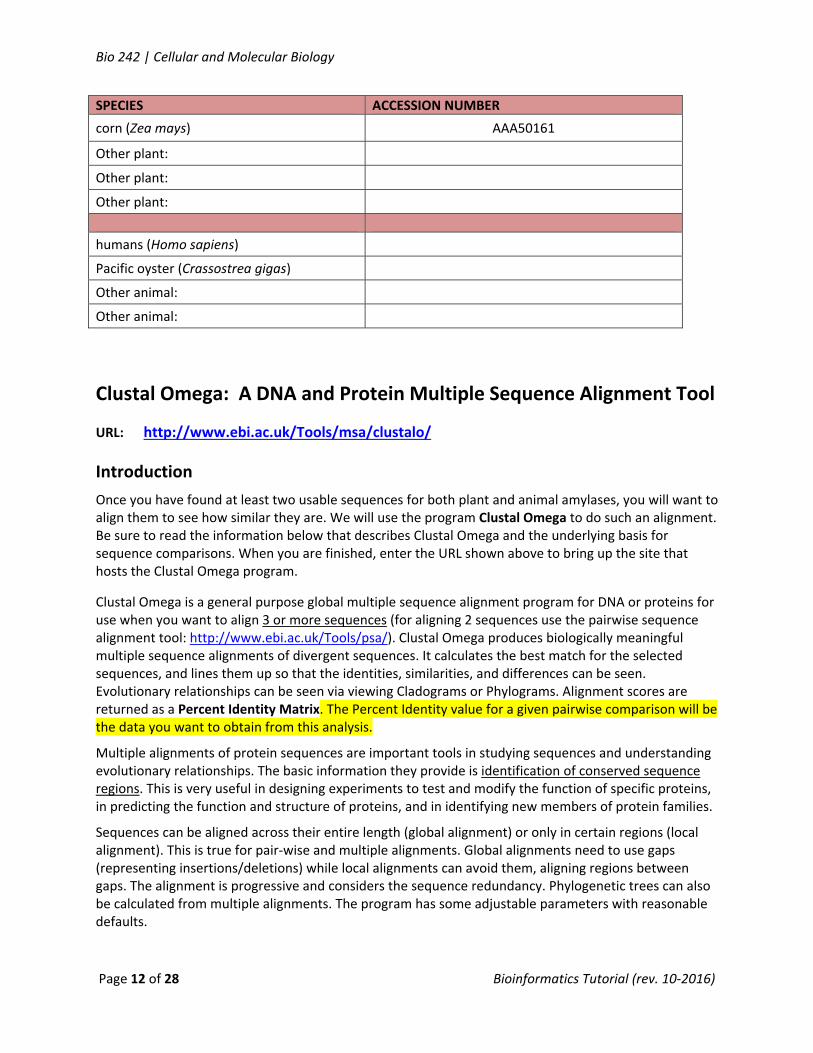
ACCESSION NUMBERS CHECK
To facilitate a broader comparison of alpha‐amylase among plant and animals, you should now have four (or more) accession numbers: one for corn (Zea mays), humans (Homo sapiens), Pacific oyster (Crassostrea gigas) and barley (Hordeum vulgare). There are now sequences for amylase from two other clam Genera in the databases (Cerastoderma and Corbicula) which could be used as alternatives to the Pacific oyster. Likely sequences to include will have lengths similar to the human and corn sequences and will be rich in “A” in the accession number.
Record those species and their accession numbers below and then check with a lab instructor or TA to make sure that you have appropriate sequences before you proceed.
Bio 242 | Cellular and Molecular Biology
Page 12 of 28 Bioinformatics Tutorial (rev. 10‐2016)
SPECIES ACCESSION NUMBER
corn (Zea mays) AAA50161
Other plant:
Other plant:
Other plant:
humans (Homo sapiens)
Pacific oyster (Crassostrea gigas)
Other animal:
Other animal:
Clustal Omega: A DNA and Protein Multiple Sequence Alignment Tool
URL: http://www.ebi.ac.uk/Tools/msa/clustalo/ Introduction
Once you have found at least two usable sequences for both plant and animal amylases, you will want to align them to see how similar they are. We will use the program Clustal Omega to do such an alignment. Be sure to read the information below that describes Clustal Omega and the underlying basis for sequence comparisons. When you are finished, enter the URL shown above to bring up the site that hosts the Clustal Omega program.
Clustal Omega is a general purpose global multiple sequence alignment program for DNA or proteins for use when you want to align 3 or more sequences (for aligning 2 sequences use the pairwise sequence alignment tool: http://www.ebi.ac.uk/Tools/psa/). Clustal Omega produces biologically meaningful multiple sequence alignments of divergent sequences. It calculates the best match for the selected sequences, and lines them up so that the identities, similarities, and differences can be seen. Evolutionary relationships can be seen via viewing Cladograms or Phylograms. Alignment scores are returned as a Percent Identity Matrix. The Percent Identity value for a given pairwise comparison will be the data you want to obtain from this analysis.
Multiple alignments of protein sequences are important tools in studying sequences and understanding evolutionary relationships. The basic information they provide is identification of conserved sequence regions. This is very useful in designing experiments to test and modify the function of specific proteins, in predicting the function and structure of proteins, and in identifying new members of protein families.
Sequences can be aligned across their entire length (global alignment) or only in certain regions (local alignment). This is true for pair‐wise and multiple alignments. Global alignments need to use gaps (representing insertions/deletions) while local alignments can avoid them, aligning regions between gaps. The alignment is progressive and considers the sequence redundancy. Phylogenetic trees can also be calculated from multiple alignments. The program has some adjustable parameters with reasonable defaults.
Bio 242 | Cellular and Molecular Biology
Page 13 of 28 Bioinformatics Tutorial (rev. 10‐2016)
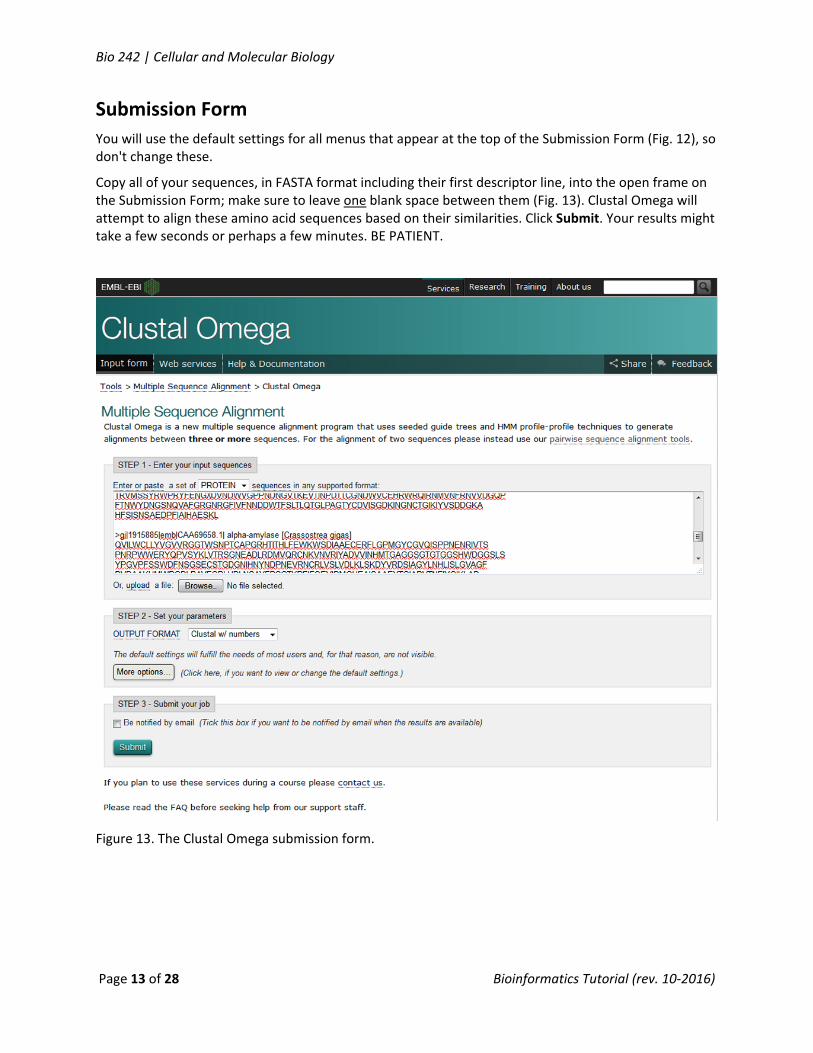
Submission Form
You will use the default settings for all menus that appear at the top of the Submission Form (Fig. 12), so don't change these.
Copy all of your sequences, in FASTA format including their first descriptor line, into the open frame on the Submission Form; make sure to leave one blank space between them (Fig. 13). Clustal Omega will attempt to align these amino acid sequences based on their similarities. Click Submit. Your results might take a few seconds or perhaps a few minutes. BE PATIENT.
Figure 13. The Clustal Omega submission form.
Bio 242 | Cellular and Molecular Biology
Page 14 of 28 Bioinformatics Tutorial (rev. 10‐2016)
Alignment Results
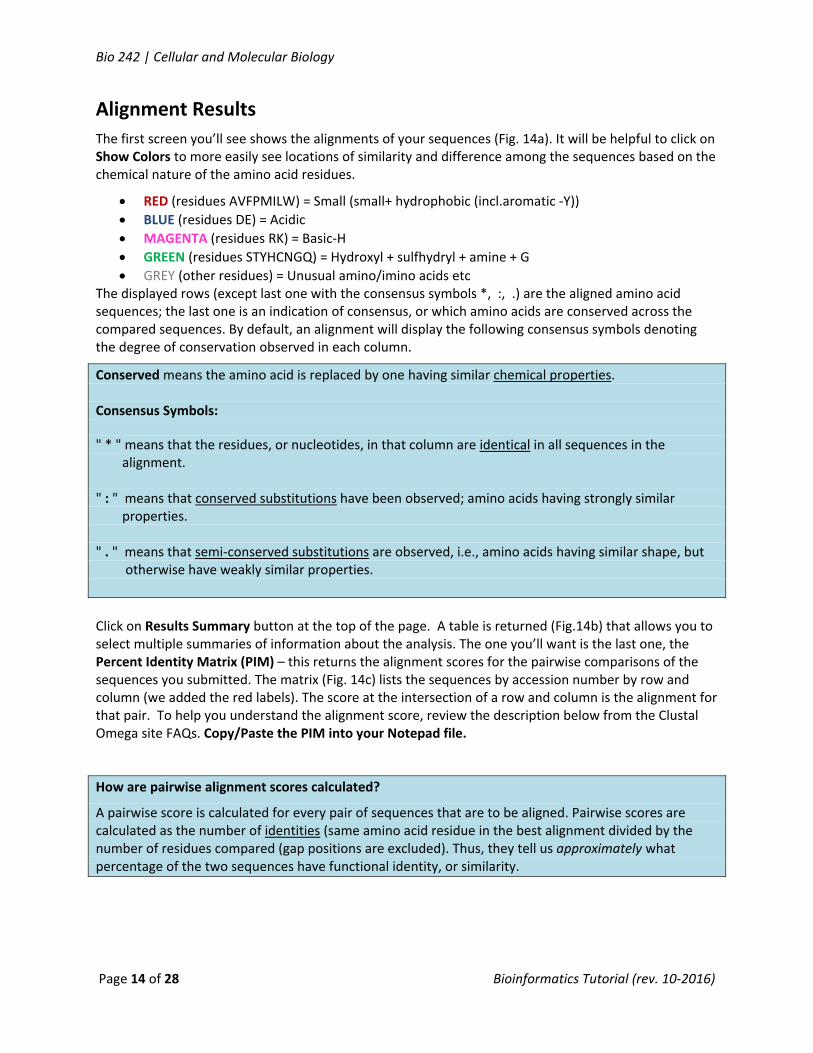
The first screen you’ll see shows the alignments of your sequences (Fig. 14a). It will be helpful to click on Show Colors to more easily see locations of similarity and difference among the sequences based on the chemical nature of the amino acid residues.
RED (residues AVFPMILW) = Small (small+ hydrophobic (incl.aromatic ‐Y))
BLUE (residues DE) = Acidic
MAGENTA (residues RK) = Basic‐H
GREEN (residues STYHCNGQ) = Hydroxyl + sulfhydryl + amine + G
GREY (other residues) = Unusual amino/imino acids etc The displayed rows (except last one with the consensus symbols *, :, .) are the aligned amino acid sequences; the last one is an indication of consensus, or which amino acids are conserved across the compared sequences. By default, an alignment will display the following consensus symbols denoting the degree of conservation observed in each column.
Conserved means the amino acid is replaced by one having similar chemical properties. Consensus Symbols:
" * " means that the residues, or nucleotides, in that column are identical in all sequences in the alignment. " : " means that conserved substitutions have been observed; amino acids having strongly similar properties. " . " means that semi‐conserved substitutions are observed, i.e., amino acids having similar shape, but otherwise have weakly similar properties.
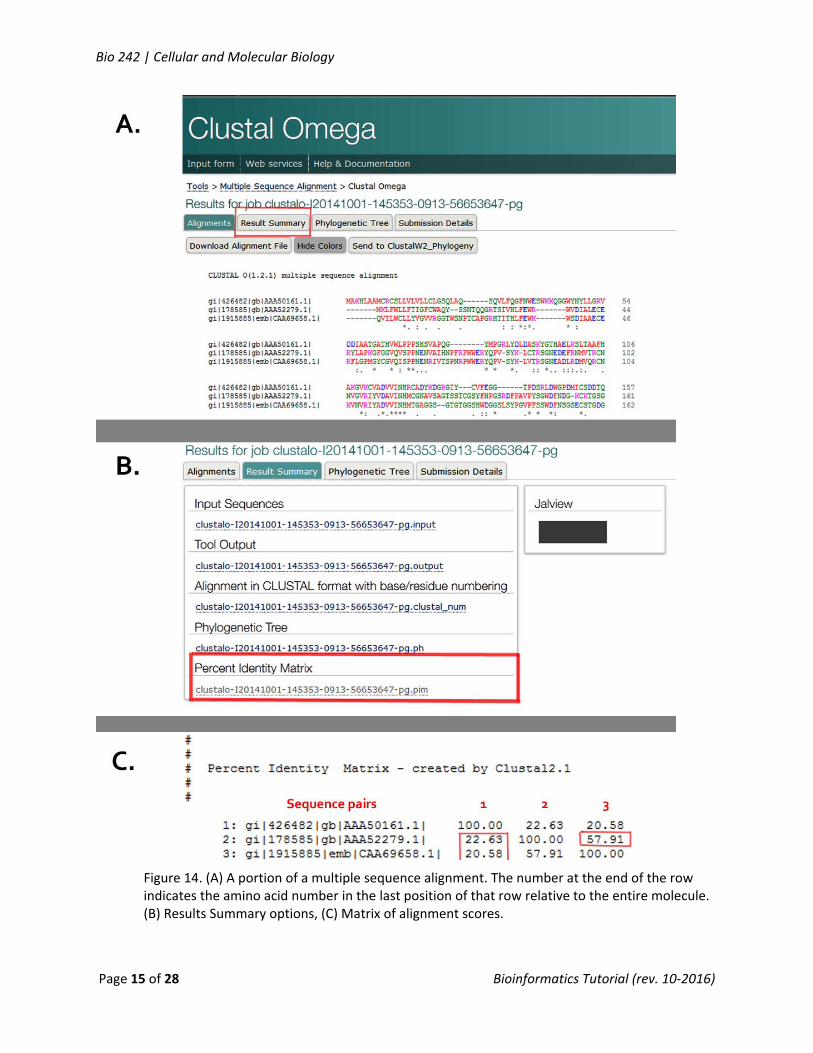
Click on Results Summary button at the top of the page. A table is returned (Fig.14b) that allows you to select multiple summaries of information about the analysis. The one you’ll want is the last one, the Percent Identity Matrix (PIM) – this returns the alignment scores for the pairwise comparisons of the sequences you submitted. The matrix (Fig. 14c) lists the sequences by accession number by row and column (we added the red labels). The score at the intersection of a row and column is the alignment for that pair. To help you understand the alignment score, review the description below from the Clustal Omega site FAQs. Copy/Paste the PIM into your Notepad file.
How are pairwise alignment scores calculated?
A pairwise score is calculated for every pair of sequences that are to be aligned. Pairwise scores are calculated as the number of identities (same amino acid residue in the best alignment divided by the number of residues compared (gap positions are excluded). Thus, they tell us approximately what percentage of the two sequences have functional identity, or similarity.
Bio 242 | Cellular and Molecular Biology
Page 15 of 28 Bioinformatics Tutorial (rev. 10‐2016)
Figure 14. (A) A portion of a multiple sequence alignment. The number at the end of the row indicates the amino acid number in the last position of that row relative to the entire molecule. (B) Results Summary options, (C) Matrix of alignment scores.

Bio 242 | Cellular and Molecular Biology
Page 16 of 28 Bioinformatics Tutorial (rev. 10‐2016)
Be sure to copy the alignments output and matrix scores results to your Notepad file. Look through the entire sequence to look for areas of similarity.
How much is there? Can you guess why clam/oyster and human sequences did not appear in the BLAST search with corn alpha‐amylase?
Compare each pair of sequences to see which ones are most similar. You might need to re‐run ClustalW2 with the different pairs to most efficiently determine this.
Are there any areas of the sequence that you expect to be more similar between species than others (i.e., the active site)? The parts of the sequence with the most identity are likely parts of the active site. How are they distributed along the sequence? How can you explain their distribution?
If you don’t know where the important functional domains are, you should run a search of the literature in PubMed to find out. Simply click on the NCBI icon on the active web page and choose PubMed.
Protein Structures ‐ Conserved Domain Database (CDD)
Since you found that there are few similarities in the amino acid sequences for alpha amylase in the three organisms, how do we account for them being functionally similar? We need to take one more step and examine the three dimensional structure of the enzymes. You can use tools on the NCBI website for this as well.
1. Open the NCBI main page (Fig. 14). Click on Domains and Structure on the left hand menu bar, and then select Conserved Domain Database (CDD) under the resource tab.
Figure 14. NCBI website homepage.
2. On the CDD database page, click on "CD‐Search" (Fig. 15).

Bio 242 | Cellular and Molecular Biology
Page 17 of 28 Bioinformatics Tutorial (rev. 10‐2016)
Figure 15. Conserved Domain Database entry page.
3. Type (or paste) the accession number for human salivary alpha amylase into the big center search window (Fig. 16). Use the default settings as presented. Click on the SUBMIT button.
Figure 16. Conserved domain query submission page.
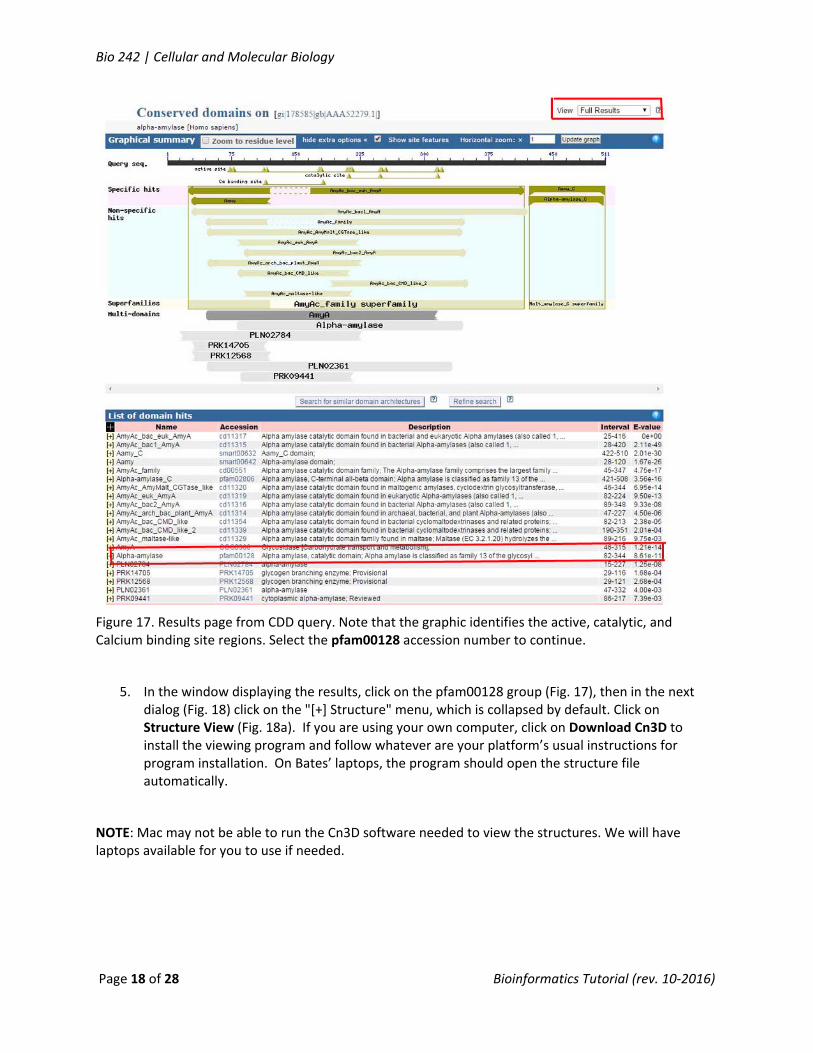
4. The results window should confirm that this sequence is for alpha amylase. Click on SEARCH FOR SIMILAR DOMAIN ARCHITECTURE (Fig. 17).
Bio 242 | Cellular and Molecular Biology
Page 18 of 28 Bioinformatics Tutorial (rev. 10‐2016)
Figure 17. Results page from CDD query. Note that the graphic identifies the active, catalytic, and Calcium binding site regions. Select the pfam00128 accession number to continue.
5. In the window displaying the results, click on the pfam00128 group (Fig. 17), then in the next dialog (Fig. 18) click on the "[+] Structure" menu, which is collapsed by default. Click on Structure View (Fig. 18a). If you are using your own computer, click on Download Cn3D to install the viewing program and follow whatever are your platform’s usual instructions for program installation. On Bates’ laptops, the program should open the structure file automatically.
NOTE: Mac may not be able to run the Cn3D software needed to view the structures. We will have laptops available for you to use if needed.

Bio 242 | Cellular and Molecular Biology
Page 19 of 28 Bioinformatics Tutorial (rev. 10‐2016)
A. B.
Figure 18. Accessing the Cn3D display program.
6. The Cn3D application will open enabling you to see the structure of your protein (Fig. 19). You can rotate the 3‐D structure by dragging it with your mouse. The catalytic active region is shown in red.
The alpha‐amylase molecule displayed is a consensus structure representing ALL alpha amylases across taxa, not one from a particular species. In Fig. 19 the molecule is positioned to show the catalytic site in the upper right; it appears as a v‐shaped groove on one side of the molecule. In the bottom of the V a starch molecule is shown as it would be oriented in the active site.
Figure 19. 3D rendering of the human salivary amylase molecule.
7. The color key of the image in Fig. 19 matches the amino acid sequence information (Fig. 20) in the window that appears below the 3‐D representation of your protein. The first row is the query sequence. If you select a portion of the sequence by dragging the mouse, it will be highlight in yellow of the model. The same works for individual residues.

Bio 242 | Cellular and Molecular Biology
Page 20 of 28 Bioinformatics Tutorial (rev. 10‐2016)
Figure 20. Amino acid sequences of pfam00128 amylases. The first row is the query sequence.
8. Change the display format of Cn3D by selecting Style –> Rendering Shortcuts –> Worms (Fig. 21). Now you should be able to rotate the structure to clearly see the α/β barrel site in the center of the molecule. If need be, rotate the molecule to see the “hole” through the molecule formed by the barrel.
Figure 21. Commands to change the rendering style of the 3d model.
Protein Structures: Comparisons
Now that you know what the catalytic site looks like, you can search for the 3D structure of the specific enzymes used in this study and see how they compare. We’ll start with the human salivary amylase. Unfortunately, there are no structure models for either corn or clams in the database, but there is one for barley, another grain. Before viewing the structure of the barley enzyme, look at your Clustal Omega PIM results and compare the barley and corn sequences to determine if this substitute is valid.
1. Close the CDD windows and return to the main NCBI website by clicking the NCBI logo in the upper left corner.
2. Click on STRUCTURE in the drop down menu by the search window at the top of the page.
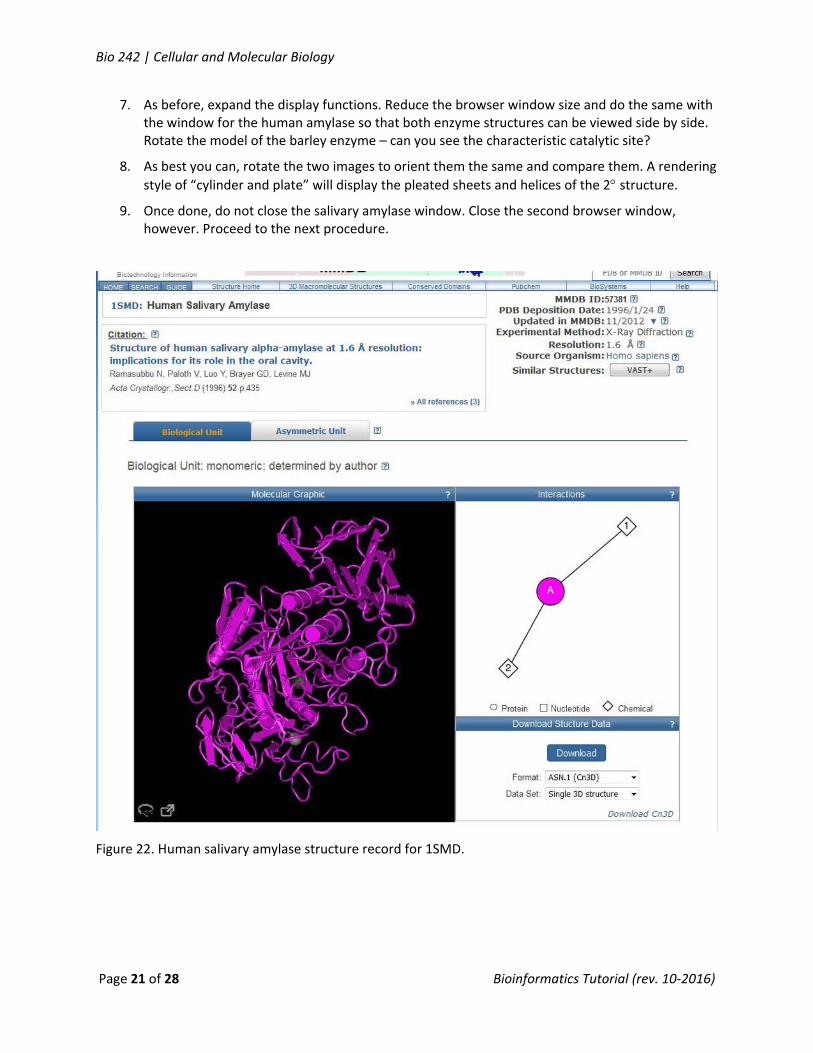
3. At the Structure Search Entrez, enter “1SMD” (=human salivary amylase) and click Search.
4. Rotate the model of the enzyme – can you see the characteristic catalytic site? To access the full function of the viewer, click on the expand window icon in the lower left of the image window.
5. This site does not show the catalytic site in red, but you can select a section of the sequence in the right hand window, and it will also be highlighted on the model. You can use this attribute when comparing two amylases to help achieve the same orientation.
6. Now, open a new browser by right mouse clicking on the browser icon on your taskbar or desktop and selecting the browser name. Enter the NCBI website URL. Select STRUCTURE, enter “1RPK” (= barley alpha amylase) in the search window and click Search.
Bio 242 | Cellular and Molecular Biology
Page 21 of 28 Bioinformatics Tutorial (rev. 10‐2016)
7. As before, expand the display functions. Reduce the browser window size and do the same with the window for the human amylase so that both enzyme structures can be viewed side by side. Rotate the model of the barley enzyme – can you see the characteristic catalytic site?
8. As best you can, rotate the two images to orient them the same and compare them. A rendering
style of “cylinder and plate” will display the pleated sheets and helices of the 2 structure.
9. Once done, do not close the salivary amylase window. Close the second browser window, however. Proceed to the next procedure.
Figure 22. Human salivary amylase structure record for 1SMD.

Bio 242 | Cellular and Molecular Biology
Page 22 of 28 Bioinformatics Tutorial (rev. 10‐2016)
Comparing 3D Structures with VAST (now this IS cool!!)
While Cn3D does fine with single structures, it's even better suited to displaying structure alignments of multiple proteins, i.e., it enables you to superimpose 3‐D structure on top of each other such that differences in structure are readily apparent. NCBI creates and maintains a database of such alignments, called VAST (Vector Alignment Search Tool), for all pairs of proteins from MMDB whose structures have some similar core regions. The VAST tool does two things for each related pair: it calculates an optimal 3‐D superimposition for the conserved core, and constructs a sequence alignment based on the correlation of the 3‐D structures.
1. If you have the human salivary amylase (1SMD) still open, return to the Structure Summary page
and then go to step 3. If not, from the NCBI home page, choose the Structure database.
2. Search for 1SMD.
3. When you select 1SMD, you should get the Structure Summary page (Fig. 23).
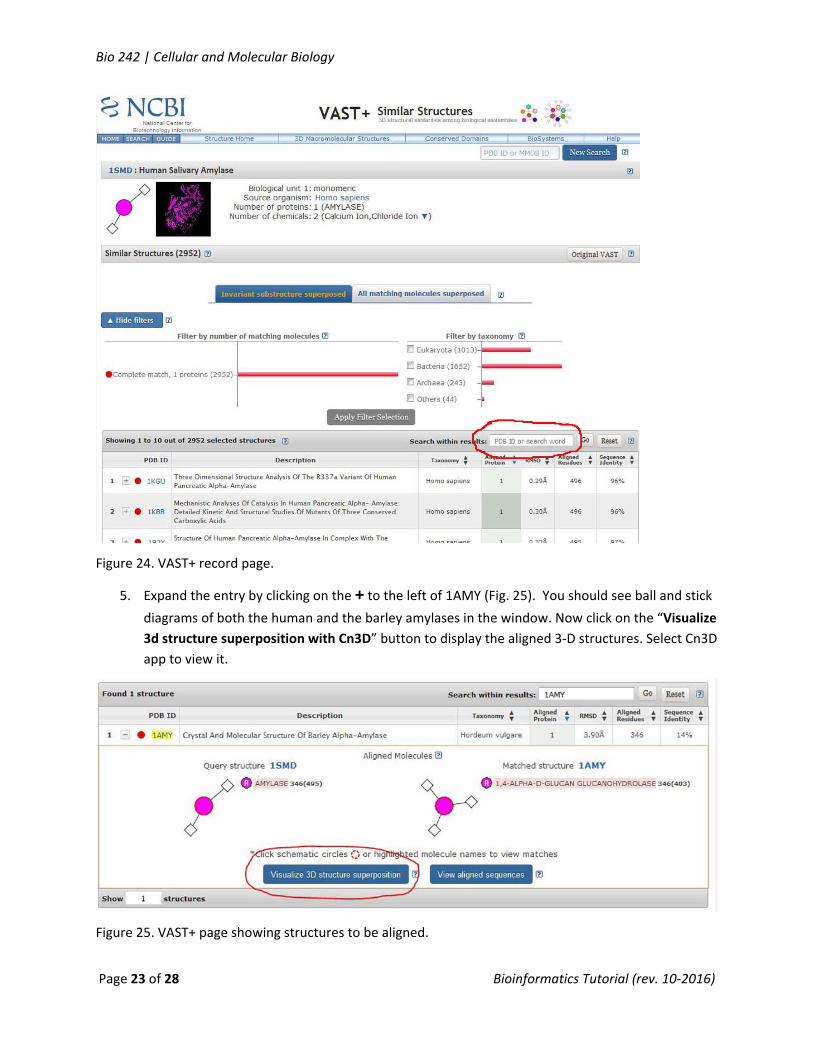
4. To compare this structure with other molecules, click the VAST+ button on the right. You now
have a list of similar structures. Find the structure for barley alpha amylase (1AMY) by entering
1AMY for the PDB ID and click “Search within Results” button (Fig. 24).
Figure 23. Structure Summary page.
Bio 242 | Cellular and Molecular Biology
Page 23 of 28 Bioinformatics Tutorial (rev. 10‐2016)
Figure 24. VAST+ record page.
5. Expand the entry by clicking on the + to the left of 1AMY (Fig. 25). You should see ball and stick
diagrams of both the human and the barley amylases in the window. Now click on the “Visualize
3d structure superposition with Cn3D” button to display the aligned 3‐D structures. Select Cn3D
app to view it.
Figure 25. VAST+ page showing structures to be aligned.
Bio 242 | Cellular and Molecular Biology
Page 24 of 28 Bioinformatics Tutorial (rev. 10‐2016)
6. The default coloring for structure alignments in Cn3D uses magenta and blue for the regions
aligned by the VAST algorithm, where residues aligned in 3‐D space are magenta, and different
residues are blue; unaligned regions are colored gray. Note that because of the way VAST works,
the aligned regions tend to correspond to individual or groups of consecutive secondary
structure elements ‐ helices and strands, while the loops outside the core vary in length and
orientation and are often left unaligned.
7. There are some important differences between structure‐based alignments in Cn3D and
sequence alignments from common algorithms like BLAST or Clustal Omega, both in the display
and the underlying alignment data. In a structure alignment (e.g. from VAST), one residue is
aligned with another because their alpha carbons are nearby in space, not because of the
residue identity.
8. Try aligning a molecule that is very similar to human alpha‐amylase – porcine alpha‐amylase.
Search for the PDP ID = 1PIF instead of the barley.
9. Alteromonas halopanctis, the cold‐adapted marine organism that Feller, et. al., wrote about is in the VAST results too – search for PDP ID = 1AQH.
CITING REFERENCES RELATED TO BIOINFORMATICS INFORMATION IN YOUR PAPER
When using Clustal Omega to compare sequences, your citations are in two parts:
In your Methods, when you say that you compared protein sequences using Clustal Omega, cite the creators of the program just as you would cite it in any other section of your paper. The citations (both are required by EMBL) in your Literature Cited list then is:
Sievers, F, Wilm, A, Dineen, DG, Gibson, TJ, Karplus, K, Li, W, Lopez, R, McWilliam, H, Remmert, M, Söding, J, Thompson, JD, and D Higgins. Fast, scalable generation of high‐quality protein multiple sequence alignments using Clustal Omega. Molecular Systems Biology 7 Article number: 539
Goujon, M, McWilliam, H, Li, W, Valentin, F, Squizzato, S, Paern, J, and R Lopez. 2010. A new bioinformatics analysis tools framework at EMBL‐EBI. Nucleic Acids Research 38 Suppl: W695‐9
Also, in your Methods, for each sequence you used, give the accession number of the sequence and cite the paper/researchers who submitted that sequence to NCBI. For instance, for the corn sequence below the accession number is AAA50161 and the citation in your text is (Young et. al. 1994). The citation in your Literature Cited section would be:
Young, T.E., DeMason, D.A., Close 1994. Cloning of an alpha‐amylase cDNA from aleurone tissue of germinating maize seed. Plant Physiol. 105(2), 759‐760.
Bio 242 | Cellular and Molecular Biology
Page 25 of 28 Bioinformatics Tutorial (rev. 10‐2016)
Glossary
Alignment
The process of lining up two or more sequences to achieve maximal levels of identity (and conservation, in the case of amino acid sequences) for the purpose of assessing the degree of similarity and the possibility of homology.
Algorithm
A fixed procedure embodied in a computer program.
Bioinformatics
The merger of biotechnology and information technology with the goal of revealing new insights and principles in biology.
Bit score
The value S' is derived from the raw alignment score S in which the statistical properties of the scoring system used have been taken into account. Because bit scores have been normalized with respect to the scoring system, they can be used to compare alignment scores from different searches.
BLAST
Basic Local Alignment Search Tool. (Altschul et al.) A sequence comparison algorithm optimized for speed used to search sequence databases for optimal local alignments to a query. The initial search is done for a word of length "W" that scores at least "T" when compared to the query using a substitution matrix. Word hits are then extended in either direction in an attempt to generate an alignment with a score exceeding the threshold of "S". The "T" parameter dictates the speed and sensitivity of the search. For additional details, see one of the BLAST tutorials (Query or BLAST) or the narrative guide to BLAST.
BLOSUM
Blocks Substitution Matrix. A substitution matrix in which scores for each position are derived from observations of the frequencies of substitutions in blocks of local alignments in related proteins. Each matrix is tailored to a particular evolutionary distance. In the BLOSUM62 matrix, for example, the alignment from which scores were derived was created using sequences sharing no more than 62% identity. Sequences more identical than 62% are represented by a single sequence in the alignment so as to avoid over‐weighting closely related family members. (Henikoff and Henikoff)
Conservation
Changes at a specific position of an amino acid or (less commonly, DNA) sequence that preserve the physico‐chemical properties of the original residue.
Domain
A discrete portion of a protein assumed to fold independently of the rest of the protein and possessing its own function.
Bio 242 | Cellular and Molecular Biology
Page 26 of 28 Bioinformatics Tutorial (rev. 10‐2016)
DUST
A program for filtering low complexity regions from nucleic acid sequences.
E value
Expectation value. The number of different alignments with scores equivalent to or better than S that are expected to occur in a database search by chance. The lower the E value, the more significant the score.
FASTA
The first widely used algorithm for database similarity searching. The program looks for optimal local alignments by scanning the sequence for small matches called "words". Initially, the scores of segments in which there are multiple word hits are calculated ("init1"). Later the scores of several segments may be summed to generate an "initn" score. An optimized alignment that includes gaps is shown in the output as "opt". The sensitivity and speed of the search are inversely related and controlled by the "k‐tup" variable which specifies the size of a "word". (Pearson and Lipman)
Filtering
Also known as Masking. The process of hiding regions of (nucleic acid or amino acid) sequence having characteristics that frequently lead to spurious high scores. See SEG and DUST.
Gap
A space introduced into an alignment to compensate for insertions and deletions in one sequence relative to another. To prevent the accumulation of too many gaps in an alignment, introduction of a gap causes the deduction of a fixed amount (the gap score) from the alignment score. Extension of the gap to encompass additional nucleotides or amino acid is also penalized in the scoring of an alignment.
Global Alignment
The alignment of two nucleic acid or protein sequences over their entire length.
H
H is the relative entropy of the target and background residue frequencies. (Karlin and Altschul, 1990). H can be thought of as a measure of the average information (in bits) available per position that distinguishes an alignment from chance. At high values of H, short alignments can be distinguished by chance, whereas at lower H values, a longer alignment may be necessary. (Altschul, 1991)
Homology
Similarity attributed to descent from a common ancestor.
HSP
High‐scoring segment pair. Local alignments with no gaps that achieve one of the top alignment scores in a given search.
Identity
The extent to which two (nucleotide or amino acid) sequences are invariant.
Bio 242 | Cellular and Molecular Biology
Page 27 of 28 Bioinformatics Tutorial (rev. 10‐2016)
K
A statistical parameter used in calculating BLAST scores that can be thought of as a natural scale for search space size. The value K is used in converting a raw score (S) to a bit score (S').
Lambda
A statistical parameter used in calculating BLAST scores that can be thought of as a natural scale for scoring system. The value lambda is used in converting a raw score (S) to a bit score (S').
Local Alignment
The alignment of some portion of two nucleic acid or protein sequences
Low Complexity Region (LCR)
Regions of biased composition including homopolymeric runs, short‐period repeats, and more subtle overrepresentation of one or a few residues. The SEG program is used to mask or filter LCRs in amino acid queries. The DUST program is used to mask or filter LCRs in nucleic acid queries.
Masking
Also known as Filtering. The removal of repeated or low complexity regions from a sequence in order to improve the sensitivity of sequence similarity searches performed with that sequence.
Motif
A short conserved region in a protein sequence. Motifs are frequently highly conserved parts of domains.
Multiple Sequence Alignment
An alignment of three or more sequences with gaps inserted in the sequences such that residues with common structural positions and/or ancestral residues are aligned in the same column. Clustal W is one of the most widely used multiple sequence alignment programs
Optimal Alignment
An alignment of two sequences with the highest possible score.
Orthologous
Homologous sequences in different species that arose from a common ancestral gene during speciation; may or may not be responsible for a similar function.
P value
The probability of an alignment occurring with the score in question or better. The p value is calculated by relating the observed alignment score, S, to the expected distribution of HSP scores from comparisons of random sequences of the same length and composition as the query to the database. The most highly significant P values will be those close to 0. P values and E values are different ways of representing the significance of the alignment.
PAM = Percent Accepted Mutation
A unit introduced by Dayhoff et al. to quantify the amount of evolutionary change in a protein sequence. 1.0 PAM unit, is the amount of evolution which will change, on average, 1% of amino acids in a protein sequence. A PAM(x) substitution matrix is a look‐up table in which scores for
Bio 242 | Cellular and Molecular Biology
Page 28 of 28 Bioinformatics Tutorial (rev. 10‐2016)
each amino acid substitution have been calculated based on the frequency of that substitution in closely related proteins that have experienced a certain amount (x) of evolutionary divergence.
Paralogous
Homologous sequences within a single species that arose by gene duplication.
Profile
A table that lists the frequencies of each amino acid in each position of protein sequence. Frequencies are calculated from multiple alignments of sequences containing a domain of interest. See also PSSM.
Proteomics
The systematic analysis of protein expression in normal and diseased tissues that involves the separation, identification, and characterization of all of the proteins in an organism.
PSI‐BLAST ‐ Position‐Specific Iterative BLAST
An iterative search using the BLAST algorithm. A profile is built after the initial search, which is then used in subsequent searches. The process may be repeated, if desired with new sequences found in each cycle used to refine the profile. Details can be found in this discussion of PSI‐BLAST. (Altschul et al.)
PSSM = Position‐specific scoring matrix
The PSSM gives the log‐odds score for finding a particular matching amino acid in a target sequence.
Query The input sequence (or other type of search term) with which all of the entries in a database are to be compared.
VAST Vector Alignment Search Tool. A tool that enables superimposition of multiple 3d structures. The VAST tool does two things for each related pair: it calculates an optimal 3‐D superimposition for the conserved core, and constructs a sequence alignment based on the correlation of the 3‐D structures.