Embed Size (px)
Citation preview

BioinformaticsBioinformatics
GIS ApplicationsGIS Applications
Anatoly PetrovAnatoly Petrov

BioinformaticsBioinformatics
(in a strict sense) a branch of science dealing with storage, (in a strict sense) a branch of science dealing with storage, retrieval and analysis or prediction of the composition or retrieval and analysis or prediction of the composition or the structure of biomoleculesthe structure of biomolecules ((sequence analysissequence analysis))
- nucleic acids (DNA, RNA) - - nucleic acids (DNA, RNA) - genomicsgenomics
- proteins -- proteins - proteomics proteomics
(in a wider sense) the intersection of biology and computer (in a wider sense) the intersection of biology and computer science (eg., computational biogeography)science (eg., computational biogeography)
Bioinformatics Institute (VBI) sponsored a major conference focused on
the interface between GIS and bioinformatics: “GIS
Applications to Bioinformatics” (May 16–17, 2001, Blacksburg, Virginia).

A Gene Map of the Human GenomeA Gene Map of the Human Genome
The Human Transcript Map
Chromosome X

3-dimentional reconstructionof the amicyanin -
an enzyme participatingin respiration

Chromosome structureChromosome structure
Chromosomal DNA is packaged into a compact structure with the help of specialized proteins called histones. The fundamental packing unit is known as a nucleosome. Sequence features that appear to be spatially disconnected according to a linear representation of a genome, may actually be close neighbors due to the folding of DNA into a 3-dimensional molecule.
Nucleosome

GenoSIS - GenoSIS - Genome Spatial Information Genome Spatial Information System System
Applications:Applications: - thematic mapping and visualizationthematic mapping and visualization- exploratory spatial data analysisexploratory spatial data analysis
(ESDA)(ESDA)
(ESRI ArcGIS – visualization tool +Oracle Spatial – object-relational database)
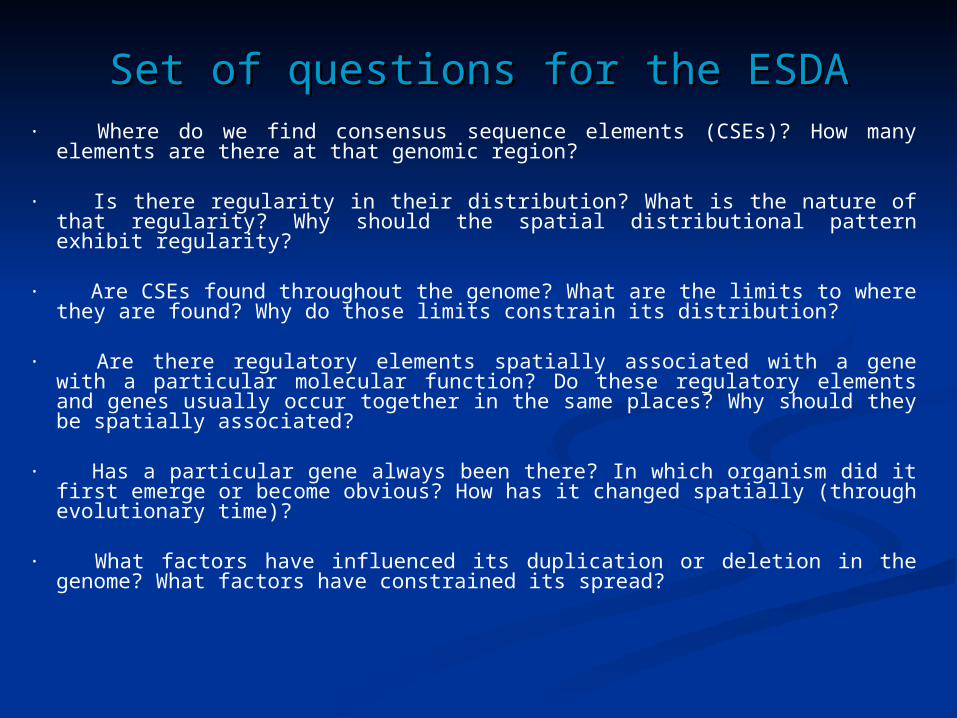
Set of questions for the ESDASet of questions for the ESDA· Where do we find consensus sequence elements (CSEs)? How many
elements are there at that genomic region?
· Is there regularity in their distribution? What is the nature of that regularity? Why should the spatial distributional pattern exhibit regularity?
· Are CSEs found throughout the genome? What are the limits to where they are found? Why do those limits constrain its distribution?
· Are there regulatory elements spatially associated with a gene with a particular molecular function? Do these regulatory elements and genes usually occur together in the same places? Why should they be spatially associated?
· Has a particular gene always been there? In which organism did it first emerge or become obvious? How has it changed spatially (through evolutionary time)?
· What factors have influenced its duplication or deletion in the genome? What factors have constrained its spread?
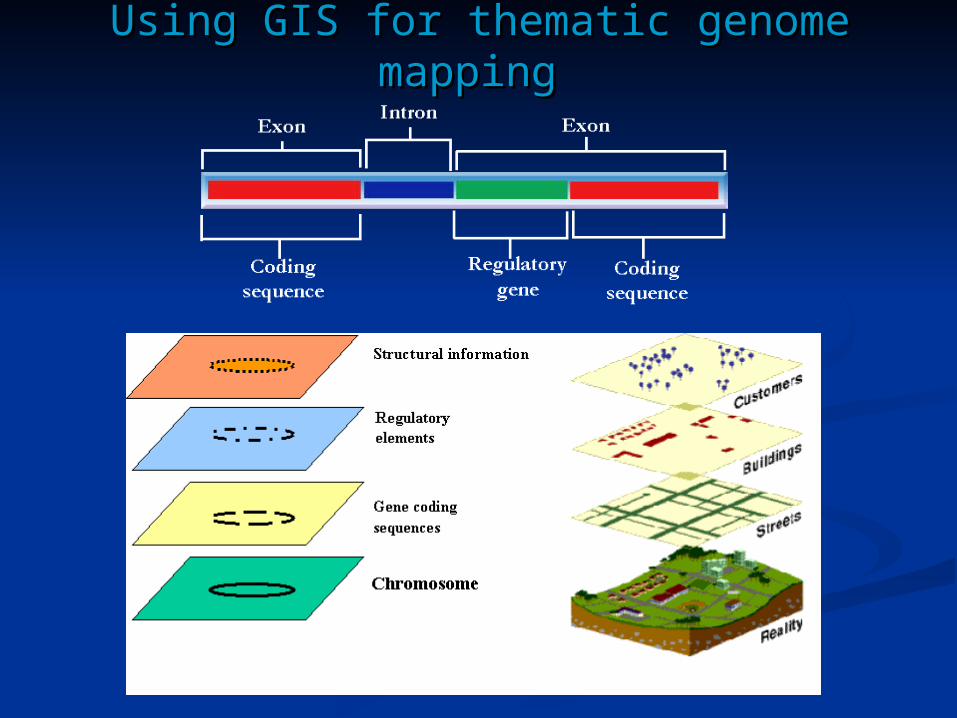
Using GIS for thematic genome Using GIS for thematic genome mapping mapping
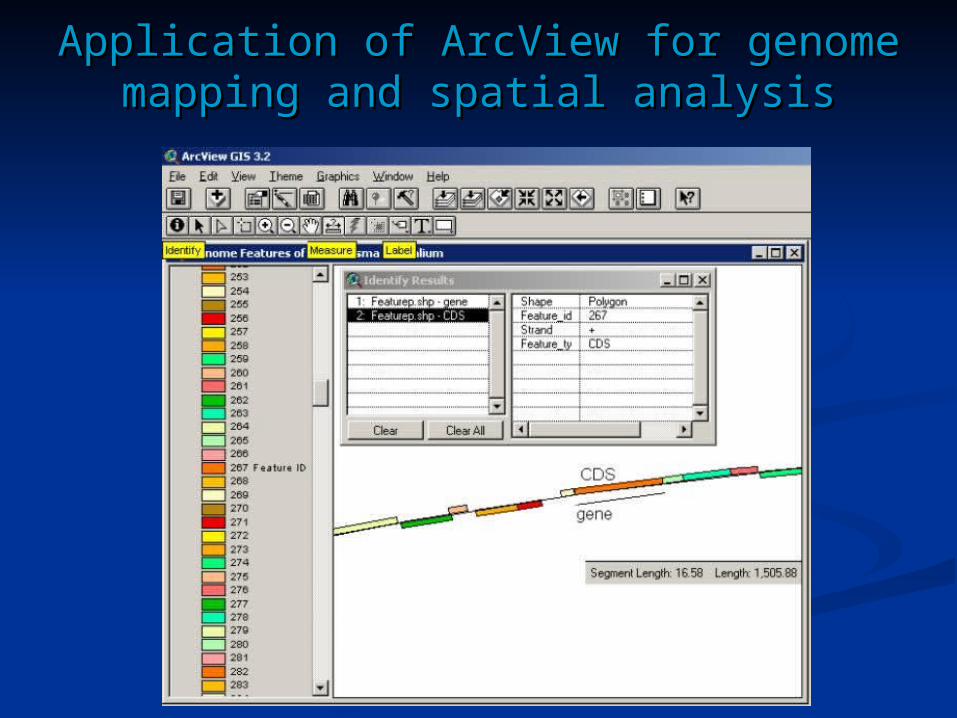
Application of ArcView for genome Application of ArcView for genome mapping and spatial analysismapping and spatial analysis
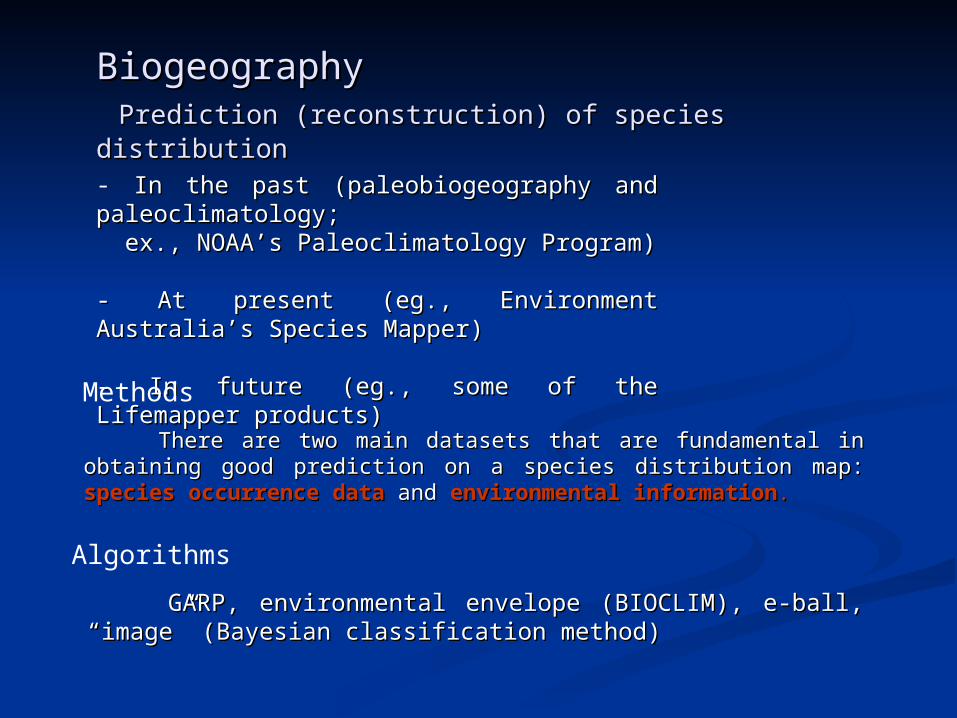
Biogeography Biogeography Prediction (reconstruction) of species distributionPrediction (reconstruction) of species distribution
TherThere are two main datasets that are fundamental in obtaining e are two main datasets that are fundamental in obtaining good prediction on a species distribution map: good prediction on a species distribution map: species species occurrence dataoccurrence data and and environmental informationenvironmental information..
- In the past (paleobiogeography and In the past (paleobiogeography and paleoclimatology; paleoclimatology; ex., NOAA’s Paleoclimatology Program)ex., NOAA’s Paleoclimatology Program)
- At present (eg., Environment Australia’s - At present (eg., Environment Australia’s Species Mapper)Species Mapper)
- In future (eg., some of the Lifemapper - In future (eg., some of the Lifemapper products)products)
Methods
Algorithms
GARP, environmental envelope (BIOCLIM), e-ball, “image” GARP, environmental envelope (BIOCLIM), e-ball, “image” (Bayesian classification method)(Bayesian classification method)

Habitat Digitizer ExtensionHabitat Digitizer Extension(HDE) to ArcView(HDE) to ArcView
useusess a hierarchical classification scheme a hierarchical classification scheme to delineateto delineate habitats by visually habitats by visually interpreting georeferencedinterpreting georeferenced images such images such as aerial photographs, satellite images,as aerial photographs, satellite images, and side scan sonar. and side scan sonar.

HDE HDE allows users to create custom classification allows users to create custom classification schemes and rapidly delineate and attribute polygons schemes and rapidly delineate and attribute polygons
using simple menus. using simple menus.

Deducing potential species distributionDeducing potential species distribution using BIOCLIMusing BIOCLIM
Query database to retrieve records ofQuery database to retrieve records of species locations.species locations. For each species location, interpolateFor each species location, interpolate values of essential climatic variables.values of essential climatic variables. Calculate the climatic envelope boundingCalculate the climatic envelope bounding all the species records.all the species records. At the resolution specified, identify allAt the resolution specified, identify all other sites in the landscape that fall other sites in the landscape that fall within the climatic envelope.within the climatic envelope. Plot the sites identified on a base map.Plot the sites identified on a base map.
Deliver the map to the user.Deliver the map to the user.
Environment Australia’s Species Mapper

LifemapperLifemapper
1. The species occurrence data is gathered from a number of biological collections housed at several museums and herbaria worldwide. Those institutions have their specimen databases linked and integrated through The Species Analyst project.
2. The environmental information is represented as a set of geographic layers. Each layer displays one particular environmental parameter, such as temperature, rainfall, land use, elevation, among others.
3. Using data from those two datasets, GARP tries to find nonrandom correlations between species occurrence data and the values of the environmental parameters where the species occur or do not occur.
G GeneticA Algorithm forR Ruleset P Production

PaleobiogeographyPaleobiogeography
Holocene Holocene Evolution of the Evolution of the Southern Southern Washington and Washington and Northern Oregon Northern Oregon Shelf and CoastShelf and Coast..
3-D Flythroughanimation
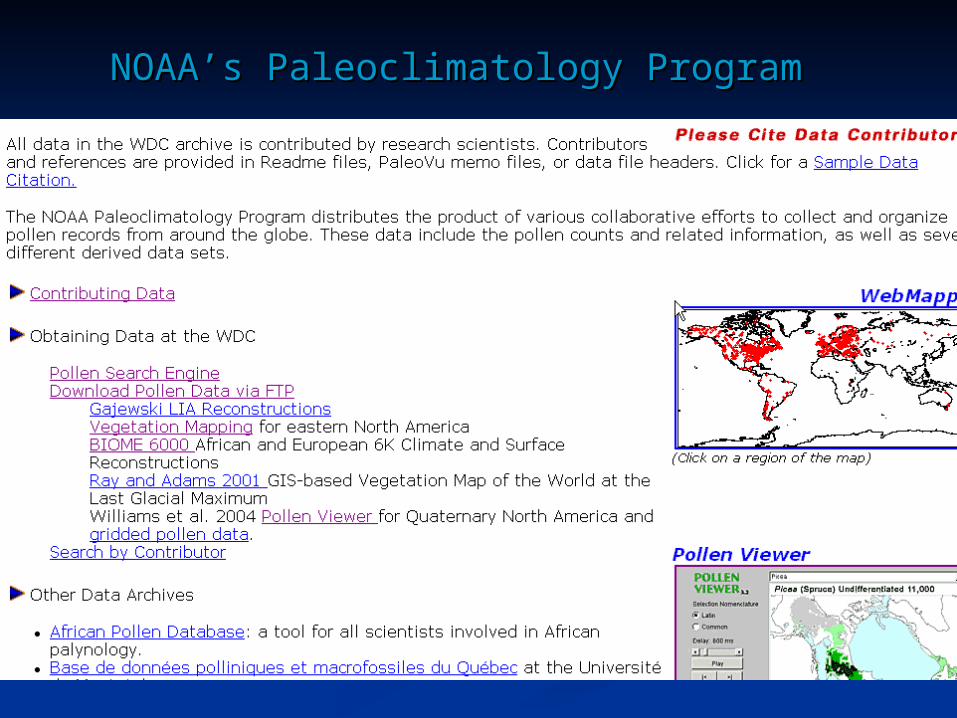
NOAA’s Paleoclimatology ProgramNOAA’s Paleoclimatology Program
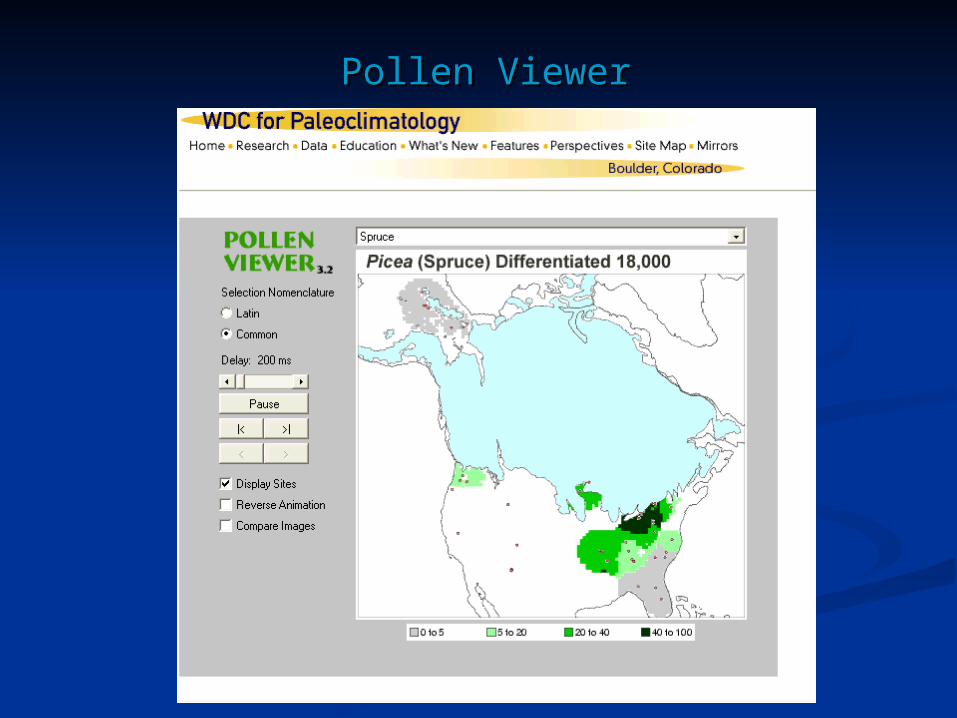
Pollen ViewerPollen Viewer

THE ENDTHE END