Embed Size (px)
Citation preview

Biogeosciences, 10, 6419–6432, 2013www.biogeosciences.net/10/6419/2013/doi:10.5194/bg-10-6419-2013© Author(s) 2013. CC Attribution 3.0 License.
Biogeosciences
Open A
ccess
Impact of the Kuroshio intrusion on the nutrient inventory in theupper northern South China Sea: insights from an isopycnalmixing model
C. Du1, Z. Liu 1, M. Dai1, S.-J. Kao1, Z. Cao1, Y. Zhang2, T. Huang1, L. Wang1, and Y. Li1
1State Key Laboratory of Marine Environmental Science, Xiamen University, Xiamen 361005, China2Key Laboratory of Coastal Zone Environmental Processes, Yantai Institute of Coastal Zone Research, Chinese Academy ofSciences, Yantai 264003, China
Correspondence to:M. Dai ([email protected])
Received: 29 March 2013 – Published in Biogeosciences Discuss.: 18 April 2013Revised: 17 August 2013 – Accepted: 29 August 2013 – Published: 10 October 2013
Abstract. Based on four cruises covering a seasonal cy-cle in 2009–2011, we examined the impact of the Kuroshiointrusion, featured by extremely oligotrophic waters, onthe nutrient inventory in the central northern South ChinaSea (NSCS). The nutrient inventory in the upper 100 m ofthe water column in the study area ranged from∼ 200 to∼ 290 mmol m−2 for N + N (nitrate plus nitrite), from∼ 13to ∼ 24 mmol m−2 for soluble reactive phosphate and from∼ 210 to∼ 430 mmol m−2 for silicic acid. The nutrient in-ventory showed a clear seasonal pattern with the highestvalue appearing in summer, while the N+ N inventory inspring and winter had a reduction of∼ 13 and∼ 30 %, re-spectively, relative to that in summer. To quantify the ex-tent of the Kuroshio intrusion, an isopycnal mixing modelwas adopted to derive the proportional contribution of watermasses from the SCS proper and the Kuroshio along individ-ual isopycnal surfaces. The derived mixing ratio along theisopycnal plane was then employed to predict the genuinegradients of nutrients under the assumption of no biogeo-chemical alteration. These predicted nutrient concentrations,denoted asNm, are solely determined by water mass mix-ing. Results showed that the nutrient inventory in the upper100 m of the NSCS was overall negatively correlated to theKuroshio water fraction, suggesting that the Kuroshio intru-sion significantly influenced the nutrient distribution in theSCS and its seasonal variation. The difference between theobserved nutrient concentrations and their correspondingNmallowed us to further quantify the nutrient removal/additionassociated with the biogeochemical processes on top of the
water mass mixing. We revealed that the nutrients in the up-per 100 m of the water column had a net consumption in bothwinter and spring but a net addition in fall.
1 Introduction
The major ocean basins at low latitudes are often nutrientdepleted in their upper mixed layer because strong stratifica-tion in the pycnocline diminishes nutrient supplies from thedepths through diapycnal mixing (Lewis et al., 1986). Whilecoastal oceans are typically characterized by higher nutrientconcentrations due to abundant riverine inputs at the surface(e.g., Cai et al., 2004; Chen and Chen, 2006; Han et al., 2012)and elevated supplies from the depths through processes suchas strong upwelling and/or enhanced diapycnal mixing (e.g.Bourgault et al., 2011; Gong et al., 1992; Tian et al., 2009),the deep basins of some large marginal seas in low latitudesare overall oligotrophic due partly to the year-round stratifi-cation (e.g. Thingstad et al., 2005; Wu et al., 2003). On theother hand, some marginal seas are strongly influenced by theboundary currents of the adjacent open ocean (Chen, 2008;Gordon, 1967; Huertas et al., 2012; Matsuno et al., 2009; Quet al., 2000) which are usually very oligotrophic. An exampleis the Kuroshio of the North Pacific Ocean, which is featuredby extremely low nutrients. Nutrients within the marginalseas may thus be significantly impacted by permanent or oc-casional intrusions of the boundary currents. Although theinteractions between the open oceans and the marginal seas
Published by Copernicus Publications on behalf of the European Geosciences Union.
6420 C. Du et al.: Impact of the Kuroshio intrusion on the nutrient inventory
Fig. 1. Map of the northern South China Sea (NSCS) showing its topography and the locations of the sampling stations (yellow dots). Theblue triangle indicates the focused region in which the nutrient inventory was assessed. Three meridional sections across the Luzon Strait arehighlighted with dark dotted lines (i.e., sections E4, LU5 and LU6, among which sections LU5 and LU6 were investigated only in spring2011). Also shown schematically are the Kuroshio Current and its intrusion path into the NSCS around the Luzon Strait (pink lines). TheSouth East Asian Time-series Study (SEATS) station (red triangle) is established in the central basin of the SCS, while station LU65 (greentriangle) is located in the Kuroshio travel path.
have been extensively studied in terms of their water ex-changes and the dynamic controls (e.g. Baringer et al., 1999;Chu and Li, 2000; Hu et al., 2000; Kida et al., 2009; Liang etal., 2008; Matsuno et al., 2009; Partt and Spall, 2008; Qu etal., 2000; Shaw, 1991; Tian et al., 2006), their impacts on thenutrient inventory of the marginal seas and the consequentbiogeochemical effects have rarely been examined (Huertaset al., 2012).
The South China Sea (SCS) is the largest marginal sea ofthe Pacific. The basin area of the SCS is characterized by nu-trient deficiency in its surface and thus very low primary pro-ductivity. The SCS is also under significant modulation bywater exchanges through the Luzon Strait. It is well knownthat the Kuroshio carries the most oligotrophic water of theworld’s oceans and that it intrudes into the SCS at least inwinter (e.g. Centurioni et al., 2004; Chen et al., 2001; Chuand Li, 2000; Hu et al., 2000; Qu, 1999; Qu et al., 2000).However, the impact of the Kuroshio intrusion on the up-per ocean nutrient inventory, or the depth-integrated nutrientconcentration in the SCS has rarely been assessed in a quan-titative way.
In this study, a large data set of nutrients includingN / P / Si was collected during four cruises to the northernSCS (NSCS) covering a complete seasonal cycle. The up-per 100 m nutrient inventory, which ultimately determinesthe primary productivity in each season was calculated andcompared. Moreover, an isopycnal mixing model was devel-oped to quantitatively estimate the seasonal intrusion patternof the Kuroshio to the NSCS. Based on a combination of fieldobservations and the model calculation, the Kuroshio’s influ-
ence on the upper 100 m nutrient inventory of the NSCS wasfurther quantified and the biogeochemical processes on topof the isopycnal mixing were examined.
2 Materials and methods
2.1 Study area
The seasonally reversing East Asian Monsoon drives a clock-wise circulation in summer and partially anticlockwise cir-culation during winter in the upper SCS (Wu et al., 2003).As a consequence, the interior of the SCS is effectively iso-lated from terrestrial inputs and forms a basin-wide gyre,which displays overall oligotrophic characteristics similar tothose in the major ocean basins (Gong et al., 1992). On theother hand, the SCS and the western North Pacific (wNP) ex-change their water masses via the 2200 m-deep Luzon Strait,through which the Kuroshio Branch Water intrudes from thewNP into the SCS (Chen, 2001; Chu and Li, 2000; Dai et al.,2009; Hu et al., 2000; Qu et al., 2000) (Fig. 1). It is reportedthat at the salinity maximum layer, at a depth of∼ 150 m,the Kuroshio intrudes into the SCS all year round (Qu et al.,2000).
2.2 Sampling and analyses
Field observations were carried out in summer (July–August 2009), winter (January 2009), fall (October–November 2010) and spring (May 2011). The sampling areacovered nearly the entire NSCS except in the fall cruise when
Biogeosciences, 10, 6419–6432, 2013 www.biogeosciences.net/10/6419/2013/
C. Du et al.: Impact of the Kuroshio intrusion on the nutrient inventory 6421
only the western part of the NSCS was covered due to highsea conditions. In this study, we focused on the central NSCScovering a region from 111 to 119.5◦ E and from 17.7◦ Nto roughly the 200 m isobaths in the meridional direction(Fig. 1). The total surface area of the subject zone is about2.74× 1011 m2. We excluded the shelf shallower than 200 m(Fig. 1) where the nutrient inventories are under significantinfluence of the riverine inputs.
Nutrient samples were collected with a Rosette samplerat 5, 25, 50, 75 and 100 m layer in the upper 100 m, andanalysed onboard using a Four-channel Continuous FlowTechnicon AA3 Auto-Analyzer (Bran-Lube GmbH). Thedetection limits for N+ N (nitrate plus nitrite), SRP (sol-uble reactive phosphate) and Si(OH)4 (silicic acid) were0.03 µmol L−1, 0.03 µmol L−1 and 0.05 µmol L−1, respec-tively. The analytical precision was better than±1 % forN + N, ±2 % for SRP and±2.8 % for Si(OH)4 (Han et al.,2012). In addition, SRP was determined at nanomolar lev-els in the surface waters. The SRP in the water samples waspre-concentrated as phosphomolybdenum blue into a solidphase cartridge (Waters Oasis), then eluted with sodium hy-droxide solution, and finally determined using a spectropho-tometer within a flow injection system. The detection limitof this method is 1.4 nmol L−1 and the precision is bet-ter than±5 % (Ma et al., 2008; Han et al., 2012). Depthprofiles of temperature and salinity were determined ship-board with a SBE 911 plus conductivity-temperature-depth(CTD) profiler (Sea-Bird Inc).
2.3 Estimation of the nutrient inventory
Using field measured nutrient concentrations, we estimatedboth the station-integrated and area-integrated nutrient in-ventories in the central NSCS. The former was calculatedby integrating nutrient concentrations in the upper 100 mof the water column at individual stations. The latter wasobtained by integrating the station-integrated nutrient in-ventory over the entire study area via spatial interpola-tions, for which the Inverse Distance Square method wasapplied (Lin et al., 2002).
3 Results
3.1 Hydrography
As shown in Fig. 2, the potential temperature-salinity (θ -S)distributions in the upper 400 m of the water column re-vealed a distinct hydrological difference between the centralNSCS and the Kuroshio, with the latter being indicated bydata points collected along sections LU5 and LU6. At den-sity levels of< 1025.7 kg m−3, which corresponded to thedepth of< 200 m in the NSCS and< 350 m in the Kuroshio,the Kuroshio water tended to have higher potential temper-ature and salinity than the SCS water at the same isopycnallayer. However, the pattern was reversed at greater depths
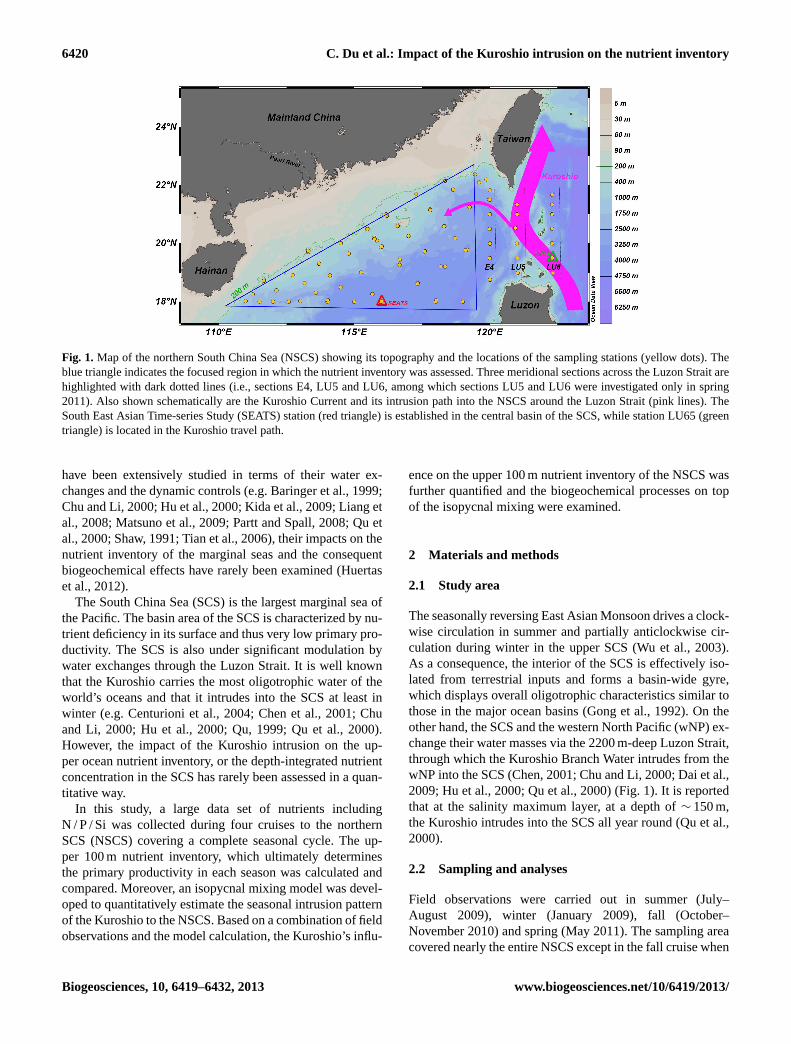
Fig. 2. Potential temperature (θ ) versus salinity (S) plots (θ -S dia-gram) in the upper 400 m of the water column for the sampling sta-tions in the central northern South China Sea (NSCS) during fourseasons and along sections LU5 and LU6 in spring. Also markedare the depths of 100 m (density 1024.2 kg m−3) and 200 m (den-sity 1025.6 kg m−3) in the central NSCS.
(Fig. 2). Among the four seasons, the summerθ-S distribu-tion pattern in the central NSCS was least close to that ofthe Kuroshio water, and the data points in the upper 200 min summer were overall less scattered relative to those dur-ing spring, fall and winter, due likely to the higher extentof the Kuroshio intrusion in the latter three seasons. At den-sity levels of> 1026.2 kg m−3 (corresponding to the depth of> 300 m in the NSCS), no significant seasonal variations ofθ-S distributions were observed in the central NSCS.
It is known that the Kuroshio intrusion can be down to400 m (Fang et al., 2009; Tian et al., 2006). We focused onthe nutrient dynamics in the upper 100 m of the central NSCSsince biological alterations of nutrients are highest in theeuphotic zone, which typically extends from the surface to∼ 100 m water depth in the SCS (Chen et al., 2008; Tseng etal., 2005) where any changes in nutrients would profoundlyresult in changes in primary productivity of the ecosystem.
3.2 Nutrient distribution in the upper 100 m of thecentral NSCS and the Kuroshio
Since the distribution patterns of N+ N, SRP and Si(OH)4were similar, we used N+ N as an example throughout thispaper unless otherwise indicated. The spatial and temporaldistributions of the iso-depth N+ N concentration are shownin Fig. 3. During spring and summer, the surface N+ N con-centration in the entire central NSCS was mostly below thedetection limit of quantification, or< 0.1 µmol L−1 (Fig. 3a,b). Similarly in fall, the surface N+ N concentrations at the
www.biogeosciences.net/10/6419/2013/ Biogeosciences, 10, 6419–6432, 2013

6422 C. Du et al.: Impact of the Kuroshio intrusion on the nutrient inventory
Fig. 3. Iso-depth distributions of N+ N (nitrate plus nitrite, µmol L−1) concentrations at depths of 5 m(A–D), 50 m(E–H) and 100 m(I–L)in the central northern South China Sea and Kuroshio during the four seasons (spring:A, E andI ; summer:B, F andJ; fall: C, J andK ;winter:D, H andL ).
majority of the sampling stations were below the detectionlimit, except at the four stations located in the central basin,which displayed a relatively high N+ N concentration of∼ 1.5 µmol L−1 (Fig. 3c). This region was characterized bylow sea surface temperature (data not shown), possibly indi-cating that the potentially strong wind-driven vertical mixingand/or upwelling processes in fall drew nutrient-rich watersfrom the depths. In winter, the surface N+ N concentrationranged 0–1.2 µmol L−1, which was slightly higher than thatin other seasons (Fig. 3d).
Nutrient concentrations increased rapidly with depth asshown in Fig. 3e–l. During spring, high nutrient centers withN + N > 2 µmol L−1 and > 10 µmol L− were observed at50 m (Fig. 3e) and 100 m (Fig. 3i), respectively, in the centralpart of the NSCS. In this region, low temperature and highsalinity (data not shown) were observed at 75 and 100 m, andsea surface height also had low values in the same region,which indicated that a cyclonic circulation occurred in thisregion, and might have induced this high N+ N center. Insummer, N+ N distributions showed significant spatial vari-ations in the central NSCS, with higher concentrations in thewestern part (> 1 µmol L−1 at 50 m and> 10 µmol L−1 at100 m) and lower ones in the eastern part (< 1 µmol L−1 at50 m and< 10 µmol L−1 at 100 m) (Fig. 3f, j). During fall,N + N concentrations at 50 m were relatively higher in themiddle and southern regions (> 2 µmol L−1) than those inthe western and eastern regions (< 1 µmol L−1) of the NSCS(Fig. 3g). At 100 m however, higher values were observed inthe western part (∼ 10 µmol L−1) while lower values wereobserved in the eastern part (< 5 µmol L−1) (Fig. 3k). In
winter, a broad zone with low nutrient levels was locatedalong the shelf break, corresponding to an N+ N concen-tration of 0–2 µmol L−1 at 50 m (Fig. 3h) and 2–10 µmol L−1
at 100 m (Fig. 3l). Meanwhile, a high N+ N concentrationzone was observed along section E4 in the northeast part ofthe NSCS (Fig. 3h, l).
3.3 Comparison of nutrient distributions between thecentral NSCS and the Kuroshio waters
Vertical distributions of potential temperature and SRP in theupper 200 m at the SEATS (South East Asian Time-seriesStudy, Wong et al., 2007) and LU65 stations, which wererepresentative of the SCS and Kuroshio waters, respectively,are shown in Fig. 4. Here only the SRP was shown becausewe did not have enough data of N+ N at low level in theupper nutricline to draw comparison between seasons. Sig-nificant seasonal patterns were observed at the SEATS sta-tion. Its upper mixed layer depth (MLD, optimal estima-tion of 1T = 0.8◦C according to Kara et al., 2000) wasdeeper in winter (∼ 60 m) than in spring (∼ 10 m), summer(∼ 35 m) and fall (∼ 40 m) (Fig. 4a). On the other hand,SRP concentrations in the mixed layer were higher in fall(∼ 0.08 µmol L−1) than those in spring (∼ 0.04 µmol L−1),summer (∼ 0.02 µmol L−1) and winter (∼ 0.03 µmol L−1)
(Fig. 4b). At the same depth above 200 m, the Kuroshio wa-ter was relatively warmer by 0–8◦C and the SRP lower by0–1.1 µmol L−1 than the SCS water. In this context, intru-sions of the Kuroshio water with low nutrient content mighthave induced a dilution effect on the NSCS nutrients.
Biogeosciences, 10, 6419–6432, 2013 www.biogeosciences.net/10/6419/2013/

C. Du et al.: Impact of the Kuroshio intrusion on the nutrient inventory 6423
Table 1.Summary of the area-integrated nutrient inventories in the upper 100 m of the water column in the central northern South China Sea.
SeasonsInventory (109 mol) Reduction relative to summer (%)
N + N SRP Si(OH)4 N + N SRP Si(OH)4
Spring 69 5.8 106 13.2 10.8 10.1Summer 80 6.5 118 – – –Fall 67 6.2 98 16.2 5.7 17.1Winter 55 3.6 58 31.7 44.4 51.0
Fig. 4. Vertical distribution of potential temperature(A) and SRP(soluble reactive phosphate,(B)) in the upper 200 m of the watercolumn at the SEATS station in different seasons and station LU65in spring.
It should be pointed out that the MLD (∼ 60 m) in winterwas deeper than the top of nutricline (TND,∼ 50 m), and itwas consistent with the previous observations at the SEATSstation (Tseng et al., 2005, 2007). Such a decoupling maybe a result of the combination of the physical dynamics andbiological alteration. Firstly, it can be attributable to the un-even consumption rate of nutrients by biological metabolismvs. water depth within the mixed layer because of the lightintensity differences. Secondly, it can also be related to thedefinition of the MLD. Here we defined the MLD with tem-perature difference (1T ) from the sea surface temperature,and a critical value of 0.8◦C was adopted (Kara et al., 2000).This definition of MLD might not be sensitive enough attimes to catch for example weak stratification that would di-minish the mixing within the upper layer. Finally, it shouldalso be pointed out that the coarse sampling resolution of ourdiscrete nutrient samples also made it difficult to preciselyestimate the depth of TND.
3.4 Nutrient inventory in the upper 100 m of the centralNSCS
The station-integrated N+ N inventory in the upper 100 mof the central NSCS is shown in Fig. 5. The N+ N inventoryranged from 50–600 mmol m−2 in spring (Fig. 5a). A highN + N inventory center of> 500 mmol m−2 was observedin the central basin of the NSCS, which was about twice
that at the edge stations (∼ 100–200 mmol m−2). Regionswith the N+ N inventory < 100 mmol m−2 were observedat the northeast part near Taiwan and the southwest partnear Hainan. During summer (Fig. 5b), the station-integratedN + N inventory was mostly> 300 mmol m−2 in the entirecentral NSCS, whereas the< 100 mmol m−2 region was ob-served only at the western part. In fall, the N+ N inven-tory was higher in the western part (> 300 mmol m−2), butlower in the eastern part (< 100 mmol m−2) (Fig. 5c). Duringwinter, a band with low N+ N inventory (< 200 mmol m−2)
was located between the Luzon Strait and 115◦E alongthe shelf break in the northeast part of the central NSCS(Fig. 5d), in which an extremely low N+ N inventory cen-ter (∼ 20 mmol m−2) was observed. Combined with the iso-depth distributions (Fig. 3), the N+ N inventory results re-vealed an overall pattern that the nutrients were consistentlyhigher in the western than in the eastern part of the centralNSCS.
On the basis of these seasonal observations, the an-nual averaged N+ N inventory was estimated to be∼ 250 mmol m−2 in the central NSCS, which was signifi-cantly higher than that in the Kuroshio in spring, implyingagain the potential dilution effect of the Kuroshio intrusionon the nutrient inventory of the upper NSCS.
Taking the central NSCS as a whole, the area-integratedN + N inventory (see Sect. 2.3 for details) was highest insummer, while it was∼ 13,∼ 16 and∼ 32 % lower in spring,fall and winter, respectively, as compared to that in summer(Table 1). The seasonal patterns of the SRP and Si(OH)4 in-ventories were similar to that of N+ N but with larger de-grees of reduction in winter as compared to N+ N (Table 1).
4 Discussion
4.1 Water fraction estimation with the isopycnal mixingapproximation
In exploring the seasonal intrusions of the Kuroshio to thecentral NSCS, we assumed that the mixing between differentwater masses was mainly along isopycnal surfaces, while thediapycnal processes which occurred were insignificant. Thisstatement can be approached by means of a comparison be-tween the diffusive flux along and across isopycnal surfaces.
www.biogeosciences.net/10/6419/2013/ Biogeosciences, 10, 6419–6432, 2013

6424 C. Du et al.: Impact of the Kuroshio intrusion on the nutrient inventory
Fig. 5.Station-integrated N+ N inventory (mmol m−2) in the upper 100 m of the water column in the central northern South China Sea.(A)spring;(B) summer;(C) fall; and(D) winter.
Fig. 6. Potential temperature (θ ) versus salinity (S) plots (θ -S di-agram) in the upper 400 m of the water column for the samplingstations in the central northern South China Sea (NSCS) superim-posed by(A) the isopycnal mixing model-derived Kuroshio waterfraction (RK ), and (B) the field observed N+ N (nitrate plus ni-trite) concentrations. A red triangle in(A) donates an example oftheRK calculation along the potential density 1023.5 surface. Dataof the typical Kuroshio water were collected from LU6 section inspring, while data of the SCS proper water were collected from sta-tion SEATS and its nearby stations in summer.
According to Fick’s law of diffusion, the diffusive flux ofdissolved material can be expressed as
F = −K × ∂c/∂x, (1)
where K can be either the diapycnal (KV) or isopycnal(KH) diffusivity, and∂c/∂x is the corresponding concentra-tion gradient. Here we take 100 m as an example. Note thatthe results of the other layers in the upper 100 m resem-ble that of the 100 m. We adopted theKV of 10−5 m2 s−1
according to Liu and Lozovatsky (2012) and theKH of500 m2 s−1 based on Glover et al. (2005). The horizon-tal gradient in N+ N was ∼ 1.0× 10⁻⁵ mmol m−4 basedon the estimated distance of 750 km and a concentrationdifference of about 10 mmol m−3 in N + N between sec-tion LU6 of the Kuroshio and the central NSCS. At thesame time, the vertical gradient in N+ N at the SEATSstation was estimated to be∼ 1.0× 10⁻¹ mmol m−4 at the100 m layer. Based on Eq. (1), the along isopycnal fluxwas estimated to be 5.0× 10⁻³ mmol m−2 s−1, which wasthree orders of magnitude larger than the diapycnal fluxof 1.0× 10⁻⁶ mmol m−2 s−1. This suggested that isopycnalmixing was indeed prevailing over diapycnal diffusion incontrolling the diffusive transport of nutrients in the uppercentral NSCS.
The mixing ratio of the Kuroshio water and the SCSproper water along any isopycnal surface can be quantita-tively determined, the detailed methodology of which canbe illustrated with reference to theθ -S diagram (Fig. 6).Firstly, following previous studies (e.g. Chen and Huang1996; Gong et al., 1992), the two endmembers representingtypical Kuroshio water and SCS proper water were chosenas the precursors of the NSCS water under consideration.For any in situ observed water parcel represented by a pointin theθ -S diagram, the fractional contributions of Kuroshioand SCS water can be derived by adopting the conservativealong-isopycnal mixing law ofθ or S:
RK = RKθ =θ−θSθK−θS
RK = RKS=
S−SSSK−SS
.(2)
Biogeosciences, 10, 6419–6432, 2013 www.biogeosciences.net/10/6419/2013/

C. Du et al.: Impact of the Kuroshio intrusion on the nutrient inventory 6425
Here, the Kuroshio water fraction is denoted asRK (RKθ andRKS
represent results derived fromθ and S, respectively),and thus 1-RK stands for the SCS proper water fraction.θKand SK denote the endmember values ofθ and S for theKuroshio water, whileθS andSS represent those for the SCSproper water. Due to the fact that the thermal structures inthe upper ocean are significantly influenced by the season-ally varying heat flux (Tseng et al., 2005), we usedS con-servation for the upper 60 m of the water column for modelprediction. At greater depths,θ was used due to its highersensitivity than salinity (Fig. 6a). It should be pointed out thatin the upper ocean, in particular in the mixed layer, the defi-nition of an isopycnal is not easy. We contend that the mixedlayer is roughly characterized by uniformθ andS, thus, be-ing representative of a single point inθ -S diagram regard-less its thickness. Accordingly, the same mixing ratio will beobtained through our isopycnal model for this mixed layer,which would thus be subject to greater uncertainties becausethis layer is also affected by the surface heat fluxes that wedo not take into account in our calculations. Our approachby usingS conservation for the upper 60 m the water columnmodel prediction should have helped in this regard. We havealso vigorously estimated as elaborated in the later discussionsections, individual source terms in our model prediction. In-deed, our uncertainty test using conservative Ca2+ data wasable to well validate the model prediction.
The model-derivedRK at each sampling point in the upper400 m of the central NSCS is shown in Fig. 6a. As an ex-ample,RK for a water parcel located at the potential densityanomaly surface of 23.50, is also shown in Fig. 6a. Accord-ing to the isopycnal mixing approximation, this water parcelwas a mixture of the SCS endmember and the Kuroshio end-member with the same potential density of 23.50 (due to thenonlinear nature of density mixing the genuine potential den-sity anomaly of its parents are slightly higher than 23.50). Assuch,RK was estimated to be 0.4, meaning that the propor-tional contribution from the Kuroshio was 40 %, while theSCS endmember contributed 60 % to the mixture.
We also note that some data beyond the endmembers ap-peared in Fig. 6. This reflects the difficulty in finding a per-fect Kuroshio (or SCS) endmember from the existing ob-servations withθ /S as well as chemical parameter measure-ments. Some shelf stations presumably under evident influ-ence of nearshore water masses were excluded from the anal-ysis. The error resulted from the endmember selection is de-tailed in Sect. 4.2. As shown in Fig. 6b, there was an along-isopycnal surface difference of∼ 0–10 µmol L−1 in N + Nin the upper 100 m of the water column between the typi-cal SCS and the Kuroshio. With the derived water fractions,the nutrient concentrations (Nm) of each water parcel in thecentral NSCS could be calculated from
Nm = RK × NK + (1− RK) × NS. (3)
This is the nutrient concentration solely due to conservativephysical mixing of the parent waters. In situ-observed con-
Fig. 7. (A) Scatter plot of the isopycnal mixing predicted Ca2+ andthe field observed Ca2+ in the upper 100 m of the central NSCS.(B) The individual error of the estimated Kuroshio water fraction(r) versus potential density in the upper 100 m of the central SouthChina Sea (SCS). Green lines donate the±0.1 range. Note that theanalytical precision of Ca2+ is better than±5 µmol kg−1 (Cao andDai, 2011), which accounts for less than 2 % of the estimated error.
centrations might have departed from this value due to chem-ical and/or biological alterations. Here,NK andNS are theendmember concentrations of nutrients for the Kuroshio andthe SCS proper water at a given isopycnal surface.
4.2 Model validation and error estimation
Since the seawater-dissolved calcium ion (Ca2+) is nearlyconservative in the upper ocean, despite possible smallchanges resulting from CaCO3 production or dissolution(Cao and Dai, 2011; Feely et al., 2002), we could use thehigh-precision data of Ca2+ to evaluate the applicability ofour isopycnal mixing approach.
As shown in Fig. 7a, the isopycnal mixing approximationworked very well in predicting concentrations of Ca2+ in theupper 100 m of the central NSCS. The model prediction andthe observations were highly correlated (R = 0.993,n = 96,p < 0.0001), and the slope was 0.93, suggesting a 7 % bulkuncertainty of the model prediction. This provided direct ev-idence for the applicability of our isopycnal mixing model.
However, observable departures in model prediction fromfield measurements did exist, which provided an estimateof the errors in the calculated water fractions induced bythe physical approximations adopted in the isopycnal mixingmodel. Ifr is the error in the derived Kuroshio water fraction(RK) and assuming Ca2+ to be perfectly conservative (i.e.the observed Ca2+ is solely a result of water mass mixingwithout any chemical or biological alterations), we have
Ca2+
M = RK × Ca2+
K + (1− RK) × Ca2+
SCa2+
F = (RK + r) × Ca2+
K + (1− RK − r) × Ca2+
S .(4)
Here, Ca2+
M and Ca2+
F denote the model-derived and field-observed Ca2+ concentrations, respectively, and Ca2+
K andCa2+
S are the endmember concentrations of Ca2+ forKuroshio and SCS proper water, respectively. Therefore, the
www.biogeosciences.net/10/6419/2013/ Biogeosciences, 10, 6419–6432, 2013

6426 C. Du et al.: Impact of the Kuroshio intrusion on the nutrient inventory
error in each individual estimate ofRK is
r =Ca2+
M − Ca2+
F
Ca2+
K − Ca2+
S
. (5)
As shown in Fig. 7b, the absolute value ofr in the upper100 m of the central NSCS was mostly< 0.1, or less than10 %. Statistically, it had a mean value of−0.02 (Xr), and astandard deviation of 0.09 (Sr , n = 96). Note that this errorr derived from Ca2+ is an upper limit estimate of the modelerror, as it also includes errors due to potential CaCO3 pro-duction or dissolution.
Besides the model approximations, the selection ofendmembers also introduced uncertainties. This is de-tailed in the Supplementary Material. Overall, the un-certainty resulting from the SCS endmember variationwas −0.09± 0.28 µmol L−1 (the mean value (XNS)
±standard deviation (SNS) is the same in the follow-ing descriptions) for N+ N, 0.026± 0.015 µmol L−1
for SRP and 0.48± 0.30 µmol L−1 for Si(OH)4. On theother hand, the uncertainty induced by the Kuroshioendmember variation was −0.22±0.38 µmol L−1
for N + N, −0.002± 0.030 µmol L−1 for SRP and−0.28± 0.59 µmol L−1 for Si(OH)4.
Combining the model-induced errorr and the un-certainties introduced by the selection of endmembers,the total error for the estimated nutrient concentration(Eq. 3; see Supplementary Material for details) was aver-aged to be−0.16± 0.65 µmol L−1 for N + N (XN ± SN),−0.002± 0.043 µmol L−1 for SRP and 0.1± 0.73 µmol L−1
for Si(OH)4 in the upper 100 m of the central NSCS. Thenegative values indicate overestimation of the model.
4.3 Impact of the Kuroshio intrusion on the nutrientinventory in the central NSCS
The Kuroshio water fraction (RK ; Eq. 2) for each water par-cel was integrated over the upper 100 m for a given sta-tion to represent the station-integrated Kuroshio water frac-tion (RIKW ). Similarly, we calculated the station-integratedKuroshio nutrient fraction (RIKN ) according to the followingequation:
RIKN =IKN
IN=
z=100m∑z=0
RK × NK
z=100m∑z=0
(Nm)
, (6)
where IN is the station-integrated nutrient concentrationin the upper 100 m of the central NSCS, andIKN is thestation-integrated nutrient concentration contributed fromthe Kuroshio water in the upper 100 m.
As shown in Fig. 8a–d, the spatial distribution ofRIKWdisplayed distinct features over the seasons. In spring, falland winter,RIKW was typically above 0.2 in the northeast
part of the central NSCS under the stronger influence of theKuroshio intrusion (Fig. 8a, c and d). In summer,RIKW was< 0.2 except in the region near the Luzon Strait (Fig. 8b).Relative to that in summer,RIKW in fall was higher in theeastern part (> 0.2) while lower in the west (< 0.1) (Fig. 8c).Nevertheless, it was clear from the spatial distributions indifferent seasons that the Kuroshio influence in the centralNSCS was persistent all year round, although varying inmagnitude.
The distribution patterns of theRIKN resembled that ofRIKW , but the value was much lower. Most notably, only avery small fraction of the Kuroshio water was observed dur-ing summer in the central NSCS (Fig. 8b), again suggestingthat the Kuroshio did not significantly intrude into the SCSin summer. The basin-wide surface circulation of the SCSin summer (responding to the southwest monsoon) may pre-vent the Kuroshio from further intrusion (if any) into the inte-rior of the SCS and, instead, it flows out eastwardly throughthe Luzon Strait (Chu and Li., 2000; Hu et al., 2000; Qu etal., 2000). The lowest seasonal averagedRIKW was∼ 0.06 insummer and the highest seasonal averagedRIKW was∼ 0.3in spring. The values were∼ 14 % in fall and∼ 18 % in win-ter which showed intermediate values as compared to the for-mer two seasons.
The patchy rather than homogeneous distribution of theRIKW in the SCS proper was observed (Fig. 8), which mightbe partly due to the combination of the interior SCS circula-tion and the Kuroshio intrusion. On the other hand, it shouldbe noted that the estimated Kuroshio water fraction based onthe isopycnal mixing model is not necessarily related to in-stantaneous intruding processes because any formation of awater mass containing fractions of the Kuroshio water mayhave taken a much longer time than the seasonal timescale.
As shown in Fig. 9a, the model-predicted N+ N (Nm)
agreed overall well with the field measurements. The factthat the majority of the scattered data points fell outside theestimated N+ N error (XN ± SN) domain might suggest sig-nificant biological mediation of the nutrient, in particular inthe upper layer of the central NSCS (Fig. 9a). As shown inFig. 9b, the field estimated N+ N inventory was negativelycorrelated with the correspondingRIKW . The nearly even dis-tribution of the data points around the theoretical mixing lineindicated that the Kuroshio intrusion might play a key role inthe N+ N inventory of the study area.
In order to assess the dilution effect of the Kuroshio in-trusion, featured by extremely low nutrients, we calculatedthe area-integrated Kuroshio dilution amount (KNR) of thenutrient inventory over the upper 100 m of the central NSCSbased on the proposed isopycnal mixing model as
KNR =
(area∑ z=100m∑
z=0m
(NS− Nm)
). (7)
Here, NS is the SCS endmember nutrient concentrationbefore Kuroshio dilution, andNm is the model-predicted
Biogeosciences, 10, 6419–6432, 2013 www.biogeosciences.net/10/6419/2013/

C. Du et al.: Impact of the Kuroshio intrusion on the nutrient inventory 6427
Fig. 8. The station-integrated Kuroshio water fraction (RIKW , A–D) and nutrient fraction (RIKN , E–H) in the upper 100 m of the centralnorthern South China Sea.(A) springRIKW ; (B) summerRIKW ; (C) fall RIKW ; (D) winterRIKW ; (E) springRIKN ; (F) summerRIKN ; (G)fall RIKN ; and(H) winterRIKN .
nutrient. Assuming that the study area is under steadystate on an intra-seasonal timescale, we did a first-orderestimate of the nutrient inventory reduction from summer2009 to winter 2009. The calculatedKNR values were∼ 21× 109, ∼ 1.5× 10⁹ and∼ 22× 109 mol for N+ N, SRPand Si(OH)4, respectively. The nutrient inventory reduc-tion in winter 2009 relative to those in summer 2009 were∼ 25× 109, ∼ 3× 10⁹ and∼ 60× 109 mol for N+ N, SRPand Si(OH)4, respectively (Table 1). As a consequence, the
Kuroshio intrusion accounted for an inventory reduction of∼ 83,∼ 52 and∼ 37 % for N+ N, SRP and Si(OH)4 duringthis period of time, whereas the residual reduction might beattributed to the biological metabolism and/or other physicalprocesses. It should be pointed out that these reduction as-sessments were referenced to summer 2009, while our foursurveys spanned from 2009 to 2011. Therefore, our esti-mated reduction at seasonal levels assumed no interannualvariations in the Kuroshio intrusions into the SCS, which is
www.biogeosciences.net/10/6419/2013/ Biogeosciences, 10, 6419–6432, 2013

6428 C. Du et al.: Impact of the Kuroshio intrusion on the nutrient inventory
0
4
8
12
16
0 4 8 12 16
Mo
de
l p
red
icte
d N
+N
[m
mo
l L
-1]
Field observed N+N [mmol L-1]
SpringSummerFallWinterError line
A
0
200
400
600
800
0 0.2 0.4 0.6 0.8 1
N+
N in
ven
tory
[m
mo
l m
-2d
-1]
RIKW
SpringSummerFallWinter
B
Fig. 9. (A) The model-predicted N+ N concentrations versus the field measurements in the upper 100 m of the central northern South ChinaSea (NSCS). Pink line is the 1:1 line while gray lines donate theXr ± Sr domain;(B) The relationship between the field observed N+ Ninventory and the station-integrated Kuroshio water fraction (RIKW ). The solid pink line is the theoretical mixing line constructed by theN + N inventory of the SCS and Kuroshio endmembers (∼ 250 mmol m−2 in NSCS and∼ 5 mmol m−2 in Kuroshio, respectively, which isobtained by supposing the mixingRKW is the same value in the entire upper 100 m). The dotted lines with the different colors represent thecorresponding linear regressions from different seasons.
however not always true (e.g. Chao et al., 1996; Michael etal., 2006; Liu et al., 2011).
It might be argued that other processes also regulate theN + N inventory in the upper ocean. One additional pos-sible process to supply nutrients is N2-fixation. However,N2-fixation was estimated to be∼ 20 mmol N m−2 yr−1
in the NSCS (Kao et al., 2012), which only accounts forless than 10 % of the present nutrient inventory variation(∼ 250 mmol m−2). Moreover, N2-fixation is a net source forthe N+ N inventory which accounts for the increase in theN + N inventory, while the reduction in the nutrient inven-tory we observed occurred in the second half of 2009. Thus,the genuine inventory reduction might exceed our estimation.Another possible process to add nutrients is diapycnal mix-ing. In particular, during the strong northeast monsoon sea-son, deepening of the surface mixed layer frequently occurs,which enhances the influxes of the nutrient-rich subsurfacewater (Tseng et al., 2005; Liu et al., 2002). As a result, anenhancement by∼ 2 fold in primary production in the cen-tral NSCS was reported in winter as compared to that in sum-mer (Chen, 2005; Chen and Chen, 2006). However, based onturbulence profiling measurements (data not shown), we es-timated the upward N+ N flux across the 100 m layer to be∼ 0.1 mmol m−2 d−1, implying that it might take more than∼ 7 yr to thoroughly change the N+ N inventory given theaveraged N+ N inventory of∼ 250 mmol m−2 in the upper100 m of the central NSCS. Therefore, we contend that ona seasonal timescale, the effect of diapycnal mixing on theN + N inventory might be negligible.
At seasonal timescale, variations of the isopycnal depthcan also change the nutrient inventory in the upper 100 mwater column. The overall positive correlation between thedensity and nutrient concentration observed in the upperocean suggests that any lift of the isopycnal would induce
increase in nutrient inventory in the upper water column. Asa matter of fact, this is exactly the reason why we observeda very scattered relationship between the station-integratedKuroshio (RIKW ) water fraction and the nutrient inventory asshown in Fig. 9b. Such impact can also be seen at the sea-sonal timescale reflected in the different slopes in Fig. 9b.
The drivers causing the variations of isopycnal depthcan be beyond the Kuroshio intrusion. For example,both mesoscale eddies and basin-scale Ekman conver-gence/divergence may induce such variations of the isopy-cnal depth. The impact of the mesoscale eddies on isopy-cnal depth/nutrient inventory could be significant in thenortheast SCS during winter (Fig. 5d), when we observeda low nutrient inventory center that might not only reflectthe Kuroshio intrusion but also a warm eddy. During ourspring cruise (Fig. 5a), the high nutrient inventory centerin the central NSCS (corresponding to the isopycnal uplift)should be attributable to the basin-scale divergence. We areaware that both mesoscale eddies and basin-scale conver-gence/divergence may have induced the scattered relation-ship and different slopes between the observed nutrient in-ventory and theRIKW as shown in Fig. 9b. However, theireffect on the nutrient inventory will vanish when the isopyc-nal returns to its initial position, after for example the decayof the eddy and/or the basin-scale circulation is weakened.Thus, we believe that the Kuroshio intrusion should play adominant role in determining the nutrient inventory distribu-tion in the NSCS.
The Kuroshio intrusion might also affect the nutrient ratiostoichiometry in the central NSCS, due to the different Si/Nand N/P ratios between the SCS proper and the Kuroshio wa-ter at the same isopycnal surface. Potentially attributable toN2-fixation (e.g. Kao et al., 2012) and upwelling (Gong et al.,1992), the N/P ratio of the upper 100 m ranged 0.2–14.5 in
Biogeosciences, 10, 6419–6432, 2013 www.biogeosciences.net/10/6419/2013/
C. Du et al.: Impact of the Kuroshio intrusion on the nutrient inventory 6429
(N+N) [mol L-1]
Nu
mb
er
of
sam
ple
s
D
-6 -4 -2 0 2 4 60
50
100
150
200
SRP [mol L-1]
E
-0.4 -0.2 0 0.2 0.40
10
20
30
40
50
60
70
(N+N)/SRP
16:1
F
0 5 10 15 20 25 300
5
10
15
20
25
(N+N) [mol L-1]
Nu
mb
er
of
sam
ple
s
D
-6 -4 -2 0 2 4 60
50
100
150
200
SRP [mol L-1]
E
-0.4 -0.2 0 0.2 0.40
10
20
30
40
50
60
70
(N+N)/SRP
16:1
F
0 5 10 15 20 25 300
5
10
15
20
25
(N+N) [mol L-1]
Nu
mb
er
of
sam
ple
s
D
-6 -4 -2 0 2 4 60
50
100
150
200
SRP [mol L-1]
E
-0.4 -0.2 0 0.2 0.40
10
20
30
40
50
60
70
(N+N)/SRP
16:1
F
0 5 10 15 20 25 300
5
10
15
20
25
(N+N) [mol L-1]
Nu
mb
er
of
sam
ple
s
D
-6 -4 -2 0 2 4 60
50
100
150
200
SRP [mol L-1]
E
-0.4 -0.2 0 0.2 0.40
10
20
30
40
50
60
70
(N+N)/SRP
16:1
F
0 5 10 15 20 25 300
5
10
15
20
25
(N+N) [mol L-1]
Nu
mb
er o
f sam
ples
D
-6 -4 -2 0 2 4 60
50
100
150
200
SRP [mol L-1]
E
-0.4 -0.2 0 0.2 0.40
10
20
30
40
50
60
70
(N+N)/SRP
16:1
F
0 5 10 15 20 25 300
5
10
15
20
25
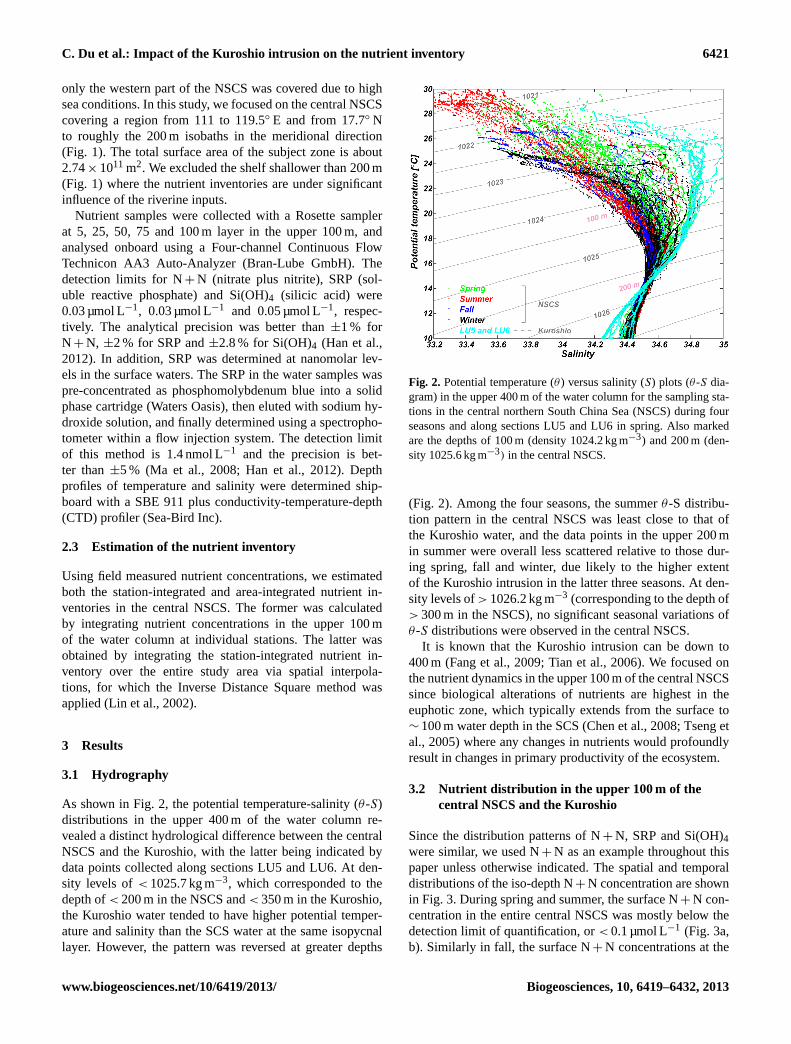
Fig. 10. 1(N + N) (A) and 1SRP (B) versus potential density in the upper 100 m of the central NSCS.(C) The relationship between1(N + N) and1SRP. Lines in(A) and (B) represent the moving average during each season. Pink shadows in(A) and (B) indicate theXN ± SN domain (see Supplementary for details). The straight pink line in(C) denotes the theoretical correlation of 16: 1 based on theRedfield ratio (Redfield et al., 1963). Also shown are the histogram distributions of1(N + N) (D), 1SRP(E) and1(N + N)/1SRP(F) inthe upper 100 m of the central NSCS.
the SCS, which is generally higher than that in the Kuroshioof 0.1–10 in the upper 150 m. The intrusion of the Kuroshioand its seasonal contrast might therefore significantly shapethe nutrient ratio structure in the SCS, which would have afundamental impact on the ecosystem structure therein.
4.4 Biogeochemical alteration of nutrients in the upper100 m of the central NSCS
Although the model-predicted N+ N concentrations and thefield measurements showed an overall agreement in the up-per 100 m of the central NSCS, observable departures didexist (Figs. 9a and 10). The difference, denoted here as1
(field observation minus the model prediction), would sug-gest a biogeochemically mediated portion of the nutrients.As shown in Fig. 10a, the majority of the departures occurredin the upper euphotic zone where N+ N concentrations werelower than 10 µmol L−1.
For 1(N + N) and 1SRP, a scatter distribution rangingfrom−6 to 6 µmol L−1 and−0.4 to 0.3 µmol L−1 were foundin the upper 100 m of the central NSCS (Fig. 10a, b). Thehistogram distributions further showed that the majority ofthese1 data was grouped at±2 µmol L−1 for 1(N + N) and±0.15 µmol L−1 for 1SRP (90 % data range; Fig. 10d, e). As
shown by the seasonal moving average lines, both1(N + N)and1SRP values were negative in spring and winter but pos-itive in fall (Fig. 10a, b). We inferred that on average∼ 0–3 µmol L−1 of N + N and∼ 0–0.15 µmol L−1 of SRP wereremoved by biological metabolism in the upper 100 m of cen-tral NSCS during winter and spring. Such removal was muchmore significant in the upper 50 m in winter, which agreedwell with the fact that the primary production is generallyhigher in winter in the NSCS (Chen, 2005; Chen and Chen,2006). In summer, both1(N + N) and1SRP were aroundzero, suggesting no significant biological consumption of nu-trients. In contrast, in fall,1(N + N) and1SRP were overallpositive suggesting net nutrient addition in the upper centralNSCS.
If we further assumed that our study area was understeady state on a seasonal timescale, the above removalof nutrients would be translated into a new production ofabout 6.0± 2.7 mmol C m−2 d−1 in spring, 1.8± 2.7 mmolC m−2 d−1 in summer,−4.5± 2.7 mmol C m−2 d−1 in falland 7.4± 2.7 mmol C m−2 d−1 in winter based on the C / NRedfield ratio of 106/16 (Redfield et al., 1963). The positivevalue in fall might indicate that nutrient addition was largerthan its removal, inducing no net production.
www.biogeosciences.net/10/6419/2013/ Biogeosciences, 10, 6419–6432, 2013

6430 C. Du et al.: Impact of the Kuroshio intrusion on the nutrient inventory
It should be pointed out that the above-derived new pro-duction values in spring and summer were very close tothose previously reported in the NSCS basin (∼ 5.8 mmolC m−2 d−1 in spring, ∼ 2.5 mmol C m−2 d−1 in summer),based on the15N incubation method (Chen, 2005). However,our derived value in winter was substantially lower than thereported value of∼ 21.7 mmol C m−2 d−1 (Chen, 2005), andour derived data in fall was significantly different from the re-ported value of∼ 4.1 mmol C m−2 d−1. The reasons for thediscrepancy in the fall and winter of the new production esti-mates are unclear and require additional studies. We also notethat the field measurements in winter have been extremelysparse in the SCS as elsewhere in the world ocean.
Nevertheless, our derived1(N + N)/1SRP ratio, or therelative biological consumption, with its average value of∼ 12.8 was in very good agreement with the Redfield Ra-tio (Redfield et al., 1963) (Fig. 10c, f). This ratio was alsoconsistent with the (N+ N)/SRP ratio obtained from thedepths in the SCS, the average of which was around 13.6based on the long-term observations at SEATS (Wong etal., 2007). Such consistence provided another piece of evi-dence that our isopycnal mixing model was generally in or-der. Among different seasons, the1(N + N) /1SRP ratio di-agnosed from the model, which was the slope of the linearregression line between1(N + N) and1SRP, was highestin fall (∼ 17.8, R = 0.97, n = 66, P < 0.0001), but lowestin winter (∼ 9.2,R = 0.79, n = 88, P < 0.0001). This ratiowas∼ 13.4 in spring (R = 0.93, n = 168,P < 0.0001) and∼ 12.4 in summer (R = 0.88, n = 135, P < 0.0001), bothof which were close to the average value of∼ 12.8. Quigget al. (2003) reported a different phytoplankton compositionassociated with different element composition, and so a dif-ferent1(N + N)/1SRP addition/removal ratio in the NSCSmight indicate that a red superfamily (lower N / P ratio de-mand) was prevailing in winter and a green superfamily(high N / P ratio demand) in fall.
5 Conclusions
Both nutrient concentrations and their inventories in the up-per 100 m of the central NSCS displayed significant spa-tial and seasonal variations. The inventories were overallhigher in the west part relative to the east part of the centralNSCS, which was consistent with the decreasing dilution ef-fect along the travel path of the Kuroshio intrusion. On sea-sonal timescale, the nutrient inventories in the upper 100 mwere relatively high in summer but low in spring and winter.In addition to the diapycnal mixing, N2-fixation, mesoscaleeddies and basin-scale divergence/convergence, the Kuroshiointrusion might therefore play a dominant role in determiningthe nutrient inventory distribution in the central NSCS.
A two endmember based isopycnal mixing model wasadopted to derive the Kuroshio and SCS proper water frac-tions in the water parcel of the central NSCS, and this indi-
cated that spring and winter were the two main seasons forthe Kuroshio water fraction distribution in the central NSCS.The station-integrated Kuroshio water fraction showed a sig-nificant negative correlation with the nutrient inventory inthe upper 100 m of the central NSCS, indicating the domi-nant Kuroshio dilution effect. Based on the endmember sen-sitivity analysis and water fraction error estimation, our well-validated model results demonstrated relatively high nutrientconsumption during winter and spring but possibly net addi-tion in fall in the upper 100 m of the central NSCS.
It is important to note that the SCS does not have itsown independent water mass formation since, on a timescale> 4 yr longer than the residence time of the SCS surfacewater (Chen, 2001), the SCS water originally comes fromthe wNP, although with a certain degree of transformation.We thus caution applying the isopycnal mixing approach toquantify the impact of the Kuroshio intrusion into the SCS ona longer timescale, when diapycnal mixing processes wouldbecome significant.
Supplementary material related to this article isavailable online athttp://www.biogeosciences.net/10/6419/2013/bg-10-6419-2013-supplement.pdf.
Acknowledgements.This study was funded by the NationalBasic Research Program of China (973 Program) through grantNo. 2009CB421200 and by the National Natural Science Foun-dation of China through grants No. 41130857, 41121091 and41023007. We are grateful to the captain and crew members onR/V Dongfanghong II as well as H. Lin, X. Huang, Y. Xu, J. Linand A. Han for their assistance in sampling and/or analyses duringthe cruises. We thank K.-K. Liu, T.-D. Qu, C. Measure, P. Cai,Y. Li, H. Lin, H. Gupta and G. Wang for their valuable suggestions.J. Hodgkiss is thanked for his help with the English.
Edited by: H. Liu
References
Baringer, M. O. and Price, J. F.: A review of the physical oceanogra-phy of the Mediterranean outflow, Mar Geol., 155, 63–82, 1999.
Bourgault, D., Hamel, C., Cyr, F., Tremblay, J.É., Galbraith, P.S.,Dumont, D., and Gratton, Y.: Turbulent nitrate fluxes in theAmundsen Gulf during ice-covered conditions, Geophys. Res.Lett., 38, L15602, doi:10.1029/2011GL047936, 2011.
Cai, W. J., Dai, M. H., Wang, Y. C., Zhai, W. D., Huang, T., Chen,S. T., Zhang, F., Chen, Z. Z., and Wang, Z. H.: The biogeochem-istry of inorganic carbon and nutrients in the Pearl River estuaryand the adjacent Northern South China Sea, Cont. Shelf Res., 24,1301–1319, 2004.
Cao, Z. M. and Dai, M. H.: Shallow-depth CaCO3 dissolution: Ev-idence from excess calcium in the South China Sea and its ex-port to the Pacific Ocean, Global Biogeochem. Cy., 25, GB2019,doi:10.1029/2009GB003690, 2011.
Biogeosciences, 10, 6419–6432, 2013 www.biogeosciences.net/10/6419/2013/
C. Du et al.: Impact of the Kuroshio intrusion on the nutrient inventory 6431
Centurioni, L. R., Niiler, P. P., and Lee, D. K.: Observations of In-flow of Philippine Sea Surface Water into the South China Seathrough the Luzon Strait, J. Phys. Oceanogr., 34, 113–121, 2004.
Chao, S. Y., Shaw, P. T., and Wu, S. Y..: El Niño modulation ofthe South China Sea circulation, Prog. Oceanogr., 38, 51–93,doi:10.1016/S0079-6611(96)00010-9, 1996.
Chen, C. T. A., and Huang, M. H.: A mid-depth front separatingthe South China Sea water and the West Philippine Sea water, J.Oceanogr., 52, 17–25, 1996.
Chen, C. T. A., Wang, S. L., Wang, B. J., and Pai, S. C.: Nutrientbudgets for the South China Sea basin, Mar. Chem., 75, 281–300,2001.
Chen, Y. L.: Spatial and seasonal variations of nitrate-based newproduction and primary production in the South China Sea, DeepSea Res I., 52, 319–340, 2005.
Chen, Y. L. and Chen, H. Y.: Seasonal dynamics of primary and newproduction in the northern South China Sea: The significance ofriver discharge and nutrient advection, Deep Sea Res I., 53, 971–986, 2006.
Chen, Y. L., Chen, H. Y., Tuo, S., and Ohki, K.: Seasonal dynam-ics of new production from Trichodesmium N2 fixation and ni-trate uptake in the upstream Kuroshio and South China Sea basin,Limnol. Oceanogr., 53, 1705–1721, 2008.
Chu, P. C. and Li, R. F.: South China Sea Isopycnal-Surface Circu-lation, J. Phys. Oceanogr., 30, 2419–2438, 2000.
Dai, M., Meng, F., Tang, T., Kao, S.-J., Lin, J., Chen, J., Huang,J.-C., Tian, J., Gan, J., and Yang, S.: Excess total organic carbonin the intermediate water of the South China Sea and its exportto the North Pacific, Geochem. Geophys. Geosyst., 10, Q12002,doi:10.1029/2009GC002752, 2009.
Fang, G. H., Wang, Y. G., Wei, Z. X., Fang, Y., Qiao, F. L., and Hu,X. M.: Interocean circulation and heat and freshwater budgetsof the South China Sea based on a numerical model, Dynam.Atmos. Oceans., 47, 55–72, 2009.
Feely, R. A., Sabine, C. L., Lee, K., Millero, F. J., Lamb, M. F.,Greeley, D., Bullister, J. L., Key, R. M., Peng, T. H., Kozyr,A., Ono, T., and Wong, C. S.: In situ calcium carbonate disso-lution in the Pacific Ocean, Global Biogeochem. Cy., 16, 1144,doi:10.1029/2002GB001866, 2002.
Glover, D. M., Jenkins, W. J., and Doney, S. C.: Modeling methodsfor marine science, Cambridge University Press, pp. 255, 2005.
Gong, G. C., Liu, K. K., Liu, C. T., and Pai, S. C.: The chemicalhydrography of the South China Sea west of Luzon and a com-parison with the West Philippine Sea, Terr. Atmos. Ocean. Sci.,3, 587–602, 1992.
Gordon, A. L.: Circulation of the Caribbean Sea, J. Geophys. Res.,72, 6207–6223, 1967.
Han, A. Q., Dai, M. H., Kao, S. J., Gan, J. P., Li, Q., Wang, L.F., Zhai, W. D., and Wang, L.: Nutrient dynamics and biologi-cal consumption in a large continental shelf system under theinfluence of both a river plume and coastal upwelling, Limnol.Oceanogr., 57, 486–502, doi:10.4319/lo.2012.57.2.0486, 2012.
Hu, J. Y., Kawamura, H., Hong, H. S., and Qi, Y. Q.: A Review onthe Currents in the South China Sea: seasonal Circulation, SouthChina Sea Warm Current and Kuroshio Intrusion, J. Oceanogr.,56, 607–624, 2000.
Huertas, I. E., Ríos, A.F., García-Lafuente, J., Navarro, G.,Makaoui, A., Sánchez-Román, A., Rodriguez-Galvez, S., Orbi,A., Ruíz, J., and Pérez, F. F.: Atlantic forcing of the Mediter-
ranean oligotrophy, Global Biogeochem. Cy., 26, GB2022,doi:10.1029/2011GB004167, 2012.
Kao, S. J., Yang, J. Y. T., Liu, K. K., Dai, M. H., Chou, W. C.,Lin, H. L., and Ren, H.: Isotope constraints on particulate ni-trogen source and dynamics in the upper water column of theoligotrophic South China Sea, Global Biogeochem. Cy., 26,GB2033, doi:10.1029/2011GB004091, 2012.
Kara, A. B., Rochford, P. A., and Hurlburt, H. E.: An optimal defini-tion for ocean mixed layer depth, J. Geophys. Res., 105, 16803–16821, doi:10.1029/2000JC900072, 2000.
Kida, S., Yang, J. Y., and Price, J. F.: Marginal Sea Overflows andthe Upper Ocean Interaction, J. Phys. Oceanogr., 39, 387–403,doi:10.1175/2008JPO3934.1, 2009.
Lewis, M. R., Harrison, W. G., Oakey, N. S., Hebert, D., and Platt,T.: Vertical Nitrate Fluxes in the Oligotrophic, Science, 234,4778, 870–873, 1986.
Liang, W. D., Yang, Y. J., Tang, T. Y., and Chuang, W. S.:Kuroshio in the Luzon Strait, J. Geophys. Res., 113, C08048,doi:10.1029/2007JC004609, 2008.
Lin, Z. H., Mo, X. G., Li, H. X., and Li, H. B.: Comparison of threespatial interpolation methods for climate variables in China, ActaGeographica Sinica, 57, 47–56, 2002.
Liu, K. K., Chao, S. Y., Shaw, P. T., Gong, G. C., Chen, C. C.,and Tang, T. Y.: Monsoon-forced chlorophyll distribution andprimary production in the South China Sea: observations and anumerical study, Deep Sea Res. I., 49, 1387–1412, 2002.
Liu, Q. Y., Feng, M., and Wang, D. X.: ENSO-induced interannualvariability in the southeastern South China Sea, J. Oceanogr.,67,127–133, doi:10.1007/s10872-011-0002-y, 2011.
Liu, Z. Y. and Lozovatsky, I. D.: Upper pycnocline turbulence in thenorthern South China Sea, Chinese Sci. Bull., 57, 2302–2306,2012.
Ma, J., Yuan, D. X., and Liang, Y.: Sequential injection anal-ysis of nanomolar soluble reactive phosphorus in seawaterwith HLB solid phase extraction, Mar. Chem., 111, 151–159,doi:10.1016/j.marchem.2008.04.011, 2008.
Michael, J. C., Glen, G. G., and Robert, C. B.: Interannual Vari-ability of the Kuroshio Intrusion in the South China Sea, J.Oceanogr., 62, 559–575, doi:10.1007/s10872-006-0076-0, 2006.
Matsuno, T., Lee, J.-S., and Yanao, S.: The Kuroshio exchangewith the South and East China Seas, Ocean Sci., 5, 303–312,doi:10.5194/os-5-303-2009, 2009.
Pratt, L. J. and Spall, M. A.: Circulation and Exchange inChoked Marginal Seas, J. Phys. Oceanogr., 38, 2639–2661,doi:10.1175/2008JPO3946.1, 2008.
Qu, T. D.: Upper-Layer Circulation in the South China Sea, J. Phys.Oceanogr., 30, 1450–1460, 1999.
Qu, T. D., Mitsudera, H., and Yamagata, T.: Intrusion of the NorthPacific waters into the South China Sea, J. Geophys. Res., 105,6415–6424, 2000.
Quigg, A., Finkel, Z. V., Irwin, A. J., Rosenthal, Y., Ho, T. Y., Re-infelder, J. R., Schofield, O., Morel, F. M. M., and Falkowski, P.G.: The evolutionary inheritance of elemental stoichiometry inmarine phytoplankton, Nature, 425, 291–294, 2003.
Redfield, A. C., Ketchum, B. H., and Richards, F. A.: The influenceof organisms on the composition of seawater, in: The Sea, editedby: Hill, M. N., Wiley, New York, 26–77, 1963.
www.biogeosciences.net/10/6419/2013/ Biogeosciences, 10, 6419–6432, 2013

6432 C. Du et al.: Impact of the Kuroshio intrusion on the nutrient inventory
Shaw, P. T.: The seasonal variation of the intrusion of the PhilippineSea water into the South China Sea, J. Geophys. Res., 96, 821–827, doi:10.1029/90JC02367, 1991.
Thingstad, T. F., Krom, M. D., Mantoura, R. F. C., Flaten, G. A.F., Groom, S., Herut, B., Kress, N., C. Law, S., Pasternak, A.,Pitta, P., Psarra, S., Rassoulzadegan, F., Tanaka, T., Tselepides,A., Wassmann, P., Woodward, E.M.S., Wexels Riser, C., Zodi-atis, G., and Zohary, T.: Nature of Phosphorus Limitation in theUltraoligotrophic Eastern Mediterranean, Science, 309, 1068–1071, 2005.
Tian, J. W., Yang, Q. X., Liang, X. F., Xie, L.L., Hu, D. X., Wang, F.,and Qu, T. D.: Observation of Luzon Strait transport, Geophys.Res. Lett., 33, L19607, doi:10.1029/2006GL026272, 2006.
Tian, J. W., Yang, Q. X., and Zhao, W.: Enhanced Diapycnal Mix-ing in the South China Sea, J. Phys. Oceanogr., 39, 3191–3203,doi:10.1175/2009JPO3899.1, 2009.
Tseng, C. M., Wong, G. T. F., Lin, I. I., Wu, C. R., and Liu, K. K.: Aunique seasonal pattern in phytoplankton biomass in low-latitudewaters in the South China Sea, Geophys. Res. Lett., 32, L08608,doi:10.1029/2004GL022111, 2005.
Tseng, C. M., Wong, G. T. F., Chou, W. C., Lee, B. S., Sheu, D.D., and Liu, K. K.: Temporal variations in the carbonate systemin the upper layer at the SEATS station, Deep Sea Res. II, 54,1448–1468, doi:10.1016/j.dsr2.2007.05.003, 2007.
Wong, G. T. F., Tseng, C. M., Wen, L. S., and Chung, S. W.: Nutrientdynamics and N-anomaly at the SEATS station, Deep Sea Res II.,54, 1528–1545, doi:10.1016/j.dsr2.2007.05.011, 2007.
Wu, J. F., Chung, S. W., Wen, L. S., Liu, K. K., Chen, Y.L., Chen, H. Y., and Karl, D. M.: Dissolved inorganicphosphorus, dissolved iron, and Trichodesmium in the olig-otrophic South China Sea, Global Biogeochem. Cy., 17, 1008,doi:10.1029/2002GB001924, 2003.
Biogeosciences, 10, 6419–6432, 2013 www.biogeosciences.net/10/6419/2013/