Embed Size (px)
Citation preview
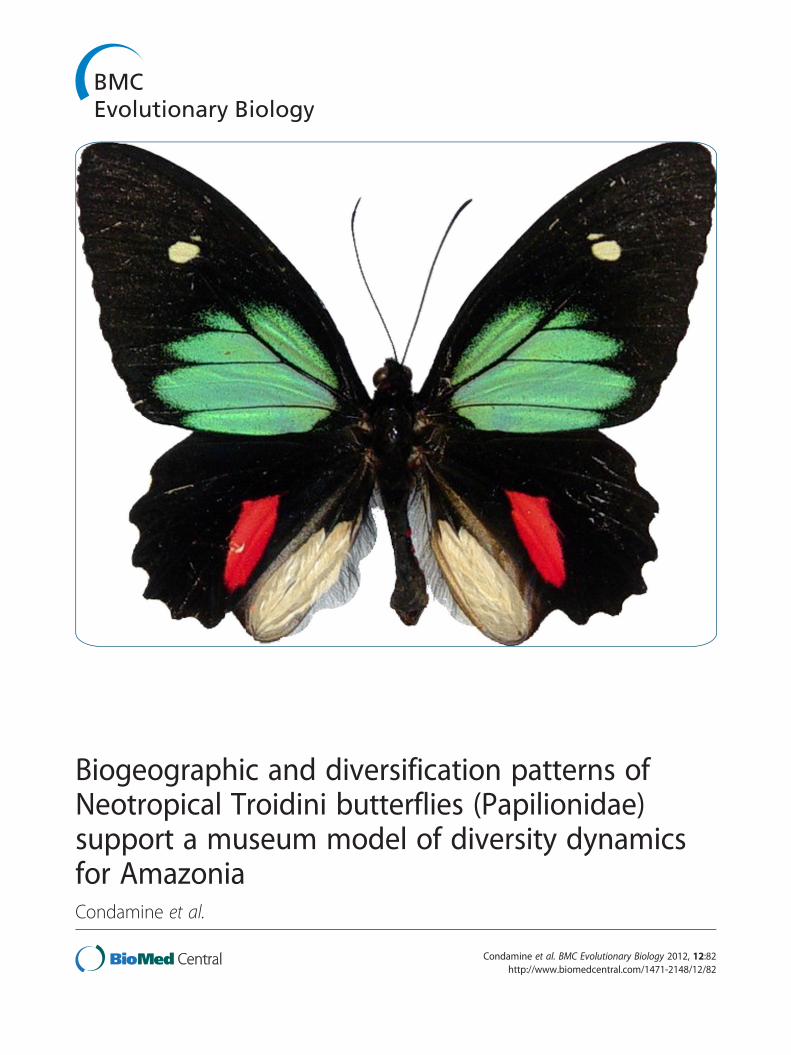
Biogeographic and diversification patterns ofNeotropical Troidini butterflies (Papilionidae)support a museum model of diversity dynamicsfor AmazoniaCondamine et al.
Condamine et al. BMC Evolutionary Biology 2012, 12:82http://www.biomedcentral.com/1471-2148/12/82
Condamine et al. BMC Evolutionary Biology 2012, 12:82http://www.biomedcentral.com/1471-2148/12/82
RESEARCH ARTICLE Open Access
Biogeographic and diversification patterns ofNeotropical Troidini butterflies (Papilionidae)support a museum model of diversity dynamicsfor AmazoniaFabien L Condamine1,2*, Karina L Silva-Brandão3, Gael J Kergoat1 and Felix AH Sperling4
Abstract
Background: The temporal and geographical diversification of Neotropical insects remains poorly understoodbecause of the complex changes in geological and climatic conditions that occurred during the Cenozoic. Tobetter understand extant patterns in Neotropical biodiversity, we investigated the evolutionary history of threeNeotropical swallowtail Troidini genera (Papilionidae). First, DNA-based species delimitation analyses wereconducted to assess species boundaries within Neotropical Troidini using an enlarged fragment of the standardbarcode gene. Molecularly delineated species were then used to infer a time-calibrated species-level phylogenybased on a three-gene dataset and Bayesian dating analyses. The corresponding chronogram was used to exploretheir temporal and geographical diversification through distinct likelihood-based methods.
Results: The phylogeny for Neotropical Troidini was well resolved and strongly supported. Molecular dating andbiogeographic analyses indicate that the extant lineages of Neotropical Troidini have a late Eocene (33–42 Ma)origin in North America. Two independent lineages (Battus and Euryades+ Parides) reached South America via theGAARlandia temporary connection, and later became extinct in North America. They only began substantivediversification during the early Miocene in Amazonia. Macroevolutionary analysis supports the “museum model” ofdiversification, rather than Pleistocene refugia, as the best explanation for the diversification of these lineages.
Conclusions: This study demonstrates that: (i) current Neotropical biodiversity may have originated ex situ; (ii) theGAARlandia bridge was important in facilitating invasions of South America; (iii) colonization of Amazonia initiatedthe crown diversification of these swallowtails; and (iv) Amazonia is not only a species-rich region but also acted asa sanctuary for the dynamics of this diversity. In particular, Amazonia probably allowed the persistence of oldlineages and contributed to the steady accumulation of diversity over time with constant net diversification rates, aresult that contrasts with previous studies on other South American butterflies.
Keywords: Amazon rainforest, Andean uplift, Biogeography, Diversification, GAARlandia connection, Swallowtailbutterflies
* Correspondence: [email protected], UMR Centre de Biologie pour la Gestion des Populations, CBGP,(INRA/IRD/CIRAD/Montpellier SupAgro), Campus International de Baillarguet,CS30016, 34988, Montferrier-sur-Lez, France2CNRS, UMR 7641 Centre de Mathématiques Appliquées(École Polytechnique), Route de Saclay, 91128, Palaiseau, FranceFull list of author information is available at the end of the article
© 2012 Condamine et al.; licensee BioMed Central Ltd. This is an Open Access article distributed under the terms of theCreative Commons Attribution License (http://creativecommons.org/licenses/by/2.0), which permits unrestricted use,distribution, and reproduction in any medium, provided the original work is properly cited.
Condamine et al. BMC Evolutionary Biology 2012, 12:82 Page 2 of 16http://www.biomedcentral.com/1471-2148/12/82
BackgroundThe Neotropical ecozone, including its Central andSouth American regions, is arguably the most species-rich terrestrial biogeographic region on Earth [1]. Theprimary hypothesis, considered the most likely explan-ation for understanding the origin and diversification ofNeotropical biodiversity, suggests that this diversityarose by in situ speciation [2-4]. However, several recentphylogenetic studies have revealed that a substantial partof the extant diversity of this region can be accountedfor by ex situ origins and dispersals of taxa into the Neo-tropics (e.g., [5-8]). These lineages subsequently diversi-fied and became major components of communitieswithin the Neotropical biota, both in term of speciesrichness and ecological dominance [9]. The mode of di-versification of this extraordinary high species diversityis often attributed to two competing hypothetic models.The ‘museum’ model postulates that gradual accumula-tion and/or preservation of species over time via con-stant speciation rates and/or low extinction rates haveshaped the present diversity [10,11]. In contrast, the‘evolutionary cradles’ model predicts that the extant di-versity is the result of recent and rapid accumulation ofspecies via high speciation rates [4,12]. Although ‘evolu-tionary cradles’ and ‘museum’ models are presented asalternative hypotheses explaining the diversification ofmany groups, both models can account for the diversifi-cation of Neotropical taxa [13], rendering the under-standing of Neotropical diversification more intricatethan expected [9]. Although the age and geographic originof many Neotropical groups is well known (e.g., [6-8]),less is known about their diversification patterns [14].Similarly, the factors that have shaped this high speciesrichness through time have been scarcely investigated in alarge-scale and temporal framework. This is especiallytrue for the processes that underlie the assembly and evo-lution of Amazonian biodiversity [15-17].Among the potential factors influencing diversification
patterns, geological history (tectonic movements andmountain orogenesis) has had profound consequencesfor the origin and evolution of Neotropical biodiversitythrough the rise and fall of biogeographic barriers [6,18].For instance the Andean uplift affected regional climate,which in turn dramatically changed the Amazonianlandscape by reconfiguring drainage systems [15]. Climatechange is often postulated as a major driver of present-day biodiversity pattern, thus favouring the ‘evolutionarycradles’ model, but investigating its effects through timeremains challenging [16,19-21]. In addition, differences inclade age may underlie variation in species richnessamong lineages (i.e., ‘time-for-speciation hypothesis’;[22,23]), while speciation rates may be intrinsically higher(or extinction rates lower) in clades during the periodsthat they occupy tropical versus temperate regions, even
if the clades are the same age (i.e., ‘diversification ratehypothesis’; [24]). Finally, biotic effects such as hostplant interactions can contribute to the geographic diver-sification of a group [25,26]. These distinct factors arepotentially linked and interwoven, and it is difficult todisentangle and quantify their respective contributionto the establishment of Neotropical diversity [17]. Asadvocated by several authors, solving this puzzlerequires the combination of multiple research fieldssuch as biogeography, climatology, ecology, evolutionarybiology, paleogeography, and palaeontology (e.g., [13,17]).In this study, we investigate the diversification patterns
of three Neotropical swallowtail genera from the tribeTroidini (Lepidoptera, Papilionidae). This tribe com-prises some of the most spectacular butterflies on Earthand represents one of the best-studied swallowtailgroups (e.g., [27-29]). Troidini are predominantly trop-ical and include about 130 species divided into 12 gen-era, with most species encountered in the lowlandrainforests of the Neotropical and Indo-Australianregions [30]. We focused on the New World Troidini,which include three genera: Battus (10 to 12 species),Euryades (2 species), and Parides (up to 35 species)[27,29]. These three genera do not form a monophyleticclade [28,31]. The genus Battus, recovered as sister tothe remaining Troidini, is distributed from North Amer-ica to southern South America, with its species richnessincreasing towards the equator [28]. Exclusively Neo-tropical, the genus Parides is the most diversified genusof Troidini [29]. Many subspecies or varieties have beendescribed, possibly constituting species of their own.The genus Euryades, sister to Parides, has a peculiar dis-tribution confined to the Cerrado region (south-easternSouth America). Interestingly Troidini are frequentlycited as classic examples of coevolution with their hostplants Aristolochia [32,33], and are thus commonlycalled pipevine swallowtails. The larvae of Troidini feedexclusively on Aristolochia species, and sequester themajor secondary metabolites of these plants [33].Although this association partially agrees with the prem-ises of the coevolution hypothesis [32], Silva- Brandãoet al. [34] demonstrated that there is no strict codiver-sification pattern between the insects and plants, sug-gesting that their diversification was probably notdriven by their host plant history. This hypothesis waspartially confirmed by a study of Fordyce [35] thatfound no evidence of diversification rate shifts withinAristolochiaceae feeders throughout their history.We have previously demonstrated that the extant di-
versity of troidines from the Western Hemisphere had aboreotropical origin followed by southward dispersal oftaxa into the Neotropical region [36]. We thus focushere on exploring the tempo and mode of diversificationof Troidini within the Neotropics. To better understand
Condamine et al. BMC Evolutionary Biology 2012, 12:82 Page 3 of 16http://www.biomedcentral.com/1471-2148/12/82
this diversity pattern, a species-level and molecularlydated phylogenetic hypothesis is necessary to assess andquantify the possible factors and mechanisms that haveshaped their present Neotropical biodiversity throughtime. Until now, few studies have focused on the internalrelationships of the three genera (but see [27,28]), andeven fewer have tried to assess their divergence times.Using a molecular phylogenetic framework for the NewWorld Troidini of the genera Battus, Euryades and espe-cially Parides, this study aims to: (i) use a DNA-baseddelimitation method to clarify the species status of sev-eral Troidini species to provide better estimates of spe-cies richness; (ii) infer their historical biogeographichistory using a Bayesian relaxed-clock method andmodel-based geographic analyses; and (iii) investigatetheir diversification pattern to link possible changes indiversification rates with proximate mechanisms in pastabiotic and/or biotic events.
MethodsTaxon sampling and Molecular dataOverall, our taxon sampling includes five Battus out of11 described species, the two described Euryades spe-cies, and 21 Parides species out of 34, representing allspecies groups (sensu [29]). The taxonomic coverageencompasses about 60% of all Neotropical Troidini spe-cies (Additional file 1 Dataset S1). Outgroup selection isa crucial step in phylogenetics, especially in estimates ofdivergence times [37]. Based on the most comprehensiveand recent phylogeny of swallowtail butterflies [36],three outgroups were chosen. These species (Graphiumagamemnon, Papilio machaon, and Teinopalpus imperialis)were included as they represent sister tribes to theTroidini (Leptocircini, Papilionini and Teinopalpinirespectively; [31]). Sampled taxa and GenBank accessionnumbers for all materials are given in Additional file 1Dataset S1.All molecular data on Neotropical Troidini were
retrieved from previously published studies on the Gen-Bank database [28,30,31,34,38,39]. About 2.3 kilobases oftwo mitochondrial genes were used, namely cytochromeoxidase I (COI) and cytochrome oxidase II (COII), andabout 1.2 kilobases of the nuclear protein-coding geneelongation factor 1 alpha (EF-1α). The phylogenetic util-ity of these genes has been widely demonstrated forPapilionidae (e.g., [36]), and especially for Troidini[28,30]. In summary, sequence for 165 specimens forCOI, 71 specimens for COII, and 50 specimens for EF-1α have been retrieved (including outgroups). Thesesequences were aligned using ClustalX 2.0 with the de-fault settings [40]. The reading frame of coding geneswas further checked under Mesquite 2.75 (available at:www.mesquiteproject.org).
DNA-barcode marker and species delimitation procedureThe aim of tree-based DNA species delimitation is toclassify observed branching time intervals defined bynodes in a clock-constrained phylogeny as either beingthe result of inter-specific (diversification) or intraspeci-fic (coalescent) processes of lineage branching [41]. Inour study, this approach was implemented to provide anobjective assessment of the number of genetic lineagesthat correspond to species, the latter entities being cru-cial to all biogeographic and diversification analyses[42]. Although the results of DNA-based genetic lineagedelimitation can also be used to clarify and test the spe-cies taxonomy of the group, we have chosen to refer tothese entities in a conservative manner by retaining alloriginal species names associated via morphology withthe specimens. Numbers at the end of the species namedistinguish distinct molecular entities within a morpho-logically defined species.The General Mixed Yule Coalescent model (GMYC)
was employed to perform analyses of species delimitation[41]. This method is implemented in R software and usesthe splits (available at http://r-forge.r-project.org/projects/splits/) and the ape [43] packages. This approach usuallyrelies on a single threshold to delimit nodes defining themost recent common ancestor of species.Phylogenetic analyses were performed on the COI
mitochondrial gene, well known as the standard barcoderegion for animals [44]. Here we used the entire COIgene (1,527 bp) rather than the standard 648 bp frag-ment [44]. We did not perform these phylogenetic ana-lyses with the whole molecular dataset because there aremissing data for the other genes (i.e., only 50 specimensfor EF-1α versus 165 specimens for COI) that can altersome parameters such as branch length [41]. However, aphylogeny using only the EF-1α gene was also con-structed as an independent genomic test of the COI-defined molecular lineages. This provides a practical andconceptual link between molecular entities defined solelyby single-locus barcodes and species as population unitsdefined by maintenance of their genomic integrity,equivalent to reproductive isolation.Bayesian phylogenetic inference was performed to re-
cover relationships (see below for details on settings forphylogenetic reconstructions). From the COI-phylogeny,the program PATHd8 [45] was used to transform thetree (with branch lengths scaled as evolutionary rate)into an ultrametric tree (with branch lengths propor-tional to time) using the mean path length algorithm.When applying the GMYC model on the ultrametrictree [41], a transition in branching rates may be identi-fied as a sudden increase in slope of the plot. We com-pared the likelihood of the null model (assuming asingle branching process for the tree) to the GMYCmodel (assuming significant changes in branching time).
Condamine et al. BMC Evolutionary Biology 2012, 12:82 Page 4 of 16http://www.biomedcentral.com/1471-2148/12/82
The threshold model has five parameters (λ1, speciationrate before the threshold; λ2, speciation rate after thethreshold; p1, scaling parameter before the threshold;p2, scaling parameter after the threshold; and T, thresh-old time), whereas the null model has two (λ1 and p1);hence, there are three degrees of freedom (d.f.) for thecomparison.The delimitation of molecular species was then used
to build a ‘reduced dataset’. This new dataset compriseda single specimen for each putative species cluster (mo-lecular entity) obtained by reconstructing the consensusof all the sequences recovered in the same species clus-ter. The consensus sequences were inferred by usingMesquite with default settings. Then we combined COIIand EF-1α sequences with COI-consensus sequences.This ‘reduced dataset’ was further used to reconstruct aspecies-level phylogeny to estimate the divergence times,geographic range evolution and diversification rates ofNeotropical troidine species.
Species-level phylogenetic analysesPhylogenetic analyses were performed with probabilisticmethods (maximum likelihood, (ML) and Bayesian infer-ence (BI)). The molecular dataset was combined andpartitioned into six partitioning strategies (PS): (i) a sin-gle partition encompassing all genes (PS1), (ii) two parti-tions (one partition for the mitochondrial genes and onepartition for the nuclear gene; PS2), (iii) three partitions(one partition per gene; PS3); (iv) three partitions (onepartition per codon position; PS4); (v) six partitions (onepartition per codon position for the mitochondrial cod-ing genes, one partition per codon position for the nu-clear coding gene; PS5); and (vi) nine partitions (onepartition per codon position for each protein-codinggene; PS6). For each partition, the substitution model ofsequence evolution was selected using jModelTest 0.1[46] with the Bayesian information criterion (BIC) [47].The General Time Reversible (GTR) + I + Γ model wasrecovered for all partitions, except those using codonpositions (PS4-6) where the second position gave F81 +I + Γ and the third position consistently gave GTR+ Γ.The tRNA-leucine sequence between COI and COII wasnot coded with a substitution model but instead treatedas non-coding.Maximum likelihood analyses were carried out using
PhyML 3.0 [48] to obtain fast and accurate phylogeneticresults. All the analyses were parameterized with thebest-fit substitution model, the fastest algorithm to per-form Nearest Neighbor Interchanges and also the algo-rithm Subtree Pruning and Regrafting [48], a BIONJstarting tree, 1,000 bootstrap replicates, and theremaining parameters set to default settings. Independ-ent runs were carried out to check congruence in likeli-hood scores [49]. Bootstrap values (BV)≥ 70% were
considered as moderate support whereas BV ≥ 90% indi-cated strong support for a node [49].Bayesian inference analyses were performed with
MrBayes 3.1.2 [50] with the following settings: (i) twoindependent runs with eight Markov Chains MonteCarlo (MCMC, one cold and seven incrementallyheated), (ii) 10.106 generations for the complete dataset,(iii) the trees were sampled every 100th cycle and eachMCMC started from a random tree. To generate the50% majority rule consensus tree, a conservative burn-inof 25% was applied after checking the log-likelihoodscores and the split-frequencies of the runs, and allsampled trees prior to reaching these generations werediscarded. Posterior Probabilities (PP) estimated thenode supports, and PP ≥ 0.95 were usually considered asstrong support [49]. The potential scale reduction fac-tors (PSRF) were checked after the end of each analysisand should approach 1 as runs converge [49].Selection of the best-fit PS (with the best-fit substitu-
tion model) was performed using Bayes Factors (BF) forBI [47,51]. Estimates of harmonic mean (HM) of thelikelihood values were obtained with the sump commandin MrBayes, and were used to approximate the BF be-tween two substitution models or partitioning strategies.BF values > 10 were considered to significantly favourone model over another [47,51]. Hypothesis tests (e.g.,monophyletic constraints) were conducted by comparinglikelihood scores with SH-tests [52] in ML using 1,000RELL bootstrap replicates, and with BF approximated byharmonic means in BI.
Bayesian estimates of divergence timesThe applicability of a molecular clock was assessed foreach node using PATHd8 [45]. Because the hypothesis ofa molecular clock was not statistically supported for ourdataset, a Bayesian relaxed-clock (BRC) approach wasused to take into account rate variation across lineages[53]. It uses MCMC procedures to approximate the pos-terior distribution of rates and divergence times and sim-ultaneously infer their credibility intervals. The BRCanalyses were carried out with BEAST 1.6.2 [54]. Weused the standard log-normal model to account forchanges in evolution rates, the latter being uncorrelatedin BEAST. The xml-file for BEAST analyses was createdusing the BEAUti interface (included in the BEAST pack-age) with the following non-default settings and priors:the Site Model was set to the same nucleotide substitu-tion model evolution, with partitioning (1+ 2) and 3 forall partitions, the Clock Model was set to a relaxed clockwith uncorrelated rates, the Tree Model was set to a Yuleprocess of speciation, and the MCMC parameters werefixed to 5.107 generations with sampling every 1,000 gen-erations and the first 25% discarded as burn-in. Thestarting tree was enforced with the best MrBayes
Condamine et al. BMC Evolutionary Biology 2012, 12:82 Page 5 of 16http://www.biomedcentral.com/1471-2148/12/82
topology defined by Bayes factors. The remaining para-meters were left unchanged. In BEAST analyses, only asingle MCMC explores the data; thus several independ-ent analyses were performed to check congruence ofresults and likelihood scores. The output files were com-bined and checked in LogCombiner 1.6.2 (included inthe BEAST package), and also checked in Tracer 1.5[54]. Under Tracer, an effective sample size (ESS) super-ior or equal to 500 for all parameters was used to com-pare the analyses. Chronograms from BEAST aremaximum clade credibility trees with the 95% highestposterior density (95% HPD) rescaled to match posteriormedian estimates, compiled from posterior trees usingTreeAnnotator 1.6.2 (included in the BEAST package).The BRC approach also allows using flexible techni-
ques for incorporating calibrations leading to discussionabout approaches to calibrating estimates of divergencetimes [53]. The selection of calibrations is an importantissue because divergence time estimates are taken intoaccount by the biogeographic analyses used in this study[55]. For swallowtails, the fossil record is scarce and theknown unambiguous swallowtail fossils do not belong tothe Neotropical Troidini genera. Therefore, secondarycalibrations were chosen to calibrate specific nodes.Calibrations were retrieved from a previous study thatestimated the divergence times of the Papilionidae usingthe most comprehensive taxon sampling and moleculardataset [36]. As a similar phylogenetic pattern wasrecovered for Troidini in this study, dates were con-strained for each corresponding node, using the 95%HPD values. Seven calibration points were set to uni-form distribution following the recommendation ofHo and Phillips [37]. The prior distribution for theroot time (Root Height) was constrained to be within40.61–57.39 Ma (corresponding to the 95% HPD forthe age of Papilioninae), the node between Troidiniand Papilionini was set to 37.23–53.05 Ma, and thenode between Papilionini and Teinopalpini was set to33.16–48.64 Ma. Finally Troidini was constrained to32.45–46.92 Ma, Battus was constrained to be within17.22–29.29 Ma, Euryades was set to 7.21–16.9 Ma,and Parides constrained to 18.56–28.45 Ma [36].
Historical biogeographyReconstruction of ancestral areas was inferred using theDispersal–Extinction–Cladogenesis (DEC) model ofrange evolution, as implemented in the softwareLagrange [55]. The distribution of New World Troidiniextends from the Nearctic to the Neotropics, which weresubdivided into smaller biogeographic units. For thatpurpose, we followed several studies [6,15,16] and usedseveral lines of evidence to define the areas, such aspaleogeography (e.g., [56]) or biodiversity hotspots [1].The model comprised six component areas, namely (A)
Nearctic (North America up to Mexico); (B) Mexican re-gion (i.e., Central America, including Northern Mexicoup to the Isthmus of Panama); (C) Northern SouthAmerica (including the Chocó and Páramo regions, theNorthern Andes and the Guiana shield); (D) CentralAndes (all along the South America); (E) Amazonianforest; and (F) Brazilian shield (South-Eastern SouthAmerica, including the Cerrado region and BrazilianAtlantic forest) (see inset in Figure 1). Species ranges werefinally coded by presence–absence data, excluding mar-ginal distributions or known human introductions [6,57].Among the theoretically possible geographic ranges,
some were excluded from consideration based on thebiological implausibility of their spatial configurations(e.g., wide disjunction between A and F). We thus defineda biogeographic model by taking into account the geo-logical history of the region. Following the principlesdescribed in Ree and Smith [55], temporal constraints onrates of dispersal were designed between areas based onpaleogeographic reconstructions of area position throughtime (e.g., [56]). Constraints were implemented as a seriesof five time slices:
(1)Origin of Troidini up to 32 Ma. Amazonian forestextended north to the Caribbean coast of SouthAmerica where a diverse rain forest existed [15].Andes orogenesis had just begun, and the Pozoembayment separated the northern and centralAndes. In the North, GAARlandia (Greater Antillesand Aves Ridge land bridge; [58]) connected theNearctic and the Neotropics [15].
(2)32 to 23 Ma. This period corresponded to thepresence of a sub-Andean river system where SouthAmerica was a lowland river-dominated landscape[15]. GAARlandia disappeared [58], as well as thePozo embayment, leaving space for the westernAndean portal [6]. This was also a period ofintensified Andean uplift.
(3)23 to 10 Ma. This time was characterized by theintensification of the Andean uplift and subsequentchanges in Amazonian landscape with the formationof the Pebas system separating western and easternSouth America [15]. This period is noteworthy fornumerous evolutionary radiations recorded incentral Amazonia [5,6,14,59].
(4)10 to 7 Ma. The Amazon River originated duringthis time. As a result of the Andean uplift, thedrainage system changed and fragmented theAmazonian forest with the formation of the Acresystem [15].
(5)7 Ma to present. The Amazon River is fullyestablished. This period corresponds to theformation of the Isthmus of Panama connectingCentral and South America [15,60].
Condamine et al. BMC Evolutionary Biology 2012, 12:82 Page 6 of 16http://www.biomedcentral.com/1471-2148/12/82
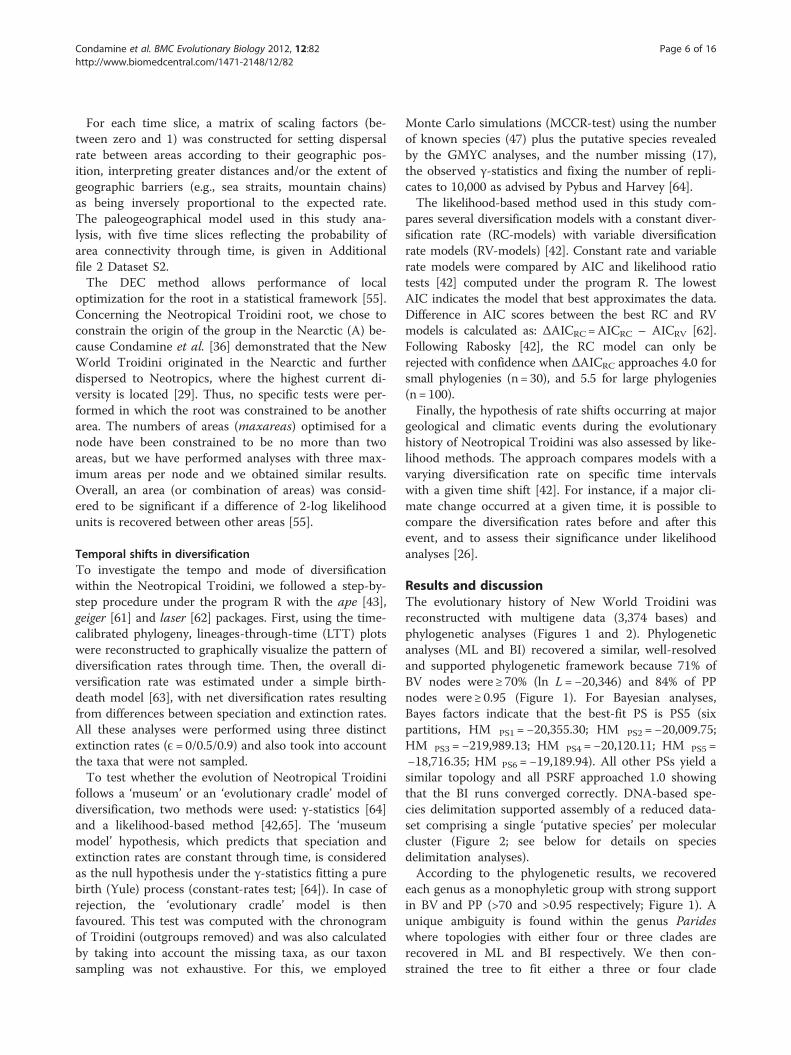
For each time slice, a matrix of scaling factors (be-tween zero and 1) was constructed for setting dispersalrate between areas according to their geographic pos-ition, interpreting greater distances and/or the extent ofgeographic barriers (e.g., sea straits, mountain chains)as being inversely proportional to the expected rate.The paleogeographical model used in this study ana-lysis, with five time slices reflecting the probability ofarea connectivity through time, is given in Additionalfile 2 Dataset S2.The DEC method allows performance of local
optimization for the root in a statistical framework [55].Concerning the Neotropical Troidini root, we chose toconstrain the origin of the group in the Nearctic (A) be-cause Condamine et al. [36] demonstrated that the NewWorld Troidini originated in the Nearctic and furtherdispersed to Neotropics, where the highest current di-versity is located [29]. Thus, no specific tests were per-formed in which the root was constrained to be anotherarea. The numbers of areas (maxareas) optimised for anode have been constrained to be no more than twoareas, but we have performed analyses with three max-imum areas per node and we obtained similar results.Overall, an area (or combination of areas) was consid-ered to be significant if a difference of 2-log likelihoodunits is recovered between other areas [55].
Temporal shifts in diversificationTo investigate the tempo and mode of diversificationwithin the Neotropical Troidini, we followed a step-by-step procedure under the program R with the ape [43],geiger [61] and laser [62] packages. First, using the time-calibrated phylogeny, lineages-through-time (LTT) plotswere reconstructed to graphically visualize the pattern ofdiversification rates through time. Then, the overall di-versification rate was estimated under a simple birth-death model [63], with net diversification rates resultingfrom differences between speciation and extinction rates.All these analyses were performed using three distinctextinction rates (E= 0/0.5/0.9) and also took into accountthe taxa that were not sampled.To test whether the evolution of Neotropical Troidini
follows a ‘museum’ or an ‘evolutionary cradle’ model ofdiversification, two methods were used: γ-statistics [64]and a likelihood-based method [42,65]. The ‘museummodel’ hypothesis, which predicts that speciation andextinction rates are constant through time, is consideredas the null hypothesis under the γ-statistics fitting a purebirth (Yule) process (constant-rates test; [64]). In case ofrejection, the ‘evolutionary cradle’ model is thenfavoured. This test was computed with the chronogramof Troidini (outgroups removed) and was also calculatedby taking into account the missing taxa, as our taxonsampling was not exhaustive. For this, we employed
Monte Carlo simulations (MCCR-test) using the numberof known species (47) plus the putative species revealedby the GMYC analyses, and the number missing (17),the observed γ-statistics and fixing the number of repli-cates to 10,000 as advised by Pybus and Harvey [64].The likelihood-based method used in this study com-
pares several diversification models with a constant diver-sification rate (RC-models) with variable diversificationrate models (RV-models) [42]. Constant rate and variablerate models were compared by AIC and likelihood ratiotests [42] computed under the program R. The lowestAIC indicates the model that best approximates the data.Difference in AIC scores between the best RC and RVmodels is calculated as: ΔAICRC=AICRC – AICRV [62].Following Rabosky [42], the RC model can only berejected with confidence when ΔAICRC approaches 4.0 forsmall phylogenies (n= 30), and 5.5 for large phylogenies(n= 100).Finally, the hypothesis of rate shifts occurring at major
geological and climatic events during the evolutionaryhistory of Neotropical Troidini was also assessed by like-lihood methods. The approach compares models with avarying diversification rate on specific time intervalswith a given time shift [42]. For instance, if a major cli-mate change occurred at a given time, it is possible tocompare the diversification rates before and after thisevent, and to assess their significance under likelihoodanalyses [26].
Results and discussionThe evolutionary history of New World Troidini wasreconstructed with multigene data (3,374 bases) andphylogenetic analyses (Figures 1 and 2). Phylogeneticanalyses (ML and BI) recovered a similar, well-resolvedand supported phylogenetic framework because 71% ofBV nodes were ≥ 70% (ln L=−20,346) and 84% of PPnodes were ≥ 0.95 (Figure 1). For Bayesian analyses,Bayes factors indicate that the best-fit PS is PS5 (sixpartitions, HM PS1 =−20,355.30; HM PS2 =−20,009.75;HM PS3 =−219,989.13; HM PS4 =−20,120.11; HM PS5 =−18,716.35; HM PS6 =−19,189.94). All other PSs yield asimilar topology and all PSRF approached 1.0 showingthat the BI runs converged correctly. DNA-based spe-cies delimitation supported assembly of a reduced data-set comprising a single ‘putative species’ per molecularcluster (Figure 2; see below for details on speciesdelimitation analyses).According to the phylogenetic results, we recovered
each genus as a monophyletic group with strong supportin BV and PP (>70 and >0.95 respectively; Figure 1). Aunique ambiguity is found within the genus Parideswhere topologies with either four or three clades arerecovered in ML and BI respectively. We then con-strained the tree to fit either a three or four clade
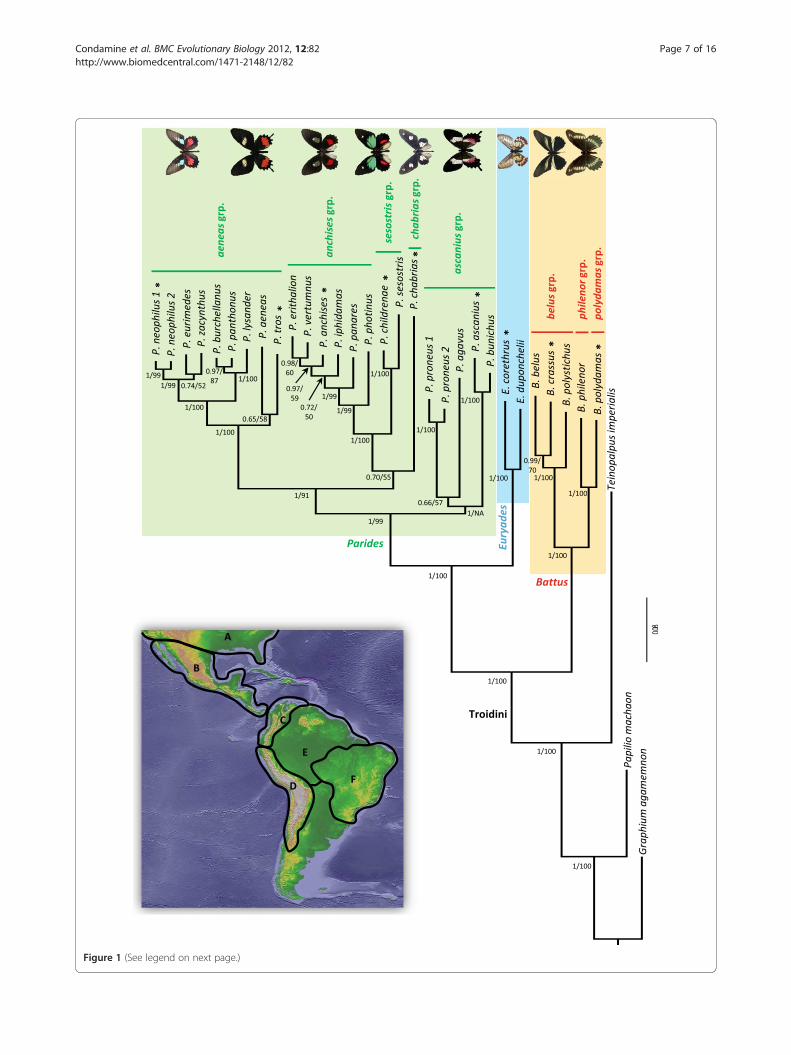
Figure 1 (See legend on next page.)
Condamine et al. BMC Evolutionary Biology 2012, 12:82 Page 7 of 16http://www.biomedcentral.com/1471-2148/12/82
(See figure on previous page.)Figure 1 Phylogeny of Neotropical Troidini obtained with the best-fit partitioning strategy (six partitions) under Bayesian inference.Posterior probabilities (PP) and maximum likelihood bootstrap values (BV) are shown by nodes. NA indicates that ML analyses did not recover thisbranching. Coloured tinted boxes highlight the three genera, and the species groups are also indicated within Battus and Parides. For illustrationpurposes, images of some species are shown beside the tree for species with asterisks (*). The geographic map shows areas used inbiogeographic analyses (see Materials and Methods for details).
Condamine et al. BMC Evolutionary Biology 2012, 12:82 Page 8 of 16http://www.biomedcentral.com/1471-2148/12/82
topology in ML and BI respectively. Their likelihoodscores were further compared with SH-test [52] and BF[47,51]. Both analyses confirmed that the four-clade top-ologies are not significantly better supported than thethree-clade topologies because the likelihood in the MLanalysis is not statistically different (ln L Constrained =−20,299; p > 0.05 for SH-test) and the harmonic meanhas increased in BI (HM Constrained =−18,733.60; BF < 10).Because Silva-Brandão et al. [28] and Condamine et al.[36] also recovered the three-clade topology, it waspreferentially used to investigate the tempo and modeof diversification of Troidini.
Through GAARlandia to Amazonia: evolutionary radiationof Neotropical TroidiniOur molecular dating analyses suggest that Troidinievolved in the late Eocene/early Oligocene boundaryaround 37 Ma with a 95% HPD between 32.5–42.2 Ma(Figure 3; maximum clade credibility tree with medianages from the Bayesian uncorrelated lognormal methodis provided in Additional file 3 Dataset S3). Most im-portantly, our dating and biogeographic analyses eluci-date the colonization of South America by Troidini,indicating that these swallowtails have independentlycolonized South America twice from the Nearctic regionbecause Battus and Euryades+ Parides are not mono-phyletic within the tribe (see [28,30,36]). The ancestor ofEuryades and Parides and that of Battus diversified inSouth America around 27 Ma (95% HPD 23–32.4 Ma)and 21 Ma (95% HPD 17.2-26.5 Ma) respectively.Our biogeographic analyses permit investigation of the
nature of the colonization routes that have been used toreach South America. Two hypotheses can be postulateda priori: either a dispersal event through Central Amer-ica, by crossing the oceanic barrier between Central andSouth America (Panama Strait) [60], or a dispersal eventthrough the Caribbean Sea using intervening islands asstepping-stones (GAARlandia bridge) [66]. Interestingly,for both lineages the biogeographic results provide moresupport for the GAARlandia route as a stepping-stonepathway to colonizing South America. Central Americawas never recovered as the most likely ancestral area forthe crown of each Neotropical lineage (more than 2-loglikelihood difference with the optimal area). Instead theAmazon forest was consistently recovered (lnL=−90.12for each clade), thus suggesting that both clades
colonized this area from the Nearctic region throughGAARlandia rather than via Central America. It is worthstressing that our biogeographic stratified model did notinfluence this result as we used similar rates of dispersalto account for possible dispersal events toward SouthAmerica via the GAARlandia bridge or the CentralAmerica region. In addition, the temporal time frame ofcolonization of South America is congruent with forma-tion of the GAARlandia bridge and the emergence ofnumerous intermediate islands that formed a pathwaybetween the Nearctic and South America (Figures 3 and4; [15,58,66]).We speculate that early Troidini dispersed from North
America to South America via the temporary connectionof the GAARlandia bridge during Eocene–Oligocenetimes, which spanned 35–32 Ma [66]. This land connec-tion may have also been important for the evolution ofPhyciodina and Euptychiina butterflies (Nymphalidae)[67,68 respectively]. Our hypothesis implies that earlycolonizers of North America went extinct and currentTroidini in North and Central America are the resultof later colonizations from South America (see below;Figures 3 and 4).After their arrival in South America, Amazonia played
a significant role in the early evolutionary history of theTroidini, especially as a driver of diversification. Strik-ingly, the biogeographic analyses show that the Amazonforest region is the main geographic area of diversifica-tion for the Neotropical Troidini genera (Figure 3). Thisresult is not unexpected because the Amazon forest cov-ered most of northern South America until the Andesinitiated orogenesis 20–23 Ma [15]. We thus hypothesizethat swallowtails reached South America in the northernpart where Amazonian rainforest was already presentand diversified (Figure 4; [15]). Meanwhile, the Andesrose and the tropical rainforest was subsequently con-fined to central South America. It is interesting to notethat we observed the same pattern in swallowtails thattracked Amazonia, a trend explained by tropical nicheconservatism [22] as shown by the maintenance of theancestral area in the Amazonian region (Figures 3 and4). This role for Amazonia is likely to be reinforced withmore extensive taxon sampling, since several of themissing species of Battus and Parides are restricted tothe Amazon Basin (e.g., B. madyes and B. laodamas, and10 out of 13 species of Parides) [27,29].
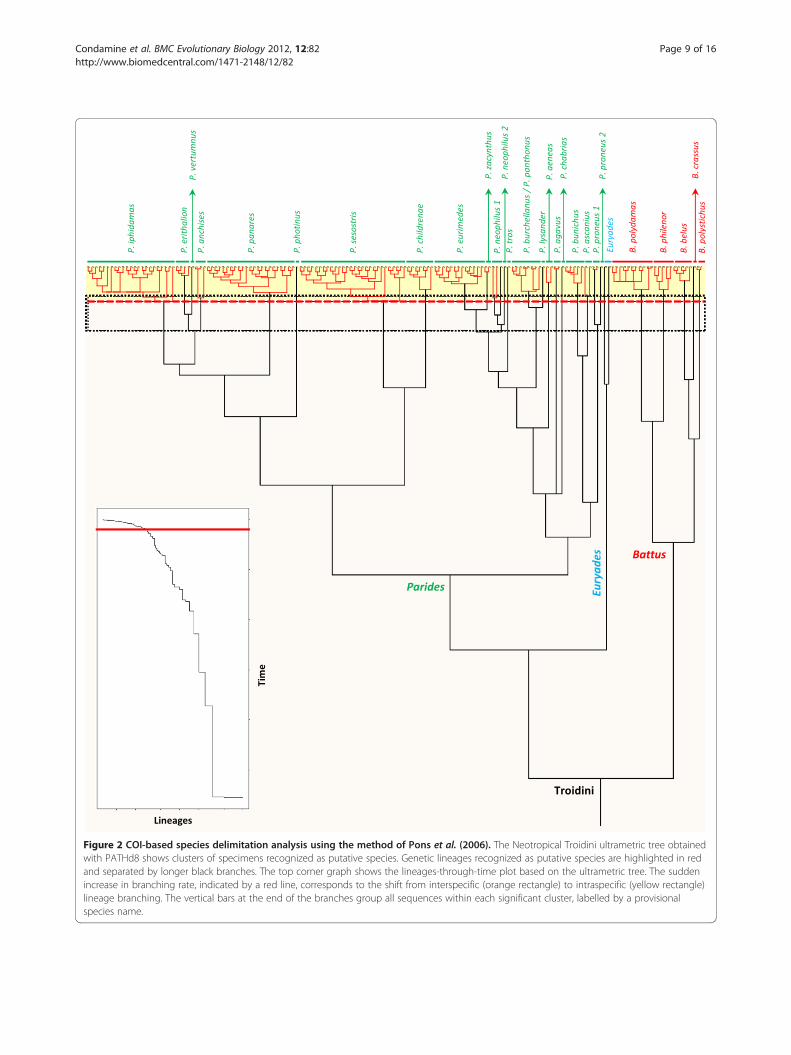
Figure 2 COI-based species delimitation analysis using the method of Pons et al. (2006). The Neotropical Troidini ultrametric tree obtainedwith PATHd8 shows clusters of specimens recognized as putative species. Genetic lineages recognized as putative species are highlighted in redand separated by longer black branches. The top corner graph shows the lineages-through-time plot based on the ultrametric tree. The suddenincrease in branching rate, indicated by a red line, corresponds to the shift from interspecific (orange rectangle) to intraspecific (yellow rectangle)lineage branching. The vertical bars at the end of the branches group all sequences within each significant cluster, labelled by a provisionalspecies name.
Condamine et al. BMC Evolutionary Biology 2012, 12:82 Page 9 of 16http://www.biomedcentral.com/1471-2148/12/82
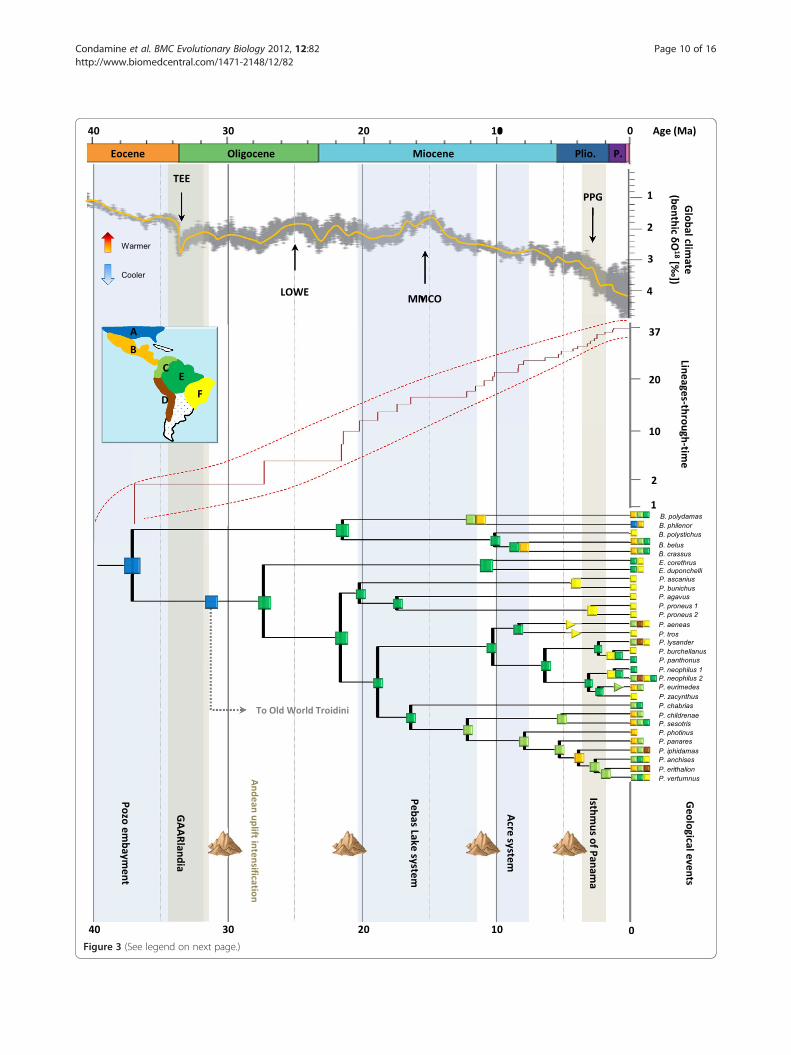
Figure 3 (See legend on next page.)
Condamine et al. BMC Evolutionary Biology 2012, 12:82 Page 10 of 16http://www.biomedcentral.com/1471-2148/12/82
(See figure on previous page.)Figure 3 Origin and diversification pattern of Neotropical Troidini. The uppermost panel shows the evolution of paleoclimate as estimatedby proxy Benthic δO18 [20. Major climate events are indicated. The lineages-through-time plot is placed next, with the 95% confidence intervalindicated by a dotted red line. Most likely biogeographic reconstructions (inferred by the DEC model) are shown on the median-age BEASTchronogram of Neotropical Troidini. Major geological events are also indicated to show congruence between speciation and possible factors ofdiversification.
Condamine et al. BMC Evolutionary Biology 2012, 12:82 Page 11 of 16http://www.biomedcentral.com/1471-2148/12/82
Diversification pattern, biogeography and the role ofAmazonia in the NeotropicsThe diversification of Neotropical biodiversity has longbeen subject to debates and assumptions, especiallyregarding explanations for the megadiverse richness ofNeotropical insects (e.g., [6,12,15,17]). Few studies haveinvestigated the evolutionary history of these organisms(but see [13]). How this biodiversity evolved through
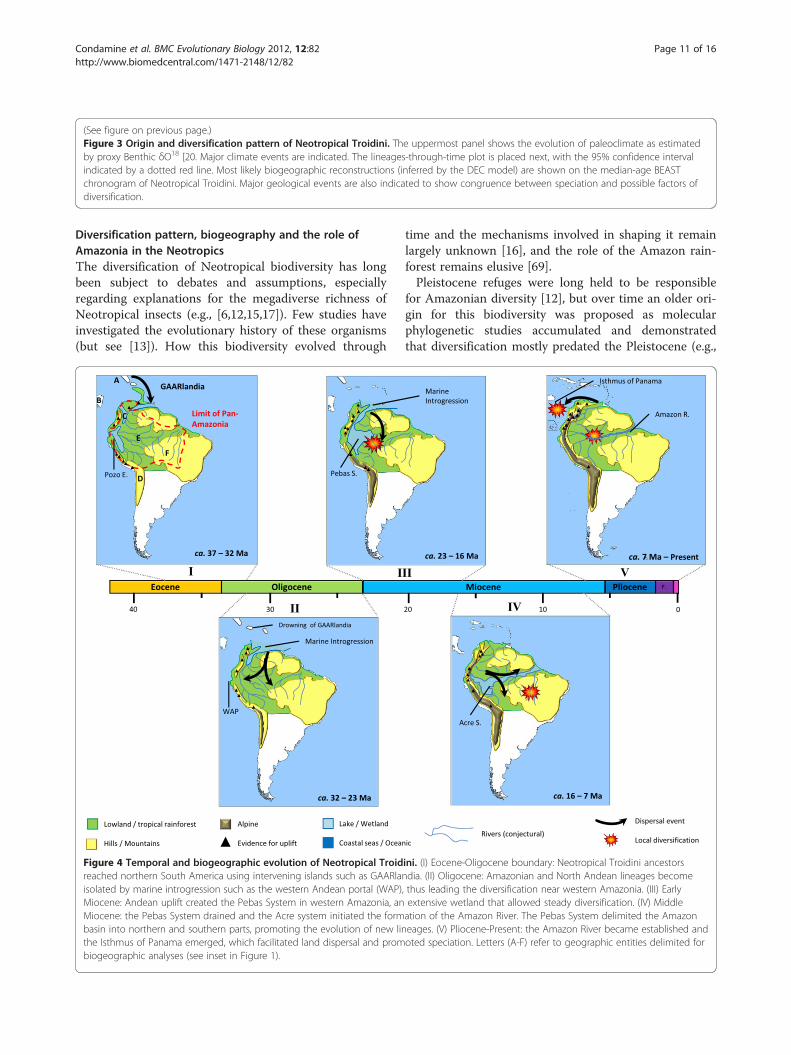
Figure 4 Temporal and biogeographic evolution of Neotropical Troidreached northern South America using intervening islands such as GAARlaisolated by marine introgression such as the western Andean portal (WAP)Miocene: Andean uplift created the Pebas System in western Amazonia, anMiocene: the Pebas System drained and the Acre system initiated the formbasin into northern and southern parts, promoting the evolution of new linthe Isthmus of Panama emerged, which facilitated land dispersal and prombiogeographic analyses (see inset in Figure 1).
time and the mechanisms involved in shaping it remainlargely unknown [16], and the role of the Amazon rain-forest remains elusive [69].Pleistocene refuges were long held to be responsible
for Amazonian diversity [12], but over time an older ori-gin for this biodiversity was proposed as molecularphylogenetic studies accumulated and demonstratedthat diversification mostly predated the Pleistocene (e.g.,
ini. (I) Eocene-Oligocene boundary: Neotropical Troidini ancestorsndia. (II) Oligocene: Amazonian and North Andean lineages become, thus leading the diversification near western Amazonia. (III) Earlyextensive wetland that allowed steady diversification. (IV) Middleation of the Amazon River. The Pebas System delimited the Amazoneages. (V) Pliocene-Present: the Amazon River became established andoted speciation. Letters (A-F) refer to geographic entities delimited for
Condamine et al. BMC Evolutionary Biology 2012, 12:82 Page 12 of 16http://www.biomedcentral.com/1471-2148/12/82
[15]). Our molecular dating results corroborate thistrend, as Neotropical Troidini appeared around 27 and21 Ma. The overall shape of the LTT plot (Figure 3) isfairly linear during this time, a pattern generally asso-ciated with a constant rate of diversification [42,63].Both approaches, γ-statistics and the likelihood-basedmethod, confirmed that diversification rates have notsignificantly varied through time. The γ-statisticsreturned an observed value of γ=−0.1573 at p= 0.437,indicating that rates remained constant according to thestandard value of −1.645 [64]. Based on the MCCR-test,which takes into account the missing taxon sampling,the trend was confirmed with a critical value of γ=−1.78and p= 0.659. The likelihood-based method also sup-ports a constant rate model of diversification becauseΔAICRC =AICRC – AICRV=−0.617, and favours the purebirth model over the Yule-3-rates model (see Additionalfile 4 Table S1 for details). A likelihood ratio test per-formed on the two previously best-selected models con-firms that the constant rate model is significantlysupported (Likelihood ratio = 8.582; p= 0.0034). To con-firm these results, a relative cladogenesis test, as imple-mented in the geiger package [61], was used to identifylineages with unusually slow or rapid diversification ratesfor all slices through the tree (with the Bonferroni cor-rection and 0.05 as the cut-off for significant p-value).The test highlights that no shift in diversification ratesis evident for the Neotropical Troidini.We repeated all analyses for only the Euryades+
Parides clade (excluding the Battus clade), since theNeotropical Troidini are not monophyletic (see above;[36]). We obtained very similar results to the wholeclade analysis for (i) γ-statistics: γ=−0.091 at p= 0.464(MCCR-test: critical value of γ=−1.951 and p= 0.615);and (ii) the likelihood-based method: with the pure birthas the best constant rate model (AICRC = 46.437) and theYule-3-rates as the best rate variable model (AICRV=47.165) therefore favouring the constant rate model(ΔAICRC =−0.728; likelihood ratio = 7.272; p= 0.007).The relative cladogenesis test also confirms that no rateshift occurs in this clade.Interestingly, equivalent taxon-level LTT plots within
different animal and plant groups generally do not fit aconstant rate scenario of diversification [14]. Our resultfor Neotropical Troidini is therefore unexpected becauseof the numerous environmental changes occurring inthe Neotropical region that could influence the diversifi-cation of organisms during the Neogene [15,69]. Such acontrasted pattern could potentially be the result of sev-eral factors linked to their tropical ecology. One hypoth-esis advanced to explain the high levels of diversity intropical ecosystems is the ‘museum’ model of diversity,whereby lineages accumulated steadily through time dueto constant speciation rate or low extinction rate [10,11].
The hypothesis is supported by the fact that the diversi-fication model that best approximates our data is thepure birth model, where the speciation rate is constantand the extinction rate is null. In fact, we expect thatAmazonia played a key role in the observed pattern ofdiversification. The biogeographic reconstruction showsthat swallowtails originated in the Amazon forest whenthey reached South America, and further followed thetropical rainforest when it was constrained by geologicaland climatic changes created by the Andean uplift(Figure 4), a trend referred to as tropical niche conserva-tism [22]. Tropical rainforest is often depicted as beingecologically stable through time, and has thus favored thepreservation of comparatively ancient lineages resultingfrom adaptive radiation, facilitating the continued accu-mulation of species diversity [3,4]. For new migrants,Amazonia was thus an ecological opportunity that pro-moted their diversification, as well as a formidable reser-voir of biodiversity that prevented any dramatic changesin diversification rates through time. This pattern is alsoconfirmed by the lack of shifts in diversification ratesduring the evolution of Neotropical Troidini at the mainclimate or geological events, as determined using thelikelihood-based method (see Additional file 4 Table S1).In contrast, other studies that focused on the evolu-
tionary history of Neotropical butterflies and their diver-sification patterns (e.g., [59,70,71]) recovered significantvariation in diversification rates. They attributed theseshifts in diversification rates to possible adaptive radi-ation linked to host plant shifts leading to ecologicalspeciation processes and subsequent increases in diversi-fication rates. Indeed, the regions spanning the upperAmazon and eastern Andes are geographic sources ofcolonization for several plant clades [5-8] and also con-stitute major diversity hotspots for plants in general [1].These regions thus offer greater potential for ecologicalspeciation driven by host plant adaptation, a speciationmechanism considered important in butterfly diversifica-tions (e.g., [72]).Troidini exclusively feed on Aristolochia [33], a genus
of plants that comprises 350–430 species mainly distrib-uted in tropical and subtropical regions worldwide[27,28,32]. The Aristolochia host plant niche providessubstantial opportunity for the diversification of Troi-dini, especially as the Neotropical Troidini tend to beopportunistic in their host plant use [34]. However, hostshifts within the genus Aristolochia have not necessarilyled to ecological speciation or adaptive radiation, in con-trast with other groups of phytophagous insects thatexperienced more drastic (and numerous) host shifts[35,36,72]. Fordyce [35] also showed that diversificationof Aristolochia had no effect on diversification rates ofTroidini. Together, this evidence is consistent withconstant diversification rates and suggests that the
Condamine et al. BMC Evolutionary Biology 2012, 12:82 Page 13 of 16http://www.biomedcentral.com/1471-2148/12/82
Neotropical Troidini are able to colonize all areas con-taining Aristolochia [34]. Hence, this biotic factor maynot be as important to Troidini diversification as inother butterfly groups [35,59,68,69].
Amazonia as current motor for speciationAmazonia contains the most species-rich biota on Earth[1,69] and is characterized by recent speciation eventsindicating that organisms experience an ongoing diversi-fication [12]. The results of our analyses of DNA-basedspecies delimitation support this trend as they recoveredadditional molecular entities that may or may not (de-pending on how conservatively we interpret them) beconsidered as new putative species (Figure 2). The LTTplot based on the ultrametric tree indicated a suddenincrease in branching rate toward the present, corre-sponding to the switch from interspecific to intraspecificbranching events (see the inset plot in Figure 2). To fitthe position of this switch, the method of Pons et al.[41] was applied to the ultrametric tree (Figure 2). TheGMYC model was preferred over the null model ofuniform branching rates (logL= 322.35, compared tonull model logL= 333.96; 2ΔL= 23.22; χ2 test, d.f. = 3,p < 0.0001). The model is consistent with the switch inthe branching pattern occurring at −0.037 (i.e., T of theML solution; root arbitrarily assigned to 1), leading toan estimate of 30 putative species (Figure 2). Overall,we recovered five molecular entities (corresponding tofive recognized species) for the genus Battus, two mo-lecular entities (corresponding to two recognized species)for the genus Euryades, and 23 molecular entities (corre-sponding to 21 recognized species) for the genus Parides(Figure 2; see Additional file 5 Figure S1 for the test withEF-1α phylogeny). The species delimitation analysis is inagreement with both morphological and geographical cri-teria e.g., [27-29,33,34,39]. The confidence interval for thethreshold value included 23 to 35 molecular entities withlikelihood scores ranging from −324.30 to 324.33 respect-ively (i.e., estimates falling within 2 log-likelihood units ofthe ML solution).These analyses also clarify the taxonomic status of the
P. panthonus complex (e.g., [39]). Based on our phylo-genetic analyses and species-delimitations, P. burchella-nus is conspecific to P. panthonus (including allsubspecies), and should be treated as a junior synonymof P. panthonus jaguarae. Although P. aglaope has beententatively placed as a distinct species, P. aglaope maybe regarded as a subspecies of P. panthonus. However,our results stress the need for more comprehensivetaxonomic studies [73]. In particular, several putativenew species may be revealed within the widespreadSouth American P. neophilus and the more localised P.proneus in the Atlantic Forest [29]. Strikingly, recentspeciation events are reconstructed as being located in
the Amazonian region. These results testify to the on-going process of diversification occurring in the Amazonrainforest. The emergence of the Isthmus of Panama isoften postulated as a motor of recent speciation eventsand thus responsible for an increase in diversificationrates [70]. Our study does not support this hypothesisbecause (i) dating analyses predate the emergence of thegeologic structure (even taking into account the 95%HPD); (ii) no change in diversification rates was detectedin the last seven million years, which corresponded tothe onset of the Isthmus of Panama [58]; and (iii) noputative new species was shown in Central America byapplying the species delimitation analyses.
Methodological limitationsConclusions about the temporal nature of diversifica-tion depend upon the quality of the underlying data[37,63-65,74,75]. Incomplete taxon sampling is a po-tentially serious problem of this kind that is difficultto address. Missing lineages can lead to inaccuratephylogenetic reconstructions, and anomalous branchlengths can in turn bias dating analyses (e.g., [75]). Inour study, we first re-define the species boundariesbefore performing biogeographic and diversificationanalyses. Such an approach provides more consistentclassification of taxa (e.g., splitting or pooling species)and inferences concerning diversification rates. Whenpossible, we have taken into account missing lineagesby using Monte Carlo simulations to circumscribe thiseffect [64]. But even with some missing taxa, taxonsampling can still provide uncertainty in the selectionof the best-fit model of diversification [75].Another methodological bias is the estimation of
divergence times, which may introduce error intodiversification analyses or distort conclusions (e.g.,[63-65,72,73]). Poor choice of calibration and use ofinappropriate statistical distribution can lead to illu-sory dating results (e.g., [37]). Although diversificationanalyses rely on branching times of the chronogram[63-65,74,75], few studies have taken dating uncertain-ties into account.Such methodological limitations constrain the cer-
tainty of our interpretations and provide areas for futureinvestigation [74,75]. As long as the fundamental hy-pothesis testing nature of these analyses are kept inmind, however, they remain our best window intounderstanding the rich, deep past of the stupendous bio-logical diversity of our planet.
ConclusionsUnderstanding the origin and evolution of Neotropicalbiodiversity is a fascinating challenge that relies on in-vestigating intricate patterns to disentangle the processesinvolved in diversification mechanisms. Species-level
Condamine et al. BMC Evolutionary Biology 2012, 12:82 Page 14 of 16http://www.biomedcentral.com/1471-2148/12/82
molecularly dated phylogenies constitute powerful toolsto unravel such patterns. Here, we show that Amazoniahad a central role in the origin and evolution ofNeotropical Troidini. In particular, the vast and stableecological opportunity offered by this tropical rainfor-est is best explained by the hypothesis that Troidiniswallowtails evolved under the museum model of di-versity. This suggests that the Amazonian fauna has anolder origin than supposed, which is in agreement withrecent syntheses [15,67]. Comparative biogeographicand macroevolutionary analyses are required to con-firm this trend on other swallowtails (Papilio subgenusHeraclides) or butterfly groups (e.g., [68,74,75]).Amazonia is not only the evolutionary source of this di-
versity but continues to play an important role in latespeciation events. Our results underline the need for fur-ther studies using dense taxon sampling, with most ofthe described subspecies each being represented by sev-eral individuals. Such a large survey requires collabor-ation and extensive fieldwork in remote tropical areas,including fine morphological examinations and densemolecular study. All together, these data illustrate theprocesses that have shaped extant Amazonian biodiversityand, on a broader scale, Neotropical species richness.
Additional files
Additional file 1: Dataset S1. MrBayes files (COI, COII and EF-1αseparated and all genes combined into a single dataset) for phylogeneticanalyses with all taxon sampling used for this study and GenBankaccession numbers.
Additional file 2: Dataset S2. Paleogeographical model used in thisstudy, with five time slices reflecting the probability of area connectivitythrough time.
Additional file 3: Dataset S3. Dated phylogeny of Neotropical Troidini:maximum clade credibility tree with median ages from the Bayesianuncorrelated lognormal method (implemented in BEAST) usingnucleotide sequence data from 3 loci.
Additional file 4: Table S1. Results of analyses exploring diversificationrates. A: Results of net diversification rates (speciation minus extinction;[62]) for Neotropical Troidini species for three values of extinction rates(E). On the right, best-fit extinction rates are estimated by maximumlikelihood analyses. B: Results for various diversification models usingΔAICRC test statistic [42]. These tests fit a specified set of rate-constant(RC) and rate-variable (RV) variants of the birth-death model to branchingtimes. C: Results of branching times analyses testing for temporaldiversification rate during the major climate changes (EOGM, LOWE,MMCO, and PPG) using a Yule model and likelihood analyses [42] asdescribed in Winkler et al. [26] and Condamine et al. [36].
Additional file 5: Figure S1. Results of species delimitation analysesusing only the EF-1α gene to reconstruct the phylogeny. The GMYCmodel was not preferred over the null model of uniform branching rates(logL = 183.989, compared to null model logL = 183.646; 2ΔL = 0.687; χ2test, d.f. = 3, p= 0.876).
AbbreviationsAIC: Akaike information criterion; BI: Bayesian inference; BIC: Bayesianinformation criterion; BV: Bootstrap values; DEC: Dispersal-extinction-cladogenesis; GMYC: General mixed Yule coalescent; ML: Maximumlikelihood; PP: Posterior probabilities.
Competing interestsThe authors declare that they have no competing interests.
Authors’ contributionsFLC designed the research. FLC retrieved material or data from GenBank,formerly published by KLSB and FAHS. FLC performed the analyses. FLCwrote the manuscript, with revisions by KLSB, GJK and FAHS. All authors readand approved the final manuscript.
Authors’ informationFabien Condamine was a PhD student at the Centre de Biologie pour laGestion des Populations, and is now a post-doctoral fellow in the CentreAppliquées de Mathématiques with Hélène Morlon. He is interested innumerous aspects of historical biogeography, especially on global patternsin biodiversity such as latitudinal diversity gradients. He aims to decipher themain evolutionary and ecological processes that have shaped the presentpattern of biodiversity. Karina Silva-Brandão is a post-doctoral fellow atUniversidade de São Paulo (ESALQ/USP) in Brazil and has been working withmolecular diversity and phylogenetic relationships at several taxonomiclevels of wild and pest species of Lepidoptera. Gael Kergoat is a researchscientist who has focussed on understanding the evolution of phytophagousinsects and their host plants. Professor Felix Sperling is interested inprocesses of evolution ranging from the diversification of major insectlineages to the formation of species boundaries.
AcknowledgmentsWe thank E. Jousselin and F. Delsuc for their helpful comments on early talksand drafts, as well as D.L. Rabosky, I.S. Winkler and J.-P. Rossi for advice ondiversification analyses. We are grateful to the five referees that gave usfruitful comments. Funding was obtained through the project ANRBIONEOCAL of the French National Agency for Research and by a grant ofthe graduate school SIBAGHE of Montpellier II University. FS also wishes toacknowledge an NSERC Discovery Grant and the University of Alberta forbeing a Supporting Member of BioMed Central.
Author details1INRA, UMR Centre de Biologie pour la Gestion des Populations, CBGP,(INRA/IRD/CIRAD/Montpellier SupAgro), Campus International de Baillarguet,CS30016, 34988, Montferrier-sur-Lez, France. 2CNRS, UMR 7641 Centre deMathématiques Appliquées (École Polytechnique), Route de Saclay, 91128,Palaiseau, France. 3Departamento de Entomologia e Acarologia, EscolaSuperior de Agricultura “Luiz de Queiroz”, Universidade de São Paulo, Av.Padua Dias 11, Piracicaba, SP, Brazil 13418-900. 4Department of BiologicalSciences, University of Alberta, Edmonton, AB, Canada T6G 2E9.
Received: 29 February 2012 Accepted: 4 June 2012Published: 12 June 2012
References1. Myers N, Mittermeier RA, Mittermeier CG, da Fonseca GAB, Kent J:
Biodiversity hotspots for conservation priorities. Nature 2000,403:853–858.
2. Raven PH, Axelrod DI: Angiosperm biogeography and past continentalmovements. Ann Missouri Bot Gard 1974, 61:539–673.
3. Simpson G, Haffer J: Speciation patterns in the Amazonian forest biota.Annu Rev Ecol Evol Syst 1978, 9:497–518.
4. Gentry AH: Neotropical floristic diversity: phytogeographical connectionsbetween Central and South America, Pleistocene climatic fluctuations, oran accident of the Andean orogeny? Ann Mo Bot Gard 1982, 69:557–593.
5. Hughes C, Eastwood SV: Island radiation on a continental scale:exceptional rates of plant diversification after uplift of the Andes. ProcNatl Acad Sci USA 2006, 103:10334–10339.
6. Antonelli A, Nylander JAA, Persson C, Sanmartín I: Tracing the impact ofthe Andean uplift on Neotropical plant evolution. Proc Natl Acad Sci USA2009, 106:9749–9754.
7. Erkens RHJ, Maas JW, Couvreur TLP: From Africa via Europe to SouthAmerica: migrational route of a species-rich genus of Neotropicallowland rain forest trees (Guatteria, Annonaceae). J Biogeogr 2009,36:2338–2352.

Condamine et al. BMC Evolutionary Biology 2012, 12:82 Page 15 of 16http://www.biomedcentral.com/1471-2148/12/82
8. Couvreur TLP, Forest F, Baker W: Origin and global diversification patternsof tropical rain forests: inferences from a complete genus-levelphylogeny of palms. BMC Biol 2011, 9:44.
9. Pennington RT, Dick CW: The role of immigrants in the assemblageof the South American rainforest tree flora. Philos Trans R Soc B 2004,359:1611–1622.
10. Wallace AR: Tropical Nature, and Other Essays. Macmillan: London; 1978.11. Fischer AG: Latitudinal variation in organic diversity. Evolution 1960,
14:64–81.12. Haffer J: Speciation in Amazonian forest birds. Science 1969, 165:131–137.13. McKenna DD, Farrell BD: Tropical forests are both evolutionary cradles
and museums of leaf beetle diversity. Proc Natl Acad Sci USA 2006,103:10947–10951.
14. Antonelli A, Sanmartín I: Why are there so many plant species in theNeotropics? Taxon 2011, 60:403–414.
15. Hoorn CM, Wesselingh FP: Amazonia, Landscape and Species Evolution: ALook into the Past. 1st edition. Wiley-Blackwell: London; 2010.
16. Antonelli A, Sanmartín I: Mass Extinction, gradual cooling, or rapidradiation? Reconstructing the spatiotemporal evolution of the ancientAngiosperm genus Hedyosmum (Chloranthaceae) using empirical andsimulated approaches. Syst Biol 2011, 60:596–615.
17. Wiens JJ, Pyron RA, Moen DC: Phylogenetic origins of local-scalediversity patterns and causes of Amazonian megadiversity. Ecol Lett 2011,14:643–652.
18. Moritz C, Patton JL, Schneider CJ, Smith TB: Diversification of rainforestfaunas: An integrated molecular approach. Annu Rev Ecol Evol Syst 2000,31:533–563.
19. Currie DJ, Mittelbach GG, Cornell HV, Field R, Guégan J-F, Hawkins BA,Kaufman DM, Kerr JT, Oberdorff T, O’Brien E, Turner JRG: Predictions andtests of climate-based hypotheses of broad-scale variation in taxonomicrichness. Ecol Lett 2004, 7:1121–1134.
20. Erwin DH: Climate as a driver of evolutionary change. Curr Biol 2009,19:575–583.
21. Kozak KH, Wiens JJ: Accelerated rates of climatic-niche evolution underlierapid species diversification. Ecol Lett 2010, 13:1378–1389.
22. Wiens JJ, Donoghue MJ: Historical biogeography, ecology and speciesrichness. Trends Ecol Evol 2004, 19:639–644.
23. Wiens JJ, Sukumaran J, Pyron RA, Brown RM: Evolutionary andbiogeographic origins of high tropical diversity in old world frogs(Ranidae). Evolution 2009, 63:1217–1231.
24. Mittelbach GG, Schemske DW, Cornell HV, Allen AP, Brown JM, Bush MB,Harrison SP, Hurlbert AH, Knowlton N, Lessios HA, McCain CM, McCune AR,McDade LA, McPeek MA, Near TJ, Price TD, Ricklefs RE, Roy K, Sax DF,Schluter D, Sobel JM, Turelli M: Evolution and the latitudinal diversitygradient: speciation, extinction and biogeography. Ecol Lett 2007,10:315–331.
25. Becerra JX, Venable DL: Macroevolution of insect-plant associations: therelevance of host biogeography to host affiliation. Proc Natl Acad Sci USA1999, 96:12625–12631.
26. Winkler IS, Mitter C, Scheffer SJ: Repeated climate-linked host shifts havepromoted diversification in a temperate clade of leaf-mining flies. ProcNatl Acad Sci USA 2009, 106:18103–18108.
27. Tyler HA, Brown KS, Wilson K: Swallowtail Butterflies of the Americas: a Studyin Biological Dynamics, Ecological Diversity, Biosystematics, and Conservation.Scientific Publishers: Gainesville; 1994.
28. Silva-Brandão KL, Freitas AVL, Brower AVZ, Solferini VN: Phylogeneticrelationships of the New World Troidini swallowtails (Lepidoptera:Papilionidae) based on COI, COII, and EF-1α genes. Mol Phylogenet Evol2005, 36:468–483.
29. Racheli T: The Genus Parides: An Unended Quest. In Butterflies of theWorld. Edited by Bauer F, Frankenbach T. Keltern, Deutschland: Goecke andEvers; 2006:116.
30. Braby MF, Trueman JWH, Eastwood R: When and where did troidinebutterflies (Lepidoptera: Papilionidae) evolve? Phylogenetic andbiogeographic evidence suggests an origin in remnant Gondwana in theLate Cretaceous. Invert Syst 2005, 19:113–143.
31. Simonsen TJ, Zakharov EV, Djernaes M, Cotton AM, Vane-Wright RI, SperlingFAH: Phylogeny, host plant associations and divergence time ofPapilioninae (Lepidoptera: Papilionidae) inferred from morphology andseven genes with special focus on the enigmatic genera Teinopalpusand Meandrusa. Cladistics 2011, 27:113–137.
32. Ehrlich PR, Raven PH: Butterflies and plants: a study in coevolution.Evolution 1964, 18:586–608.
33. Weintraub JD: Host plant association patterns and phylogeny in the tribeTroidini (Lepidoptera: Papilionidae). In Swallowtail Butterflies: their Ecologyand Evolutionary Biology. Edited by Scriber JM, Tsubaki Y, Lederhouse RC.Gainesville: Scientific Publishers; 1995:307–316.
34. Silva-Brandão KL, Solferini VN: Use of host plants by Troidini butterflies(Papilionidae, Papilioninae): constraints on host shift. Biol J Linn Soc 2007,90:247–261.
35. Fordyce JA: Host shifts and evolutionary radiations of butterflies. Proc RSoc B 2010, 277:3735–3743.
36. Condamine FL, Sperling FAH, Wahlberg N, Rasplus J-Y, Kergoat GJ: Whatcauses latitudinal gradients in species diversity? Evolutionary processesand ecological constraints on swallowtail biodiversity. Ecol Lett 2012,15:264–277.
37. Ho SYW, Phillips MJ: Accounting for calibration uncertainty inphylogenetic estimation of evolutionary divergence times. Syst Biol 2009,58:367–380.
38. Caterino MS, Reed RD, Kuo MM, Sperling FAH: A partitioned likelihoodanalysis of swallowtail butterfly Phylogeny (Lepidoptera: Papilionidae).Syst Biol 2001, 50:106–127.
39. Silva-Brandão KL, Azeredo AML, Freitas AVL: New evidence on thesystematic and phylogenetic position of Parides burchellanus(Lepidoptera: Papilionidae). Mol Ecol Resources 2008, 8:502–511.
40. Larkin MA, Blackshields G, Brown NP, Chenna R, McGettigan PA, McWilliamH, Valentin F, Wallace IM, Wilm A, Lopez R, Thompson JD, Gibson TJ,Higgins DG: Clustal W and Clustal X version 2.0. Bioinfo 2007,23:2947–2948.
41. Pons J, Barraclough TG, Gómez-Zurita J, Cardoso A, Duran DP, Hazell S,Kamoun S, Sumlin WD, Vogler AP: Sequence-based species delimitationfor the DNA taxonomy of undescribed insects. Syst Biol 2006, 55:595–609.
42. Rabosky DL: Likelihood methods for detecting temporal shifts indiversification rates. Evolution 2006, 60:1152–1164.
43. Paradis E, Claude J, Strimmer K: APE: analyses of phylogenetics andevolution in R language. Bioinfo 2004, 20:289–290.
44. Hebert PDN, Cywinska A, Ball SL, DeWaard JR: Biological identificationsthrough DNA barcodes. Proc R Soc B 2003, 270:313–321.
45. Britton T, Anderson CL, Jacquet D, Lundqvist S, Bremer K: Estimatingdivergence times in large phylogenetic trees. Syst Biol 2007, 56:541–752.
46. Posada D: jModelTest: phylogenetic model averaging. Mol Biol Evol 2008,25:1253–1256.
47. Brown JM, Lemmon AR: The importance of data partitioning and the utilityof Bayes factors in Bayesian phylogenetics. Syst Biol 2007, 56:643–655.
48. Guindon S, Dufayard JF, Lefort V, Anisimova M, Hordijk W, Gascuel O: Newalgorithms and methods to estimate maximum-likelihood phylogenies:assessing the performance of PhyML 3.0. Syst Biol 2010, 59:307–321.
49. Felsenstein J: Inferring Phylogenies. Massachusetts, Sinauer: Sunderland; 2004.50. Ronquist F, Huelsenbeck JP: MrBayes 3: Bayesian phylogenetic inference
under mixed models. Bioinfo 2003, 19:1572–1574.51. Kass RE, Raftery AE: Bayes factors. J Am Stat Assoc 1995, 90:773–795.52. Shimodaira H, Hasegawa M: Multiple comparisons of log-likelihoods with
applications to phylogenetic inference. Mol Biol Evol 1999, 16:1114–1116.53. Drummond AJ, Ho SYW, Phillips MJ, Rambaut A: Relaxed phylogenetics
and dating with confidence. PLoS Biol 2006, 4:e88.54. Drummond AJ, Rambaut A: BEAST: Bayesian evolutionary analysis by
sampling trees. BMC Evol Biol 2007, 7:214.55. Ree RH, Smith SA: Maximum-likelihood inference of geographic range
evolution by dispersal, local extinction, and cladogenesis. Syst Biol 2008,57:4–14.
56. Scotese CR: Atlas of Earth History. Volume 1. Paleogeography. Arlington,Texas: PALEOMAP Project; 2001.
57. Hines HM: Historical biogeography, divergence times, and diversificationpatterns of bumble bees (Hymenoptera: Apidae: Bombus). Syst Biol 2008,57:58–75.
58. Iturralde-Vinent MA: Meso-Cenozoic Caribbean paleogeography:Implications for the historical biogeography of the region. Int Geol Rev2006, 48:791–827.
59. Elias M, Joron M, Willmott K, Silva-Brandão KL, Kaiser V, Arias CF, PinerezGLM, Uribe S, Brower AVZ, Freitas AVL, Jiggins CD: Out of the Andes:patterns of diversification in clearwing butterflies. Mol Ecol 2009,18:1716–1729.

Condamine et al. BMC Evolutionary Biology 2012, 12:82 Page 16 of 16http://www.biomedcentral.com/1471-2148/12/82
60. Johnson KP, Weckstein JD: The Central American land bridge as anengine of diversification in New World doves. J Biogeogr 2011,38:1069–1076.
61. Harmon LJ, Weir J, Brock C, Glor RE, Challenger W: GEIGER: Investigatingevolutionary radiations. Bioinfo 2008, 24:129–131.
62. Rabosky DL: LASER: a maximum likelihood toolkit for detecting temporalshifts in diversification rates from molecular phylogenies. Evol BioinfoOnline 2006, 2:257–260.
63. Magallón S, Sanderson MJ: Absolute diversification rates in angiospermclades. Evolution 2001, 55:1762–1780.
64. Pybus OG, Harvey PH: Testing macro-evolutionary models usingincomplete molecular phylogenies. Proc R Soc B 2000, 267:2267–2272.
65. Rabosky DL, Lovette IJ: Density-dependent diversification in NorthAmerican wood warblers. Proc R Soc B 2008, 275:2363–2371.
66. Ali JR: Colonizing the Caribbean: is the GAARlandia land-bridgehypothesis gaining a foothold? J Biogeogr 2012, 39:431–433.
67. Wahlberg N, Freitas AVL: Colonization of and radiation in South Americaby butterflies in the subtribe Phyciodina (Lepidoptera: Nymphalidae).Mol Phylogenet Evol 2007, 44:1257–1272.
68. Peña C, Nylin S, Freitas AVL, Wahlberg N: Biogeographic history of thebutterfly subtribe Euptychiina (Lepidoptera, Nymphalidae, Satyrinae).Zoolog Scripta 2010, 39:243–258.
69. Hoorn C, Wesselingh FP, ter Steege H, Bermudez MA, Mora A, Sevink J,Sanmartín I, Sánchez-Meseguer A, Anderson CL, Figueiredo JP, Jaramillo C,Riff D, Negri FR, Hooghiemstra H, Lundberg J, Stadler T, Särkinen T,Antonelli A: Amazonia through time: Andean uplift, climate change,landscape evolution and biodiversity. Science 2010, 330:927–931.
70. Mullen SP, Savage WK, Wahlberg N, Willmot KR: Rapid diversification andnot clade age explains high diversity in Neotropical Adelpha butterflies.Proc R Soc B 2011, 278:1777–1785.
71. Strutzenberger P, Fielder K: Temporal patterns of diversification in AndeanEois, a species-rich clade of moth (Lepidoptera, Geometridae). J Evol Biol2011, 24:919–925.
72. Janz N, Nylin S, Wahlberg N: Diversity begets diversity: host expansionsand the diversification of plant-feeding insects. BMC Evol Biol 2006, 6:4.
73. Dayrat B: Towards integrative taxonomy. Biol J Linn Soc 2005, 85:407–415.74. Rabosky DL: Ecological limits and diversification rate: alternative
paradigms to explain the variation in species richness among clades andregions. Ecol Lett 2009, 12:735–743.
75. Cusimano N, Renner SS: Slowdowns in diversification rates from realphylogenies may not be real. Syst Biol 2010, 59:458–464.
doi:10.1186/1471-2148-12-82Cite this article as: Condamine et al.: Biogeographic and diversificationpatterns of Neotropical Troidini butterflies (Papilionidae) support amuseum model of diversity dynamics for Amazonia. BMC EvolutionaryBiology 2012 12:82.
Submit your next manuscript to BioMed Centraland take full advantage of:
• Convenient online submission
• Thorough peer review
• No space constraints or color figure charges
• Immediate publication on acceptance
• Inclusion in PubMed, CAS, Scopus and Google Scholar
• Research which is freely available for redistribution
Submit your manuscript at www.biomedcentral.com/submit


![Neotropical cervidology_12[1]](https://img.pdfslide.us/doc/110x75/547f4ab5b37959a22b8b56e0/neotropical-cervidology121.jpg)