Embed Size (px)
Citation preview
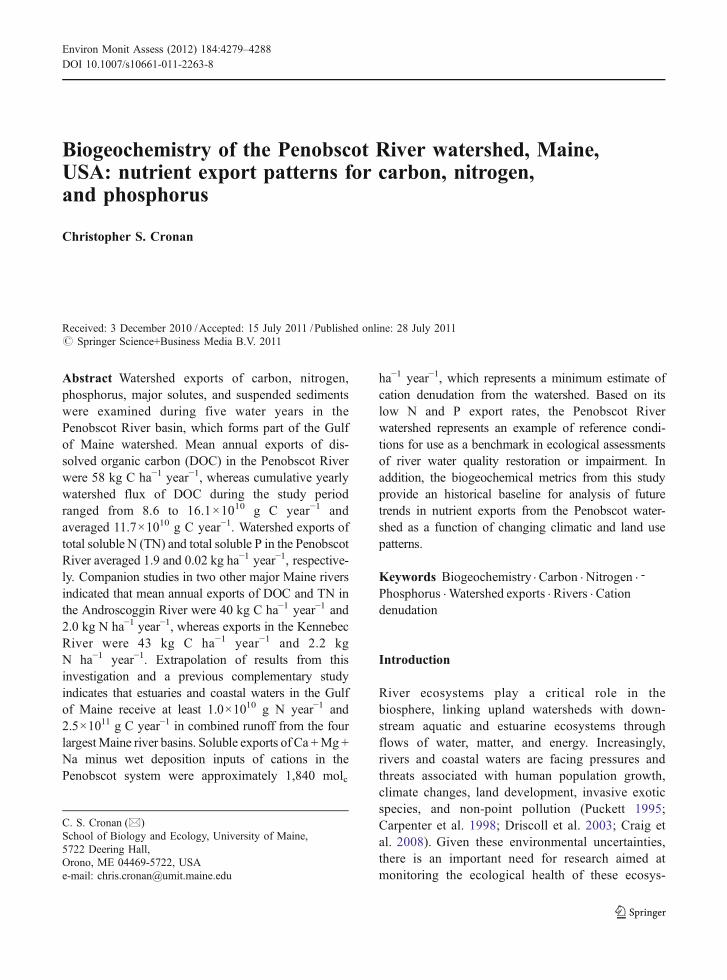
Biogeochemistry of the Penobscot River watershed, Maine,USA: nutrient export patterns for carbon, nitrogen,and phosphorus
Christopher S. Cronan
Received: 3 December 2010 /Accepted: 15 July 2011 /Published online: 28 July 2011# Springer Science+Business Media B.V. 2011
Abstract Watershed exports of carbon, nitrogen,phosphorus, major solutes, and suspended sedimentswere examined during five water years in thePenobscot River basin, which forms part of the Gulfof Maine watershed. Mean annual exports of dis-solved organic carbon (DOC) in the Penobscot Riverwere 58 kg C ha−1 year−1, whereas cumulative yearlywatershed flux of DOC during the study periodranged from 8.6 to 16.1×10¹⁰ g C year−1 andaveraged 11.7×10¹⁰ g C year−1. Watershed exports oftotal soluble N (TN) and total soluble P in the PenobscotRiver averaged 1.9 and 0.02 kg ha−1 year−1, respective-ly. Companion studies in two other major Maine riversindicated that mean annual exports of DOC and TN inthe Androscoggin River were 40 kg C ha−1 year−1 and2.0 kg N ha−1 year−1, whereas exports in the KennebecRiver were 43 kg C ha−1 year−1 and 2.2 kgN ha−1 year−1. Extrapolation of results from thisinvestigation and a previous complementary studyindicates that estuaries and coastal waters in the Gulfof Maine receive at least 1.0×10¹⁰ g N year−1 and2.5×1011 g C year−1 in combined runoff from the fourlargestMaine river basins. Soluble exports of Ca +Mg+Na minus wet deposition inputs of cations in thePenobscot system were approximately 1,840 molc
ha−1 year−1, which represents a minimum estimate ofcation denudation from the watershed. Based on itslow N and P export rates, the Penobscot Riverwatershed represents an example of reference condi-tions for use as a benchmark in ecological assessmentsof river water quality restoration or impairment. Inaddition, the biogeochemical metrics from this studyprovide an historical baseline for analysis of futuretrends in nutrient exports from the Penobscot water-shed as a function of changing climatic and land usepatterns.
Keywords Biogeochemistry . Carbon . Nitrogen . -
Phosphorus .Watershed exports . Rivers . Cationdenudation
Introduction
River ecosystems play a critical role in thebiosphere, linking upland watersheds with down-stream aquatic and estuarine ecosystems throughflows of water, matter, and energy. Increasingly,rivers and coastal waters are facing pressures andthreats associated with human population growth,climate changes, land development, invasive exoticspecies, and non-point pollution (Puckett 1995;Carpenter et al. 1998; Driscoll et al. 2003; Craig etal. 2008). Given these environmental uncertainties,there is an important need for research aimed atmonitoring the ecological health of these ecosys-
Environ Monit Assess (2012) 184:4279–4288DOI 10.1007/s10661-011-2263-8
C. S. Cronan (*)School of Biology and Ecology, University of Maine,5722 Deering Hall,Orono, ME 04469-5722, USAe-mail: [email protected]
tems and detecting changes and trends associatedwith degradation of aquatic resources.
Many investigators have focused on using ecolog-ical indicators based on nutrient indices as a means oftracking and assessing the ecological integrity ofwatersheds and downstream aquatic receptors(Degens et al. 1991). Results from these biogeochem-ical studies have provided a framework for under-standing how exports of nutrients from terrestrialwatersheds vary as a function of different environ-mental drivers and ecosystem processes, and howcumulative nutrient subsidies can potentially trans-form ecological conditions in the coastal zone(Howarth et al. 1996; Driscoll et al. 2003).
Comparative studies of N cycling budgets haveshown that watershed inputs of N from atmo-spheric deposition, food imports, fertilizer, live-stock feed imports, and N fixation differ as afunction of geographic location, population den-sities, and land use patterns (Puckett 1995; Mayeret al. 2002; Boyer et al. 2002; Driscoll et al. 2003),with total inputs varying from <10 to >70 kgN ha−1 year−1. Evidence indicates that watershedsgenerally retain roughly 75±20% of external Ninputs (Dillon et al. 1991; Jordan et al. 1997;Peterson et al. 2001; Boyer et al. 2002) and thatannual N exports in river runoff typically increasewith increasing watershed inputs of N.
Land use impacts on nutrient exports have beenwidely documented (Puckett 1995). On the AtlanticCoastal Plain, Jordan et al. (1997) reported thatsoluble N in watershed runoff increased with theproportion of cropland in the catchment, reaching amaximum export of 16 kg N ha−1 year−1. In theAroostook River basin in northern Maine, Cronan etal. (1999) noted that nitrate–N fluxes from agricul-tural watersheds (7 kg N ha−1 year−1) were ten timeshigher than fluxes of nitrate–N from forested water-sheds (0.7 kg N ha−1 year−1). David and Gentry(2000) reported that half of net anthropogenic Ninputs to Illinois farmlands were discharged tosurface waters, resulting in a riverine flux of 4.4×10¹² g N from 1979–1996. Linking those patternswith regional ecological impacts, Goolsby (2000)observed that the immense annual flux of soluble Nfrom mid-western agricultural watersheds intoMississippi River receiving waters ultimately con-tributes to hypoxic conditions and degradation ofcoastal food webs in the Gulf of Mexico.
River runoff from terrestrial watersheds delivers amix of other important solutes and substances todownstream aquatic systems and coastal waters(Meybeck 1982). For example, Howarth et al.(1991) reported that river exports provided the majorsource of organic C to the Hudson River estuary,thereby driving ecosystem metabolism and stronglyaffecting dissolved oxygen concentrations. Otherinvestigations have examined the patterns, processes,and implications of dissolved organic carbon (DOC)export fluxes (Spitzy and Leenheer 1991; Clair et al.1994; Aitkenhead and McDowell 2000), mineralfluxes (e.g., Teland et al. 1991; Kawaguchi et al.1997), and fluxes of particulate organic matter andtotal suspended solids (TSS) (e.g., Ittekkot and Laane1991; Correll et al. 1999) in a range of world rivers.These studies have provided a rich context forcomparing and interpreting patterns of nutrient trans-port in different watersheds and geographic settings.
In this investigation, biogeochemical metrics wereused to characterize the current water quality con-ditions and nutrient export patterns of the PenobscotRiver, which drains a large, relatively undevelopedwatershed in central Maine. The objectives of thisstudy were to: (a) quantify exports of N, C, P, andother nutrients from this major river basin; (b)examine cumulative nutrient transfers to estuarineand coastal receiving waters in the Gulf of Maine; and(c) provide a baseline for detection of long-termtrends in watershed and river ecosystem properties inresponse to landscape changes associated with ongo-ing development, climate warming, and shifting landuse patterns.
Site description and methods
This investigation focused primarily on the PenobscotRiver basin (Fig. 1), but included a less intensivecomparison of the Androscoggin and Kennebec Riverbasins in Maine, USA (Table 1). These watersheds areheavily forested, contain 5–11% wetland cover, havemean annual temperatures of 4–5°C, and receiveroughly 100±20 cm of annual precipitation. Meanpopulation densities are low, ranging from 8 to 17persons per square kilometer among the three riverbasins (Boyer et al. 2002). Regional bedrock andsurficial geologic conditions vary across the water-sheds (Osberg et al. 1985; Thompson and Borns
4280 Environ Monit Assess (2012) 184:4279–4288

1985), reflecting a complex history of geomorpho-logical and tectonic events.
Rivers were sampled during ice-free periods fromMay 2001 to October 2005, with collections targetedto encompass the full range of hydrologic discharge
conditions and chemical variability ranging from lowto moderate to high runoff periods. Rather thansampling at regular time intervals, river dischargewas monitored remotely online, and sampling dateswere selected to include a range of specific runoffvolumes in each season. The sampling design explic-itly accounted for seasonality and hydrologic conditionsas major determinants of nutrient concentrations andfluxes. Collections at the primary study site on thePenobscot River included 21 sample dates distributedover 5 years, whereas seven representative watercollections were made over 4 years at each of thesecondary sites on the Androscoggin and KennebecRivers. Permanent sample locations were located justabove the tidal influence of the saline upper estuary ineach system; on the Kennebec River, sample collectionsoccurred at low tide to avoid salt water intrusion. Thecontributing watershed area above each samplinglocation was estimated using published data andtopographic maps from the US Geological Survey. Oneach collection date, river runoff data from the closestupstream USGS gauging station were obtained fromhttp://waterdata.usgs.gov/me/nwis. Adjustments weremade to account for the additional contributingwatershed area and runoff at the sampling point.
Water samples were collected from the upper 1 mof the offshore river channel into pre-cleaned glassand polyethylene bottles that were rinsed with riverwater. In the Androscoggin River, samples were
Fig. 1 Location map showing the Penobscot River watershedin central Maine, USA
Table 1 Geographic conditions in the Penobscot, Androscoggin, and Kennebec River Watersheds
Parameter Penobscot Androscoggin Kennebec
Locationa Eddington, ME Topsham, ME Richmond, ME
N 44°50.598 N 43°55.087 N 44°05.277
W 68°41.758 W 69°58.401 W 69°47.934
Watershed area (km2) 20,109 8,824 15,076
Land use (% of area)b
Forest + shrub land 78.1 82.2 76.9
Farming 1.8 2.9 4.0
Wetlands 10.9 4.8 7.4
Open water 5.2 4.3 6.1
Developed 2.2 4.2 3.5
Other 1.8 1.6 2.1
a River discharge data for these locations were obtained from the USGS stations at West Enfield on the Penobscot River (ID=01034500), North Sidney on the Kennebec River (ID=01049265), and Auburn on the Androscoggin River (ID=01059000). Riverrunoff estimates were scaled up to the watershed area surrounding the actual sampling location listed in the table above.b Land use data from the National Land Cover GIS Data—NLCD (2006)
Environ Monit Assess (2012) 184:4279–4288 4281

collected from a bridge using a pre-rinsed stainlesssteel canister lowered into the upper 1 m of river inthe mid-channel. In the Penobscot, most samples werecollected from a kayak in the upper 1 m of mid-channel. Other samples in the Penobscot and allsamples in the Kennebec were collected by heavingthe rinsed steel canister 10–12 m from shore andhauling it back through the upper 1 m of river.
Measurements of temperature and conductivity weremade on-site, and samples were returned to the lab in aclosed ice chest. DOC samples in pre-baked glassbottles were pressure filtered through a 0.5-μmOsmonics glass fiber filter and were stored in the darkat 4°C prior to analysis. Filtrates were sub-sampled andstored at −10°C for subsequent analysis of total N and P.DOC analyses on river samples were performed intriplicate using an OI Corp. model 700 instrumentcalibrated with KHP standards (detection limit ∼0.1 mgC L−1). Total N concentrations in thawed samplefiltrates were analyzed by alkaline persulfate oxidation,followed by Cd reduction, reaction of nitrite withsulfanilamide and N-(1-naphthyl) ethylenediaminedihydrochloride, and flow injection analysis at theSawyer Environmental Chemistry Laboratory. Internalstandards containing 10−5 M sulfanilamide and 10−5 Mammonium nitrate were included in all sample runs,and these standards were routinely measured with ±5%accuracy or better. Phosphorus samples were acidified,and total P (TP) was analyzed with the ascorbic acidmethod 4500 P-E described in Standard Methods forthe Examination of Water and Wastewater (Eaton andFranson 2005) using a Varian Cary 50 spectrophotom-eter at 880 nm.
Samples for inorganic analysis (collected in HDPEbottles) were pressure filtered through pre-rinsed0.45-μm Nylon-66 membranes, and subsamples werestored frozen for inorganic N analysis or acidified topH 2 for cation analysis. Nitrate–N was determinedwith the cadmium reduction/sulfanilamide methodand flow injection analysis, and NH4–N was deter-mined by the hypochlorite/salicylate method and flowinjection. Cations and Si were determined by induc-tively coupled plasma emission spectrometry withcalibration and internal standards. Detection limits forthe various methods and solutes were as follows:NO3–N (0.003 mg L−1), NH4–N (0.015 mg L−1), Ca(0.04 mg L−1), Mg (0.05 mg L−1), Na (0.027 mg L−1),P (0.001 mg L−1), Si (0.015 mg L−1), and Fe(0.003 mg L−1).
A separate 2-L polyethylene bottle of each samplewas used to estimate TSS in the laboratory. Using anoven-dried and pre-weighed 0.5-μm glass fiber filter,a measured volume (1–2 L) of each well-mixedsample was pressure filtered using a Gelman stainlesssteel filtration system. The glass filter was then driedat 100°C for 24 h and was re-weighed to estimate themass of TSS collected on the filter.
Unit area watershed fluxes were calculated bymultiplying the 5-year weighted mean concentrationof a solute by the annual discharge volume in liters,dividing by the watershed area, and converting tokilograms. Mean annual fluxes were calculated usingthe 5-year mean of river runoff, whereas estimates ofminimum or maximum flux were based, respectively,on the lowest or highest annual runoff value over the5 years of study. Total cumulative flux from awatershed was estimated by multiplying the unit areaflux by the watershed area and adjusting units.
Results
Hydrology
Sampling of the Penobscot River covered a widedistribution of flows, ranging from a minimum meandaily discharge of 114 m3 s−1 to a maximum of3,370 m3 s−1. For reference, historical records for theperiod 1903–1999 indicate that Penobscot Riverrunoff over the last century has been as low as46 m3 s−1 and as high as 4,302 m3 s−1 (Fig. 2). Thus,sampling during this study captured a peak flowroughly 75% as large as the historical record and aminimum flow that was about 2.5 times larger than
1
10
100
1000
10000
0 20 40 60 80 100
Exceedence Probability (%)
Riv
er R
unof
f m3 /
s
Fig. 2 Historical long-term frequency distribution of runoff inthe Penobscot River, ME, for the period 1903–1999
4282 Environ Monit Assess (2012) 184:4279–4288

the record minimum mean daily flow. During thatlong-term historical period of record, Penobscot Riverrunoff exhibited a seasonal pattern of dischargecharacterized by peak flows in April and May andbase flows in August and September (Fig. 3). Sam-pling in the Kennebec River included flows rangingfrom 59 to 1,795 m3 s−1, whereas flows sampled inthe Androscoggin River ranged from 48 to1,179 m3 s−1. By comparison, peak mean daily flowsreported by USGS during the entire sampling periodwere 2,515 m3 s−1 for the Kennebec River and1,368 m3 s−1 for the Androscoggin River.
Over the period of sampling from May 2001 toOctober 2005, annual runoff estimates for the PenobscotRiver during five successive water years beginning on 1October 2000 were as follows: 42, 40, 47, 66, and74 cm, with a mean value of 54 cm for the period of rivermonitoring. By comparison, mean annual runoff for theperiod 1903–1999 was roughly 61 cm. Precipitationinputs to the Penobscot River basin during the five wateryears covered by the study were as follows: 86, 92, 95,113, and 123 cm, with a mean of 102 cm. Precipitationand river discharge were below normal for the first3 years of the study, whereas the final year of samplingwas wetter than the long-term average and includedsome near-record peak flows.
Carbon biogeochemistry
Concentrations of DOC in the Penobscot Riverranged from 7.0 to 15.3 mg C L−1, with a flow-weighted mean of 10.8 mg C L−1 (Table 2). Highestconcentrations of DOC were observed during peakrunoff periods in autumn, when fresh litter inputs andseasonal shallow hydrologic flow paths within the
drainage basin presumably contributed to elevatedfluxes of soluble organic C into drainage waters.
Unit area fluxes of DOC from the Penobscot Riverwatershed ranged from 43 to 80 kg C ha−1 year−1
among the five water years, with a mean export of58 kg C ha−1 year−1. Cumulative yearly watershedfluxes of DOC during the study period ranged from8.6 to 16.1×10¹⁰ g C year−1, with a mean annualcarbon export of 11.7×10¹⁰ g C year−1 (Table 2).
Carbon cycling patterns in the Penobscot River werecompared with observations from two other major riversystems—the Androscoggin and Kennebec Rivers—that drain to the Gulf of Maine. Flow-weighted meanDOC concentrations were lower in these rivers, averag-ing 7.4 mg C L−1 in the Androscoggin and 7.9 mgC L−1 in the Kennebec. Unit area fluxes of DOC in theAndroscoggin watershed were approximately 40 kgC ha−1 year−1, and cumulative annual watershed exportof DOC was estimated at 3.5×10¹⁰ g C year−1. In theKennebec River watershed during the same period,unit area fluxes of DOC averaged 43 kg C ha−1 year−1,and cumulative annual export of DOC was approxi-mately 6.5×10¹⁰ g C year−1. Summing annualexports of carbon from the Penobscot, Kennebec,and Androscoggin River watersheds, it was esti-mated that the three rivers deliver 2.2×10¹¹ gC year−1 as DOC to estuaries and coastal waters inthe Gulf of Maine.
Nitrogen biogeochemistry
Concentrations of total soluble N (TN) in thePenobscot River averaged 0.36 mg N L−1, and thispool was dominated by dissolved organic N (DON) ata flow-weighted mean concentration of 0.32 mgN L−1 (Table 2). Concentrations of nitrate–N wereabout 11% as large as TN, averaging 0.04 mg N L−1,and concentrations of ammonium–N were usuallyclose to detection limits of 0.015 mg N L−1. On aseasonal basis, concentrations of nitrate–N wereelevated in spring and late fall, whereas seasonalpatterns for DON were not apparent. The average C/Nmolar ratio for dissolved organic matter was 39 basedon DOC and DON concentrations, but averaged 35when calculated using DOC divided by TN.
Mean unit area fluxes for TN, DON, and nitrate–Nwere estimated at 1.9, 1.7, and 0.2 kg N ha−1 year−1,respectively. Cumulative annual N exports for thePenobscot River watershed were approximately 3.9×
0
200
400
600
800
1000
1200
J F M A M J J A S O N D
Pen
obsc
ot F
low
m3 /s
Fig. 3 Historical long-term monthly pattern of mean dailydischarge values in the Penobscot River, ME, for the period1903–1999
Environ Monit Assess (2012) 184:4279–4288 4283

109 g year−1 for TN, 3.5×10⁹ g year−1 for DON, and0.4×109 g year−1 for nitrate–N.
Compared with N cycling in the Penobscot River,mean concentrations of nitrate–N (0.11 mg L−1) andunit area fluxes of nitrate–N (0.6 kg ha−1 year−1) werehigher in the Androscoggin and Kennebec Rivers.Mean unit area exports of TN were also somewhat
higher in the Androscoggin (2.0 kg N ha−1 year−1) andKennebec Rivers (2.2 kg N ha−1 year−1). Cumulativeannual exports of TN from the three watershedsincreased from the smallest river basin (Androscoggin)at 1.8×10⁹ g N year−1, to the mid-sized KennebecRiver basin at 3.3×10⁹ g N year−1, and peaked in thelarge Penobscot River basin at 3.9×10⁹ g N year−1.
Concentration, mg L−1
Parameter Minimum Maximum Weighted mean
DOC 7.0 15.3 10.8
TN 0.23 0.45 0.36
DON 0.22 0.44 0.32
Nitrate–N 0.01 0.07 0.04
TSS 0.3 8.7 4.8
Ca 3.2 6.4 3.9
Mg 0.6 1.5 0.8
Na 1.7 6.9 2.2
Fe 0.07 0.44 0.20
Si 0.8 4.1 2.0
TP 0.001 0.011 0.003
Unit area flux, kg ha−1 year−1
Parameter Minimum Maximum Mean
DOC 43.2 79.9 58.3
TN 1.4 2.7 1.9
DON 1.3 2.4 1.7
Nitrate–N 0.1 0.3 0.2
TSS 9.4 29.4 16.1
Ca 15.6 28.9 21.1
Mg 3.2 5.9 4.3
Na 8.8 16.3 11.9
Fe 0.8 1.5 1.1
Si 8.0 14.8 10.8
TP 0.005 0.055 0.015
Watershed annual flux, 109 g year−1
Parameter Minimum Maximum Mean
DOC 86.9 160.7 117.3
TN 2.9 5.4 3.9
DON 2.6 4.8 3.5
Nitrate–N 0.3 0.6 0.4
TSS 18.9 59.1 32.5
Ca 31.4 58.0 42.3
Mg 6.4 11.9 8.7
Na 17.7 32.7 23.9
Fe 1.6 3.0 2.2
Si 16.1 29.8 21.7
TP 0.02 0.04 0.03
Table 2 Summary of ele-ment concentrations andfluxes for the water yearsOctober 2000 to September2005 at Eddington, ME, inthe Penobscot RiverWatershed
Conductivity ranged from20–78 μS, with a mean of32 μS
4284 Environ Monit Assess (2012) 184:4279–4288

Combined annual watershed exports of TN in thethree river systems delivered an average of 9.0×10⁹ g N year−1 to estuaries and coastal waters in theGulf of Maine. Adding that export flux to a previousestimate of nitrate–N export from the AroostookRiver basin (Cronan et al. 1999), it appears that thetotal delivery of soluble N to the Gulf of Maine bythe four largest rivers in the state is at least as largeas 1.0×10¹⁰ g N year−1.
Phosphorus and N/P stoichiometry
The weighted mean concentration of total soluble P(TP) in the Penobscot River was approximately3 μg L−1, and concentrations for this solute weregenerally below 10 μg L−1. As such, the unit area fluxof TP from the Penobscot River watershed isestimated to be <0.02 kg ha−1 year−1. In terms ofnutrient stoichiometry, the N/P molar ratio based onTN and TP values in the Penobscot River isapproximately 265, which is roughly 20-fold higherthan the N/P ratio of 13:1 found in organisms. Thishigh ratio implies that biological production in thisriver is limited by P availability (Schlesinger 1991).
Other solutes and TSS
The Penobscot River generally exhibits the dilutechemistry of an undisturbed watershed that is pre-dominantly forested and contains resistant igneousbedrock. During the study period, the flow-weightedmean conductivity of river water was 32 μS, andcation chemistry was dominated by calcium (Ca) andsodium (Na), with respective flow-weighted meanionic concentrations of 3.9 and 2.2 mg L−1 (Table 2).The molar Ca/Mg ratio in river water was roughly2.9, compared with a Ca/Na ratio of 1.0. The meanconcentrations of soluble silica (Si), suspended solids(TSS), and iron (Fe) were 2.0, 4.8, and 0.2 mg L−1,respectively.
Watershed export fluxes of TSS exhibited acurvilinear relationship with river discharge, withannual values ranging from 1.9 to 5.9 ×10¹⁰ g year−1 during the study and averaging 3.3×10¹⁰ g year−1. River fluxes of soluble Si thatsupports growth of marine diatoms averaged 2.2×10¹⁰ g year−1, whereas fluxes of soluble andcolloidal Fe required by photosynthetic marineplankton averaged 2.2×10⁹ g year−1. Annual unit
area exports of Ca + Mg + Na (Table 2) minus wetdeposition inputs of cations (NADP/NTN 2010)were roughly equivalent to 1,840 molcha
−1 year−1,which represents a minimum estimate of cationdenudation from the watershed (Reynolds andJohnson 1972).
Discussion
Numerous investigators have examined watershedexport fluxes of carbon as a potential energy subsidyto downstream aquatic receptors. In their study of riversin Atlantic Canada, Clair et al. (1994) reported thatwatershed exports of DOC ranged from 16 to 123.5 kgC ha−1 year−1 and averaged 29 kg C ha−1 year−1.Spitzy and Leenheer (1991) examined 20 major worldrivers and found that annual exports of DOC variedfrom 3 to 61 kg C ha−1 year−1. In their analysis of totalorganic carbon transport in northern rivers of theworld, Teland et al. (1991) reported exports rangingfrom 11 to 21 kg C ha−1 year−1. Comparing streams inthe Aroostook River basin of northern Maine, Cronanet al. (1999) found that mean annual DOC fluxes inagricultural watersheds were 30 kg C ha−1 year−1,whereas stream fluxes in forested watersheds averaged48 kg C ha−1 year−1. McDowell and Likens (1988)reported that mean annual DOC flux in a first-orderstream draining Hubbard Brook Forest, NH, was 20 kgC ha−1 year−1. Compared with published values, thecarbon export estimate of 58 kg C ha−1 year−1 for thePenobscot River watershed is in the upper range ofprevious estimates. This elevated flux probably reflectsthe combined influences of favorable hydrologic flowpaths and biogeochemical conditions leading to elevat-ed generation, persistence, and transport of humicsubstances within a landscape dominated by forestcover and wetlands.
Estuaries and coastal waters in the Gulf of Mainereceive annual carbon subsidies of roughly 2.2×10¹¹ g C year−1 in the form of DOC in combinedannual runoff from the Penobscot, Androscoggin, andKennebec Rivers. Taking into account additionalannual DOC exports from the Aroostook River basinin northern Maine estimated by Cronan et al. (1999),the four major river systems in Maine provideestuaries and coastal waters with annual DOC inputsof approximately 2.5×10¹¹ g C year−1. By compari-son, Townsend (1998) estimated that estuarine pro-
Environ Monit Assess (2012) 184:4279–4288 4285

duction in the Gulf of Maine is approximately 8.3×10¹¹ g C year−1. Thus, annual DOC export from thefour rivers is roughly equivalent to 30% of estuarineprimary production.
Mean annual unit area export of TN from thePenobscot River watershed was 1.9 kg N ha−1 year−1,which is at the low end of estimates for TN exportreported by Driscoll et al. (2003) for the northeasternUSA (Fig. 4). The Penobscot flux of N was alsocompared with 44 other watershed export estimatesreported in papers by Frink (1991), Howarth et al.(1996), Jordan et al. (1997), David and Gentry (2000),and Boyer et al. (2002). In that composite database,90% of the reported annual fluxes are ≥2.1 kgN ha−1 year−1, 75% of the values exceed 4.4 kgN ha−1 year−1, and 50% of the values exceed 7.4 kgN ha−1 year−1. Based on that comparison, unit areaexports of TN from the Penobscot River watershed arelower than roughly 90% of other reported fluxestimates. Furthermore, the ratio of DON/TN inunit exports (0.89) is well outside the range ofdegraded conditions described by Pellerin et al.(2006). As such, this Maine river system can beviewed as an example of a reference condition orendpoint for ecological assessments of river restora-tion or impairment.
Another tool that is useful in examining watershedN cycling is to estimate N retention relative to overallwatershed inputs of N. Based on estimates reportedby Boyer et al. (2002) for total annual N inputs to thePenobscot River watershed (8.35 kg N ha−1 year−1), itappears that the watershed retains approximately 81%of N inputs.
In their study of 16 watersheds in the northeasternUSA, Boyer et al. (2002) estimated N export fluxes fora range of rivers from Maine to Virginia, including thethree rivers examined in this study. During the period1988–1993, they estimated that exports of TN were3.2 kg N ha−1 year−1 in the Penobscot watershed,3.3 kg N ha−1 year−1 in the Kennebec watershed, and4.0 kg N ha−1 year−1 in the Androscoggin watershed.These higher export values may be a reflection ofelevated runoff during that period (mean of 59 cm forthe Penobscot River) or higher estimates of TNconcentrations reported by Alexander et al. (1998).
Looking to the future, it is important to consider hownutrient exports in the Penobscot River might beaffected by various drivers of landscape change associ-ated with human activities or climate. As an example, ifpopulation density were to double in the next halfcentury within the watershed, that development processcould potentially increase current watershed unit areaexports from 1.9 to 2.15 kg N ha−1 year−1 (based onhuman waste coefficients). In an alternative scenario, iffarming activities were to increase substantially inconjunction with a push for local food production, onemight expect to see a progressive increase in N and Pexports from the watershed as land cover shifted fromforested to agricultural uses (Cronan et al. 1999; Davidand Gentry 2000).
Conclusions
The Penobscot River exhibits order of magnitudechanges in runoff during the year, whereas concen-
0 5 10 15 20 25 30 35 40
Massachusetts Bay, MA
Narragansett Bay, RI
Raritan Bay, NY
Buzzards Bay, MA
Merrimack River, MA
Great Bay, NH
Casco Bay, ME
Kennebec River, ME
Androscoggin River, ME
Penobscot River, ME
Annual N Export kg/ha
Fig. 4 Mean annual unitarea exports of nitrogenfrom a variety of watershedsalong the northeastern coastof the USA. Values for thePenobscot, Androscoggin,and Kennebec River water-sheds are from this study;other values are based onDriscoll et al. (2003)
4286 Environ Monit Assess (2012) 184:4279–4288

trations of solutes vary by much smaller amounts.Consequently, export fluxes of nutrients and TSS arestrongly controlled by hydrology. Watershed unit areaexports of DOC and base cations are relatively high inwaters draining the forested Penobscot River basin,whereas exports of P and N are low, with most of theN flux dominated by DON. As such, the PenobscotRiver upstream of the city of Bangor displaysminimal symptoms of non-point nutrient pollutionand nitrogen saturation, and represents an example ofbackground reference conditions for water quality interms of nutrient chemistry. The heavily forestedwatershed acts as a conservative nutrient sink thattends to minimize export fluxes of nutrients andsediments to downstream waters. Evidence indi-cates that primary production in the river is limitedby phosphorus availability, and this implies thatland use and anthropogenic activities within thewatershed should be managed to avoid excess Pexports that might stimulate undesirable algalproduction.
Acknowledgments This research was supported by theMaine Agricultural and Forest Experiment Station (publicationno. 3219) and the Sustainability Solutions Initiative (NationalScience Foundation grant EPS-0904155). The author thanksJohn Cangelosi for analytical assistance and Jill Tremblay forpreparing the map and land cover estimates. The contributionsof peer reviewers are also gratefully acknowledged by theauthor.
References
Aitkenhead, J. A., & McDowell, W. H. (2000). Soil C:N ratio asa predictor of annual riverine DOC flux at local and globalscales. Global Biogeochemical Cycles, 14, 127–138.
Alexander, R. B., Slack, J. R., Ludtke, A. S., Fitzgerald, K. K.,& Schertz, T. L. (1998). Data from selected U.S.Geological Survey national stream water monitoring net-works. Water Resources Research, 34, 2401–2405.
Boyer, E. W., Goodale, C. L., Jaworski, N. A., & Horwarth, R.W. (2002). Anthropogenic nitrogen sources and relation-ships to riverine nitrogen export in the northeastern U.S.A.Biogeochemistry, 57/58, 137–169.
Carpenter, S. R., Caraco, N. F., Correll, D. L., Howarth, R. W.,Sharpley, A. N., & Smith, V. H. (1998). Nonpoint pollutionof surface waters with phosphorus and nitrogen. Ecolog-ical Applications, 8, 559–568.
Clair, T. A., Pollock, T. L., & Ehrman, J. M. (1994). Exports ofcarbon and nitrogen from river basins in Canada's AtlanticProvinces. Global Biogeochemical Cycles, 8, 441–450.
Correll, D. L., Jordan, T. E., & Weller, D. E. (1999).Precipitation effects on sediment and associated nutrient
discharges from Rhode River watersheds. Journal ofEnvironmental Quality, 28, 1897–1907.
Craig, L., Palmer, M. A., Richardson, D. C., Filoso, S.,Bernhardt, E. S., Bledsoe, B. P., et al. (2008). Streamrestoration strategies for reducing river nitrogenloads. Frontiers in Ecology and the Environment, 6,529–538.
Cronan, C. S., Piampiano, J. T., & Patterson, H. H. (1999).Influence of land use and hydrology on exports of carbonand nitrogen in a Maine river basin. Journal of Environ-mental Quality, 28, 953–961.
David, M. B., & Gentry, L. E. (2000). Anthropogenic inputs ofnitrogen and phosphorus and riverine export for Illinois,USA. Journal of Environmental Quality, 29, 494–508.
Degens, E. T., Kempe, S., & Richey, J. E. (1991). Summary:biogeochemistry of major world rivers. In E. T. Degens, S.Kempe, & J. E. Richey (Eds.), Biogeochemistry of majorworld rivers (pp. 323–347). New York: Wiley.
Dillon, P. J., Molot, L. A., & Scheider, W. A. (1991).Phosphorus and nitrogen export from forested streamcatchments in central Ontario. Journal of EnvironmentalQuality, 20, 857–864.
Driscoll, C. T., Whitall, D., Aber, J., Boyer, E., Castro, M.,Cronan, C., et al. (2003). Nitrogen pollution in thenortheastern United States: sources, effects, and manage-ment options. BioScience, 53, 357–374.
Eaton, A. D., & Franson, M. A. H. (Eds.). (2005). Standardmethods for the examination of water and wastewater.Washington: American Public Health Association.
Frink, C. R. (1991). Estimating nutrient exports to estuaries.Journal of Environmental Quality, 20, 717–724.
Goolsby, D. A. (2000). Mississippi basin nitrogen flux believedto cause Gulf hypoxia. EOS Transactions AGU, 81, 321–321.
Howarth, R. W., Fruci, J. R., & Sherman, D. (1991). Imputs ofsediment and carbon to an estuarine ecosystem: influenceof land use. Ecological Applications, 1, 27–39.
Howarth, R. W., Billen, G., Swaney, D., Townsend, A.,Jaworski, N., Lajtha, K., et al. (1996). Regional nitrogenbudgets and riverine N and P fluxes for the drainages tothe North Atlantic Ocean: natural and human influences.In R. W. Howarth (Ed.), Nitrogen cycling in the NorthAtlantic Ocean and its watersheds (pp. 75–139). Boston:Kluwer.
Ittekkot, V., & Laane, R. W. P. M. (1991). Fate of riverineparticulate organic matter. In E. T. Degens, S. Kempe, & J.E. Richey (Eds.), Biogeochemistry of major world rivers,Scope 42 (pp. 233–243). New York: Wiley.
Jordan, T. E., Correll, D. L., & Weller, D. E. (1997). Effects ofagriculture on discharges of nutrients from coastal plainwatersheds of Chesapeake Bay. Journal of EnvironmentalQuality, 26, 836–848.
Kawaguchi, T., Lewitus, A. J., Aelion, C. M., & McKellar, H.N. (1997). Can urbanization limit iron availability toestuarine algae? Journal of Experimental Marine Biologyand Ecology, 213, 53–69.
Mayer, B., Boyer, E. W., Goodale, C., Jaworski, N. A., VanBreemen, N., Howarth, R. W., et al. (2002). Sources ofnitrate in rivers draining sixteen watersheds in thenortheastern U.S.: isotopic constraints. Biogeochemistry,57/58, 171–197.
Environ Monit Assess (2012) 184:4279–4288 4287

McDowell, W. H., & Likens, G. E. (1988). Origin, composi-tion, and flux of dissolved organic carbon in theHubbard Brook valley. Ecological Monographs, 58,177–195.
Meybeck, M. (1982). Carbon, nitrogen, and phosphorustransport by world rivers. American Journal of Science,282, 401–450.
NADP/NTN. (2010). Annual and seasonal data summary forsite ME09. National Atmospheric Deposition Program/National Trends Network. http://nadp.sws.uiuc.edu.Accessed 15 Sep 2010.
NLCD (2006) National land cover data. http://www.epa.gov/mrlc/nlcd-2006.html/. Accessed 25 May 2011.
Osberg, P. H., Hussey, A. M., & Boone, G. M. (1985). Bedrockgeology map of Maine. Augusta: Dept. of Conservation.
Pellerin, B. A., Kaushall, S. S., & McDowell, W. H. (2006).Does anthropogenic nitrogen enrichment increase organicnitrogen concentrations in runoff from forested andhuman-dominated watersheds? Ecosystems, 9, 852–864.
Peterson, B. J., Wollheim, W. M., Mulholland, P. J., Webster, J.R., Meyer, J. L., Tank, J. L., et al. (2001). Control ofnitrogen export from watersheds by headwater streams.Science, 292, 86–90.
Puckett, L. J. (1995). Identifying the major sources of nutrientwater pollution: a national catchment-based analysisconnects nonpoint and point sources of nitrogen and
phosphorus with regional land use and other factors.Environmental Science and Technology, 29, 408–414.
Reynolds, R. J., & Johnson, N. M. (1972). Chemicalweathering in the temperate glacial environment of thenorthern Cascade Mountains. Geochimica CosmochimicaActa, 36, 537–554.
Schlesinger, W. H. (1991). Biogeochemistry––an analysis ofglobal change. New York: Academic.
Spitzy, A., & Leenheer, J. (1991). Dissolved organic carbon inrivers. In E. T. Degens, S. Kempe, & J. E. Richey (Eds.),Biogeochemistry of major world rivers, Scope 42 (pp.213–232). New York: Wiley.
Teland, S. A., Pocklington, R., Naidu, A. S., Romankevich, E.A., Gitelson, I. I., & Gladyshev, M. I. (1991). Carbon andmineral transport in major North American, RussianArctic, and Siberian Rivers: the St. Lawrence, theMackenzie, the Yukon, the arctic Alaskan rivers, the arcticbasin rivers in the Soviet Union, and the Yenisi. In E. T.Degens, S. Kempe, & J. E. Richey (Eds.), Biogeochem-istry of major world rivers, Scope 42 (pp. 75–104). NewYork: Wiley.
Thompson, W. B., & Borns, H. W. (1985). Surficial geologicmap of Maine. Augusta: Dept. of Conservation.
Townsend, D. W. (1998). Sources and cycling of nitrogen inthe Gulf of Maine. Journal of Marine Systems, 16, 283–295.
4288 Environ Monit Assess (2012) 184:4279–4288