Embed Size (px)
Citation preview
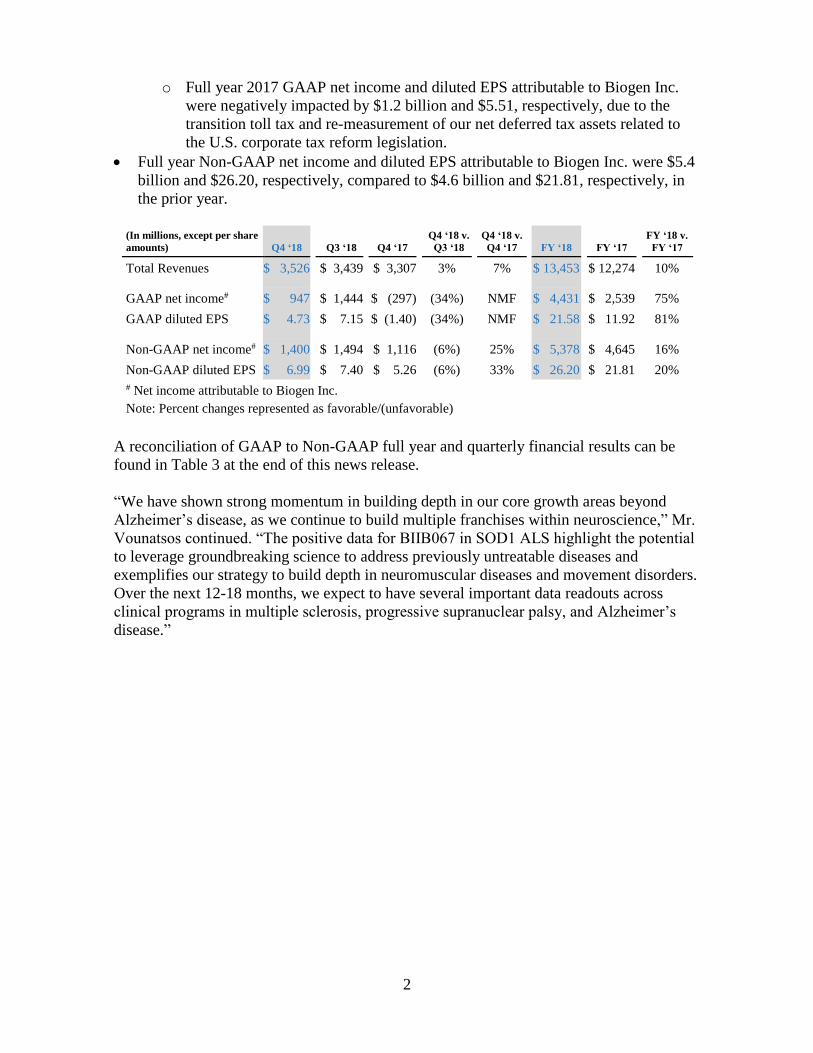
BIOGEN REPORTS RECORD REVENUES FOR BOTH THE FULL YEAR AND
Q4 2018, $13.5 BILLION AND $3.5 BILLION, RESPECTIVELY
2018 revenues grew 10%, driven primarily by SPINRAZA®
2018 GAAP EPS increased 81%; Non-GAAP EPS increased 20%
Company added six clinical programs to neuroscience pipeline in 2018
Biogen reported positive Phase 1 data for BIIB067 in amyotrophic lateral sclerosis (ALS)
Cambridge, Mass., January 29, 2019 -- Biogen Inc. (Nasdaq: BIIB) today reported full
year and fourth quarter 2018 financial results.
“In 2018 Biogen executed well against our strategic priorities and financial objectives,”
said Michel Vounatsos, Biogen’s chief executive officer. “We made significant progress
developing and expanding our pipeline, as well as advancing multiple modalities to
potentially deliver new therapies to patients. We also reported solid revenue growth for the
year, led by continued strong global penetration of SPINRAZA, significant gains in our
biosimilars business, and resilience in our core MS business. We believe our strong base
business, including a deep and diversified neuroscience pipeline, positions Biogen well to
take advantage of the opportunities before us. As always, we remain focused on allocating
capital efficiently and appropriately with the objective of maximizing returns for our
shareholders over the long term.”
Financial Results
• Full year total revenues were $13.5 billion, a 10% increase versus the prior year.
o Full year multiple sclerosis (MS) revenues, including $478 million in royalties
on the sales of OCREVUS®, were relatively stable versus the prior year at $9.1
billion.
▪ For the fourth quarter of 2018 MS revenues, including $152 million in
royalties on the sales of OCREVUS, grew 2% versus the prior year to
$2.3 billion.
o Full year revenue growth was driven primarily by the continued global launch
of SPINRAZA, which contributed $1.7 billion in revenues compared to $884
million in the prior year.
• Full year GAAP net income and diluted earnings per share (EPS) attributable to Biogen
Inc. were $4.4 billion and $21.58, respectively, compared to $2.5 billion and $11.92,
respectively, in the prior year.
2
o Full year 2017 GAAP net income and diluted EPS attributable to Biogen Inc.
were negatively impacted by $1.2 billion and $5.51, respectively, due to the
transition toll tax and re-measurement of our net deferred tax assets related to
the U.S. corporate tax reform legislation.
• Full year Non-GAAP net income and diluted EPS attributable to Biogen Inc. were $5.4
billion and $26.20, respectively, compared to $4.6 billion and $21.81, respectively, in
the prior year.
(In millions, except per share
amounts) Q4 ‘18 Q3 ‘18 Q4 ‘17
Q4 ‘18 v.
Q3 ‘18
Q4 ‘18 v.
Q4 ‘17 FY ‘18 FY ‘17
FY ‘18 v.
FY ‘17
Total Revenues $ 3,526 $ 3,439 $ 3,307 3% 7% $ 13,453 $ 12,274 10%
GAAP net income# $ 947 $ 1,444 $ (297) (34%) NMF $ 4,431 $ 2,539 75%
GAAP diluted EPS $ 4.73 $ 7.15 $ (1.40) (34%) NMF $ 21.58 $ 11.92 81%
Non-GAAP net income# $ 1,400 $ 1,494 $ 1,116 (6%) 25% $ 5,378 $ 4,645 16%
Non-GAAP diluted EPS $ 6.99 $ 7.40 $ 5.26 (6%) 33% $ 26.20 $ 21.81 20%
# Net income attributable to Biogen Inc.
Note: Percent changes represented as favorable/(unfavorable)
A reconciliation of GAAP to Non-GAAP full year and quarterly financial results can be
found in Table 3 at the end of this news release.
“We have shown strong momentum in building depth in our core growth areas beyond
Alzheimer’s disease, as we continue to build multiple franchises within neuroscience,” Mr.
Vounatsos continued. “The positive data for BIIB067 in SOD1 ALS highlight the potential
to leverage groundbreaking science to address previously untreatable diseases and
exemplifies our strategy to build depth in neuromuscular diseases and movement disorders.
Over the next 12-18 months, we expect to have several important data readouts across
clinical programs in multiple sclerosis, progressive supranuclear palsy, and Alzheimer’s
disease.”

3
Revenue Highlights
(In millions) Q4 ‘18 Q3 ‘18 Q4 ‘17
Q4 ‘18 v.
Q3 ‘18
Q4 ‘18 v.
Q4 ‘17 FY ‘18 FY ‘17
FY ‘18 v.
FY ‘17
Multiple Sclerosis (MS):
TECFIDERA® $ 1,110 $ 1,090 $ 1,076 2% 3% $ 4,274 $ 4,214 1%
Total Interferon $ 597 $ 590 $ 645 1% (7%) $ 2,363 $ 2,646 (11%)
AVONEX® $ 481 $ 482 $ 520 (0%) (8%) $ 1,915 $ 2,152 (11%)
PLEGRIDY® $ 116 $ 108 $ 125 7% (7%) $ 448 $ 494 (9%)
TYSABRI® $ 464 $ 470 $ 463 (1%) 0% $ 1,864 $ 1,973 (6%)
FAMPYRA™ $ 23 $ 23 $ 24 1% (6%) $ 93 $ 92 1%
ZINBRYTA® $ - $ - $ 12 NMF (100%) $ 1 $ 53 (98%)
Spinal Muscular Atrophy:
SPINRAZA $ 470 $ 468 $ 363 0% 30% $ 1,724 $ 884 95%
Hemophilia*:
ELOCTATE® $ - $ - $ - NMF NMF $ - $ 48 (100%)
ALPROLIX® $ - $ - $ - NMF NMF $ - $ 26 (100%)
Other Product Revenues:
Biosimilars $ 156 $ 135 $ 122 16% 28% $ 545 $ 380 44%
FUMADERM™ $ 5 $ 5 $ 9 4% (44%) $ 22 $ 40 (44%)
Total Product Revenues: $ 2,826 $ 2,780 $ 2,712 2% 4% $ 10,887 $ 10,355 5%
OCREVUS Royalties $ 152 $ 137 $ 77 11% 97% $ 478 $ 159 200%
RITUXAN®/GAZYVA®
Revenues $ 383 $ 375 $ 338 2% 13% $ 1,502 $ 1,400 7%
Other Revenues $ 166 $ 147 $ 180 13% (8%) $ 586 $ 360 63%
Total Revenues $ 3,526 $ 3,439 $ 3,307 3% 7% $ 13,453 $ 12,274 10%
MS Product Revenues +
OCREVUS Royalties $ 2,346 $ 2,310 $ 2,296 2% 2% $ 9,073 $ 9,137 (1%)
Note: Numbers may not foot due to rounding; percent changes represented as favorable/(unfavorable)
* In Q1 2017 Biogen completed the spin-off of its global hemophilia business. As of February 1, 2017,
Biogen no longer records product revenues for ELOCTATE and ALPROLIX.
• In the fourth quarter of 2018 channel inventory levels in the U.S. increased by
approximately $115 million for TECFIDERA, AVONEX, PLEGRIDY, and TYSABRI
combined. This compares to relatively stable inventory levels in the third quarter of
2018 and an increase of approximately $50 million in the fourth quarter of 2017.
• In the fourth quarter of 2018 SPINRAZA revenues comprised $236 million in sales in
the U.S. and $234 million in sales outside the U.S. The number of commercial patients
receiving SPINRAZA grew approximately 9% in the U.S. and approximately 18%
outside the U.S. versus the third quarter of 2018. In the fourth quarter of 2018 Biogen
recorded SPINRAZA revenues in over 40 countries. SPINRAZA revenues outside the
4
U.S. were negatively impacted by a combination of lower volumes in certain markets
due to loading dose dynamics, the timing of shipments in certain distributor markets,
and pricing dynamics in certain markets.
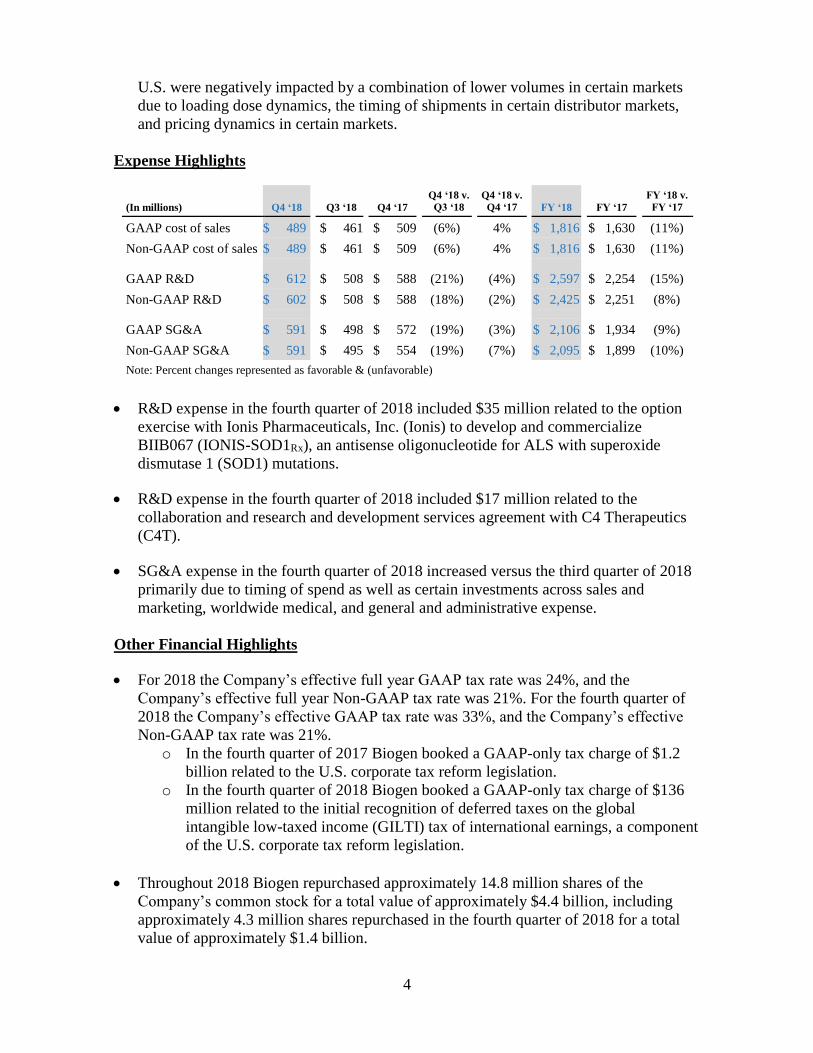
Expense Highlights
(In millions) Q4 ‘18 Q3 ‘18 Q4 ‘17
Q4 ‘18 v.
Q3 ‘18
Q4 ‘18 v.
Q4 ‘17 FY ‘18 FY ‘17
FY ‘18 v.
FY ‘17
GAAP cost of sales $ 489 $ 461 $ 509 (6%) 4% $ 1,816 $ 1,630 (11%)
Non-GAAP cost of sales $ 489 $ 461 $ 509 (6%) 4% $ 1,816 $ 1,630 (11%)
GAAP R&D $ 612 $ 508 $ 588 (21%) (4%) $ 2,597 $ 2,254 (15%)
Non-GAAP R&D $ 602 $ 508 $ 588 (18%) (2%) $ 2,425 $ 2,251 (8%)
GAAP SG&A $ 591 $ 498 $ 572 (19%) (3%) $ 2,106 $ 1,934 (9%)
Non-GAAP SG&A $ 591 $ 495 $ 554 (19%) (7%) $ 2,095 $ 1,899 (10%)
Note: Percent changes represented as favorable & (unfavorable)
• R&D expense in the fourth quarter of 2018 included $35 million related to the option
exercise with Ionis Pharmaceuticals, Inc. (Ionis) to develop and commercialize
BIIB067 (IONIS-SOD1Rx), an antisense oligonucleotide for ALS with superoxide
dismutase 1 (SOD1) mutations.
• R&D expense in the fourth quarter of 2018 included $17 million related to the
collaboration and research and development services agreement with C4 Therapeutics
(C4T).
• SG&A expense in the fourth quarter of 2018 increased versus the third quarter of 2018
primarily due to timing of spend as well as certain investments across sales and
marketing, worldwide medical, and general and administrative expense.
Other Financial Highlights
• For 2018 the Company’s effective full year GAAP tax rate was 24%, and the
Company’s effective full year Non-GAAP tax rate was 21%. For the fourth quarter of
2018 the Company’s effective GAAP tax rate was 33%, and the Company’s effective
Non-GAAP tax rate was 21%.
o In the fourth quarter of 2017 Biogen booked a GAAP-only tax charge of $1.2
billion related to the U.S. corporate tax reform legislation.
o In the fourth quarter of 2018 Biogen booked a GAAP-only tax charge of $136
million related to the initial recognition of deferred taxes on the global
intangible low-taxed income (GILTI) tax of international earnings, a component
of the U.S. corporate tax reform legislation.
• Throughout 2018 Biogen repurchased approximately 14.8 million shares of the
Company’s common stock for a total value of approximately $4.4 billion, including
approximately 4.3 million shares repurchased in the fourth quarter of 2018 for a total
value of approximately $1.4 billion.
5
• As of December 31, 2018, Biogen had cash, cash equivalents, and marketable securities
totaling approximately $4.9 billion, and approximately $5.9 billion in notes payable and
other financing arrangements.
• The Company generated $6.2 billion in net cash flows from operations in 2018,
including $1.9 billion in the fourth quarter of 2018.
• For 2018 the Company’s full year weighted average diluted shares were 205 million.
For the fourth quarter of 2018 the Company’s weighted average diluted shares were
200 million.
2019 Financial Guidance
Biogen also announced its full year 2019 financial guidance. This guidance consists of the
following components:
• Revenue is expected to be approximately $13.6 billion to $13.8 billion.
• GAAP and Non-GAAP R&D expense is expected to be approximately 16% to 17% of
total revenue.
o This guidance does not include any impact from potential acquisitions or large
business development transactions, as both are hard to predict.
• GAAP and Non-GAAP SG&A expense is expected to be approximately 16% to 17% of
total revenue.
• GAAP tax rate is expected to be approximately 18.5% to 19.5%; Non-GAAP tax rate is
expected to be approximately 18% to 19%.
• GAAP diluted EPS is expected to be between $26.65 and $27.65.
• Non-GAAP diluted EPS is expected to be between $28.00 and $29.00.
Biogen may incur charges, realize gains or losses, or experience other events in 2019 that
could cause actual results to vary from this guidance.
Recent Events
• In January 2019 Biogen and Skyhawk Therapeutics, Inc. (Skyhawk) entered into a
collaboration and research and development services agreement pursuant to which the
companies will leverage Skyhawk’s SkySTAR™ technology platform with the goal of
discovering innovative small molecule RNA splicing modifiers for MS, spinal muscular
atrophy (SMA), and other neurological diseases. Biogen paid Skyhawk an upfront
payment of $74 million and may also pay additional milestone payments as well as
potential royalties. Biogen expects to record a research and development expense of
approximately $35 million in the first quarter of 2019 related to this collaboration, with
the remaining portion of the upfront payment to be allocated to future research services.
• In 2018 Biogen added six clinical programs to its neuroscience pipeline, including
BIIB078 (IONIS-C9Rx) for C9ORF72-associated ALS, BIIB110 (ActRIIA/B ligand
trap) for muscle enhancement in diseases such as SMA, an option to acquire TMS-007
for acute ischemic stroke, BIIB104 (AMPA receptor potentiator) for cognitive
6
impairment associated with schizophrenia (CIAS), BIIB074 (vixotrigine) for small
fiber neuropathy, and BIIB095 for neuropathic pain.
• In December 2018 Biogen and C4T entered into a collaboration and research and
development services agreement to investigate the use of C4T’s novel protein
degradation platform to discover and develop potential new treatments for neurological
conditions, such as Alzheimer’s disease (AD) and Parkinson’s disease. Biogen will pay
C4T up to a total of $415 million in upfront and additional milestone payments as well
as potential royalties. Biogen recorded a research and development expense of $17
million in the fourth quarter of 2018 related to this collaboration.
• In December 2018 Biogen enrolled the first patient in a global Phase 3b study
evaluating the efficacy and safety of extended interval dosing (EID) for natalizumab
compared to standard interval dosing (SID) in patients with relapsing MS. Currently
commercialized under the brand name TYSABRI, natalizumab 300 mg dosed every
four weeks is the only approved dosing regimen. The new study, NOVA, is a two-year,
prospective, randomized, interventional, controlled, open-label, rater-blinded,
international Phase 3b study that will assess the efficacy of six-week natalizumab
dosing intervals in people with relapsing-remitting MS with a primary endpoint
measuring the number of new or newly enlarging T2 hyperintense lesions at week 48.
The NOVA study was initiated following analyses of observational data that showed
that EID was associated with a significant reduction in the risk of progressive
multifocal leukoencephalopathy (PML), a rare but serious brain infection. The NOVA
study aims to assess the efficacy of EID natalizumab to further evaluate the drug’s
benefit-risk profile.
• In December 2018 Biogen received feedback from the U.S. Food and Drug
Administration (FDA) on its proposed Phase 3 development plan for BIIB074
(vixotrigine) in trigeminal neuralgia (TGN). Biogen is now planning to initiate a Phase
3 program for the development of vixotrigine in TGN by the end of 2019.
• In December 2018 Biogen and Alkermes plc (Alkermes) announced that Alkermes has
submitted a New Drug Application (NDA) to the FDA for diroximel fumarate
(BIIB098), a novel oral fumarate in development for the treatment of relapsing forms of
MS. Alkermes is seeking approval of diroximel fumarate under the 505(b)(2)
regulatory pathway, and the NDA submission includes data from EVOLVE-1, a Phase
3 pivotal trial that evaluated long-term safety in relapsing-remitting MS with
approximately 700 patients dosed with diroximel fumarate. If approved, Biogen intends
to market diroximel fumarate under the brand name VUMERITY™. This name has
been conditionally accepted by the FDA and will be confirmed upon approval.
• In December 2018 Biogen notified Applied Genetic Technologies Corporation (AGTC)
of the termination of its collaboration agreement related to the development of AAV-
based gene therapies for the treatment of rare ophthalmologic diseases, including X-
linked retinoschisis (XLRS) and X-linked retinitis pigmentosa. This portfolio
prioritization decision followed topline interim six-month data from a Phase 1/2 clinical
trial in XLRS which demonstrated no signs of clinical activity. The termination will be
effective in March 2019.
7
• In December 2018 Biogen reported positive Phase 1 data from an interim analysis of a
randomized, placebo-controlled single- and multiple-ascending dose study (n=70) that
achieved proof-of-biology and proof-of-concept for BIIB067, an investigational
treatment for ALS with SOD1 mutations. At the highest dose tested (n=10), treatment
with BIIB067 over a three month period resulted in a statistically significant lowering
of SOD1 protein levels in the cerebrospinal fluid (p=0.002) and numerical trends across
three efficacy endpoints: slowing of clinical decline as measured by the ALS
Functional Rating Scale-Revised, slowing of decline in respiratory function as
measured by slow vital capacity, and slowing of decline in muscle strength as measured
by handheld dynamometry, all compared to placebo (n=12). Biogen paid Ionis a $35
million one-time upfront payment to exercise its option to obtain a worldwide,
exclusive, royalty-bearing license to develop and commercialize BIIB067. The
Company plans to add an additional cohort to this study with the potential to support
registration.
• In December 2018 Biogen dosed the first patient in the Phase 2b study of BIIB104, an
AMPA receptor potentiator, in patients with CIAS.
• In December 2018 Biogen dosed the first patient in a bioequivalence study to test
whether exposure levels of PLEGRIDY are maintained with intramuscular
administration as compared to subcutaneous administration. Biogen is pursuing an
intramuscular formulation of PLEGRIDY with the goal of reducing injection site
reactions.
• In November 2018 Biogen was awarded the 2018 International Prix Galien as Best
Biotechnology Product for SPINRAZA, the first and only treatment for SMA. The
prestigious honor marks the seventh Prix Galien for SPINRAZA, following country
recognitions in the U.S., Germany, Italy, Belgium-Luxembourg, the Netherlands, and
the U.K. The International Prix Galien is given every two years by Prix Galien
International Committee members in recognition of excellence in scientific innovation
to improve human health.
• In October 2018 Biogen presented results at the Clinical Trials on Alzheimer’s Disease
(CTAD) meeting, in Barcelona, Spain, from the recent 36- and 48-month analyses of
the ongoing long-term extension (LTE) of the Phase 1b PRIME study of aducanumab,
an investigational treatment for mild cognitive impairment (MCI) due to AD and mild
AD. A late-breaking oral presentation and a poster included data from patients treated
with aducanumab for up to 36 and 48 months. Data from both analyses showed a
reduction in amyloid plaque levels in a dose- and time-dependent manner, as measured
by positron emission tomography (PET). In addition, analyses of exploratory clinical
endpoints, Clinical Dementia Rating Sum of Boxes (CDR-SB) and the Mini-Mental
State Examination (MMSE), suggested a continued slowing of clinical decline over 36
months and 48 months. The results in each dosing arm were generally consistent with
previously reported analyses of this study, and there were no changes to the risk-benefit
profile of aducanumab.
8
• In October 2018 Biogen’s collaboration partner Eisai Co., Ltd. (Eisai) presented the
latest data from the Phase 2 clinical study (Study 201) of BAN2401, an anti-amyloid
beta protofibril antibody, in 856 patients with early AD, at a symposium session titled
“Clinical and Biomarker Updates from BAN2401 Study 201 in Early Alzheimer’s
Disease” held on October 25 at CTAD. The study did not achieve its primary outcome
measure which was designed to enable a potentially more rapid entry into Phase 3
development based on Bayesian analysis at 12 months of treatment. From conventional
statistical analysis of the topline 18-month final results, the highest treatment dose
demonstrated a statistically significant reduction in brain amyloid measured by PET at
18 months (p<0.0001). This dose also showed a statistically significant slowing of
clinical decline on the Alzheimer’s disease composite score (ADCOMS) of 30%
compared to placebo at 18 months (p=0.034). Eisai also presented analysis of clinical
outcome measures in pre-specified subgroups, including in APOE4 positive versus
APOE4 negative patients.
Conference Call and Webcast
The Company’s earnings conference call for the fourth quarter will be broadcast via the
internet at 8:00 a.m. ET on January 29, 2019, and will be accessible through the Investors
section of Biogen’s website, www.biogen.com. Supplemental information in the form of a
slide presentation is also accessible at the same location on the internet and will be
subsequently available on the website for at least one month.
Note about Earnings Releases and Calls
Starting with the second quarter 2018 earnings release, Biogen has ceased publishing press
releases relating to future earnings calls, earnings releases, and investor events via
newswire services. The Company will post these materials on the Investors section of
Biogen’s website, www.biogen.com, and issue a statement on Twitter (@biogen) when
they become available.
About Biogen
At Biogen, our mission is clear: we are pioneers in neuroscience. Biogen discovers,
develops, and delivers worldwide innovative therapies for people living with serious
neurological and neurodegenerative diseases. One of the world’s first global biotechnology
companies, Biogen was founded in 1978 by Charles Weissmann, Heinz Schaller, Kenneth
Murray, and Nobel Prize winners Walter Gilbert and Phillip Sharp, and today has the
leading portfolio of medicines to treat multiple sclerosis, has introduced the first and only
approved treatment for spinal muscular atrophy, and is focused on advancing neuroscience
research programs in Alzheimer’s disease and dementia, MS and neuroimmunology,
movement disorders, neuromuscular disorders, acute neurology, neurocognitive disorders,
pain, and ophthalmology. Biogen also manufactures and commercializes biosimilars of
advanced biologics.
We routinely post information that may be important to investors on our website at
www.biogen.com. Follow us on social media – Twitter, LinkedIn, Facebook, YouTube.
9
Safe Harbor
This news release contains forward-looking statements, including statements made
pursuant to the safe harbor provisions of the Private Securities Litigation Reform Act of
1995, relating to: our strategy and plans; potential of our commercial business and pipeline
programs; capital allocation and investment strategy; clinical trials and data readouts and
presentations; regulatory filings and the timing thereof; anticipated benefits and potential of
investments, collaborations, and business development activities; and our 2019 financial
guidance. Drug development and commercialization involve a high degree of risk, and only
a small number of research and development programs result in commercialization of a
product. Results in early stage clinical trials may not be indicative of full results or results
from later stage or larger scale clinical trials and do not ensure regulatory approval. These
forward-looking statements may be accompanied by such words as “aim,” “anticipate,”
“believe,” “could,” “estimate,” “expect,” “forecast,” “intend,” “may,” “plan,” “potential,”
“possible,” “will,” “would,” and other words and terms of similar meaning. You should not
place undue reliance on these statements or the scientific data presented.
These statements involve risks and uncertainties that could cause actual results to differ
materially from those reflected in such statements, including: our dependence on sales from
our principal products; difficulties in obtaining and maintaining adequate coverage, pricing,
and reimbursement for our products; failure to protect and enforce our data, intellectual
property, and other proprietary rights and the risks and uncertainties relating to intellectual
property claims and challenges; uncertainty of long-term success in developing, licensing,
or acquiring other product candidates or additional indications for existing products; failure
to compete effectively due to significant product competition in the markets for our
products; failure to successfully execute on our growth initiatives; risks relating to
technology failures or breaches; the risk that positive results in a clinical trial may not be
replicated in subsequent or confirmatory trials or success in early stage clinical trials may
not be predictive of results in later stage or large scale clinical trials or trials in other
potential indications; risks associated with clinical trials, including our ability to adequately
manage clinical activities, unexpected concerns that may arise from additional data or
analysis obtained during clinical trials, regulatory authorities may require additional
information or further studies, or may fail to approve or may delay approval of our drug
candidates; the occurrence of adverse safety events, restrictions on use with our products,
or product liability claims; our dependence on collaborators and other third parties for the
development, regulatory approval, and commercialization of products and other aspects of
our business, which are outside of our control; risks associated with current and potential
future healthcare reforms; failure to comply with legal and regulatory requirements; the
risks of doing business internationally, including currency exchange rate fluctuations; risks
relating to management and key personnel changes, including attracting and retaining key
personnel; risks relating to investment in and expansion of manufacturing capacity for
future clinical and commercial requirements; problems with our manufacturing processes;
risks related to commercialization of biosimilars; fluctuations in our effective tax rate; risks
related to investment in properties; the market, interest, and credit risks associated with our
portfolio of marketable securities; risks relating to stock repurchase programs; risks relating
to access to capital and credit markets; risks related to indebtedness; environmental risks;
risks relating to the sale and distribution by third parties of counterfeit or unfit versions of
our products; risks relating to the use of social media for our business; change in control
10
provisions in certain of our collaboration agreements; risks relating to the spin-off of our
hemophilia business, including exposure to claims and liabilities; and the other risks and
uncertainties that are described in the Risk Factors section of our most recent annual or
quarterly report and in other reports we have filed with the Securities and Exchange
Commission.
These statements are based on our current beliefs and expectations and speak only as of the
date of this news release. We do not undertake any obligation to publicly update any
forward-looking statements.
Biogen Media Contact: Biogen Investor Contact:
David Caouette Matt Calistri
Biogen Inc. Biogen Inc.
Tel: (781) 464-3260 Tel: (781) 464-2442
###

TABLE 1
BIOGEN INC. AND SUBSIDIARIES
CONDENSED CONSOLIDATED STATEMENT OF INCOME
(unaudited, in millions, except per share amounts)
For the Three Months
Ended December 31, For the Twelve Months
Ended December 31,
2018 2017 2018 2017 (1)
Revenues:
Product, net $ 2,825.7 $ 2,712.4 $ 10,886.8 $ 10,354.7
Revenues from anti-CD20 therapeutic programs 534.9 415.0 1,980.2 1,559.2
Other 165.7 179.6 585.9 360.0
Total revenues 3,526.3 3,307.0 13,452.9 12,273.9
Cost and expenses:
Cost of sales, excluding amortization of acquired
intangible assets 488.5
509.2
1,816.3
1,630.0
Research and development 611.6 587.6 2,597.2 2,253.6
Selling, general and administrative 591.1 572.0 2,106.3 1,933.9
Amortization of acquired intangible assets 254.1 139.8 747.3 814.7
Collaboration profit (loss) sharing 55.8 29.8 185.0 112.3
Acquired in-process research and development — — 112.5 120.0
Restructuring charges 2.8 0.9 12.0 0.9
(Gain) loss on fair value remeasurement of contingent
consideration 79.3
1.5
(12.3 ) 62.7
Total cost and expenses 2,083.2 1,840.8 7,564.3 6,928.1
Income from operations 1,443.1 1,466.2 5,888.6 5,345.8
Other income (expense), net (28.6 ) (66.4 ) 11.0 (217.0 )
Income before income tax expense and equity in loss of
investee, net of tax 1,414.5
1,399.8
5,899.6
5,128.8
Income tax expense 469.6 1,566.1 1,425.6 2,458.7
Equity in loss of investee, net of tax — — — —
Net income 944.9 (166.3 ) 4,474.0 2,670.1
Net income (loss) attributable to noncontrolling
interests, net of tax (1.9 ) 131.1
43.3
131.0
Net income attributable to Biogen Inc. $ 946.8 $ (297.4 ) $ 4,430.7 $ 2,539.1
Net income per share:
Basic earnings per share attributable to Biogen Inc. $ 4.74 $ (1.41 ) $ 21.63 $ 11.94
Diluted earnings per share attributable to Biogen Inc. $ 4.73
$ (1.40 ) $ 21.58
$ 11.92
Weighted-average shares used in calculating:
Basic earnings per share attributable to Biogen Inc. 199.8 211.5 204.9 212.6
Diluted earnings per share attributable to Biogen Inc. 200.3
212.0
205.3
213.0
(1) On February 1, 2017, we completed the spin-off of our hemophilia business. Our consolidated results of operations reflect the financial results of our
hemophilia business through January 31, 2017.

TABLE 2
BIOGEN INC. AND SUBSIDIARIES
CONDENSED CONSOLIDATED BALANCE SHEETS
(unaudited, in millions)
As of December 31,
2018 As of December 31,
2017
ASSETS
Cash, cash equivalents and marketable securities $ 3,538.0 $ 3,689.0
Accounts receivable, net 1,958.5 1,787.0
Inventory 929.9 902.7
Other current assets 1,214.5 1,494.6
Total current assets 7,640.9 7,873.3
Marketable securities 1,375.9 3,057.3
Property, plant and equipment, net 3,601.2 3,182.4
Intangible assets, net 3,120.0 3,879.6
Goodwill 5,706.4 4,632.5
Investments and other assets 3,844.5 1,027.5
TOTAL ASSETS $ 25,288.9 $ 23,652.6
LIABILITIES AND EQUITY
Current liabilities $ 3,295.2 $ 3,368.2
Notes payable 5,936.5 5,935.0
Other long-term liabilities 3,025.6 1,751.3
Equity 13,031.6 12,598.1
TOTAL LIABILITIES AND EQUITY $ 25,288.9 $ 23,652.6

TABLE 3
BIOGEN INC. AND SUBSIDIARIES
GAAP TO NON-GAAP RECONCILIATION:
NET INCOME ATTRIBUTABLE TO BIOGEN INC. AND DILUTED EARNINGS PER SHARE
(unaudited, in millions, except per share amounts)
An itemized reconciliation between diluted earnings per share on a GAAP and Non-GAAP basis is as follows:
For the Three Months Ended
December 31, 2018 September 30, 2018 December 31, 2017
GAAP earnings per share - Diluted $ 4.73 $ 7.15 $ (1.40 )
Adjustments to GAAP net income attributable to Biogen Inc.
(as detailed below) 2.26
0.25 6.66
Non-GAAP earnings per share - Diluted $ 6.99 $ 7.40 $ 5.26
For the Twelve Months Ended
December 31, 2018 December 31, 2017
GAAP earnings per share - Diluted $ 21.58 $ 11.92
Adjustments to GAAP net income attributable to Biogen Inc. (as detailed below) 4.62 9.89
Non-GAAP earnings per share - Diluted $ 26.20 $ 21.81
An itemized reconciliation between net income attributable to Biogen Inc. on a GAAP and Non-GAAP basis is as follows:
For the Three Months Ended
December 31, 2018 September 30, 2018 December 31, 2017
GAAP net income attributable to Biogen Inc. $ 946.8 $ 1,444.4 $ (297.4 )
Adjustments:
Amortization of acquired intangible assets A, B 254.1 281.9 139.8
Acquired in-process research and development — 27.5 —
Research and development C 10.0 — —
(Gain) loss on fair value remeasurement of contingent
consideration D 79.3
(87.9 ) 1.5
(Gain) loss on equity security investments 12.2 (141.2 ) —
Net distribution to noncontrolling interests E (1.6 ) (1.5 ) 132.4
Restructuring, business transformation and other cost
saving initiatives:
2017 corporate strategy implementation F — 3.1 18.5
Restructuring charges F 2.8 6.0 0.9
Income tax effect related to reconciling items (49.8 ) (19.3 ) (53.2 )
Elimination of deferred tax asset G 10.6 — —
Tax reform H 135.8 (18.5 ) 1,173.6
Non-GAAP net income attributable to Biogen Inc. $ 1,400.2 $ 1,494.5 $ 1,116.1
For the Twelve Months Ended
December 31, 2018 December 31, 2017 (1)
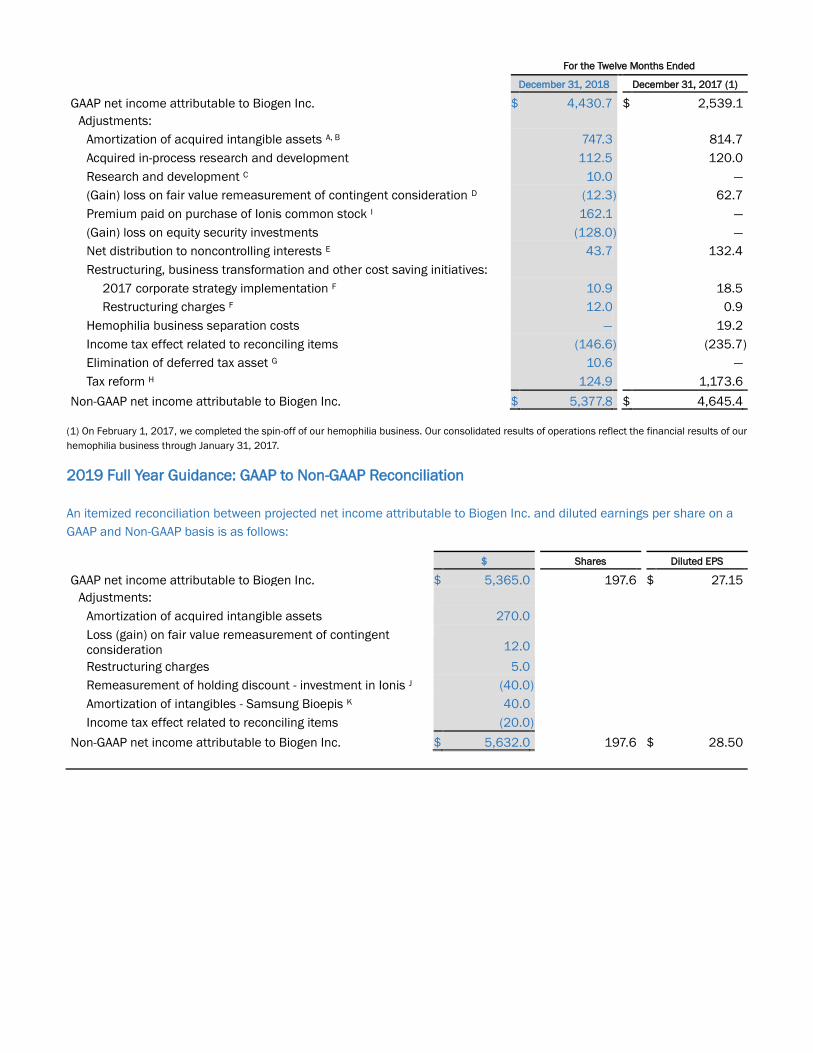
GAAP net income attributable to Biogen Inc. $ 4,430.7 $ 2,539.1
Adjustments:
Amortization of acquired intangible assets A, B 747.3 814.7
Acquired in-process research and development 112.5 120.0
Research and development C 10.0 —
(Gain) loss on fair value remeasurement of contingent consideration D (12.3 ) 62.7
Premium paid on purchase of Ionis common stock I 162.1 —
(Gain) loss on equity security investments (128.0 ) —
Net distribution to noncontrolling interests E 43.7 132.4
Restructuring, business transformation and other cost saving initiatives:
2017 corporate strategy implementation F 10.9 18.5
Restructuring charges F 12.0 0.9
Hemophilia business separation costs — 19.2
Income tax effect related to reconciling items (146.6 ) (235.7 )
Elimination of deferred tax asset G 10.6 —
Tax reform H 124.9 1,173.6
Non-GAAP net income attributable to Biogen Inc. $ 5,377.8 $ 4,645.4
(1) On February 1, 2017, we completed the spin-off of our hemophilia business. Our consolidated results of operations reflect the financial results of our
hemophilia business through January 31, 2017.
2019 Full Year Guidance: GAAP to Non-GAAP Reconciliation
An itemized reconciliation between projected net income attributable to Biogen Inc. and diluted earnings per share on a
GAAP and Non-GAAP basis is as follows:
$ Shares Diluted EPS
GAAP net income attributable to Biogen Inc. $ 5,365.0 197.6 $ 27.15
Adjustments:
Amortization of acquired intangible assets 270.0
Loss (gain) on fair value remeasurement of contingent
consideration 12.0
Restructuring charges 5.0
Remeasurement of holding discount - investment in Ionis J (40.0 )
Amortization of intangibles - Samsung Bioepis K 40.0
Income tax effect related to reconciling items (20.0 )
Non-GAAP net income attributable to Biogen Inc. $ 5,632.0 197.6 $ 28.50
Notes to GAAP to Non-GAAP Reconciliation
A In January 2017 we entered into a settlement and license agreement among Biogen Swiss Manufacturing GmbH, Biogen International
Holding Ltd., Forward Pharma A/S (Forward Pharma) and certain related parties, which was effective February 1, 2017. Pursuant to this
agreement, we obtained U.S. and rest of world licenses to Forward Pharma’s intellectual property, including Forward Pharma’s
intellectual property related to TECFIDERA. In exchange, we paid Forward Pharma $1.25 billion in cash, of which $795.2 million was
recognized as an intangible asset in the first quarter of 2017.
We have two intellectual property disputes with Forward Pharma, one in the U.S. and one in the European Union, concerning
intellectual property related to TECFIDERA.
In March 2017 the U.S. intellectual property dispute was decided in our favor. Forward Pharma appealed to the U.S. Court of Appeals
for the Federal Circuit. We evaluated the recoverability of the U.S. asset acquired from Forward Pharma and recorded a $328.2 million
impairment charge in the first quarter of 2017 to adjust the carrying value of the acquired U.S. asset to fair value reflecting the impact
of the developments in the U.S. legal dispute and continued to amortize the remaining net book value of the U.S. intangible asset in our
consolidated statements of income utilizing an economic consumption model. The U.S. Court of Appeals for the Federal Circuit upheld
the U.S. Patent and Trademark Office's March 2017 ruling and in January 2019 denied Forward Pharma's petition for rehearing. We
evaluated the recoverability of the U.S. asset based upon these most recent developments and recorded a $176.8 million impairment
charge in the fourth quarter of 2018 to reduce the remaining net book value of the U.S. asset to zero.
In March 2018 the European Patent Office (EPO) revoked Forward Pharma’s European Patent No. 2 801 355. Forward Pharma has
filed an appeal to the Technical Board of Appeal of the EPO and the appeal is pending. Based upon our assessment of this ruling, we
continue to amortize the remaining net book value of the rest of world intangible asset in our consolidated statements of income
utilizing an economic consumption model.
Amortization of acquired intangible assets for the three and twelve months ended December 31, 2017, also includes a $31.2 million
pre-tax impairment charge related to our acquired and in-licensed rights and patents intangible asset associated with ZINBRYTA after
the initiation of an European Medicines Agency review (referred to as an Article 20 Procedure) of ZINBRYTA following the report of a
case of fatal fulminant liver failure, as well as four cases of serious liver injury.
B Amortization of acquired intangible assets for the three months ended September 30, 2018, and the twelve months ended December
31, 2018, includes the impact of impairment charges totaling $189.3 million related to certain in-process research and development
(IPR&D) assets associated with our vixotrigine (BIIB074) program.
During the third quarter of 2018 we completed a Phase 2b study of vixotrigine for the treatment of painful lumbosacral radiculopathy
(PLSR). The study did not meet its primary or secondary efficacy endpoints; therefore, we discontinued development of vixotrigine for
the treatment of PLSR and we recognized an impairment charge of approximately $60.0 million during the third quarter of 2018 to
reduce the fair value of the related IPR&D intangible asset to zero. In addition, we delayed the initiation of the Phase 3 studies of
vixotrigine for the treatment of trigeminal neuralgia (TGN) as we awaited the outcome of ongoing interactions with the U.S. Food and
Drug Administration (FDA) regarding the design of the Phase 3 studies, a more detailed review of the data from the Phase 2b study of
vixotrigine for the treatment of PLSR and insights from the Phase 2 study of vixotrigine for the treatment of small fiber neuropathy
(SFN). We reassessed the fair value of our vixotrigine program for the treatment of TGN using reduced expected lifetime revenues,
higher expected clinical development costs and a lower cumulative probability of success and, as a result of that assessment, we
recognized an impairment charge of $129.3 million during the third quarter of 2018 to reduce the fair value of the IPR&D intangible
asset associated with our vixotrigine program for the treatment of TGN to $41.8 million.
C GAAP research and development expense for the three and twelve months ended December 31, 2018, include a $10.0 million
contingent consideration payment accrued in relation to the acquisition of an asset.
D During the third quarter 2018, we adjusted the fair value of our contingent consideration obligations related to our vixotrigine
program for the treatment of TGN to reflect the lower cumulative probabilities of success, which resulted in a gain of $89.6 million.
In late December 2018 we received feedback from the FDA regarding the design of the Phase 3 studies of vixotrigine for the treatment
of TGN. Following this feedback, we are now planning to initiate the Phase 3 studies for our vixotrigine program for the treatment of
TGN and, as a result, we adjusted the fair value of our contingent consideration obligations related to our vixotrigine program for the
treatment of TGN to reflect the increased probabilities of success and recognized a loss of $80.6 million in the fourth quarter of 2018.
E In October 2017 we amended the terms of our collaboration and license agreement with Neurimmune SubOne AG (Neurimmune).
Under the amended agreement, we made a $150.0 million payment to Neurimmune in exchange for a 15% reduction in the previously
negotiated royalty rates payable on products developed under this agreement, including royalties payable on potential commercial
sales of aducanumab, our anti-amyloid beta antibody candidate for the treatment of Alzheimer's disease. In May 2018 we made an
additional $50.0 million payment to Neurimmune to further reduce the previously negotiated royalty rates payable on products
developed under this agreement, including royalties payable on potential commercial sales of aducanumab, by an additional 5%.
Net distribution to noncontrolling interest for the twelve months ended December 31, 2018, reflects the $50.0 million payment made
to Neurimmune, net of Neurimmune’s tax, in May 2018.
Net distribution to noncontrolling interest for the three and twelve months ended December 31, 2017, reflects the $150.0 million
payment made to Neurimmune, net of Neurimmune’s tax, in October 2017.
F 2017 corporate strategy implementation and restructuring charges are related to our efforts to create a leaner and simpler operating
model.
G Elimination of deferred tax asset due to Samsung Bioepis Co., Ltd. (Samsung Bioepis) qualifying as a corporate joint venture for
accounting purposes.
H The Tax Cuts and Jobs Act of 2017 (2017 Tax Act) resulted in significant changes to the U.S. corporate income tax system. These
changes include a federal statutory rate reduction from 35% to 21%, the elimination or reduction of certain domestic deductions and
credits and limitations on the deductibility of interest expense and executive compensation. The 2017 Tax Act also transitions
international taxation from a worldwide system to a modified territorial system and includes base erosion prevention measures on non-
U.S. earnings, which has the effect of subjecting certain earnings of our foreign subsidiaries to U.S. taxation as global intangible low-
taxed income (GILTI). During the fourth quarter of 2018 we elected to recognize deferred taxes for the basis differences expected to
reverse as GILTI is incurred and have established initial deferred tax balances, as of the enactment date of the 2017 Tax Act.
During the fourth quarter of 2017 we recognized within our provision for income taxes a $1.2 billion provisional estimate pursuant to
the U.S. Securities and Exchange Commission Staff Accounting Bulletin No. 118. Our provisional estimate included an amount of
$989.6 million associated with a one-time mandatory deemed repatriation tax on accumulated foreign subsidiaries' previously untaxed
foreign earnings (the Transition Toll Tax) and $184.0 million related to the impact of remeasuring our deferred tax balances to reflect
the new federal statutory rate and other changes to U.S. tax law.
Tax reform amounts for the three months ended September 30, 2018, reflects the effect of a net reduction of $34.6 million to our
2017 preliminary Transition Toll Tax estimate, an expense of $5.1 million for the remeasurement of our deferred tax balances and an
$11.0 million expense to reflect other aspects of the 2017 Tax Act.
Tax reform amounts for the three and twelve months ended December 31, 2018, reflects the effect of an expense of $135.8 million
related to the establishment of GILTI deferred taxes.
Tax reform amounts for the twelve months ended December 31, 2018, also reflects the effect of a net reduction of $34.6 million to our
2017 preliminary Transition Toll Tax estimate, an expense of $12.7 million for the remeasurement of our deferred tax balances and an
$11.0 million expense to reflect other aspects of the 2017 Tax Act.
The final determination of the Transition Toll Tax and remeasurement of our deferred assets and liabilities was completed in the fourth
quarter of 2018.
I In June 2018 we closed a new ten-year exclusive agreement with Ionis Pharmaceuticals, Inc. (Ionis) to develop novel antisense
oligonucleotide drug candidates for a broad range of neurological diseases for a total payment of $1.0 billion consisting of an upfront
payment of $375.0 million and the purchase of approximately 11.5 million shares of Ionis' common stock at a cost of $625.0 million.
The 11.5 million shares of Ionis' common stock were purchased at a premium to their fair value at the transaction closing date. The
premium consisted of acquiring the shares at a price above the fair value based on the trailing 10-day weighted-average close price
prior to entering into the agreement in April 2018 and the effect of certain holding period restrictions. We recorded an asset of $462.9
million in investments and other assets in our consolidated balance sheets reflecting the fair value of the common stock as of the
purchase date and a charge of $162.1 million to research and development expense in our consolidated statements of income during
the second quarter of 2018 reflecting the premium paid for the common stock.
J Our investment in Ionis' common stock, which is subject to certain holding period restrictions, is remeasured each reporting period
and carried at fair value. The effects of the holding period restrictions are estimated using an option pricing valuation model.
K Amortization of intangibles - Samsung Bioepis represents the amortization of the difference reflecting the application of equity
method accounting.

Use of Non-GAAP Financial Measures
We supplement our consolidated financial statements presented on a GAAP basis by providing additional measures which
may be considered “Non-GAAP” financial measures under applicable SEC rules. We believe that the disclosure of these
Non-GAAP financial measures provides additional insight into the ongoing economics of our business and reflects how we
manage our business internally, set operational goals and form the basis of our management incentive programs. These
Non-GAAP financial measures are not in accordance with generally accepted accounting principles in the United States
and should not be viewed in isolation or as a substitute for reported, or GAAP, net income attributable to Biogen Inc. and
diluted earnings per share.
Our “Non-GAAP net income attributable to Biogen Inc.” and “Non-GAAP earnings per share - Diluted” financial measures
exclude the following items from “GAAP net income attributable to Biogen Inc.” and “GAAP earnings per share - Diluted”:
1. Purchase accounting, merger-related and other adjustments
We exclude certain purchase accounting related items associated with the acquisition of businesses, assets and amounts
in relation to the consolidation or deconsolidation of variable interest entities for which we are the primary beneficiary.
These adjustments include, but are not limited to, charges for in-process research and development and certain
milestones, the amortization of intangible assets and charges or credits from the fair value remeasurement of our
contingent consideration obligations.
2. Hemophilia business separation costs
We have excluded costs that are directly associated with the set up and spin-off of our hemophilia business on February
1, 2017. These costs represent incremental third-party costs attributable solely to the hemophilia spin-off and set up
activities.
3. Restructuring, business transformation and other cost saving initiatives
We exclude costs associated with our execution of certain strategies and initiatives to streamline operations, achieve
targeted cost reductions, rationalize manufacturing facilities or refocus R&D activities. These costs may include employee
separation costs, retention bonuses, facility closing and exit costs, asset impairment charges or additional depreciation
when the expected useful life of certain assets have been shortened due to changes in anticipated usage and other costs
or credits that management believes do not have a direct correlation to our ongoing or future business operations.
4. (Gain) loss on equity security investments
Effective January 2018 we exclude unrealized and realized gains and losses and discounts or premiums on our equity
security investments as we do not believe that these components of income or expense have a direct correlation to our
ongoing or future business operations.
5. Other items
We evaluate other items of income and expense on an individual basis and consider both the quantitative and qualitative
aspects of the item, including (i) its size and nature, (ii) whether or not it relates to our ongoing business operations and
(iii) whether or not we expect it to occur as part of our normal business on a regular basis. We also include an adjustment
to reflect the related tax effect of all reconciling items within our reconciliation of our GAAP to Non-GAAP net income
attributable to Biogen Inc. and diluted earnings per share.

TABLE 4
BIOGEN INC. AND SUBSIDIARIES
PRODUCT REVENUES
(unaudited, in millions)
For the Three Months Ended
December 31, 2018 September 30, 2018 December 31, 2017
United
States Rest of
World Total United
States Rest of
World Total United
States Rest of
World Total
Multiple Sclerosis (MS): TECFIDERA $ 856.3 $ 254.1 $ 1,110.4 $ 842.1 $ 247.9 $ 1,090.0 $ 831.6 $ 244.0 $ 1,075.6
Interferon* 430.9 166.3 597.2 421.5 168.6 590.1 449.3 195.6 644.9
TYSABRI 256.8 207.6 464.4 253.0 217.2 470.2 252.1 210.6 462.7
FAMPYRA — 22.7 22.7 — 22.5 22.5 — 24.2 24.2
ZINBRYTA — — — — — — — 11.7 11.7
Spinal Muscular Atrophy: SPINRAZA 236.2 233.7 469.9 223.9 243.8 467.7 218.2 144.3 362.5
Other Product Revenues: FUMADERM — 5.0 5.0 — 4.8 4.8 — 8.9 8.9
BENEPALI — 125.3 125.3 — 123.4 123.4 — 117.6 117.6
FLIXABI — 14.1 14.1 — 11.4 11.4 — 4.3 4.3
IMRALDI — 16.7 16.7 — — — — — —
Total product revenues $ 1,780.2 $ 1,045.5 $ 2,825.7 $ 1,740.5 $ 1,039.6 $ 2,780.1 $ 1,751.2 $ 961.2 $ 2,712.4
For the Twelve Months Ended
December 31, 2018 December 31, 2017 (1)
United
States Rest of
World Total United
States Rest of
World Total
Multiple Sclerosis (MS): TECFIDERA $ 3,253.2 $ 1,020.9 $ 4,274.1 $ 3,294.0 $ 920.0 $ 4,214.0
Interferon* 1,668.3 694.7 2,363.0 1,889.1 756.7 2,645.8
TYSABRI 1,025.0 839.0 1,864.0 1,113.8 859.3 1,973.1
FAMPYRA — 92.7 92.7 — 91.6 91.6
ZINBRYTA — 1.4 1.4 — 52.7 52.7
Spinal Muscular Atrophy: SPINRAZA 854.0 870.2 1,724.2 657.0 226.7 883.7
Hemophilia: ELOCTATE — — — 42.2 6.2 48.4
ALPROLIX — — — 21.0 5.0 26.0
Other Product Revenues: FUMADERM — 22.3 22.3 — 39.6 39.6
BENEPALI — 485.2 485.2 — 370.8 370.8
FLIXABI — 43.2 43.2 — 9.0 9.0
IMRALDI — 16.7 16.7 — — —
Total product revenues $ 6,800.5 $ 4,086.3 $ 10,886.8 $ 7,017.1 $ 3,337.6 $ 10,354.7
* Interferon includes AVONEX and PLEGRIDY
(1) On February 1, 2017, we completed the spin-off of our hemophilia business. Our consolidated results of operations reflect the financial results of our
hemophilia business through January 31, 2017.