Embed Size (px)
Citation preview
“Dynamic Development” abstract painting by Osnat Tzadok
Biogas Production System as an “Upcycler” Exergy Analysis and Economic Evaluation Master of Science Thesis
AMIN PARSAPOUR Department of Management and Engineering (IEI) Division of Environmental Technology and Management Linköping University Linköping, Sweden, 2012 Report No. LIU-IEI-TEK-A--12/01476--SE
Biogas Production System as an “Upcycler” Exergy Analysis and Economic Evaluation
AMIN PARSAPOUR
Supervisor: Michael Martin Examiner: Niclas Svensson
Department of Management and Engineering (IEI) Division of Environmental Technology and Management
Linköping University Linköping, Sweden, 2012
LIU-IEI-TEK-A--12/01476--SE

Bertrand Russell: “Whenever there is a great deal of energy in one region and very little in a neighboring
region, energy tends to travel from the one region to the other, until equality is established.
This whole process may be described as a tendency towards democracy” (Rifkin, 1980).
i
Abstract
Sustainable development is a growing concern for inhabitants of the planet earth. Consumption of fossil sources keeps up the depletion of nature’s capital and causes environmental impacts. One solution to have a sustainable society is to reduce the dependency on fossil fuels and substitute them by renewable energy sources. Among different types of renewable energy, biofuels have great potential for development and improvement. Though, the production of biofuels is criticized by many experts from the energy efficiency, environmental and economical points of view.
Biogas as one type of first generation biofuels is achieved from the wastes and by-products of other industries, and can be used as a transportation fuel in the form of biomethane. The use of by-products may give added value as inputs to the biogas production process, a process which may be called “upcycling.” The aim of upcycling is to convert wastes into new materials with higher quality or higher environmental value in order to reduce the consumption of raw materials which results in decreasing of energy usage and environmental impacts
The aim of this thesis is to study the possibility of a biogas plant to act as an upcycler of wastes and by-products through anaerobic digestion process by the use of exergy analysis and economic evaluation. An imaginary biogas plant which uses a major by-product of brewing industry, i.e. Brewer’s Spent Grain (BSG), is considered to quantify the added value by biogas production process.
The results of the exergy analysis show that the exergy of the input BSG (78,320 MJ) is upgraded into two main products as biomethane (47,430 MJ) and biofertilizer (37,026 MJ) with a total exergy amount of 84,456 MJ.
On the other hand, the economic analysis of the studied biogas production process indicates that the biogas plant has the added value for the input material. In the economic analysis, the annual costs and benefits of the biogas production is calculated. The results show that the production of biomethane and biofertilizer from the by-product of brewing industry is profitable. However, the price of input BSG and also the variation price of the biofertilizer in different seasons, have great impact on the economy of a biogas plant.
The outcomes from exergy and economic analysis are indicated that the biogas production process is an “upcycling” process which has the added value for the inputs, from both economic and quality points of view. The exergy and economic evaluation may be used as indicators of the sustainable development, but only increasing the exergy and the economic value of a production process alone should not be considered as the sustainability of a system.
ii
Table of Contents
Abstract --------------------------------------------------------------------------------------------------------------------------------------- i
Table of Contents ------------------------------------------------------------------------------------------------------------------------- ii
List of Figures ------------------------------------------------------------------------------------------------------------------------------ v
List of Tables ------------------------------------------------------------------------------------------------------------------------------- v
Units ----------------------------------------------------------------------------------------------------------------------------------------- vi
Abbreviations ----------------------------------------------------------------------------------------------------------------------------- vi
Glossary of Terms ----------------------------------------------------------------------------------------------------------------------- vii
Chapter 1. Introduction to the Study ------------------------------------------------------------------------------------------------ 1
1.1 Introduction --------------------------------------------------------------------------------------------------------------------- 1
1.2 Aim --------------------------------------------------------------------------------------------------------------------------------- 1
1.3 Biogas Production System as an “Upcycler” ---------------------------------------------------------------------------- 2
1.4 Why Biogas? --------------------------------------------------------------------------------------------------------------------- 3
1.5 Biogas Production Process --------------------------------------------------------------------------------------------------- 4
1.6 By-product of Brewing Industry: Brewer’s Spent Grain (BSG) ----------------------------------------------------- 4
1.7 Limitations ----------------------------------------------------------------------------------------------------------------------- 6
1.8 Structure of the Report ------------------------------------------------------------------------------------------------------- 6
Chapter 2. Theoretical Backgrounds to the Study ------------------------------------------------------------------------------- 8
2.1 Industrial Ecology and Industrial Metabolism-------------------------------------------------------------------------- 8
2.2 Drawbacks of Industrial Ecology ------------------------------------------------------------------------------------------- 8
2.3 Thermodynamics Background ---------------------------------------------------------------------------------------------- 9
2.4 Exergy and Entropy ---------------------------------------------------------------------------------------------------------- 11
2.4.1 Definition of Exergy ---------------------------------------------------------------------------------------------------------- 11
2.4.2 Definition of Entropy --------------------------------------------------------------------------------------------------------- 12
2.5 Exergy/Entropy and Sustainability -------------------------------------------------------------------------------------- 13
2.6 Introduction to Exergy Analysis ------------------------------------------------------------------------------------------ 15

iii
2.7 Eco-Thermodynamics ------------------------------------------------------------------------------------------------------- 17
2.7.1 Physical and Economic System -------------------------------------------------------------------------------------------- 17
Chapter 3. Case Study ----------------------------------------------------------------------------------------------------------------- 20
3.1 Introduction ------------------------------------------------------------------------------------------------------------------- 20
3.2 System Boundaries ---------------------------------------------------------------------------------------------------------- 20
3.3 Methodology ------------------------------------------------------------------------------------------------------------------ 22
3.3.1 Exergy Analysis Methodology --------------------------------------------------------------------------------------------- 22
3.3.2 Economic Analysis Methodology ----------------------------------------------------------------------------------------- 23
3.4 Assumptions ------------------------------------------------------------------------------------------------------------------- 23
3.5 Input-Output Data for the BIOLIU Plant ------------------------------------------------------------------------------- 24
Chapter 4. Exergy Analysis ----------------------------------------------------------------------------------------------------------- 26
4.1 Input Raw Material (BSG) -------------------------------------------------------------------------------------------------- 26
4.2 Input Utilities ------------------------------------------------------------------------------------------------------------------ 27
4.2.1 Electricity ----------------------------------------------------------------------------------------------------------------------- 28
4.2.2 Heat ------------------------------------------------------------------------------------------------------------------------------ 28
4.2.3 Water ---------------------------------------------------------------------------------------------------------------------------- 28
4.3 Outputs ------------------------------------------------------------------------------------------------------------------------- 29
4.3.1 Bio-Methane (CH4) ----------------------------------------------------------------------------------------------------------- 29
4.3.2 Bio-Fertilizers / Digestate --------------------------------------------------------------------------------------------------- 30
4.3.3 Carbon Dioxide (CO2) -------------------------------------------------------------------------------------------------------- 31
Chapter 5. Economic Evaluation ---------------------------------------------------------------------------------------------------- 32
5.1 Production Costs ------------------------------------------------------------------------------------------------------------- 32
5.1.1 Raw Material Cost (Substrate Cost) -------------------------------------------------------------------------------------- 32
5.1.2 Investment Costs (capital costs) ------------------------------------------------------------------------------------------ 33
5.1.3 Labor and Maintenance Costs --------------------------------------------------------------------------------------------- 33
5.1.4 Cost of Utilities ---------------------------------------------------------------------------------------------------------------- 34
5.2 Incomes from Biogas Plant (Benefits) ---------------------------------------------------------------------------------- 35
5.2.1 Biogas / Bio-Methane (CH4) ----------------------------------------------------------------------------------------------- 35
5.2.2 Bio-Fertilizer (Digestate) ---------------------------------------------------------------------------------------------------- 36
Chapter 6. Overall Results and Sensitivity Analysis --------------------------------------------------------------------------- 37
iv
6.1 Exergy Analysis Results ----------------------------------------------------------------------------------------------------- 37
6.2 Economic Analysis Results ------------------------------------------------------------------------------------------------- 38
6.3 Sensitivity Analysis ---------------------------------------------------------------------------------------------------------- 39
6.3.1 Sensitivity to BSG Price ------------------------------------------------------------------------------------------------------ 39
6.3.2 Sensitivity to Biofertilizer Pricing ----------------------------------------------------------------------------------------- 41
Chapter 7. Discussion ------------------------------------------------------------------------------------------------------------------ 43
7.1 Exergy Analysis --------------------------------------------------------------------------------------------------------------- 43
7.2 Economic Assessment ------------------------------------------------------------------------------------------------------ 44
7.3 Sustainability and Biogas Production from By-products ---------------------------------------------------------- 44
Chapter 8. Conclusion ----------------------------------------------------------------------------------------------------------------- 46
References -------------------------------------------------------------------------------------------------------------------------------- 47
v
List of Figures Figure 1. Schematic diagram of brewing process to obtain BSG from barley (Mussatto, 2006) -------- 5 Figure 2. Thermodynamic hourglass (inspired by Georgescu-Roegen, 1971) ------------------------------ 11 Figure 3. Relative of sustainability decreases with increasing of entropy (Hornbogen, 2003) --------- 14 Figure 4. Second law analysis of a real process (Dewulf et al., 2008) ---------------------------------------- 16 Figure 5. Hierarchy of physical and economic systems ----------------------------------------------------------- 18 Figure 6. The entropy hourglass (Eriksson and Andersson, 2010) --------------------------------------------- 19 Figure 7. System boundary of the biogas plant applied in exergy analysis ---------------------------------- 20 Figure 8. System boundary of the biogas plant applied in economic evaluation --------------------------- 21 Figure 9. Method on the exergy analysis ----------------------------------------------------------------------------- 22 Figure 10. Exergy flow diagram of BIOLIU biogas plant -------------------------------------------------------- 38 Figure 11. Cost-Benefit diagram (base scenario) ------------------------------------------------------------------ 39 Figure 12. Cost-Benefit diagram with 50% increase in BSG price -------------------------------------------- 40 Figure 13. Cost-Benefit diagram with 50% decrease in BSG price -------------------------------------------- 40 Figure 14. Cost-Benefit diagram of the biogas plant for three biofertilizer pricing scenarios ---------- 42
List of Tables Table 1. Energy versus exergy (Wall, 2010) ......................................................................................... 12 Table 2. Chemical exergy content of some fuels (Ayres et al., 2001) ................................................... 17 Table 3. Input-Output of BIOLIU biogas plant ..................................................................................... 25 Table 4. Chemical elements of BSG – Before Digestion ....................................................................... 27 Table 5. Typical composition of biogas (Karellas et al., 2010) ............................................................ 29 Table 6. Chemical elements of BSG – After Digestion ......................................................................... 30 Table 7. Total electricity consumption .................................................................................................. 34 Table 8. Produced methane and biogas ................................................................................................ 35 Table 9. Production cost, tax and VAT of petrol (2012) ....................................................................... 35 Table 10. NPK value after digestion ..................................................................................................... 36 Table 11. Exergy results of Input-Output of BIOLIU biogas plant ....................................................... 37 Table 12. Annual costs and benefits of BIOLIU biogas plant ............................................................... 38 Table 13. Biofertilizer price scenarios in spring and summer .............................................................. 41 Table 14. Income from biofertilizer in one year for three scenarios .................................................... 41

vi
Units Nm3 Normal cubic meter, volume of gas at atmospheric pressure (1,013 bars) and 0°C
kWh Kilowatt hour
MWh Megawatt hour (1 MWh = 1000 kWh)
GWh Gigawatt hour (1 GWh = 1000 MWh) TWh Terawatt hour (1 TWh = 1000 GWh)
Abbreviations AD Anaerobic Digestion BSG Brewer’s Spent Grain BTU British Thermal Unit CBA Cost Benefit Analysis DM Dry Matter EU European Union GHG Greenhouse Gas IE Industrial Ecology IM Industrial Metabolism IS Industrial Symbiosis NPK Fertilizer A fertilizer composed by %N, %P and %K SEK Swedish Krona
vii
Glossary of Terms
Biogas: a form of biofuel produced through anaerobic digestion of organic materials.
Biomethane (CH4): upgraded biogas which is cleaned from CO2 and other gases with about 96% purity.
Degradation: it is when the quality of the resources or products are removed in a consumptive process
Enthalpy: a chemical energy which is needed to balance the accounts in any process involving chemical reactions.
Exergy Loss: That part of exergy input which is not changed into useful exergy.
Industrial Metabolism (IM): the whole integrated collection of physical processes that convert raw materials and energy, plus labor, into finished products and wastes in a steady-state condition
Irreversibility: in most processes, the transition from an initial state to a final state cannot be fully undone. Irreversibility means that there is no process which starts from initial state and restores it completely.
Thermal efficiency: Amount of district heating generation divided by lower heating value in the waste
Throughput: The amount of energy or matter passing through a system from input to output

1
Chapter 1. Introduction to the Study
1.1 Introduction Due to the growing concern about climate change, it is apparent that one major part of the increasing environmental problems is connected to the use of fossil based energy sources in different industrial, transportation and residential sectors. Fossil fuel consumption has a twofold role; on the one hand it contributes to the rising of concentration of greenhouse gases (GHG) in the atmosphere and on the other hand it depletes the availability of such resources which results to steadily rising prices for fossil fuels such as oil and gas. One solution to have a sustainable society is to reduce the dependency on fossil fuels and substitute them by renewable energy sources such as biofuels, solar, wind or hydropower energy. Among those, biofuel production industries have great potential for development and improvement.
Generally, attempts to produce first generation biofuels are criticized among experts from the energy efficiency, environmental and economical points of view. One criticism is the poor energy efficiency of the production system because of the need of fossil based fuels to operate the process. Fossil fuel consumption in the production of biofuels generates greenhouse gases which will cause environmental impacts (Martin and Eklund, 2011). Another criticism is that the biofuels are not economically competitive compared to fossil fuels (Hill, 2006). In order to meet better environmental and economical outcomes, it is important to use energy and materials efficiently. Increasing efficiency, creating added value for input materials, and decreasing the use of natural resources can be achieved by expanding the system boundaries and applying a wider system view (Wolf, 2007). In the case of biofuel production, this will happen by using by-products and wastes from other industries.
In this regard, decreasing the amount of industrial wastes, enhancing availability of energy and financial benefits through creating value from by-products, can be accounted as indicators of sustainable development.
1.2 Aim This study intends to quantify the input and output flows of a biogas plant to find out how the biogas production system may potentially create “value” from by-products. The term “value” will perceive not only by its common definition in economy but also from the thermodynamics point of view, employing the second law of thermodynamics called “exergy”. In this case the by-product of the brewing industry, called Brewer’s Spent Grain (BSG), has been selected for the study.
The overall aim in this thesis work is divided into two main aims as follows:
The first aim is the exergy analysis of a biogas production system. This is done by looking at the input and output flows of materials and utilities in a biogas plant, in order to find out how the exergy of the substrate, a by-product of brewing process, i.e. BSG, modifies when it is used for biogas production. In this part, based on the second law of thermodynamics, the exergy variation of the biogas production process has been analysed. Furthermore, it has also
2
been investigated how these changes may contribute the system into sustainable development.
The second aim of this thesis project is the economic evaluation of the studied biogas production system, with the aim to examine whether it may create economic benefit by taking brewer’s spent grains (BSG), an organic by-product from brewing process, and converting them into biogas and other possible useful products.
Finally, this thesis tries to follow and combine the aforementioned to figure out how the studied biogas plant uses resources in a sustainable manner. This thesis tries to connect the physical flow perspective with economic analysis to study a biogas production system. From this view, exergy analysis and economic evaluation can address some dimensions of sustainable development.
In this regard, this thesis will try to answer following research questions:
RQ1. How could exergy analysis be applied in a biogas production system?
RQ2. What is the economic performance of a biogas production system?
RQ3. How can the use of exergy analysis and economic evaluation contribute to assess the sustainability of a production process?
In other words, this thesis tries to discover how a biogas production system may act as an “Upcycler” by looking into two concepts: exergy and economy of selected inputs and outputs of the production system. From this view, upcycling is going to be defined by both increasing the quality of the outputs and also by increasing the economic value of the output products.
1.3 Biogas Production System as an “Upcycler” From a very early age, humans learned to break apart problems, to fragment the world. Obviously, this enables to manage complex tasks and subjects more easily. But there is a hidden and extra cost when one can no longer see the consequences of the actions; the intrinsic sense of connection to a larger whole will lose. Then attempts are to reassemble the pieces in order to see the big picture. David Bohm1 says, the task is ineffective, which resembles putting together the fragments of a broken mirror to see the right reflection. The system thinking approach is the way to destroy the illusion that the world is created of separate and unrelated forces (Senge, 1990).
Industrial Ecology (IE) is a branch of system thinking which tries to view the industrial system not in isolation from its surrounding system, but in concert with them. IE is a system’s view that attempts to solve problems of industrial activities related to waste generation, resource depletion and pollution (Graedel and Allenby, 2003). Furthermore, industrial ecology has a subdivision called Industrial Symbiosis (IS) that can be defined in a collective approach to create competitive advantages involving physical exchanges of materials, energy, water and by-products. Further, the proximity of the input raw materials to the users will affect on transportation costs (Chertow, 2000; Wolf, 2007).
1 David Joseph Bohm, physicist, 1917-1992
3
The focus in this thesis is to analyze how a biogas production system creates value from organic wastes and by-products of other industries, by studying the economic performance and also by measuring the availability of energy through biogas production process in order to look into the sustainability of the system as a whole. Here, the availability of energy is defined as “exergy” that will be discussed more in details in this thesis work. In this study Brewer’s Spent Grain (BSG), a by-product from beer production will be studied as an input substrate into anaerobic digestion process in a biogas production system.
Biogas is produced by anaerobic digestion of organic matter. These organic materials can come from household organic wastes, agricultural wastes or industrial organic wastes. In other words, the anaerobic digestion process treats almost every kind of organic wastes to produce methane (CH4) as the main product of biogas production. Referring to the nature of biogas production activity, as they are units which take wastes and supposing to give more value to them, they can play the role of an “upcycler” in an industrial cluster. Biogas plant can attract industries with problems associated to the handling of their wastes (Martin, 2010). The difficulties of disposing of wastes can be converted to the opportunity of producing additional products instead of just incinerating and combusting them.
The aim of “upcycling” is to return wastes back to the material flows in the economy, and to convert them into new materials with higher quality or higher environmental value in order to reduce the consumption of raw materials which results in decreasing of energy usage and environmental impacts. In further sections, this thesis describes thoroughly what is meant of the higher quality value.
By contrast, ‘downcycling’ is the process transforming the materials into new ones with lesser environmental or quality value (McDonough and Braungart, 2002).
Industrial processes use natural resources as inputs to make products but they also generate wastes and emissions. In order to assess the sustainability of a production system, it needs to account the inputs to the system and outputs from it.
1.4 Why Biogas? According to the report by European Commission, the targets of EU for 2020, so called “20-20-20” targets (Europe 2020) in the Renewable Energy Directive (EC Directive, 2009), are that by the year 2020 greenhouse gas emissions should be decreased by 20 percent, energy efficiency should rise by 20 percent and the share of renewable energy sources should reach to 20 percent of total Europe’s final energy consumption. On the other hand, in 2005, government of Sweden announced that Sweden is going to be the first country to cut its dependency to fossil fuel resources and being an oil free society by 2020 (Commission on Oil Independence, 2006). Thus, in order to satisfy these mentioned targets, one solution is to reduce dependency on fossil fuels and replacing them by biofuels. Among different types of biofuels, biogas is a renewable source which can be one possible approach to meet EU targets towards sustainability. Biogas can be used for heating and electricity generation, as vehicle fuel or it can be injected to natural gas grid systems. If biogas is to be used as vehicle fuel or be added to natural gas grid, requirements necessitate that it be upgraded by removing undesirable gases such as CO2 and H2S, and thereafter compressed.
Reasons of increasing attention toward biogas production:
- Fossil fuels are non-renewable resources and have the problem of depletion
4
- To be independent from oil which can be because of the continually increasing the oil price
- Environmental problems due to increasing GHG emissions that will cause climate change and global warming
1.5 Biogas Production Process Biogas is a type of biofuel, also called as biomethane, which is a gaseous fuel produced from organic matter through the Anaerobic Digestion (AD) process. This process results in the biological breakdown of organic materials in the absence of oxygen. Biogas and digestate are two valuable products from anaerobic digestion process. Biogas is a useful source of renewable energy and digestate can be used as a valuable biofertilizer.
In certain cases, the substrate must be pre-treated before adding to the anaerobic digestion process. Water needs to add to dry matters.
Biogas can be produced from numerous different input substrates. Organic materials are major inputs for biogas production process. The organic materials used for biogas production should be free from wood (lignin), because of the inability of bacteria to process woody substances (Avfall Sverige, 2009)
There are several different types of organic materials which used for biogas production including agricultural, industrial and household wastes. In Sweden, typical raw materials for biogas production include (Martin, 2010):
- Manure - Food and fruit residues - Biomass - Dairy by-products - Sewage - Municipal, agricultural and industrial Wastes - Sludge - Alcohol - Glycerol - Fats
As mentioned earlier, this study is intended to consider the Brewers’ Spent Grain (BSG), the organic by-product of brewing process, as the input substrate into anaerobic digestion process for the production of purified biogas, called biomethane.
1.6 By-product of Brewing Industry: Brewer’s Spent Grain (BSG) Beer, after tea, carbonates, milk and coffee, is the fifth most consumed beverage in the world with around 1.34 billion hectoliters produced annually. In the production of beer, many different types of residues and by-products are generated.
For better understanding of beer production, Figure 1 is included to show a schematic view of brewing process. At the first step of brewing process, barley or other grains must be grinded, immersed in water and then boiled in order to extract the sugars and starches. Next, the rich sugary brew has to be moved to fermentation tank. The watery grains which are left behind often called spent grain or brewers’ spent grain (Mussatto et al., 2006).

5
BARLEY
Cleaning / Selection
Steeping
Germination
Drying
Sorting
BARLEY MALT
Mashing
Filtration
BREWERS’ SPENT GRAIN
Milling
Solid fraction
WortLiquid fraction
Water/heating
MaltingProcess
BrewingProcess
Figure 1. Schematic diagram of brewing process to obtain BSG from barley (Mussatto, 2006)
Spent grains are a by-product of the mashing process; one of the initial processes in brewing to solubilize the malt and cereal grains to ensure adequate extraction of the wort (water with extracted matter). Brewer’s spent grain (BSG) consists of 85% of total by-products of brewing process (Aliyu and Bala, 2011).
Stojceska (2008) has indicated that about 3.4 million tonnes of BSG from the brewing industry are generated in the EU every year (Stojceska et al., 2008). Also, Brazil as the fourth largest beer producer in the world (~ 8.5 billion liters/year) has generated about 1.7 million tonnes of BSG in 2002. Other large beer producers are: USA (23 billion), China (18 billion) and Germany (10.5 billion). According these figures, BSG can be a readily available low cost by-product for industrial uses (Mussatto et al., 2006; Aliyu and Bala, 2011). This thesis considers the BSG for the purpose of biogas production.
6
In this thesis it is assumed that the BSG comes from the brewing process of barley (barley alone or a mixture of barley and other cereal grains). Barley is the world’s most important cereal apart from wheat, maize and rice, and used mainly as animal feed or as the raw material for beer production (Sežun et al., 2010, 2011).
In the past, the BSG was used as feed for farm animals, but nowadays due to its slow degradability and toxic lignin degradation products, the interest to use it for biogas production has increased (Sežun et al., 2010).
Some potential applications of BSG are as follows (Mussatto et al., 2006):
1- Animal nutrition, mainly for cattle due to the high contents of protein and fiber 2- Human nutrition, for manufacturing of flakes, bread, biscuits, aperitif snacks 3- Energy production, through direct combustion or using in anaerobic fermentation to
produce biogas 4- Charcoal production 5- As a brick component for use in building materials
The chemical composition of BSG is dependent on the variety of barley, harvest time and mashing conditions (Forssell et al., 2008). To have information of the available chemical elements in BSG before and after digestion is a key to calculate its exergy.
1.7 Limitations This thesis examines the biogas plant as a so called “black-box”; which means the biogas plant under this study is going to be viewed in terms of only inputs and outputs. This thesis is not intended to enter into technical description and technical assessment of anaerobic digestion process of the biogas production, and this project does not consider the production process stages inside the biogas plant. It only looks at the biogas (biomethane) production system including upgrading of biogas into pure methane as a one stage process.
Sustainability is a broad concept with different dimensions which is difficult to define decently and objectively. In this work, the environmental aspects and social factors of sustainability will not be addressed and examined directly. However, the environmental sustainability will be assessed based on the results of exergy analysis.
Due to the unavailability of a real case study, data are extracted from different sources and in the case of lack of data; assumptions had to be made accordingly (described in proceeding text in Section 3.4). For example, in the case of exergy analysis, inaccessibility of an integrated exergy database is compensated by some assumptions which are extracted from different sources.
Most of the information related to biogas systems has been received from Swedish biogas industries, and related available data are based on the conditions in Sweden.
1.8 Structure of the Report This study is divided into eight chapters. Chapter 1 presents a brief introduction and background to the thesis project including its aims and research questions and also description of the biogas production process and the by-product of brewing industry. Chapter 2 continues the study research with the theoretical background to both ‘drawbacks of
7
industrial ecology’ and ‘the laws of thermodynamics’ by focusing on the concepts of exergy and entropy, and their applications to economy and sustainability. A large literature study covers these mentioned theoretical backgrounds in this second chapter to explain the concepts of exergy and entropy. Further, in Chapter 2, the literature review has been conducted for gathering related information for introduction, background and method of exergy analysis.
In order to start analyzing the biogas production system, firstly the system under study needs to be defined. This includes selecting the system boundary of the biogas plant to determine which inputs and outputs and which production stages are involved in this study. The system boundary and the analyzing methodology will be discussed more in details in third chapter where the case study is evaluated.
In this thesis, Chapter 4 and Chapter 5 are comprised of two main sections, i.e. exergy analysis and economic evaluation, to approach to the aims of the research in order to answer research questions. The overall results of both exergy analysis and economic evaluation and also the sensitivity analysis are presented in Chapter 6.
Finally, Chapter 7 discusses and sums up the results achieved from exergy analysis and economic evaluation to answer research questions, and also overall conclusion is drawn in Chapter 8.

8
Chapter 2. Theoretical Backgrounds to the Study
2.1 Industrial Ecology and Industrial Metabolism According to the definition of Industrial Ecology (IE) which was also presented in Section 1.3 of this thesis, the concept of IE is based on the system perspective view that tries to solve industrial activities problems related to the waste generation and resource depletion. In this system thinking, a by-product of one industry can be served as raw material for another industry. In connection with IE, the concept of metabolism has been used to describe the flows of materials through the socio-economical system. In biology, metabolism is a process in which organisms take energy-rich materials for their functions and growth. The process necessarily generates waste, consisting of degraded materials (Talens Peiró, 2009). Based on this definition, Industrial Metabolism (IM) is “the whole integrated collection of physical processes that convert raw materials and energy, plus labor, into finished products and wastes in a steady-state condition” (Ayres, 1989). The IM concept acts as a framework to study the flows of materials and energy in an industrial system. It uses the mass balance principles of inputs and outputs in production systems in accordance with the first law of thermodynamics.
In this thesis, the principles of energy and material balance are applied to quantify the inputs and outputs of a biogas system for production of biogas from Brewer’s Spent Grain (BSG) for the purpose of economic evaluation and exergy analysis of the process.
2.2 Drawbacks of Industrial Ecology Today, the world is confronted with the massive consumption of finite resources which are extracted and refined at high economical and environmental costs, and finally converted them into waste products which may be harmful to human and ecological health. In recent years, attempts to find solutions to decrease material consumption and consequently reduce environmental impacts, introduced a field of study called industrial ecology (IE). The goal of IE is to create a pattern in industrial ecosystem to have materials in a closed cycle similar to cyclical material use in natural ecosystem.
The concept of industrial ecology (IE) and its implementation are hampered by insufficient definitions of consumption and recycling. The definition of consumption must be separated and defined into two independent quantifiable phenomena as ‘throughput’ and ‘degradation’. Throughput defines the amount of flow rate of materials passing through a consumptive process (Connelly and Koshland, 1997). Most of IE studies have only addressed this aspect of consumption considering energy and material flow analysis through industrial networks (Connelly and Koshland, 1997; Karlsson and Wolf, 2008; Wolf and Karlsson, 2008). In the theory of industrial ecology, the idea of using by-product of one industrial process as the raw material for another process can positively reduce dispersion of material throughput, but this definition has ignored the concept of “entropy cycling” (O’Rourke et al., 1996). The conception of entropy will be discussed in this chapter in the section of thermodynamics background.
From another point of view and in order to have a complete definition of consumption, the quality of the resource which removed in a consumptive process needs to be considered; this
9
is called resource degradation (Connelly and Koshland, 1997). Unlike material throughput which could be measured on a mass flow basis, degradation measurement has no direct meaningful and coherent definition. As far as materials and resources present different functions with wide variety of purposes, it is not possible to develop an invariant measure of degradation to define usefulness lost to resource consumption. Loss of economic value, for example, is an insufficient measure because both physical property and the scarcity of materials determine its value, and due to the growth of knowledge among business directors, the profitability alone would not be adequate as a measure of success. To reach to a uniform measure of quality only based on physical properties of materials, it is necessary to employ the second law of thermodynamics by using thermodynamic properties named exergy and entropy. Degradation indicates the increase of entropy, or the amount of exergy (usefulness) loss (Connelly and Koshland, 1997). These two different definitions of ‘throughput’ and ‘degradation’ are representing the first law and second law of thermodynamics, respectively.
Furthermore, in the IE literature, the generic term re-use can be defined in three different subdivided categories: Cascading, Recirculation and Upgrading. Cascading is to convert the consumed material to a lower quality; and recirculation is the use of non-consumed material in a process again. Upgrading is to return the consumed material to the higher quality than pre-consumed state or converting it completely into its pre-consumed condition (Connelly and Koshland, 1997). In this study, upgrading category is in the centre of analysis and discussion, to know how the anaerobic digestion process in biogas plant acts as an “upcycler” to change the quality of brewing by-product into other valuable products.
The three mentioned material cycling definitions could be explained by an exergy based definition which shows the differences among three re-use categories. In the re-use cascading category, materials cascade from low exergy (high entropy) waste stream to a lower exergy (higher entropy) feedstock elsewhere in the economy. Cascading does not return the waste to the quality and economy of its pre-consumed state, which means that its exergy was lost from the material. Materials in recirculation can be used one or more times in the same process without any significant degradation in every using step. So, exergy was not lost in recirculation and no exergy needs to bring back material to pre-consumed condition. Material cycling decreases the need for new raw material and it can be attained by returning wastes to the higher exergy (lower entropy) condition.
In order to distinguish the various aforesaid re-use categories, it is required to consider the change of mass flow and quality. Connelly and Koshland (1997) have introduced an exergy based definition called Cycling of Material Exergy (CME) to measure the fraction of exergy transferred (or lost) during consumption that is returned to the material (Connelly and Koshland, 1997).
2.3 Thermodynamics Background Thermodynamics is the physical science of the conversion of energy and matter (Lems et al., 2004). The most important facts of thermodynamics are summarized based on the principles and laws of thermodynamics which are fundamental to all actions and reactions and everything that changes or happens in the world. Two major laws of thermodynamics which are called the first law and second law of thermodynamics are defined as follows:

10
First Law2, so called the ‘law of conservation of mass/energy’: energy and matter can neither be created nor destroyed, but can only be converted from one form into another (Ayres, 1998; Lems et al., 2004).
Second Law, so called as ‘entropy law’: energy has quality as well as quantity, and actual processes happen in the direction of decreasing quality of energy (Cengel and Boles, 2006), that means what changes in energy is its quality, i.e. exergy, not its quantity.
There are several interpretations of the second law of thermodynamics presented in following bullet points: (“Institute of Human Thermodynamics,” 2012)
“Heat cannot of itself pass from a colder to a hotter body” (Clausius, 1879) “The entropy of the universe tends to increase” (Bent, 1965) “No isolated system can be returned to its original state when a natural cyclic process
takes place in the system” (Battino and Wood, 1968) “Energy tends to disperse” (Atkins, 1984) “All natural processes are irreversible and unidirectional” (Haynie, 2001) “When energy does work, its quality, its exergy, diminishes” (Kay, 2002) “It is impossible by a cyclic process to convert the heat absorbed by a system
completely into work done by the system” (Smith et al., 2005)
The first law of thermodynamics implicates that matter and energy are conserved in every process, neither can they be created nor destroyed. The outcomes of the first law to physical systems are that the total energy and material content of an isolated system is fixed. However, the first law of thermodynamics fails to describe irreversibility; it may never be possible to recover the original inputs from the outputs. Thus, as the first law indicates, while the quantity of energy and material is conserved, but the quality (exergy) or availability could not. The degree of irreversibility in processes is defined by the second law of thermodynamics. The second law of thermodynamics, known as ‘entropy law’, discusses the limitations of the reverse direction in processes. Work, for example, can be converted into heat with 100% efficiency, but there are limits to completely converting heat into work (McMahon and Mrozek, 1997).
2 The first statement by Rudolf Clausius in 1850.

11
The laws of thermodynamics can be easily exposed by a clear image borrowed from Georgescu-Roegen (1971). As it is shown in Figure 2, consider an hourglass; it is a closed and isolated system in that no sand enters and none exits. The total amount of sand inside the glass is constant, sand neither created nor destroyed within the hourglass. This is what the first law of thermodynamics indicates; there is no creation or destruction of matter and energy. While the quantity of sand in the hourglass is constant, the quality of sand distribution is constantly changing, where the bottom chamber is filling up and the upper chamber is getting empty. This is the analog of the second law of thermodynamics which points that the entropy (the sand in bottom chamber) constantly increases. Sand in the top chamber, like water at the top of a waterfall, has ability to do work by falling due to the availability of matter/energy, but sand at the bottom is out of capability to do work because of unavailability of matter/energy (Georgescu-Roegen, 1971; Daly, 1996).
Available Matter / Energy
Matter / Energy alters form
Unavailable Matter / EnergyE
ntro
py o
f the
sys
tem
incr
ease
s
Figure 2. Thermodynamic hourglass (inspired by Georgescu-Roegen, 1971)
2.4 Exergy and Entropy Exergy and entropy are two concepts that both derived from the second law of thermodynamics. The connection between exergy and entropy defines that “exergy lost in a process converts into entropy” (Ayres, 1998). In the followings some definitions of exergy and entropy are explained, and the study continues with more focus on the exergy and the exergy analysis parts.
2.4.1 Definition of Exergy Energy is incorrectly defined as “the ability to do work” and generally people refer to exergy whenever they talk about energy. Exergy is the available energy can be converted to ‘useful work’. Based on the first and second laws of thermodynamics, exergy is not conserved; it could be used to determine losses, efficiency and irreversibility of a system. Exergy measures

12
the useful energy content of a substance which is enabled to perform work. In other words, exergy is the extraction of useful work from the processes of equilibration in systems (Ayres et al., 1996).
Every thermodynamic system has various variables. Some of these variables, such as temperature T and pressure p are accessible to the human senses and can easily be measured by thermometers and barometers. On the other hand the concepts such as “heat” and “work” are less straightforward and are difficult cases to measure. Above all, energy as a familiar word is a more difficult concept which is separated from embodiment. It would not be possible to measure it directly and cannot directly be sensed. In everyday life we hear the term “energy” with no exact meaning, when we say “energy industry,” or “I have no energy today,” we actually mean something else, which in the right manner it is “exergy.” (Ayres et al., 1996).
Based on the first law of thermodynamics, energy can neither be created nor destroyed; it may only be changed from one form to another. Because of this change and based on second law of thermodynamics, only quality of energy is degraded. According to these two laws, exergy measures this change at quality. Exergy is the maximum amount of useful work received from a system when it is brought to equilibrium with its surroundings through a series of reversible processes, in which the system interacts only with its reference environment (Szargut et al., 1988). Table 1 gives a summary of some thermodynamic differences between energy and exergy (Wall, 2010).
Table 1. Energy versus exergy (Wall, 2010) Energy Exergy
The first law of thermodynamics The second law of thermodynamics
Energy is motion or ability to produce motion. Exergy is work, i.e. ordered motion, or ability to produce work.
Energy is always conserved, i.e. in balance; it can neither be produced nor consumed
Exergy is always conserved in a reversible process, but reduced in an irreversible process,
i.e. real processes. Thus, exergy is never in balance for real processes.
Energy is a measure of quantity. Exergy is a measure of quantity and quality.
2.4.2 Definition of Entropy Entropy and second law of thermodynamic are two concepts that not clearly understood and expressed. For easy understanding, entropy may be defined as “a function of thermodynamic variables, as temperature or pressure, which is a measure of energy that is not available for work during a thermodynamic process. A closed system evolves toward a state of maximum entropy.” (“The American Heritage,” 2012).
Entropy is low when matter and energy are highly organized and structured, and are potentially most useful in this form. The entropy increases in any thermodynamic process inside an isolated system, and according to second law of thermodynamic total amount of concentrated energy and matter in a system will decrease over time. The concept of entropy is an important method to measure the quality of natural resources and is a way to understand the irreversible nature of environmental and resource processes (Jowsey, 2007).
13
The amount of exergy loss per unit mass in a process, quantifies the extent of entropy increase that means entropy gain is equal to exergy loss (Connelly and Koshland, 1997).
2.5 Exergy/Entropy and Sustainability The concept of Sustainability has a very broad meaning, concerning several disciplines (Lems et al., 2004). There are a number of definitions of “Sustainability” and “Sustainable Development” which the most famous one with widely-used is in the report by the Brundtland Commission in 1987, Our Common Future:
“To meet the needs of the present without compromising the ability of future nations to meet their own needs.” The Brundtland report (1987) pointed toward the continuing of economic expansion without environmental degradation. Also, the concept of sustainable development (SD) defined by a U.N. commission, suggested continuous development in a way that considers both human needs and global ecosystems, promising quality of life for future generations (Brundtland, 1987).
The given definition of “sustainable development” by the U.N. is a qualitative definition which would not be helpful for decision-making. The following definition is more useful:
“A sustainable product or process is one that constrains resource consumption and waste generation to an acceptable level, makes a positive contribution to the satisfaction of human needs, and provides enduring economic value to the business enterprise.”
The above term, “acceptable level”, indicates that resources should not be consumed at a rate faster than the rate of renewal, and generation of wastes should not exceed the carrying capacity of the surrounding ecosystem (Bakshi and Fiksel, 2003).
One of the difficulties for evaluating the sustainability of a system is the lack of adequate clear perception, tools, and techniques to cover the complexity of environmental, economical and social issues at different levels of the system.
According to several scientific observations, there is a link between second law of thermodynamics (entropy law) and sustainability by considering the entropy law as a measure for sustainability (Hornbogen, 2003; Wall, 2010). Exergy is a suitable scientific concept in the work toward sustainable development. Calculation of the exergy of a systems in order to know how its energy and matter are used, gives important information on how the system is effective and balanced as the view point of conserving nature’s capital. The achieved knowledge in this regard will indicate the priorities that should be attributed to conservation measures. A system would not be sustainable if it consumed the exergy resources at a faster rate than they are renewed (Wall, 2010), or it can be said that entropy generation moves the system from order to disorder (chaos), and this entropy increase would be the measure of unsustainability (Figure 3).

14
Figure 3. Relative of sustainability decreases with increasing of entropy (Hornbogen, 2003)
By minimizing the increase of entropy or by minimizing the exergy loss, the system moves toward sustainability. In other words, sustainable development is related to entropy/exergy efficiency. The rising of entropy due to mixing dispersion of matters is an inevitable consequence of every industrial process. Material sustainability could be achieved if enough energy is provided to create negative entropy (ordering force) to compensate unwanted raise in entropy. The entropy and exergy analysis could be significant and valuable tools from both economic and environmental viewpoints (Hornbogen, 2003).
It would not be sufficient just considering energy balances for a critical analysis and comparison, because it ignores the dispersion of matter. Biosphere and technosphere have general tendency toward increasing entropy, growth of human population, car traffics, or mass production of goods of lesser usefulness and durability are examples of heightening the entropy in the world. In all physical transformation not only is matter restructured, but also energy is dissipated as heat slightly above ambient temperature (Hornbogen, 2003).
Dissipation of materials can be well explained by the principles of thermodynamics. According to the second law of thermodynamics, energy is dissipated during work. In completing any work, a certain amount of energy is consumed and expended in the form of heat. When a task is accomplished, the quality of energy has been dissipated and the ability to do further work has been diminished. This dissipated stated of energy, as aforementioned is denoted as entropy. This concept can also be employed for materials. The material transformation results in the quality dissipation of the material and increasing the entropy.
A physical translation of entropy generation would be the dissipation of materials and dispersal of energy. In other words, when a process generates entropy in universe the inputs to the system in the forms of material and energy are being dissipated and dispersed respectively. This kind of material and energy consumption under the form of dissipation brings economic and environmental problems. Lessening the quality of input materials and energy leads to an economic decline and also releasing the energy and material flows out to the environment would be a threat to the ecosystem. Hence, the exergy/entropy analysis would reflect the economical and environmental view points of a system. When the quality of energy or matter moves from higher to lower states, it is said to be “dissipated” (Geiser, 2001). Energy cannot be recycled, anyhow available energy stored in materials would be lost and finally materials transform to waste, and again needs energy to make them possible to reuse. During this process, part of matter is always lost and dissipated into the environment (Honkasalo, 1998).
Entropy
Sustainability
Chaos Order

15
Dissipation of matter and energy in the form of increasing entropy or decreasing the exergy efficiency is an indicator of unsustainability of the system. So, by using the by-product of a production process in such a way to decline its dissipation and resulting lesser exergy loss, the system could be more sustainable. This would be just one aspect of sustainable development indicator among several other elements.
2.6 Introduction to Exergy Analysis As explained before, the exergy concept is a possible way to describe the consumption of mass and energy from different resources by a common physical unit which is in fact consumed in real processes. Exergy can be calculated in different forms: kinetic, potential, physical and chemical (Ayres et al., 2001). Kinetic and potential exergy are mostly the same. Kinetic exergy can be used for analyzing a flywheel or turbine, and potential exergy is applicable for analyzing electrical or hydraulic systems. According to Ayres (2001), these two terms can be ignored for the aim of analyzing most common industrial processes (Ayres et al., 2001). Also, physical exergy is relevant to the optimization of thermal and mechanical processes such as heat engines, but it simply can be disregarded when the focus is to analyze a large scale system. In this case, the chemical exergy play an important role to account the resources (Ayres et al., 2001). Therefore the major focus in this study will be on the chemical exergy of the materials and products.
The physical units for exergy are the same as for energy or heat, namely kilocalories, joules or BTU. In resource use assessment, exergy analysis can be used for energetic and non-energetic inputs in joules. All materials have definable and calculable exergy content just with respect to a defined environment or reference state. In the chemical and engineering literature the standard reference state of each element is defined as its pure elementary state, for example: C for carbon or O for oxygen (Ayres and Ayres, 1999). So, natural resources can be evaluated by exergy concept. Exergy of fossil fuels is almost equivalent to the (standard) heat of combustion; for other energy forms, specific calculation are needed which depends on the details of conversion process. To calculate the exergy of the materials such as water, methane or Brewer’s Spent Grain (BSG), based on the standard chemical exergy of their elements, following equation (Eq. 1) is used (Wall, 1977; Szargut, 2005). In this report the symbol E is used for exergy instead of symbol B which usually used in Szargut (1988) studies.
𝐸𝑐ℎ𝑛 = ∆𝐺𝑓 + ∑ 𝑛𝑒𝑒 𝐸𝑐ℎ𝑛𝑒 (Eq. 1)
Where ∆𝐺𝑓 is formation Gibbs free energy of formation of the compound, 𝑛𝑒 is the amount of kmol of element e and 𝐸𝑐ℎ𝑛𝑒 is the standard chemical exergy of the element e (Szargut et al., 1988).
The standard chemical exergy of many pure substances and compounds can be found in Szargut et al. (1988) or in Appendixes B and C of the book “Accounting for Resources 2” (Ayres and Ayres, 1999). For those are not available, above formula can be used to estimate the chemical exergy. The Gibbs free energy of formation of many chemicals is available in standard reference sources, by knowing the chemical composition of substances, the exergy can be calculated (Ayres et al., 2001). Gibbs free energy of formation of a chemical
16
compound is the energy absorbed (+) or released (–) when the compound is formed from its original elements.
Further, the chemical exergy of mixtures can be calculated (Eq. 2) by the sum of the chemical exergy of substances forming the mixture plus the exergy loss due to the mixing of the substances (Talens Peiró et al., 2008).
𝐸𝑐ℎ𝑛,𝑚𝑖𝑥𝑡𝑢𝑟𝑒 = ∑ 𝑛𝑒𝑖 𝐸𝑐ℎ𝑛𝑒 + 𝑅𝑇0𝑦𝑒 ln𝑦𝑒 (Eq. 2)
Where, 𝐸𝑐ℎ𝑛𝑒 is the chemical exergy of the 𝑒 pure element of the substance [J/kg]; 𝑅 is the gas law constant [J/kg K]; 𝑇0 is temperature [K]; and 𝑦𝑒 is the mole fraction of the 𝑒𝑡ℎ substance.
The difference between the input and output exergy of a system is often related to the irreversibility of the system’s process that is referred to generation of entropy. The exergy destruction is in direct connection to entropy generation and can be defined by following formula (Eq. 3): (law of exergy loss)
∆𝐸 = 𝑇0∆𝑆𝑡𝑜𝑡 = 𝐸𝑖𝑛𝑡𝑜𝑡 − 𝐸𝑜𝑢𝑡𝑡𝑜𝑡 (Eq. 3)
Where ∆𝐸 is exergy destruction (or exergy loss), 𝑇0 is temperature, ∆𝑆𝑡𝑜𝑡 is total increase in entropy, 𝐸𝑖𝑛𝑡𝑜𝑡 and 𝐸𝑜𝑢𝑡𝑡𝑜𝑡 are total input and output exergy respectively.
Eq. 3 also indicates that the work can be performed when there is a difference in temperature and pressure against its surroundings.
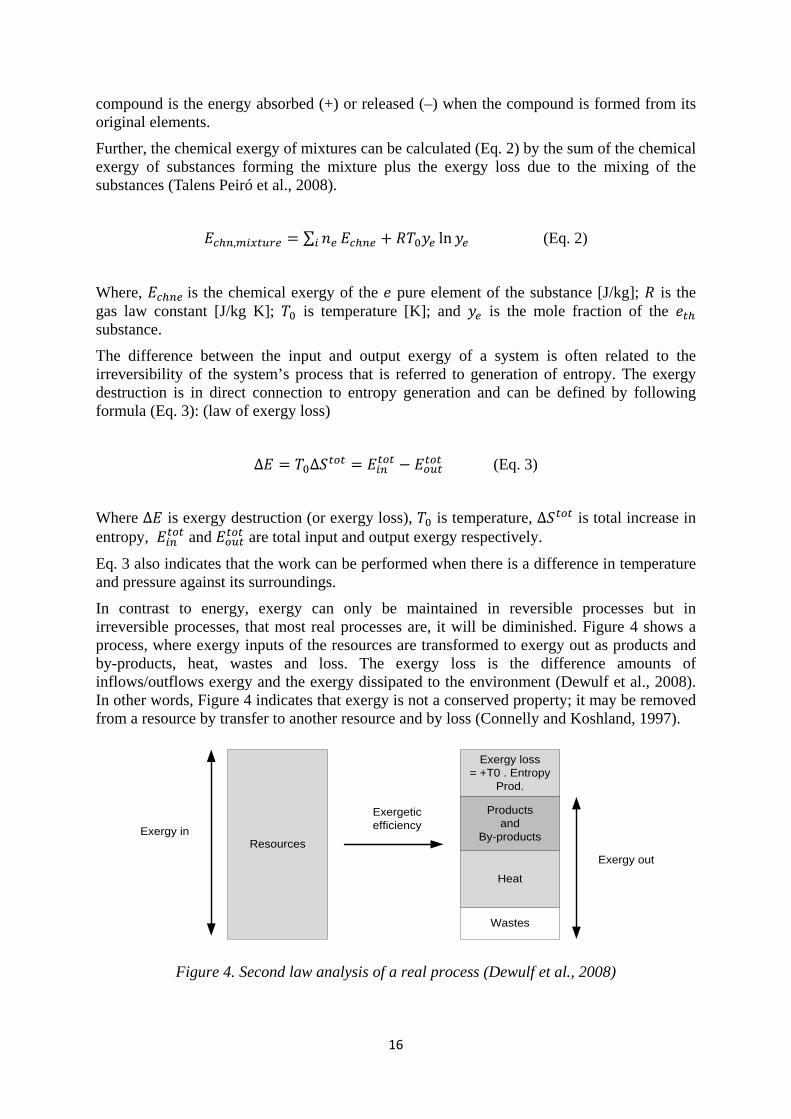
In contrast to energy, exergy can only be maintained in reversible processes but in irreversible processes, that most real processes are, it will be diminished. Figure 4 shows a process, where exergy inputs of the resources are transformed to exergy out as products and by-products, heat, wastes and loss. The exergy loss is the difference amounts of inflows/outflows exergy and the exergy dissipated to the environment (Dewulf et al., 2008). In other words, Figure 4 indicates that exergy is not a conserved property; it may be removed from a resource by transfer to another resource and by loss (Connelly and Koshland, 1997).
Resources
Exergy loss= +T0 . Entropy
Prod.
Productsand
By-products
Wastes
Heat
Exergy out
Exergy in
Exergetic efficiency
Figure 4. Second law analysis of a real process (Dewulf et al., 2008)

17
For calculating the exergy of fuels and electricity, a different method has been used. Usually, to account energy sources in exergy units (Joules), exergy conversion coefficients are defined. In the case of fuels such as coal, fuel oil or natural gas, by multiplying the net heating value by an appropriate coefficient, the exergy content can be estimated. Table 2 shows the net heating value and chemical exergy of some fuels (Ayres et al., 2001; Talens Peiró et al., 2007).
Table 2. Chemical exergy content of some fuels (Ayres et al., 2001)
Fuel Exergy coefficient Net heating value (kJ/kg) Chemical exergy (kJ/kg) Coal 1.088 21680 23587.84 Coke 1.06 28300 29998 Fuel Oil 1.073 39500 42383.5 Natural Gas 1.04 44000 45760 Diesel Fuel 1.07 39500 42265
The exergy coefficient of electricity is assumed to be equal to 1.00, so 1 kJ of electrical energy represents an exergy flow of 1 kJ (Ayres et al., 2001).
According to the exergy balance conditions which apply to every process, the exergy content of the inputs must be equal to the exergy lost in a process plus the exergy content of the outputs (Ayres, 1998).
The exergy calculation of input materials and utilities, and output products in the studied biogas production system will be presented in details in third chapter.
2.7 Eco-Thermodynamics This section will provide some points of the relationship between the concepts of entropy/exergy and economy.
The first and second laws of thermodynamic, as special laws in physics have meaningful application in economic theory, that Ayres called it as eco-thermodynamic (Ayres, 1998). According to the first law of thermodynamic, the law of conservation of mass/energy, raw material inputs to economic processes are not consumed, these inputs must equal to outputs for every processes, which apparently indicates that the desired raw materials extracted from the environment eventually return to environment again as unwanted wastes. On the other hand, the second laws of thermodynamics, so called ‘entropy law’ implies that in a closed system which has no any exchange of matter and energy with other systems, for each physical transformation the entropy of system increases. This increasing of entropy continues to rise up to its maximum amount until this isolated system reaches to internal balance. When various systems interacted with each other, the total sum of their entropy tends to increase over time (Ayres, 1998; Baumgärtner et al., 2003).
2.7.1 Physical and Economic System The economy is an open subsystem of the larger closed environmental system which extracts useable energy and material and return unusable wastes to the surrounding environment
18
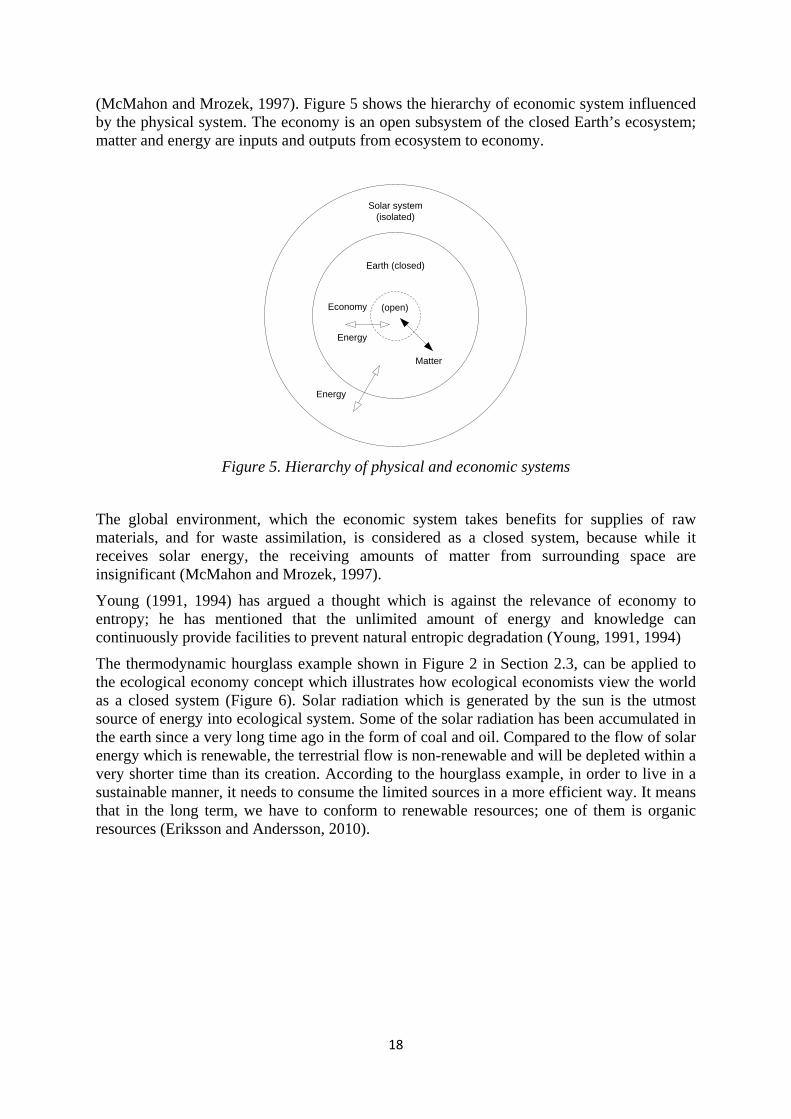
(McMahon and Mrozek, 1997). Figure 5 shows the hierarchy of economic system influenced by the physical system. The economy is an open subsystem of the closed Earth’s ecosystem; matter and energy are inputs and outputs from ecosystem to economy.
Solar system(isolated)
Earth (closed)
Economy
Energy
Matter
Energy
(open)
Figure 5. Hierarchy of physical and economic systems
The global environment, which the economic system takes benefits for supplies of raw materials, and for waste assimilation, is considered as a closed system, because while it receives solar energy, the receiving amounts of matter from surrounding space are insignificant (McMahon and Mrozek, 1997).
Young (1991, 1994) has argued a thought which is against the relevance of economy to entropy; he has mentioned that the unlimited amount of energy and knowledge can continuously provide facilities to prevent natural entropic degradation (Young, 1991, 1994)
The thermodynamic hourglass example shown in Figure 2 in Section 2.3, can be applied to the ecological economy concept which illustrates how ecological economists view the world as a closed system (Figure 6). Solar radiation which is generated by the sun is the utmost source of energy into ecological system. Some of the solar radiation has been accumulated in the earth since a very long time ago in the form of coal and oil. Compared to the flow of solar energy which is renewable, the terrestrial flow is non-renewable and will be depleted within a very shorter time than its creation. According to the hourglass example, in order to live in a sustainable manner, it needs to consume the limited sources in a more efficient way. It means that in the long term, we have to conform to renewable resources; one of them is organic resources (Eriksson and Andersson, 2010).

19
Figure 6. The entropy hourglass (Eriksson and Andersson, 2010)
The entropy hourglass in Figure 6 shows that the sun is the unlimited source of all energy on the earth. The upside of the hourglass indicates the amount of useful energy. By moving downward in the hourglass the entropy will increase, this means that the consumption of resources such as fossil fuels and minerals with low entropy causes the generation of useless wastes with high entropy (Eriksson and Andersson, 2010) Ayres discussed the incompatibility of the closed and cyclic model of standard economy by employing a material-energy balance model and by using the first law of thermodynamic, which mentions that the low-entropy material and energy enter the economic process as useful raw materials finally must leave the process and return to nature as high entropy wastes (Ayres, 1998). Related problems of resource depletion and environmental pollution could be linked to thermodynamic laws to promote a better, inter-disciplinary, understanding of the interaction between economy and environment (Jowsey, 2007). A closed cycle of flows can be sustained as long as its external exergy supply lasts. By contrast, an open system is inherently unstable and unsustainable (Ayres and Ayres, 1998).
Ayres has stated that in industrial production processes, the high quality raw materials extracted from the earth enter to the system and return to natural system in degraded form (Ayres, 1998). The material flow through the economy can be viewed by thermodynamic principles in terms of entropy changes. Connelly has indicated that this flow can be seen in two paces: first, high entropy resources such as minerals and metal ores are converted to low entropy, primary materials. Then, these primary materials are used in industrial processes and finally returned to the environment as high entropy wastes. So, in order to have a closed material cycle, the linear flow model has to be substituted by such steps to refine high entropy wastes into low entropy materials. Therefore, material cycling needs “entropy cycling” (O’Rourke et al., 1996).

20
Chapter 3. Case Study
3.1 Introduction In this chapter, in order to accomplish the “Exergy Analysis” and “Economic Evaluation” as two main studies in this thesis work, a fictitious biogas plant, named BIOLIU, is introduced as a case study. It has been assumed that the BIOLIU receives Brewer’s Spent Grain (BSG), a by-product from beer production as the input raw material into biogas production process. All required input and output data are extracted from scientific articles, reports and companies webpages, mostly based on the conditions in Sweden.
3.2 System Boundaries In order to start the analysis, definition of the system under study is necessary. This includes selecting the system boundaries of the BIOLIU biogas plant to define which inputs and outputs and which production stages are involved in the study. The focus in this chapter is on both exergy analysis and economic evaluation of the imaginary biogas production process.
The first step in exergy and economic analysis is to define the system boundary including inputs and outputs by drawing a flow diagram of the biogas industrial process under study. In defining system boundaries, inputs include of all energy, utilities and raw material, which consists of electricity, water, heat, and Brewer’s Spent Grain (BSG). The outputs of the system consist of biomethane (CH4), biofertilizer (digestate) and CO2. The black dashed line in Figure 7 shows the system boundaries applied to the system under consideration. It should be indicated that in this study the produced biogas is assumed to be purified and upgraded to biomethane (CH4) for use as a vehicle fuel for transportation purposes.
Brewer’s Spent Grain Digestate/
BioFertilizer
Bio-Methane
Electricity Heat
Water
CO2
Figure 7. System boundary of the biogas plant applied in exergy analysis
21
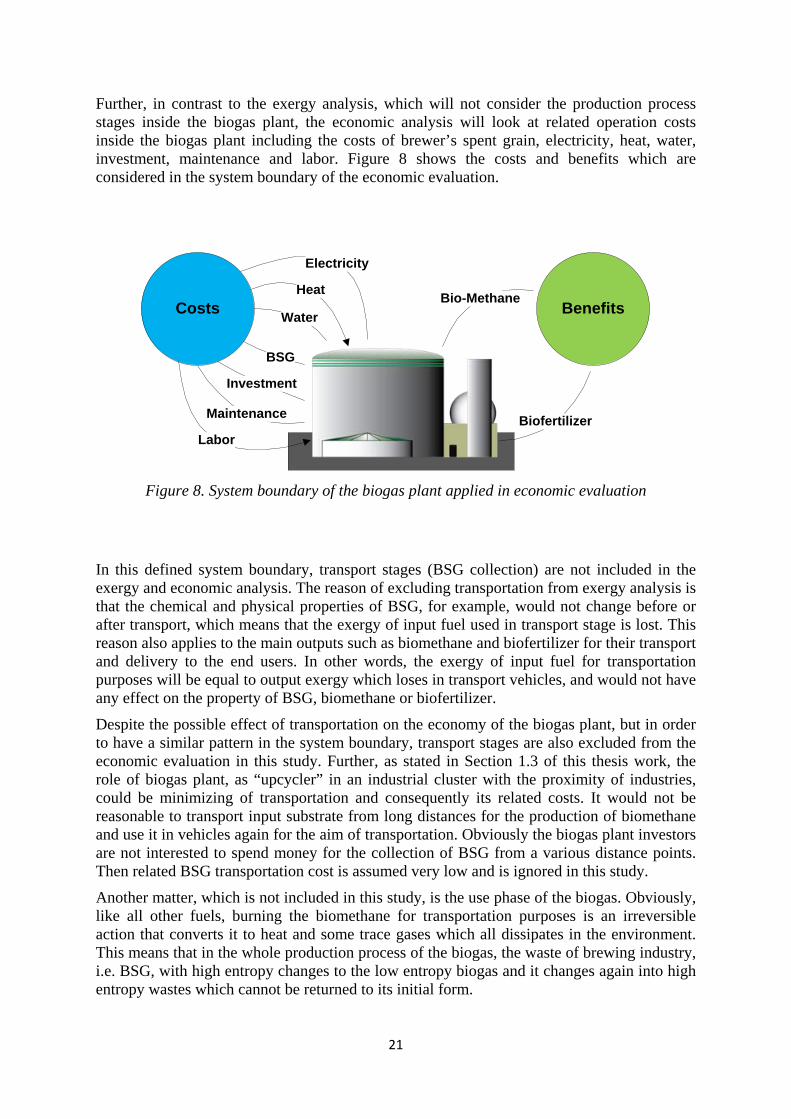
Further, in contrast to the exergy analysis, which will not consider the production process stages inside the biogas plant, the economic analysis will look at related operation costs inside the biogas plant including the costs of brewer’s spent grain, electricity, heat, water, investment, maintenance and labor. Figure 8 shows the costs and benefits which are considered in the system boundary of the economic evaluation.
Costs BenefitsHeat
Electricity
Water
Maintenance
Investment
Bio-Methane
BSG
LaborBiofertilizer
Figure 8. System boundary of the biogas plant applied in economic evaluation
In this defined system boundary, transport stages (BSG collection) are not included in the exergy and economic analysis. The reason of excluding transportation from exergy analysis is that the chemical and physical properties of BSG, for example, would not change before or after transport, which means that the exergy of input fuel used in transport stage is lost. This reason also applies to the main outputs such as biomethane and biofertilizer for their transport and delivery to the end users. In other words, the exergy of input fuel for transportation purposes will be equal to output exergy which loses in transport vehicles, and would not have any effect on the property of BSG, biomethane or biofertilizer.
Despite the possible effect of transportation on the economy of the biogas plant, but in order to have a similar pattern in the system boundary, transport stages are also excluded from the economic evaluation in this study. Further, as stated in Section 1.3 of this thesis work, the role of biogas plant, as “upcycler” in an industrial cluster with the proximity of industries, could be minimizing of transportation and consequently its related costs. It would not be reasonable to transport input substrate from long distances for the production of biomethane and use it in vehicles again for the aim of transportation. Obviously the biogas plant investors are not interested to spend money for the collection of BSG from a various distance points. Then related BSG transportation cost is assumed very low and is ignored in this study.
Another matter, which is not included in this study, is the use phase of the biogas. Obviously, like all other fuels, burning the biomethane for transportation purposes is an irreversible action that converts it to heat and some trace gases which all dissipates in the environment. This means that in the whole production process of the biogas, the waste of brewing industry, i.e. BSG, with high entropy changes to the low entropy biogas and it changes again into high entropy wastes which cannot be returned to its initial form.
22
Further, instead of using brewer’s spent grain for biogas production, as mentioned in Section 1.6, it can be used as human or animal fodder. In this case, the exergy and economic consequences of this scenario might show different results which needs to be examined in a separate study.
3.3 Methodology In the previous steps, in Sections 1.2 and 3.2, the aims and the system boundary of the study are discussed respectively.
Here, the methodologies used in the exergy and economic analysis are explained. This step is divided into two methods, one for the exergy analysis and another for the economic evaluation. In this thesis work, in order to apply these evaluations, a fictitious biogas plant named BIOLIU is introduced as the case study which enables this study answers the research questions.
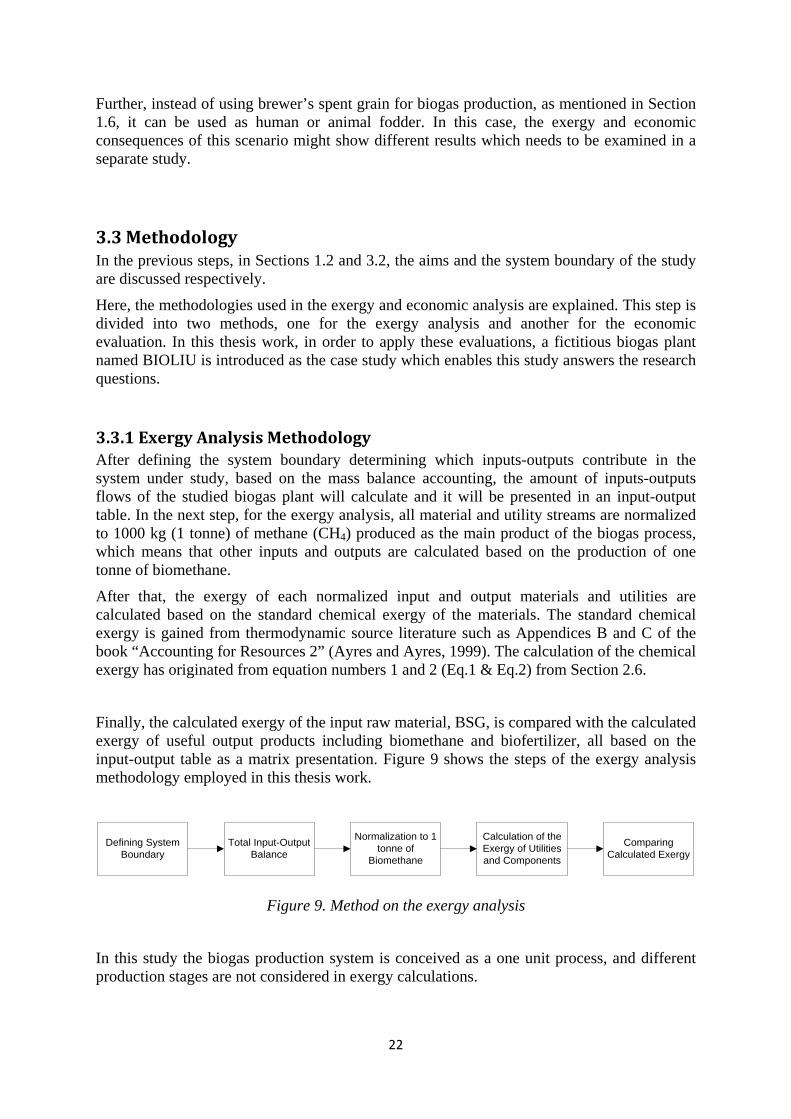
3.3.1 Exergy Analysis Methodology After defining the system boundary determining which inputs-outputs contribute in the system under study, based on the mass balance accounting, the amount of inputs-outputs flows of the studied biogas plant will calculate and it will be presented in an input-output table. In the next step, for the exergy analysis, all material and utility streams are normalized to 1000 kg (1 tonne) of methane (CH4) produced as the main product of the biogas process, which means that other inputs and outputs are calculated based on the production of one tonne of biomethane.
After that, the exergy of each normalized input and output materials and utilities are calculated based on the standard chemical exergy of the materials. The standard chemical exergy is gained from thermodynamic source literature such as Appendices B and C of the book “Accounting for Resources 2” (Ayres and Ayres, 1999). The calculation of the chemical exergy has originated from equation numbers 1 and 2 (Eq.1 & Eq.2) from Section 2.6.
Finally, the calculated exergy of the input raw material, BSG, is compared with the calculated exergy of useful output products including biomethane and biofertilizer, all based on the input-output table as a matrix presentation. Figure 9 shows the steps of the exergy analysis methodology employed in this thesis work.
Defining System Boundary
Normalization to 1 tonne of
Biomethane
Total Input-Output Balance
Calculation of the Exergy of Utilities and Components
Comparing Calculated Exergy
Figure 9. Method on the exergy analysis
In this study the biogas production system is conceived as a one unit process, and different production stages are not considered in exergy calculations.
23
Nonetheless, basis of the exergy analysis is to compare the exergy of the input BSG with the exergy of biomethane and biofertilizer, to discover how the exergy of the input changes during the production process.
3.3.2 Economic Analysis Methodology The economic evaluation in this thesis is on the microeconomic level which is the study of an individual imaginary biogas plant and how it can generate economic benefits. An analyst in energy policy, an investor or developer may use the results of this study to evaluate the attractiveness of a biogas production project. In this part, the biogas production system is evaluated economically based on the input raw material of Brewer’s Spent Grain (BSG) into the mentioned imaginary BIOLIU biogas power plant. The economic evaluation is based on extracted data from published documents, articles, reports and company information mostly linked to the conditions in Sweden.
The system boundaries applied for economic evaluation are defined in Section 3.2 in Figure 8. This economic analysis is based on the Cost-Benefit Analysis (CBA) tool which is a method for calculating and comparing benefits and costs of the projects. All costs and benefits are calculated based on the data of anaerobic digestion processing of 60,000 tonne of brewer’s spent grain (BSG) during one year operation of the biogas plant; total annual costs and total annual benefits of the biogas system have been compared to have a general view of the economic analysis. The input-output data in Table 3 from Section 3.5 is the basis of cost-benefit calculations.
With the objective of economic analysis, the studied biogas plant is divided into two categories:
1) Costs: including production costs (production and running costs) and capital (investment) costs
2) Incomes (benefits) to biogas plant comprising the benefits of selling biogas and biofertilizer. Each of these categories will be discussed in following sections. All costs and prices in the economic evaluation part are estimated in Swedish Krona (SEK).
Further, detailed information of inputs and outputs of the biogas production process have been achieved from different studies. In this study the BIOLIU biogas plant is an imaginary name which is defined based on various data from different sources combined together.
3.4 Assumptions In the real world, biogas production plants usually employ various types of raw materials to be co-digested to establish a proper operation in biogas production process in order to satisfy the aims of system outputs. Berglund and Börjesson (2006) indicated that the net energy output from biogas system is affected by the type of raw materials digested and the system design (Berglund and Börjesson, 2006). But, this project considers only one type of raw material namely BSG.
In this study, BIOLIU is assumed as a large-scale biogas production because of digestion of 60,000 tonne of raw material in a year. Based on the definition of Berglund and Börjesson (2006), farm-scale biogas plants can process up to 10,000 tonne of raw material per year and large-scale biogas plants can digest some 20,000 - 60,000 tonne of feedstock during one year

24
(Berglund and Börjesson, 2006). Selection of the scale type helps to have a unique definition of the studied biogas system and to make calculations more near to real cases.
This report considers the upgraded biogas, biomethane (CH4), as the main product of a biogas plant which is used as vehicle fuel. Therefore, the data from those farm scale biogas systems that are not usually utilized with biogas upgrading facilities are not considered in this study.
It is assumed that the produced raw biogas contains methane (CH4) and carbon dioxide (CO2) with a content of 65% and 35% respectively, other gases or components in biogas are excluded from calculations (Karellas et al., 2010). The economic evaluation in this report has been made from an owner’s perspective of a large scale biogas plant. This view is in contrast to the farm scale biogas plant as they usually use feedstock which is produced on farm. Large scale biogas plants have to pay to buy and collect their required feedstock from different suppliers, resulting different economic outcomes. The economic study does not include market factors and policy issues which are outside of defined biogas plant system boundary.
3.5 Input-Output Data for the BIOLIU Plant Before starting the exergy and economic analysis, it would be helpful to have a general view of inputs and outputs in BIOLIU biogas plant.
In order to make possible the exergy and economic analysis, the biogas production’s input and output enables to have a general view of the inflows and outflows based on defined system boundaries. Here a brief description of the annual input and output is given and the results will be presented in an input-output table to show the process under evaluation. Details of the input-output information will be discussed in following sections.
Regarding to the Section 3.4, it is assumed that a total of 60,000 tonne of BSG, wet weight, is input to the anaerobic digestion process in one year. Only about 20 percent of this wet BSG is dried matter (Avfall Sverige, 2008). According to Sezun (2010) one tonne of BSG can produce 98 Nm3 of methane, and about 85 percent of input BSG will remain as digestate which around 90 percent of it can be used as biofertilizer (Garcia, 2005; Berglund, 2006; Sežun et al., 2010).
The electricity consumption is 18 kWh per tonne of BSG plus 0.75 kWh for upgrading of each Nm3 of CH4 which results total 5,490 MWh of electricity consumption(Murphy and McCarthy, 2005; Berglund and Börjesson, 2006). The required heat for anaerobic digestion process is 46 kWh per tonne of input which amounts to a total of 2760 MWh of heat (Murphy and McCarthy, 2005). In the case of water consumption, Okereke (2009) has indicated that the ratio of dried BSG to water for digestion process should be 1:4 which means that required water for AD process of 12,000 tonne of dried BSG would be 48,000 tonne (48,000 m3), and also water consumption for upgrading process is 9,046 m3 (Benjaminsson et al., 2010). Total CO2 generation from biogas production, again assuming the biogas to contain 35% CO2, is calculated to be around 3,166,153 m3.
The results of the inputs and outputs of the studied BOILIU biogas plant are summarized in Table 3.
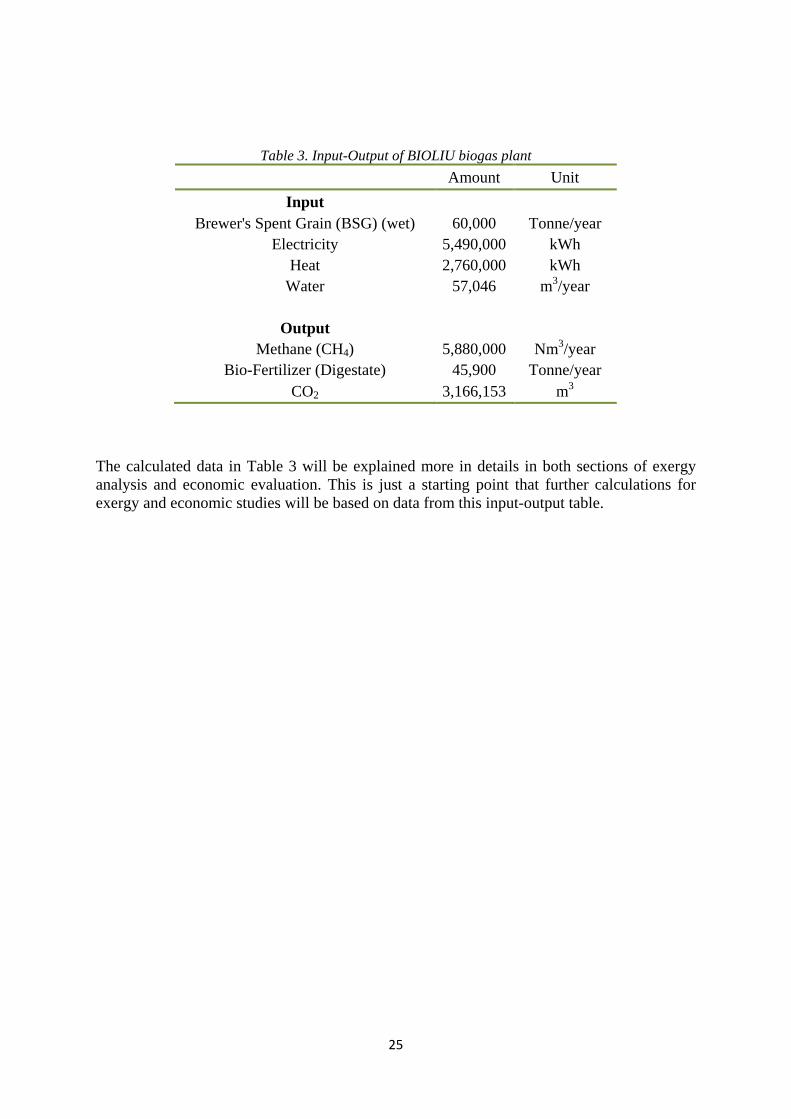
25
Table 3. Input-Output of BIOLIU biogas plant
Amount Unit Input
Brewer's Spent Grain (BSG) (wet) 60,000 Tonne/year Electricity 5,490,000 kWh
Heat 2,760,000 kWh Water 57,046 m3/year
Output
Methane (CH4) 5,880,000 Nm3/year Bio-Fertilizer (Digestate) 45,900 Tonne/year
CO2 3,166,153 m3
The calculated data in Table 3 will be explained more in details in both sections of exergy analysis and economic evaluation. This is just a starting point that further calculations for exergy and economic studies will be based on data from this input-output table.
26
Chapter 4. Exergy Analysis
The first aim of this chapter is to show how an exergy analysis can be used to evaluate a biogas production system as an “upcycler” in an industrial cluster. Exergy analysis uses the exergy concept to study a production process and quantify how the quality of energy changes from raw material into the end products. Exergy analysis has been used in processes or applications with the aim of comparing different options which presented how the embodied exergy in the input materials is divided among the outputs i.e. products and wastes, and also internal irreversibilities (Dewulf and Langenhove, 2006). In this part, the exergy analysis is used to evaluate the exergy of inputs and outputs of a renewable resource, i.e. BSG, by considering a biogas production system.
In contrast to energy analysis, exergy analysis provides information on how the quality of energy is degraded and upgraded in a production system (Talens Peiró et al., 2008). In this study, exergy analysis gives information on how the exergy of the input material Brewer’s Spent Grain (BSG) upgraded to methane and biofertilizer throughout a biogas production system and it identifies material waste and exergy losses.
The concept of “Exergy Analysis” for the purpose of exergy accounting has been outlined, developed and applied in some previous studies to analyse the production processes and to account wastes and emissions (Wall, 1977, 2010; Ayres, 1998; Talens Peiró et al., 2007, 2008). According to definition, with the objective of estimating the total exergy input to and output from a production process, all different inflows and outflows of exergy in the process must be taken into account; This kind of accounting is called Exergy Analysis (Wall, 2010).
The system boundary in Figure 5 and input-output data in Table 3 are the basis for the exergy analysis. In order to alleviate exergy comparisons, all process streams are normalized to 1 tonne (1000 kg) of the main product, methane (CH4), and then the exergy of products, components and utilities is calculated. In order to facilitate some calculations, 1,000 kg CH4 needs to be converted to its equal amount in Nm3. The density of methane is assumed 717 g/m3 (0.717 kg/m3) in this study (IPCC, 1996), so 1,000 kg of CH4 would be equal to 1,395 Nm3 CH4. Based on data in Section 3.5, for production of 1,395 Nm3 methane, 14,240 kg of wet BSG (1 tonne BSG = 98 Nm3 CH4) or 2,848 kg in dried (20% DM) form are required.
The exergy amount of each inputs and outputs will be discussed and calculated separately in following parts.
4.1 Input Raw Material (BSG) According to a report by Avfall Sverige (2008), the potential quantity of Swedish brewing by-product is about 60,000 tonne of wet weight of Brewer’s Spent Grain (BSG), major by-product of brewing industry, per year (Avfall Sverige, 2008). Based on this and referring to the Section 3.4, it is assumed that the BIOLIU biogas plant receives 60,000 tonne of BSG per year in order to digest and produce biogas. Around 20% of the input BSG is dry matter (Avfall Sverige, 2008), therefore the total DM of BSG would be 12,000 tonne.
In order to calculate the exergy of materials, their compositions must be identified. For calculating the chemical exergy of the input substrate, the chemical components of brewer’s spent grain must be known. Obtaining the exact chemical components of brewer’s spent grain before and after digestion was difficult due to very few literature references.
27
Some information about the chemical composition of BSG could be achieved from the studies by Huotari et al. (2008), and Onwosi and Okereke (2009). They have been analysed the nutrient contents of BSG before and after digestion (Table 4 & Table 6). Results from these studies combined together, but only major chemical elements are selected. These selected major chemical elements are Carbon (C), Hydrogen (H), Nitrogen (N), Phosphorus (P), and Potassium (K) which showed in Table 4 with their percentages in BSG (Huotari et al., 2008; Onwosi and Okereke, 2009). Carbon and hydrogen are selected because of their utilization in biomethane production, and nitrogen, phosphorus and potassium (NPK) are chosen because of their importance for the plants growth.
There are other chemical elements available in BSG such as Cl, Ca, Si, Al and Mg which are ignored from exergy calculations because of two following reasons:
Aforementioned elements are only available in small shares in the BSG, and also they have very low amount of exergy. Oxygen (O), for example, with percentage of 34% - 38% is disregarded too, due to its low exergy (0.12 kJ/g).
Another reason relates to the lack of data. The percentages of the chemical elements in BSG ‘before digestion’ could more or less be found in different literature, but the problem is to find out the share of these chemical elements in the BSG ‘after digestion’.
Table 4. Chemical elements of BSG – Before Digestion Elements C H N P K
% 54.26 7.00 3.63 0.43 0.03
As pointed out in Section 3.5, every tonne of BSG can produce 98 Nm3 methane. Thus, 1,395 Nm3 of CH4 results the input raw material of 14.24 tonne (14,240 kg) wet BSG and there would be 2,848 kg of dry matter of input BSG accordingly. For the exergy calculation of BSG, in order to facilitate the calculation, it is assumed that BSG is input into production system in dried form and afterward water will be added to the anaerobic digestion process. By using data of chemical components from Table 4, the chemical exergy of dried BSG would be about 27.50 kJ/g and finally the normalized exergy of input BSG can be calculated as 78,320 MJ. Obviously, in real processes, BSG will be used in wet form, and no further pre-treatment processes are required for dewatering the BSG.
4.2 Input Utilities Electricity, heat and water are required input utilities for the operation of biogas plants. The energy requirements vary among different biogas plants and it also depends on their input raw materials. For example, farm-scale biogas plants may require more heat than large-scale biogas systems due to the poorer insulation and their limitation for using heat exchangers. Also, the demand of electricity for pumping and mixing of raw materials differ among biogas production systems. In following sections, the exergy of required electricity, heat and water is calculated.

28
4.2.1 Electricity Based on the information from the articles by Berglund (2006) and Murphy (2005) the electricity demand for the anaerobic digestion process including pumping and mixing of feedstock in large scale biogas plants is estimated about 18 kWh per tonne of input raw material, without including any pretreatment of substrates. Also, since this thesis work considers the biomethane for use as vehicle fuel, the biogas needs to be upgraded by removing undesirable gases such as CO2 and H2S. In large-scale biogas plants, electricity consumption for upgrading each Nm3 of CH4 is considered 0.75 kWh (0.75 kWh/Nm3 CH4) (Murphy and McCarthy, 2005; Berglund and Börjesson, 2006). By applying above numbers, the electricity consumption for the normalized methane (1,395 Nm3) production, the required electricity for digestion process and upgrading process would be 258 kWh and 1,046 kWh respectively.
As mentioned in Section 2.6, the exergy coefficient of electricity is assumed to be equal to 1.00, so 1 kJ of electrical energy represents an exergy flow of 1 kJ (Ayres et al., 2001). Therefore, the exergy of total 1,304 kWh of electricity consumption is calculated about 4,700 MJ.
4.2.2 Heat Heat can be provided by an external heating source such as industrial steam or from district heating system (around 60° C). The thermal requirements for anaerobic digestion process is assumed to be 46 kWh/tonne (166 kJ/kg) (Murphy and McCarthy, 2005).
It has been assumed that the heat consumption of biogas power plant under this study is in the form of steam with the amount of 655 kg per 1 tonne of methane produced. The physical and chemical exergy of steam must be calculated and the sum would be the total exergy of the steam. For the exergy calculations of the process steam, both the chemical exergy (𝐸𝑐ℎ) and the physical exergy (𝐸𝑝ℎ) must be taken into account. The chemical exergy of water in gas state (528kJ/kg) can be achieved from Szargut (Table 1 of the appendix). Generally, the physical exergy can be defined by (Eq. 4) as following:
𝐸𝑝ℎ = (ℎ − ℎ0) − 𝑇0(𝑠 − 𝑠0) (Eq. 4)
Where ℎ is the specific enthalpy of steam [J/kg], ℎ0 is the specific enthalpy of saturated liquid water at room temperature [J/kg], 𝑠 is the specific entropy of steam [J/kg K], 𝑠0 is the specific entropy of saturated liquid water at room temperature [J/kg K] and 𝑇0 is the room temperature [K].
Based on aforementioned methods, the chemical exergy of steam is 345 MJ and its physical exergy is 730 MJ. Therefore, the total exergy of steam is 1,075 MJ.
4.2.3 Water In practice the substrate input into digestion tank must be mixed with water. In the case of BSG, it usually uses in its wet condition. In the case of water consumption, Onwosi and Okereke (2009) have examined different water (water ratio) dilution on biogas production from brewer’s spent grain. That study is shown the water ratio of 1:4 would yield maximum biogas production (Onwosi and Okereke, 2009).
29
In order to make an easier estimation of water consumption, it is assumed that the input BSG into digestion process is in dried form and then needs to be mixed with water. This also makes it easier to calculate the exergy of both BSG and water separately. According to Onwosi and Okereke (2009) which mentioned above, and also referred to Section 4.1, the water requirement for digestion process of 2,848 kg dried BSG would be 11,392 kg.
On the other hand, this study has assumed that water scrubbing technology is the most common technology for biogas upgrading. In the study by Benjaminsson et al., 2010, the water consumption for upgrading process is estimated 1 liter/Nm3 of raw biogas (Benjaminsson et al., 2010). Based on the normalized amount of methane (1395 Nm3) for exergy calculation, total produced raw biogas would be 2,146 m3, and therefore the required water for biogas purification is 2,146 liter which is equal to 2,146 kg. The sum of normalized water consumption would be 13,538 kg.
The exergy of water in the form of liquid is 0.05 kJ/g (Ayres and Ayres, 1999); therefore the exergy of water for processing of 2,848 kg of dried BSG, including digestion and upgrading, would be 677 MJ.
4.3 Outputs While biogas is the main product of the anaerobic digestion process, solid digestate is another important output. Also, there are other gases generated during anaerobic digestion which are removed throughout upgrading process. Biogas contains roughly 53-73% methane, 30-40% carbon dioxide (CO2) and trace of other gases such as nitrogen (N) and hydrogen sulphide (H2S) (Karellas et al., 2010). Table 5 presents the typical composition of biogas. Among those, only methane and carbon dioxide (CO2) will be considered in exergy analysis, and other gases are ignored from calculations. Once again this study has assumed that the CH4 content in biogas is 65% and its CO2 is 35% (Karellas et al., 2010).
Table 5. Typical composition of biogas (Karellas et al., 2010) Methane, CH4 55 -75 % Carbon Dioxide, CO2 25 - 45 % Carbon Monoxide, CO 0 - 0.3 % Nitrogen, N2 1 - 5 % Hydrogen, H2 0 - 3 % Hydrogen Sulphide, H2S 0.1 - 0.5 %
Referring to defined system boundaries in Section 3.2, methane, bio-fertilizer and CO2 are considered as outputs of the production process. In following sections the exergy of these three outputs will be discussed and calculated.
4.3.1 Bio-Methane (CH4) Based on the information from Sezun (2010), the theoretical potential methane production of 17,000 tonne of brewer’s spent grain is 1,656,000 Nm3 (CH4) which means that each 1 tonne of input BSG to biogas production system can generate about 98 Nm3 of methane. The amount of generated yeast is not included in this study work.
30
Section 2.6 identified that the exergy content of the fuels have been estimated according to their net heating value which also known as the calorific value. A typical normal cubic meter of methane has a calorific value3 about 9.6 kWh, which results about 34.00 MJ 4 (Swedish Gas Center, 2007). The exergy of methane (CH4) is considered as its calorific value, thus the exergy of 1,000 kg (1,395 m3) of methane would be 47,430 MJ.
According to the results of Onwosi & Okereke (2009), the highest biogas yield from the digestion of spent grain was related to the time when the feed to water ratio was 1:4 w/v5. Therefore this ratio is assumed as the best water dilution for the digestion in order to soak the optimum degradation and production of biogas (Onwosi and Okereke, 2009).
4.3.2 Bio-Fertilizers / Digestate The sludge obtained after anaerobic digestion of BSG can be used as an organic fertilizer because of the availability of the nutrients N, P and K which are useful for the growth of plants. According to a report by IEA Bioenergy, it is indicated that “the quantities of nutrients that are supplied to a digester via the feedstock are the same as those in the digestate.” (Lukehurst et al., 2010). So, the amount of N, P and K nutrients in digestate, i.e. after digestion, are considered as same as before digestion.
Based on the calculations by Garcia (2005), around 85% of input substrate into anaerobic digestion can be digested and remains as digestate. According to Berglund (2006), about 90% of produced digestate in large scale biogas plants can be used as biofertilizer (Garcia, 2005; Berglund, 2006). Therefore, the total possible production of biofertilizer would be around 45,900 tonne which is assumed that about 20 percent of this amount is dry matter.
As discussed before, in order to calculate the exergy of the components, it is necessary to identify the chemical elements. The chemical components of BSG “After Digestion” are shown in Table 6 (Huotari et al., 2008; Onwosi and Okereke, 2009). Similar to Section 4.1, the exergy of digestate is calculated based only on those elements which tend to be most significant for the total exergy of the substrate. Carbon (C) has high sharing percentage, Hydrogen (H) has high amount of kJ chemical exergy per gram, and N, P, and K are important nutrients that plants need for the biofertilizer production (Table 6).
Table 6. Chemical elements of BSG – After Digestion Elements C H* N P K
% 37.51 4.00 3.63 0.43 0.03 * Source: Applicability of biogas digestate as solid fuel (Kratzeisen, 2010)
Knowing the percentage of each element and also the chemical exergy of them will help to calculate total exergy of digested BSG. By using data from Table 6 the chemical exergy of BSG after digestion would be 17.00 kJ/g. For the production of 1,000 kg (1,395 Nm3) of methane, 2,178 kg of biofertilizer can be produced. Hence, the normalized exergy of this bio-fertilizer (BSG after digestion) can be calculated 37,026 MJ.
3 It indicates the lower calorific value which uses mostly in Sweden. 4 1 kWh is equal to 3.6 MJ 5 Weight / Volume
31
4.3.3 Carbon Dioxide (CO2) Carbon dioxide is an unwanted output from biogas production system which contains 22-45% of biogas (Table 5). There might be possibilities of using CO2 for some industries which will discuss briefly in economic evaluation part of this thesis study.
This study has assumed that 35% of produced biogas is CO2. Other trace gases are ignored from exergy calculations. According to this assumption, and based on the production of 1,000 kg (1,395 Nm3) CH4, total CO2 generation would be 750 m3. The density of CO2 and its chemical exergy are 1.842 kg/m3 and 0.4515 kJ/g respectively; therefore the exergy of the generated CO2 is estimated to be 623 MJ.
As the generation of CO2 during biogas production can not be employed for further use, it is released to the environment, thus it exergy amount of 623 MJ is considered as one part of the exergy loss of the system.
32
Chapter 5. Economic Evaluation There are many different biogas systems using of the variety in raw materials, digestion technologies and application of digestate and biogas. Raw materials include organic wastes from food waste, agricultural residues, and manure or ley crops (Berglund and Börjesson, 2006); but this thesis work will not take into account the probable economic benefits of substitution of biofertilizer for mineral fertilizers, and also will not consider the possible economic benefits of related waste management strategies. In following sections, details of the costs and incomes of the studied biogas plant are described.
5.1 Production Costs An important factor for the feasibility of a project is estimating the total operating and running costs. Estimations of operating costs are subject to various uncertainties, because of different operation processes. This category is consisted of all fixed and variable costs for running and operation of the biogas plant. These costs include:
Cost of input raw material (BSG) Cost of consumption of utilities such as electricity, heat and water Maintenance cost Labor cost Investment cost
Related costs of the upgrading of biogas are also included in the economic evaluation part.
5.1.1 Raw Material Cost (Substrate Cost) Raw materials for the anaerobic digestion process can be divided in three categories. Some of them, e.g. energy crops, must be purchased. Some have no fees and are free of charge, e.g. manure; and some even bring extra income to biogas production plant, e.g. household wastes. Also, those who provide particular services to take care of wastes will get economic compensation for their works.
In this study, as mentioned earlier, the Brewer’s Spent Grain (BSG) has been chosen as input substrate for economic analysis of the BIOLIU biogas production system. The price ranges considerably for wet BSG. According to information from the Energy Center of Wisconsin (2004) the price of spent grains, which is now used for animal consumption, is about $47 (315 SEK)6 per tonne of wet BSG. In the study by Ben-Hamed et al. (2011), in the sensitivity analysis section, it is assumed that the cost of wet BSG for farmers is from 0£ (0 SEK)/tonne to 38£ (395 SEK)7/ tonne (Ben Hamed et al., 2011). Also, Zanker et al. (2007) indicated the price of wet spent grain to be 10.5 Euro (93 SEK)8 (Zanker et al., 2007).
Also based on the information from Michael Martin (2011), the price of BSG is estimated 500 SEK per tonne (Martin, 2011).
6 1 USD = 6.7 SEK (Date: February 2012) 7 1 £ (British Pound) = 10.4 SEK (Date: February 2012) 8 1 Euro = 8.8 SEK (Date: February 2012)

33
Due to the various types of BSG buyers for different purposes the prices vary too. Local farmers use it for feeding their cattle and industrial users may buy it for biogas production. In order to have an average price for the basis of economic calculation, it is assumed that the cost of wet BSG for the biogas plant is 350 SEK/tonne. In discussion section in Chapter 7, other scenarios of BSG prices, more or less than this assumed price, will be considered as the sensitivity analysis in this thesis.
For the economic analysis of a biogas plant, the annual input of 60,000 tonne of BSG is evaluated to show how this total raw material input will affect the costs and total revenue of the biogas power plant. Therefore, the total cost of buying BSG would be 21,000,000 SEK.
5.1.2 Investment Costs (capital costs) Construction of a large scale biogas plant requires significant investment which to date have needed support from public funds, at least at the start-up of the project. In Sweden the central government support in the form of LIP (Local Investment Programmes) and KLIMP (Climate Investment Programmes) grants has in many cases proved decisive (Held et al., 2008).
Related reports mention that the founding of biogas plants in Sweden in long-term depends on the continuation of these supportive actions.
Biogas upgrading facilities are another cost intensive part of a large scale biogas plant. Biogas must first be purified from corrosive components, particulate matter and water, and in order to increase its energy content, the carbon dioxide must be removed. This cleaning process which called as biogas upgrading is required if biogas is to be used as vehicle fuel or distributed through the gas grids. The upgrading of biogas requires relatively investments which must be included in the total investment costs.
There are many different ranges of investments in biogas industries in Sweden. Held et al. (2008) have analysed some biogas plants in Sweden from investment point of view and found a range of investments from 90 million SEK to 135 million SEK (Held et al., 2008). Berglund (2006) has investigated that biogas upgrading cost is ranged from 0.10 - 0.20 SEK up to 0.40 SEK per kWh of purified biogas in some Swedish upgrading plants (Berglund, 2006).
In the calculation of investment cost, interest rate and the depreciation (amortization) cost must be taken into account. For the calculation of depreciation, the life span of the studied biogas plant is assumed 20 years.
It is needed to calculate the annual repayment of the loan. It is assumed that the investment has been 110 million SEK with the interest rate (discount rate) of 4% during a period of 20 years as the life span of the biogas plant. So, the amount must be paid back is 8,093,993 SEK per year.
5.1.3 Labor and Maintenance Costs For the calculation of the annual labor cost (fixed cost), which is primarily the salaries of personnel, the average monthly cost of labor for the studied biogas plant is 300,000 SEK which made the annual cost of 3,600,000 SEK.
According to different studies, the annual maintenance cost of a biogas production process including the spare parts costs and the costs of external assistance (contractors) are between 10,000 to 50,000 SEK per month (Svenska Renhållningsverksföreningen, 2005). The average
34
amount of 30,000 SEK per month is considered as the monthly maintenance cost, which resulted total cost of 360,000 SEK in one year.
5.1.4 Cost of Utilities In Section 4.2, electricity, heat and water are considered as input utilities for the operation of the biogas plant; the consumption cost of each of them is calculated separately as follows:
In the case of electricity consumption, based on the information from Section 4.2.1, the required electricity for the anaerobic digestion process including pumping and mixing of feedstock is estimated about 18 kWh per tonne of input raw material, without including any pretreatment of substrates. Also, since this study considers the biomethane to be used as a vehicle fuel, the biogas needs to be upgraded by removing undesirable gases such as CO2 and H2S. In large-scale biogas plants, electricity consumption for upgrading each Nm3 of CH4 is assumed to be 0.75 kWh (0.75 kWh/Nm3 CH4) (Murphy and McCarthy, 2005). Table 7 shows total electricity consumption of anaerobic digestion and upgrading process.
Table 7. Total electricity consumption
Electricity Consumption (kWh) Total (kWh) Anaerobic Digestion 18 / tonne BSG 60,000 1,080,000
Upgrading 0.75 /Nm3 CH4 5,880,000 4,410,000 Total 5,490,000
According to the information of energy price statistics achieved from Eurostat, electricity price in Sweden for industrial purposes in 2011 amounted to 0.089 Euro/kWh (0.78 SEK/kWh. So, total annual electricity consumption of the BIOLIU biogas plant would be 4,282,200 SEK (energy price statistics, 2011).
Heating is another required energy input to keep the substrate at optimal temperature for the bacteria to produce biogas (Martin, 2010). District heating is considered as the heat source for anaerobic digestion process. The temperature requirement is 84 – 86 °C for the processes with pasteurization. The other processes without the need of pasteurization the incoming district heating water must have temperatures about 57 – 72 °C (Lundqvist, 2009). The thermal requirement for anaerobic digestion process is assumed 46 kWh/tonne (166kJ/kg) of input substrate (Murphy and McCarthy, 2005). According to a report by Lund University (2009) the district heating price in Sweden is between 0.4 to 0.9 SEK/kWh (Ericsson, 2009). Another study by Nordic Energy Perspective (2009) shows that the district heating prices in Sweden are between 351 SEK/MWh and 621 SEK/MWh (Nordic Energy Perspectives, 2009). This aforementioned study considers 15 municipalities as the representative for all district heating in Sweden, the average district heating price in this thesis is assumed 600 SEK/MWh including VAT. This therefore amounts to a total annual heating cost of 1,656,000 SEK.
The water consumption in biogas plant is briefly described in Section 4.2.3, which same as electricity consumption, is including of required water for both AD and upgrading processes. On the other hand based on the input-output Table 3 in Section 3.5, total water consumption of the biogas production system is calculated to be 57,046 m3 in one year. Based on a report by Benjaminsson et al. (2010), the price of water is mentioned to be 10 SEK/m3, so total annual water consumption cost is estimated to be 570,460 SEK (Benjaminsson et al., 2010).

35
5.2 Incomes from Biogas Plant (Benefits) Biomethane and biofertilizer are two profitable products from biogas plant which can be sold in the market. The possible production amount of methane and biofertilizer from 60,000 tonne of input BSG into biogas production system and their potential selling price are estimated in following sections.
5.2.1 Biogas / Bio-Methane (CH4) The main product of the anaerobic digestion of organic wastes, i.e. Brewer’s Spent Grain (BSG) in this thesis work, is biogas which contains a mixture of methane (CH4) and Carbon Dioxide (CO2) and trace gases such as nitrogen and hydrogen.
According to previous sections (Section 3.5 and Section 4.3.1), the amount of methane that could be produced theoretically from brewers’ spent grain is around 98 Nm3 per tonne of wet BSG (Sežun et al., 2010). Therefore, total methane production from 60,000 tonne of BSG would be 5,880,000 Nm3. This amount is the potential (maximum) amount of CH4 production for certain quantities of substrate (BSG); because in the continuous anaerobic digestion process, the actual biogas yields are lower (Karellas, 2010). Table 8 shows the amount of production of methane (CH4) and biogas from 60,000 tonne of input raw material.
Table 8. Produced methane and biogas Input BSG ton/year Nm3 CH4/ton VS Nm3 CH4/year Nm3 Biogas/year*
60,000 98 5,880,000 9,046,154 *CH4 content in biogas is assumed 65%.
The purpose of economic evaluation in this section is the benefits of selling upgraded biogas as a vehicle fuel in the market. The selling price of upgraded biogas in filling stations is about 13.00 SEK / Nm3, but this price is the selling price at filling stations in Sweden for end users which is different from the selling price of biogas plants to distribution network (Tekniska Verken i Linköping AB, 2012) (access dated March 2012).
The price of biogas as a vehicle fuel in Sweden is free of energy tax and CO2 tax. Usually, the biogas (biomethane) price is about 20 percent less expensive than petrol price (E.ON Sverige, 2012). Regarding to the information from (Svenska Petroleum Institutet, 2012), the operation cost and gross margin, energy and CO2 taxes and value added tax of petrol in 2012 is shown in Table 9 (E.ON Sverige, 2012 & Svenska Petroleum Institute, 2012).
Table 9. Production cost, tax and VAT of petrol (2012) Constituents of petrol price Cost (SEK/liter)
Production Cost and Gross Margin 6.46 Energy and CO2 TAX 5.37
VAT 2.96 Total 14.79
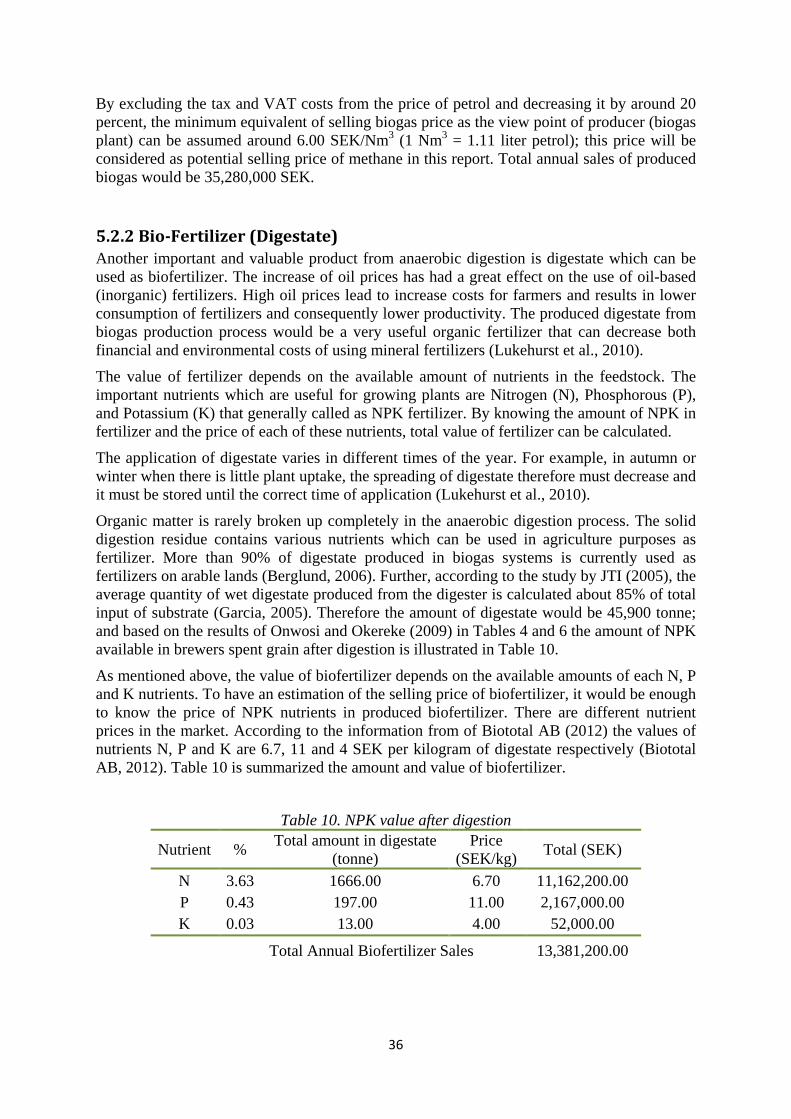
36
By excluding the tax and VAT costs from the price of petrol and decreasing it by around 20 percent, the minimum equivalent of selling biogas price as the view point of producer (biogas plant) can be assumed around 6.00 SEK/Nm3 (1 Nm3 = 1.11 liter petrol); this price will be considered as potential selling price of methane in this report. Total annual sales of produced biogas would be 35,280,000 SEK.
5.2.2 Bio-Fertilizer (Digestate) Another important and valuable product from anaerobic digestion is digestate which can be used as biofertilizer. The increase of oil prices has had a great effect on the use of oil-based (inorganic) fertilizers. High oil prices lead to increase costs for farmers and results in lower consumption of fertilizers and consequently lower productivity. The produced digestate from biogas production process would be a very useful organic fertilizer that can decrease both financial and environmental costs of using mineral fertilizers (Lukehurst et al., 2010).
The value of fertilizer depends on the available amount of nutrients in the feedstock. The important nutrients which are useful for growing plants are Nitrogen (N), Phosphorous (P), and Potassium (K) that generally called as NPK fertilizer. By knowing the amount of NPK in fertilizer and the price of each of these nutrients, total value of fertilizer can be calculated.
The application of digestate varies in different times of the year. For example, in autumn or winter when there is little plant uptake, the spreading of digestate therefore must decrease and it must be stored until the correct time of application (Lukehurst et al., 2010).
Organic matter is rarely broken up completely in the anaerobic digestion process. The solid digestion residue contains various nutrients which can be used in agriculture purposes as fertilizer. More than 90% of digestate produced in biogas systems is currently used as fertilizers on arable lands (Berglund, 2006). Further, according to the study by JTI (2005), the average quantity of wet digestate produced from the digester is calculated about 85% of total input of substrate (Garcia, 2005). Therefore the amount of digestate would be 45,900 tonne; and based on the results of Onwosi and Okereke (2009) in Tables 4 and 6 the amount of NPK available in brewers spent grain after digestion is illustrated in Table 10.
As mentioned above, the value of biofertilizer depends on the available amounts of each N, P and K nutrients. To have an estimation of the selling price of biofertilizer, it would be enough to know the price of NPK nutrients in produced biofertilizer. There are different nutrient prices in the market. According to the information from of Biototal AB (2012) the values of nutrients N, P and K are 6.7, 11 and 4 SEK per kilogram of digestate respectively (Biototal AB, 2012). Table 10 is summarized the amount and value of biofertilizer.
Table 10. NPK value after digestion
Nutrient % Total amount in digestate (tonne)
Price (SEK/kg) Total (SEK)
N 3.63 1666.00 6.70 11,162,200.00 P 0.43 197.00 11.00 2,167,000.00 K 0.03 13.00 4.00 52,000.00
Total Annual Biofertilizer Sales 13,381,200.00

37
Chapter 6. Overall Results and Sensitivity Analysis
The aim of this chapter is to gather the calculations in exergy analysis and economic evaluation from Chapter 4 and Chapter 5, in order to provide a holistic approach to the aims of this thesis work. The two following sections provide the overall results of the exergy and economic analyses respectively.
6.1 Exergy Analysis Results The results of the exergy calculations for the BIOLIU biogas plant as outlined above in Chapter 4, are summarized in Table 11.
Table 11. Exergy results of Input-Output of BIOLIU biogas plant
Exergy (MJ) Input
Brewer's Spent Grain (BSG) 78,320 Electricity 4,700
Heat 1,075 Water 677 Total 84,772
Output
Methane (CH4) 47,430 Bio-Fertilizer (Digestate) 37,026
Total
CO2
84,456
623
The results of exergy analysis of biogas production process show that the major exergy input is the Brewer’s Spent Grain. The BSG had an exergy input of 78,320 MJ. Other inputs also include electricity, heat and water with 4,700 MJ, 1,075 MJ and 677 MJ respectively. Thereafter, the major exergy outputs of the system are biomethane and biofertilizer. The production of biomethane and biofertilizer from BSG gives opportunity of recycling of industrial by-product of brewing process with high exergy content. The summation of the exergy content of both final products, biomethane and biofertilizer, have higher exergy than the original input of BSG. According to the second laws of thermodynamics, the exergy increase of the final products shows that the quality of BSG (78,320 MJ) is upgraded to produce biomethane (47,430 MJ) and biofertilizer (37,026 MJ) which is a total of 84,456 MJ. Figure 10 illustrates the exergy flow diagram of the studied biogas plant.
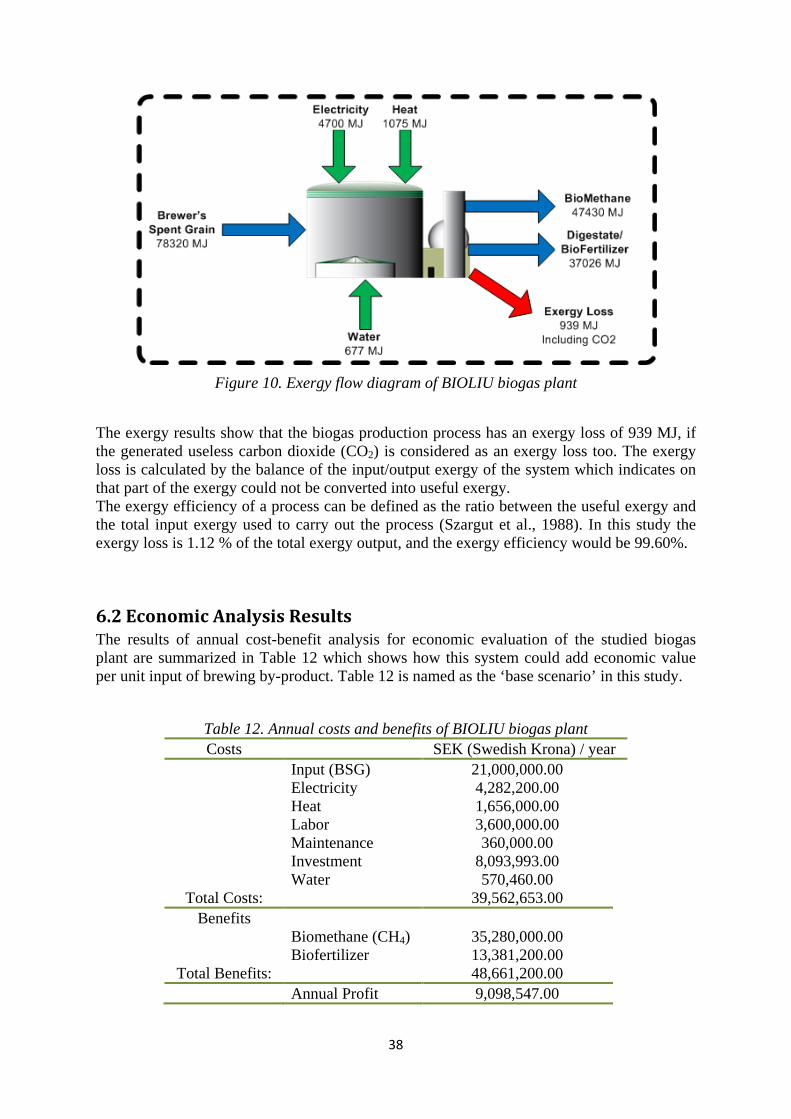
38
Figure 10. Exergy flow diagram of BIOLIU biogas plant
The exergy results show that the biogas production process has an exergy loss of 939 MJ, if the generated useless carbon dioxide (CO2) is considered as an exergy loss too. The exergy loss is calculated by the balance of the input/output exergy of the system which indicates on that part of the exergy could not be converted into useful exergy. The exergy efficiency of a process can be defined as the ratio between the useful exergy and the total input exergy used to carry out the process (Szargut et al., 1988). In this study the exergy loss is 1.12 % of the total exergy output, and the exergy efficiency would be 99.60%.
6.2 Economic Analysis Results The results of annual cost-benefit analysis for economic evaluation of the studied biogas plant are summarized in Table 12 which shows how this system could add economic value per unit input of brewing by-product. Table 12 is named as the ‘base scenario’ in this study.
Table 12. Annual costs and benefits of BIOLIU biogas plant Costs SEK (Swedish Krona) / year
Input (BSG) 21,000,000.00
Electricity 4,282,200.00
Heat 1,656,000.00
Labor 3,600,000.00
Maintenance 360,000.00
Investment 8,093,993.00
Water 570,460.00 Total Costs: 39,562,653.00
Benefits Biomethane (CH4) 35,280,000.00
Biofertilizer 13,381,200.00 Total Benefits: 48,661,200.00
Annual Profit 9,098,547.00
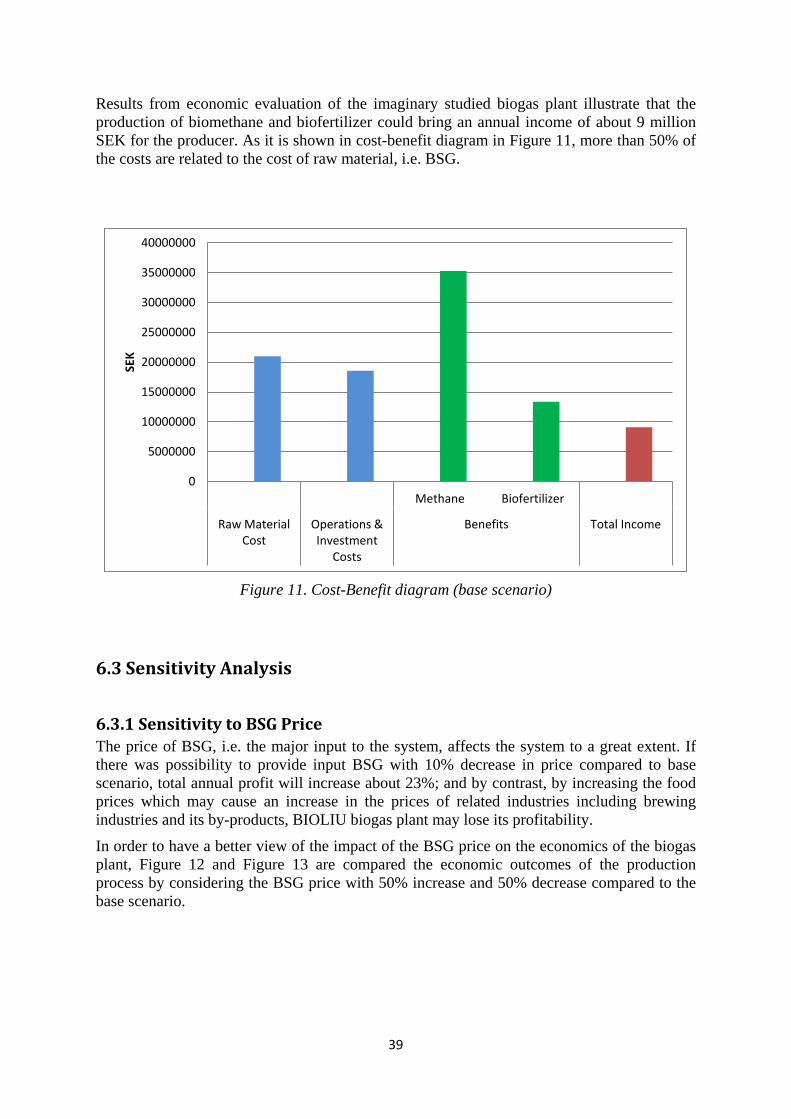
39
Results from economic evaluation of the imaginary studied biogas plant illustrate that the production of biomethane and biofertilizer could bring an annual income of about 9 million SEK for the producer. As it is shown in cost-benefit diagram in Figure 11, more than 50% of the costs are related to the cost of raw material, i.e. BSG.
Figure 11. Cost-Benefit diagram (base scenario)
6.3 Sensitivity Analysis
6.3.1 Sensitivity to BSG Price The price of BSG, i.e. the major input to the system, affects the system to a great extent. If there was possibility to provide input BSG with 10% decrease in price compared to base scenario, total annual profit will increase about 23%; and by contrast, by increasing the food prices which may cause an increase in the prices of related industries including brewing industries and its by-products, BIOLIU biogas plant may lose its profitability.
In order to have a better view of the impact of the BSG price on the economics of the biogas plant, Figure 12 and Figure 13 are compared the economic outcomes of the production process by considering the BSG price with 50% increase and 50% decrease compared to the base scenario.
0
5000000
10000000
15000000
20000000
25000000
30000000
35000000
40000000
Methane Biofertilizer
Raw Material Cost
Operations & Investment
Costs
Benefits Total Income
SEK
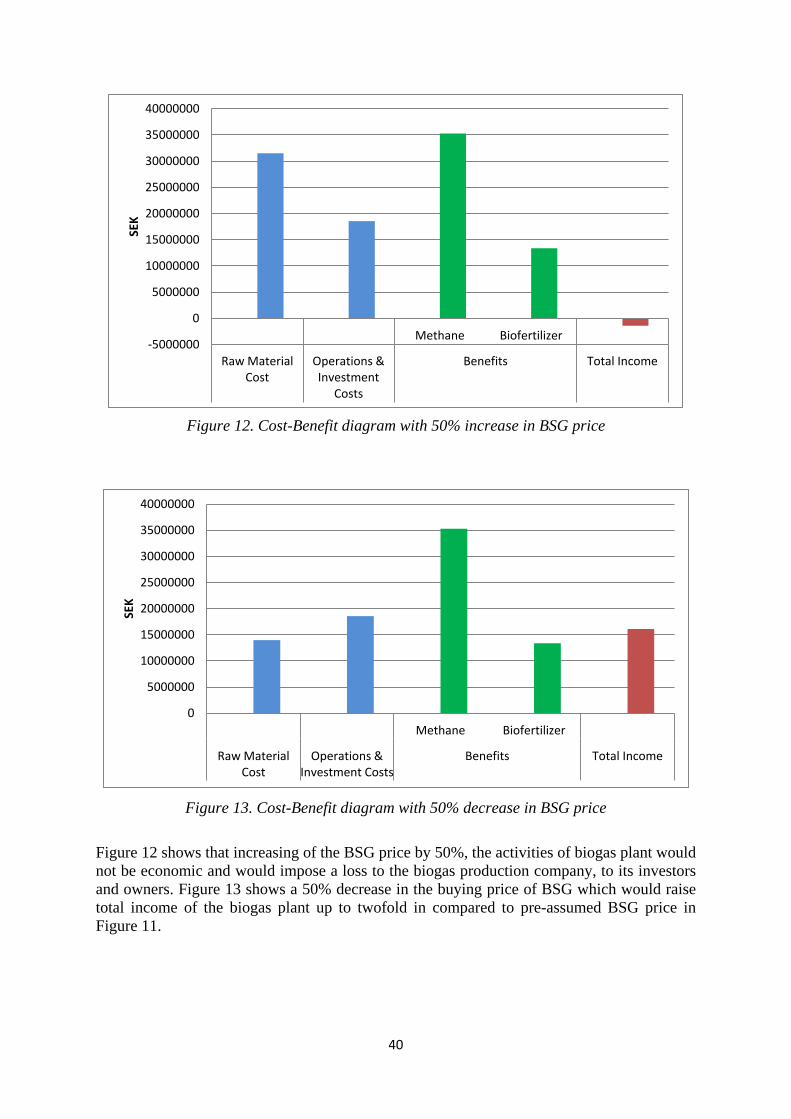
40
Figure 12. Cost-Benefit diagram with 50% increase in BSG price
Figure 13. Cost-Benefit diagram with 50% decrease in BSG price
Figure 12 shows that increasing of the BSG price by 50%, the activities of biogas plant would not be economic and would impose a loss to the biogas production company, to its investors and owners. Figure 13 shows a 50% decrease in the buying price of BSG which would raise total income of the biogas plant up to twofold in compared to pre-assumed BSG price in Figure 11.
-5000000
0
5000000
10000000
15000000
20000000
25000000
30000000
35000000
40000000
Methane Biofertilizer
Raw Material Cost
Operations & Investment
Costs
Benefits Total Income
SEK
0
5000000
10000000
15000000
20000000
25000000
30000000
35000000
40000000
Methane Biofertilizer
Raw Material Cost
Operations & Investment Costs
Benefits Total Income
SEK
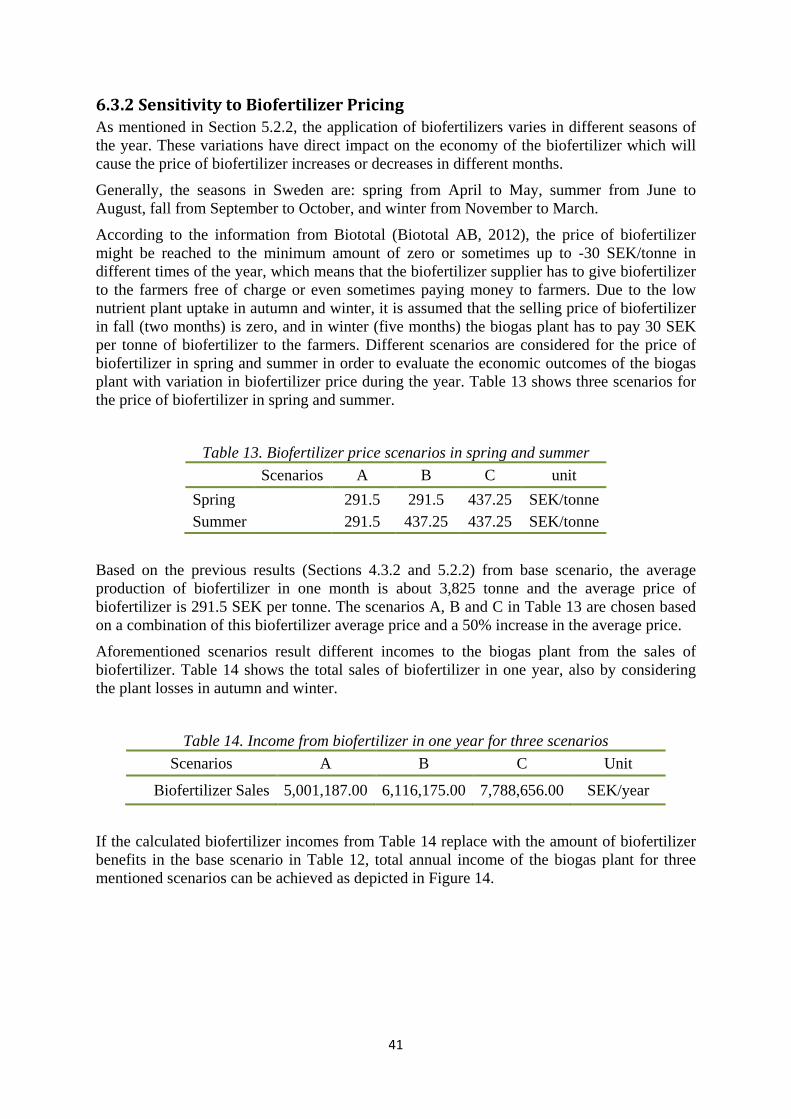
41
6.3.2 Sensitivity to Biofertilizer Pricing As mentioned in Section 5.2.2, the application of biofertilizers varies in different seasons of the year. These variations have direct impact on the economy of the biofertilizer which will cause the price of biofertilizer increases or decreases in different months.
Generally, the seasons in Sweden are: spring from April to May, summer from June to August, fall from September to October, and winter from November to March.
According to the information from Biototal (Biototal AB, 2012), the price of biofertilizer might be reached to the minimum amount of zero or sometimes up to -30 SEK/tonne in different times of the year, which means that the biofertilizer supplier has to give biofertilizer to the farmers free of charge or even sometimes paying money to farmers. Due to the low nutrient plant uptake in autumn and winter, it is assumed that the selling price of biofertilizer in fall (two months) is zero, and in winter (five months) the biogas plant has to pay 30 SEK per tonne of biofertilizer to the farmers. Different scenarios are considered for the price of biofertilizer in spring and summer in order to evaluate the economic outcomes of the biogas plant with variation in biofertilizer price during the year. Table 13 shows three scenarios for the price of biofertilizer in spring and summer.
Table 13. Biofertilizer price scenarios in spring and summer Scenarios A B C unit
Spring 291.5 291.5 437.25 SEK/tonne Summer 291.5 437.25 437.25 SEK/tonne
Based on the previous results (Sections 4.3.2 and 5.2.2) from base scenario, the average production of biofertilizer in one month is about 3,825 tonne and the average price of biofertilizer is 291.5 SEK per tonne. The scenarios A, B and C in Table 13 are chosen based on a combination of this biofertilizer average price and a 50% increase in the average price.
Aforementioned scenarios result different incomes to the biogas plant from the sales of biofertilizer. Table 14 shows the total sales of biofertilizer in one year, also by considering the plant losses in autumn and winter.
Table 14. Income from biofertilizer in one year for three scenarios Scenarios A B C Unit
Biofertilizer Sales 5,001,187.00 6,116,175.00 7,788,656.00 SEK/year
If the calculated biofertilizer incomes from Table 14 replace with the amount of biofertilizer benefits in the base scenario in Table 12, total annual income of the biogas plant for three mentioned scenarios can be achieved as depicted in Figure 14.
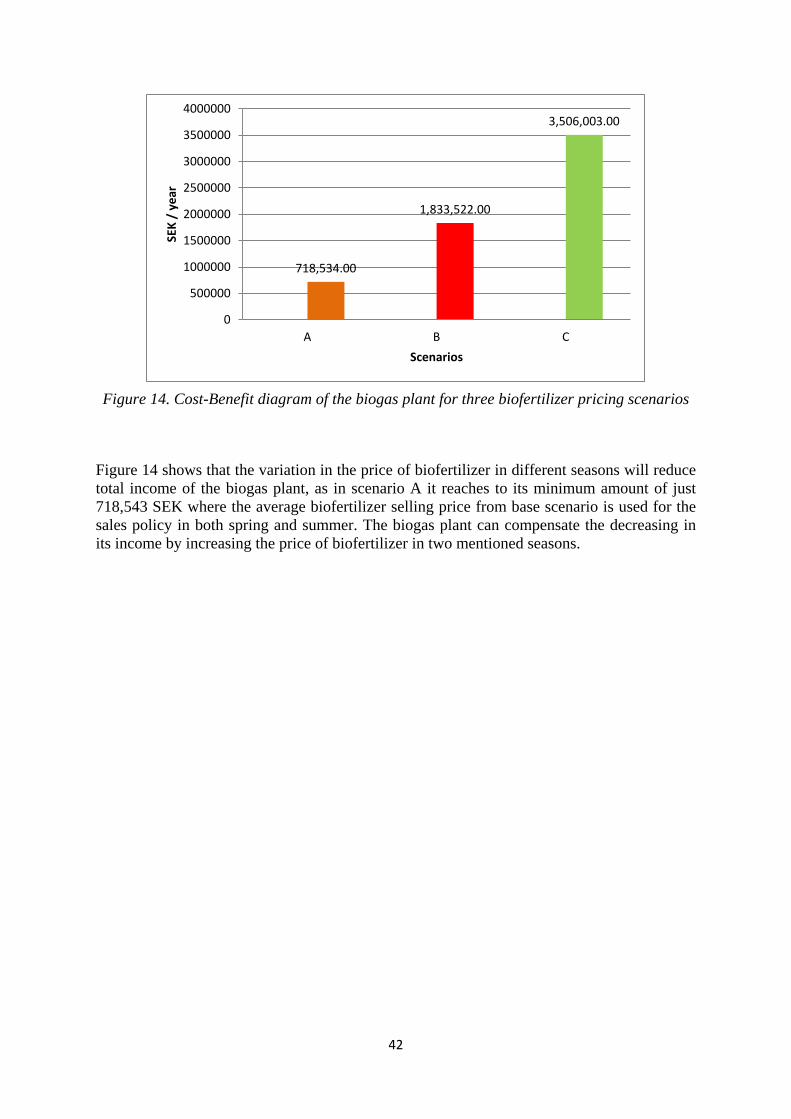
42
Figure 14. Cost-Benefit diagram of the biogas plant for three biofertilizer pricing scenarios
Figure 14 shows that the variation in the price of biofertilizer in different seasons will reduce total income of the biogas plant, as in scenario A it reaches to its minimum amount of just 718,543 SEK where the average biofertilizer selling price from base scenario is used for the sales policy in both spring and summer. The biogas plant can compensate the decreasing in its income by increasing the price of biofertilizer in two mentioned seasons.
718,534.00
1,833,522.00
3,506,003.00
0
500000
1000000
1500000
2000000
2500000
3000000
3500000
4000000
A B C
SEK
/ ye
ar
Scenarios

43
Chapter 7. Discussion This thesis work was intended to conduct a better understanding of the concept of upcycling in an industrial biogas process, and to know how it can contribute to the sustainable development of its surrounding environment.
Nowadays world is confronting the problem of depletion of its natural resources. According to Wall (2010), one solution which leads the world toward sustainable development is to save nature’s capital. This imposes new ways to increase the capital of nature instead of exploiting it (Wall, 2010). This thesis has studied the handling of an organic by-product of brewing industry, i.e. Brewer’s Spent Grain (BSG), to produce biomethane as a renewable energy which can be substituted for the fossil fuels such as natural gas or petrol, to minimize the consumption’s rate of nature’s capital.
Martin and Eklund (2011) have stated that biogas systems can be seen as “upcycling tenants” in the industrial symbiosis concept which can improve the environmental performance of involved industries and give further value (Martin and Eklund, 2011). However, this thesis study perceived the term “value” not only by its common definition in economy but also from the thermodynamics point of view. The studied biogas plant in this report acts as an “Upcycler” which can add value to the input raw materials by means of the increasing of exergy and creating economic benefits.
In order to complete the discussion in this section, the following parts will answer research questions concerning exergy and economic analysis and the sustainability of the system under study.
7.1 Exergy Analysis The exergy analysis of the BIOLIU biogas plant investigates how the quality of the materials changes during anaerobic digestion. The input substrate, brewer’s spent grain with the calculated exergy of 78,320 MJ converts to biomethane (CH4) and biofertilizer with the exergy amounts of 47,430 MJ and 37,026 MJ respectively. However, the biomethane is esteemed as the main product from the biogas plant, but the biofertilizer is the by-product of production process which is accounted as another useful product with applications in agricultural industry. The summation of the exergy of useable outputs (84,456 MJ) proves that the quality of the input material is upgraded through the biogas system. The ratio between the useful exergy and the input exergy is calculated 99.60% as the exergetic efficiency of the biogas production system.
In other similar exergy analyses study of biofuels, it has been reported that the exergy of a substance can be used as a means of material quality. Talens et al. (2007) reported that the quality of used cooking oil (30,367 MJ) may be upgraded during the production of biodiesel (31,349 MJ).
As Ayres et al. (2001) have claimed, exergy is the most suitable indicator for the accounting of resources (Ayres et al., 2001). The increasing of the exergy of the system in this study demonstrates that the system goes toward order by decreasing its entropy which results decreasing the dissipation of materials. Though, every production and consumption process inevitably generates unwanted by-products and wastes (Ayres, 1998), exergy analysis can express the degree of usefulness of the system for surrounding environment and also for comparing it with other systems. Brewer’s spent grain has applications as animal feed (Ben
44
Hamed et al., 2011) or as alternative fuel to produce heat and electricity through combustion (Enweremadu et al., 2008). These applications can be examined from the exergy viewpoint to understand the best usage of BSG in an industrial cluster. The use of BSG to produce biogas and biofertilizer seems a promising method which generates further exergy value.
7.2 Economic Assessment The economics of biogas production system cannot be compared with the economics of other energy production systems directly, because the anaerobic digestion is often applied to address more issues than the demand for just an energy carrier. Anaerobic digestion can be used to cope with legal requirements such as prohibition of organic wastes landfilling in order to reduce the environmental impacts of waste management strategies or to supply a good bio-fertilizer to substitute for mineral fertilizers (Berglund, 2006). Anaerobic digestion is an alternative waste management system since the landfilling of organic wastes has been banned in Sweden.
In addition to the exergy analysis, the economic aspect of the biogas plant is another face of the usefulness of the system in term of “value”. In the economy, the difference between production costs and sales price of a manufactured product is defined as value added per unit of the product. In this thesis work, in the economic evaluation of the BIOLIU biogas system, the by-product of beer production alone, with assumed price of 350 SEK/tonne, could create value and bring more than 9 million SEK/year profit for the biogas plant. The sensitivity analysis to BSG price in Section 6.3.1 showed that the price of input substrate has great importance in the profitability of the production process and can drastically influence the economic benefit. A 50% decrease or increase of the price of BSG, may double the profit of the biogas plant or even make it go bust. Further, the sensitivity analysis to biofertilizer in Section 6.3.2 demonstrated that the variation in the price of biofertilizer in different months of the year will impact on the incomes of the biogas plant.
In the economic analysis of a biogas plant, the transportation cost is a relevant item. However, obviously it would not be a rational thought to consume the fossil fuels in long distance transport of the raw materials in order to produce biogas as vehicle fuel to use it once again for transportation purposes. Some authors point the maximum economic distance of 15-25 km for transportation of feedstock (Gebrezgabher et al., 2010). Also, as mentioned in Chapter 1, a biogas plant can take benefit of the symbiotic network which has possibility to minimize the transportation and its related costs.
Another matter that relates to the economy of a biogas plant is the market price of fossil fuels. Increasing the price of petrol may cause an inevitable increase in the biofuels prices too; this will bring more economic benefits to the biogas plant.
7.3 Sustainability and Biogas Production from By-products According to Norde (1997), in a thermodynamic world view, increasing the exergy, or in other words decreasing the entropy will preserve the life on earth as long as possible, as the ultimate aim of a real sustainable development (Norde, 1997); by contrast Bakshi and Fiksel (2003) indicates that the exergy/entropy change alone is not enough to portray the sustainability (Bakshi and Fiksel, 2003).
45
In this thesis, results of the exergy analysis demonstrated that the total exergy of useful outputs, methane and biofertilizer, increased compared to the calculated exergy of input raw material. According to Wall (1977) a system, such as biogas production, is sustainable if its total exergy generation is more than total exergy it takes from the surrounding system (Wall, 1977).
By looking into the results from exergy analysis and economic evaluation in this thesis work, it could be ensued that the production of biogas from by-products of brewing industry leads the system toward sustainability; however believing sustainability of a system is not a concept to be measured or evaluated by just limited number of factors is also important. Achieving sustainability is a challenging task which needs to cross different fields and disciplines, a holistic system view that incorporate social, environmental and economic aspects of the activities. For example, the iron ore extracted from the earth’s crust has an exergy of 1412 MJ, however during the steel production process, it is upgraded with the exergy amount of 6750 MJ (Ayres and Ayres, 1999). On the other hand, obviously the economic value of produced steel is more than just its ore; but it would not be easy to say that the steel production system is a sustainable activity by addressing just the increase in exergy and economic value. The environmental impacts of the process, for example, must be taken into account. Exergy loss in production processes can be indicated on the dissipation of energy or material which can be translated to the associated environmental impacts. However, in this report the environmental impact of the biogas plant based on the exergy analysis is excluded from the study.
Nonetheless, the important point about biogas which makes it different from other energy sources is that the biogas is a renewable energy and can be counted as sustainable energy source.
Exergy analysis and economic evaluation can be used as the sustainability indicators but other aspects must be taken into account for the measurement of the sustainability of a system or a process.
46
Chapter 8. Conclusion
The world is facing depletion of fossil fuel resources and the contributed environmental impacts of their consumption. To overcome these problems and to move toward sustainability, biofuels have potential for development among other alternative solutions.
The aim of this thesis has been to study the exergy analysis and the economic evaluation of an imaginary biogas plant which produces upgraded biogas, i.e. biomethane, from the by-product of brewing industry called as Brewer’s Spent Grain (BSG), to know how the studied biogas production system creates value. The contributions of the exergy analysis and the economic evaluation as indicators into the sustainability of the biogas system have also been investigated.
Exergy analysis of the studied biogas plant showed that the exergy of input BSG with the amount of 78,320 MJ has increased to 84,456 MJ by converting into biomethane (47,430 MJ) and biofertilizer (37,026 MJ) as two useful products of the biogas production system. The raising of the exergy of the system proves that the quality of the input BSG is increased through anaerobic digestion process.
The results of economic evaluation indicated that using the by-product of brewing process, i.e. BSG, to produce biomethane and biofertilizer had economic benefit to the biogas plant. However, the profit of the biogas plant is very sensitive to the price of BSG. A 50% decrease in the price of BSG makes about 80% increase in the total profit of the biogas system, but increasing the price of BSG by 50% will impose a loss to the economy of the biogas plant. Further, due to the variation of the biofertilizer price among different seasons, the annual benefit of the biogas plant may reduce.
Both exergy and economic analysis of the studied biogas plant showed an increase in the quality and the value of the input BSG. These two mentioned assessments are illustrated that how the biogas plant create value from the thermodynamic and economic point of view, and showed how the biogas plant acts as an “upcycler”.
Exergy analysis and economic evaluation can be used as indicators to measure the sustainability of a system, but the sustainability of a system depends on the other factors such as social and environmental aspects of the system. It should not say that a production system is sustainable just by looking into the increasing of the exergy and economic value.
47
References Aliyu, S., Bala, M., 2011. Brewer’s spent grain: A review of its potentials and applications. African
Journal of Biotechnology 10, 324–331. Atkins, P.W., 1984. The Second Law, 1st ed. Scientific American Books - W. H. Freeman & Co., New
York. Avfall Sverige, 2008. Den svenska biogaspotentialen från inhemska råvaror. Rapport 2008:02. Avfall
Sverige Utveckling. Avfall Sverige, 2009. Microbiological Handbook for Biogas Plants. Rapport U2009:03. Avfall Sverige
Utveckling. Swedish Gas Centre Report 207. Ayres, R.U., 1989. Industrial Metabolism, InTechnology and Environment. National Academies Press,
Washington DC. Ayres, R.U., 1998. Eco-thermodynamics: economics and the second law. Ecological Economics 26,
189–209. Ayres, R.U., Ayres, L.W., 1998. Accounting for Resources, 1: Economy-Wide Applications of Mass-
Balance Principles to Materials and Waste. Edward Elgar Publishing Limited, Cheltenham,UK. Ayres, R.U., Ayres, L.W., 1999. Accounting for Resources, 2: The Life Cycles of Materials. Edward
Elgar Publishing Limited, Cheltenham,UK. Ayres, R.U., Martinas, K., Ayres, L.W., 1996. Eco-thermodynamics : exergy and life cycle analysis.
Working Paper 96/04/EPS, INSEAD, Fontainebleau, France. Ayres, R.U., Masini, A., Ayres, L.W., 2001. An Application of Exergy Accounting to Five Basic Metal
Industries. INSEAD, Fontainebleau, France. Bakshi, B.R., Fiksel, J., 2003. The quest for sustainability: Challenges for process systems engineering.
AIChE Journal 49, 1350–1358. Battino, R., Wood, S., 1968. Thermodynamics: an introduction. Academic Press, New York. Baumgärtner, S., Dyckhoff, H., Faber, M., Proops, J., Schiller, J., 2003. Joint Production. International
Society for Ecological Economics. Ben Hamed, U., Seddighi, H., Thomas, K., 2011. Economic returns of using brewery’s spent grain in
animal feed. World Academy of Science, Engineering & Technology 74, 701–704. Benjaminsson, J., Goldschmidt, B., Uddgren, R., 2010. Optimal integration of energy at the Combined
Energy Plant in Norrköping - Integration of steam, hot water and district heat to biogas plants (Rapport 1149). VÄRMEFORSK Service AB, Stockholm.
Bent, H.A., 1965. The Second Law: An Introduction to Classical and Statistical Thermodynamics.
Oxford University Press, USA.
48
Berglund, M., 2006. Biogas Production from a Systems Analytical Perspective (Doctoral Dissertation). Department of Technology and Society, Environmental and Energy Systems Studies, Lund University, Lund, Sweden.
Berglund, M., Börjesson, P., 2006. Assessment of energy performance in the life-cycle of biogas
production. Biomass and Bioenergy 30, 254–266. Biototal AB, 2012. Biototal AB Homepage. <www.biototal.se> Accessed January 2012 Brundtland, G.H., 1987. Our Common Future. Oxford University Press, Oxford. Cengel, Y., Boles, M., 2006. Thermodynamics: An Engineering Approach, 6th ed. McGraw-Hill, New
York. Chertow, M.R., 2000. Industrial Symbiosis: Literature and Taxonomy. Annual Review of Energy and
the Environment 25, 313–337. Clausius, R., 1879. The mechanical theory of heat, 2nd ed. Macmillan, London. Commission on Oil Independence, 2006. Making Sweden an Oil-Free Society. Stockholm, Sweden Connelly, L., Koshland, C.P., 1997. Two aspects of consumption: using an exergy-based measure of
degradation to advance the theory and implementation of industrial ecology. Resources, Conservation and Recycling 19, 199–217.
Daly, H.E., 1996. Beyond Growth: The Economics of Sustainable Development. Beacon Press books,
Boston. Dewulf, J., Van Langenhove, H., Muys, B., Bruers, S., Bakshi, B.R., Grubb, G.F., Paulus, D.M., Sciubba,
E., 2008. Exergy: Its Potential and Limitations in Environmental Science and Technology. Environ. Sci. Technol. 42, 2221–2232.
Dewulf, J., Langenhove, H.V. (Eds.), 2006. Renewables-Based Technology: Sustainability Assessment,
1st ed. John Wiley & Sons Ltd, West Sussesx, England. EC Directive 2009/28/EC of the European Parliament and of the Council of 23 April 2009 on the
Promotion of the Use of Energy from Renewable Sources and Amending and Subsequently Repealing Directives 2001/77/EC and 2003/30/EC
Enweremadu, C.C., Waheed, M.A., Adekunle, A.A., Adeala, A., 2008. The energy potential of
brewer’s spent grain for breweries in Nigeria. JEAS - Journal of Engineering & Applied Sciences 3, 175–177.
Ericsson, K., 2009. Introduction and development of the Swedish district heating systems (D5 of WP2
from the RES-H Policy project). Lund University, Lund, Sweden. Eriksson, R., Andersson, J.O., 2010. Elements of Ecological Economics. Taylor & Francis, New York.

49
Forssell, P., Kontkanen, H., Schols, H.A., Hinz, S., Eijsink, V.G.H., Treimo, J., Robertson, J.A., Waldron, K.W., Faulds, C.B., Buchert, J., 2008. Hydrolysis of Brewer’s Spent Grain by Carbohydrate Degrading Enzymes. Journal of the Institute of Brewing. Institute of Brewing (Great Britain) 114, 306–314.
Garcia, S.G., 2005. Farm scale anaerobic digestion integrated in an organic farming system. JTI-
rapport 34. Swedish Institute of Agricultural Engineering. Uppsala, Sweden. Gebrezgabher, S.A., Meuwissen, M.P.M., Prins, B.A.M., Lansink, A.G.J.M.O., 2010. Economic analysis
of anaerobic digestion—A case of Green power biogas plant in The Netherlands. NJAS - Wageningen Journal of Life Sciences 57, 109–115.
Geiser, K., 2001. Materials Matter: Toward a Sustainable Materials Policy, 1st ed. The MIT Press,
Cambridge. Georgescu-Roegen, N., 1971. The Entropy Law and the Economic Process. Harvard University Press,
Harvard. Graedel, T.E., Allenby, B.R., 2003. Industrial Ecology, 2nd ed. Prentice Hall, PearsonEducation Inc.
Upper Saddle River, New Jersey. Haynie, D.T., 2001. Biological Thermodynamics, 1st ed. Cambridge University Press, Cambridge. Held, J., Mathiasson, A., Nylander, A., 2008. Biogas from manure and waste products - Swedish case
studies. Svenska Gasföreningen, Stockholm, Sweden. Hill, J., 2006. Environmental, economic, and energetic costs and benefits of biodiesel and ethanol
biofuels. PROC NAT ACAD SCI U S A 103, 11206–11210. Honkasalo, A., 1998. Entropy, exergy and steady-state economy. Sustainable Development 6, 130 –
142. Hornbogen, E., 2003. A definition of sustainability based on entropy production by matter and
energy. Metall 57, 124–128. Huotari, J., Walsh, R., Helkilinna, K., 2008. A new biofuel - spent grain. WÄRTSILÄ TECHNICAL
JOURNAL, Twentyfour7, in detail. issue no.02, 20–24. Institute of Human Thermodynamics, 2012. <http://www.humanthermodynamics.com/2nd-Law-
Variations.html> Accessed January 2012. Jowsey, E., 2007. A new basis for assessing the sustainability of natural resources. Energy 32, 906–
911. Karellas, S., Boukis, I., Kontopoulos, G., 2010. Development of an investment decision tool for biogas
production from agricultural waste. Renewable and Sustainable Energy Reviews 14, 1273–1282.
Karlsson, M., Wolf, A., 2008. Using an optimization model to evaluate the economic benefits of
industrial symbiosis in the forest industry. Journal of Cleaner Production 16, 1536–1544.
50
Lems, S., Van Der Kooi, H.J., De Swaan Arons, J., 2004. Thermodynamics and the feasibility of sustainable technology Use and abuse of the second law. AIChE Annual Meeting, Conference Proceedings , pp. 53-59
Lukehurst, C.T., Frost, P., Al Seadi, T., 2010. Utilisation of digestate from biogas plants as biofertiliser.
<http://www.iea-biogas.net/_download/Digestate_Brochure_Revised_12-2010.pdf> Accessed December 2011.
Lundqvist, P., 2009. District heating for increased biogas production (Rapport 1122). VÄRMEFORSK
Service AB, Stockholm. Martin, M., 2010. Industrial Symbiosis for the development of Biofuel Production, PhD Dissertation
No. 1441. Linköping University, Department of Management and Engineering, Environmental Technique and Management, Linköping, Sweden.
Martin, M., Eklund, M., 2011. Improving the environmental performance of biofuels with industrial
symbiosis. Biomass and Bioenergy 35, 1747–1755. McDonough, W., Braungart, M., 2002. Cradle to Cradle: Remaking the Way We Make Things, 1. ed.
North Point Press, New York. McMahon, G.F., Mrozek, J.R., 1997. Economics, entropy and sustainability. Hydrological Sciences
Journal 42, 501–512. Murphy, J.D., McCarthy, K., 2005. The optimal production of biogas for use as a transport fuel in
Ireland. Renewable Energy 30, 2111–2127. Mussatto, S.I., Dragone, G., Roberto, I.C., 2006. Brewers’ spent grain: generation, characteristics and
potential applications. Journal of Cereal Science 43, 1–14. Norde, W., 1997. Energy and entropy: a thermodynamic approach to sustainability. The
Environmentalist 17, 57–62. Nordic Energy Perspectives, 2009. The Future of Nordic District Heating - A First Look at District Heat
Pricing and Regulation. Oslo. O’Rourke, D., Connelly, L., Koshland, C.P., 1996. Industrial ecology: a critical review. International
Journal of Environment and Pollution 6, 89 – 112. Onwosi, C.O., Okereke, G.U., 2009. Effect of water dilution and nutrient supplements on biogas
production from brewers spent grain, in: Current Research Topics in Applied Microbiology and Microbial Biotechnology: Proceedings of the II International Conference on Environmental, Industrial and Applied Microbiology (BioMicroWorld2007). World Scientific Publishing, Singapore, pp. 232–235.
Rifkin, J., 1980. Entropy: A New World View. The Viking Press, New York. Senge, P.M., 1990. The Fifth Discipline: The Art and Practice of the Learning Organization, 1. uppl.
ed. Doubleday/Currency, New York.
51
Sežun, M., Grilc, V., Logar, R.M., 2010. Anaerobic Digestion of Mechanically and Chemically Pretreated Lignocellulostic Substrate. CISA, Environmental Sanitary Engineering Center, Third International Symposium on Energy from Biomass and Waste, Venice, Italy.
Sežun, M., Grilc, V., Zupancic, G.D., Logar, R.M., 2011. Anaerobic digestion of brewery spent grain in
a semi-continuous bioreactor: Inhibition by phenolic degradation products. ACTA CHIM SLOV 58, 158–166.
Smith, J.M., Ness, H.V., Abbott, M., 2005. Introduction to Chemical Engineering Thermodynamics,
7th ed. McGraw-Hill, New York. Stojceska, V., Ainsworth, P., Plunkett, A., İbanoglu, S., 2008. The recycling of brewer’s processing
by-product into ready-to-eat snacks using extrusion technology. Journal of Cereal Science 47, 469–479.
Swedish Gas Center, 2007. Basic data on biogas.
<http://www.sgc.se/dokument/BiogasfolderengA5.pdf> Accessed January 2012 Szargut, J., 2005. Exergy Method: Technical and Ecological Applications. WIT Press, UK. Szargut, J., Morris, D.R., Steward, F.R., 1988. Exergy analysis of thermal, chemical, and metallurgical
processes. Hemisphere Publishing Corporation, New York. Talens Peiró, L., 2009. Exergy Analysis of Biofuels, Doctoral Thesis. Universitat Autònoma de
Barcelona. Institut de Ciència i Tecnologia Ambientals, Bellaterra. Talens Peiró, L., Méndez, G.V., Durany, X.G. i, 2008. Exergy Analysis of Integrated Waste
Management in the Recovery and Recycling of Used Cooking Oils. Environ. Sci. Technol. 42, 4977–4981.
Talens Peiró, L., Villalba, G., Gabarrell, X., 2007. Exergy analysis applied to biodiesel production.
Resources, Conservation and Recycling 51, 397–407. The American Heritage, 2012. <http://dictionary.reference.com/browse/entropy?s=t> Accessed
January 2012 Wall, G., 1977. Exergy - a useful concept within resource accounting. Institute of Theoretical Physics,
Chalmers University, Göteborg, Sweden. Wall, G., 2010. On Exergy and Sustainable Development in Environmental Engineering. The Open
Environmental Engineering Journal 3, 21–32. Wolf, A., 2007. Industrial Symbiosis in the Swedish Forest Industry, PhD Dissertation No. 1133.
Linköping University, Department of Management and Engineering, Environmental Technique and Management, Linköping, Sweden.
Wolf, A., Karlsson, M., 2008. Evaluating the environmental benefits of industrial symbiosis:
discussion and demonstration of a new approach. Progress in Industrial Ecology, an International Journal 5, 502–517.

52
Young, J.T., 1991. Is the entropy law relevant to the economics of natural resource scarcity? Journal of Environmental Economics and Management 21, 169–179.
Young, J.T., 1994. Entropy and Natural Resource Scarcity: A Reply to the Critics. Journal of
Environmental Economics and Management 26, 210–213. Zanker, G., Kepplinger, W., Pecher, C., 2007. Incineration of solid food waste: a project about spent
grain, in: Utilization of By-Products and Treatment of Waste in the Food Industry. Springer, New York.