Embed Size (px)
Citation preview
Ernesta Varapnickaite
T6614KA
BIOGAS PLANT IN MUAS
Bachelor’s Thesis Building Services Engineering
January 2015
DESCRIPTION
Date of the bachelor's thesis
04.02.2015
Author(s)
Ernesta Varapnickaite
Degree programme and option
Double Degree in Building Services Engineering
Name of the bachelor's thesis
Biogas plant in MUAS
Abstract Every year we produce about 3% more waste than the year before. This might not sound much but if
we carry on at this rate, it means that we will double the amount of waste we produce every 25 years.
Nowadays, when the whole world is trying to move to completely renewable energy sources, waste
could probably play particulary important role, especially in biogas plants.
The first and the most important aim is to find out if it is profitable to build a biogas plant in MUAS.
Biogas plant has already proved that it is efficient way to use waste and make additional energy for
heating and electricity. However in MUAS we have limited amount of biowaste so I will investigate
how much energy would ir be possible to get. The second aim is to learn what is the best way to use
the energy from the plant – if it should be used in all buildings for electricity and heating or just for one
(A)-building.
In order to find the answers I will use the following methods. First of all I will collect data from
restaurants about the amount of biowaste each day. The second method will be calculations of possible
amount of energy. The next method is examination of biogas plant working technically. The last method
is to get acquainted with biogas plant types, components of biogas and understand the work process of
biogas plant.
Subject headings, (keywords)
Biomass, renewable energy, biogas, biogas plant Pages Language URN
30
English
Remarks, notes on appendices
Tutor
Arola Johana
Employer of the bachelor's thesis
Mikkeli University of Applied Sciences
1 INTRODUCTION ....................................................................................................................... 1
1.1 General overview .................................................................................................................. 1
1.2 Aims ...................................................................................................................................... 2
1.3 Methods ................................................................................................................................ 2
2 RENEWABLE ENERGY IN EUROPE ..................................................................................... 2
2.1 Biomass energy ..................................................................................................................... 5
2.1.1 Biomass resources ......................................................................................................... 6
2.1.2 Biomass properties ........................................................................................................ 7
3 BIOGAS IN EUROPE ................................................................................................................ 7
3.1 Germany ................................................................................................................................ 7
3.1.1 Production of biogas ...................................................................................................... 8
3.1.2 Utilization of biogas ...................................................................................................... 8
3.1.3 Financial support systems .............................................................................................. 8
3.2 Finland .................................................................................................................................. 9
3.2.1 Production of biogas ...................................................................................................... 9
3.2.2 Utilization of biogas .................................................................................................... 10
3.2.3 Financial support systems ............................................................................................ 11
4 BIOGAS PLANT ...................................................................................................................... 11
4.1 Fixed-dome Plants .............................................................................................................. 13
4.1.1 Function ....................................................................................................................... 14
4.1.2 Advantages and disadvantages .................................................................................... 15
4.2 Floating Drum Plants .......................................................................................................... 16
4.2.1 Advantages and disadvantages .................................................................................... 17
4.3 Comparison of various plant designs .................................................................................. 17
5 BIOMASS TO BIOPOWER ..................................................................................................... 19
5.1 Anaerobic Digestion ........................................................................................................... 20
6 BIOGAS PLANT IN MUAS ..................................................................................................... 25

6.1 SWOT analysis ................................................................................................................... 25
7 AMOUNT OF WASTE IN MUAS ........................................................................................... 26
8 CONCLUSION ......................................................................................................................... 28
9 REFERENCES .......................................................................................................................... 30
1
1 INTRODUCTION
1.1 General overview
Every year we produce about 3% more waste than the year before. This might not sound much but if
we carry on at this rate, it means that we will double the amount of waste we produce every 25 years.
Nowadays, when the whole world is trying to move to completely renewable energy sources, waste
could probably play particulary important role, especially in biogas plants.
What if it is possible to get additional energy with waste that we have around us and take one more
step to increase the use of renewable sources? Nowadays our society is still dependent on fossil
sources, but renewable energy sources as biomass, sun or wind could change it faster than anyone
expects. Biogas can not only contribute to the energy balance but also helps to protect environment
from greenhouse effect and preserves natural resources.
Biogas plants are not an absolutely new thing. Each country already tries to increase the number of
biogas plants and in this way achieve the goals of renewable energy directive of final energy
consumption by renewable energy sources. Finland is one of the countries which uses most renewable
energy sources and in 2012 it was 14,1% of gross final energy and now it is already >2% above of
interim target.
In my Bachelor‘s thesis I will analyze how biogas plant works technically – what are the types of
biogas plants, techniques to treat waste and processes during waste treatment. I will also discuss the
advantages and disadvantages of biogas plant, I will try to find out, how much energy it is possible
to get from biogas plant which would be located in Mikkeli University of Applied Science (MUAS)
area, and if we could use the bio-waste thrown from restaurants there.
2
1.2 Aims
This work has several important aims. The first and the most important aim is to find out if it is
profitable to build a biogas plant in MUAS. Biogas plant has already proved that it is efficient way
to use waste and make additional energy for heating and electricity. However in MUAS we have
limited amount of biowaste so I will investigate how much energy would ir be possible to get.
The second aim is to learn what is the best way to use the energy from the plant – if it should be used
in all buildings for electricity and heating or just for one (A)-building.
1.3 Methods
In order to find the answers I will use the following methods. First of all I will collect data from
restaurants about the amount of biowaste each day. The amount will be summed up.
The second method will be calculations of possible amount of energy. This information will be very
important while investigating the answers to other questions, as amount of possible energy, if it would
be enough energy for MUAS or just for A-building.
The next method is examination of biogas plant working technically. This one will help me to get
acquainted with biogas plant types, possible materials to use in biogas plant and after all get familiar
to the typical components of biogas.
The last method is to get acquainted with biogas plant types, components of biogas and understand
the work process of biogas plant.
2 RENEWABLE ENERGY IN EUROPE
Nowadays more and more people and countries are getting closer to green energy and renewable
energy sources, but a lot of them are still loyal to coal, oil and natural gas to fulfill all the energy
needs but reliance on fossil fuels can be a big problem in the future as fossil fuels are finite resource.
3
Fossil fuels also causes air and produces greenhouse effect, however it could be changed easily if all
the world begins to use renewable energy. In this chapter the use of renewable energy sources in
Finland and Europe will be described.
Solar energy
From the solar energy is possible to produce energy for heating, lightning or cooling homes, it could
also be used for electricity and a lot of other industrials processes. To get the benefit from the sun it
is important to install solar panels. However, the efficiency of sun depends on the location. If in the
specific location sun is not shining most of the seasons, other renewable energy sources can be used.
In Finland during the last three years the use of solar energy increased from 13888 MWh to 16666
MWh. /1./
Wind power
Wind power in general is a form of solar power as wind is caused by heat from the sun. This kind of
energy has already been used before to sail ships and drive windmills but nowadays it has been moved
to another level and now wind energy is used by wind turbines and used to generate electricity.
Nowadays wind turbines are installed in the sea, where is bigger potential of the wind, also in high
level locations. To add more, wind power does not have any harmful effect to environment as it do
not produce CO2. In 2009 Finland have made 275000 MWh from wind, and now it is used 483000
MWh. /1./
Water
Water is also renewable energy source as it is all the time recharged by rain cycle. Furthermore,
falling water downstream is the powerfull force. It could be used for generating electricity by water
wheels that drives mechanical processes. Comparing to other renewable energy sources water has the
lowest amount of solid waste during energy production. However, as the number of people in Earth
rapidly increases, there is the chance, that in several centuries there will be a lack of clean water and
it could became a non-renewable source. Finland in 2009 produced 12.5 TWh energy from water,
however in 2012 this number decreased and there is 12.3 TWh of energy produced. /1./
4
Geothermal energy
The heat inside Earth produces steam and hot water that can be used to power generators and produce
electricity, use it for home heating and power generation for industry. Geothermal energy is also
environmental friendly, cost efficient and sustainable. Besides, geothermal energy also has a potential
to reduce greenhouse effect and help to reduce global worming if it will be used more than fossil
fuels. In 2009 Finland produced 2 TWh of energy from geothermal energy. Nowadays geothermal
energy in Finland produces 3.5 TWh of energy. /1./
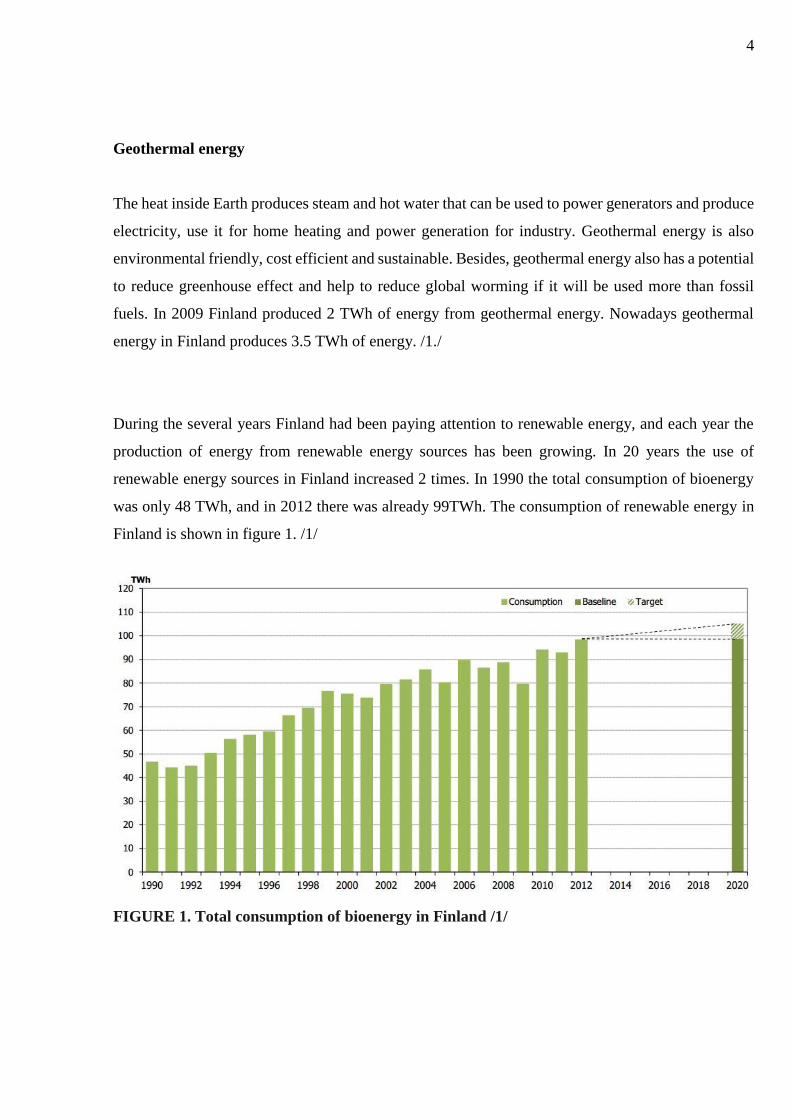
During the several years Finland had been paying attention to renewable energy, and each year the
production of energy from renewable energy sources has been growing. In 20 years the use of
renewable energy sources in Finland increased 2 times. In 1990 the total consumption of bioenergy
was only 48 TWh, and in 2012 there was already 99TWh. The consumption of renewable energy in
Finland is shown in figure 1. /1/
FIGURE 1. Total consumption of bioenergy in Finland /1/
5
2.1 Biomass energy
Biomass was an important source long time ago, people began to use wood for food or worming
themselves before winter chill. Wood is still used not only in industry for example for paper but also
in heating systems. However, there are other sources of biomass energy as food crops, grasses and
other plants as well as agricultural and forest waste and residue, industrial wastes and organic
components from municipal.
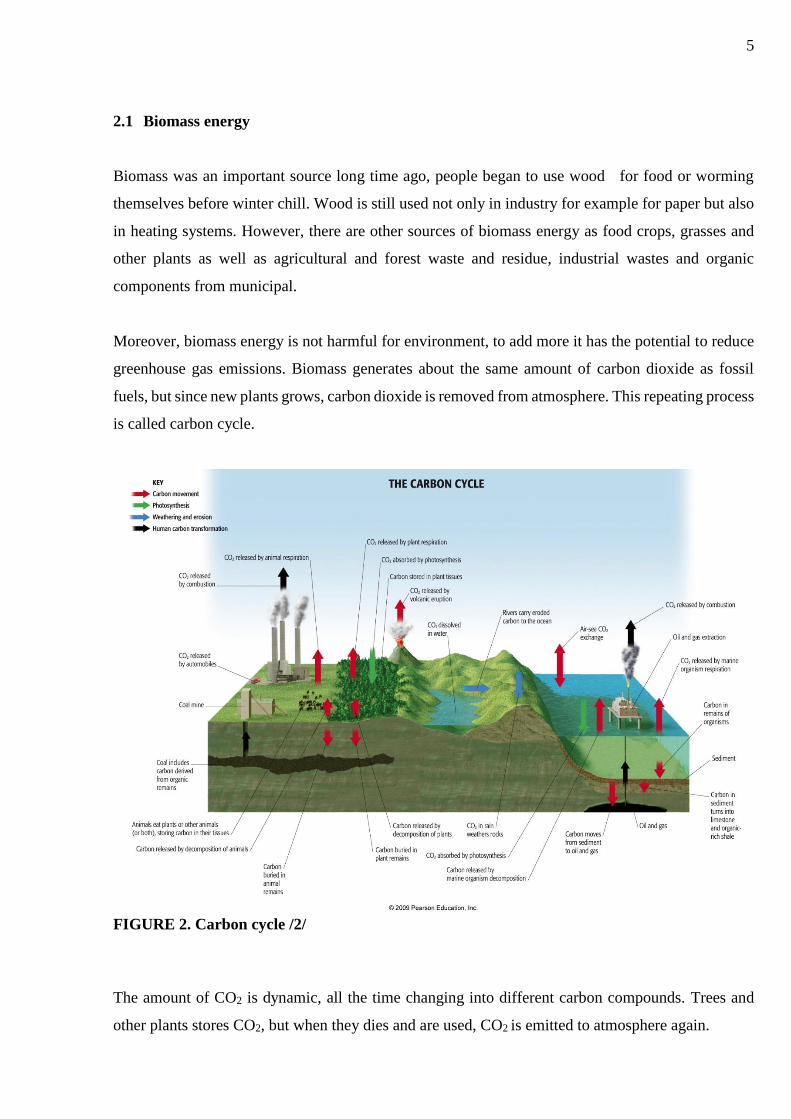
Moreover, biomass energy is not harmful for environment, to add more it has the potential to reduce
greenhouse gas emissions. Biomass generates about the same amount of carbon dioxide as fossil
fuels, but since new plants grows, carbon dioxide is removed from atmosphere. This repeating process
is called carbon cycle.
FIGURE 2. Carbon cycle /2/
The amount of CO2 is dynamic, all the time changing into different carbon compounds. Trees and
other plants stores CO2, but when they dies and are used, CO2 is emitted to atmosphere again.
6
Biomass can also be used in various ways. First of all biomass can be converted to liquid fuels for
transportation. The most common types of biofuels nowadays are ethanol and biodiesel. It is also
possible to burn biomass directly or convert it to gaseous or liquid fuels, and use it for heating or
electricity. The last way to use biomass is to convert it into chemicals for making plastics or other
products.
2.1.1 Biomass resources
Researchers had found the various types of biomass in different ways and then conclude it to four
main types:
Woody plants
Herbaceous plants/grasses
Aquatic plants
Manures
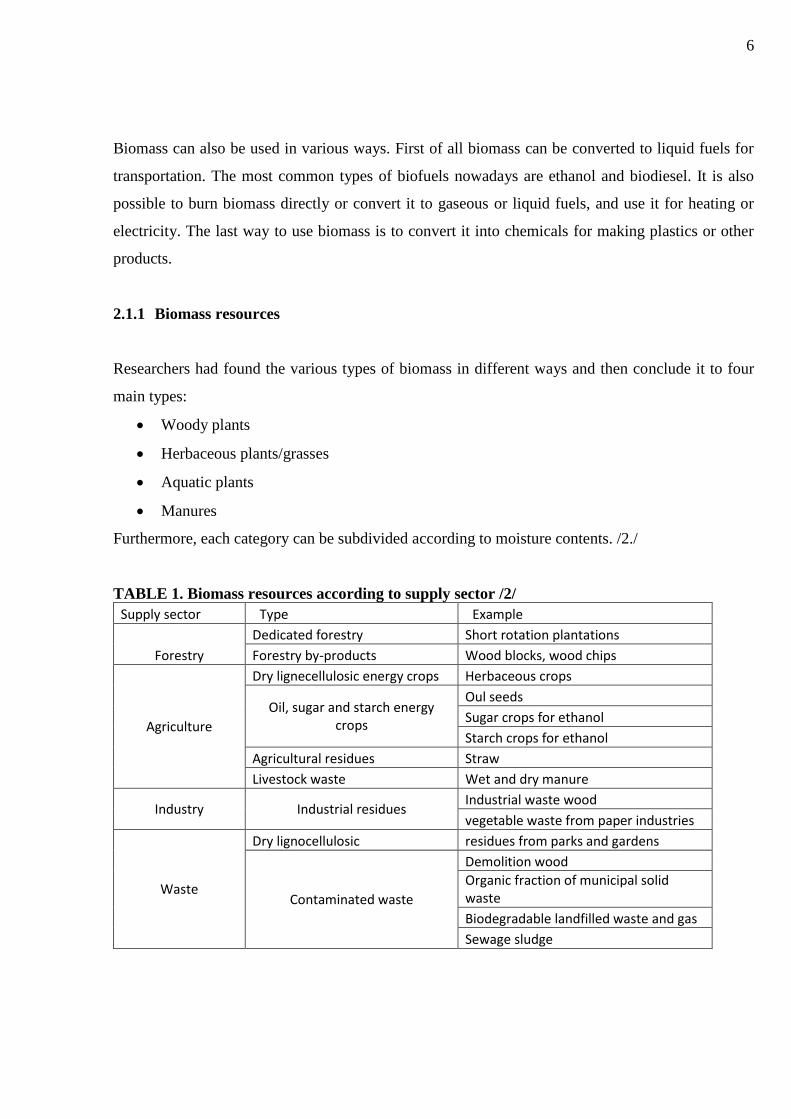
Furthermore, each category can be subdivided according to moisture contents. /2./
TABLE 1. Biomass resources according to supply sector /2/
Supply sector TType EExample
Forestry
Dedicated forestry Short rotation plantations
Forestry by-products Wood blocks, wood chips
Agriculture
Dry lignecellulosic energy crops Herbaceous crops
Oil, sugar and starch energy crops
Oul seeds
Sugar crops for ethanol
Starch crops for ethanol
Agricultural residues Straw
Livestock waste Wet and dry manure
Industry Industrial residues Industrial waste wood
vegetable waste from paper industries
Waste
Dry lignocellulosic residues from parks and gardens
Contaminated waste
Demolition wood
Organic fraction of municipal solid waste
Biodegradable landfilled waste and gas
Sewage sludge
7
2.1.2 Biomass properties
There are specific properties of biomass sources that explains both the choice of conversion process
and difficulties that may appear. The main material properties of interest, during processing as an
energy source, connect to:
Moisture content
Calorific value
Proportions of fixed carbon and volatiles
Ash/residue content
Alkali metal content
Cellulose/lignin ratio.
For dry biomass conversion process these properties are of interest, while for wet biomass conversion,
the first and last properties are primary./3./
3 BIOGAS IN EUROPE
The European Union policy has set the fixed goal to supply 20% energy from renewable energy
sources. To reach this goal biogas can play an important role, as it is possible to make heat, electricity,
vehicle fuel, chemicals or fuels cells from biogas. The most efficient way to integrate biogas into
European energy sectors are to integrate biogas into the natural gas grid. Some of the countries has
already integrated biogases into natural gas grid.
3.1 Germany
Germany is one of the country with mostly developed bioenergy sector, because of that, Germany
has been chosen to compare with Finland. In 2011, The Federal Government of Germany made a
decision to change the energy police and look at renewable energy sources as an opportunity for
future energy production /4/. The Renewable Energy Directive 2009/28/EC made a goal to get 20%
of renewable energy in final energy consumption by 2020.
8
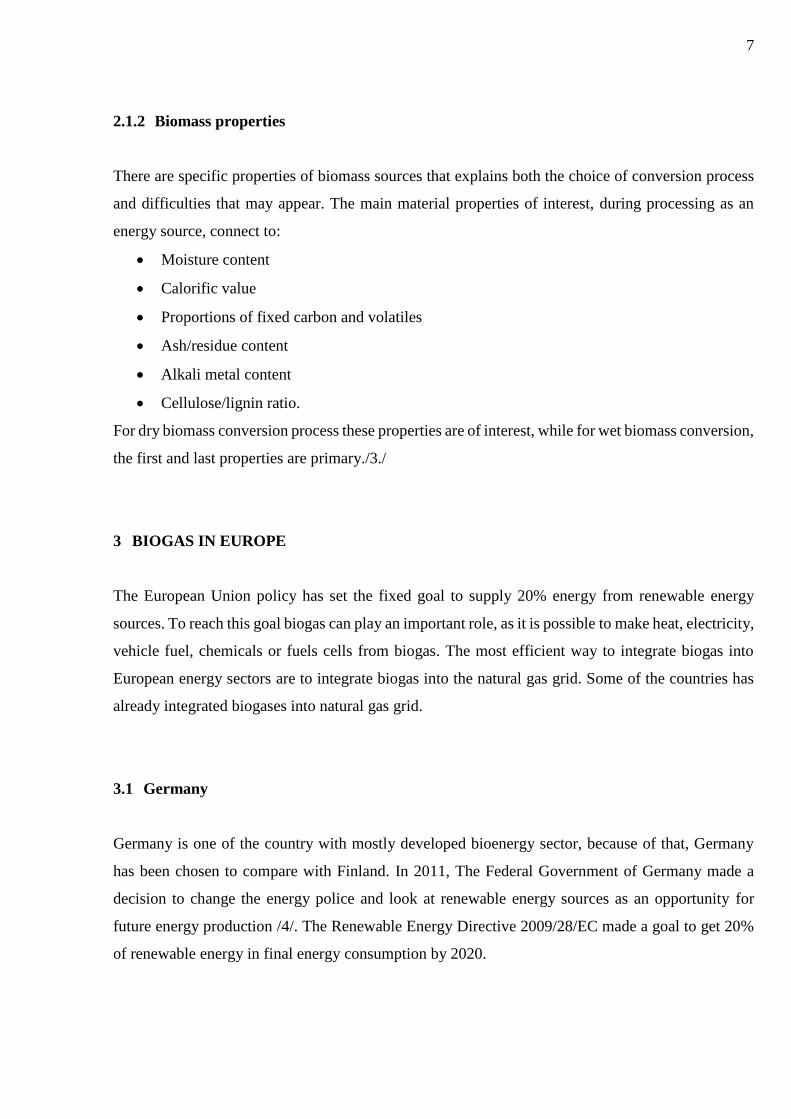
3.1.1 Production of biogas
Most of the biogas plants were built in Germany. In 2013 in there were 710 biogas plants and 610 of
them operated fully with renewable energy sources. Mostly there are plats using agriculture, but also
digest sewage sludge, biowaste, waste from industry and landfills.
TABLE 2. Status of biogas production in Germany from different plants 2012 /4/
Plant type Number of plants Energy production* (GWh/year)
Sewag sludge 1400 3100
Biowaste 95 4500
Agiculture 7800 29400
Industrial 250 3420
Landfils 400 550
Total 9945 40970
*= Produced energy as heat, electricity, vehicle fuel without efficiency losses
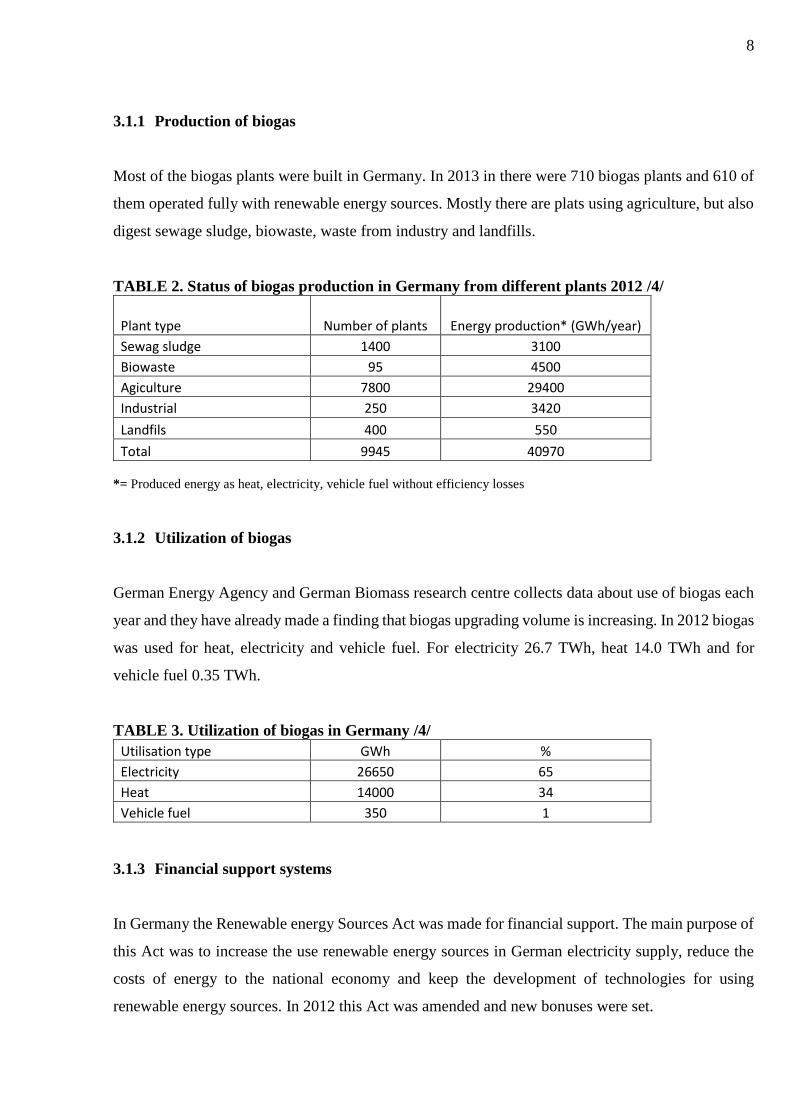
3.1.2 Utilization of biogas
German Energy Agency and German Biomass research centre collects data about use of biogas each
year and they have already made a finding that biogas upgrading volume is increasing. In 2012 biogas
was used for heat, electricity and vehicle fuel. For electricity 26.7 TWh, heat 14.0 TWh and for
vehicle fuel 0.35 TWh.
TABLE 3. Utilization of biogas in Germany /4/
Utilisation type GWh %
Electricity 26650 65
Heat 14000 34
Vehicle fuel 350 1
3.1.3 Financial support systems
In Germany the Renewable energy Sources Act was made for financial support. The main purpose of
this Act was to increase the use renewable energy sources in German electricity supply, reduce the
costs of energy to the national economy and keep the development of technologies for using
renewable energy sources. In 2012 this Act was amended and new bonuses were set.
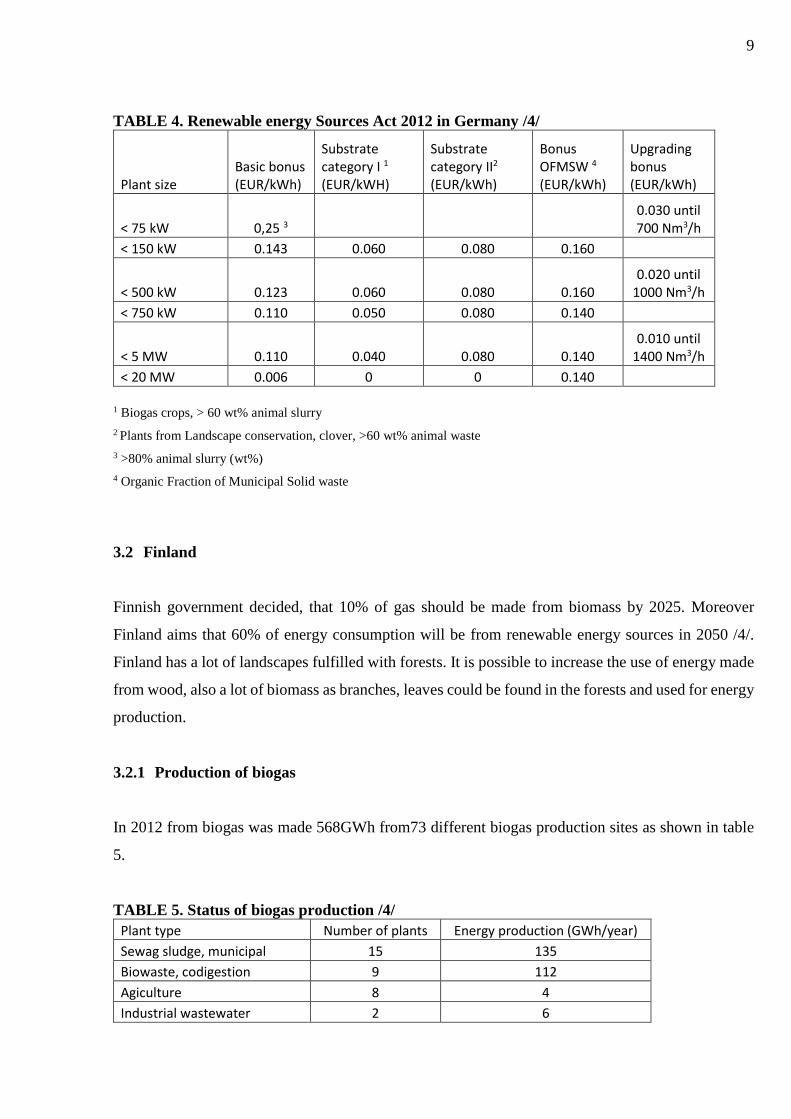
9
TABLE 4. Renewable energy Sources Act 2012 in Germany /4/
Plant size Basic bonus (EUR/kWh)
Substrate category I 1 (EUR/kWH)
Substrate category II2
(EUR/kWh)
Bonus OFMSW 4
(EUR/kWh)
Upgrading bonus (EUR/kWh)
< 75 kW 0,25 3
0.030 until 700 Nm3/h
< 150 kW 0.143 0.060 0.080 0.160
< 500 kW 0.123 0.060 0.080 0.160 0.020 until
1000 Nm3/h
< 750 kW 0.110 0.050 0.080 0.140
< 5 MW 0.110 0.040 0.080 0.140 0.010 until
1400 Nm3/h
< 20 MW 0.006 0 0 0.140
1 Biogas crops, > 60 wt% animal slurry
2 Plants from Landscape conservation, clover, >60 wt% animal waste
3 >80% animal slurry (wt%)
4 Organic Fraction of Municipal Solid waste
3.2 Finland
Finnish government decided, that 10% of gas should be made from biomass by 2025. Moreover
Finland aims that 60% of energy consumption will be from renewable energy sources in 2050 /4/.
Finland has a lot of landscapes fulfilled with forests. It is possible to increase the use of energy made
from wood, also a lot of biomass as branches, leaves could be found in the forests and used for energy
production.
3.2.1 Production of biogas
In 2012 from biogas was made 568GWh from73 different biogas production sites as shown in table
5.
TABLE 5. Status of biogas production /4/
Plant type Number of plants Energy production (GWh/year)
Sewag sludge, municipal 15 135
Biowaste, codigestion 9 112
Agiculture 8 4
Industrial wastewater 2 6
10
Landfils 39 312
Total 73 569
Finland could produce up to 4-6 TWh/year biogas from wastes and manures. In 2012 it was observed
that crops do not play a significant role in renewable energy production. In addition, conclusion has
been made, that forest-based biomass is more economical to raise the use of renewable energy in final
energy production /4/. In the beginning of 2013, about 20 co-digestation plants were under
construction or in planning phase /3/.
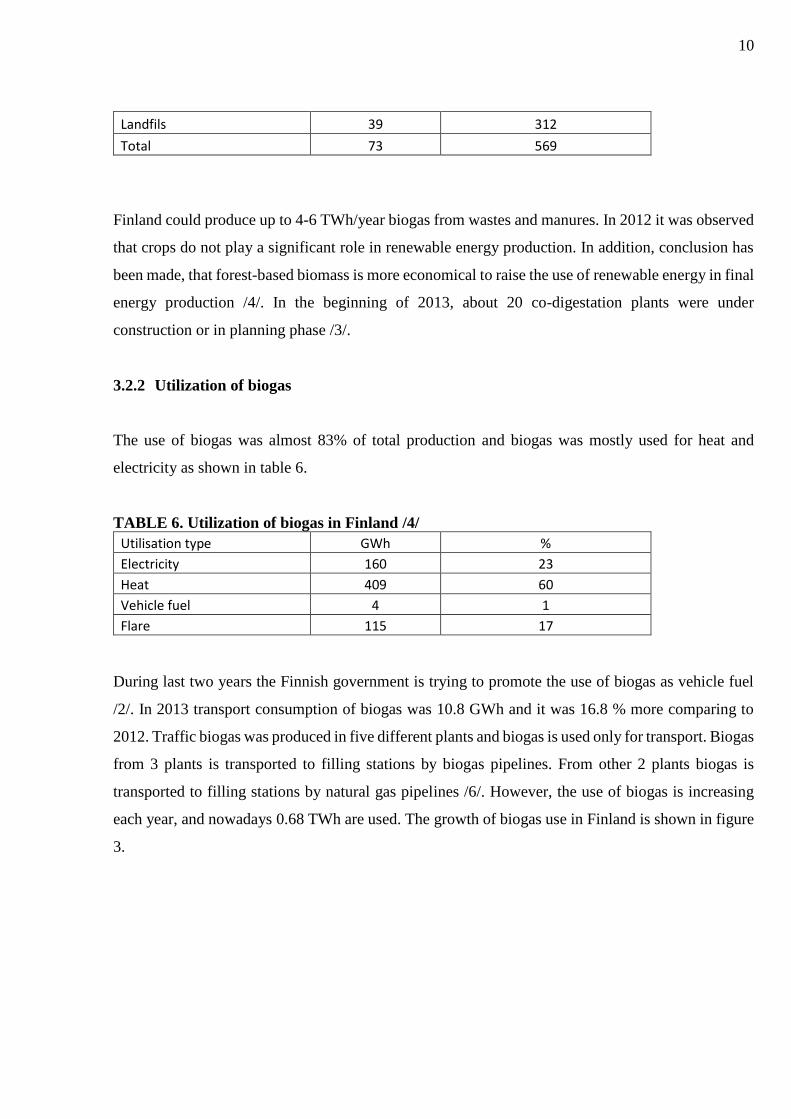
3.2.2 Utilization of biogas
The use of biogas was almost 83% of total production and biogas was mostly used for heat and
electricity as shown in table 6.
TABLE 6. Utilization of biogas in Finland /4/
Utilisation type GWh %
Electricity 160 23
Heat 409 60
Vehicle fuel 4 1
Flare 115 17
During last two years the Finnish government is trying to promote the use of biogas as vehicle fuel
/2/. In 2013 transport consumption of biogas was 10.8 GWh and it was 16.8 % more comparing to
2012. Traffic biogas was produced in five different plants and biogas is used only for transport. Biogas
from 3 plants is transported to filling stations by biogas pipelines. From other 2 plants biogas is
transported to filling stations by natural gas pipelines /6/. However, the use of biogas is increasing
each year, and nowadays 0.68 TWh are used. The growth of biogas use in Finland is shown in figure
3.
11
FIGURE 3. Biogas use in Finland /5/
3.2.3 Financial support systems
The Electric Market Authority of Finland sponsors new biogas plants, which can produce more than
100kVA, with feed-in tariff. It ensures a minimum price of 83.50 EUR/MWh electricity, but if
generators exceeds 19 MVA no subsidy is paid. In the feed-in tariff system, subsidy will be approved
for 12 years for electricity producer /4./.
The Ministry of Agriculture and Forestry supports farmers who want to have a biogas plants on own,
but more than half biomass must be from their own farm (animals, crops, sludge) and more than 50%
of produced heat and electricity should be used by the farm.
4 BIOGAS PLANT
Now there are several main types of biogas plants all over the world. Each time it is necessary to find
the most suitable type in different case. One of my aims is to find out which type of the biogas plant
is the most suitable and cost efficient for MUAS. To find out which type of biogas plants are most
12
cost efficient, in my Bachelor’s thesis I will consider several factors, as energy production,
requirements and used materials for constructing biogas plant.
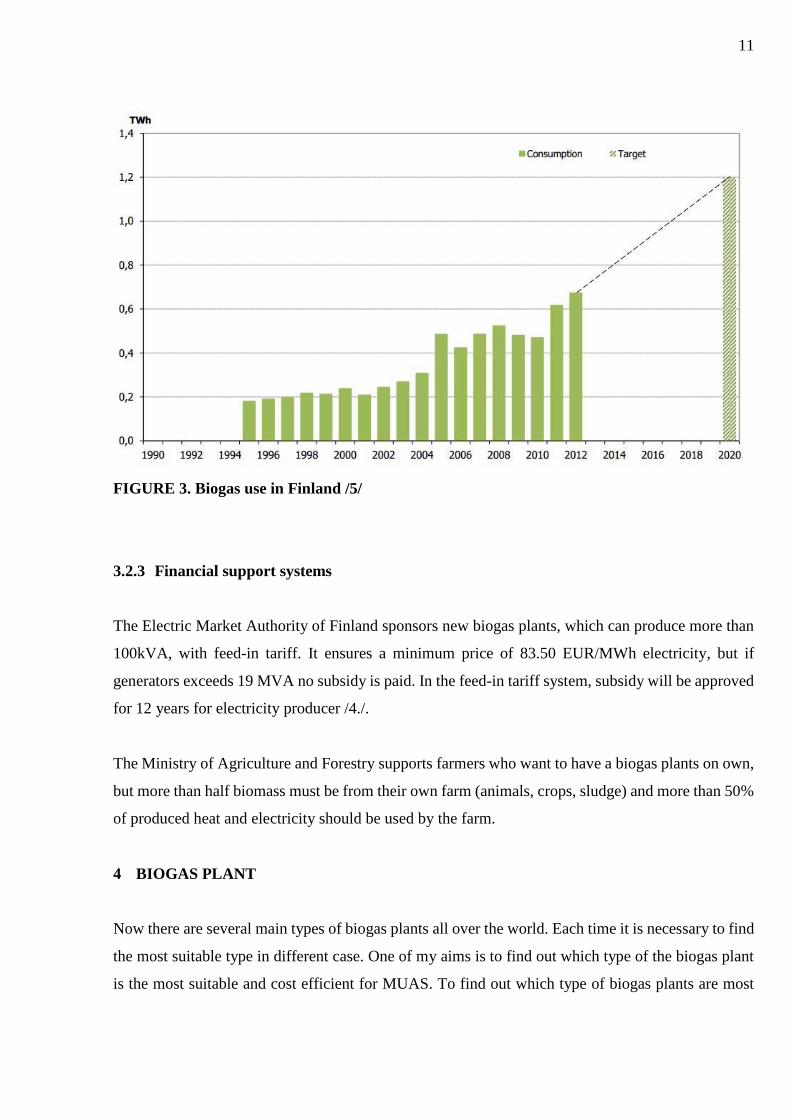
In smaller areas with less waste or slurry to use low cost polyethylene tube digester can be used. This
kind of system a hermetic isolated tank is obtained. Polyethylene tube digester has drainpipes serves,
which works as inlet and outlet of the slurry. Tubular polyethylene is flexible, for this reason a firm
is needed. This firm is nescessary for accommodation of tank, that a ditch is excavated.
FIGURE 4. Polyethylene Tube Digester /7/
This system is simple to design and construct, also cost effective. On the other hand, it is short-lived
because of the polyethilene plastic, which during some time can degrade. However, this system is not
expensive to maintain, so main chamber is replaceable when needed.
Other not so popular types are horizontal plants, Earth Pit Plants and Ferrocement Plants.
Horizontal plants are chosen when unsound installation is needed and they are made from masonry
or concrete. The construction of these plants are shallow, despite large slurry space, however, there
can be problems with gas-space leakage and the elimination of scum is quite difficult.
Earth Pit Plants are recommended for installation in impermeable soul, which are above
groundwater table. The cost of installation is low, but useful life is short. In addition it is only useful
in suitable, tight types of soil.
Ferrocement Plants can be applied either as a self-supporting shell or earth pit lining. This plant
gasholder needs special sealing measures. Ferrocement plants are low cost, needs low material input
and mass production is possible. However, workmanship must meet high quality standards, this
13
construction technique is not properly time-tested. Also this kind of plants are recommended where
special ferro-cement know how is available. /7./
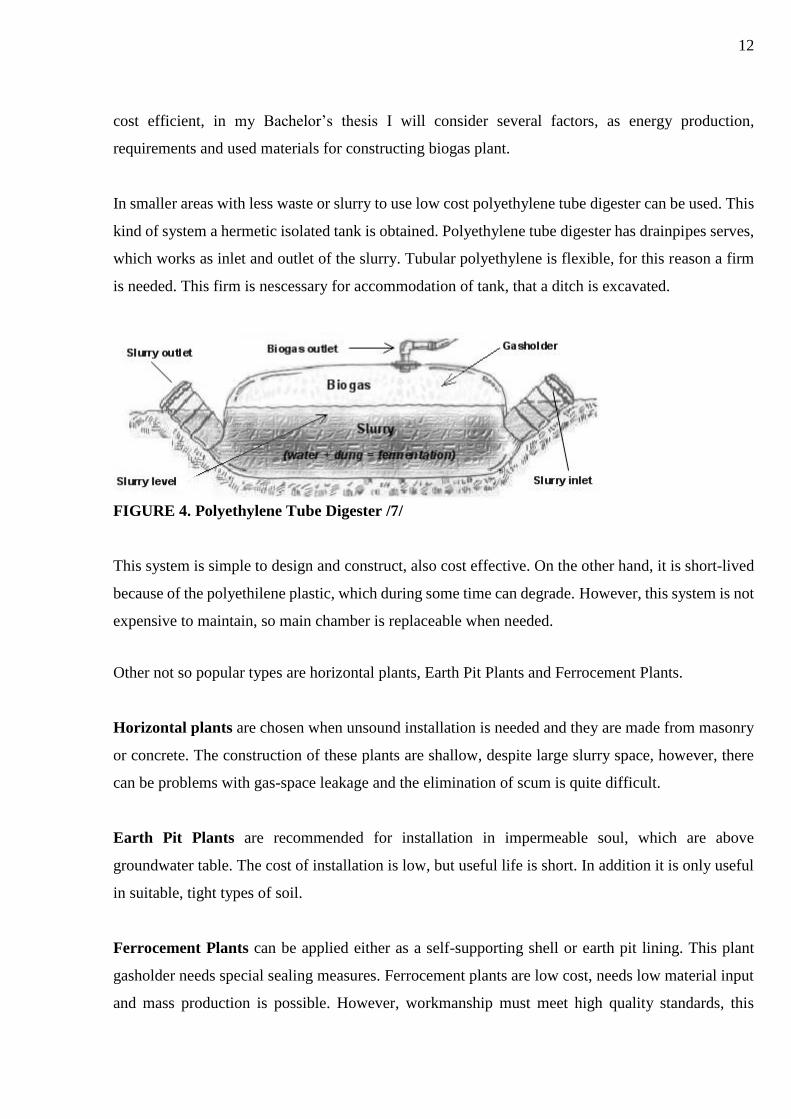
4.1 Fixed-dome Plants
This type of biogas plant consists of a digester with a fixed gas holder which cannot move and it is
located on the top of the digester. Another component is compensation tank, and slurry is displaced
to compensation tank, when gas production begins. Gas pressure increases with the volume of gas
stored and the height difference between the slurry level in the digester and compensation tank. /7./
The costs of fixed-dome biogas plants are low because there are no moving parts and rusting steel
parts. The plant is constructed underground because of space saving and protecting from physical
damage.
However, fixed-dome plants is not so easy to build construct as they should be build where
experienced biogas technicians can supervise building process. Otherwise plants may not be gas-
tight.
FIGURE 5. Fixed-dome biogas plant. 1. Mixed tank with inlet pipe and sand trap. 2. Digester. 3.
Compensation and removal tank. 4. Gasholder. 5. Gas pipe. 6. Entry hatch, with gastight seal. 7.
Accumulation of thick sludge. 8. Outlet pipe. 9. Reference level. 10. Supernatant scum, broken up by
varying level. /8./
14
The digesters (2) of fixed-dome plants are masonry structures, structures of cement and ferro-
cementexist. When choosing materials it is necessary to pay attention to technical suitability, cost-
effectiveness, availability in the region and transport costs.
The top part of fixed-dome plant is gas holder (4) has to be gas-tight. Concrete, masonry and cement
are not gas-tight. Before using biogas plant gas space must be painted with a gas-tight layer and for
this can be used latex or synthetic paints. In case to prevent cracks that appears due to hydrostatic
pressure in lower parts, weak-ring in the masonry of the digester can be used. This ring joins lower
and upper parts of the hemispherical structure.
In the cold climate countries and locations fixed-dome plants should be covered with earth up to the
top of gas-filled space to neutralize the internal 0.15 bar pressure. Due to economic parameters
recommended minimum size of plant is 5 m3 and digester volumes up to 200 m3.
4.1.1 Function
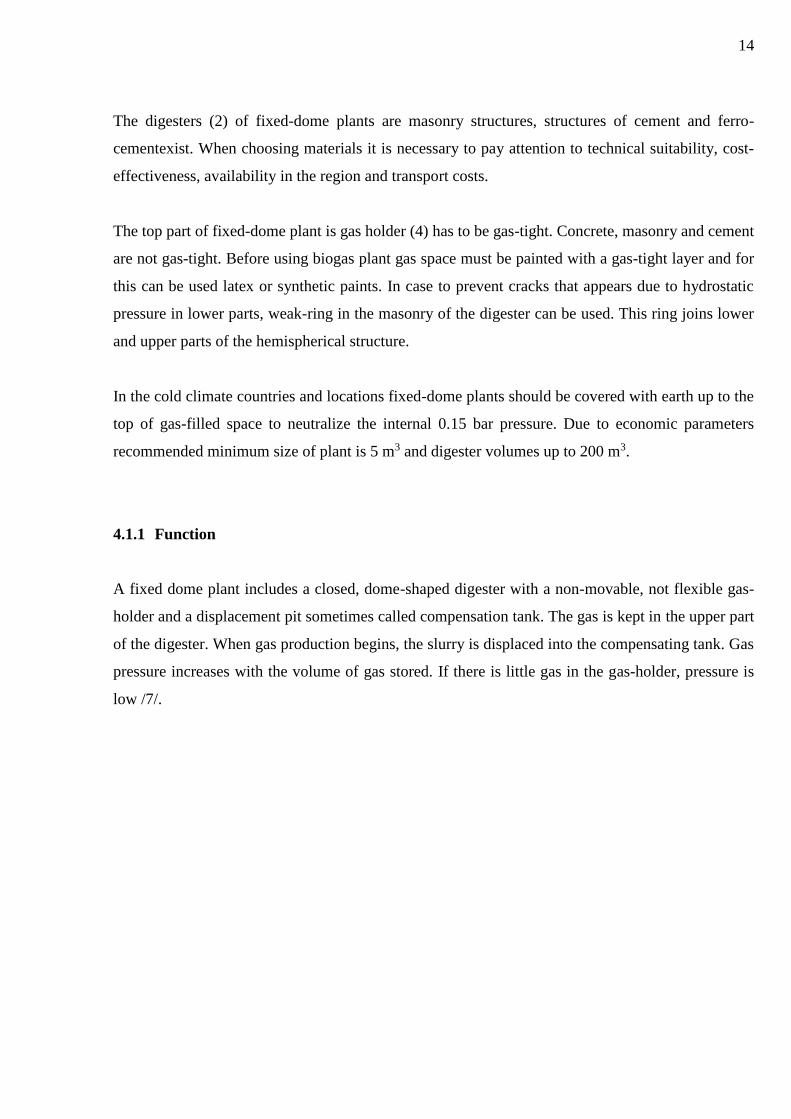
A fixed dome plant includes a closed, dome-shaped digester with a non-movable, not flexible gas-
holder and a displacement pit sometimes called compensation tank. The gas is kept in the upper part
of the digester. When gas production begins, the slurry is displaced into the compensating tank. Gas
pressure increases with the volume of gas stored. If there is little gas in the gas-holder, pressure is
low /7/.
15
FIGURE 6. Basic function of a fixed-dome biogas plant. 1. Mixing pit. 2. Digester. 3. Gasholder.
4. Displacement pit. 5. Gas pipe /8/
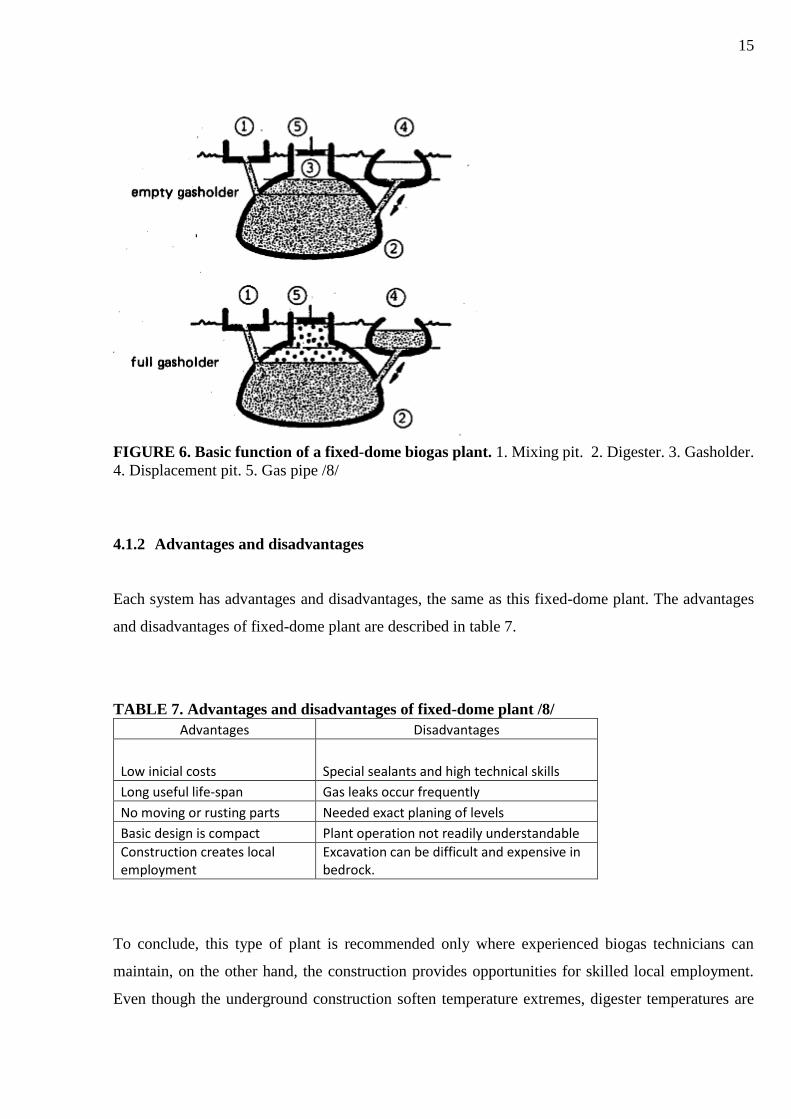
4.1.2 Advantages and disadvantages
Each system has advantages and disadvantages, the same as this fixed-dome plant. The advantages
and disadvantages of fixed-dome plant are described in table 7.
TABLE 7. Advantages and disadvantages of fixed-dome plant /8/
Advantages Disadvantages
Low inicial costs Special sealants and high technical skills
Long useful life-span Gas leaks occur frequently
No moving or rusting parts Needed exact planing of levels
Basic design is compact Plant operation not readily understandable
Construction creates local employment
Excavation can be difficult and expensive in bedrock.
To conclude, this type of plant is recommended only where experienced biogas technicians can
maintain, on the other hand, the construction provides opportunities for skilled local employment.
Even though the underground construction soften temperature extremes, digester temperatures are
16
quite low. Nevertheless the underground construction saves space and protects the digester from
temperature changes. /7./
4.2 Floating Drum Plants
Floating-drum plants consist of an underground digester and moving gas-holder. The gas-holder
moves either directly on a fermentation slurry or in water jacket of its own. Gas drum collects gas
and it moves down or rises, depending on the amount of gas stored. Also it is prevented from tilting
by a guiding frame. /7./
Floating-drum plants are used for digesting animal and human feces on a continuous feed mode
operation. This means that waste or feces should be imputed every day with the same or different
amount. Most of the time floating-drum plants are used in farms with a digester size 5-15 m3 or in an
institutions and larger farms with a size of digester 20-100 m3/7./.
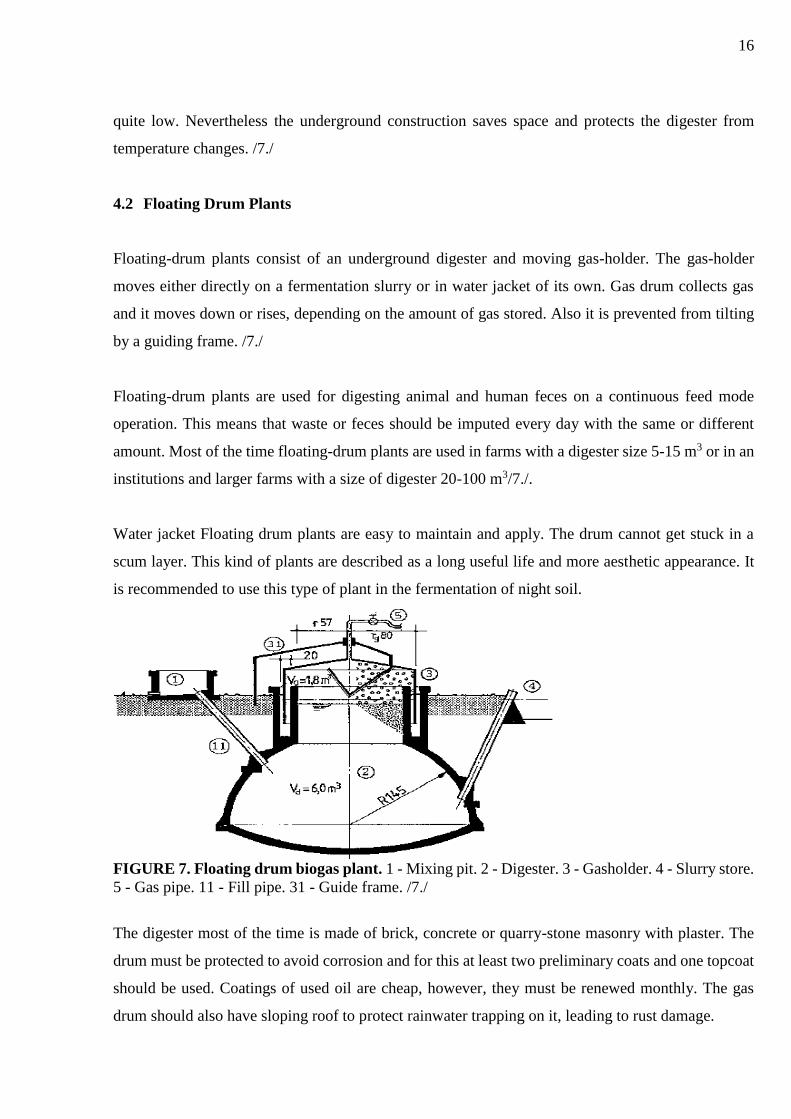
Water jacket Floating drum plants are easy to maintain and apply. The drum cannot get stuck in a
scum layer. This kind of plants are described as a long useful life and more aesthetic appearance. It
is recommended to use this type of plant in the fermentation of night soil.
FIGURE 7. Floating drum biogas plant. 1 - Mixing pit. 2 - Digester. 3 - Gasholder. 4 - Slurry store.
5 - Gas pipe. 11 - Fill pipe. 31 - Guide frame. /7./
The digester most of the time is made of brick, concrete or quarry-stone masonry with plaster. The
drum must be protected to avoid corrosion and for this at least two preliminary coats and one topcoat
should be used. Coatings of used oil are cheap, however, they must be renewed monthly. The gas
drum should also have sloping roof to protect rainwater trapping on it, leading to rust damage.
17
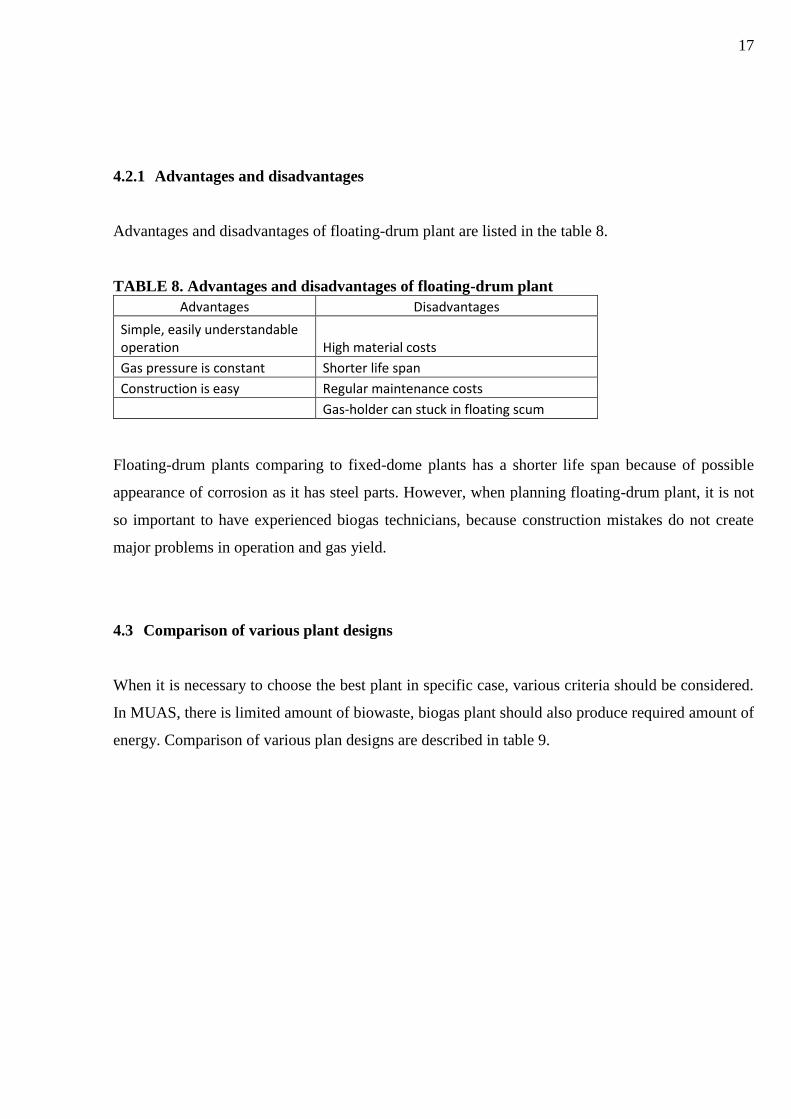
4.2.1 Advantages and disadvantages
Advantages and disadvantages of floating-drum plant are listed in the table 8.
TABLE 8. Advantages and disadvantages of floating-drum plant
Advantages Disadvantages
Simple, easily understandable operation High material costs
Gas pressure is constant Shorter life span
Construction is easy Regular maintenance costs
Gas-holder can stuck in floating scum
Floating-drum plants comparing to fixed-dome plants has a shorter life span because of possible
appearance of corrosion as it has steel parts. However, when planning floating-drum plant, it is not
so important to have experienced biogas technicians, because construction mistakes do not create
major problems in operation and gas yield.
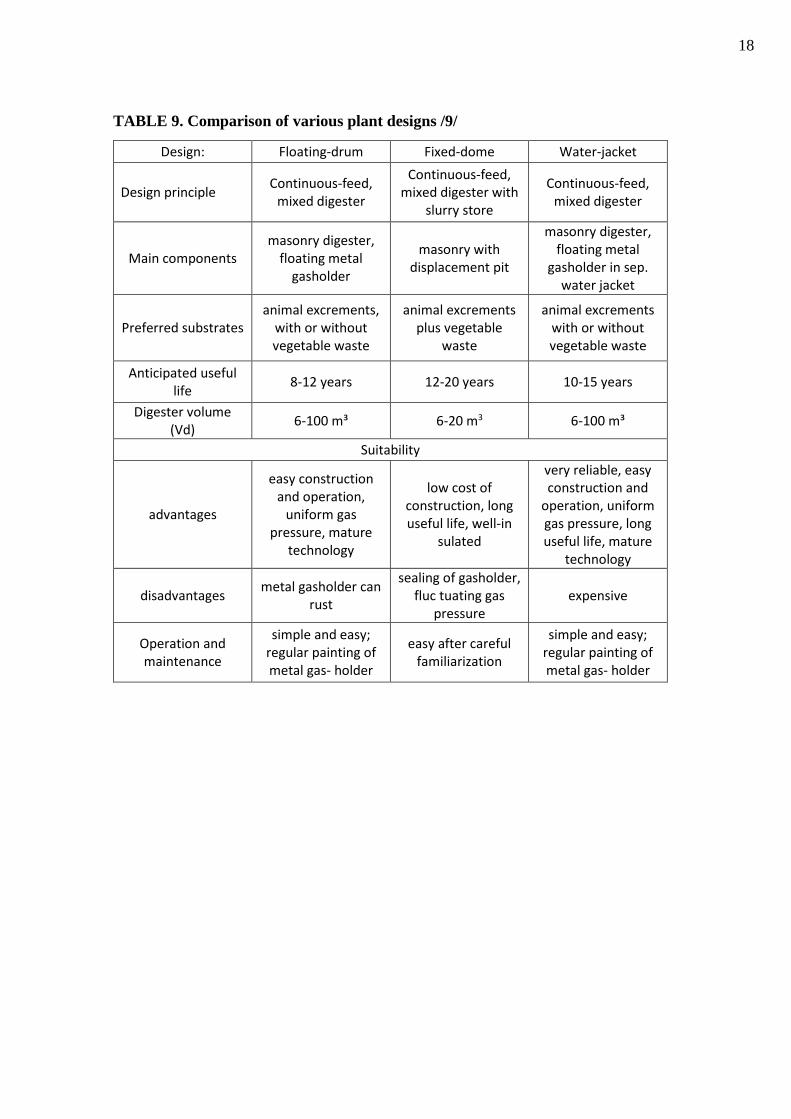
4.3 Comparison of various plant designs
When it is necessary to choose the best plant in specific case, various criteria should be considered.
In MUAS, there is limited amount of biowaste, biogas plant should also produce required amount of
energy. Comparison of various plan designs are described in table 9.
18
TABLE 9. Comparison of various plant designs /9/
Design: Floating-drum Fixed-dome Water-jacket
Design principle Continuous-feed,
mixed digester
Continuous-feed, mixed digester with
slurry store
Continuous-feed, mixed digester
Main components masonry digester,
floating metal gasholder
masonry with displacement pit
masonry digester, floating metal
gasholder in sep. water jacket
Preferred substrates animal excrements,
with or without vegetable waste
animal excrements plus vegetable
waste
animal excrements with or without vegetable waste
Anticipated useful life
8-12 years 12-20 years 10-15 years
Digester volume (Vd)
6-100 m³ 6-20 m3 6-100 m³
Suitability
advantages
easy construction and operation,
uniform gas pressure, mature
technology
low cost of construction, long useful life, well-in
sulated
very reliable, easy construction and
operation, uniform gas pressure, long useful life, mature
technology
disadvantages metal gasholder can
rust
sealing of gasholder, fluc tuating gas
pressure expensive
Operation and maintenance
simple and easy; regular painting of metal gas- holder
easy after careful familiarization
simple and easy; regular painting of metal gas- holder
19
5 BIOMASS TO BIOPOWER
Before the industrial revolution biomass was mostly burned directly to make a heat. Nowadays from
fired heat of biomass stem power are produced and more recently biomass fired steam has been used
to generate electricity.
Researchers have found, that there are even more efficient and cleaner ways to use biomass. As it
was mentioned before it is possible to convert it into liquid fuels, to produce combustible gases.
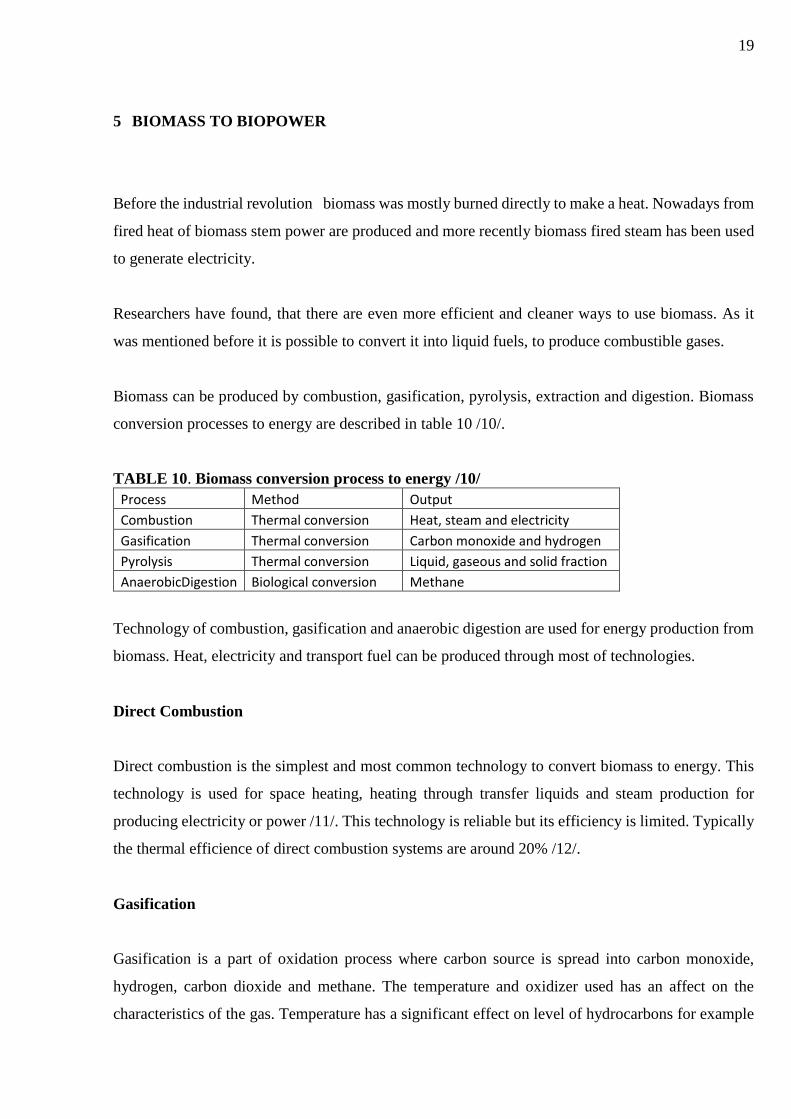
Biomass can be produced by combustion, gasification, pyrolysis, extraction and digestion. Biomass
conversion processes to energy are described in table 10 /10/.
TABLE 10. Biomass conversion process to energy /10/
Process Method Output
Combustion Thermal conversion Heat, steam and electricity
Gasification Thermal conversion Carbon monoxide and hydrogen
Pyrolysis Thermal conversion Liquid, gaseous and solid fraction
AnaerobicDigestion Biological conversion Methane
Technology of combustion, gasification and anaerobic digestion are used for energy production from
biomass. Heat, electricity and transport fuel can be produced through most of technologies.
Direct Combustion
Direct combustion is the simplest and most common technology to convert biomass to energy. This
technology is used for space heating, heating through transfer liquids and steam production for
producing electricity or power /11/. This technology is reliable but its efficiency is limited. Typically
the thermal efficience of direct combustion systems are around 20% /12/.
Gasification
Gasification is a part of oxidation process where carbon source is spread into carbon monoxide,
hydrogen, carbon dioxide and methane. The temperature and oxidizer used has an affect on the
characteristics of the gas. Temperature has a significant effect on level of hydrocarbons for example
20
in low temperature, such as 700ºC -1000º C , the product gas will have bigger level of hydrocarbons
than in high temperature (1200 ºC -1600 ºC). This technology can be used in water heating in central
heating, generation of steam for electricity or as part of systems which makes motive force /13/. In
addition to this, gasification is more efficient than direct combustion, as gasifying biomass to make
electricity is twice efficient and it emitts less particulate matter and greenhouse gases /12./
Pyrolysis
Pyrolysis is the process, when biomass is heated in oxygen-free medium to produce gas which is rich
in hydrocarbons. Produced gas is immediately cooled, to create a liquid which is similar to oil and
sold char, with the proportions depending on parameters of the process. The same as gasification
pyrolysis can be in low and high temperatures. The difference between low and high temperatures is
that in low temperatures more solid char is produced, and in high temperatures higher proportion of
liquid is made. Pyrolysis can be applied in co-firing for heat and power, feedstock for gasification
/14/.
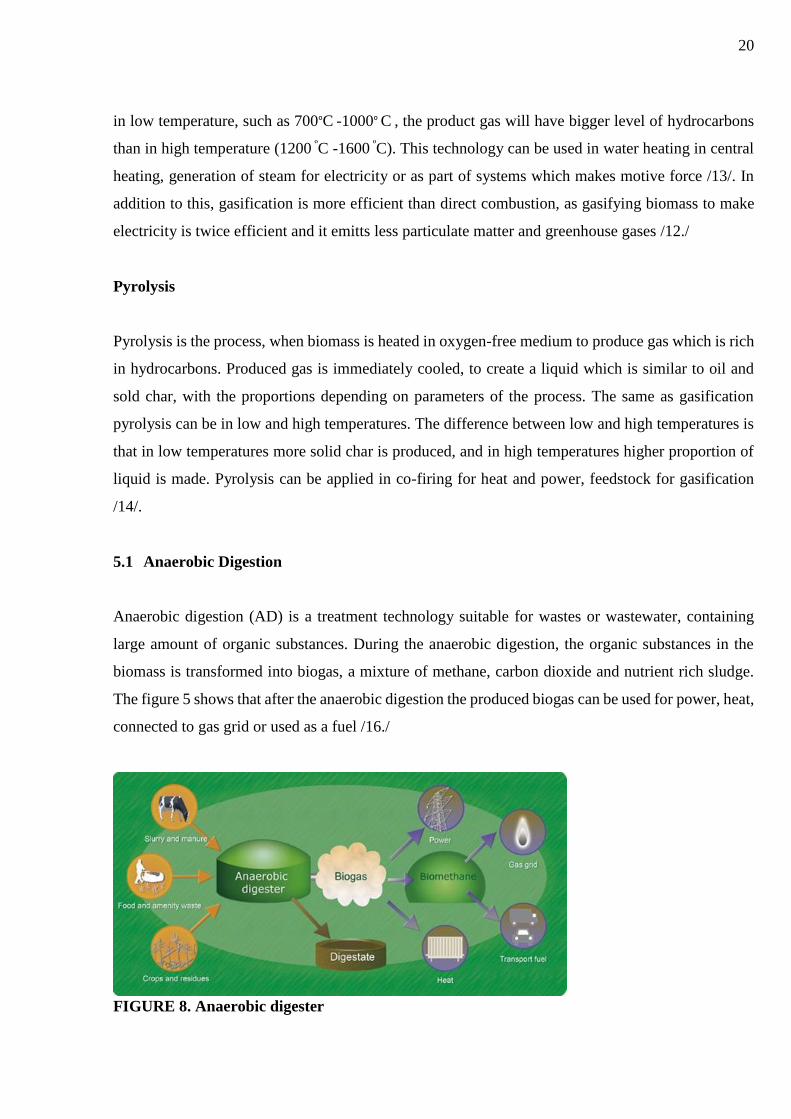
5.1 Anaerobic Digestion
Anaerobic digestion (AD) is a treatment technology suitable for wastes or wastewater, containing
large amount of organic substances. During the anaerobic digestion, the organic substances in the
biomass is transformed into biogas, a mixture of methane, carbon dioxide and nutrient rich sludge.
The figure 5 shows that after the anaerobic digestion the produced biogas can be used for power, heat,
connected to gas grid or used as a fuel /16./
FIGURE 8. Anaerobic digester
21
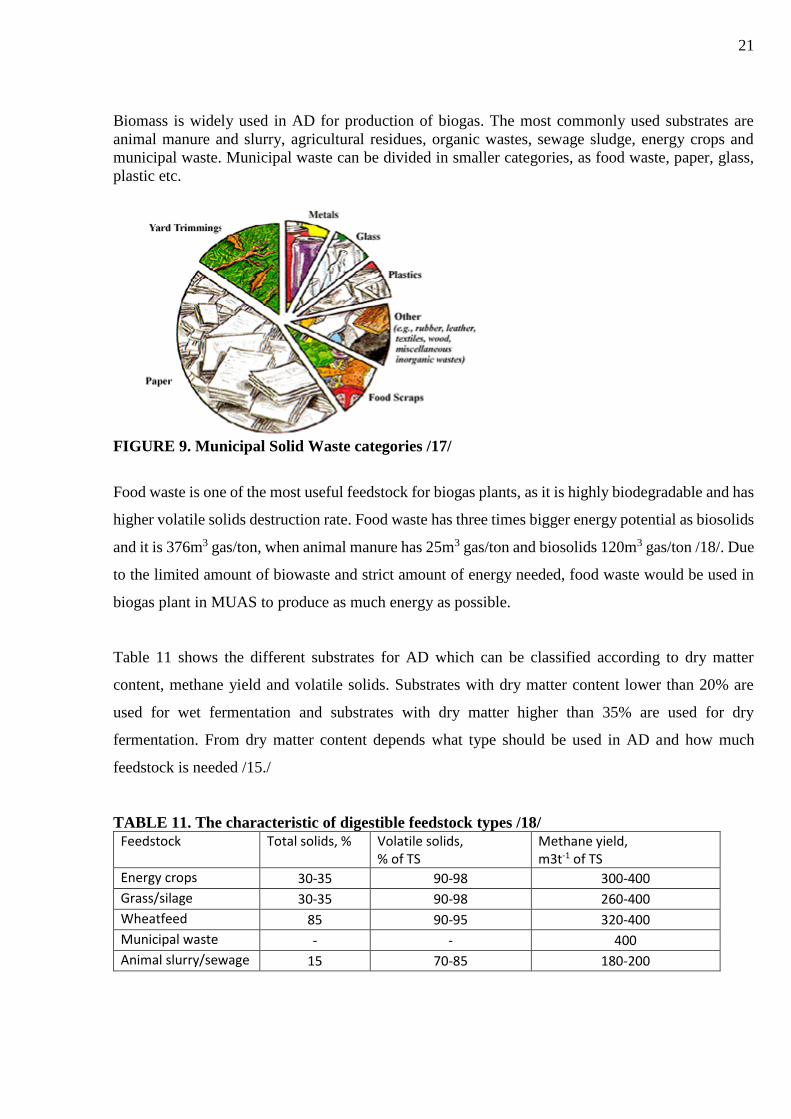
Biomass is widely used in AD for production of biogas. The most commonly used substrates are
animal manure and slurry, agricultural residues, organic wastes, sewage sludge, energy crops and
municipal waste. Municipal waste can be divided in smaller categories, as food waste, paper, glass,
plastic etc.
FIGURE 9. Municipal Solid Waste categories /17/
Food waste is one of the most useful feedstock for biogas plants, as it is highly biodegradable and has
higher volatile solids destruction rate. Food waste has three times bigger energy potential as biosolids
and it is 376m3 gas/ton, when animal manure has 25m3 gas/ton and biosolids 120m3 gas/ton /18/. Due
to the limited amount of biowaste and strict amount of energy needed, food waste would be used in
biogas plant in MUAS to produce as much energy as possible.
Table 11 shows the different substrates for AD which can be classified according to dry matter
content, methane yield and volatile solids. Substrates with dry matter content lower than 20% are
used for wet fermentation and substrates with dry matter higher than 35% are used for dry
fermentation. From dry matter content depends what type should be used in AD and how much
feedstock is needed /15./
TABLE 11. The characteristic of digestible feedstock types /18/
Feedstock Total solids, % Volatile solids, % of TS
Methane yield, m3t-1 of TS
Energy crops 30-35 90-98 300-400
Grass/silage 30-35 90-98 260-400
Wheatfeed 85 90-95 320-400
Municipal waste - - 400
Animal slurry/sewage 15 70-85 180-200
22
The most important criteria when comparing different AD substrates is potential methane yield.
According to table 11 animal slurry and sewage has rather low methane yield. Because of this animal
slurry and sewage is not digested alone, but mixed with other substrates as waste or energy crops, to
boost the biogas production. When two different substrates are used in AD it is called co-digestion.
The efficiency of AD depends not only on substrates used, but also on some parameters as
temperature, pH-values, volatile fatty acids, ammonia and macro and micronutrients and toxic
compounds. The most important parameters in AD are temperature, pH-values and content of total
solids (TS).
Temperature
Temperature influences the performance of AD processes and it can take place at different
temperatures. There are three temperature ranges: psychrophilic, mesophilic and termophilic.
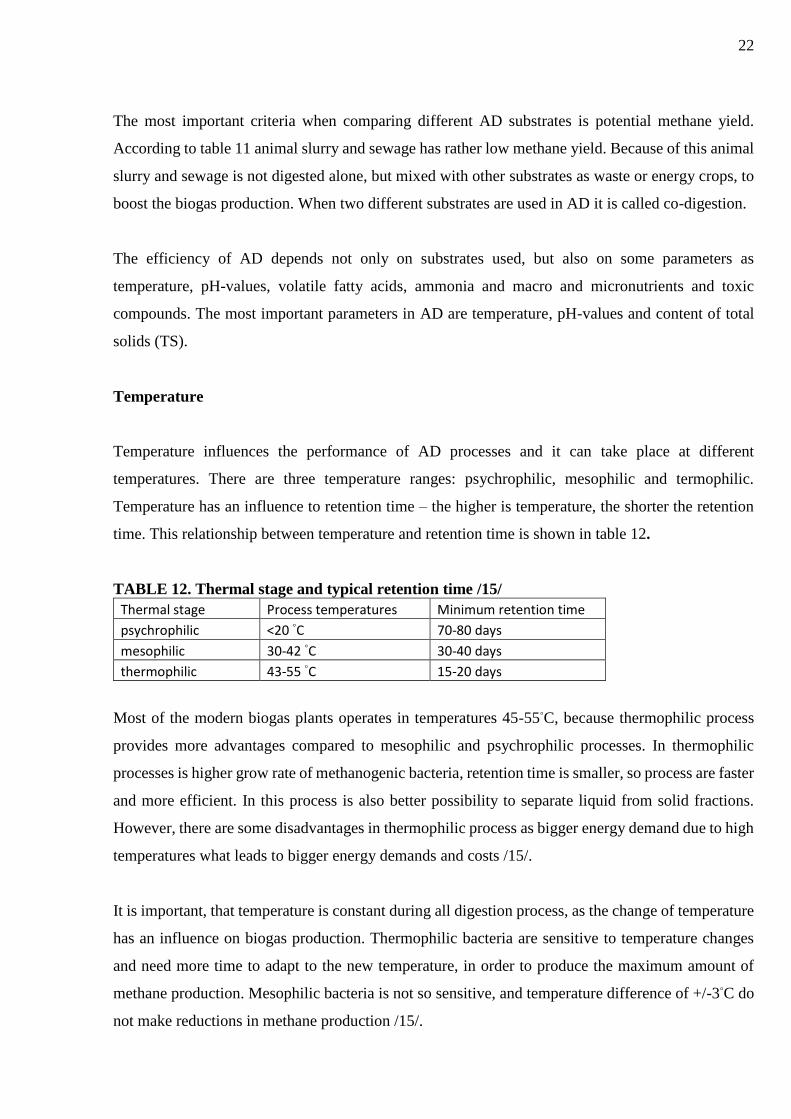
Temperature has an influence to retention time – the higher is temperature, the shorter the retention
time. This relationship between temperature and retention time is shown in table 12.
TABLE 12. Thermal stage and typical retention time /15/
Thermal stage Process temperatures Minimum retention time
psychrophilic <20 ◦C 70-80 days
mesophilic 30-42 ◦C 30-40 days
thermophilic 43-55 ◦C 15-20 days
Most of the modern biogas plants operates in temperatures 45-55◦C, because thermophilic process
provides more advantages compared to mesophilic and psychrophilic processes. In thermophilic
processes is higher grow rate of methanogenic bacteria, retention time is smaller, so process are faster
and more efficient. In this process is also better possibility to separate liquid from solid fractions.
However, there are some disadvantages in thermophilic process as bigger energy demand due to high
temperatures what leads to bigger energy demands and costs /15/.
It is important, that temperature is constant during all digestion process, as the change of temperature
has an influence on biogas production. Thermophilic bacteria are sensitive to temperature changes
and need more time to adapt to the new temperature, in order to produce the maximum amount of
methane production. Mesophilic bacteria is not so sensitive, and temperature difference of +/-3◦C do
not make reductions in methane production /15/.
23
pH - values
The pH-value is the measure of a substrate mixture and it is expressed in parts per million (ppm). The
pH value has an effect of methanogenic microorganisms growth. pH value inside the digesters
depends on pressure of CO2 and the concentration of alkaline and acid components in the liquid phase.
Moreover, the pH-value can be quick, cheap and reliable way to mark system disbalance in systems
as AD /15/.
Content of Total Solids (TS)
Digestation process in digesters can operate in high-solids or low-solids processes. High-solids
digesters has a total solids content above 20%, when low-solids has TS content less than 20%. Dry
processes have the advantage because less space is needed and they have a bigger potential for the
processing of municipal organic solid waste.
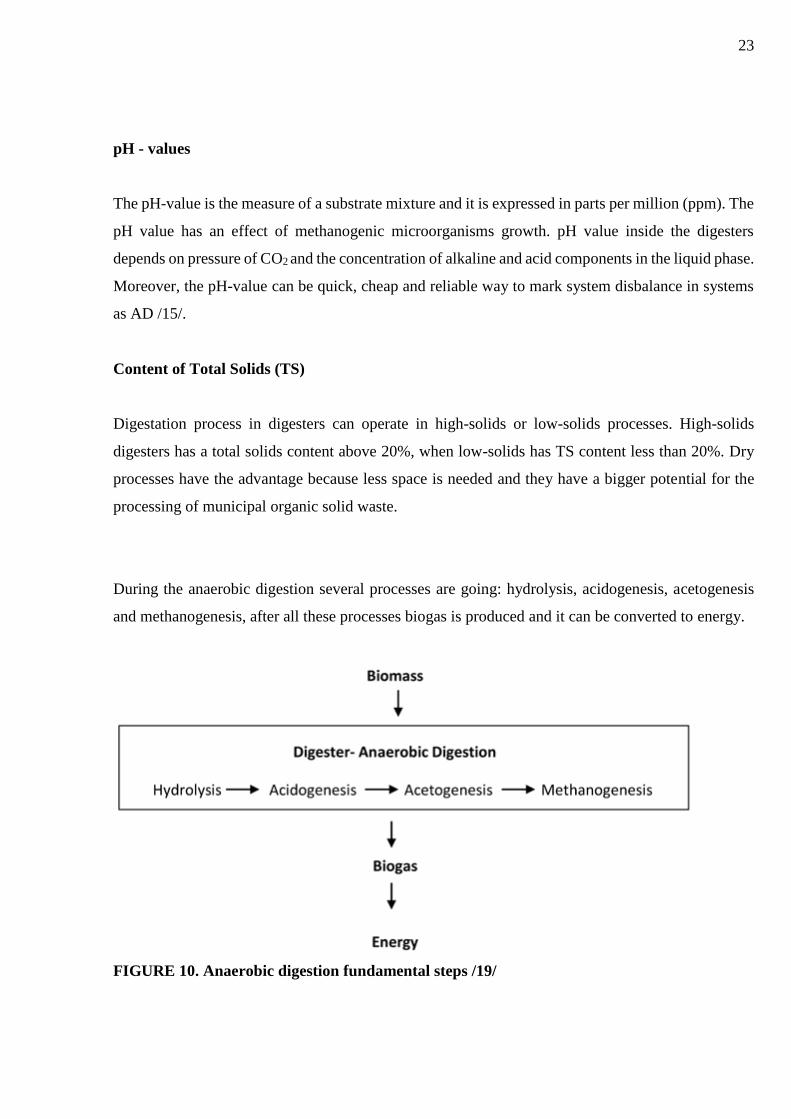
During the anaerobic digestion several processes are going: hydrolysis, acidogenesis, acetogenesis
and methanogenesis, after all these processes biogas is produced and it can be converted to energy.
FIGURE 10. Anaerobic digestion fundamental steps /19/
24
Hydrolysis
Hydrolysis is the main step in anaerobic digestion to separate unusual organic polymers from
biomass. During hydrolysis large polymers as proteins, fats and carbohydrates are separated to
smaller molecules such as amino acids, fatty acids and sugars. Molecules, which are still large after
the hydrolysis should be separated again in the process of acidogenesis, to be useful for methane
production /19/.
Acidogenesis
Acidogenesis is the further step of anaerobic digestion in which microorganisms are break down after
hydrolysis. These bacteria creates ammonia, shorter volatile fatty acids, carbonic acids, alcohols,
water, carbon dioxide. When acidogenic bacteria further breaks down the organic matter, it is still
unusable for methane production, so acedogenesis is needed /19/.
Acedogenesis
During the acedogenesis acetate is created from carbon and energy sources by acetogens. Acetogens
splits biomass so that it could be used in methanogenesis process to create methane /19/.
Methanogenesis
Methanogenesis is the final process of anaerobic digestion where methane is created. To create
methane acetic acid and carbon dioxide is needed. When using acetic acid methane and CO2 are
created and they are two main products of anaerobic digestion /19/.
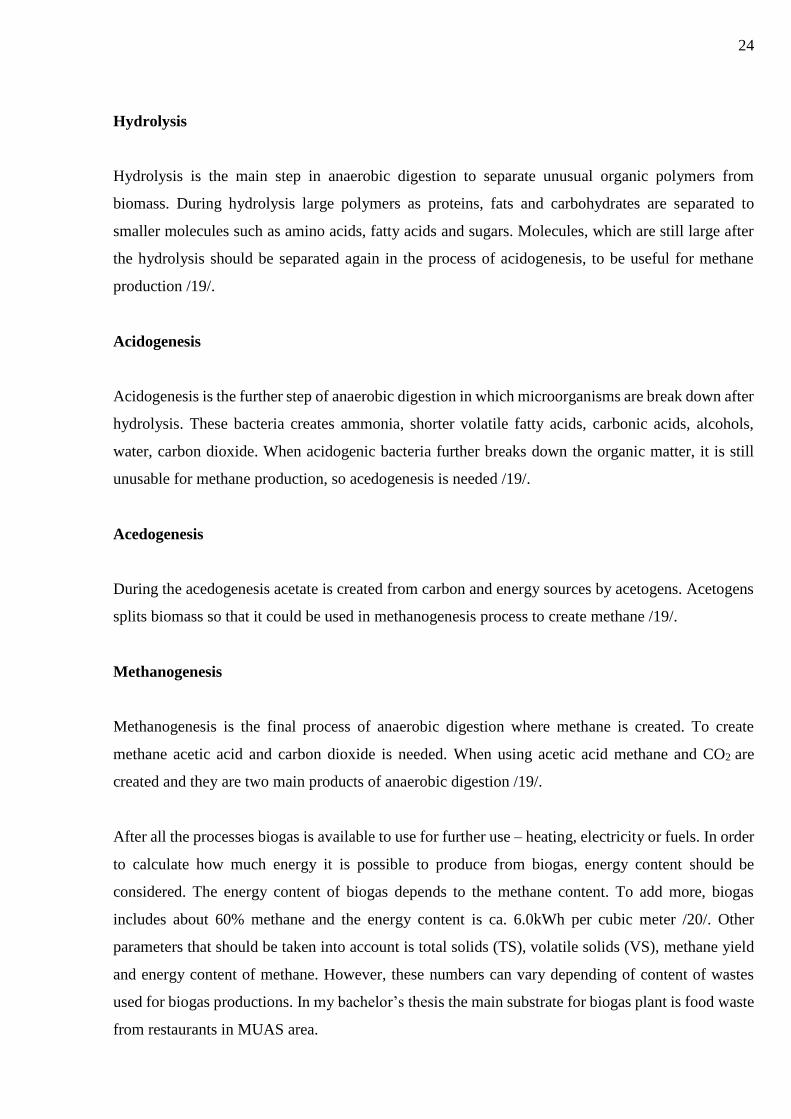
After all the processes biogas is available to use for further use – heating, electricity or fuels. In order
to calculate how much energy it is possible to produce from biogas, energy content should be
considered. The energy content of biogas depends to the methane content. To add more, biogas
includes about 60% methane and the energy content is ca. 6.0kWh per cubic meter /20/. Other
parameters that should be taken into account is total solids (TS), volatile solids (VS), methane yield
and energy content of methane. However, these numbers can vary depending of content of wastes
used for biogas productions. In my bachelor’s thesis the main substrate for biogas plant is food waste
from restaurants in MUAS area.
25
TABLE 13. Parametres of foodwaste /21/
Substrate TS, % VS, % Methane yield, m3/kgVS
Cont. Of methane, %
Energy content, MWh/m3
Foodwaste 40 70 0.4 60 0.006
6 BIOGAS PLANT IN MUAS
6.1 SWOT ANALYSIS
Each system has some advantages and disadvantages. In each project there are also threats and
weaknesses that should be managed and benefits create from that. In order to understand and find out
the strengths, weaknesses, opportunities and threats of biogas plant in MUAS, SWOT analysis was
made.
Strengths
Biogas plant can save an energy and it protects environment from greenhouse effect. When energy
produced in own biogas plant, less energy is used from the grid. Also energy made from biogas plant
can be used not only for heating, but also for electricity or fuels. To add more, the waste from campus
area can be used, there are no additional expenditure for waste removal. If the amount of waste is not
enough, agreements with farmers can be made and biogas manure can replace the mineral fertilizer.
Weaknesses
The weaknesses of biogas plant is limited quantity of energy. This problem could appear if not enough
waste are used in digestion. Moreover, digestion must meet high standards to be used. If it is installed
not paying attention to requirements, the efficiency of plant decreases, and less energy can be
produced. To add more, efficiency of biogas plant depends of location proximately.
26
Opportunities
Biogas plant has a great opportunity to reduce budget for energy. This factor is also the strength of
the plant. If there would be enough waste, it would be possible to produce energy for all buildings in
MUAS. During the winter time it is possible to use energy for cars pre-heating to avoid freezing. The
last opportunity is making additional jobs for qualified workers.
Threats
However, there are several threats that can be met during the process. For example not enough waste
for all buildings. If the agreements with farmers are nor made, the threat that there are no place to
keep used biowaste manure which could replace mineral fertilizers. To add more, if organic waste is
not continuously fed or overfed into the biogas plant, it will lead to less or no generation of biogas.
The last threat is the possibility that biogas plant will not pay off during several years, if it will not
produce enough energy.
7 AMOUNT OF WASTE IN MUAS
In order to find out the answer to the question if it is profitable to build biogas plant in MUAS, the
energy consumption and amount of biowaste were needed. The data about energy consumption was
collected from each month in 2013. In MUAS are there are 19 buildings and the total energy
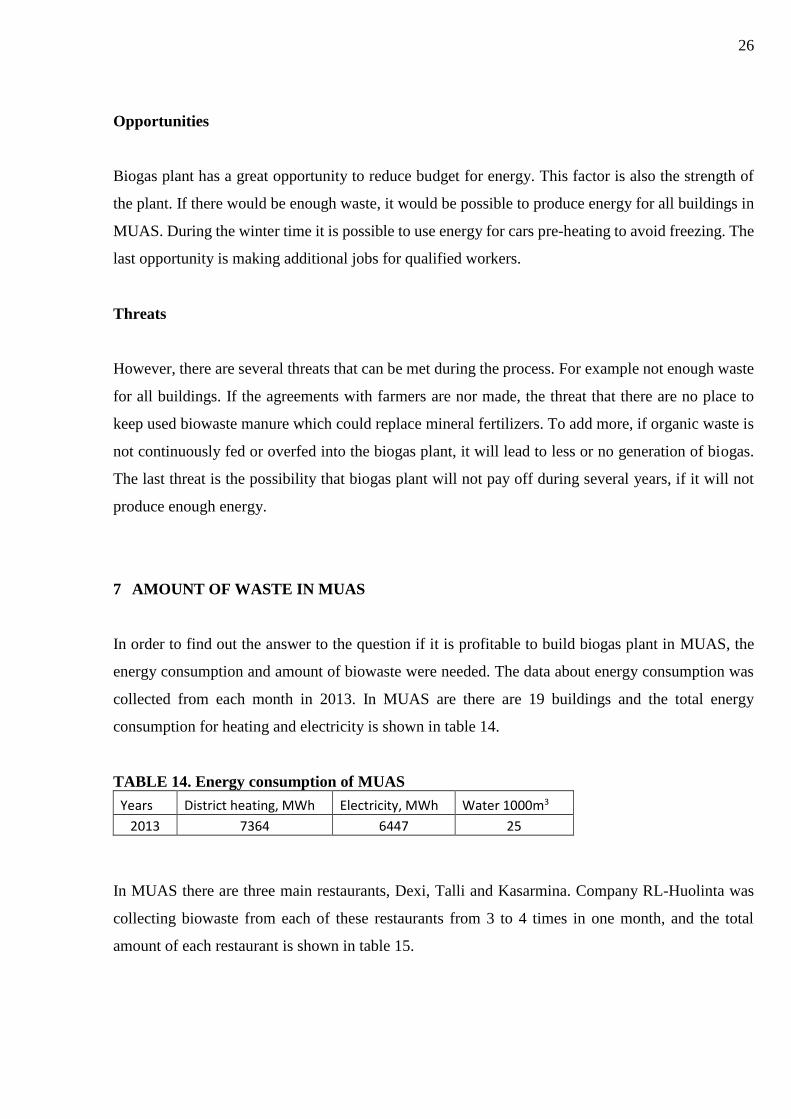
consumption for heating and electricity is shown in table 14.
TABLE 14. Energy consumption of MUAS
Years District heating, MWh Electricity, MWh Water 1000m3
2013 7364 6447 25
In MUAS there are three main restaurants, Dexi, Talli and Kasarmina. Company RL-Huolinta was
collecting biowaste from each of these restaurants from 3 to 4 times in one month, and the total
amount of each restaurant is shown in table 15.
27
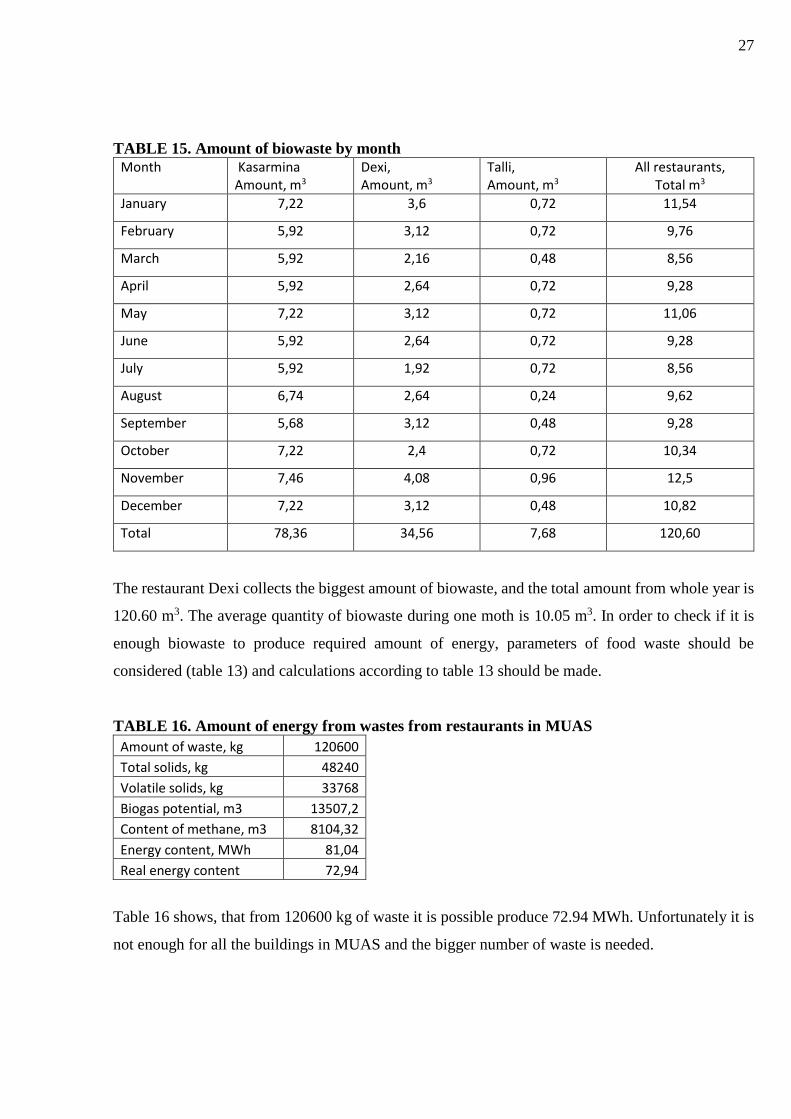
TABLE 15. Amount of biowaste by month
Month Kasarmina Amount, m3
Dexi, Amount, m3
Talli, Amount, m3
All restaurants, Total m3
January 7,22 3,6 0,72 11,54
February 5,92 3,12 0,72 9,76
March 5,92 2,16 0,48 8,56
April 5,92 2,64 0,72 9,28
May 7,22 3,12 0,72 11,06
June 5,92 2,64 0,72 9,28
July 5,92 1,92 0,72 8,56
August 6,74 2,64 0,24 9,62
September 5,68 3,12 0,48 9,28
October 7,22 2,4 0,72 10,34
November 7,46 4,08 0,96 12,5
December 7,22 3,12 0,48 10,82
Total 78,36 34,56 7,68 120,60
The restaurant Dexi collects the biggest amount of biowaste, and the total amount from whole year is
120.60 m3. The average quantity of biowaste during one moth is 10.05 m3. In order to check if it is
enough biowaste to produce required amount of energy, parameters of food waste should be
considered (table 13) and calculations according to table 13 should be made.
TABLE 16. Amount of energy from wastes from restaurants in MUAS
Amount of waste, kg 120600
Total solids, kg 48240
Volatile solids, kg 33768
Biogas potential, m3 13507,2
Content of methane, m3 8104,32
Energy content, MWh 81,04
Real energy content 72,94
Table 16 shows, that from 120600 kg of waste it is possible produce 72.94 MWh. Unfortunately it is
not enough for all the buildings in MUAS and the bigger number of waste is needed.
28
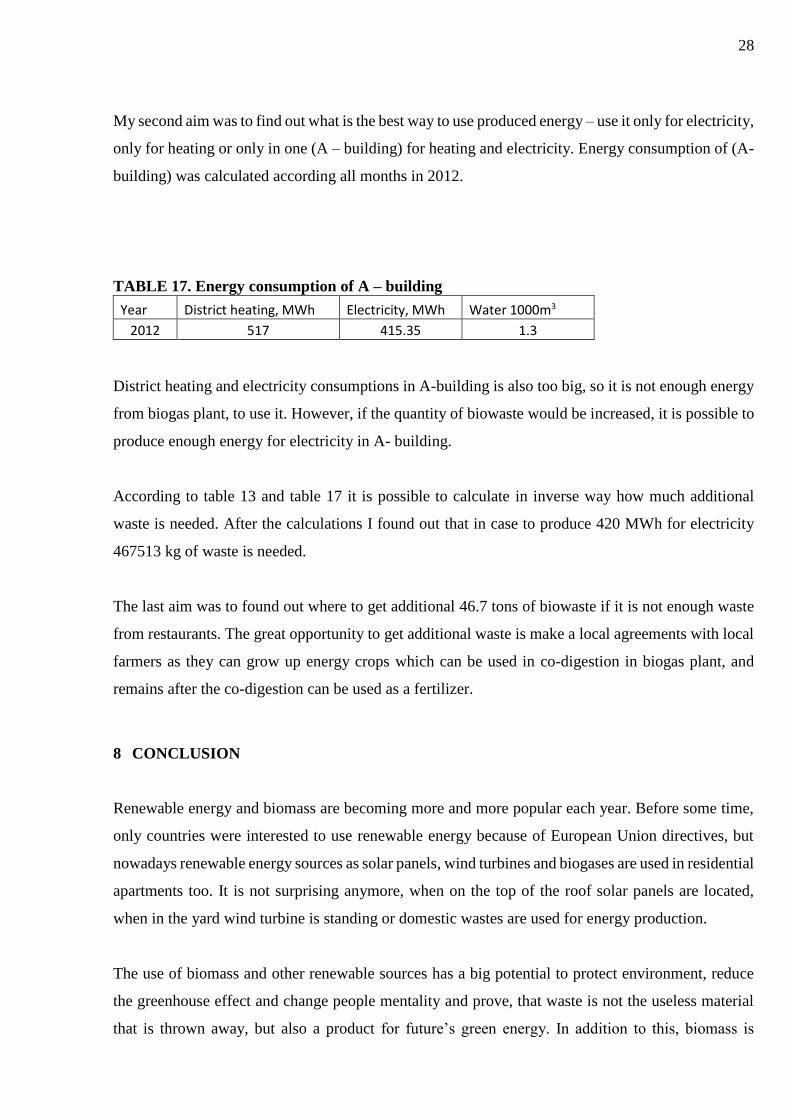
My second aim was to find out what is the best way to use produced energy – use it only for electricity,
only for heating or only in one (A – building) for heating and electricity. Energy consumption of (A-
building) was calculated according all months in 2012.
TABLE 17. Energy consumption of A – building
Year District heating, MWh Electricity, MWh Water 1000m3
2012 517 415.35 1.3
District heating and electricity consumptions in A-building is also too big, so it is not enough energy
from biogas plant, to use it. However, if the quantity of biowaste would be increased, it is possible to
produce enough energy for electricity in A- building.
According to table 13 and table 17 it is possible to calculate in inverse way how much additional
waste is needed. After the calculations I found out that in case to produce 420 MWh for electricity
467513 kg of waste is needed.
The last aim was to found out where to get additional 46.7 tons of biowaste if it is not enough waste
from restaurants. The great opportunity to get additional waste is make a local agreements with local
farmers as they can grow up energy crops which can be used in co-digestion in biogas plant, and
remains after the co-digestion can be used as a fertilizer.
8 CONCLUSION
Renewable energy and biomass are becoming more and more popular each year. Before some time,
only countries were interested to use renewable energy because of European Union directives, but
nowadays renewable energy sources as solar panels, wind turbines and biogases are used in residential
apartments too. It is not surprising anymore, when on the top of the roof solar panels are located,
when in the yard wind turbine is standing or domestic wastes are used for energy production.
The use of biomass and other renewable sources has a big potential to protect environment, reduce
the greenhouse effect and change people mentality and prove, that waste is not the useless material
that is thrown away, but also a product for future’s green energy. In addition to this, biomass is

29
flexible and profitable as it can be used not only for heating, ventilation, CHP plants, but also for
making fuels and using it as a fertilizer in the land.
I highly believe, that in the future food waste from restaurants will also be used in MUAS area and
agreements with local farmers would be made. It would help not only reduce the costs of energy, but
also it would be an example for young students to understand that the future can be full of green
energy.
30
9 REFERENCES
1. Motiva. 2014. Renewable energy in Finland. WWW document.
www.motiva.fi/en/areas_of_operation/renewable_energy. Updated 8.12.2014.Reffered
14.12.2014
2. Eubia. Biomass Characterictics. WWW document .http://www.eubia.org/index.php/about-
biomass/biomass-characteristics. Update information: 11/09/2014
3. Peter McKendry. Energy production from biomass (part 1): overwiew of biomass 2002
4. Renewable energy progress report, Brussels.PDF document. 27.3.2013
5. Biogas Country Overview (Country reports), January 2014. PDF document. Reffered
11/10/2014. No updare information.
6. Cbg100. 2014. Biogas use in transport in Finland 2013: preliminary statistics. WWW
document. http://www.cbg100.net/news/biogas-use-in-transport-in-finland-2013-
preliminary-statistics/
Update information: 11/09/2014
7. Sgpindia, Types of Biogas Plants. PDF document
www.sgpindia.org/documents/Biogas_Plants.pdf. No Update information.
8. Energypedia. Fixed-dome Biogas Plants. WWW document.
https://energypedia.info/wiki/Fixed-dome_Biogas_Plants Update information: 11/09/2014
9. Infocollections. http://collections.infocollections.org/ukedu/en/d/Jg32bie/6.3.html
10. Ayobami Olanrewaju Ogunleye, 2010. Biomass energy production. Bachelor’s thesis
11. Biomass technology. Dirext combustion. WWWdocument.
http://www.biomasstechnology.org/direct-combustion. Updated 31.5.2013. Referred
22.11.2014
12. Centre of energy. How is biomass energy used? WWWdocument.
www.centreforenergy.com/AboutEnergy/Biomass. No update information available.
Referred 22.11.2014
13. Biomass energy centre. Gasification. WWWdocument.
http://www.biomassenergycentre.org.uk/. No update information available. Referred
22.11.2014
31
14. Biomass energy centre. Pyrolysis. WWWdocument.
http://www.biomassenergycentre.org.uk/. No update information available. Referred
22.11.2014
15. Al Seadi, Teodorita 2008. Biogas handbook. University of Southern Denmark Esbjerg. PDF
document. http://lemvigbiogas.com/. Update information 11.10.2014. Referred 23.11.2014
16. Spuhler, Dorothee. Anaerobic Digestion. Sustainable sanitation and water management.
WWW document. http://www.sswm.info/content/anaerobic-digestion-general. Last
modified 11.23.2014. Referred 23.11.2014.
17. Mtu. 2005. Municipal Solid waste. WWW document.
http://techalive.mtu.edu/meec/module15/MunicipalSolidWaste. Updated 06.02.2005.
Referred 23.11.2014
18. Williams, Gregg 2011. Feedstocks:Characteristics, Pre-treatments. University of
Glamorgan. PDF document.
http://biomethaneregions.cra.wallonie.be/img/download/TrainingTheTrainers_UK_Feedstoc
ks_and_Pretreatments.pdf. Update information 07.04.2011. Referred 23.11.2014
19. Biarnes, Michail. Biomass to biogas – anaerobic digestion. E instruments. WWW document.
http://www.e-inst.com/biomass-to-biogas/. No update information. Referred 23.11.2014
20. Vögeli Y., Lohri C. R., Gallardo A., Diener S., Zurbrügg C. (2014). Anaerobic Digestion of
Biowaste in Developing Countries: Practical Information and Case Studies. Swiss Federal
Institute of Aquatic Science and Technology (Eawag), Dübendorf, Switzerland
21. Environmental protection agency. 2012. The Benefits of Anaerobic Digestion of Food
Waste At Wastewater Treatment Facilities. WWW document.
http://www.epa.gov/region9/organics/ad/Why-Anaerobic-Digestion.pdf. Update information
6.5.2012. Referred 22.11.2014
22. Keith Panter. Energy Balances in High Dry Solids Digestion Following Thermal Hydrolysis
Pre-treatment. Ebcor Ltd. PDF document. Referred 22.11.2014