Embed Size (px)
Citation preview
3. COMMODITY SNAPSHOTS
OECD-FAO AGRICULTURAL OUTLOOK 2016-2025 © OECD/FAO 2016116
BIOFUELS
Market situationSeveral political changes concerning biofuel markets were finalised in the course
of 2015. In Brazil, the taxation system was amended to favour hydrous ethanol rather than
gasohol3 and the mandatory anhydrous ethanol blending ratio was increased from 25% to
27%. In the European Union, revisions to the Renewable Energy Directive (RED) and to the
Fuel Quality Directive were adopted. A 7% cap was introduced on renewable energy coming
from food and feed crops in the transport sector by 2020. After a long delay, the US
Environmental Protection Agency’s (EPA) final rulemaking for the years 2014-16 was issued
in November 2015. The mandates specified are higher than those proposed earlier in the
year, though still considerably lower than the initial levels proposed in 2007.
World ethanol4 and biodiesel5 prices continued to decrease in nominal terms in 2015
due to weak crude oil and biofuel feedstock prices. Demand for bioenergy in the
transportation sector was mostly driven by blending mandates in major economies and by
sustained fuel use around the world.
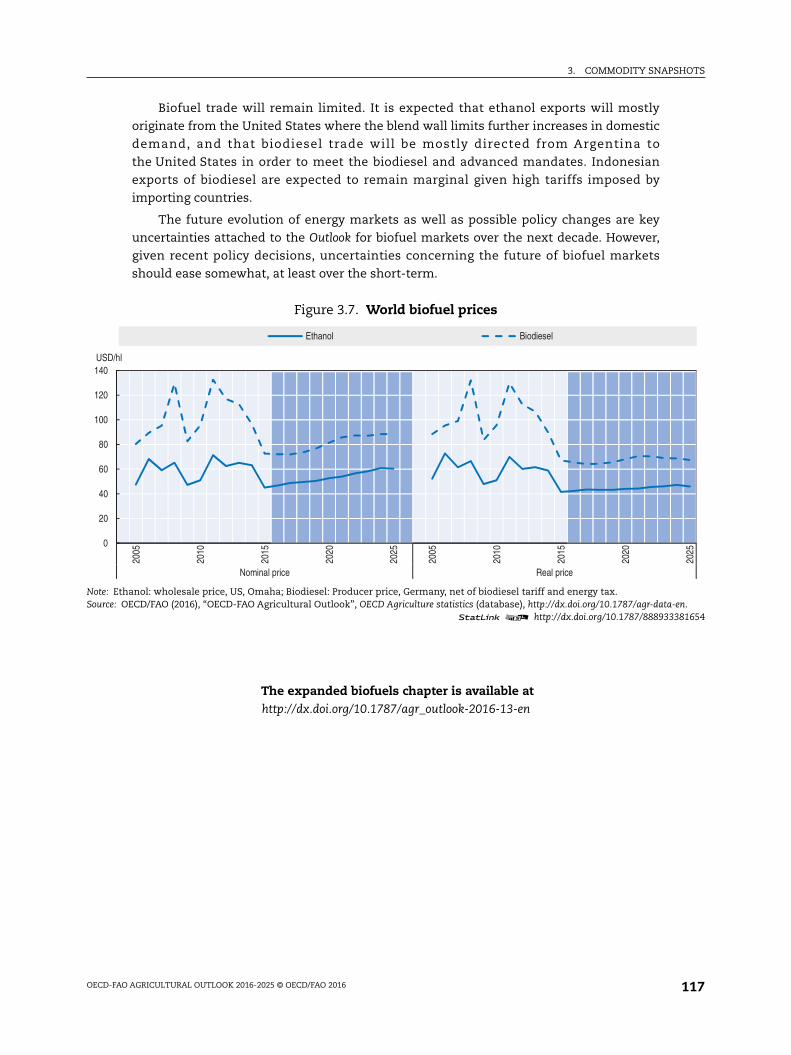
Projection highlightsInternational prices of ethanol and biodiesel are expected to recover in nominal terms
over the outlook period, given developments in crude oil markets and the recovery of prices
of biofuel feedstock (Figure 3.7). Global ethanol production is expected to expand modestly
from 116 Bln L in 2015 to 128.4 Bln L by 2025. Half of this growth will originate from Brazil.
The expansion of global biodiesel production will be driven by policies in place in
the United States, Argentina, Brazil and Indonesia, and to a lesser extent the fulfilment of
the RED target in the European Union. It is expected to increase from 31 Bln L in 2015 to
41.4 Bln L by 2025. Advanced biofuels are not expected to take off over the projection
period.
For the United States, this Outlook assumes that the 10% ethanol blend wall6 will
continue to limit growth in ethanol use, that biodiesel use will expand due to a stronger
advanced mandate and that cellulosic ethanol will not be available on a large scale. The
cellulosic mandate will be mostly met with renewable compressed natural gas and
renewable liquefied natural gas. In the European Union, the proportion of total transport
energy accounted for by biofuels, including double counting for sustainable biofuels is
expected to reach 6.3% by 2020. The remainder of the 10% RED target will be met from other
renewable energy sources such as electric cars.
In Brazil, it is assumed that prices will remain favourable to hydrous ethanol use
rather than gasohol and thus a sustained demand for ethanol, mostly met by domestic
production, will prevail over the outlook period. Indonesian biodiesel production will be
used mainly to meet domestic mandate-driven demand. For India, the new policies aiming
at compensating sugar mills for high sugar prices will encourage ethanol production from
molasses.
Elsewhere in the world, development of the comparatively minor biofuels markets
depends on a mix of effective policy support and price trends, leading to mixed prospects
across countries.
3. COMMODITY SNAPSHOTS
OECD-FAO AGRICULTURAL OUTLOOK 2016-2025 © OECD/FAO 2016 117
Biofuel trade will remain limited. It is expected that ethanol exports will mostly
originate from the United States where the blend wall limits further increases in domestic
demand, and that biodiesel trade will be mostly directed from Argentina to
the United States in order to meet the biodiesel and advanced mandates. Indonesian
exports of biodiesel are expected to remain marginal given high tariffs imposed by
importing countries.
The future evolution of energy markets as well as possible policy changes are key
uncertainties attached to the Outlook for biofuel markets over the next decade. However,
given recent policy decisions, uncertainties concerning the future of biofuel markets
should ease somewhat, at least over the short-term.
The expanded biofuels chapter is available athttp://dx.doi.org/10.1787/agr_outlook-2016-13-en
Figure 3.7. World biofuel prices
Note: Ethanol: wholesale price, US, Omaha; Biodiesel: Producer price, Germany, net of biodiesel tariff and energy tax.Source: OECD/FAO (2016), “OECD-FAO Agricultural Outlook”, OECD Agriculture statistics (database), http://dx.doi.org/10.1787/agr-data-en.
1 2 http://dx.doi.org/10.1787/888933381654
0
20
40
60
80
100
120
140
2005
2010
2015
2020
2025
2005
2010
2015
2020
2025
Nominal price Real price
USD/hl
Ethanol Biodiesel
BIOFUELS – 1
OECD-FAO AGRICULTURAL OUTLOOK 2016 © OECD:FAO 2016
BIOFUELS
Main assumptions
Since the early 2000s, the development of global biofuel markets has been driven by policies fostering their production and use. Policies were initially motivated by a combination of factors, including the view that biofuel use would improve energy security and reduce greenhouse gas emissions (GHG). Government support for the biofuel industry takes the form of blending mandates, exemptions from taxes applied to corresponding petroleum fuels, and investment support. Biofuel markets are also affected by sustainability criteria, fuel quality standards, and import tariffs on ethanol and biodiesel. The projections presented in this Outlook are based on a set of assumptions concerning the evolution of biofuel policies around the world in the medium term.
In the United States, the Energy Independence and Security Act (EISA) of 2007 defined the Renewable Fuel Standard programme known as RFS2.1 Under this programme, EISA established four quantitative annual mandates up to 2022: the total and advanced mandates that require fuels to achieve respectively at least a 20% and a 50% GHG reduction as well as the biodiesel and the cellulosic mandates that are nested within the advanced mandate. The Environmental Protection Agency (EPA) provided on an annual basis the minimum quantities for each of the four classes of biofuels required.
The EPA final rulemaking for the years 2014-16 was issued in November 2015. It waives part of the initial levels proposed in 2007 for the total, the advanced and the cellulosic mandates based on the fact that the production capacity for cellulosic ethanol has lagged well behind the mandated quantities specified in EISA and that the ethanol blend wall2 issue represents a circumstance that warrants a reduction in the mandated volumes under the “inadequate domestic supply” general waiver provision in the RFS2. The mandates specified are higher than the proposals made in November 2013 and earlier in 2015. Similar assumptions have been used to derive a level for the mandates in 2017.
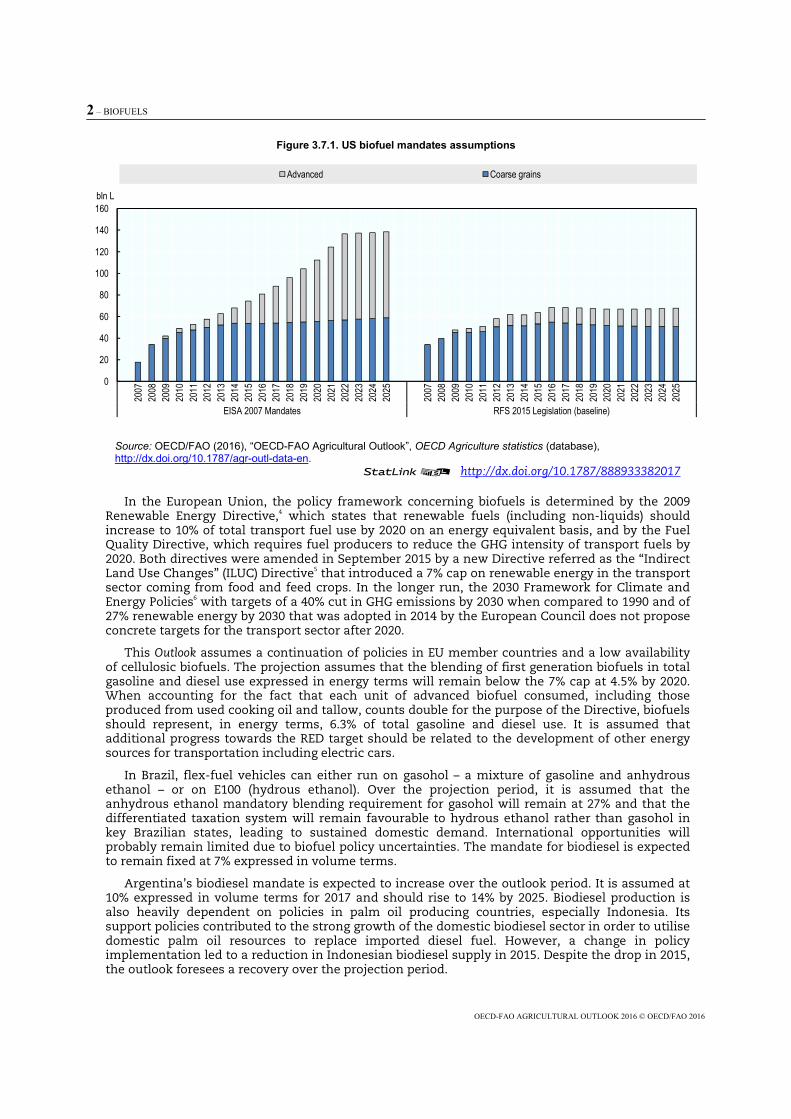
This Outlook assumes from 2018 onwards that the total mandate should remain close to its 2017 level. By 2022, the total mandate should be 50% lower than what was initially specified in RFS2 (Figure 3.7.1). This is due to several factors including decreasing gasoline use, although low crude oil prices support gasoline use in the short term, limitations in the expansion of domestic ethanol use related to the blend wall issue and the difficulties encountered in supplying E15 to US consumers as well as limited development of the flex-fuel vehicle fleet.
The advanced mandate is assumed to expand over the outlook period whereas, given lower gasoline use prospects and the restricted availability of blends going behind the 10% blend wall, the implied maize based ethanol mandate is assumed to decline after 2018. It is also assumed that the biodiesel mandate will rise. Biodiesel like sugarcane based ethanol qualifies for the advanced mandate. Argentinean soybean oil based biodiesel is certified to meet the biodiesel and advanced mandates. The need for sugarcane based ethanol imports to fill the advanced gap3 is expected to be decreasing and limited over the outlook period. In addition, the biodiesel blender tax credit is not expected to be reinstated. By the end of the projection period, it is assumed that only about 2% of the cellulosic mandate specified by EISA will be filled because of a lack of availability and that the difference between the EISA cellulosic mandate and the assumed mandate will be waived. This mandate will be mostly met with renewable compressed natural gas and renewable liquefied natural gas.
2 – BIOFUELS
OECD-FAO AGRICULTURAL OUTLOOK 2016 © OECD/FAO 2016
Figure 3.7.1. US biofuel mandates assumptions
Source: OECD/FAO (2016), “OECD-FAO Agricultural Outlook”, OECD Agriculture statistics (database), http://dx.doi.org/10.1787/agr-outl-data-en.
12 http://dx.doi.org/10.1787/888933382017
In the European Union, the policy framework concerning biofuels is determined by the 2009 Renewable Energy Directive,4 which states that renewable fuels (including non-liquids) should increase to 10% of total transport fuel use by 2020 on an energy equivalent basis, and by the Fuel Quality Directive, which requires fuel producers to reduce the GHG intensity of transport fuels by 2020. Both directives were amended in September 2015 by a new Directive referred as the “Indirect Land Use Changes” (ILUC) Directive5 that introduced a 7% cap on renewable energy in the transport sector coming from food and feed crops. In the longer run, the 2030 Framework for Climate and Energy Policies6 with targets of a 40% cut in GHG emissions by 2030 when compared to 1990 and of 27% renewable energy by 2030 that was adopted in 2014 by the European Council does not propose concrete targets for the transport sector after 2020.
This Outlook assumes a continuation of policies in EU member countries and a low availability of cellulosic biofuels. The projection assumes that the blending of first generation biofuels in total gasoline and diesel use expressed in energy terms will remain below the 7% cap at 4.5% by 2020. When accounting for the fact that each unit of advanced biofuel consumed, including those produced from used cooking oil and tallow, counts double for the purpose of the Directive, biofuels should represent, in energy terms, 6.3% of total gasoline and diesel use. It is assumed that additional progress towards the RED target should be related to the development of other energy sources for transportation including electric cars.
In Brazil, flex-fuel vehicles can either run on gasohol – a mixture of gasoline and anhydrous ethanol – or on E100 (hydrous ethanol). Over the projection period, it is assumed that the anhydrous ethanol mandatory blending requirement for gasohol will remain at 27% and that the differentiated taxation system will remain favourable to hydrous ethanol rather than gasohol in key Brazilian states, leading to sustained domestic demand. International opportunities will probably remain limited due to biofuel policy uncertainties. The mandate for biodiesel is expected to remain fixed at 7% expressed in volume terms.
Argentina’s biodiesel mandate is expected to increase over the outlook period. It is assumed at 10% expressed in volume terms for 2017 and should rise to 14% by 2025. Biodiesel production is also heavily dependent on policies in palm oil producing countries, especially Indonesia. Its support policies contributed to the strong growth of the domestic biodiesel sector in order to utilise domestic palm oil resources to replace imported diesel fuel. However, a change in policy implementation led to a reduction in Indonesian biodiesel supply in 2015. Despite the drop in 2015, the outlook foresees a recovery over the projection period.
0
20
40
60
80
100
120
140
160
2007
2008
2009
2010
2011
2012
2013
2014
2015
2016
2017
2018
2019
2020
2021
2022
2023
2024
2025
2007
2008
2009
2010
2011
2012
2013
2014
2015
2016
2017
2018
2019
2020
2021
2022
2023
2024
2025
EISA 2007 Mandates RFS 2015 Legislation (baseline)
bln L
Advanced Coarse grains
BIOFUELS – 3
OECD-FAO AGRICULTURAL OUTLOOK 2016 © OECD:FAO 2016
The government in India is foreseen to enforce an E10 mandate. Increased ethanol demand is expected to be covered by domestic ethanol production which will come mainly from molasses. Molasses prices are expected to increase and this price increase will help to compensate the high sugar cane prices that sugar mills are facing. In Thailand the government maintains its goal for increasing production of ethanol by 9 ML and biodiesel by 7.2 ML per day by 2021, therefore they are expected to contribute to 11% of the world ethanol production increase. This ambitious target relies on heavily subsidising gasohol and biodiesel mandates. Elsewhere in the world, development of the comparatively minor biofuels markets depends on a mix of effective policy support and price trends, leading to mixed prospects across countries.
Prices
In conjunction with the assumed evolution of crude oil prices, the world ethanol price is projected to increase over the projection period from its lowest level of USD 45/hL to reach USD 60.3/hL by 2025 (Figure 3.7.1). Expressed in real terms, the world ethanol price is expected to be 10% higher by 2025. In fact import demand from a variety of countries is expected to remain modest over the outlook period and trade expansion potentials from the United States and Brazil are significant. This means that the pressures on international ethanol markets are not expected to be particularly important.
World biodiesel prices expressed in nominal terms are expected to increase by 22% over the outlook period reflecting partly the projected evolution of vegetable oil prices. Demand for biodiesel should be mostly driven by policies in place and not by market forces. Biodiesel trade is expected to mostly occur between Argentina and the United States to meet the assumed increasing biodiesel mandate and to remain limited in the rest of the world because of duties in place.
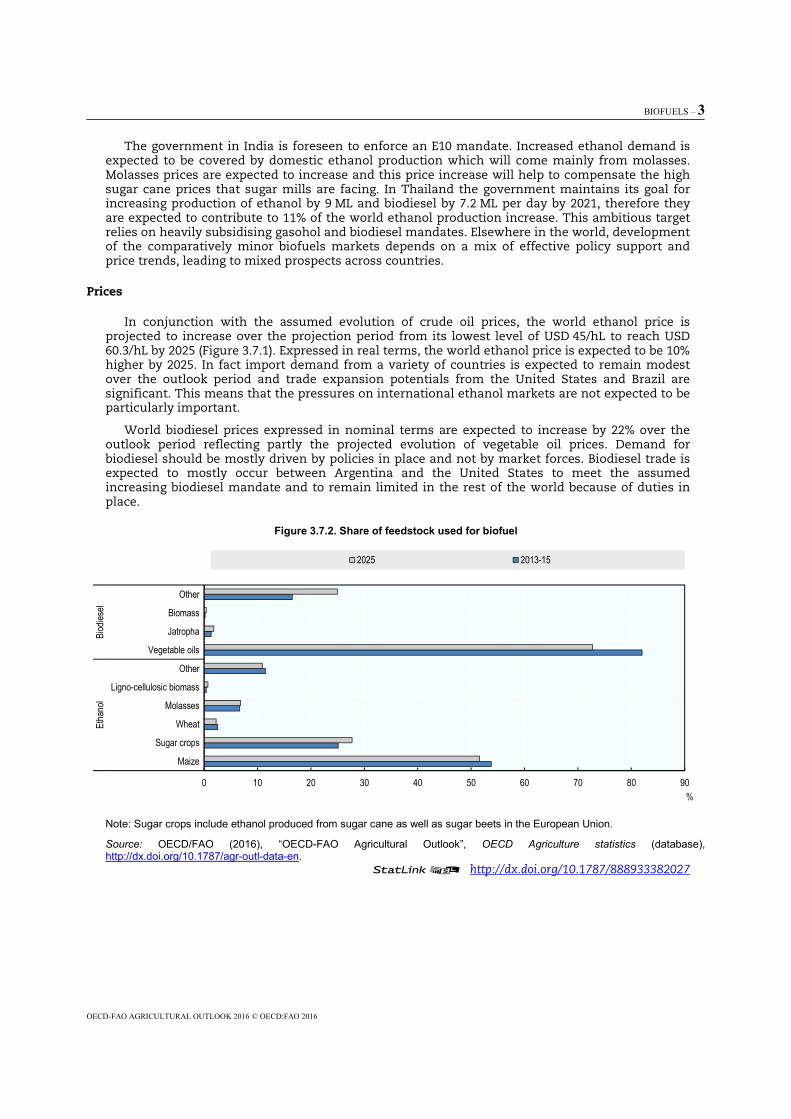
Figure 3.7.2. Share of feedstock used for biofuel
Note: Sugar crops include ethanol produced from sugar cane as well as sugar beets in the European Union.
Source: OECD/FAO (2016), “OECD-FAO Agricultural Outlook”, OECD Agriculture statistics (database), http://dx.doi.org/10.1787/agr-outl-data-en.
12 http://dx.doi.org/10.1787/888933382027
0 10 20 30 40 50 60 70 80 90
Maize
Sugar crops
Wheat
Molasses
Ligno-cellulosic biomass
Other
Vegetable oils
Jatropha
Biomass
Other
Etha
nol
Biod
iesel
%
2025 2013-15
4 – BIOFUELS
OECD-FAO AGRICULTURAL OUTLOOK 2016 © OECD/FAO 2016
Production
Coarse grains and sugarcane will remain the dominant ethanol feedstock. Molasses use in ethanol production will increase in India. Vegetable oil continues as the feedstock of choice in biodiesel production (Figure 3.7.2). Biodiesel production based on non-agricultural feedstock and in particular waste oil and tallow will develop in the European Union and the United States. Ligno-cellulosic biomass based ethanol is projected to account for less than 1% of world ethanol production by 2025.
Biofuel production is expected to consume 10.4% and 12% of global coarse grains and vegetable oil production respectively in 2025. By 2025, 22% of global sugarcane production should be used to produce ethanol.
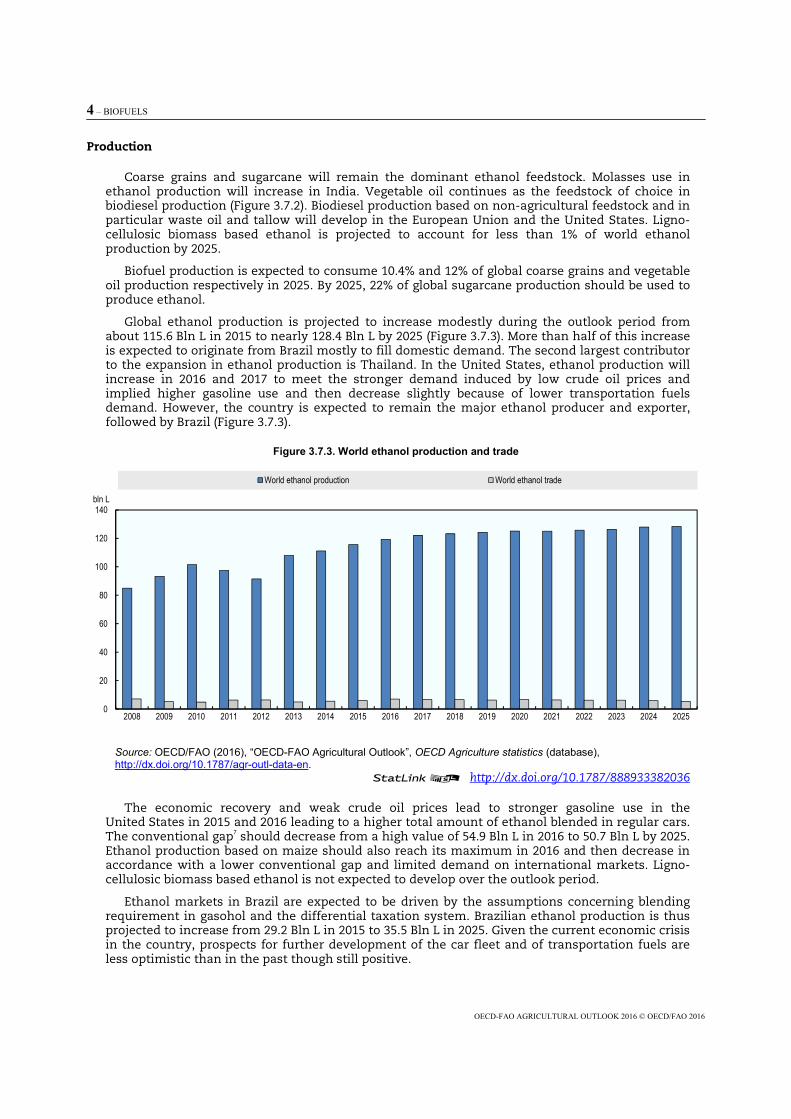
Global ethanol production is projected to increase modestly during the outlook period from about 115.6 Bln L in 2015 to nearly 128.4 Bln L by 2025 (Figure 3.7.3). More than half of this increase is expected to originate from Brazil mostly to fill domestic demand. The second largest contributor to the expansion in ethanol production is Thailand. In the United States, ethanol production will increase in 2016 and 2017 to meet the stronger demand induced by low crude oil prices and implied higher gasoline use and then decrease slightly because of lower transportation fuels demand. However, the country is expected to remain the major ethanol producer and exporter, followed by Brazil (Figure 3.7.3).
Figure 3.7.3. World ethanol production and trade
Source: OECD/FAO (2016), “OECD-FAO Agricultural Outlook”, OECD Agriculture statistics (database), http://dx.doi.org/10.1787/agr-outl-data-en.
12 http://dx.doi.org/10.1787/888933382036
The economic recovery and weak crude oil prices lead to stronger gasoline use in the United States in 2015 and 2016 leading to a higher total amount of ethanol blended in regular cars. The conventional gap7 should decrease from a high value of 54.9 Bln L in 2016 to 50.7 Bln L by 2025. Ethanol production based on maize should also reach its maximum in 2016 and then decrease in accordance with a lower conventional gap and limited demand on international markets. Ligno-cellulosic biomass based ethanol is not expected to develop over the outlook period.
Ethanol markets in Brazil are expected to be driven by the assumptions concerning blending requirement in gasohol and the differential taxation system. Brazilian ethanol production is thus projected to increase from 29.2 Bln L in 2015 to 35.5 Bln L in 2025. Given the current economic crisis in the country, prospects for further development of the car fleet and of transportation fuels are less optimistic than in the past though still positive.
0
20
40
60
80
100
120
140
2008 2009 2010 2011 2012 2013 2014 2015 2016 2017 2018 2019 2020 2021 2022 2023 2024 2025
bln L
World ethanol production World ethanol trade
BIOFUELS – 5
OECD-FAO AGRICULTURAL OUTLOOK 2016 © OECD:FAO 2016
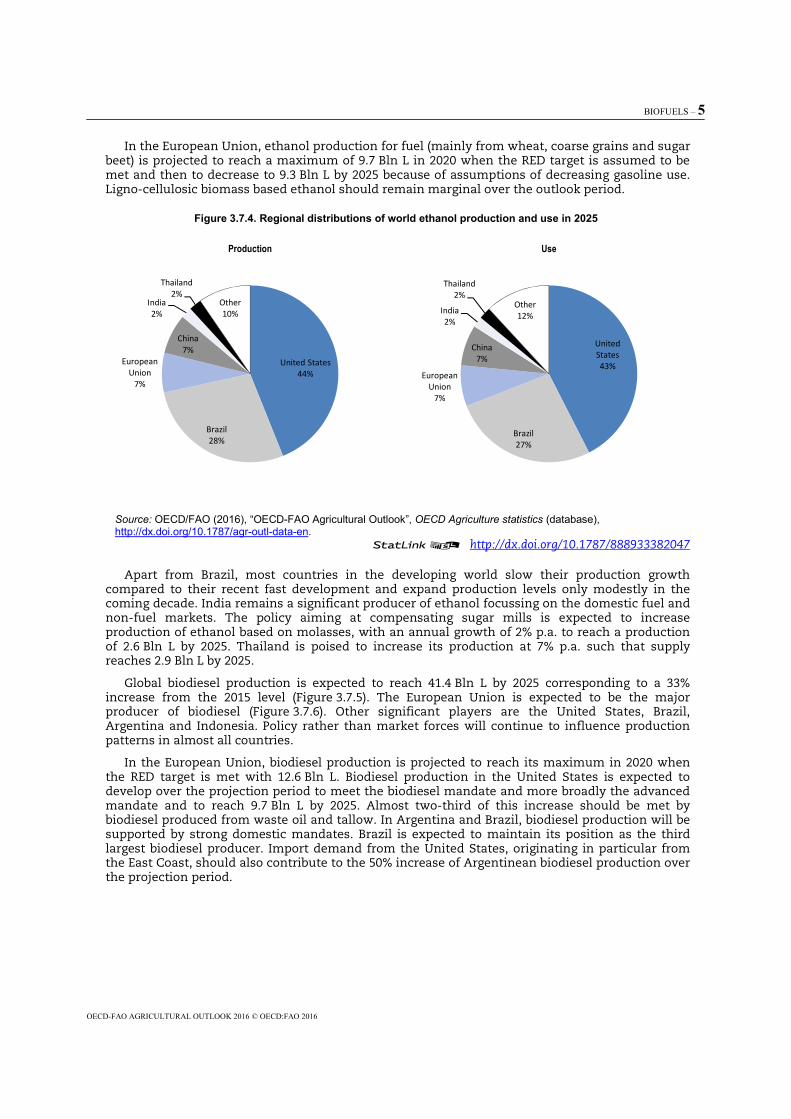
In the European Union, ethanol production for fuel (mainly from wheat, coarse grains and sugar beet) is projected to reach a maximum of 9.7 Bln L in 2020 when the RED target is assumed to be met and then to decrease to 9.3 Bln L by 2025 because of assumptions of decreasing gasoline use. Ligno-cellulosic biomass based ethanol should remain marginal over the outlook period.
Figure 3.7.4. Regional distributions of world ethanol production and use in 2025
Source: OECD/FAO (2016), “OECD-FAO Agricultural Outlook”, OECD Agriculture statistics (database), http://dx.doi.org/10.1787/agr-outl-data-en.
12 http://dx.doi.org/10.1787/888933382047
Apart from Brazil, most countries in the developing world slow their production growth compared to their recent fast development and expand production levels only modestly in the coming decade. India remains a significant producer of ethanol focussing on the domestic fuel and non-fuel markets. The policy aiming at compensating sugar mills is expected to increase production of ethanol based on molasses, with an annual growth of 2% p.a. to reach a production of 2.6 Bln L by 2025. Thailand is poised to increase its production at 7% p.a. such that supply reaches 2.9 Bln L by 2025.
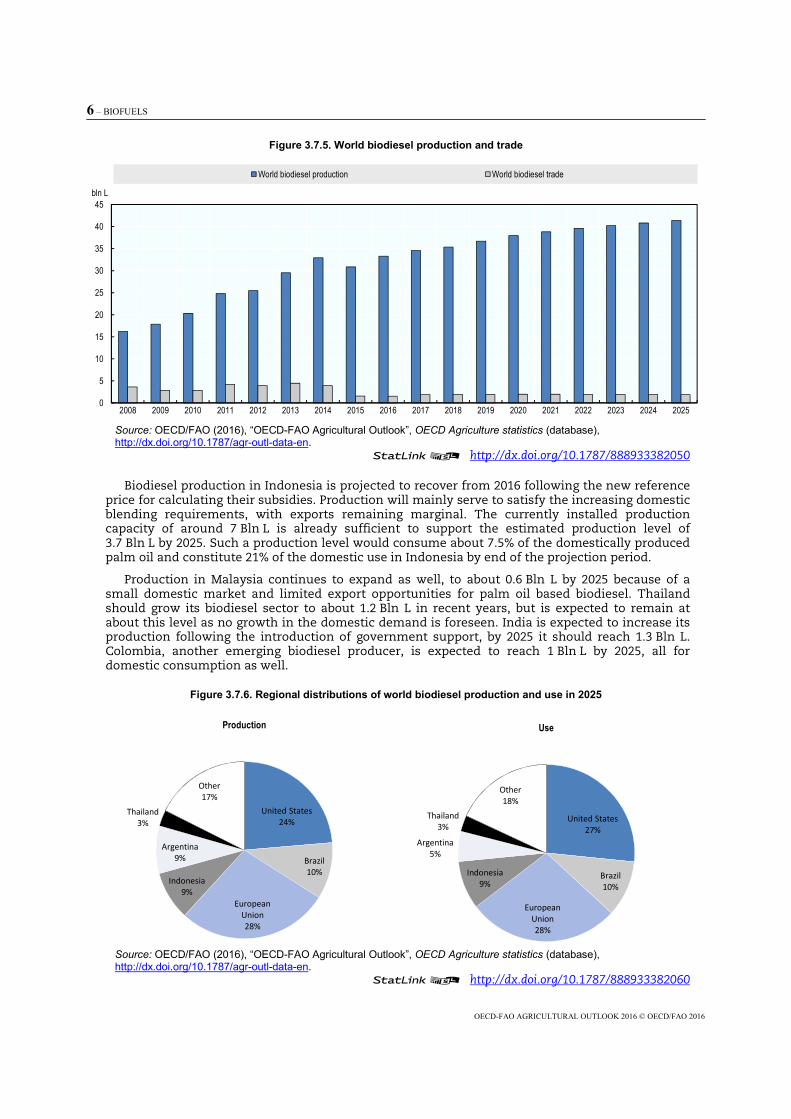
Global biodiesel production is expected to reach 41.4 Bln L by 2025 corresponding to a 33% increase from the 2015 level (Figure 3.7.5). The European Union is expected to be the major producer of biodiesel (Figure 3.7.6). Other significant players are the United States, Brazil, Argentina and Indonesia. Policy rather than market forces will continue to influence production patterns in almost all countries.
In the European Union, biodiesel production is projected to reach its maximum in 2020 when the RED target is met with 12.6 Bln L. Biodiesel production in the United States is expected to develop over the projection period to meet the biodiesel mandate and more broadly the advanced mandate and to reach 9.7 Bln L by 2025. Almost two-third of this increase should be met by biodiesel produced from waste oil and tallow. In Argentina and Brazil, biodiesel production will be supported by strong domestic mandates. Brazil is expected to maintain its position as the third largest biodiesel producer. Import demand from the United States, originating in particular from the East Coast, should also contribute to the 50% increase of Argentinean biodiesel production over the projection period.
United States44%
Brazil28%
European Union
7%
China7%
India2%
Thailand2%
Other10%
Production
United States43%
Brazil27%
European Union
7%
China7%
India2%
Thailand2%
Other12%
Use
6 – BIOFUELS
OECD-FAO AGRICULTURAL OUTLOOK 2016 © OECD/FAO 2016
Figure 3.7.5. World biodiesel production and trade
Source: OECD/FAO (2016), “OECD-FAO Agricultural Outlook”, OECD Agriculture statistics (database), http://dx.doi.org/10.1787/agr-outl-data-en.
12 http://dx.doi.org/10.1787/888933382050
Biodiesel production in Indonesia is projected to recover from 2016 following the new reference price for calculating their subsidies. Production will mainly serve to satisfy the increasing domestic blending requirements, with exports remaining marginal. The currently installed production capacity of around 7 Bln L is already sufficient to support the estimated production level of 3.7 Bln L by 2025. Such a production level would consume about 7.5% of the domestically produced palm oil and constitute 21% of the domestic use in Indonesia by end of the projection period.
Production in Malaysia continues to expand as well, to about 0.6 Bln L by 2025 because of a small domestic market and limited export opportunities for palm oil based biodiesel. Thailand should grow its biodiesel sector to about 1.2 Bln L in recent years, but is expected to remain at about this level as no growth in the domestic demand is foreseen. India is expected to increase its production following the introduction of government support, by 2025 it should reach 1.3 Bln L. Colombia, another emerging biodiesel producer, is expected to reach 1 Bln L by 2025, all for domestic consumption as well.
Figure 3.7.6. Regional distributions of world biodiesel production and use in 2025
Source: OECD/FAO (2016), “OECD-FAO Agricultural Outlook”, OECD Agriculture statistics (database), http://dx.doi.org/10.1787/agr-outl-data-en.
12 http://dx.doi.org/10.1787/888933382060
0
5
10
15
20
25
30
35
40
45
2008 2009 2010 2011 2012 2013 2014 2015 2016 2017 2018 2019 2020 2021 2022 2023 2024 2025
bln L
World biodiesel production World biodiesel trade
United States24%
Brazil10%
European Union28%
Indonesia9%
Argentina9%
Thailand3%
Other17%
Production
United States27%
Brazil10%
European Union28%
Indonesia9%
Argentina5%
Thailand3%
Other18%
Use
BIOFUELS – 7
OECD-FAO AGRICULTURAL OUTLOOK 2016 © OECD:FAO 2016
Consumption
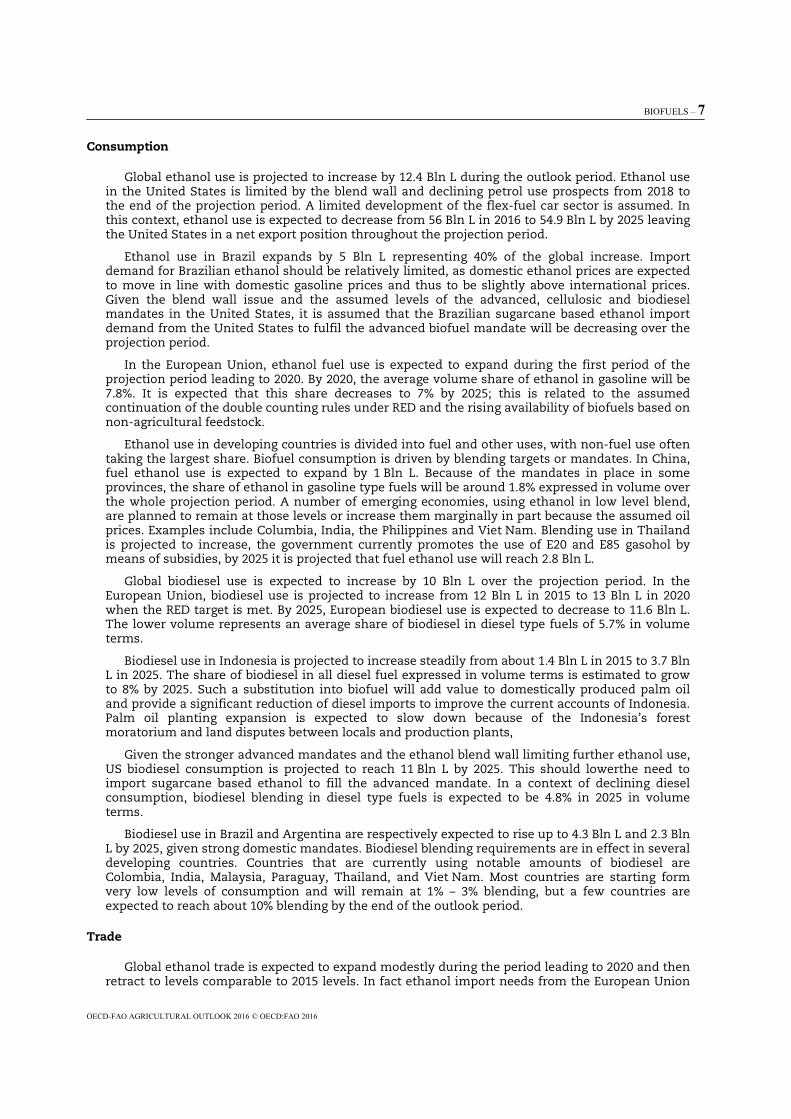
Global ethanol use is projected to increase by 12.4 Bln L during the outlook period. Ethanol use in the United States is limited by the blend wall and declining petrol use prospects from 2018 to the end of the projection period. A limited development of the flex-fuel car sector is assumed. In this context, ethanol use is expected to decrease from 56 Bln L in 2016 to 54.9 Bln L by 2025 leaving the United States in a net export position throughout the projection period.
Ethanol use in Brazil expands by 5 Bln L representing 40% of the global increase. Import demand for Brazilian ethanol should be relatively limited, as domestic ethanol prices are expected to move in line with domestic gasoline prices and thus to be slightly above international prices. Given the blend wall issue and the assumed levels of the advanced, cellulosic and biodiesel mandates in the United States, it is assumed that the Brazilian sugarcane based ethanol import demand from the United States to fulfil the advanced biofuel mandate will be decreasing over the projection period.
In the European Union, ethanol fuel use is expected to expand during the first period of the projection period leading to 2020. By 2020, the average volume share of ethanol in gasoline will be 7.8%. It is expected that this share decreases to 7% by 2025; this is related to the assumed continuation of the double counting rules under RED and the rising availability of biofuels based on non-agricultural feedstock.
Ethanol use in developing countries is divided into fuel and other uses, with non-fuel use often taking the largest share. Biofuel consumption is driven by blending targets or mandates. In China, fuel ethanol use is expected to expand by 1 Bln L. Because of the mandates in place in some provinces, the share of ethanol in gasoline type fuels will be around 1.8% expressed in volume over the whole projection period. A number of emerging economies, using ethanol in low level blend, are planned to remain at those levels or increase them marginally in part because the assumed oil prices. Examples include Columbia, India, the Philippines and Viet Nam. Blending use in Thailand is projected to increase, the government currently promotes the use of E20 and E85 gasohol by means of subsidies, by 2025 it is projected that fuel ethanol use will reach 2.8 Bln L.
Global biodiesel use is expected to increase by 10 Bln L over the projection period. In the European Union, biodiesel use is projected to increase from 12 Bln L in 2015 to 13 Bln L in 2020 when the RED target is met. By 2025, European biodiesel use is expected to decrease to 11.6 Bln L. The lower volume represents an average share of biodiesel in diesel type fuels of 5.7% in volume terms.
Biodiesel use in Indonesia is projected to increase steadily from about 1.4 Bln L in 2015 to 3.7 Bln L in 2025. The share of biodiesel in all diesel fuel expressed in volume terms is estimated to grow to 8% by 2025. Such a substitution into biofuel will add value to domestically produced palm oil and provide a significant reduction of diesel imports to improve the current accounts of Indonesia. Palm oil planting expansion is expected to slow down because of the Indonesia’s forest moratorium and land disputes between locals and production plants,
Given the stronger advanced mandates and the ethanol blend wall limiting further ethanol use, US biodiesel consumption is projected to reach 11 Bln L by 2025. This should lowerthe need to import sugarcane based ethanol to fill the advanced mandate. In a context of declining diesel consumption, biodiesel blending in diesel type fuels is expected to be 4.8% in 2025 in volume terms.
Biodiesel use in Brazil and Argentina are respectively expected to rise up to 4.3 Bln L and 2.3 Bln L by 2025, given strong domestic mandates. Biodiesel blending requirements are in effect in several developing countries. Countries that are currently using notable amounts of biodiesel are Colombia, India, Malaysia, Paraguay, Thailand, and Viet Nam. Most countries are starting form very low levels of consumption and will remain at 1% – 3% blending, but a few countries are expected to reach about 10% blending by the end of the outlook period.
Trade
Global ethanol trade is expected to expand modestly during the period leading to 2020 and then retract to levels comparable to 2015 levels. In fact ethanol import needs from the European Union
8 – BIOFUELS
OECD-FAO AGRICULTURAL OUTLOOK 2016 © OECD/FAO 2016
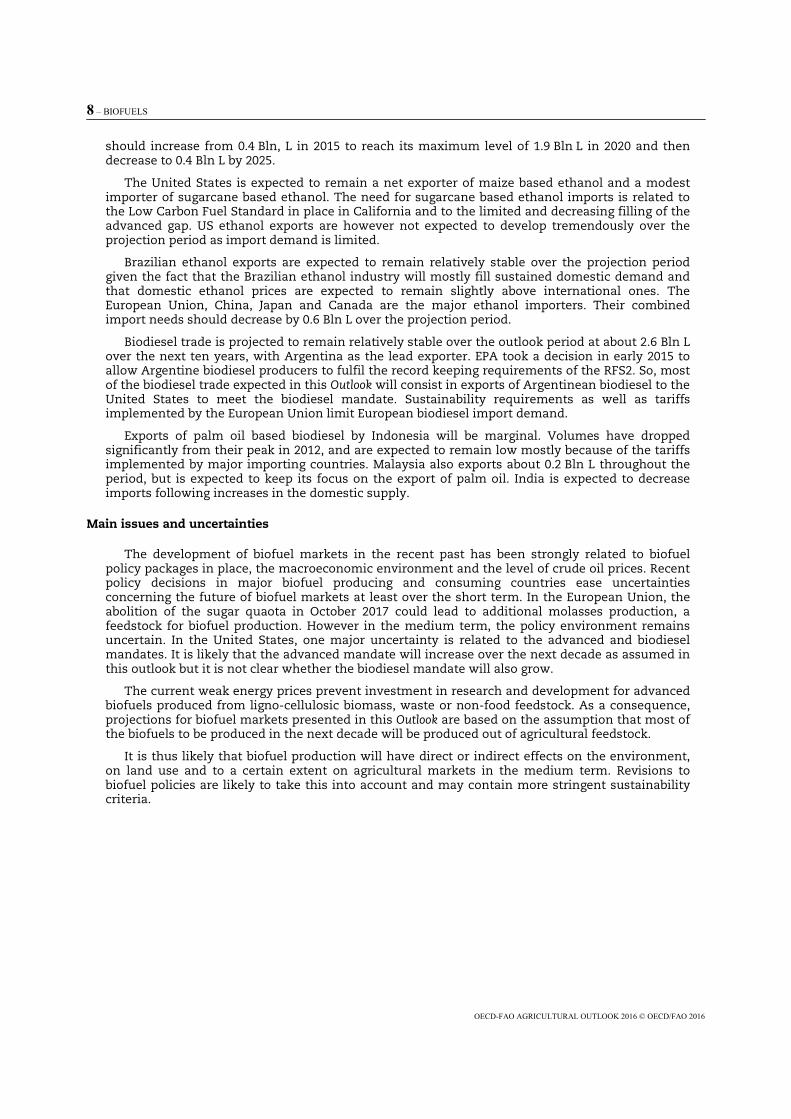
should increase from 0.4 Bln, L in 2015 to reach its maximum level of 1.9 Bln L in 2020 and then decrease to 0.4 Bln L by 2025.
The United States is expected to remain a net exporter of maize based ethanol and a modest importer of sugarcane based ethanol. The need for sugarcane based ethanol imports is related to the Low Carbon Fuel Standard in place in California and to the limited and decreasing filling of the advanced gap. US ethanol exports are however not expected to develop tremendously over the projection period as import demand is limited.
Brazilian ethanol exports are expected to remain relatively stable over the projection period given the fact that the Brazilian ethanol industry will mostly fill sustained domestic demand and that domestic ethanol prices are expected to remain slightly above international ones. The European Union, China, Japan and Canada are the major ethanol importers. Their combined import needs should decrease by 0.6 Bln L over the projection period.
Biodiesel trade is projected to remain relatively stable over the outlook period at about 2.6 Bln L over the next ten years, with Argentina as the lead exporter. EPA took a decision in early 2015 to allow Argentine biodiesel producers to fulfil the record keeping requirements of the RFS2. So, most of the biodiesel trade expected in this Outlook will consist in exports of Argentinean biodiesel to the United States to meet the biodiesel mandate. Sustainability requirements as well as tariffs implemented by the European Union limit European biodiesel import demand.
Exports of palm oil based biodiesel by Indonesia will be marginal. Volumes have dropped significantly from their peak in 2012, and are expected to remain low mostly because of the tariffs implemented by major importing countries. Malaysia also exports about 0.2 Bln L throughout the period, but is expected to keep its focus on the export of palm oil. India is expected to decrease imports following increases in the domestic supply.
Main issues and uncertainties
The development of biofuel markets in the recent past has been strongly related to biofuel policy packages in place, the macroeconomic environment and the level of crude oil prices. Recent policy decisions in major biofuel producing and consuming countries ease uncertainties concerning the future of biofuel markets at least over the short term. In the European Union, the abolition of the sugar quaota in October 2017 could lead to additional molasses production, a feedstock for biofuel production. However in the medium term, the policy environment remains uncertain. In the United States, one major uncertainty is related to the advanced and biodiesel mandates. It is likely that the advanced mandate will increase over the next decade as assumed in this outlook but it is not clear whether the biodiesel mandate will also grow.
The current weak energy prices prevent investment in research and development for advanced biofuels produced from ligno-cellulosic biomass, waste or non-food feedstock. As a consequence, projections for biofuel markets presented in this Outlook are based on the assumption that most of the biofuels to be produced in the next decade will be produced out of agricultural feedstock.
It is thus likely that biofuel production will have direct or indirect effects on the environment, on land use and to a certain extent on agricultural markets in the medium term. Revisions to biofuel policies are likely to take this into account and may contain more stringent sustainability criteria.
BIOFUELS – 9
OECD-FAO AGRICULTURAL OUTLOOK 2016 © OECD:FAO 2016
Notes
1. http://www.epa.gov/OTAQ/fuels/renewablefuels/
2. The blend wall term refers to short run technical constraints that act as an impediment to increased ethanol use. Even if the maximum blend of ethanol for conventional petrol vehicles is set in the United States at 15% for vehicles produced in 2001 or later, E10 is still the most commonly available gasohol in the United States. E10 refers to gasohol with 10% volume of ethanol blended into petrol.
3. The advanced gap corresponds to the difference between the advanced mandate, and the biodiesel and cellulosic mandates. It corresponds to fuels being able to achieve a 50% greenhouse gas reduction.
4. http://eur-lex.europa.eu/LexUriServ/LexUriServ.do?uri=OJ:L:2009:140:0016:0062:EN:PDF.
5 Directive (EU) 2015/1513
6. http://ec.europa.eu/clima/policies/2030/index_en.htm
7. The conventional gap is the difference between the total and advanced mandates as defined by the Renewable Fuel Standard (RFS2). It is often seen as an implied maize based ethanol mandate. The assumed mandate levels are based on the blend wall limit and on the evolution of gasoline use in the United States.
ANNEX: COMMODITY SNAPSHOT TABLES
OECD-FAO AGRICULTURAL OUTLOOK 2016-2025 © OECD/FAO 2016132
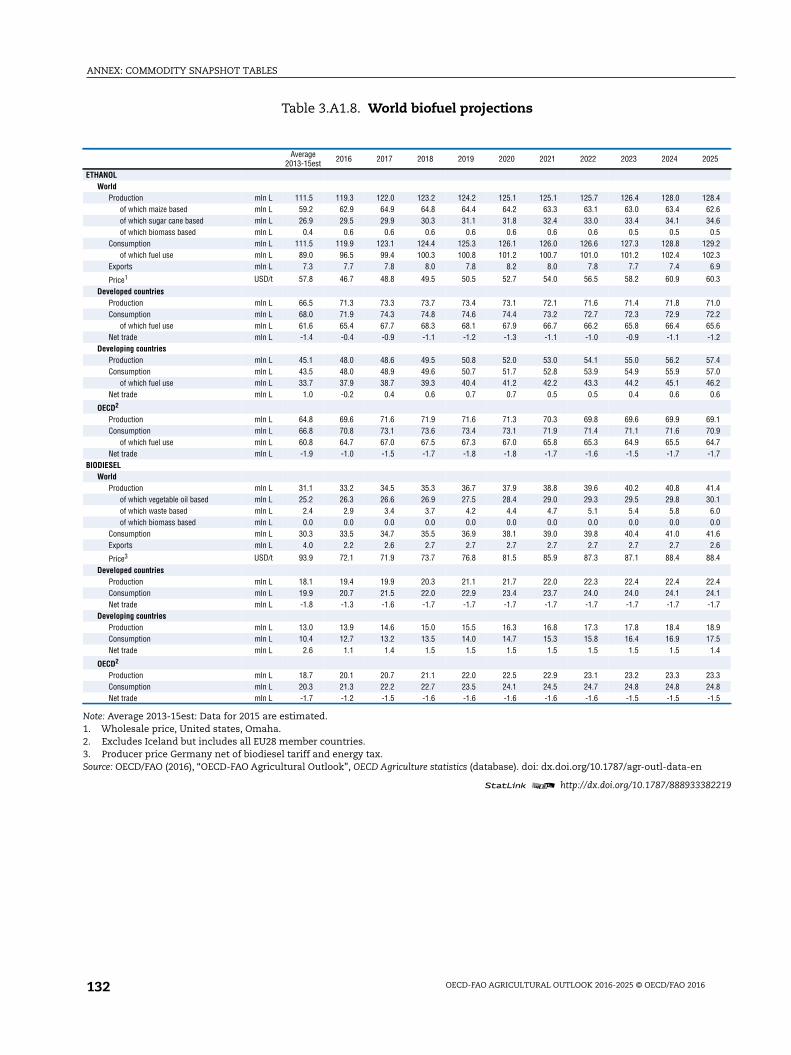
Table 3.A1.8. World biofuel projections
1 2 http://dx.doi.org/10.1787/888933382219
Note: Average 2013-15est: Data for 2015 are estimated.1. Wholesale price, United states, Omaha.2. Excludes Iceland but includes all EU28 member countries.3. Producer price Germany net of biodiesel tariff and energy tax.Source: OECD/FAO (2016), “OECD-FAO Agricultural Outlook”, OECD Agriculture statistics (database). doi: dx.doi.org/10.1787/agr-outl-data-en
Average2013-15est 2016 2017 2018 2019 2020 2021 2022 2023 2024 2025
ETHANOLWorld
Production mln L 111.5 119.3 122.0 123.2 124.2 125.1 125.1 125.7 126.4 128.0 128.4of which maize based mln L 59.2 62.9 64.9 64.8 64.4 64.2 63.3 63.1 63.0 63.4 62.6of which sugar cane based mln L 26.9 29.5 29.9 30.3 31.1 31.8 32.4 33.0 33.4 34.1 34.6of which biomass based mln L 0.4 0.6 0.6 0.6 0.6 0.6 0.6 0.6 0.5 0.5 0.5
Consumption mln L 111.5 119.9 123.1 124.4 125.3 126.1 126.0 126.6 127.3 128.8 129.2of which fuel use mln L 89.0 96.5 99.4 100.3 100.8 101.2 100.7 101.0 101.2 102.4 102.3
Exports mln L 7.3 7.7 7.8 8.0 7.8 8.2 8.0 7.8 7.7 7.4 6.9
Price1 USD/t 57.8 46.7 48.8 49.5 50.5 52.7 54.0 56.5 58.2 60.9 60.3
Developed countriesProduction mln L 66.5 71.3 73.3 73.7 73.4 73.1 72.1 71.6 71.4 71.8 71.0Consumption mln L 68.0 71.9 74.3 74.8 74.6 74.4 73.2 72.7 72.3 72.9 72.2
of which fuel use mln L 61.6 65.4 67.7 68.3 68.1 67.9 66.7 66.2 65.8 66.4 65.6Net trade mln L -1.4 -0.4 -0.9 -1.1 -1.2 -1.3 -1.1 -1.0 -0.9 -1.1 -1.2
Developing countriesProduction mln L 45.1 48.0 48.6 49.5 50.8 52.0 53.0 54.1 55.0 56.2 57.4Consumption mln L 43.5 48.0 48.9 49.6 50.7 51.7 52.8 53.9 54.9 55.9 57.0
of which fuel use mln L 33.7 37.9 38.7 39.3 40.4 41.2 42.2 43.3 44.2 45.1 46.2Net trade mln L 1.0 -0.2 0.4 0.6 0.7 0.7 0.5 0.5 0.4 0.6 0.6
OECD2
Production mln L 64.8 69.6 71.6 71.9 71.6 71.3 70.3 69.8 69.6 69.9 69.1Consumption mln L 66.8 70.8 73.1 73.6 73.4 73.1 71.9 71.4 71.1 71.6 70.9
of which fuel use mln L 60.8 64.7 67.0 67.5 67.3 67.0 65.8 65.3 64.9 65.5 64.7Net trade mln L -1.9 -1.0 -1.5 -1.7 -1.8 -1.8 -1.7 -1.6 -1.5 -1.7 -1.7
BIODIESELWorld
Production mln L 31.1 33.2 34.5 35.3 36.7 37.9 38.8 39.6 40.2 40.8 41.4of which vegetable oil based mln L 25.2 26.3 26.6 26.9 27.5 28.4 29.0 29.3 29.5 29.8 30.1of which waste based mln L 2.4 2.9 3.4 3.7 4.2 4.4 4.7 5.1 5.4 5.8 6.0of which biomass based mln L 0.0 0.0 0.0 0.0 0.0 0.0 0.0 0.0 0.0 0.0 0.0
Consumption mln L 30.3 33.5 34.7 35.5 36.9 38.1 39.0 39.8 40.4 41.0 41.6Exports mln L 4.0 2.2 2.6 2.7 2.7 2.7 2.7 2.7 2.7 2.7 2.6
Price3 USD/t 93.9 72.1 71.9 73.7 76.8 81.5 85.9 87.3 87.1 88.4 88.4
Developed countriesProduction mln L 18.1 19.4 19.9 20.3 21.1 21.7 22.0 22.3 22.4 22.4 22.4Consumption mln L 19.9 20.7 21.5 22.0 22.9 23.4 23.7 24.0 24.0 24.1 24.1Net trade mln L -1.8 -1.3 -1.6 -1.7 -1.7 -1.7 -1.7 -1.7 -1.7 -1.7 -1.7
Developing countriesProduction mln L 13.0 13.9 14.6 15.0 15.5 16.3 16.8 17.3 17.8 18.4 18.9Consumption mln L 10.4 12.7 13.2 13.5 14.0 14.7 15.3 15.8 16.4 16.9 17.5Net trade mln L 2.6 1.1 1.4 1.5 1.5 1.5 1.5 1.5 1.5 1.5 1.4
OECD2
Production mln L 18.7 20.1 20.7 21.1 22.0 22.5 22.9 23.1 23.2 23.3 23.3Consumption mln L 20.3 21.3 22.2 22.7 23.5 24.1 24.5 24.7 24.8 24.8 24.8Net trade mln L -1.7 -1.2 -1.5 -1.6 -1.6 -1.6 -1.6 -1.6 -1.5 -1.5 -1.5
From:OECD-FAO Agricultural Outlook 2016-2025
Access the complete publication at:http://dx.doi.org/10.1787/agr_outlook-2016-en
Please cite this chapter as:
OECD/FAO (2016), “Biofuels”, in OECD-FAO Agricultural Outlook 2016-2025, OECD Publishing, Paris.
DOI: http://dx.doi.org/10.1787/agr_outlook-2016-13-en
This work is published under the responsibility of the Secretary-General of the OECD and the Director-General of the FAO. Theopinions expressed and arguments employed herein do not necessarily reflect the official views of OECD member countries, orthe governments of the FAO member countries.
This document and any map included herein are without prejudice to the status of or sovereignty over any territory, to thedelimitation of international frontiers and boundaries and to the name of any territory, city or area.
You can copy, download or print OECD content for your own use, and you can include excerpts from OECD publications,databases and multimedia products in your own documents, presentations, blogs, websites and teaching materials, providedthat suitable acknowledgment of OECD as source and copyright owner is given. All requests for public or commercial use andtranslation rights should be submitted to [email protected]. Requests for permission to photocopy portions of this material forpublic or commercial use shall be addressed directly to the Copyright Clearance Center (CCC) at [email protected] or theCentre français d’exploitation du droit de copie (CFC) at [email protected].