Embed Size (px)
Citation preview
30 ECTS
Umhverfis og auðlindafræði
Biofuel Production Methods Based on Icelandic Feedstocks: An Environmental and Economic
Comparison
Elizabeth Unger
Hagfræðideild Háskóla Íslands
Leiðbeinandi: Brynhildur Daviðsdóttir
febrúar 2009

30 ECTS
Umhverfis og auðlindafræði
Biofuel Production Methods Based on Icelandic Feedstocks: An Environmental and Economic
Comparison
Elizabeth Unger
Hagfræðideild Háskóla Íslands
Leiðbeinandi: Brynhildur Daviðsdóttir
febrúar 2009


ii
ABSTRACT
Due to rising concerns of energy security and the environmental implications of using fossil fuels, there is a need to explore other fuel options. The objective of this thesis is to compare different biofuel production methods from an environmental and economic perspective and to evaluate potential implications for Iceland. The environmental implications are assessed using a “well-to-tank” (WTT) perspective, meaning in general terms the boundaries extend from the cultivation and harvest, feedstock transport, biofuel production, and finally biofuel transport. Economic implications are assessed using conventional break-even point analysis.
Results indicate that when bioethanol is produced from timber employing a bio-chemical conversion method, this yields the least impact (7.26 CO2 eq. g/MJ) to environmental categories such as global warming potential (GWP), however if using the thermal-chemical platform, the utilization of timber to produce Fisher-Tropsch biodiesel (FTD) has the least impact to acidification potential (AP) (01 to .14 SO2 eq. g/MJ). At the same time, FTD had the highest and lowest impact to POCP, depending on the feedstock (.01 to .09 C2H4 eq. g/MJ). Both types of technology reported the same in regard to eutrophication potential (EP) and that the application of fertilizer from cultivation had the largest impact. In contrast, when the organic fraction of municipal solid waste is used to make bioethanol and biodiesel from rapeseed this yielded the largest impact to GWP (86 to 80 CO2 eq. g/MJ) explained by the high moisture content, transportation and low lignin content. However, more research is needed to estimate the environmental impact in the production of biofuels in Iceland, based on Icelandic circumstances.
In conclusion based on quantity estimates of the selected Icelandic feedstocks and assuming that equal hectares of land as already cultivated land, is transformed to producing energy crops and increasing forest cover by 300%, beyond what is already planned, the potential quantity of displaced petroleum products in Iceland ranges from <0.1 % (FTD-recycled newspaper) to 68% (second generation bioethanol from wheat).

iii
ACKNOWLEDGEMENTS
This thesis is the result of a collaborative research project between the University of Iceland and Icelandic New Energy Ltd. and is a partial fulfillment of the requirements for my M.Sc. degree in environmental science and natural resource management. The project was funded by Reykjavik Energy.
I want to thank my supervisor, Brynhildur Daviðsdóttir, who goes far beyond what is expected and strongly supports her students. She also introduced me to an amazing team at Icelandic New Energy Ltd, Jón Björn Skúlason and María Maack who believe strongly and remain committed to their research and work.
I also owe a very big thank you to Arnar, my husband, for giving me the support I needed. Finally, my children, Freyja and Óðinn, who give me inspiration to make the future a better place.

iv
TABLE OF CONTENTS Abstract ............................................................................................................................. ii
Acknowledgements ............................................................................................................................................... iii
List of Figures .......................................................................................................................................................... vi
List of Tables ........................................................................................................................................................... vii
Nomenclature ........................................................................................................................................................ viii
1 Introduction .............................................................................................................................................................1
1.1 Research Questions ..................................................................................................................................3
1.2 Thesis structure ...........................................................................................................................................4
2 General Introduction to Biofuel Production Methods .........................................................................5
2.1 Liquid Biofuels ..............................................................................................................................................6
2.2 Compressed Natural Gas .......................................................................................................................8
3 Conversion Technologies for Biofuel ...................................................................................................... 11
3.1 Physical-Chemical Conversion ......................................................................................................... 13
3.2 Thermal-Chemical Conversion ......................................................................................................... 15
3.3 Bio-Chemical Conversion .................................................................................................................... 18
4 Biomass Feedstocks and Quantity Estimates .................................................................................... 23
4.1 Timber ............................................................................................................................................................ 23
4.2 Newspaper .................................................................................................................................................. 24
4.3 Municipal Solid Waste ........................................................................................................................... 24
4.4 Winter Wheat ............................................................................................................................................. 25
4.5 Rapeseed ..................................................................................................................................................... 25
4.6 Potential Quantity Estimates .............................................................................................................. 26
5 Methodology ........................................................................................................................................................ 29
5.1 Description of Life Cycle Assessment ........................................................................................... 29
5.2 Methodology for Environmental Comparison ............................................................................ 33
5.3 Methodology for Economic Analysis .............................................................................................. 34
5.3.1 Potential Quantity ............................................................................................................................ 34
5.3.2 Retail Price ......................................................................................................................................... 37
5.3.3 Production Cost ............................................................................................................................... 39
6 Environmental Results ................................................................................................................................... 40
6.1 Global Warming Potential (GWP) .................................................................................................... 40

v
6.2 Acidification Potential (AP) .................................................................................................................. 42
6.3 Eutrophication Potential (EP) ............................................................................................................. 44
6.4 Photochemical oxidant creation Potential (POCP) ................................................................. 45
6.5 Summary of Environmental Results ............................................................................................... 46
7 Economic results ............................................................................................................................................... 49
8 Discussion ............................................................................................................................................................ 53
9 Conclusion ............................................................................................................................................................ 59
10 Studies Limitations and Future Research .......................................................................................... 61
Bibliography ............................................................................................................................................................. 62
vi
LIST OF FIGURES Figure 1: Distribution of CO2 emissions by source in 2006. .............................................. 2 Figure 2: Evolution of bioethanol and biodiesel production in EU -27. .............................. 7 Figure 3: Primary production of biogas in Europe. ............................................................ 9 Figure 4: Biomass composition........................................................................................ 11 Figure 5: Illustration of the three general production pathways for biomass energy
sources ............................................................................................................. 13 Figure 6: Overview of biodiesel production...................................................................... 14 Figure 7: A general production scheme for landfilled captured biogas. ........................... 17 Figure 8: BTL production process employing thermal chemical technology. ................... 18 Figure 9: Schematic illustrating the ethanol fuel production. ........................................... 20 Figure 10: Material flow and environmental interventions across the life cycle
stages in a biofuel system. .............................................................................. 30 Figure 11: World oil prices 1980-2030 (2005 dollars) ...................................................... 39 Figure 12: Results comparing the impact to global warming potential ............................ 41 Figure 13: Results comparing the potential impact to acidification .................................. 43 Figure 14: Results comparing the impact to Eutrophication ............................................ 44 Figure 15: Results comparing the impact to photochemical ozone formation ................. 45 Figure 16: Break-even analysis of rapeseed biodiesel production in Iceland .................. 49 Figure 17: Break-even analysis of second generation bioethanol produced from
timber .............................................................................................................. 50 Figure 18: Break-even analysis of second generation bioethanol produced from
wheat ............................................................................................................... 51 Figure 19: Break-even analysis of second generation FT-Diesel produced from
Icelandic timber, .............................................................................................. 51 Figure 20: Break-even analysis of second generation FT-Diesel produced from
Icelandic wheat ................................................................................................. 52

vii
LIST OF TABLES Table 1: Main assumptions used to calculate potential quantities for different
types of biofuels ................................................................................................................................. 27 Table 2: Percentage capacity of selected biofuels to fulfill total Icelandic
consumption of petroleum ............................................................................................................ 28 Table 3: Environmental categories selected and adapted by ISO ............................................... 32 Table 4: The corresponding lower heating values (MJ/L) ................................................................ 33 Table 5: Main assumptions used to calculate potential quantity of biofuels for
specific feedstocks ........................................................................................................................... 36 Table 6: Fuels and corresponding lower heating values (LHV). ................................................... 37 Table 7: Retail price for E85 and biodiesel for 2008. ......................................................................... 38 Table 8: IEA 2nd-generation biofuel cost assumptions for 2010 and 2030 ............................ 39 Table 9: Environmental ranking of selected biofuels based on performance in
each environmental category. .................................................................................................... 46

viii
NOMENCLATURE
AP B20 B100 CPI E85 EP FTD GHG GWP ISO LCI LCA LCIA LHV MJ OFMSW OPEC POCP RME RON RTFO WTT WTW
Acidification Potential 80% diesel, 20% biodiesel 100% biodiesel Consumer price index 85% gasoline, 15% bioethanol Eutrophication Potential Fisher-Tropsch diesel Greenhouse gases Global Warming Potential International Organization for Standardization Life Cycle Inventory Life Cycle Assessment Life Cycle Impact Assessment Lower heating value Mega joule Organic fraction of municipal solid waste Organization of the Petroleum Exporting Countries Photochemical oxidant potential Rapeseed Methyl Ester Research octane test Renewable Transport Fuel Obligation Well-to-tank perspective Well-to-Wheels perspective

1
1 INTRODUCTION Estimates from the Organization of Petroleum Exporting Countries (OPEC) state
that global economic growth is expected to rise 50% between 2006 and 20301.
Accordingly, this growth will lead to an increase in energy demand and thus far
fossil fuels have been the main source for fueling 85% of the world’s need for
energy. Due to concerns such as resource depletion, environmental
degradation, economic and energy security, attention has been redirected to
alternative renewable energy sources.
Within the transportation sector, production and use of alternative fuels is one
option to counter the rising concerns associated with climate change. Of the
different options for different fuels are the so-called biofuels. Biofuels are derived
from renewable energy sources and according to United Nations Framework
Convention on Climate Change have been defined as carbon neutral. As a
result, an increase in the share of biofuels is expected to significantly contribute
to the mitigation of climate change. As a fraction of total emissions of
greenhouse gasses, and as one of the largest consumers of primary energy the
transportation sector consumes 27% of the world´s primary energy (Antoni,
Zverlov et al. 2007) and its importance is growing as less developed countries
build their transportation infrastructure. The sector is responsible for emitting
15% of anthropogenic energy-related GhG emissions and its share is expected
to increase (Schafer 2000).
The increase in demand for transportation fuels and its corollary increase in
greenhouse gas emissions have prompted enhanced pressures on increased
biofuel use in the transportation sector. At present, bioethanol is the most widely
used alternative transportation fuel, and numerous countries are encouraging the
penetration of biofuels into their markets. For example, under the Renewable
Transport Fuel Obligation (RTFO), the British government had said that by 2010,
5% of UK’s fossil fuel derived transportation fuels be displaced by biofuels where
the feedstock used is harvested using sustainable sources. The European Union
has commitments of incorporating biofuels by 10% into its portfolio of
1 http://www.opec.org/library/World%20Oil%20Outlook/pdf/Section%20One2008.pdf

2
transportation fuels by volume. In the United States, bioethanol production has
increased from 4 billion
liters in 1996 to 14 billion in 2006, and is expected to continue to increase (Dufey
2006).
In contrast to e.g. Norway, Iceland imports all petroleum products, while there is
only one landfill piping system capturing biogas to convert to methane.
Consequently the cost of fuel purchases was 27.6 billion ISK in 2005, up from
17.8 billion ISK in the year 20002. Since 1990 the vehicle fleet has increased by
70% and according to Statistics Iceland gas-powered registered vehicles had
reached approximately 240 thousand in 2007 (Hagstofa Íslands). This has led to
an increase in greenhouse gas emissions, but emissions from the transportation
sector has increased by 74% between 1990 and 2006 (Umhverfisstofnun official
data, www.ust.is).
Figure 1 illustrates the distribution of greenhouse gas emissions by source in
Iceland in 2006. The figure illustrates that almost one third of all emissions are
linked to the transportation sector.
Figure 1: Distribution of CO2 emissions by source in 20063.
2 http://eng.umhverfisraduneyti.is/media/PDF_skrar/Stefnumorkun_i_loftslagsmalum_en.pdf 3 http://eng.umhverfisraduneyti.is/media/PDF_skrar/Stefnumorkun_i_loftslagsmalum_en.pdf
Rafmagn og hiti4%
Samgöngur23%
Iðnaður og efnanotkun
41%
Sjávarútvegur15%
Landbúnaður12%
Úrgangur5%

3
In total, the National Inventory Report for 2008 stated that in 2006, greenhouse
gas emissions were estimated to be 4.234 Gg CO2-equivalents. Iceland’s total
emissions in 2006 were 24.3% above 1990 levels and 8.5% above the 1990
levels when activities under Article 3, paragraph 3 and 4 of the Kyoto Protocol
are accounted for4.
Actions to lower Iceland’s emissions lead to the adoption of a new climate
change strategy by the Icelandic government in February 20075. The Ministry for
the Environment formulated the strategy in close collaboration with the ministries
of Transport and Communications, Fisheries, Finance, Agriculture, Industry and
Commerce, Foreign Affairs and the Prime Minister’s Office. The long-term vision
of the strategy is to reduce net greenhouse gas emissions in Iceland by 50 –
75% by 2050, compared to 1990 levels. Yet within this Strategy there are no
mechanisms in place that introduces a solid plan to dramatically decrease the
use of fossil fuels in the transportation sector and therefore Iceland’s
dependence on oil for its transportation sector.
1.1 Research Questions These issues provide the grounding for this research project, which is to focus on
three main research questions:
1. Based on suitable Icelandic biomass feedstocks, what are the
environmental implications of different biofuel conversion technologies
and feedstocks?
2. Based on the most environmentally benign technology, current and future
oil prices, and productions costs, when does producing biofuels become
profitable?
3. Based on Iceland’s current oil consumption patterns within the
transportation sector, what percentage of total energy use in the
transportation sector can be displaced at a maximum if Iceland’s chooses
to begin producing it owns biofuels?
4 http://www.ust.is/media/ljosmyndir/mengun/National_Inventory_Report_2008.pdf 5 http://eng.umhverfisraduneyti.is/media/PDF_skrar/Stefnumorkun_i_loftslagsmalum_en.pdf

4
To approach the first question earlier studies that evaluated the environmental
implementations of biofuel production from a Well-to-Tank (WTT) life cycle
perspective were compared and analyzed. Afterwards the results from the
studies are standardized into a format that presents the environmental burden
expressed in the form of different types of emissions, when one MJ is delivered
to the tank. The WTT perspective in regard to biofuel production includes the
production of inputs, agriculture and harvesting, transport of material, and the
conversion process. The second question will be addressed by a general
economic assessment that estimates a potential period when certain biofuel
production platforms become profitable based on retail price of biofuel,
productions costs, and potential quantity estimates. Finally, to assess if Iceland
can self sufficiently produce its own biofuels, a comparison will be made between
current consumption patterns within the Icelandic transportation sector and
potential production of biofuels derived from Icelandic feedstock.
Results from this analysis will be fed into a larger project that is investigating
alternative fuel options in Iceland and in an upcoming study, focus will be placed
on the use of the fuels or a “tank-to-wheel” study. The combination of these two
reports will provide key decision makers in Iceland about possible outcomes
based on the production and use of alternative fuels.
1.2 Thesis structure To address these research questions the structure of this report will be organized
by first discussing general trends related to the consumption and production of
biofuels, leading into an overview of three general conversion platforms for
biomass into biofuels. This is followed by an identification of viable options for
biofuel feedstocks in Iceland, leading into a description of what a life cycle
assessment is and the methodology that was developed in this analysis to allow
an environmental comparison between different studies. To compliment these
results, an economic evaluation is included followed by a discussion that
contrasts the environmental and economic implications of using different
feedstocks and biofuel production methods.

5
2 GENERAL INTRODUCTION TO BIOFUEL PRODUCTION METHODS
The upcoming sections are divided into two main parts. The first serves the role
of describing recent trends in consumption and production that are related to
biofuels followed by a discussion of different conversion technologies for biofuel
production.
Biofuels are generally classified as either being a first generation biofuel or a
second generation biofuel, the distinguishing factor being its biomass input
source, which may also determine the production pathway. First generation
biofuels are based on mature technology and are produced from energy crops,
and according to Zinoviev (2007) bioethanol, biodiesel, and biogas (from
anaerobic digester) are considered to be the most important. Although biogas is
not from an energy crop because the technology is well established it is often
categorized as a first generation fuel. Biofuels produced from food crops are
commercial today with almost 50 billion liters of bioethanol and 5.4 million tons of
biodiesel produced worldwide in 2006 (Zinoviev November 2007). For these
types of fuels only easily extractable parts are used and the by-products such as
press cake, the remains of the converted biomass from vegetable oil production,
for example, are typically used for fodder or chemical purposes.
Second generation biofuels are of wider range and are essentially based on non-
crop feedstocks. The fuel can be converted either through a bio-chemical
process (hydrolysis) or a thermo-chemical process (pyrolysis). The raw gas
produced from the thermal-chemical process is then treated and conditioned into
synthesis gas (syngas), which mainly consists of carbon monoxide and
hydrogen. Syngas can then be further processed into different types of liquid
and gaseous fuels. Hence, fuels produced from this route are called ‘synthetic
biofuels’. “The most promising liquid synthetic biofuels, also called BtL: biomass
to liquids, are biomethanol and Fisher-Tropschs fuels” (Zinoviev 2007, p.22).
However, the status of second generation biofuels is still in developmental
stages and has not reached commercial scale to date.

6
One main objective of this thesis is to provide a comparison between different
biofuels and the environmental implications that are associated with each
production system. In order for this to occur there must be a complete
introduction of general production routes, creating an awareness of potential
energy requirements and environmental outputs of the different conversion
platforms. By providing these descriptions of different biofuel conversion
methods it provides the reader with a general background to clearly understand
the stages and possible levels of energy requirements to convert the raw
material to biofuel.
The next sections provide background information that establishes the patterns
in demand for different types of biofuels. This will then lead into a discussion
describing general production routes for biofuel production methods.
2.1 Liquid Biofuels Biofuels, in solid form such as wood, for example, have long been used by man,
but it wasn’t until the late 1800’s when two German inventors, Nikolaus August
Otto and Rudolf Diesel first suggested the use of liquid biofuels as options for
automobiles. Despite these developments related to liquid biofuels, the
discovery of crude oil, which at that the time was a cheaper and more efficient
option, forced this interest to shift from liquid biofuels to fossil fuels.
Today we return to seeking alternative fuel options due to the possibility of
scarce supplies, rising costs of petroleum products and the environmental
implications from extraction and use. In this attempt, focus has been redirected
to biofuels. Thus far bioethanol and biodiesel (1st generation) have made a solid
stance in the market because these biofuels fill the criteria of what constitutes a
good motor fuel: preferably a liquid or easy to handle gas, stable, easy to
transport and store, having a high energy to mass ratio, and inexpensive
(Wackett 2008). For these underlying reasons, biofuels that are produced from
food crops are commercial today with almost 50 billion liters of bioethanol and
5.4 million tons of biodiesel produced worldwide in 2006 (Zinoviev November
2007).

7
Currently the European Union is the world leader in the production and
consumption of biodiesel with the primary feedstock being rapeseed, while Brazil
is the world leader in producing bioethanol from sugar cane. In both cases
production and consumption has increased over the past few years. Error!
eference source not found. illustrates the dramatic increases in production for both
bioethanol and biodiesel in the EU -27 most notably between 2005 and 2006.
Comparatively, 6,400 million liters of biodiesel were produced in 2007 and on
average a + 35% per annum between 1992 -20076.
Figure 2: Evolution of bioethanol and biodiesel production in EU -27. Bioethanol is represented in the first graph and biodiesel is depicted on the right (ML/year).
These increases in production are linked to the ease at which these fuels may be
transformed and their ability to be blended in any ratio with conventional diesel
and gasoline which can extend the supplies of petroleum products and increase
the octane content. Certain countries such as Austria and Germany are using
pure biodiesel (B100) as a fuel for agricultural tractors and road vehicles. B20
and B100 are the two most often used bio-diesel variants.
The B20 (20% biodiesel and 80% conventional diesel) was originally chosen as
an optimum blend, achieving both reductions in exhaust emissions and fuel cost,
as no investment is required in new infrastructure when switching to biodiesel.
Studies showed that B20 provided about a 14% decrease in particulate matter
emissions, a 9% decrease in CO and a 7% decrease in hydrocarbons, compared
with conventional diesel. However, emission tests revealed it also entailed a 2%
6 http://www.biofuels-platform.ch/en/infos/eu-bioethanol.php Accessed October 2008

8
increase in NOx. To correct this problem a small adjustment to the engine’s
injection timing must be made7.
Like biodiesel and its variants, using ethanol reduces emissions and particulate
matter because of its chemical properties. Bioethanol contains 35% oxygen
and has a lower heating value (LHV) of 21.1 MJ/L 8 which is lower than petrol
(32.2 MJ/L). When blended with gasoline as E85 (15% bioethanol and 85%
gasoline) this increases the octane value and its efficiency in combustion and
replaces 28 MJ/L of petrol. Thus 1 L of E85 displaces .84 L of petrol while,
biodiesel replaces approximately .80 L of diesel.
The combination of displacement from fossil fuels, environmental gains from use,
and ease of production for biofuels from food crops has pushed bioethanol and
biodiesel to the forefront and explains their status in today’s market.
2.2 Compressed Natural Gas Like bioethanol and biodiesel, biogas is another biofuel option. Sources of biogas
include landfills, manure, or dedicated energy crops such as maize. In 2007, the
Biogas Barometer, a study by the European Commission-backed EurObserv'ER
research organization showed that the amount of biogas produced in 2006 was
20.5% higher than in 2005, at 5.9m tons of oil equivalent (5.9mtoe). Of this
amount, biogas from landfill accounted for 49.2%. Another reason why the use
of biogas has gained more attention is because the gas may be cleaned and
used for the production of energy and electricity. Error! Reference source not
found. is a map illustrating the primary production of biogas from landfills, sludge,
and agricultural waste. Of these three sources, biogas captured from landfills
accounted for the largest percentage in 2007. In the case of Europe, most are
using the methane to produce electricity. Overall, the production of electricity
from biogas grew by 28.9% in 2006 and Germany remains the European leader
and noted a 55.9% growth in 2006 in electricity generated from the renewable
gas.
Already 99% of Iceland’s electricity is generated from renewable geothermal and
7 http://www1.eere.energy.gov/biomass/abcs_biofuels.html#biodprod Accessed October 2008 8 http://bioenergy.ornl.gov/main.aspx Accessed October 2008

9
Already 99% of Iceland’s electricity is generated from renewable geothermal and
hydropower with an installed capacity of 2,243MW9. However, according to
Björn Halldórsson (Personal communication, November, 2008), approimately
15% of captured methane is used for transport fuel while the remaining 85% is
either flared or delivered to the grid for electricity production. Lack of demand
from consumers for methane filled vehicles explains this distribution(Personal
communication, Björn Halldórsson, November 2008).
Figure 3: Primary production of biogas in Europe. Landfilled biogas accounting for largest percentage10.
As a transportation fuel the gas has a very high octane (RON = 110-130) giving it
the potential for use in a high compression engine. Consequently engine
performance is reduced with methane because the volume of the gas reduces
9 http://www.os.is Accessed November 2008 10 http://www.bioenergy-business.com/index.cfm?section=europe&action=view&id=11498 Accessed October 2008

10
the air breathing capacity of the engine 11 . Despite this, production and
utilization is increasing due to the positive gains relating to waste treatment
issues and the environmental benefits of capturing a potent greenhouse gas. As
a result in Sweden, for example, roughly 600 buses and 10,000 light and heavy
vehicles use biogas, and currently in Iceland a platform has been established
that captures biogas from a landfill, Álfsnes, which has the potential to fuel 3 to 4
thousand smaller vehicles12.
11 www.wikipedia.com Accessed February 2008. 12 http://www.metan.is/bindata/documents/Driving_sep07A_00064.pdf Accessed October 2008

11
3 CONVERSION TECHNOLOGIES FOR BIOFUEL Biofuels are deemed to be a renewable energy source and may be produced
from biomass and organic waste. Biomass is a renewable resource that is
constantly being made from the interaction of water, air, soil, and sunlight. If
biomass is not harvested for energy purposes, then microorganisms break down
the biomass into basic elements, releasing CO2 or methane depending on
aerobic conditions. When biomass is harnessed for energy purposes,
technology is attempting to mimic the natural process that occurs in nature. In
fact, depending on the input source and technological conversion methods
required to produce the desired fuel, this determines how the biofuel will be
classified.
Figure 4 provides the fundamentals for understanding biofuel conversion
platforms. Mature and established technology can harness the energy that is
stored in the simple sugars (i.e. cellulose) and what newer technology is
attempting to do is to capture all components, thereby increasing conversion
efficiency and achieving economies of scale.
Figure 4: Biomass composition13
13 http://genomics.energy.gov/gallery/biomass/thumbnails/552.jpg Accessed November 2008
Cellulose (Glucose sugar),
25‐50%
Hemicellusoe (Other biomass sugars, esp.
pentose), 23‐32%
Lignin (Yound clean coal), 15‐
25%
Other (Extratives, protein, ash, etc.), 5‐20 %

12
Biofuels in general are classified into three categories commonly known as first
generation, second generation and third generation fuels14 and the classification
system has already been discussed in a previous section. To lead into a
discussion of general biofuel production and why focus has shifted to second
generational biofuel Figure 4 must be described. There are three main
components of biomass: cellulose, hemicelluloses, and lignin. Cellulose is the
most common form of carbon in biomass, accounting for 40%-60% by weight,
depending on the biomass source. It is a complex sugar polymer, or
polysaccharide, made from the six-carbon sugar (C6), glucose. Its crystalline
structure makes it resistant to hydrolysis. Hemicelluloses is also a major
source of carbon in biomass, at levels of between 20% and 40% by weight. It is a
complex polysaccharide made from a variety of five- and six-carbon sugars (C5).
It is relatively easy to hydrolyze into simple sugars but the sugars are difficult to
ferment to ethanol. Lignin is a complex polymer, which provides structural
integrity in plants. It makes up 10% to 24% by weight of biomass. It remains as
residual material after the sugars in the biomass have been converted to ethanol.
It contains a lot of energy and can be burned to produce steam and electricity for
the biomass-to-ethanol process.
Put simply, first generation fuels capture less than a third of the biomass content,
greatly limiting potential quantity. Second generation fuels are of wider range,
are based on non-crop feedstocks and can include by-products, residues from
organic matter, or organic waste in addition their production methods include
ways to capture and utilize the remaining biomass content.
To capture this remaining biomass, it may be converted to fuel either through a
bio-chemical process (hydrolysis) or thermo-chemical process (pyrolysis), and
both techniques have not reached maturity. Figure 5 depicts the numerous
production routes for both 1st and 2nd generation biofuels. A key observation
from Figure 5 is that there are many intermediate steps involved for the
production of biofuel, especially for second generation biofuels. Consequently 14 Third generation fuels will not be discussed in this report for they are only in the very beginning stages of R&D, but these are fuels that are produced from feedstocks that have been chemically engineered to enable faster and more efficient breakdown of required compounds.

13
each process will require energy and produce either valuable or negative
coproducts.
To evaluate these processes the upcoming sections are organized into three
parts discussing the three main platforms for biomass conversion to biofuel and
these include: Thermo-Chemical Conversion; Physical-Chemical Conversion;
and Bio-Chemical Conversion. The intent is to provide an overview and to
introduce the possible environmental concerns that are associated with each
process.
Figure 5: Illustration of the three general production pathways for biomass energy sources. Source: (Zinoviev November 2007)
3.1 Physical-Chemical Conversion Under this particular platform either vegetable oil or biodiesel derived from oil
plants such as rapeseed are the general outputs. Figure 6 illustrates the general
inputs and outputs required for biodiesel production.

14
Figure 6: Overview of biodiesel production15
Biomass that has a high free fatty acid content must undergo a pretreatment
using distillation. More specifically, it goes through an acid esterification process
to increase the yield of biodiesel. These feedstocks are also filtered and
preprocessed to remove water and contaminants, and then fed to the acid
esterification process. The catalyst, sulfuric acid, is dissolved in methanol and
then mixed with the pretreated oil. The mixture is heated and stirred, and the free
fatty acids are converted to biodiesel. Once the reaction is complete, the mixture
is dewatered and then fed to the transesterification process.
Within this process, the pressing and extraction by organic solvents are
performed. Compared to cold pressing (at temperatures not higher than 60 °C),
hot pressing at temperatures of 110–120 °C yields a larger quantity of oil.
However, 6–7% of oil is left in the cake, the remains of the pressed biomass,
even when slow presses are used. Cold pressing method requires less energy
for processing of 1 t of seeds and there are less phospholipids in the oil, which is
desirable in the production of the biodiesel fuel. However, 12–14% of oil is left in
the cake. Using the extraction method, only 0.1–0.8% of oil is left in the cake
(Unger 1990). However, the quantity of phospholipids in the hexane-extracted oil
is twice as high compared to that in the pressed oil (Makareviciene 2001). For
this reason, additional energy consuming operation of oil degumming is required
before transesterification.
To complete the transesterification process, an alcohol (like methanol) reacts
with the triglyceride oils forming biodiesel and glycerin. This stage requires
15 http://www1.eere.energy.gov/biomass/abcs_biofuels.html#feed Accessed October 2008

15
approximately 110 kg of alcohol per 1000 kg oil and is carried out at
approximately 60 °C under atmospheric pressure, as alcohol boils off at higher
temperatures. Under these conditions, the reaction takes about 90 min to
complete. To expedite the process, a higher temperature can be used in
combination with higher pressures, but at added cost (Chisti 2007). If the
feedstock required acid esterification an extra base catalyst must be added to
neutralize the acid added in the beginning of the process, in addition to
potassium hydroxide which is dissolved in methanol and then mixed with and the
pretreated oil (Chisti 2007). Once the reaction is complete, the major co-
products, biodiesel and glycerin, are separated into two layers.
After this reaction the methanol may be recovered from the biodiesel and
recycled into the process. In addition to the methanol recovery, the biodiesel
goes through a clean-up or purification process to remove excess alcohol,
residual catalyst and soaps. This consists of one or more washings with clean
water. It is then dried and sent to storage. Sometimes the biodiesel goes through
an additional distillation step to produce a colorless, odorless, zero-sulfur
biodiesel.
The glycerin must also undergo refining to remove unreacted catalyst and soaps
that were neutralized with an acid. One by-product is cake, the remains of the
rapeseed plant, which may be used for animal meal. Once the water and alcohol
are removed the product is 50%-80% crude glycerin. If the glycerin is to be used
for market applications it must be further purified to remove the remaining
contaminants of unreacted fats and oils.
3.2 Thermal-Chemical Conversion Under this category, two types of conversion technologies that yield biofuels,
from a wide range of sources exist for gasification and pyrolysis. If gasification is
employed then biomass may be converted only to biomethane. Pyrolysis
involves producing syngas, which is a combination of carbon monoxide and
hydrogen which may further be synthesized into a liquid biofuel by employing
Fisher-Tropsch synthesis, for example. Therefore processes that are related to
gasification serve as the building blocks for pyrolysis.

16
In the process of gasification, methane is produced. Methane (CH4) is a biogas
that is produced natural gas or biomass waste under different anaerobic
conditions and is 21 more times potent than carbon dioxide in terms of global
warming potential. Energy content is higher for municipal waste and that is
mainly because the sludge digestion contains about 60 to 70% methane with an
energy content of about .63 MJ per cubic foot (MacLean and Lave 2003).
There are two main ways to capture biogas, which may then be processed to
meet the same specifications as compressed natural gas. One option is to
collect municipal waste, sewage, or manure for example, and to place the
contents into an anaerobic digester. In the absence of oxygen, this step serves
the purpose of extracting the methane gas that is formed from this process. The
other option is to collect the biogas from a landfill using a piping system, which
Iceland has already established.
In either case once the biogas has been captured it must undergo two main
processes. First the moisture must be removed by the use of dryers. After the
water is removed the three main elements that found are carbon, (50% by
weight), hydrogen (5% by weight), and oxygen (45% by weight). Secondly
before the methane is transformed to pipeline quality it must be cleaned of
impurities such as hydrogen sulfide (H2S), using water scrubbers and filters
removing them (see Figure 7).
It is important to remove these impurities because of their adverse affect on the
fuel. For example, hydrogen sulfide (H2S), will affect the vehicle engine by
causing corrosiveness. Despite this, from extraction to use it is generally
accepted that biogas will provide a 95% reduction in CO2 and 80% lower
emissions of NOx in addition to other environmental benefits.

17
Figure 7: A general production scheme for landfilled captured biogas. Source: Zionoviev et al. (2007).
Pyrolysis is classified as a thermal chemical platform because it not only employs
high temperature gasification but also requires chemical processes for the
pretreatment of the biomass material, and if the syngas (carbon monoxide and
hydrogen) is going to undergo synthesis a catalyst will be required. One note
regarding pretreatment is that the material must be generally be microcrushed to
break down the biomass, making it more amiable for the acid to break down the
cells’ wall. This can be a very energy intensive process. Afterward the remains
are then fed into a boiler along with gasifying agents that include oxygen and
steam.
During the gasification typical operating temperatures are around 850°C are
used and through this process the gases produced this route will include
hydrogen (47.7%), carbon monoxide (18.7%), carbon dioxide (29.3%). After the
syngas has been created it is cleaned removing the tar and ash which are the
main by-products. Biomass ash has also the potential to be used as a clarifying
agent in water treatment, as a wastewater adsorbent, as a liquid waste
adsorbent, as a hazardous waste solidification agent, as a lightweight fill for

18
roadways, parking areas, and structures, as asphalt mineral filler, while the tar
must be removed and disposed of.
The removal of the by-products produces a suitable gas that may then be
converted into a Fisher-Tropsch Diesel or methanol. Fisher-Tropsch synthesis
is a catalyzed chemical process that converts the syngas into liquid
hydrocarbons. Most generally the common catalysts used for this process
involve iron and cobalt. Methanol via pyrolysis demands extreme pressurization
of the syngas. This option to produce different types of liquid biofuel
demonstrates one advantage of pyrolysis over the bio-chemical platform, which
will be discussed next. Figure 8 is a schematic illustration showing the
production flow employing pyrolysis technology and Fisher-Tropsch synthesis.
Figure 8: BTL production process employing thermal chemical technology. Link to view animation of process16
3.3 Bio-Chemical Conversion Under this platform, the sugars that are produced by the plants such as sugar
cane and sugar beet can be fed directly into the fermentation process, while
starches such as corn or grain require a hydrolysis reaction, known as
saccharification, to convert starches to sugars before fermentation. Recent
research indicates among the different technologies that dilute acid hydrolysis
16 http://www.choren.com/swf/carbo_v_en.htm

19
followed by enzymatic hydrolysis is less expensive and more efficient (Chandel,
Chan et al. 2007).
The draw to lignocellulosic biomass can be explained giving three reasons. First,
there are a greater number of possible input sources. Chandel, Chan et al.
(2007) reviewed possible input sources for second generation ethanol and found
28 different input options, including banana pulp waste, industrial waste, aspen,
municipal solid waste, and paper products. Secondly, there are more sugars that
may be derived, which is a vital step towards increasing lignocellulosic yield
(Huber and Corma 2007). Finally, depending on the type of biomass and its
lignin content, it has the potential to supply electricity to support the biofuel
production (Kemppainen and Shonnard 2005).
Figure 9 is a general illustration of the steps involved in bioethanol production.
The first step is biomass handling, which involves harvesting, storage, and
transport, all of which demand resources and energy. Depending on the area of
land and size of facilities will contribute either positively or negatively from those
three processes (Bernesson, Nilsson et al. 2004) . Of these three, storage of
plant material can be a critical issue because storing can lead to loss of material
and leaching of materials can cause problems requiring wastewater treatment
(Gislerud 1990). Storage may provide opportunity for reducing the impact of
some pre-treatment methods for second generation ethanol because while in
storage agents that help make the plant material more amenable to processing
and reducing costs can be introduced.

20
Figure 9: Schematic illustrating the ethanol fuel production17.
Because this material is chemically complex it must undergo pretreatment before
hydrolysis (See Figure 9).The purpose of pretreatment is to alter the size and
structure of the chemical composition increasing the efficiency and supporting
higher yields created from the process of hydrolysis (Mosier, Wyman et al. 2005).
Of the four major operations, pretreatment is the most expensive processing step
with cost as high as 30 cents/gallon ethanol produced (Mosier, Wyman et al.
2005).
Once the pretreatment is completed, the feedstock must be hydrolyzed into
monomeric sugar constituents required for fermentation into ethanol. There are
different methods available to employ, but the most commonly used are
enzymatic and dilute acid hydrolysis (Chandel, Chan et al. 2007). Essentially to
improve enzymatic hydrolytic efficiency the goal is to loosen the lignin-
hemicellulose network and improve the amenability of celluloses to residual
carbohydrate fraction for sugar recovery. The other option mentioned is the use
17 http://www.inspection.gc.ca/english/anima/feebet/pol/distillerse.jpg Accessed December 2008

21
of acid which degrades the hemicelluloses leaving only the lignin and cellulose
network.
After hydrolysis has been employed the sugar syrup is used for ethanol
fermentation. Typically yeast is the agent which is used to ferment sucrose or
glucose from starch. In some cases bacterium may be used because it offers
higher specific productivity, ethanol yield (grams per gram) and high alcohol
tolerance. Unfortunately neither of these organisms can convert pentose (C5)
sugars derived from hemicellulose. Currently there are different variations
available or being researched. For example, researchers are focusing on
recombinant yeast, which can greatly improve the ethanol production yield by
metabolizing all form of sugars (C6 and C5 sugars), and reducing the cost of
operation. In order for this to occur the yeast must be genetically engineered
(Chandel, Chan et al. 2007). In general the process can take about 45-70 hours
(see Figure 9).
Theoretically the maximum conversion efficiency of glucose to ethanol is 35%18.
In practice, assuming moisture content of 12% 1,000 kilograms of fermentable
sugar produces roughly 300 liters of pure ethanol.
After the sugars have been fermented, ethanol must be separated from a dilute
solution which is a particular energy intensive step19. Ethanol and water form an
azeotrope, or constant boiling solution, of about 95 percent alcohol and five
percent water. The five percent water cannot be separated by conventional
distillation. The production of pure, water-free ethanol requires a dehydration
step following distillation. Dehydration, a relatively complex step in ethanol fuel
production, is accomplished in one of two ways. The first method uses a third
liquid, most commonly benzene, which is added to the ethanol/ water mixture.
This changes the boiling characteristics of the solution, allowing separation to
pure ethanol. The other method employs molecular sieves that selectively absorb
water on the basis of the difference in molecular size between water and ethanol.
18 This conversion ratio also applies to second generation biodiesel. www.iea.org. 19 royalsociety.org/displaypagedoc.asp?id=28914 Accessed February 2008

22
The by-product of this process is wastewater, also known as effluent, occurring
both from the fermentation processes and distillation, although the water can be
recycled back into the process once treated to recover the chemical or biological
catalysts and remove other impurities. About 9 liters of effluent are produced for
each liter of ethanol. Effluent can have a high biological oxygen demand (BOD),
which is a measure of organic water pollution potential, and it is acidic.
Treatment requirements depend on feedstock and local pollution control
regulations. Because of the acid content, care must be taken if the effluent is
spread over fields.
One co-product of this production method is mash or the remains of the biomass
that may be used as animal meal. Mash typically contains between 50 and 100
grams of ethanol per liter (5 to 10 percent weight per volume) when fermentation
is complete. The non-fermentable solids in distilled mash (stillage) contain
variable amounts of fiber and protein, depending on the feedstock. The liquid
may also contain soluble protein and other nutrients. The recovery of the protein
and other nutrients in stillage for use as livestock feed can be essential for
economical ethanol fuel production. If the processing equipment is constructed
of stainless steel and processing is carried out under well-controlled conditions,
the protein by-products can also be consumed by humans.
Other intermediate products, including glucose, galactose, mannose, xylose, and
arabinose may be relatively easily processed into value-added bioproducts
(Mabee 2006).

23
4 BIOMASS FEEDSTOCKS AND QUANTITY ESTIMATES One objective of this analysis is to assess Iceland’s potential to achieve energy
independence by producing its own biofuels and thereby eliminating the need to
import oil for transportation needs. To fulfill this objective entails identifying
potential biomass options for biofuel production. Through personal
communication with agricultural experts (Jón Guðmundsson, Ólafur Eggertsson
2008) in Iceland and a literature review, five biomass inputs suitable to Icelandic
conditions were selected. These include:
• Timber
• Newspaper
• Municipal Solid Waste
• Winter wheat
• Rapeseed
This however, does not imply that there are not others that potentially could be
included such as manure. Below are brief summary statements corresponding
with each feedstock that was selected to fall within the study boundaries and
include the amount of biomass (kg) that will be used to calculate potential yield
for the selected fuels. The potential quantity of each feedstock and derived
biofuel quantities are estimated for the year 2030 by pushing the potential
quantity up to its limits to provide a clear understanding what the maximum
quantities may be. In all cases, the forecasts were based on information derived
from either agricultural and forestry experts, or from the consulting firm Mannvit,
who specialize among other things in waste management.
4.1 Timber Timber is one renewable biomass option that may be used to produce biofuels.
In 2007 approximately 5.5 thousand tons of unstained timber were sent to Sorpa,
which is an independent firm responsible for waste disposal in six municipalities
in Iceland. Based on weight and assuming 12% moisture content and a 35%
conversion ratio this yields 1,694 liters of bioethanol. Timber is already utilized
to produce ferra-silicon which may exclude this as a viable option. Another

24
option is to convert arable land that is available for cultivation and set it aside to
grow trees to be used as a feedstock 20. Currently there is approximately 10,000
m3 available for wood fuel and this number is expected to rise to 30,000 m3 in
2030 providing timber to become a viable option for biofuel production (Personal
communication, Ólafur Eggertsson, January 2009)21.
4.2 Newspaper The utilization of newspaper, which can be classified as municipal solid waste is
one option that may be used to produce biofuels. In 2007 2.7 thousand tons
were sent to Sorpa to be sent to Sweden where it is recycled into other paper
products22. Biofuel derived from newspaper may either be produced via the bio-
or thermochemical pathway. If hydrolysis is employed to convert the feedstock
the final product will be bioethanol, while the other conversion route (pyrolysis)
may be used to produce other biofuel options.
4.3 Municipal Solid Waste According to Sorpa, a study conducted in 2005 revealed that for Sorpa,
Suðurnes, Suðurland, and Vesturland, 223,992 tons of organic biomass was
mixed in MSW 23 and for the entire country was around 297 thousand tons
(Mannvit 2008, Unpublished report). This includes 24 different categories for
biomass such as slaughter, food, hay, and yard waste and newspaper that is not
recycled. If it is assumed that the organic fraction of MSW is expected to stay at
61%, and that MSW per capita will increase by 0.6% per year, and using
population size estimates from Hagstofan (as cited by Mannvit, 2008) - the
organic fraction of MSW is expected to increase by 44% by 2030. Based on this
20 http://www.sorpa.is/bindata/publication/Arsskyrsla_SORPU2007_00228.pdf Accessed November 2008 21 To be more specific, Iceland plans to predominately reforest by planting either pine or birch. Between these two birch has a higher density between the range of (481 to 494 kg/m3) while pine has a lower density of 407kg/m3 to 435 kg/m3 Lindblad, J. and E. Verkasalo (2001). "Basic density and conversion factors for industrial and pulpwood chips." Paperi ja puu 83(6): 458-461.. For increased quantities it is obviously better to use timber that has a higher density which in this case is birch. In this analysis potential quantity was estimated assuming the lower density for birch because according to Lindblad and Verksalo (2001) there is a regional difference and trees that grew in the southern part of Finland had a higher density. Since Iceland is geographically higher in latitude it was decided to use the lower density value. 22 http://www.sorpa.is/bindata/publication/Arsskyrsla_SORPU2007_00228.pdf Accessed November 2008 23 http://www.sorpa.is/resources/Files/Ymis-skjol/nidurstodur_radgjafa.pdf Accessed November 2008

25
assumption, the organic fraction of MSW is expected to be approximately 428
thousand tons. This value is used to calculate the potential yield for different
types of biofuels in 2030.
4.4 Winter Wheat Current research has concluded that winter wheat may be grown in Iceland but
currently only in the most southern regions as it does not survive the winter
elsewhere in Iceland. The harvest ranges from 4.5-6.0 tons (dry matter) of wheat
per hectare, applying 120 kilograms of Nitrogen per hectare (Personal
communication, Jón Guðmundsson). However given potential climatic changes
due to climate change, the growing range is likely to expand. According to Jon
Guðmundsson approximately 130 thousand hectares are cultivated in Iceland24.
Assuming at a maximum, a land area equal to this size, either derived from
transforming already cultivated land to producing winter wheat or by cultivating
new land, in addition to using the lower range for yield per hectare, sets upper
boundary conditions for the amount of wheat being produced and used as a
feedstock in 2030.
4.5 Rapeseed According to Jón Guðmundsson (2008), rapeseed is a possible feedstock and is
available in both winter sawn and spring sawn variants. The spring sawn variant
does not develop mature seeds but the winter sawn does, and it has survived the
two winters tested so far (Jón Guðmundsson, personal communication). The
harvest is 2.8-3.2 tons (dry matter) per hectare, applying 120 tons of Nitrogen per
hectare (personal communication, Jón Guðmundsson). Assuming the lower
yield value, that the dried oil seeds have a 45% oil content and oil extraction
efficiency of 98%, this yields approximately 1164 L per hectare (3000 kg of dry
matter). Assuming at a maximum, as was done for winter wheat, a land area
equal to already cultivated land, either derived from transforming already
cultivated land to producing rapeseed or by cultivating new land, sets upper
24http://www.landbunadur.is/landbunadur/wgbi.nsf/Attachment/Icelandic%20Agricultural%20Statistics%202005/$file/Statistics2005-net.pdf Accessed February 2009

26
boundaries on the amount of rapeseed possible to produce in 2030 to be used
as a feedstock.
4.6 Potential Quantity Estimates In the introduction a question that was posed asking, “What percentage of
imported petroleum products used for transportation could be displaced if Iceland
began producing its own biofuels?” To answer this question, potential quantities
must be estimated and then compared to the total amount imported for the
transportation sector.
According to statistics provided by Orkustofnun (the Icelandic National Energy
Authority), in 2007 total consumption of oil was approximately 330 million liters.
The energy forecast published in 2008 foresees oil consumption to be below the
2007 value in 2030. However, due to large uncertainties in for example future
fuel prices the 2007, value places a potential maximum in fuel consumption.
Therefore, potential quantity estimates of biofuels are compared to the 2007
value.

27
Table 1: Main assumptions used to calculate potential quantities for different types of biofuels (this is an expansion of Table 5) a includes 24 different organic biomass. This accounts for everything including newspaper, paper, yard waste, food, slaughter, hay for example.25 b Newspaper recycled to Sorpa for 2007.
Fuel Assumptions Potential Quantity 2030
(million liters)
Rapeseed Methyl Ester 1164 L/ha26
130 thousand ha
151.4
Bioethanol (timber) 10,000m3 of timber in 2008, 30,000m3
-2030
12% moisture content
3.2 kg dry biomass/liter of
bioethanol27
3.97
Bioethanol (wheat) 1718 L per hectare
5.5 tons of dry biomass/ha
130 thousand ha
3.2 kg of dry biomass/liter of
bioethanol
223.3
Fisher-Tropsch Diesel (timber) 10,000m3 of timber in 2008, 30,000m3
-2030
12% moisture content
3.7 kg dry biomass/liter of biodiesel
3.43
Fisher-Tropsch Diesel (wheat) 1486.5 L per hectare
5.5 tons of dry biomass/ha
130 thousand ha
3.7 kg of dry biomass/liter of biodiesel
193.24
Bioethanol (Organic Fraction of Municipal Solid Waste)a
428,000 tons of organic biomass.
30% moisture content
3.2 kg of dry biomass/liter of
bioethanol
93.63
Fisher Tropsch Diesel (Organic Fraction of Municipal Solid Waste)
428,000 tons of organic biomass.
30% moisture content
3.7 kg of dry biomass/liter of
bioethanol
80.97
Bioethanol (Recycled Newspaper)b 2700 tons of NP
5% moisture content
3.2 kg of dry biomass/liter of
bioethanol
.8
Fisher Tropsch Diesel (Recycled Newspaper)
2700 tons of NP
5% moisture content
3.7 kg of dry biomass/liter of
bioethanol
.7
25 http://www.sorpa.is/resources/Files/Ymis-skjol/nidurstodur_radgjafa.pdf Accessed November 2008 26 Bernesson et. al. (2005) 27 Kemppainen and Shonnard (2005)

28
Based on this figure, the following comparisons can be presented corresponding
to the quantities provided in Table 1. All feedstocks in Table 1 require land to
produce the feedstock, excluding MSW and NP.
According to Table 2 between the range of 68 to <0.01 % of petroleum products
consumed in the Icelandic transportation sector could be potentially displaced
based on the quantities estimated in this thesis. Second generation bioethanol
using wheat as the feedstock has the highest potential to displace imported fuels
followed by Fisher Tropsch diesel (wheat). The second best is Rapeseed Methyl
Ester displacing approximately 46%. It must however be noted that the quantity
values assumed possible to produce of both rapeseed and wheat are based on
assumptions that are highly uncertain. However it was deemed appropriate to
follow the information given by agricultural experts. In addition, it also should be
emphasized that the increase in forest cover used for the production of biofuels
is expected to increase by 300% beyond what is already planned for other
purposes. Yet, the lowest percentages are both associated with using Icelandic
timber.
Table 2: Percentage capacity of selected biofuels to fulfill total Icelandic consumption of petroleum for automobiles based on 2008 statistics. a assuming 130 thousand hectares are converted, employing second generation technology
Fuel %
Rapeseed Methyl Ester 46
Bioethanol (timber) a .56
Bioethanol (wheat) a 68
Bioethanol (Organic Fraction of MSW) 28
Fisher Tropsch Diesel (timber) .47
Fisher Tropsch Diesel (wheat) 58
Fisher Tropsch Diesel (Organic Fraction of MSW) a
25
Bioethanol (recycled newspaper) <.01
Fisher Tropsch diesel (recycled newspaper)
<.01

29
5 METHODOLOGY The objective of this study is to compare and rank different biofuel production
methods. To complete this goal a comparative table is created that standardizes
previous life cycle studies by expressing the environmental burden, expressed in
emissions, when one MJ of energy is delivered to the tank. The upcoming
section describes in detail what constitutes a life cycle assessment followed by
the methodology behind the creation of this comparative analysis, and finally a
description of the parameters estimated to complete the economic analysis and
potential quantity estimates.
The section is organized as follows:
• Description of life cycle assessment,
• Methodology for environmental comparative analysis,
• Methodology for economic section.
5.1 Description of Life Cycle Assessment Several different factors interplay and affect the environmental footprint of
biofuels. For example, different energy crops will demand different levels of
fertilizer and pesticides per hectare than others. These differences will thereby
indirectly affect the level of water consumption, the impact on land use, and
biodiversity. One tool that is available and that can provide a total environmental
assessment is life cycle assessment (LCA) which was standardized by the
International Organization for Standardization (ISO) in 1998. Life cycle
assessment (LCA) is a practical tool because it measures the environmental
burden of a particular product or process from a “cradle to grave” perspective,
eliminating the option to shift the burden from one stage to another. Thus, the
result is a holistic view of the entire system.
The evaluation of the system must meet a standardized format established by
the ISO and according to the ISO 14040–14049 a full LCA is divided into four
main stages:
1. Goal and scope definition
2. Life cycle inventory analysis (LCI)

30
3. Life cycle impact assessment (LCIA)
4. Life cycle interpretation of the result
The goal and scope definition defines the purpose of the study, sets the
boundaries of the system, and defines the functional unit. The functional unit
allows the cross comparison and analysis between alternative products or
processes and is defined as the measure of performance that is delivered by the
product. In practice this is an equivalent amount, so in the case of biofuels this
could be 1 ha of arable land producing biomass in order to compare the
environmental performance of the different fuel systems.
The next stage is the life cycle inventory analysis (LCI). The LCI is a
methodology for estimating the consumption of resources and the quantities of
waste flows and emissions caused by product’s life cycle. The processes within
the life cycle and the associated material and energy flows as well as other
exchanges are modeled to represent the product system and its total inputs and
outputs from and to the natural environment, respectively. It results in a product
system model and an inventory of environmental exchanges related to the
functional unit.
Figure 10: Material flow and environmental interventions across the life cycle stages in a biofuel system28.
28 MacLean, H. L., L. B. Lave, et al. (2000). "A Life-Cycle Comparison of Alternative Automobile Fuels." Journal of the Air & Waste Management Association 50(10): 1769-1779.

31
Within the realm of biofuels Figure 10 illustrates the main stages at which the LCI
measures the exchanges between the product and the natural environment. The
depiction is from a “well-to wheel” perspective (WTW) evaluating; the extraction
and production of input materials, the harvesting of the crop, the production of
the biofuel, the transportation to different locations for dispensing, and the
combustion of the fuel. At each stage there occurs a carbon input from fossil
energy resulting in emissions to the environment. This thesis evaluates the
environmental burden from a “well-to-tank” perspective (WTT) (excluding
combustion of fuel).
The life cycle impact assessment (LCIA) is the third stage and takes the
quantities of material and energy flows that were evaluated in the LCI stage and
organizes the output into different environmental indicators. Due to the functional
unit the results can be compared between the different fuels. There are many
environmental categories that should be evaluated in the case of biofuels but
most LCAs report only greenhouse gas emissions (measured as global warming
potential), energy consumption, and pollution assessments measured as
acidification potential (AP), eutrophication potential (EP) and photochemical
smog potential (POCP) (Anderson and Fergusson 2006). This conclusion was
confirmed by a recent review of previous bioethanol life cycle assessments
where land use, water consumption and ecological toxicity were never measured
in any of the reviewed studies despite their importance in a total assessment
(Blottnitz and Curran 2007). Therefore due to unavailability of a broad number
of environmental indicators only those that are described in will be standardized
in this thesis. Further research is needed on land use and water consumption.

32
Table 3: Environmental categories selected and adapted by ISO29
The environmental indicators produced from the LCIA may be tested to see how
changes in the products life cycle may alter the impact categories. This
sensitivity analysis is crucial because it allows a comparison between alternative
trade-offs, while exploring opportunities for improvement in the system. For
example, less use of fertilizers may decrease the impact of eutrophication but
may require more land to provide the same level of energy output thereby
possibly increasing GWP from the increased demand of transportation. This
may be important for key decision makers who must prioritize amongst the
different environmental impact categories.
Overall the LCA is a valuable tool that evaluates the environmental burden of
different products and processes. However within the construction of the model
the method enables flexibility with regard to system and study boundaries which
29 http://www.iso.org/iso/catalogue_detail?csnumber=29834
Environmental Impact Pollutants and main sources Examples of impacts
Global Warming Potential (GWP) CO2 eq.
CO2: carbon dioxide, from fossil fuel combustion and destruction of forests. CH4: methane, from livestock, landfill sites, extraction of natural gas or oil and coal.
Climate change affecting agricultural and forest productivity and increasing the likelihood of extreme weather events such as flood and hurricanes.
Acidification Potential (AP): SO2 eq.
SO2: sulfur dioxide, from smelters, combustion of coal or oil. NOx: nitrogen oxides, from transportation or any combustion
Negative impact of lakes, forests, and materials.
Eutrophication Potential (EP) PO43-eq.
Nitrogen and Phosphorous: nutrients and limiting agents that increase plant’s primary productivity from increased use of fertilizer.
Lead to algal blooms and fish kills.
Photochemical smog (POCP): formation of ozone and other toxic pollutants in the atmosphere
NOx: nitrogen oxides, from transportation or any combustion VOC: Volatile organic compounds from transportation, refineries, oil and wood heating
Affects human health at local and regional levels and reduces productivity of agriculture.

33
creates inconsistency between different studies that evaluating the same product
or system.
5.2 Methodology for Environmental Comparison As described above the main thrust behind this study is to prepare a format that
allows a comparative analysis between different biofuels from a “well-to-tank”
perspective. To do this, each fuel has a corresponding lower heating value
(LHV). The LHV is determined by subtracting the heat of vaporization of the
water vapor from the higher heating value. This treats any H2O formed as a
vapor and the energy required to vaporize the water therefore is not realized as
heat. In other words, it is the amount of heat released by combusting a specified
quantity (initially at 25 °C or another reference state) and returning the
temperature of the combustion products to 150 °C. LHV is useful in comparing
fuels where condensation of the combustion products is impractical, or heat at a
temperature below 150 °C cannot be put to use30.
Table 4 lists the corresponding lower heating values that have been used in this
thesis to convert the selected impact categories (GWP, AP, EP, POCP) from the
selected life cycle assessments into a standardized format. The units of the
impact categories are given by a specific quantity (g) per kilogram of the biofuel
produced and therefore when the impact categories are divided by the values
that are listed in Table 4 a new factor is created that expresses the
environmental burden when one MJ is delivered to the tank.
Table 4: The corresponding lower heating values (MJ/L) used in thesis to create standardized table31.
Fuels Gasoline Petro-
diesel
Bioethanol
Biodiesel
Energy
Density
(MJ/L)
32.2
36.4
21
32.1
30 http://en.wikipedia.org/wiki/Lower_Heating_Value 31 http://bioenergy.ornl.gov/papers/misc/energy_conv.html

34
This same approach to compare automobile fuels was also completed by
MacLean, Lave et al. (2000) but the authors only reported the differences in
greenhouse gases. This study will not only be an update but an expansion to the
study published by MacLean, Lave et al (2000) and more importantly offering a
comparison between first and second generation technology.
5.3 Methodology for Economic Analysis In addition to preparing an environmental comparison of different biofuels
produced from various raw materials, the intention of the economic analysis is to
provide an assessment of the potential period when the production of selected
biofuels in Iceland may become profitable, assuming no changes in policies and
applying the predicted price changes of crude oil provided by the Energy
Information Administration (EIA). The selection was based on which biofuel
yielded the lowest impact under the environmental analysis.
To complete this evaluation a break-even analysis was performed on three
specific biofuels, including rapeseed biodiesel, Fisher-Tropsch biodiesel and
second generation bioethanol. Two primary feedstocks, timber and winter
wheat, were considered to assess the potential quantity for the latter two
biofuels, as the environmental results indicated that these may be the most
advantageous inputs in comparison to the feedstocks that were reviewed.
To complete these general analyses three main parameters were estimated and
then presented by showing the total cost and revenue corresponding to the
production of each specific type of biofuel. To produce these graphs, retail price,
production costs, and potential quantity were estimated. Below are three
sections describing the methodology used to calculate these specific parameters.
5.3.1 POTENTIAL QUANTITY In the framework of the economic analysis potential quantity values were used
for three types of biofuels. These were selected based on the environmental
results, which indicated that these three had lowest impact in the environmental
categories that were evaluated. These include:

35
• Rape Methyl Ester (rapeseed)32
• Bioethanol (timber/wheat)
• FT-Diesel (timber/wheat)
Table 5 is an overview of the main assumptions and the estimated yield in 2030.
Under scenarios that demand land use, it is assumed that the land that is
currently cultivated is transformed to produce crops that may be converted to
biofuels. In total this is approximately 130 thousand hectares.
32 Minimal impact due to lower amounts of nitrogen used (104 kg/ha) and small scale farming.

36
Table 5: Main assumptions used to calculate potential quantity of biofuels for specific feedstocks and technology.
Fuel Assumptions Potential Quantity 2030
(million liters)
Rapeseed Methyl Ester 1164 L/ha33
130 thousand ha
151.4
Bioethanol (timber) 10,000m3 of timber in 2008
to 30,000m3 in 2030
12% moisture content
3.2 kg dry biomass/liter of
bioethanol34
3.97
Bioethanol (wheat) 5.5 tons of dry biomass/ha
1718 L ha
130 thousand ha
3.2 kg of dry biomass/liter of
bioethanol
223.3
Fisher-Tropsch Diesel (timber)
10,000m3 of timber in 2008
to 30,000m3 in 2030
12% moisture content
3.7 kg dry biomass/liter of
biodiesel
3.43
Fisher-Tropsch Diesel (wheat)
5.5 tons of dry biomass/ha
1486.5 L ha
130 thousand ha
3.7 kg of dry biomass/liter of
biodiesel
193.24
In Table 5, all of the calculations are based on second generation conversion
ratios (excluding RME). The ratio of required dry biomass (timber) to produce
bioethanol via hydrolysis was applied from the Kemppainen and Shonnard
(2005) study (3.2 kg dry biomass/liter), while the first large-scale plant in
Germany (www.Choren.com) is producing FT-Diesel and base requirements are
33 Bernesson et. al. (2005) 34 Kemppainen and Shonnard (2005)

37
3.7 kg of dry biomass/ liters of biodiesel. These ratios were applied to calculate
potential quantity for the corresponding fuels listed in Table 5.
5.3.2 RETAIL PRICE In Table 6 there are two types of general biofuels: bioethanol and biodiesel.
Each fuel has different characteristics and one way to evaluate fuels is to
compare lower heating values (LHV). A fuel’s LHV indicates a specific quantity
of heat that is transferred when the temperature is increased from 25°C and
returned to 150°C. In theory, depending on the difference between the biofuel
and the reference case (gasoline pr petro-diesel) LHV can determine the
percentage change of what price per liter the biofuel could be sold at the pump.
For example, E85 is a blend of 85% gasoline and 15% bioethanol with a LHV of
27. In comparison to gasoline and in competitive terms this implies that E85
should sell for approximately 16% lower price than gasoline at the pump because
it only has 84% of the LHV of gasoline (see Table 6).
Table 6: Fuels and corresponding lower heating values (LHV).
Gasoline Petro-Diesel Ethanol E85 Biodiesel
32.1 34.2 21.1 27 32.8
In the case of biodiesel it was assumed that there was no significant difference in
LHV so there were no differences between retail prices.
Future retail price was calculated based on the following assumptions and
methodology:
1) To calculate the retail price for gasoline and petro-diesel the twelve month
average of the retail price for gasoline and petro-diesel was estimated, which
were 3.17 USD/gallon (.84 USD/L) and 3.89 USD/gallon (1.02 USD/L) in
2008 provided by the EIA35. These prices include taxes.
2) The estimated retail values were converted to 2005 USD real dollars per liter
using 1.032 as the CPI factor36.
35 http://tonto.eia.doe.gov/oog/info/gdu/gasdiesel.asp 36 It was decided to convert these to 2005 since the EIA released a forecast predicting prices of crude oil until 2030. http://www.bls.gov/cpi/tables.htm
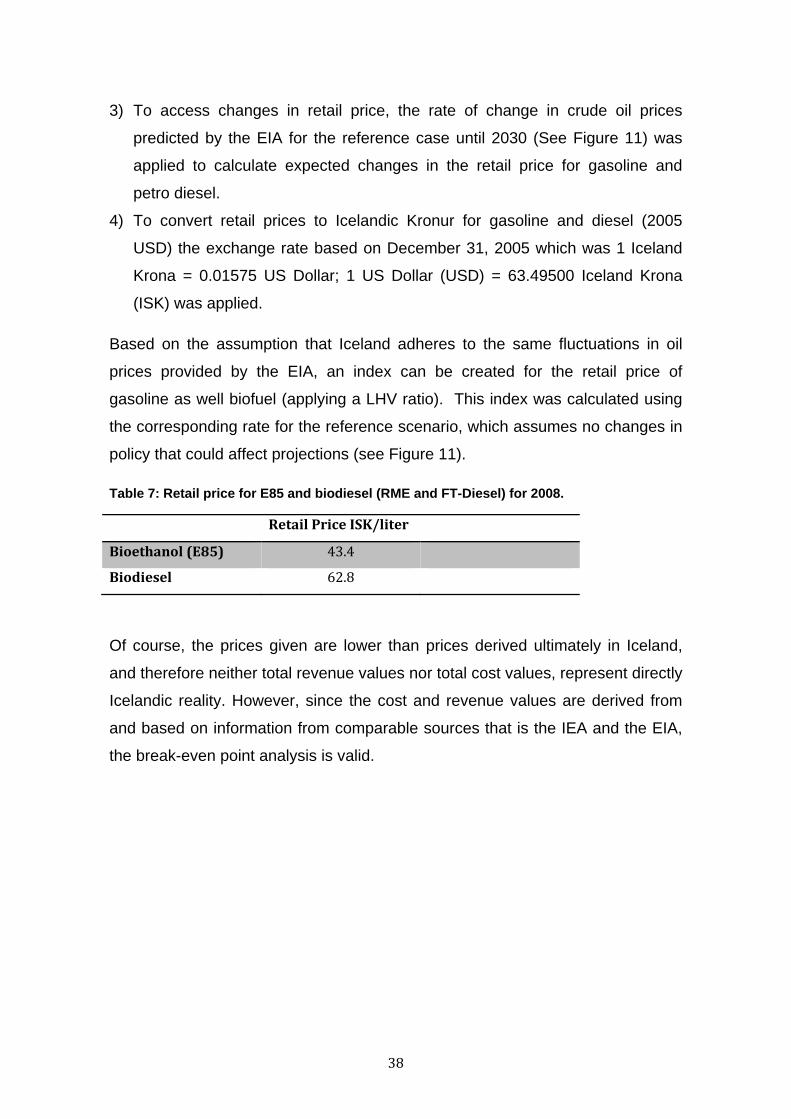
38
3) To access changes in retail price, the rate of change in crude oil prices
predicted by the EIA for the reference case until 2030 (See Figure 11) was
applied to calculate expected changes in the retail price for gasoline and
petro diesel.
4) To convert retail prices to Icelandic Kronur for gasoline and diesel (2005
USD) the exchange rate based on December 31, 2005 which was 1 Iceland
Krona = 0.01575 US Dollar; 1 US Dollar (USD) = 63.49500 Iceland Krona
(ISK) was applied.
Based on the assumption that Iceland adheres to the same fluctuations in oil
prices provided by the EIA, an index can be created for the retail price of
gasoline as well biofuel (applying a LHV ratio). This index was calculated using
the corresponding rate for the reference scenario, which assumes no changes in
policy that could affect projections (see Figure 11).
Table 7: Retail price for E85 and biodiesel (RME and FT-Diesel) for 2008.
Retail Price ISK/liter
Bioethanol (E85) 43.4
Biodiesel 62.8
Of course, the prices given are lower than prices derived ultimately in Iceland,
and therefore neither total revenue values nor total cost values, represent directly
Icelandic reality. However, since the cost and revenue values are derived from
and based on information from comparable sources that is the IEA and the EIA,
the break-even point analysis is valid.

39
Figure 11: World oil prices 1980-2030 (2005 dollars) Source: EIA World Energy Outlook 2007
5.3.3 PRODUCTION COST Biofuel production cost has been estimated by the International Energy Agency
(IEA) and has presented two different scenarios; optimistic and pessimistic (see
Table 8). These costs are expressed in 2005 real dollars.
Table 8: IEA 2nd-generation biofuel cost assumptions for 2010 and 2030 (lge: liter of gasoline equivalent).
Assumptions Production Cost - By 2010 USD/lge
Production Cost - By 2030 USD/lge
Bioethanol Optimistic .80 .55
Pessimistic .90 .60
Biodiesel Optimistic 1.00 .55
Pessimistic 1.20 .65
Both scenarios have been analyzed for second generational biofuels. The
exchange rate of 1 Iceland Krona = 0.01575 US Dollar; 1 US Dollar (USD) =
63.49500 Iceland Krona (ISK) was used to convert these prices to ISK. In regard
to first generation biodiesel, the technology is mature and well established and
for this reason production costs are assumed to stay constant (Williamson and
Badr 1998).

40
6 ENVIRONMENTAL RESULTS Life cycle studies that were chosen to be evaluated in this thesis were selected
based on the criteria that the study assessed a crop that was suitable to
Icelandic growing conditions. Research has confirmed that rapeseed and winter
wheat are possible options. In addition, a piping system is already in place that
collects biogas from waste in Álfsnes, and the gas is reformed to methane. One
other way to utilize the organic fraction of municipal solid waste is to produce
liquid biofuels. Finally, timber grown in Iceland is another possible option. In this
section the environmental results between the different combinations of
technology and selected feedstocks will be presented.
The presentation of the four life cycle environmental impact categories (GWP:
Global Warming Potential, AP: Acidification potential, EP: Eutrophication
potential, POCP: photochemical oxidant creation potential) are illustrated by the
amount of pollution (by weight) that is generated when one MJ is delivered to the
tank in regards to feedstock: NP: newspaper; W: wheat; MSW; municipal solid
waste; C; classification, T:timber; R: rapeseed; the corresponding technology:
H:Hydrolysis, F:Fermentation, P:Pyrolysis, T:Transesterfication.and the output:
E:bioethanol; and D:biodiesel. .
Accordingly, there will be four upcoming sections for each environmental
category with the abbreviations listed above under the corresponding figures.
Under each environmental category there are different numbers of studies
included. The absence is explained by the fact that the author of each respective
study did not evaluate all four categories. As will be seen, there are more results
corresponding to GWP than EP for example.
6.1 Global Warming Potential (GWP) Global warming may be enhanced by the dramatic increase in greenhouses
gases such as CO2, CH4, CO, N2O which can be induced from anthropogenic
sources. Global warming potential (GWP) is a LCA impact category that
measures the environmental performance that can result at different stages of
the biofuel production chain and that evaluates the possible impact to global
warming. When the results are presented in LCA studies they are presented as

41
a unit expressed as CO2 equivalents (kg) per hectare or liter, for example. The
results here will be presented similarly but based on the unit of energy (MJ)
delivered to the tank.
Figure 12 shows the potential impact to global warming for different production
routes and feedstocks. This evaluation assesses both second generation
production methods (hydrolysis and pyrolysis). Bioethanol that is produced using
timber as the raw material and employing hydrolysis in comparison to all other
feedstocks, yields the lowest impact to GWP of approximately 7.26 CO2 eq.
g/MJ). This is due to the fact that timber has a high lignin biomass fraction and
the energy from this content may be recycled into the system by providing
electricity (Kemppainen and Shonnard 2005). Since Iceland uses renewable,
nearly carbon neutral sources for its electricity production, these results directly
apply to Iceland. Using the same feedstock, timber, but employing pyrolysis in
comparison to the bio-chemical route this yields an impact of 18.30 CO2 eq. g/MJ
as shown in Figure 12 (Jungbluth 2007). This particular production route
demands high temperature levels (800°C) and to improve the conversion ratio
hydrogen must be produced. These demand high levels of electricity and if the
energy source is fossil fuels this will increase the potential impact to global
warming. However Jungbluth (2007) assumed that renewable energy was used
as the energy source, and thus the result does apply to Iceland.
Figure 12: Results comparing the impact to global warming potential (GWP) based on feedstock, technology, Fuel. NP: Newspaper, T: Timber, W: Winter wheat, MSW: Municipal Solid Waste, C: Classification, R: Rapeseed, H: Hydrolysis, F: Fermentation, P:Pyrolysis, T:Transesterfication, E:bioethanol, D:biodiesel. *: cases of allocation.
NP/H/E
T/H/EW/F/E
W/H/E
1W/F/E
MSW/H/E
MSW/H/C/E
T/P/DWS/P/D
1R/T/D
1R/T/D*
2R/T/D
2R/T/D*
3R/T/D
GWP 28.48 7.26 52.10 36.70 37.33 55.73 80.17 18.30 26.50 85.93 40.30 46.30 26.20 21.84
0.0010.0020.0030.0040.0050.0060.0070.0080.0090.00100.00
CO2eq
. g/M
J
GWP

42
In contrast to these favorable results, this analysis indicates that the production
of first generation biodiesel using rapeseed and employing general cultivation
and harvesting practices, such as applying 140 kg of nitrogen per hectare,
generates the largest impact to GWP (86 CO2 eq. g/MJ) (Kaltschmitt, Reinhardt
et al. 1997). The second highest in this category was linked to 2nd generation
bioethanol production and the utilization of municipal solid waste (MSW). Under
this platform, bioethanol produced from waste yielded an impact of 80 CO2 eq.
g/MJ. Kalogo, Habbibi et al. (2007) explain in their study the pivotal role that
classification (incorporating recycling into the LCA boundaries) plays and when it
is included into the boundaries of the LCA it can negatively affect results due to
the high demands of energy for separation and the transportation requirements
for pick-up as fossil fuels generally are used for transportation. When
classification was not considered the impact was reduced by 25 CO2 eq. g/MJ.
Despite this reduction, the utilization of MSW to produce bioethanol based on
parameters set by Kalogo, Habbibi et al. (2007) still generated the largest impact
in comparison to the other types of production methods for bioethanol.
6.2 Acidification Potential (AP) Although acidification is a natural process, it may also be associated with
atmospheric pollution arising from anthropogenically derived sulphur (S) and
nitrogen (N) as NOx or ammonia. Anthropogenically derived pollutant deposition
enhances the rates of acidification, which may then exceed the natural
neutralizing capacity of soils. Within the LCA, the acidification potential (AP)
impact category evaluates the different stages of the life cycle and how these
processes may illicit an impact to acidification.
Figure 13 shows the potential impact to acidification due to different production
routes. The most benign production route was when the thermal-chemical
platform is employed yielding an impact of .01 to .14 SO2 eq. g/MJ (Jungbluth
2007). According to Jungbluth (2007) the actual biomass production contributed
approximately 60% to the total acidification impact under the study while the
other sub-processes accounted for the other 40%. This is in agreement with
Kemppainen and Shonnard (2005) who calculated that most acidification is a
result of processes related to manufacturing and not premanufacturing
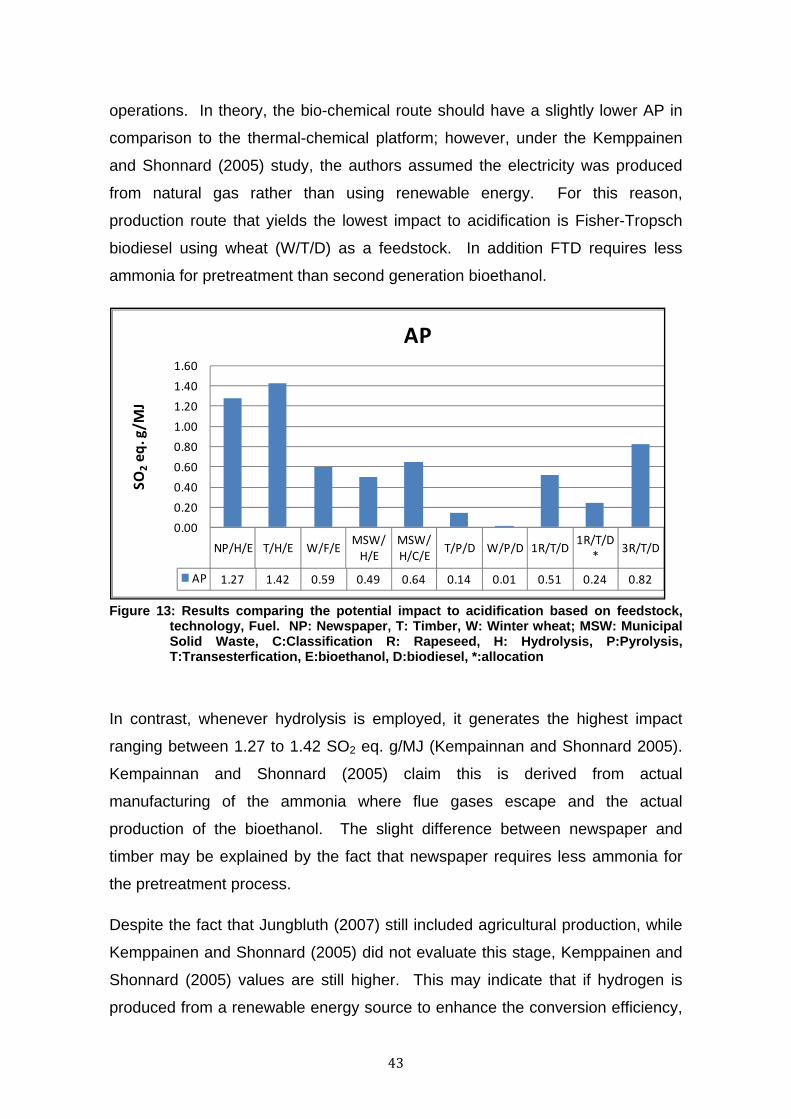
43
operations. In theory, the bio-chemical route should have a slightly lower AP in
comparison to the thermal-chemical platform; however, under the Kemppainen
and Shonnard (2005) study, the authors assumed the electricity was produced
from natural gas rather than using renewable energy. For this reason,
production route that yields the lowest impact to acidification is Fisher-Tropsch
biodiesel using wheat (W/T/D) as a feedstock. In addition FTD requires less
ammonia for pretreatment than second generation bioethanol.
Figure 13: Results comparing the potential impact to acidification based on feedstock,
technology, Fuel. NP: Newspaper, T: Timber, W: Winter wheat; MSW: Municipal Solid Waste, C:Classification R: Rapeseed, H: Hydrolysis, P:Pyrolysis, T:Transesterfication, E:bioethanol, D:biodiesel, *:allocation
In contrast, whenever hydrolysis is employed, it generates the highest impact
ranging between 1.27 to 1.42 SO2 eq. g/MJ (Kempainnan and Shonnard 2005).
Kempainnan and Shonnard (2005) claim this is derived from actual
manufacturing of the ammonia where flue gases escape and the actual
production of the bioethanol. The slight difference between newspaper and
timber may be explained by the fact that newspaper requires less ammonia for
the pretreatment process.
Despite the fact that Jungbluth (2007) still included agricultural production, while
Kemppainen and Shonnard (2005) did not evaluate this stage, Kemppainen and
Shonnard (2005) values are still higher. This may indicate that if hydrogen is
produced from a renewable energy source to enhance the conversion efficiency,
NP/H/E T/H/E W/F/EMSW/H/E
MSW/H/C/E
T/P/D W/P/D 1R/T/D1R/T/D
*3R/T/D
AP 1.27 1.42 0.59 0.49 0.64 0.14 0.01 0.51 0.24 0.82
0.00
0.20
0.40
0.60
0.80
1.00
1.20
1.40
1.60
SO2eq
. g/M
J
AP

44
which is one major hurdle under the hydrolysis scheme, that even when biomass
production is included it does not outweigh the benefits achieved by improving
the conversion efficiency. Transportation distances could also affect this impact
category.
6.3 Eutrophication Potential (EP) Eutrophication can either be a natural process or accelerated by the excessive
release of nutrients into lakes. Excessive amounts of plant nutrients (primarily
phosphorus, nitrogen, and carbon) are emitted in various ways such as
agricultural runoff, leading algal blooms. As a result, this leads to algal blooms.
When the algal blooms die and decompose they demand higher levels of oxygen
leading to anoxic environments resulting in fish kills. Eutrophication Potential
(EP) measure the possible impact of a product on eutrophication.
Figure 14 expresses the result of biofuel production as phosphate eq. g/MJ.
When comparing these results, the use of timber to produce FTD is the most
benign (.05 PO43- eq. g/MJ) followed by rapeseed biodiesel which yields an
impact of .09 PO43- eq. g/MJ. The worst production route is FTD using wheat as
a raw material. Jungbluth (2007) and Bernesson (2004) both agree that the
application of fertilizers is the great culprit to this environmental category.
Figure 14: Results comparing the impact to Eutrophication based on feedstock, technology, Fuel. T: Timber, W: Winter wheat, R: Rapeseed. H: Hydrolysis, P:Pyrolysis, T:Transesterfication, E:Bioethanol, D:Biodeisel. *:allocation
T/P/D W/P/D 1R/T/D 1R/T/D*
EP 0.05 0.18 0.09 0.04
0.000.020.040.060.080.100.120.140.160.180.20
PO43
‐ eq.g/MJ
EP

45
Jungbuth (2007) concluded that a share of more than 85% of the release of
eutrophication emissions can be attributed in most cases directly to the
agricultural production process due to the application of fertilizers. The other
important sources of emissions are from the conversion process and power
plant.
6.4 Photochemical oxidant creation Potential (POCP) Photochemical ozone formation is caused by degradation of organic compounds
(VOC) in the presence of light and nitrogen oxide (NOx). Photochemical ozone
affects environmental and human health. Exposure of plants to ozone may result
in damage of the leaf surface, leading to damage of the photosynthetic function,
discoloring of the leaves, dieback of leaves and finally the whole plant. Exposure
of humans to ozone may result in eye irritation, respiratory problems, and chronic
damage of the respiratory system.
To quantify this impact, photochemical oxidant creation potential is used by
LCAs. Figure 15 presents the results expressed as ethylene (C2H4) equivalents
i.e. their impacts are expressed relative to the effect of (C2H4).
Figure 15: Results comparing the impact to photochemical ozone formation based on feedstock, technology, Fuel. T: Timber, W: Winter wheat, R: Rapeseed. H: Hydrolysis, P:Pyrolysis, T:Transesterfication, E:Bioethanol, D:Biodeisel.*:allocation
NP/H/E T/H/E T/P/D W/P/D 1R/T/D 1R/T/D*
POCP 0.02 0.02 0.01 0.09 0.01 0.003
0.000.010.020.030.040.050.060.070.080.090.10
C 2H 4eq
.g/M
J
POCP

46
Of the different production routes considered in Figure 15, first generation
biodiesel from rapeseed and FTD using timber appear to be the most
environmentally benign in comparison to the other options (.01 C2H4 eq. g/MJ).
This may be explained by the less demanding conversion process of rapeseed
biodiesel in comparison to the newer technologies. However, this also indicates
that choosing the appropriate feedstock is critical because the different physical
properties of the biomass greatly affect the potential impact. This is illustrated by
the fact that the depending on the feedstock (timber versus wheat) will yield
either the best or worst, as timber requires less hydrogen in contrast to wheat
straw.
6.5 Summary of Environmental Results Grouping and consolidating the results from Figure 12, Figure 13, Figure 14,
Figure 15 produces Table 9 which ranks the different biofuel production methods
according to environmental impact. In some circumstances there was more than
one study that evaluated the same feedstock. In the case of rapeseed, there
were three studies (Kaltschmitt, Reinhardt et al. 1997; Elsayed, Matthews et al.
2003; Bernesson, Nilsson et al. 2004; Fredriksson, Baky et al. 2006) that
evaluated the environmental load for RME production, but only Bernesson,
Nilsson et al. (2004) assessed all four categories. Their results were chosen to
be included in Table 9. In the cases where the same feedstock was evaluated in
different studies, the most environmentally (e.g., timber) results were chosen to
be include in Table 9.
Table 9: Environmental ranking of selected biofuels based on performance in each environmental category.
Feedstock/Technology/Biofuel GWP CO2
AP SO2
EP PO43
POCP C2H4
Timber/Hydrolysis/bioethanol Wheat/Pyrolysis/Fisher-Tropsch Diesel MSW/hydrolysis/bioethanol Newspaper/hydrolysis/bioethanol Rapeseed/transesterification/biodiesel
1 3 4 2 5
5 1 2 4 3
NA 5 NA NA 1
3 5 NA 2 4
1…5:Best….Worst

47
According to Table 9 there are particular platforms that yield less impact to
selected environmental LCA categories, but when examining an entire process
and all environmental categories there is no significant difference between
production methods and it appears there are environmental trades-offs with each
conversion method. Some differences could be attributed to the different
assumptions that are built into the different studies as discussed before.
When hydrolysis is employed the lignin biomass content is utilized to support the
electricity for the production of the biofuel. Timber in particular has enough lignin
content to support its entire system. When other products such as newspaper or
MSW are used as the primary feedstock both of which have lower lignin content,
this requires electricity being drawn from outside sources increasing the impact
to acidification and global warming potential if conventional fossils fuels are the
source of energy for the electricity production.
A major assumption built into Jungbluth (2007) was that hydrogen that is used to
increase the conversion efficiency ratio was produced using renewable energy
sources, which directly applies to Iceland.
Another characteristic that is important to recognize is the corresponding
moisture content of each feedstock. In comparison to the other feedstocks when
MSW was used it produced unfavorable results for GWP. Excluding the role of
classification, one explanation may be due to the high moisture content of the
material. For example, mixed food waste and mixed yard waste are components
of MSW and their corresponding moisture contents are 72% and 62%. These
are high percentages which imply that high levels of energy will be demanded to
remove excess water. In contrast timber as moisture content of approximately
12%.
In either hydrolysis or pyrolysis, raw material must undergo pretreatment that
involves using ammonia. If Iceland uses any type of feedstock that must be
cultivated and harvested, the impact to GWP, AP, EP and POCP could
dramatically increase because not only would there be the impact from
production and application of fertilizers but also from the production of ammonia
which is used for pretreatment which was excluded form the analysis.

48
Kemppainin and Shonnard (2005) demonstrated that when evaluating the entire
biofuel production chain for bioethanol (timber and newspaper), the production of
ammonia contributed significantly to global warming potential, acidification
potential and photochemical oxidant potential mainly due to the release of flue
gases from actual production and the authors suggested finding alternatives
options in lieu the usage of ammonia.
One consistency between both technologies is the potential impact to
eutrophication. This is due to the soil emissions from the fertilizer.
Overall from an environmental perspective and based the ranking system in
Table 9, there is not a distinguishable difference between the different
generations of technology.

49
7 ECONOMIC RESULTS The intent of this economical analysis is to estimate a potential period when the
production of selected biofuels could become profitable in Iceland. Calculations
were based on retail price (2005 ISK/L), production costs (2005 ISK/L) as
derived from EIA and IEA, and potential quantity estimates according to Icelandic
quantities for the selected feedstocks (see Table 1). In total, nine different break-
even scenarios are presented. They were selected based on the criteria that the
worst and most environmentally friendly production methods were represented
and also to incorporate a comparison between older and newer technology. In
setting this criterion, two general types of biofuels were evaluated, bioethanol
(E85) and biodiesel. Three primary feedstocks are considered: rapeseed, wheat,
and timber, all of which are based on Icelandic conditions and parameters.
Figure 16 - Figure 20 were produced based on potential quantity estimates, retail
price (ISK/L), and production costs (ISK/L) and are all presented in 2005 ISK.
Where ever bioethanol is estimated, it is assumed to be E85, a blend of 85%
gasoline and 15% ethanol. E85’s LHV is 84% of gasoline’s LHV. This implies
that E85 must sell at a price at least 16% less than the retail value of gasoline
which is built into the cost calculations.
0
2000
4000
6000
8000
10000
12000
2005 2010 2015 2020 2025 2030 2035
ISK Milion
Total Revenue
Total Cost
Figure 16: Break-even analysis of rapeseed biodiesel production in Iceland, assuming no changes in production.
Results indicate that the production of rapeseed biodiesel in Iceland could be
potentially profitable today between the range of 10,000 million ISK to 8,000

50
million ISK, due to the lower production costs in comparison to the new biofuel
technology (see Figure 16). Changes in total revenue may be explained by the
changes in world oil prices. It must however be emphasized, that since both
prices and costs are based on values from the United States, that total cost and
revenue values are likely to be higher in Iceland. In addition total quantity values
for rapeseed and wheat production are likely to represent an upper extreme in
possible production quantities. Therefore one must be cautious when interpreting
total cost and revenue values in addition to the break-even analysis. However,
the break-even analysis is valid for the assumptions used in the analysis.
0
20
40
60
80
100
120
140
160
2005 2010 2015 2020 2025 2030 2035
ISK Million
Total Revenue
Total Cost
Figure 17: Break-even analysis of second generation bioethanol (E85) produced from Icelandic timber using IEA optimistic cost scenario.

51
0
2000
4000
6000
8000
10000
12000
14000
2005 2010 2015 2020 2025 2030 2035
ISK Million
Total Revenue
Total Cost
Figure 18: Break-even analysis of second generation bioethanol (E85) produced from Icelandic wheat using IEA optimistic production cost scenario.
Figure 17 and Figure 18 indicate that when employing second generation
technology to produce bioethanol using timber or wheat, a breakeven point is not
reached during the time period evaluated. This may be explained by the high
production costs and the lower retail price. However, the production of Fisher
Tropsch diesel using either timber or wheat is potentially a profitable option for
Iceland in 2020 (see Figure 19 and Figure 20).
0
50
100
150
200
250
2005 2010 2015 2020 2025 2030 2035
ISK Million
Total Revenue
Total Cost
Figure 19: Break-even analysis of second generation FT-Diesel produced from Icelandic timber, using IEA optimistic production cost scenario.
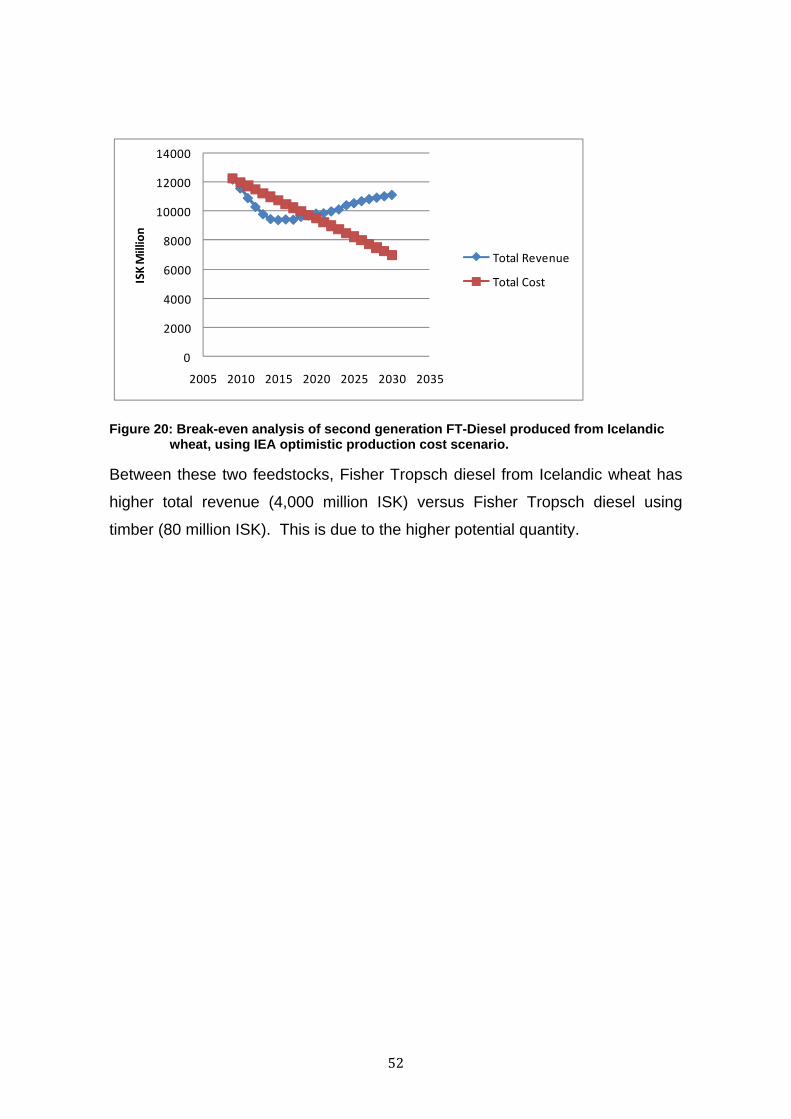
52
0
2000
4000
6000
8000
10000
12000
14000
2005 2010 2015 2020 2025 2030 2035
ISK Million
Total Revenue
Total Cost
Figure 20: Break-even analysis of second generation FT-Diesel produced from Icelandic wheat, using IEA optimistic production cost scenario.
Between these two feedstocks, Fisher Tropsch diesel from Icelandic wheat has
higher total revenue (4,000 million ISK) versus Fisher Tropsch diesel using
timber (80 million ISK). This is due to the higher potential quantity.

53
8 DISCUSSION The intent of this thesis is to evaluate the potential environmental impact of
different production methods in Iceland. To do this specific crops and organic
raw materials suitable to Icelandic conditions were identified. Based on this
criterion, earlier studies that had evaluated the environmental impact of biofuel
production using these specific feedstocks were selected and placed into a
standard format to provide an opportunity to compare and rank the different
conversion methods based on their impact to four different environmental
categories: global warming potential (GWP); acidification potential (AP);
eutrophication potential (EP); and photochemical oxidant potential (POCP).
In addition to the environmental assessment of different conversion methods, a
general economic analysis was conducted based on potential quantities
estimates, which were calculated using Icelandic feedstocks, the retail price
(2005 ISK), and production costs for the different conversion technologies also in
ISK.
In doing this it addresses the three research questions that were posed at the
beginning of the thesis which were:
1. Could Iceland achieve self-sufficiency within the transportation sector if it
started producing its own biofuels based on current/potential resources?
2. What would be the potential environmental impact of different production
methods?
3. Based on productions costs, the future price of oil, and the potential
amount of biofuel that could be produced at what point would the
production become profitable in Iceland?
Given these questions each biofuel production method has environmental,
economical, and numerical attributes that may make some more favorable or
suitable than others. Each attribute influences decision making when deciding
on possible future transportation fuel options for Iceland.
The feedstocks that were evaluated in this study represent options that may be
used to produce biofuels. Based on potential quantity limits and the percentage

54
of total fuel displaced in Iceland was in the range of 68 to < 0.01 percent. The
highest percentages were those methods that employed second generation
technology using wheat as the feedstock. However, from an economical
perspective, the productions cost per liter of gasoline equivalent is still very high
so despite the higher quantity a break-even point would not be met until
approximately 2030. Despite this drawback, this newer production method yields
less of an impact to global warming potential (GWP), with the lowest value being
7.26 CO2 eq. g/MJ for the production of bioethanol from timber.
In contrast, the production of rapeseed biodiesel yielded the highest impact to
GWP (86 CO2 eq. g/MJ). Processes responsible for this value include the
production of fertilizers, on farm fuel use and transportation. These processes
also affect the other three environmental categories.
Rapeseed biofuel production in comparison to the other methods does not
require the same amount of energy for production. The greatest contributor to
acidification potential and photochemical oxidant potential was the actual
production for these second generation biofuels and as a result flue gases would
escape affecting air quality.
Rapeseed biofuel production differs because the greatest contributor to these
environmental categories is the production of fertilizers, on-farm fuel use and
transportation to the refinery. Under all three processes there are options to
alleviate the environmental burden. For example, organic waste placed into an
anaerobic digester produces methane that may be used as transportation fuel or
electricity. This action can reduce fecal coliform bacteria in manure by more than
99%, eliminating a major source of pollution. Since the emission of CH4 is
affected by temperature, duration of storage, precipitation, etc., reducing the
storage time to 1 day reduces emissions to approximately 15%. Another
advantage is that the digested manure is a higher quality fertilizer since organic-
bound nitrogen is converted into ammonium available to plants. Results show
that nitrogen leaching may be reduced by 20% when digested manure replaces
undigested manure (Börjesson and Berglund 2007). This indicates potential for
Icelandic producers of rapeseed to incorporate the utilization of waste as a
fertilizer.
55
Another option which might further reduce the environmental burden of biofuel
derived from rapeseed would be to use bioethanol in place of using synthetic
methanol. Usually, rapeseed oil is transesterified by synthetic methanol however
the methanol energy ratio R1 is 0.76 in comparison to 1.34 for ethanol when
appropriate selected raw materials and technology are used (Janulis 2004).
More importantly, methanol is extremely toxic in comparison to bioethanol.
Another consideration is the use of renewable energy for rapeseed biofuel
production. In this thesis there was only one study included that evaluated the
impact of biofuel production using renewable energy. In this study, Jungbluth
(2007) evaluated the pyrolysis method producing Fisher-Tropsch from timber or
wheat. Jungbluth (2007) explains the great importance of using renewable
energy thereby greatly lowering the impact to all four environmental categories.
This certainly applies to Iceland since 99% of its electricity is produced from
either geothermal or hydropower.
In addition to the options that are available to potentially reduce the
environmental burden for rapeseed production, from an economic perspective
the production could be profitable today (given the large potential production
quantities). In contrast to the newer technology rapeseed production is based on
a mature technology. In addition, glycerin, a valuable by-product of rapeseed
production has many market applications. Approximately 115 kilograms of
glycerin per hectare is the expected yield (Bernesson, Nilsson et al. 2004).
Based on the assumption that Iceland transforms 130 thousand hectares this is
approximately 17.25 million kilograms of glycerin annually, along with potentially
194.75 million kilograms of animal meal. Of course it must be emphasized that
the amount possible to produce in 2030 is highly uncertain.
Further economies of scales could be reached by having a large-scale refinery
plant yet these gains may be overshadowed by environmental and economic costs due to transportation of feedstock. More importantly an increase in
emissions from rapeseed production cannot exceed the benefits from use. In
2007 there were an estimated 934 giga grams (Gg) of CO2 eq. from
transportation and 516 in 1990. Based on the results in this analysis (86 to 46
CO2 eq. g/MJ) rapeseed production exceeds the 2007 level by 5% corresponding

56
to the highest value while 57% lower using the lower number. In terms of 1990
levels (516 Gg) and according to the highest GWP value, rapeseed production is
91% higher in emission than use (2% above if using 46 CO2 eq. g/MJ).
Under these circumstances, and when taking a life-cycle perspective, rapeseed
production has higher emissions than use, which should warrant serious
consideration.
Within the category of organic waste and in this thesis, two potential options for
Icelandic feedstocks were evaluated, the organic fraction of municipal solid
waste (OFMSW) and newspaper. This does not indicate that these are the only
options available in Iceland as there could be other options such as manure or
fish waste for example but these were the two that were included in this thesis.
The Waste Management Law no. 55/2003 and Regulation no. 737/2003 on
waste treatment transpose the following EU targets into Icelandic law:
• To reduce the total weight of other organic waste, such as biodegradable
organic waste to be landfilled, by 25 per cent by no later than 1 January
2009, by 50 per cent by no later than 30 June 2013 and by 65 per cent by
no later than 30 June 2020.
According to the results in this analysis and in comparison to the other options,
using MSW solid waste to produce liquid bioethanol is the least optimal use of
this material but a more optimal route is to capture the potent biogas that can
escape and convert it to either electricity or methane, which is already occurring
at one landfill, Álfsnes, in Iceland.
An interesting observation can be made regarding MSW. According to the
literature review and the results the optimal use of OFMSW is to put it in a landfill
and capture the biogas rather than using it to produce bioethanol. The
separation of the OFMSW and non-organic material can be extremely energy
intensive (Kalogo, Habibi et al. 2007) leading to large GWP impact. For all of
these reasons, the conditions set by the waste management law may be sub-
optimal.

57
In addition to the potential impact to the selected environmental categories large
quantities of waste water are associated with the production of biofuels. For
every liter of second generation bioethanol, nine liters of effluent are created.
Although this waste stream may be recovered, treated and then recycled back
into the system, it still requires energy for the treatment process. Results from
Kalogo, Habibi et al. (2007) indicate that waste water treatment plays a critical
role in air pollutant emission (AP), especially carbon monoxide, NOx and VOC
all of which can negatively affect the quality of air.
For all of these reasons, when there is no market for heat or electricity as derived
from the process, as this may apply to Iceland, enriched methane is the most
advantageous scenario in comparison to producing ethanol via hydrolysis from
MSW (Murphy and Power 2007). If Iceland must separate the OFMSW then one
option for Iceland to optimize the system could be to use the recycled newspaper
that is normally sent to Sweden and instead place it in anaerobic digester with
the OFMSW. When this is done the rate of biogas produced increases from 79
m3 per ton of OFMSW to 115 m3 per ton. This improvement is because the
addition of newspaper improves the C:N ratio and slow biodegradability improves
the gasification of wet organics (De Wilde, Six et al. 1989).
Thus far explanations have been put forward identifying methods that could
reduce the environmental impact for selected biofuel production methods in
Iceland. Due to very high production costs, the second generation technology is
extremely limited in comparison to the older technology. In order to reduce
costs, subsides would have to be provided to make the technology competitive.
This brings the attention to energy carriers such as hydrogen or electricity to
power vehicles. According to Jón Björn Skúlasson (personal communication,
2008), in 2008 when the price of oil greatly fluctuated and reached 100 USD per
bbl (2008 USD), hydrogen could be produced and sold at competitive prices in
Iceland.
However, production costs of second generation technology are expected to
decline due to learning effects and expected increased economies of scale as
larger quantities of feedstocks such as timber are produced. Yet use of timber

58
as a feedstock limits the sequestering potential of forestry as one use excludes
the option of the other.

59
9 CONCLUSION This thesis is part of a larger project that seeks to understand the environmental,
economical and social implications of producing and using alternative
transportation fuels in Iceland. Before Iceland engages in the production of its
own biofuels, it is important to assess from an environmental and economic
perspective the potential impacts that biofuel production may have. Ultimately,
there are many unknown factors such as total land space available for
cultivation, for example, and it is imperative, that Iceland conduct its own
research before engaging in the production of biofuels.
The main outcome of this analysis is that there may be a great opportunity for
producing biofuels in Iceland assuming the large potential quantity estimates,
however in some cases there is a large tradeoff between environmental and
economic gains such as in the case of using rapeseed as a feedstock. However,
if Iceland could find ways to alleviate the environmental burden relating
specifically to global warming potential and eutrophication, and given the large
estimates then the production of rapeseed biodiesel seems to be the best choice
for liquid fuels.
In regard to biogas, since in Iceland 99% of the electricity is produced from
renewable energy, the optimal method to produce methane is to install a piping
system in a landfill that captures the biogas. This is already taking place at one
landfill in Iceland. This in turn provides strong environmental benefits because
methane in terms of global warming potential is 21 more times potent than
carbon dioxide, does not escape into the atmosphere and there are not the
social and economical issue that surround certain feedstocks.
Currently only 15% of the methane that is captured from the landfill in Álfsnes is
being used for transportation purposes, while the remaining percentage is either
flared or sold and put on the grid, according to Bjorn Halldórsson (personal
communication, December 2008). This low percentage may be attributed to lack
of demand (Bjorn Halldórsson, December 2008). Although there are tax
incentives in place for alternatively fuel vehicles, there needs to be a more

60
outspoken and proactive approach to encourage demand of the type of vehicles
that run on this type of fuel.
In conclusion when considering all three aspects such as potential environmental
impacts, economic costs, and potential quantities, it would be in Iceland’s best
interest to find ways to alleviate the environmental burden associated with
rapeseed production and to move cautiously forward with this option.

61
10 STUDIES LIMITATIONS AND FUTURE RESEARCH In this study only five feedstocks were evaluated. This does not imply, however,
that there are not others. As technology develops this will widen the range of
options, which should be analyzed.
Another weakness of this analysis is the limited number of environmental factors
considered. This result is due to inherit limitation of the LCA methodology which
does not include impact on for example, land and water use. Those factors
should be included to provide a holistic view of environmental implication of
different biofuel options.
Due to the high potential of rapeseed biodiesel further research is needed to
investigate methods to reduce the environmental burden associated with the
production.

62
BIBLIOGRAPHY Anderson, G. and M. J. Fergusson (2006). "Energy from biomass in the UK: sources,
processes and biodiversity implications." Ibis 148(s1): 180-183. Antoni, D., V. V. Zverlov, et al. (2007). "Biofuels from microbes." Applied Microbiology
and Biotechnology 77(1): 23-35. Bernesson, S., D. Nilsson, et al. (2004). "A limited LCA comparing large- and small-
scale production of rape methyl ester (RME) under Swedish conditions." Biomass and Bioenergy 26(6): 545-559.
Blottnitz, H. and M. A. Curran (2007). "A review of assessments conducted on bio-ethanol as a transportation fuel from a net energy, greenhouse gas, and environmental life cycle perspective." Journal of Cleaner Production 15(7): 607-619.
Börjesson, P. and M. Berglund (2007). "Environmental systems analysis of biogas systems—Part II: The environmental impact of replacing various reference systems." Biomass and Bioenergy 31(5): 326-344.
Chandel, A. K., E. S. Chan, et al. (2007). "Economics and environmental impact of bioethanol production technologies: an appraisal." Biotechnology and Molecular Biology Reviews 2(1): 014-032.
Chisti, Y. (2007). "Biodiesel from microalgae." Biotechnology Advances 25(3): 294-306. De Wilde, B., W. Six, et al. (1989). "Dry anaerobic conversion of source separated
household waste to biogas and humotex, 42 Informationsgesprach des ANS ‘Vergarung fester organischer Abfalle Moglichkeiten und Grezen der Biogasgewinnung’." Basel, November: 7–9.
Dufey, A. (2006). Biofuels Production, Trade and Sustainable Development Emerging Issues, International Institute for Environment and Development.
Elsayed, M. A., R. W. Matthews, et al. (2003). Carbon and Energy Balances for a Range of Biofuel Options, AEA Technology.
Fredriksson, H., A. Baky, et al. (2006). "Use of on-farm produced biofuels on organic farms - Evaluation of energy balances and environmental loads for three possible fuels." Agricultural Systems 89(1): 184-203.
Gislerud, O. (1990). "Drying and Storing of Comminuted Wood Fuels." Forestry, Forest Biomass, and Biomass Conversion: The IEA Bioenergy Agreement (1986-1989) Summary Reports.
Huber, G. W. and A. Corma (2007). "Synergies between Bio-and Oil Refineries for the Production of Fuels from Biomass." ANGEWANDTE CHEMIE-INTERNATIONAL EDITION IN ENGLISH- 46(38): 7184.
Janulis, P. (2004). "Reduction of energy consumption in biodiesel fuel life cycle." Renewable Energy 29(6): 861-871.
Kalogo, Y., S. Habibi, et al. (2007). "Environmental Implications of Municipal Solid Waste-Derived Ethanol." Environmental Science & Technology 41: 35-41.
Kaltschmitt, M., G. A. Reinhardt, et al. (1997). "Life cycle analysis of biofuels under different environmental aspects." Biomass and Bioenergy 12(2): 121-134.
Kemppainen, A. J. and D. R. Shonnard (2005). "Comparative Life-Cycle Assessments for Biomass-to-Ethanol Production from Different Regional Feedstocks." Biotechnology Progress 21(4): 1075-1084.

63
Lindblad, J. and E. Verkasalo (2001). "Basic density and conversion factors for industrial and pulpwood chips." Paperi ja puu 83(6): 458-461.
Mabee, W. E. (2006). Economic, Environmental and Social Benefits of 2nd-generation Biofuels in Canada, BIOCAP Canada Foundation.
MacLean, H. L. and L. B. Lave (2003). "Evaluating automobile fuel/propulsion system technologies." Progress in Energy and Combustion Science 29(1): 1-69.
MacLean, H. L., L. B. Lave, et al. (2000). "A Life-Cycle Comparison of Alternative Automobile Fuels." Journal of the Air & Waste Management Association 50(10): 1769-1779.
Makareviciene, V. (2001). Rapeseed oil ethyl ester production, use as fuel and impact on environment, Ph. D. thesis, Environmental Institute, Lithuanian University of Agriculture.
Mosier, N., C. Wyman, et al. (2005). "Features of promising technologies for pretreatment of lignocellulosic biomass." Bioresource Technology 96(6): 673-686.
Murphy, J. D. and N. Power (2007). "A technical, economic, and environmental analysis of energy production from newspaper in Ireland." Waste Management 27(2): 177-192.
Schafer, A. (2000). "Carbon Dioxide Emissions from World Passenger Transport: Reduction Options." Transportation Research Record 1738(-1): 20-29.
Unger, E. H. (1990). "Commercial processing of canola and rapeseed: crushing and oil extraction." Canola and Rapeseed: Production, Chemistry, Nutrition and Processing Technology: 235–249.
Wackett, L. P. (2008). "Microbial-based motor fuels: science and technology." Microbial Biotechnology(0).
Williamson, A. M. and O. Badr (1998). "Assessing the viability of using rape methyl ester (RME) as an alternative to mineral diesel fuel for powering road vehicles in the UK." Applied Energy 59(2-3): 187-214.
Zinoviev, S. A., Sivasamy; Miertus, Stanislav (November 2007). Background Paper on Biofuel Production Technologies, Area of Chemistry, International Centre for Science and High Technology-United Nations Industrial Development Organization: 1-69.
Verbal Sources Björn Halldórsson (2008), regarding descriptions of collection system at Álfsnes and use of methane in vehicles.
Brynhildur Daviðsdóttir (2009), expected rise in municipal solid waste in 2030.
Jón Gúðmundsson (2008-2009), Icelandic agricultural conditions for biofuel production.
Ólafur Eggertsson and Arnor Snorrason (2009), regarding timber coverage in Iceland‘s future.