Embed Size (px)
DESCRIPTION
Bioelectric Phenomena teached and leactured by doctor gharibzadeh
Citation preview

BIOELECTRIC PHENOMENA2014
١
3:BIOELECTRIC POTENTIALS
٢
INTRODUCTION
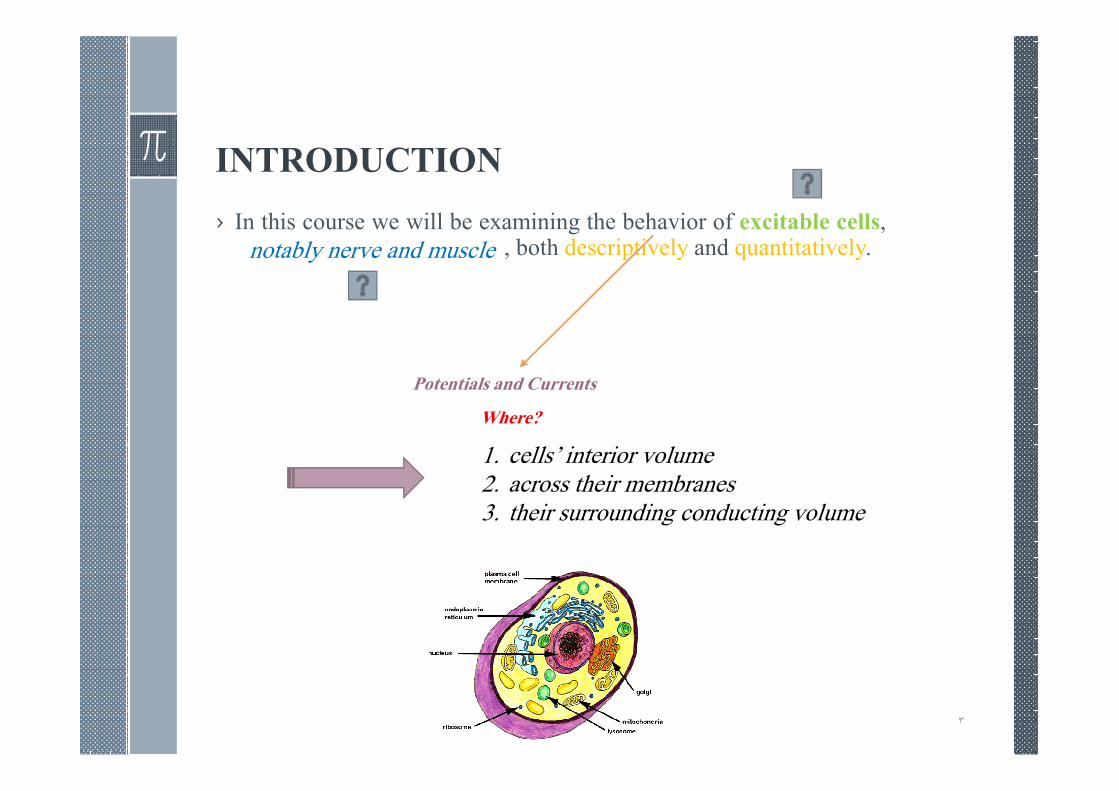
› In this course we will be examining the behavior of excitable cells, notablynerve and muscle , both descriptively and quantitatively.
٣
notably nerve and muscle
Potentials and Currents
Where?
1. cells’ interior volume2. across their membranes3. their surrounding conducting volume
• Transmission of information in nerves
• The initiation of contraction in muscles
• Vision
• Hearing
• The heartbeat
• Digestion
• …
INTRODUCTION
۴
Why?
Their underlying electrical systems share many basic
principles of organization, and how fundamentally
similar they remain in almost all living creatures.
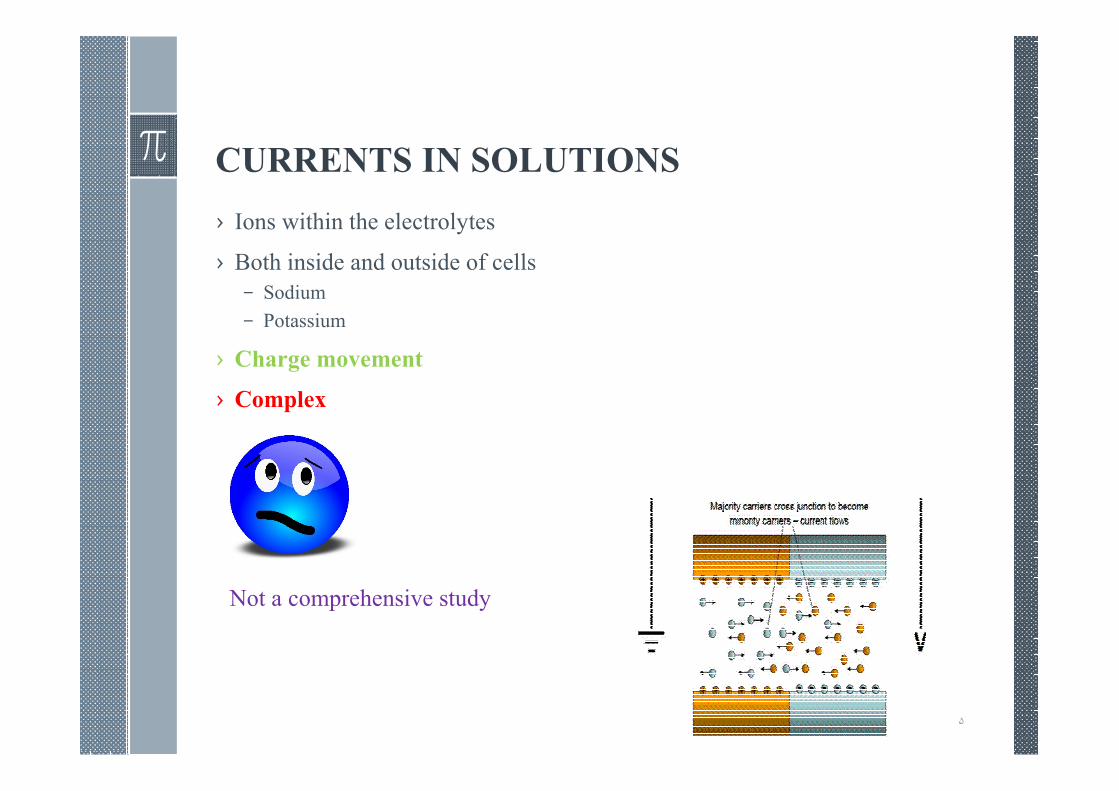
› Ions within the electrolytes
› Both inside and outside of cells
– Sodium
– Potassium
› Charge movement
› Complex
CURRENTS IN SOLUTIONS
۵
Not a comprehensive study
› The study of bioelectricity ???
› One mole is simply an amount of pure substance in grams that isnumerically equal to its atomic weight.
– A mole includes a fixed number of molecules, namely, Avogadro’s number, whichis 6.0225×10²³ molecules.
› Flows: moles per second
› Fluxes: moles per second per unit area (j)
› When ionic movements are described from the perspective of thestudy of electricity, the quantities of ions are expressed in terms ofCoulombs (the forces between charges).
– the magnitude of the charge on one electron: 1.6 × 10⁻¹⁹ Coulombs.
› Flows: Coulombs per second = Amperes.
› Flux (flow per unit area): Amperes per unit area (J)
MOLES AND AMPERES
۶
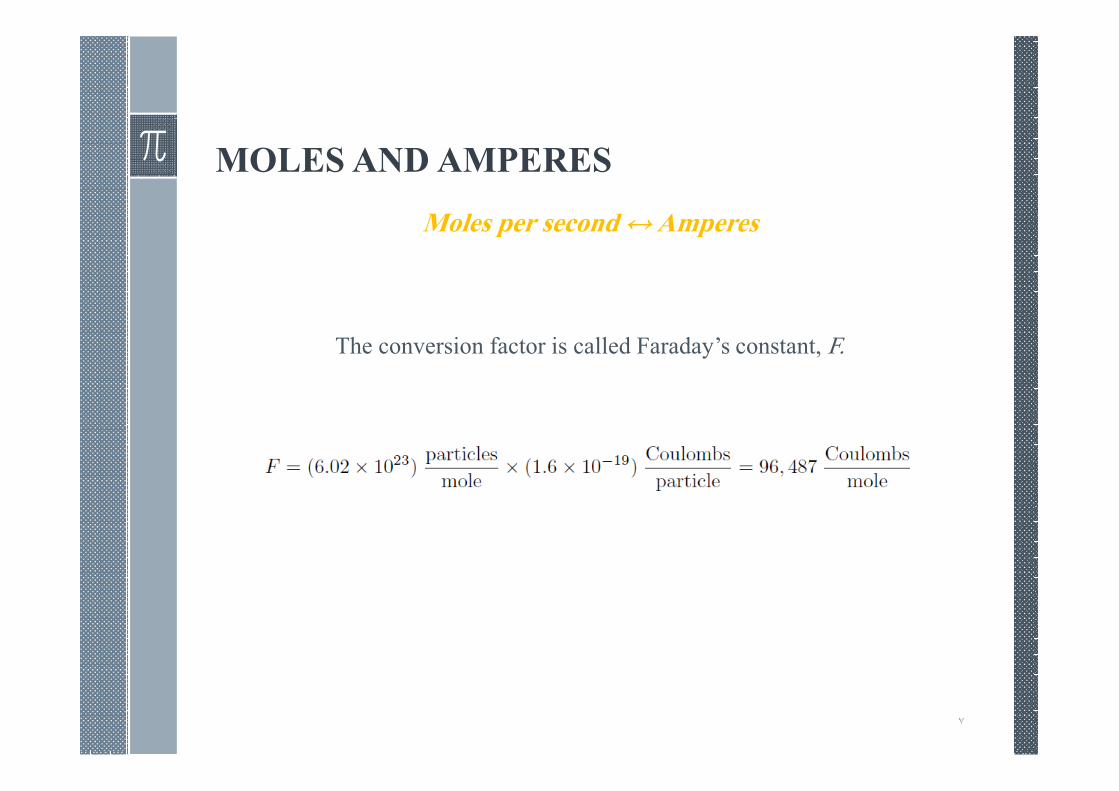
Moles per second ↔ Amperes
The conversion factor is called Faraday’s constant, F.
MOLES AND AMPERES
٧
NERNST–PLANCK EQUATION
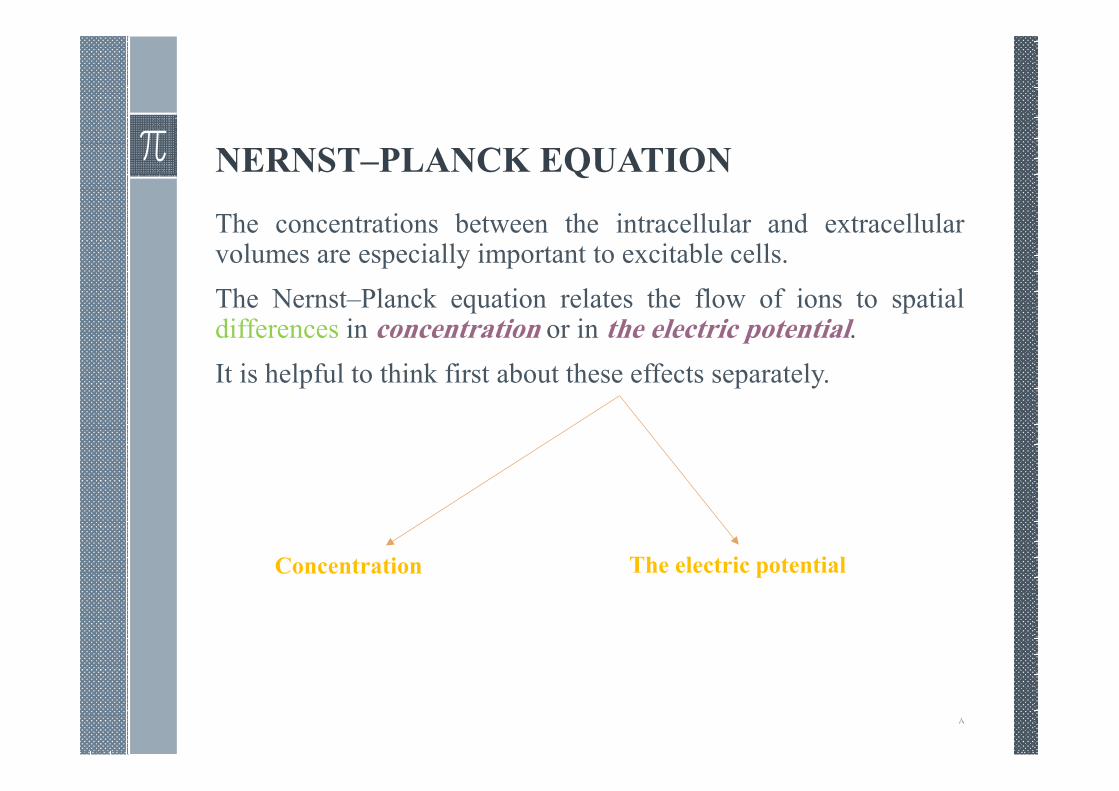
The concentrations between the intracellular and extracellularvolumes are especially important to excitable cells.
The Nernst–Planck equation relates the flow of ions to spatialdifferences in concentration or in the electric potential.
It is helpful to think first about these effects separately.
٨
Concentration The electric potential
NERNST–PLANCK EQUATIONDiffusion and the Diffusion Coefficient
If a drop of blue ink is placed in a beaker of water, then inkmolecules will, on average, move away from the highlyconcentrated region into the surrounding water. The process willcontinue until the ink is uniformly distributed in the water (whichwill become a uniform light blue color).
The process is known as diffusion.
We say that diffusion is in a direction of decreasing concentration.
No electric field is required for diffusion to occur as diffusion isnot an electrical phenomenon.
Rather, diffusion arises as a consequence of the pronouncedrandom motion of molecules that occurs at ordinary temperatures.This random motion scatters the blue ink. At first, more moveaway from the center of the ink drop than toward the center,simply because more ink molecules are near the center.
٩
NERNST–PLANCK EQUATIONDiffusion and the Diffusion Coefficient
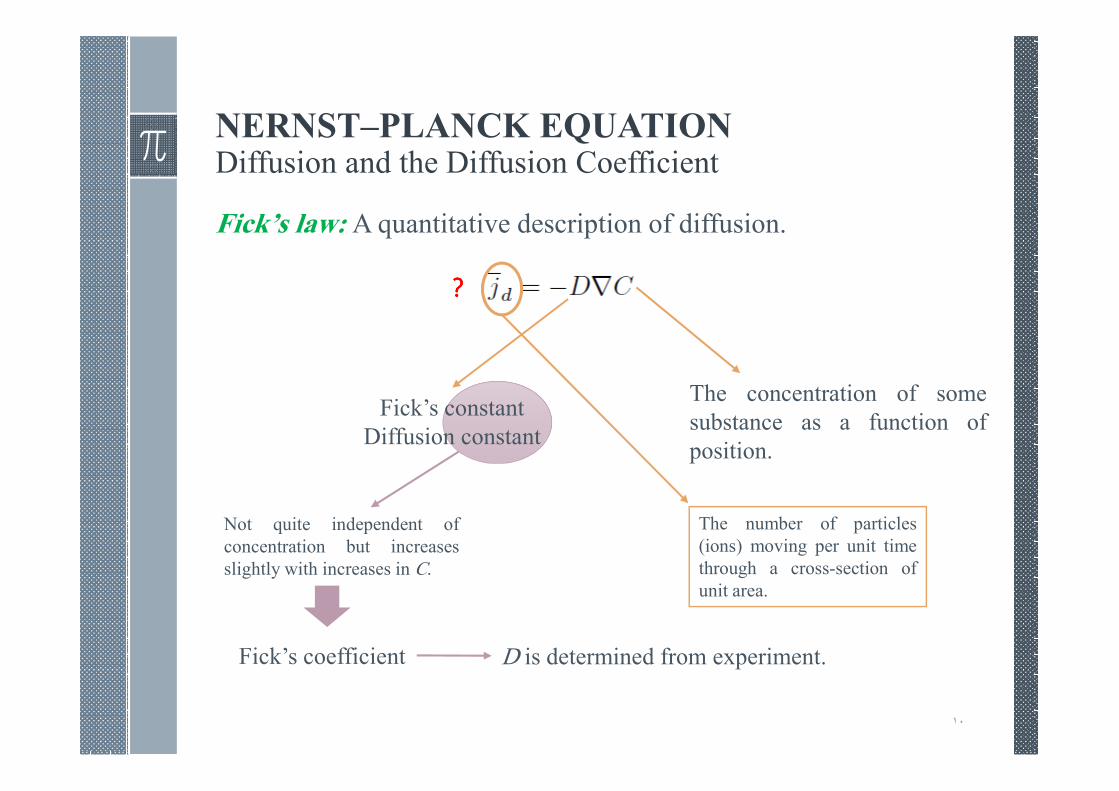
Fick’s law: A quantitative description of diffusion.
١٠
The concentration of some
substance as a function of
position.
Fick’s constant
Diffusion constant
Not quite independent of
concentration but increases
slightly with increases in C.
Fick’s coefficient D is determined from experiment.
????
The number of particles
(ions) moving per unit time
through a cross-section of
unit area.
NERNST–PLANCK EQUATIONElectric Field and Mobility
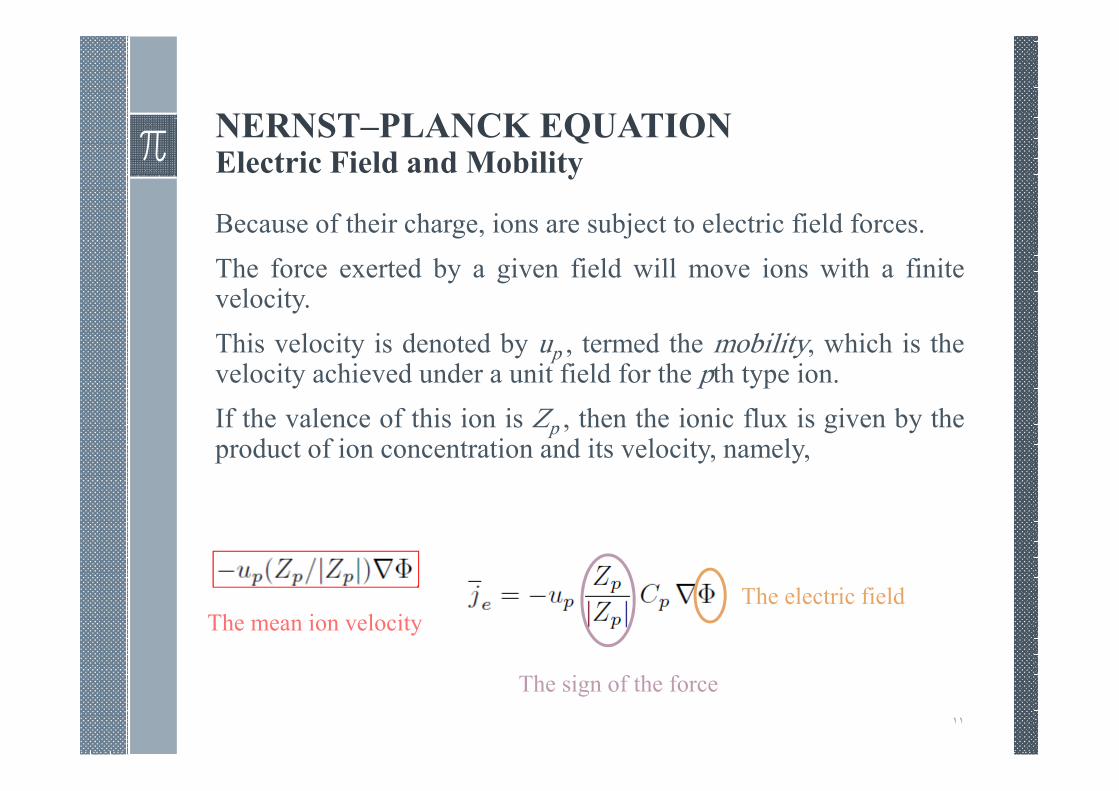
Because of their charge, ions are subject to electric field forces.
The force exerted by a given field will move ions with a finitevelocity.
This velocity is denoted by up , termed the mobility, which is thevelocity achieved under a unit field for the pth type ion.
If the valence of this ion is Zp , then the ionic flux is given by theproduct of ion concentration and its velocity, namely,
١١
The electric field
The sign of the force
The mean ion velocity
NERNST–PLANCK EQUATIONElectric Field and Mobility
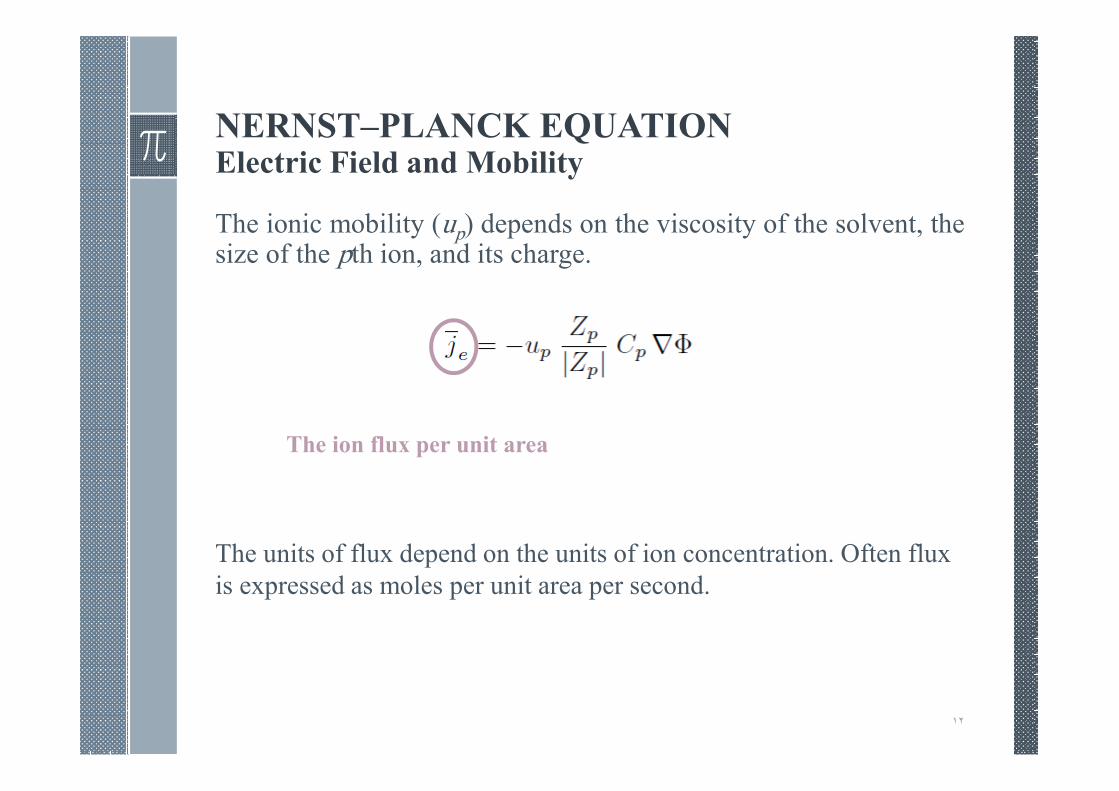
The ionic mobility (up) depends on the viscosity of the solvent, thesize of the pth ion, and its charge.
١٢
The ion flux per unit area
The units of flux depend on the units of ion concentration. Often flux
is expressed as moles per unit area per second.
NERNST–PLANCK EQUATIONElectric Field and Mobility
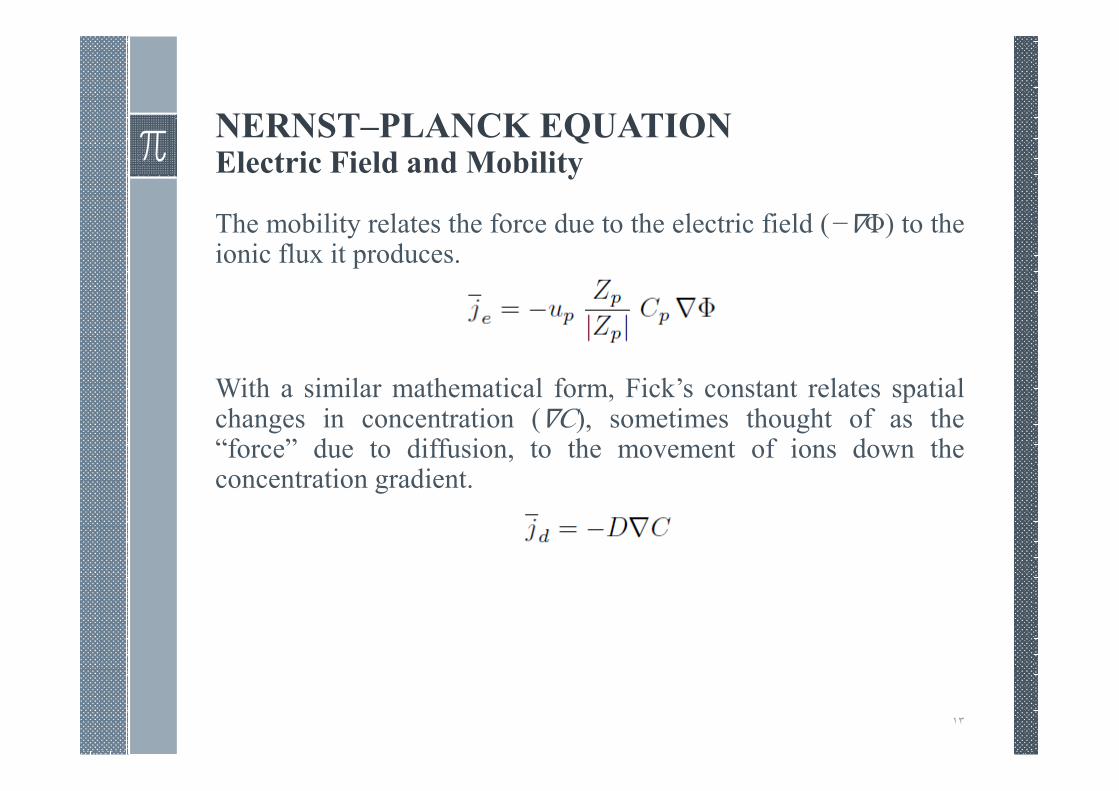
The mobility relates the force due to the electric field (−∇Φ) to theionic flux it produces.
With a similar mathematical form, Fick’s constant relates spatialchanges in concentration (∇C), sometimes thought of as the“force” due to diffusion, to the movement of ions down theconcentration gradient.
١٣
NERNST–PLANCK EQUATIONElectric Field and Mobility
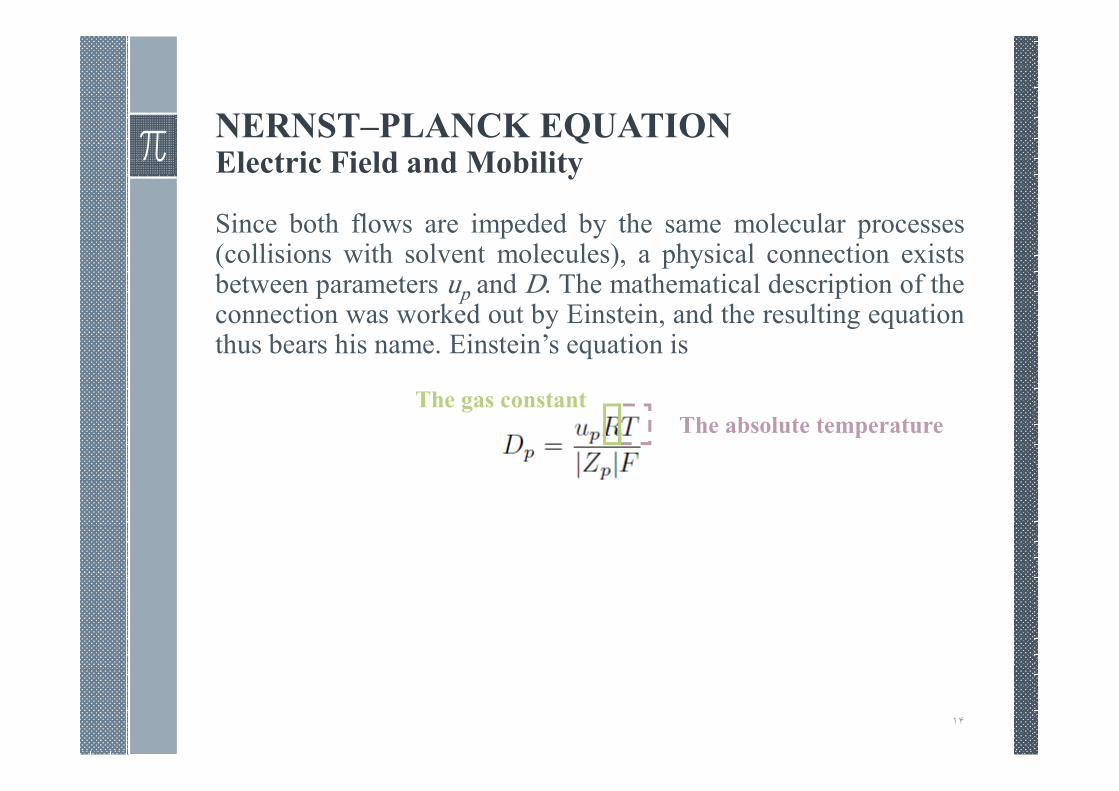
Since both flows are impeded by the same molecular processes(collisions with solvent molecules), a physical connection existsbetween parameters up and D. The mathematical description of theconnection was worked out by Einstein, and the resulting equationthus bears his name. Einstein’s equation is
١۴
The absolute temperatureThe gas constant
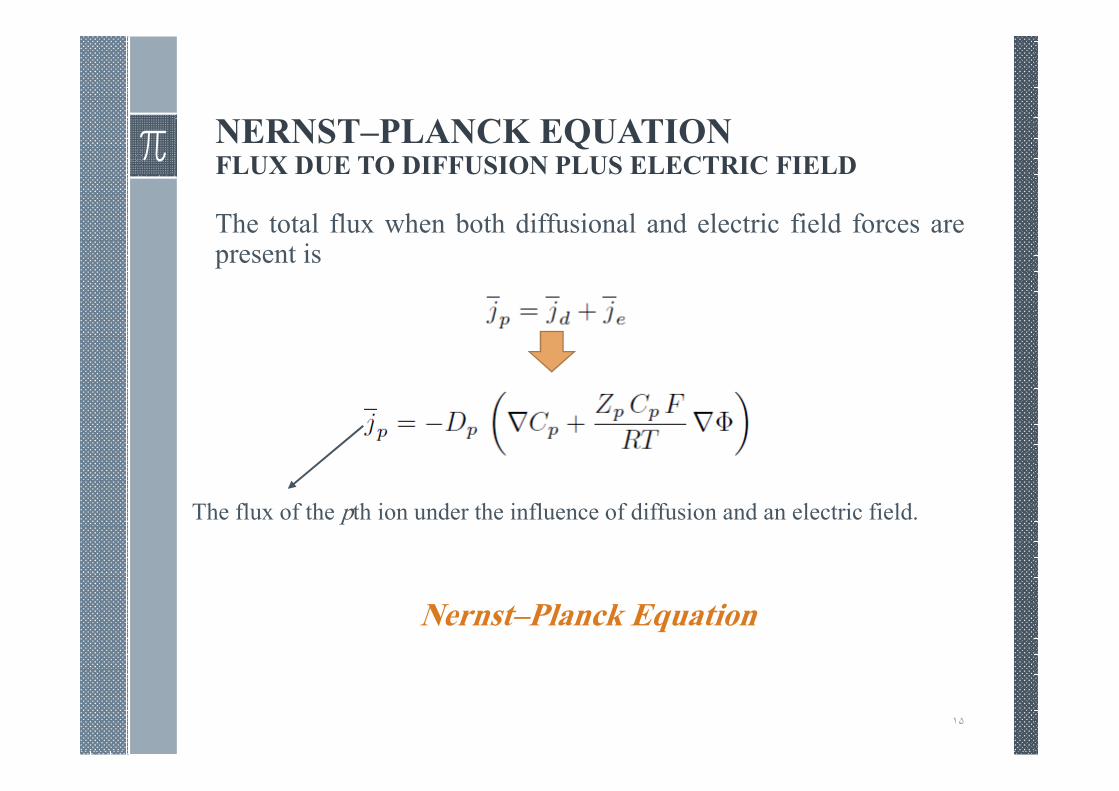
NERNST–PLANCK EQUATIONFLUX DUE TO DIFFUSION PLUS ELECTRIC FIELD
The total flux when both diffusional and electric field forces arepresent is
١۵
Nernst–Planck Equation
The flux of the pth ion under the influence of diffusion and an electric field.
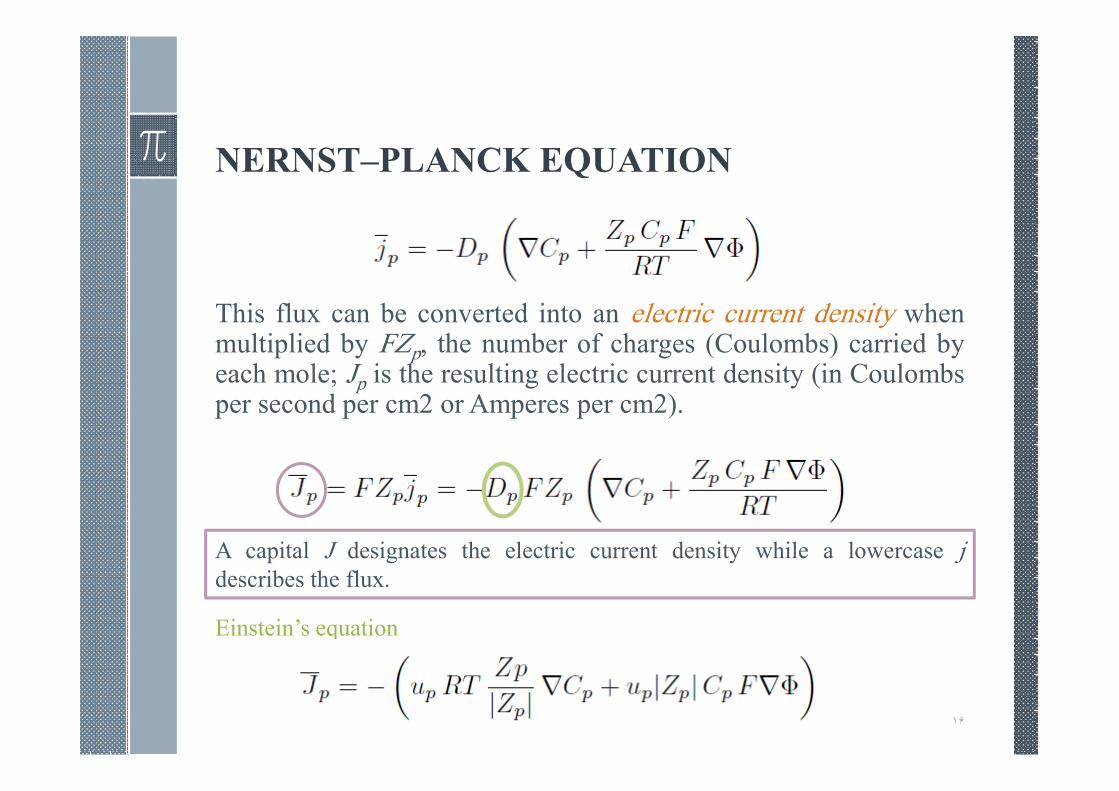
NERNST–PLANCK EQUATION
This flux can be converted into an electric current density whenmultiplied by FZp, the number of charges (Coulombs) carried byeach mole; Jp is the resulting electric current density (in Coulombsper second per cm2 or Amperes per cm2).
١۶
A capital J designates the electric current density while a lowercase jdescribes the flux.
Einstein’s equation
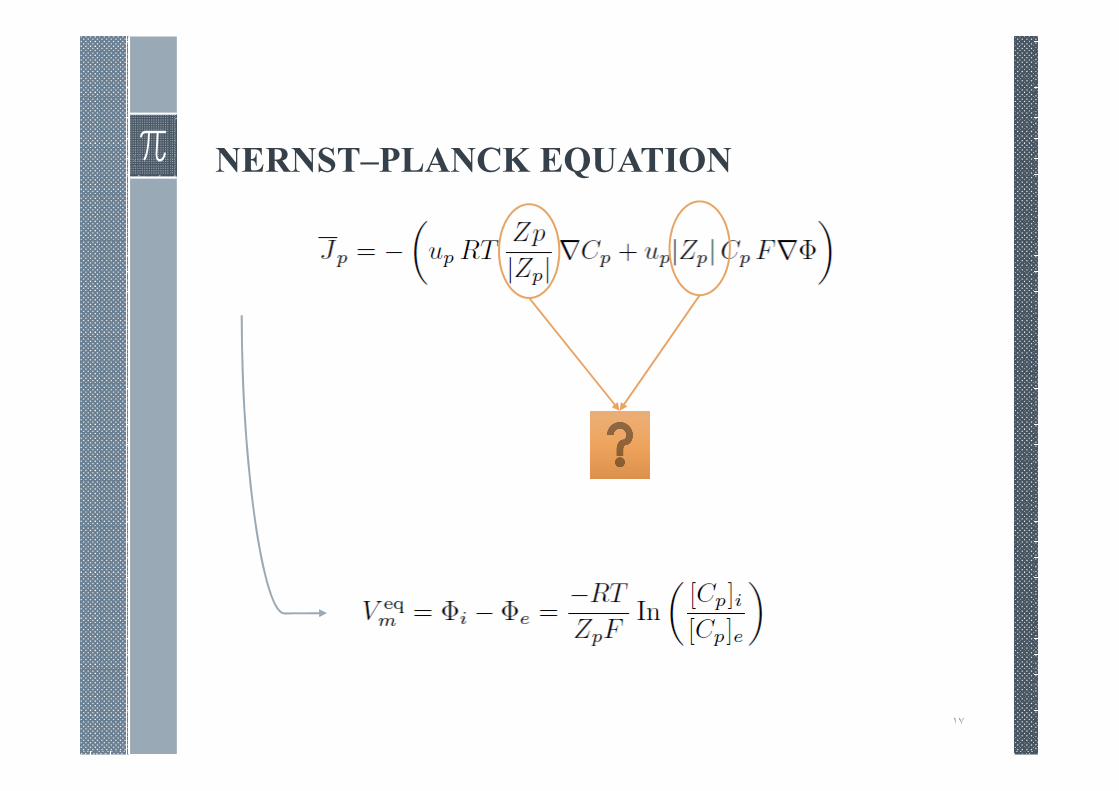
NERNST–PLANCK EQUATION
١٧
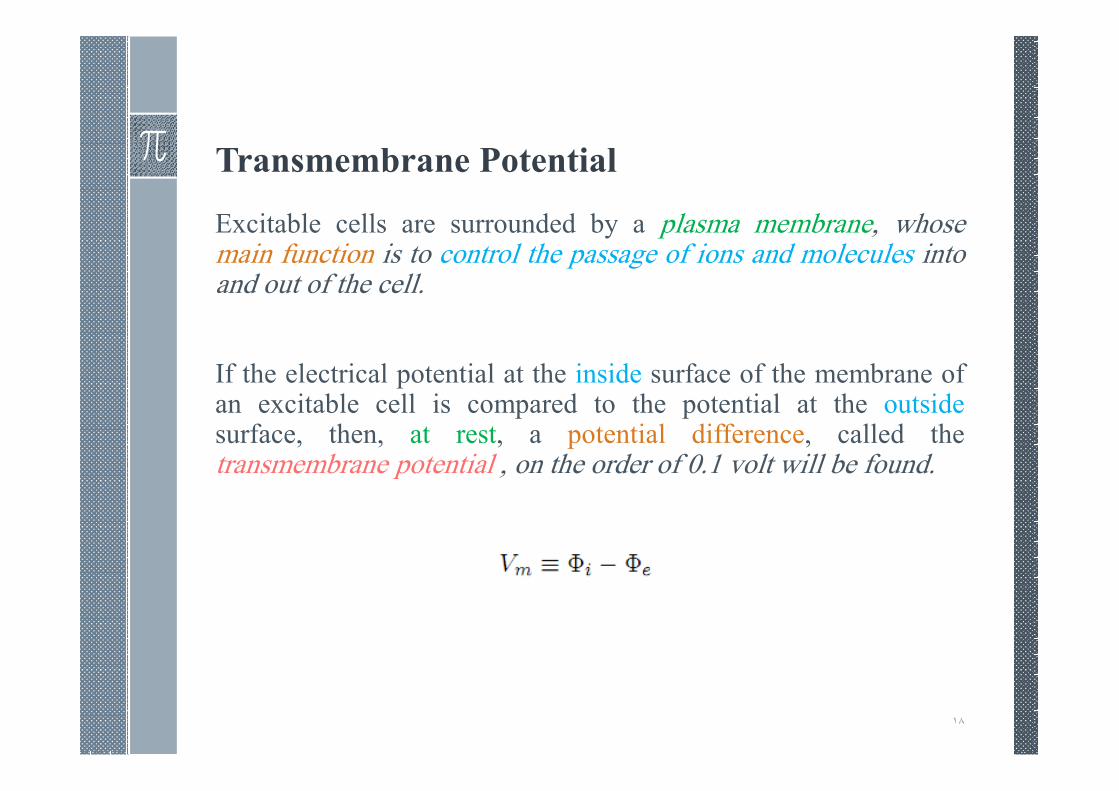
Transmembrane Potential
Excitable cells are surrounded by a plasma membrane, whosemain function is to control the passage of ions and molecules intoand out of the cell.
If the electrical potential at the inside surface of the membrane ofan excitable cell is compared to the potential at the outsidesurface, then, at rest, a potential difference, called thetransmembrane potential , on the order of 0.1 volt will be found.
١٨
Transmembrane Potential
Because the membrane has a resistance (i.e., is not a perfectinsulator), there will be a transmembrane current, Im. Bydefinition, this current is considered to have a positive sign whenit flows across the membrane in the direction from the inside tothe outside.
In this session we will consider explanations for the origin of theresting potential, and explanations of its magnitude and sign. Wewill see that the potential at rest depends on the selectivepermeability of the membrane to the several major ions that arepresent and to the different ionic composition of intracellular andextracellular space.
١٩
Transmembrane Potential
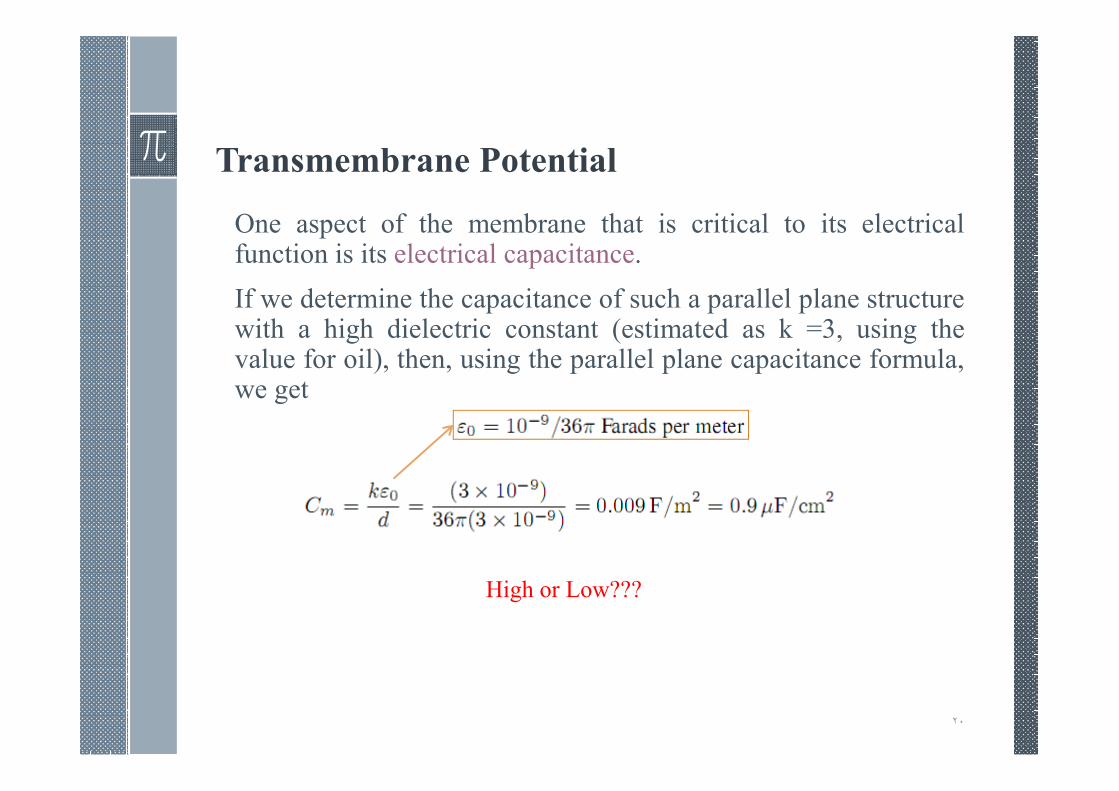
One aspect of the membrane that is critical to its electricalfunction is its electrical capacitance.
If we determine the capacitance of such a parallel plane structurewith a high dielectric constant (estimated as k =3, using thevalue for oil), then, using the parallel plane capacitance formula,we get
٢٠
High or Low???
Transmembrane Potential
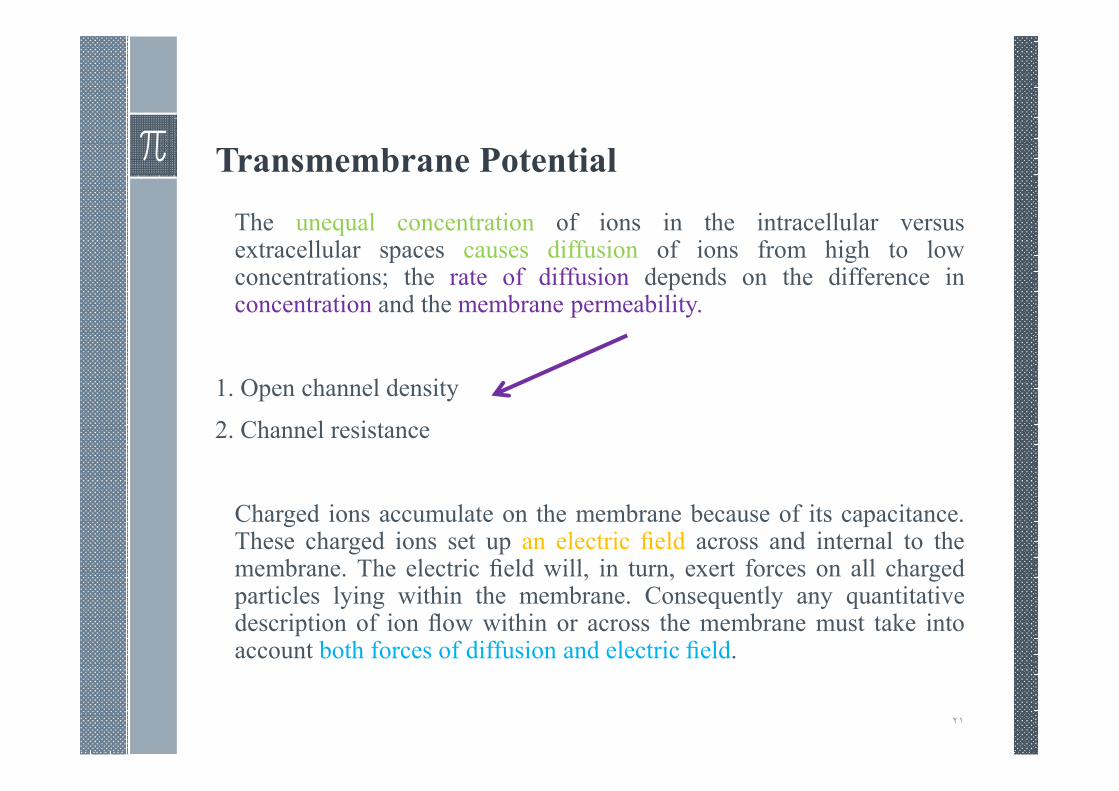
The unequal concentration of ions in the intracellular versusextracellular spaces causes diffusion of ions from high to lowconcentrations; the rate of diffusion depends on the difference inconcentration and the membrane permeability.
1. Open channel density
2. Channel resistance
Charged ions accumulate on the membrane because of its capacitance.These charged ions set up an electric field across and internal to themembrane. The electric field will, in turn, exert forces on all chargedparticles lying within the membrane. Consequently any quantitativedescription of ion flow within or across the membrane must take intoaccount both forces of diffusion and electric field.
٢١
Transmembrane Potential
At a particular moment, the movement of ions of type p across amembrane will depend on:
1. The relative density of p channels
2. The relative probability of such a channel being open
3. The conductance of the channel
4. The net driving force (diffusional plus electric field) for thision species.
In the following we treat the permeability of the membrane as,in its effect, uniformly distributed, that is, we determine amacroscopic description arising from the averagedmicroscopic channel behavior.
٢٢
Transmembrane Potential
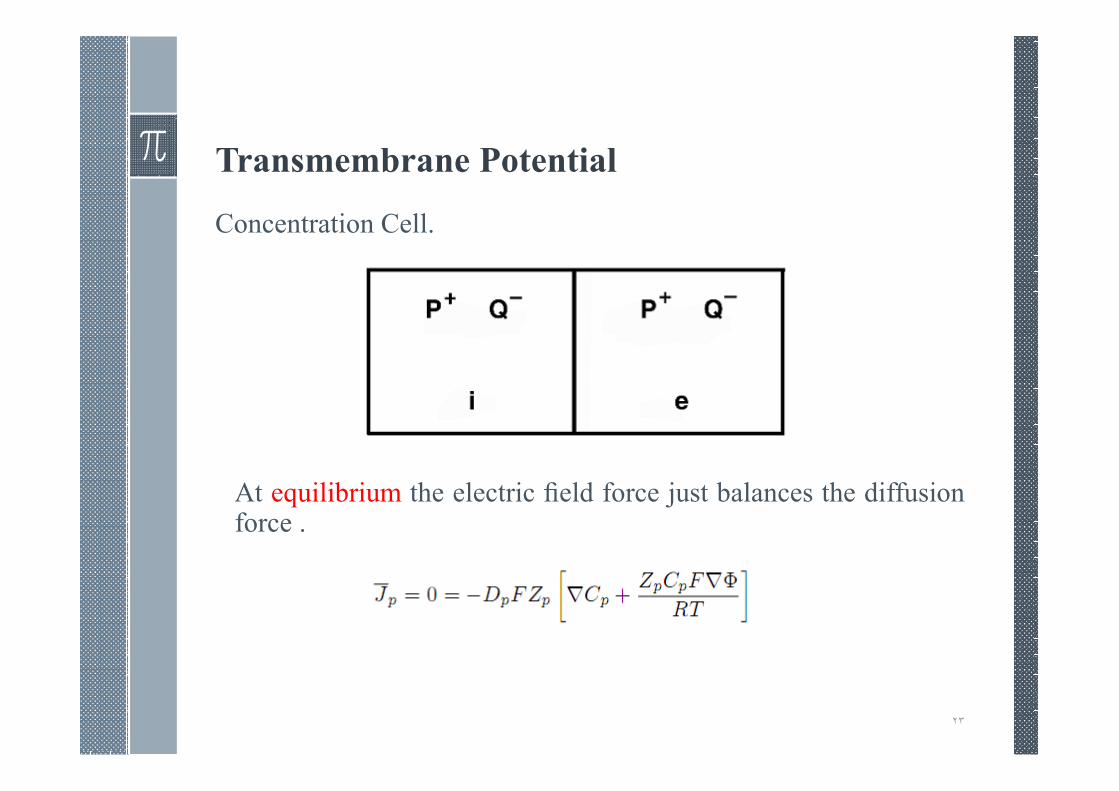
Concentration Cell.
At equilibrium the electric field force just balances the diffusionforce .
٢٣
Transmembrane Potential
٢۴
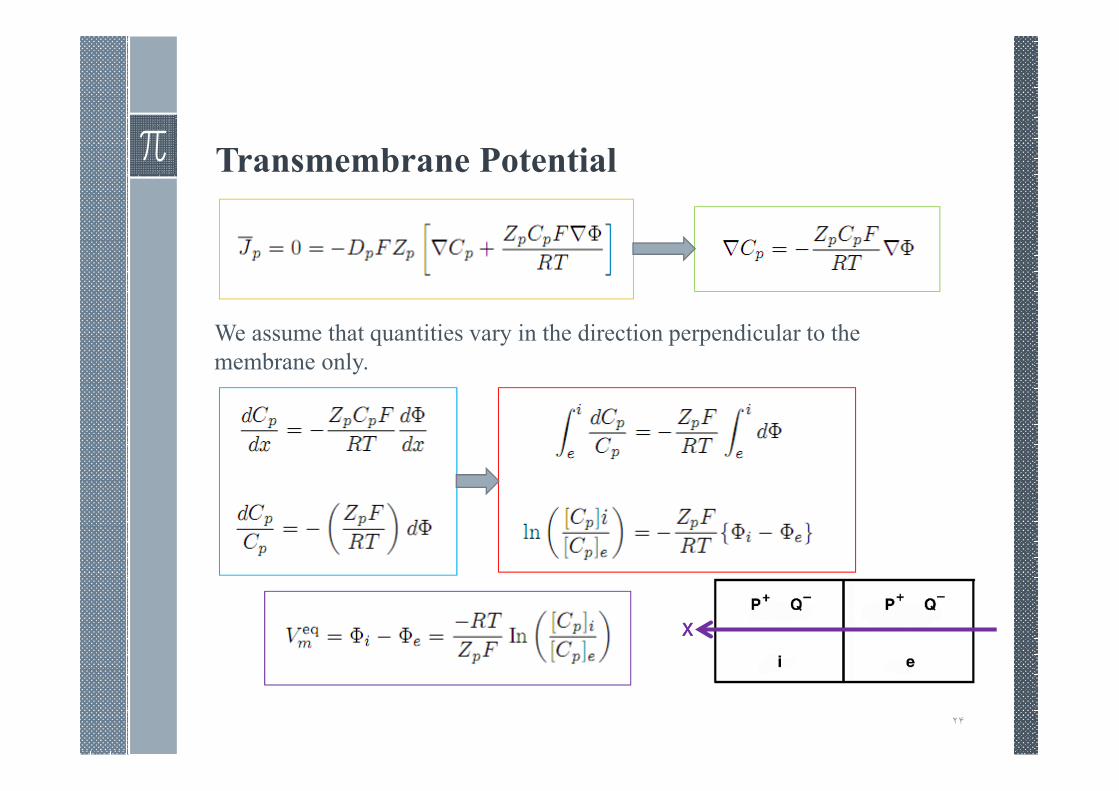
We assume that quantities vary in the direction perpendicular to the
membrane only.
xxxx
Transmembrane Potential
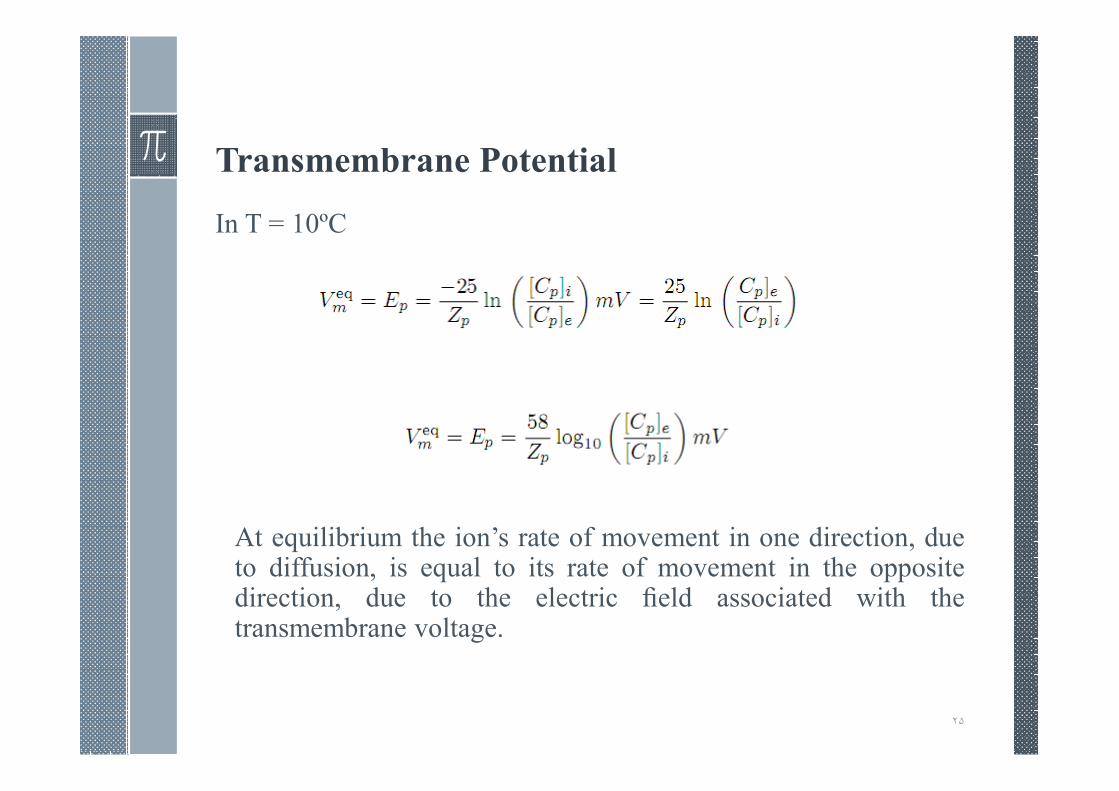
In T = 10ºC
At equilibrium the ion’s rate of movement in one direction, dueto diffusion, is equal to its rate of movement in the oppositedirection, due to the electric field associated with thetransmembrane voltage.
٢۵
Transmembrane Potential
The Nernst potentials for the major ion species are importantquantities and are usually assigned special symbols, where Ep isdefined to be VP(eq).
٢۶
Transmembrane Potential
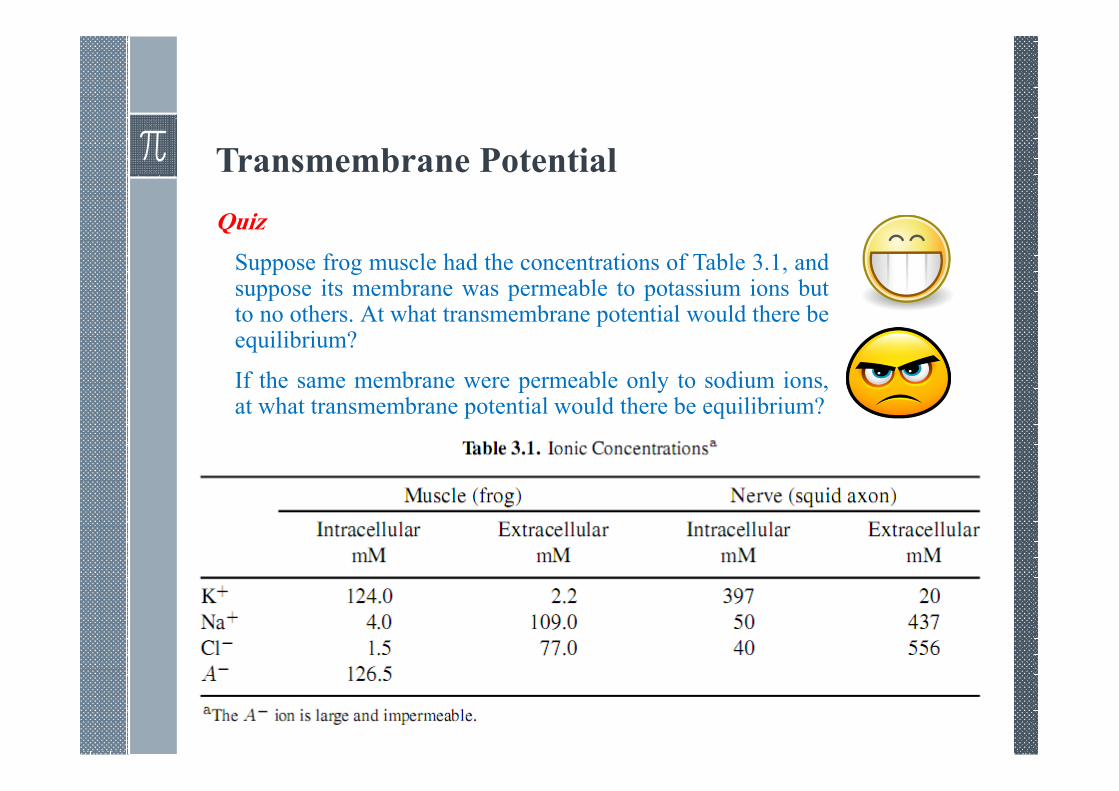
Quiz
Suppose frog muscle had the concentrations of Table 3.1, andsuppose its membrane was permeable to potassium ions butto no others. At what transmembrane potential would there beequilibrium?
If the same membrane were permeable only to sodium ions,at what transmembrane potential would there be equilibrium?
٢٧
Transmembrane Potential
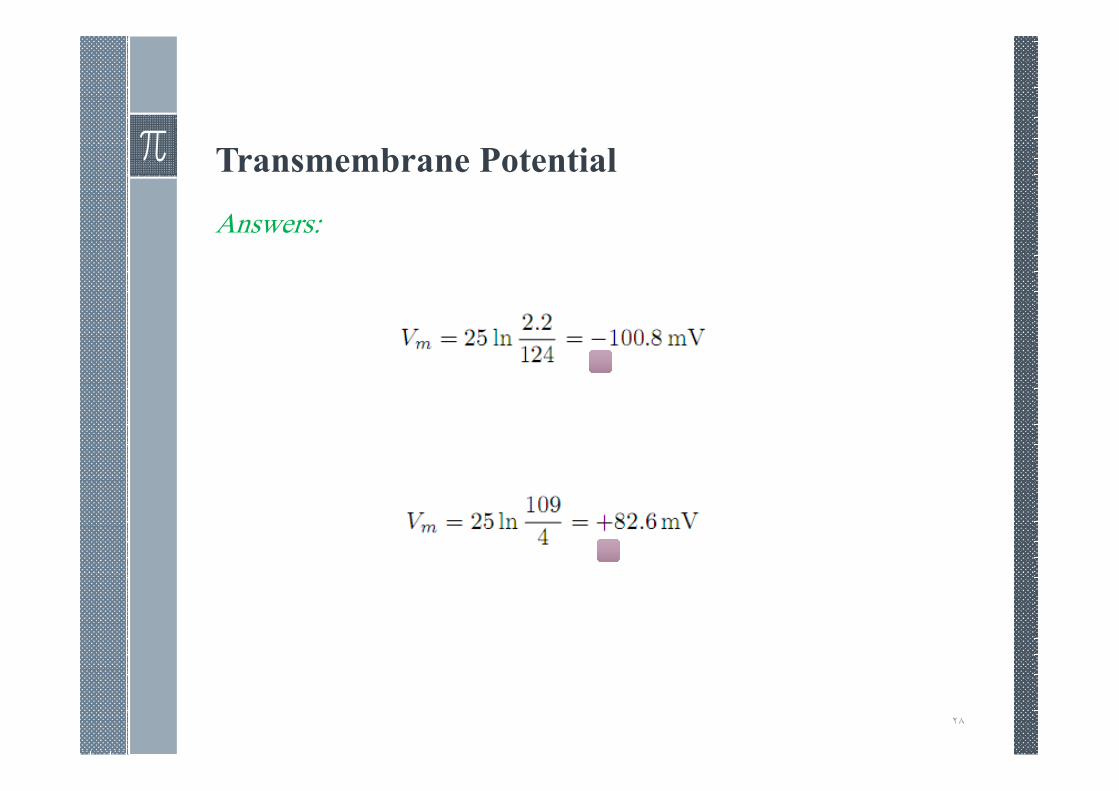
Answers:
٢٨
PARALLEL-CONDUCTANCE MODEL
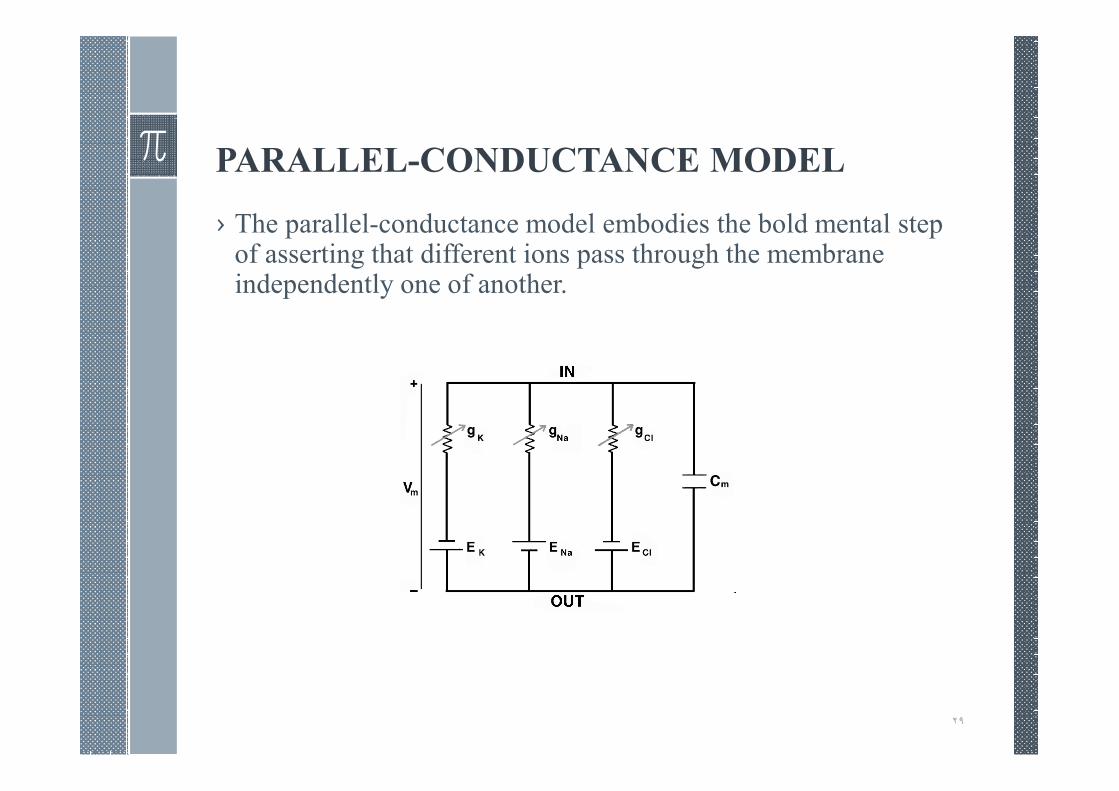
› The parallel-conductance model embodies the bold mental step of asserting that different ions pass through the membrane independently one of another.
٢٩
PARALLEL-CONDUCTANCE MODEL
› Resting Potential: The excitable membrane resting potential is one that brings the membrane into a steady state. It is that value at which the total membrane current is zero (otherwise, we have a changing potential and the membrane is not at rest).
› The model is intended to represent the flow of ions through theirrespective ionic channels in a small area of membrane, oftencalled a membrane element, or a membrane patch.
› Ionic Currents: As shown, the model assumes that thesignificant ions are potassium, sodium, and chloride. Eachbranch determines the contribution to the total transmembranecurrent from a specific ion species, and each branch is thought ofas a macroscopic description of the respective open ionchannels.
٣٠
PARALLEL-CONDUCTANCE MODEL
› Assumption: The underlying assumption of the parallel-conductance model is that one can identify segments ofmembrane that are small enough that the transmembrane voltageis the same all across the patch, while at the same time largeenough that the patch encompasses numerous ionic channels, sothat average channel behavior is all that has to be represented.This underlying assumption proves to be true in most situations.
› If the membrane potential is , then the net driving force forpotassium is ( − ),which evaluates the deviation fromequilibrium. The potassium current is, consequently,proportional to − ; the proportionality coefficient hasthe dimensions of a conductance, and is called the potassiumconductance. Conductance is not a constant but variesdepending on how many channels are open at a particularmoment.
٣١
PARALLEL-CONDUCTANCE MODEL
= ( − )
› If > , then the outward diffusional forces are notcompletely equilibrated by the electric field, and a net outwardpotassium flux, hence current, results. Note that isappropriately positive.
› For the sodium ion = ( − )
› Here if > , then because , is positive must bepositive and even larger than . The result is an outwardsodium flux driven by an electric field which exceeds the inwarddiffusional forces.
٣٢
PARALLEL-CONDUCTANCE MODEL
› For the chloride ion
= ( − )
› If > , the inward chloride diffusion is not completelyequilibrated and a net influx occurs. Since this influx is of ionswith a negative charge, it constitutes an outward electric current.
› Parallel-conductance models as used in particular contexts arenormally modified in significant ways from the form above. Forexample, Hodgkin and Huxley used a parallel-conductancemodel that had sodium and potassium pathways, and a thirdpathway identified as leakage. They inferred the properties ofthe leakage channel from measurements of the transmembranepotential, rather than by modeling a specific ionic flow.
٣٣
PARALLEL-CONDUCTANCE MODEL
› Capacitive Current: To complete the list of contributions to thetransmembrane current we add the capacitive (or displacement)current, which is simply
=
› At rest (that is, at steady state), = 0since
= 0(because
if
was not zero, would be changing and thus not at steady
state). Capacitive current is much more important than onemight at first suspect, because the membrane is very thin andthus highly capacitive.
٣۴
PARALLEL-CONDUCTANCE MODEL
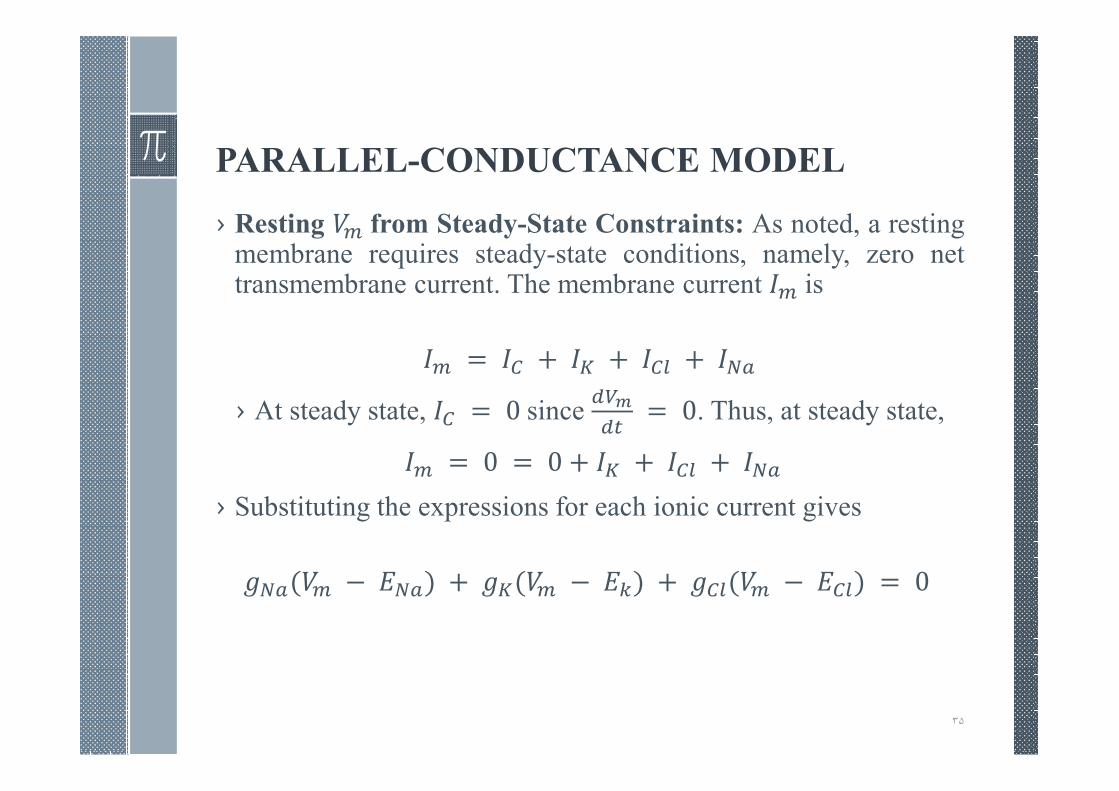
› Resting from Steady-State Constraints: As noted, a restingmembrane requires steady-state conditions, namely, zero nettransmembrane current. The membrane current is
= + + +
› At steady state, = 0since
= 0. Thus, at steady state,
= 0 = 0 + + +
› Substituting the expressions for each ionic current gives
( − ) + ( − ) + ( − ) = 0
٣۵
PARALLEL-CONDUCTANCE MODEL
› Example for Squid Axon on page 65
٣۶
CONTRIBUTIONS FROM CHLORIDE
› Chloride–Potassium Equilibrium
The role of the chloride ion in determining the resting potential appears tobe secondary to that of potassium. This comes about because theintracellular chloride concentration is very small and undergoes a largepercentage change with small amounts of chloride influx or efflux (whichis not true for potassium). Consequently, chloride ion movements can beexpected to occur that accommodate it to the potassium ion ratio to bringboth ion ratios into consonance (i.e., the same Nernst potential), namely,when
! =
" ! "
Since the chloride ion ratio tracks the potassium, one need only follow thelatter to evaluate the resting membrane potential (as a roughapproximation). Changes in resting potential may similarly be thoughtdue solely to the potassium ion ratio, namely,
≈ 25ln(
"
)
٣٧
4: CHANNELS
٣٨
Channel Structure: Molecular Genetics
› Biological cells are enclosed by a plasma membrane. Thismembrane consists of a lipid bilayer and the hydrophilic polarheads are oriented facing the intracellular and extracellularwater-containing media, while the hydrophobic tails, on theother hand, are internal to the membrane.
› Channel structure by electron microscopy
› Channel structure: molecular genetics
٣٩
What is patch-clamp?
Patch-clamping is an electrophysiological technique in which we are able
to CLAMP the VOLTAGE of an isolated piece of cell membrane (or
whole-cell). By clamping the voltage we are able to observe CURRENTS
that flow through ION CHANNELS. It is the current that the patch-clamp
amplifier supplies to hold the voltage steady (clamped) that we measure.
Patch-clamp recording allows us to measure very small currents - in the
pA range (10-12 A).
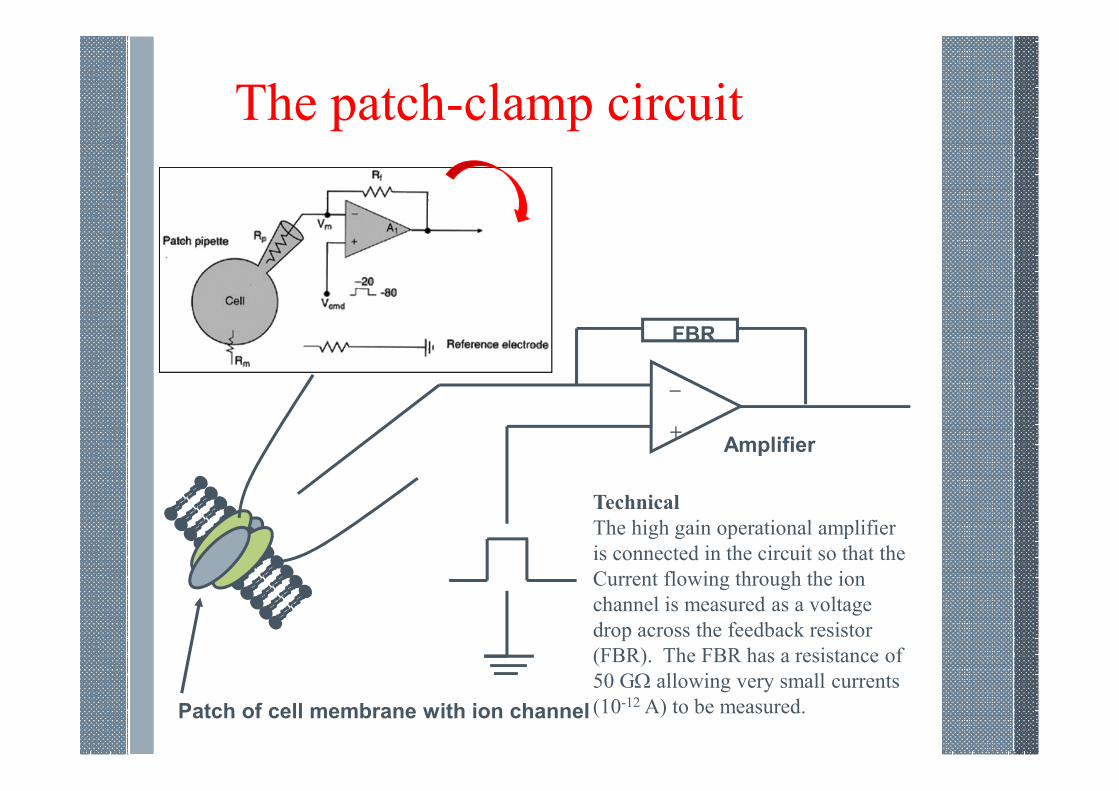
The patch-clamp circuit
Patch of cell membrane with ion channel
FBR
_
+Amplifier
Technical
The high gain operational amplifier
is connected in the circuit so that the
Current flowing through the ion
channel is measured as a voltage
drop across the feedback resistor
(FBR). The FBR has a resistance of
50 GΩ allowing very small currents
(10-12 A) to be measured.
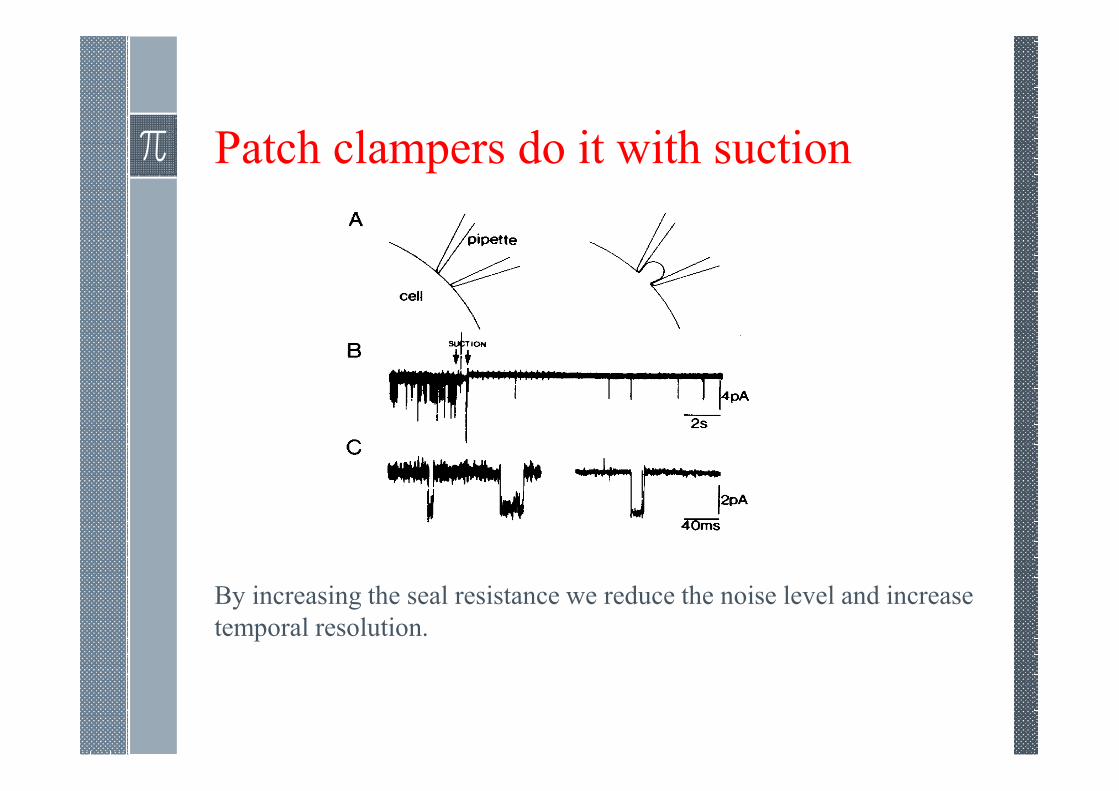
Patch clampers do it with suction
By increasing the seal resistance we reduce the noise level and increase
temporal resolution.
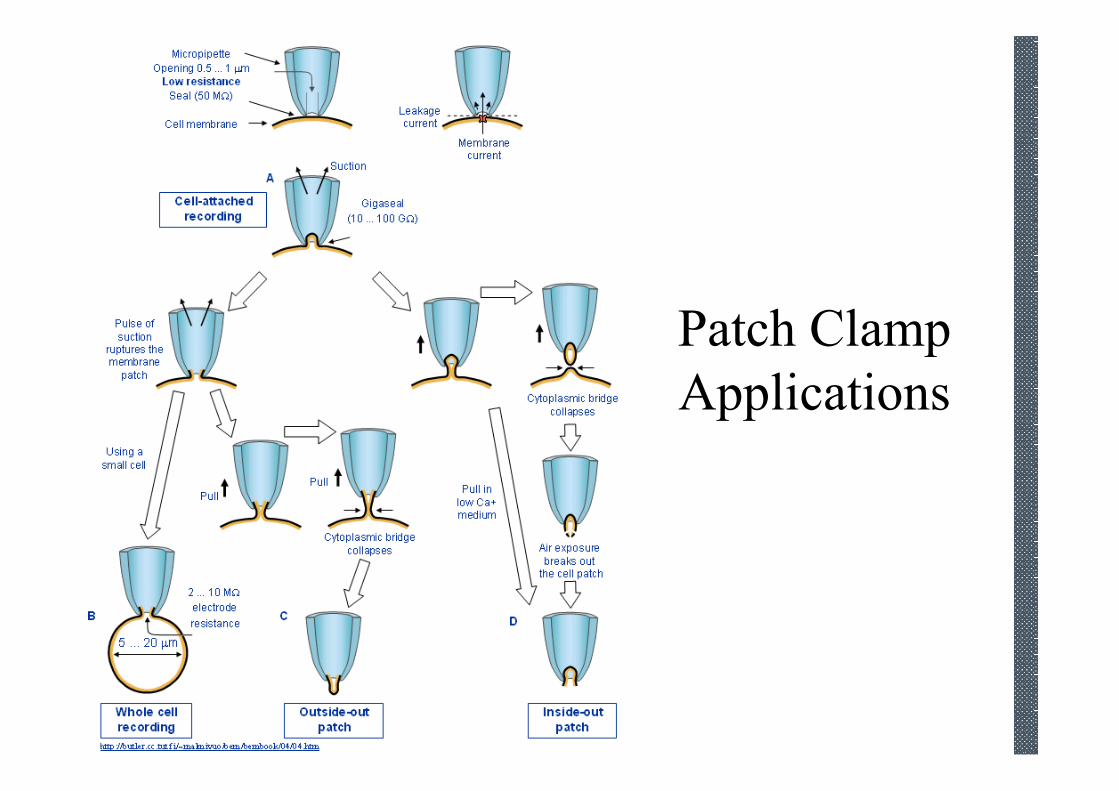
Patch Clamp
Applications
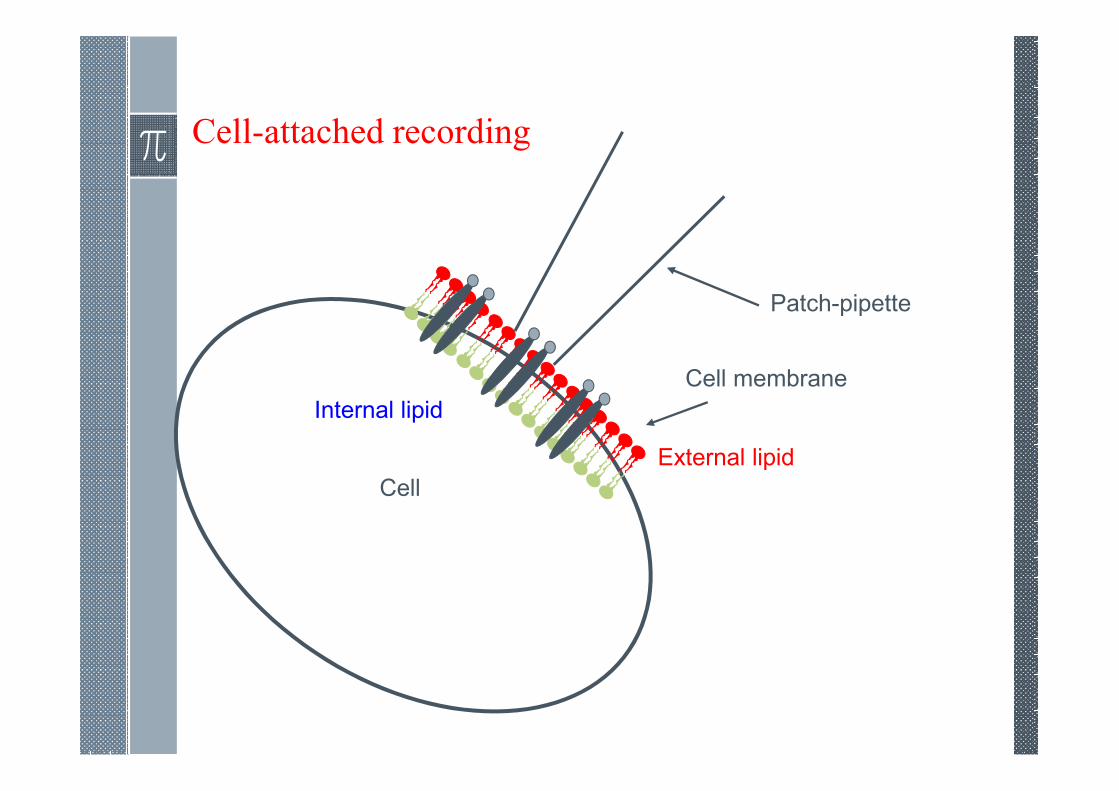
Cell-attached recording
Cell
Patch-pipette
Cell membrane
External lipid
Internal lipid
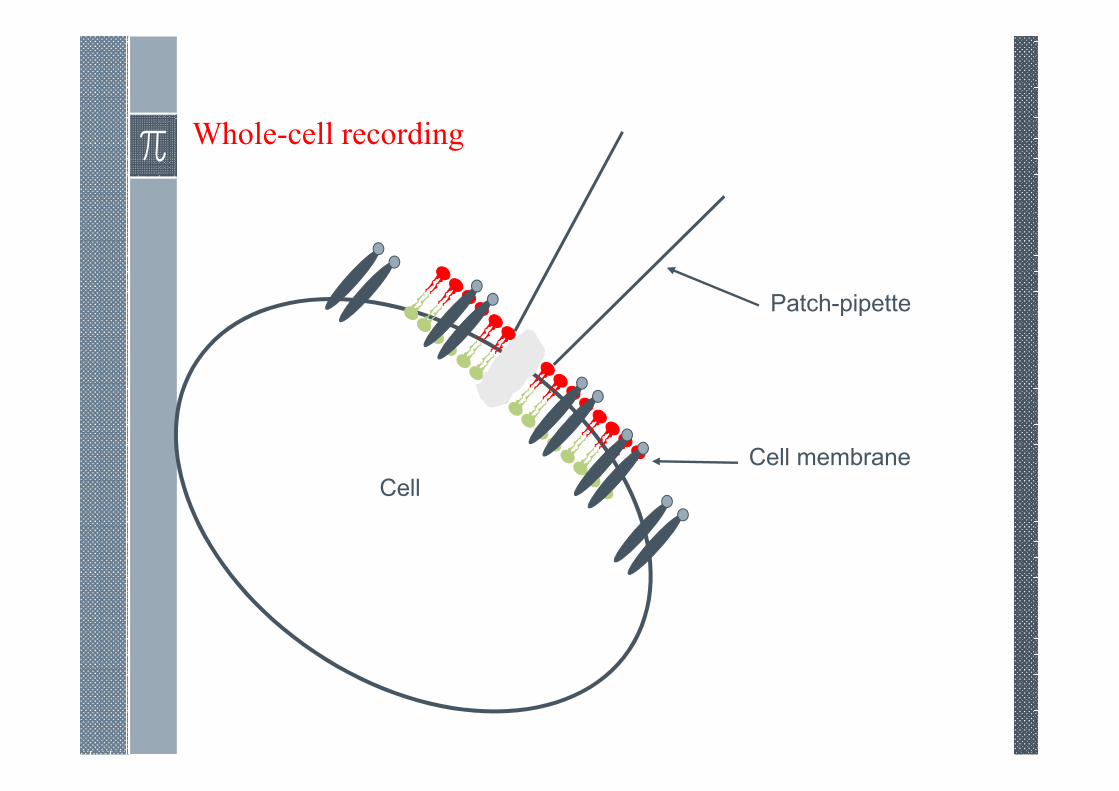
Whole-cell recording
Cell
Patch-pipette
Cell membrane
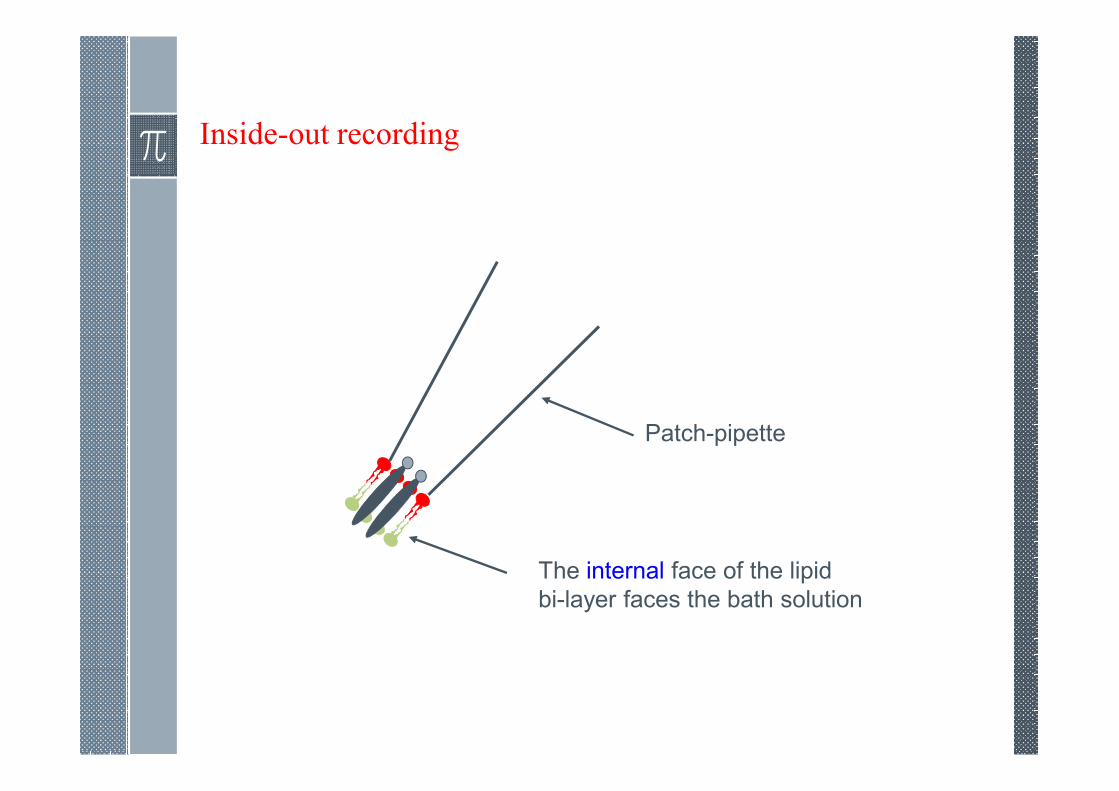
Inside-out recording
Patch-pipette
The internal face of the lipid
bi-layer faces the bath solution
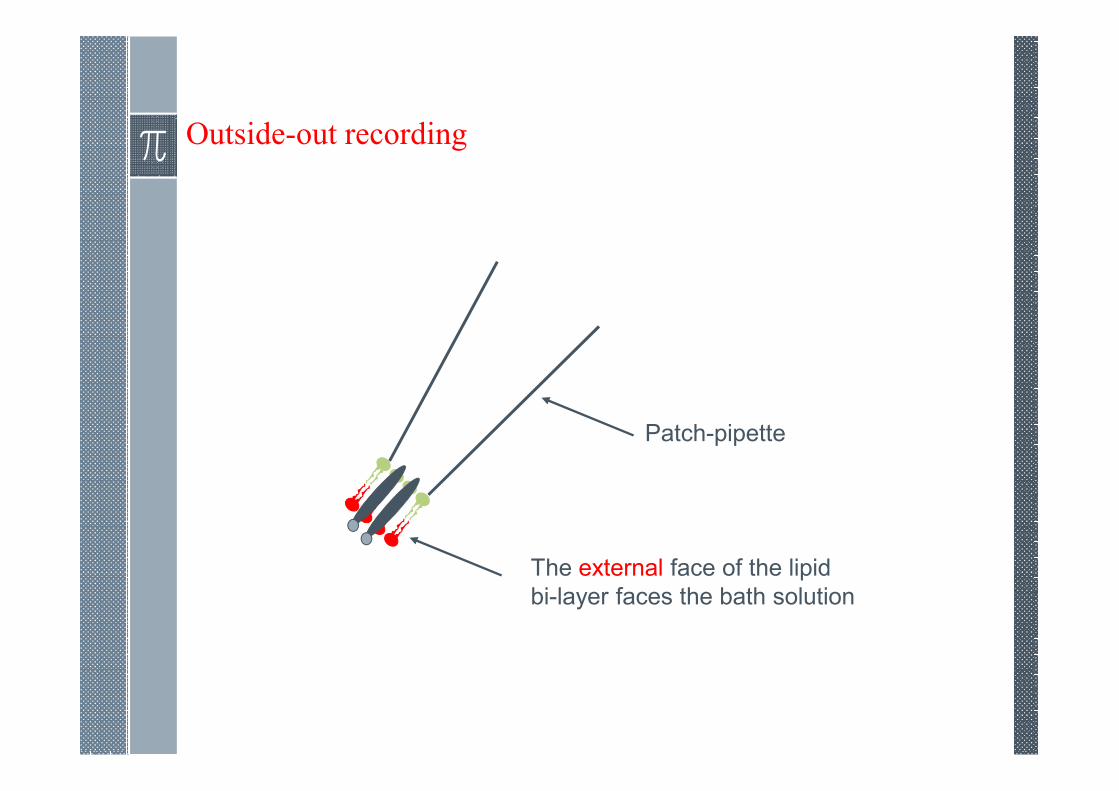
Outside-out recording
Patch-pipette
The external face of the lipid
bi-layer faces the bath solution
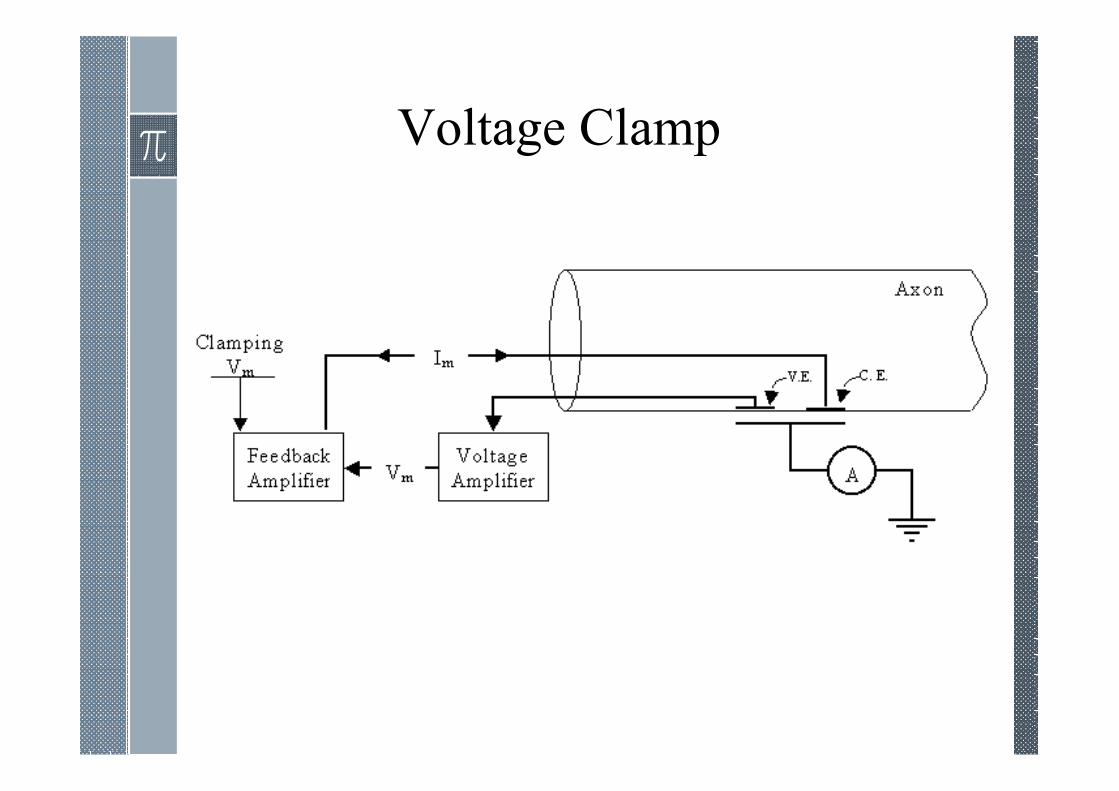
Voltage Clamp
Single-Channel Currents
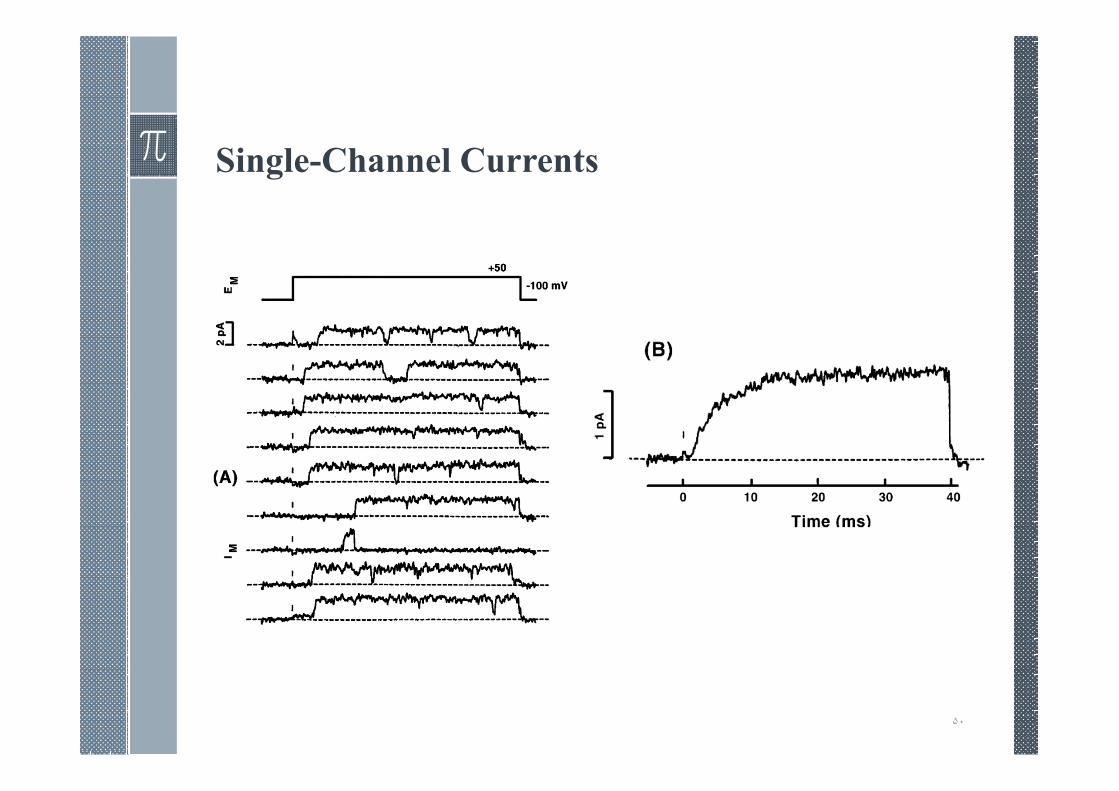
› Examination of patch-clamp current reveals discontinuities thatdirectly reflect the opening and closing of channel gates.
› The current waveform is interpreted as reflecting the openingand closing of a single channel.
› The single-channel record is seen to switch to and from an openor closed state. The time in each state varies randomly, but if theratio of open to closed time is evaluated over a sufficiently longperiod, then this ratio (with some statistical variation) will be thesame over any successive such interval. Such a determinationgives the expected value or probability that the channel will beopen (closed), a value that is independent of time under thesesteady-state conditions.
۴٩
Single-Channel Currents
۵٠
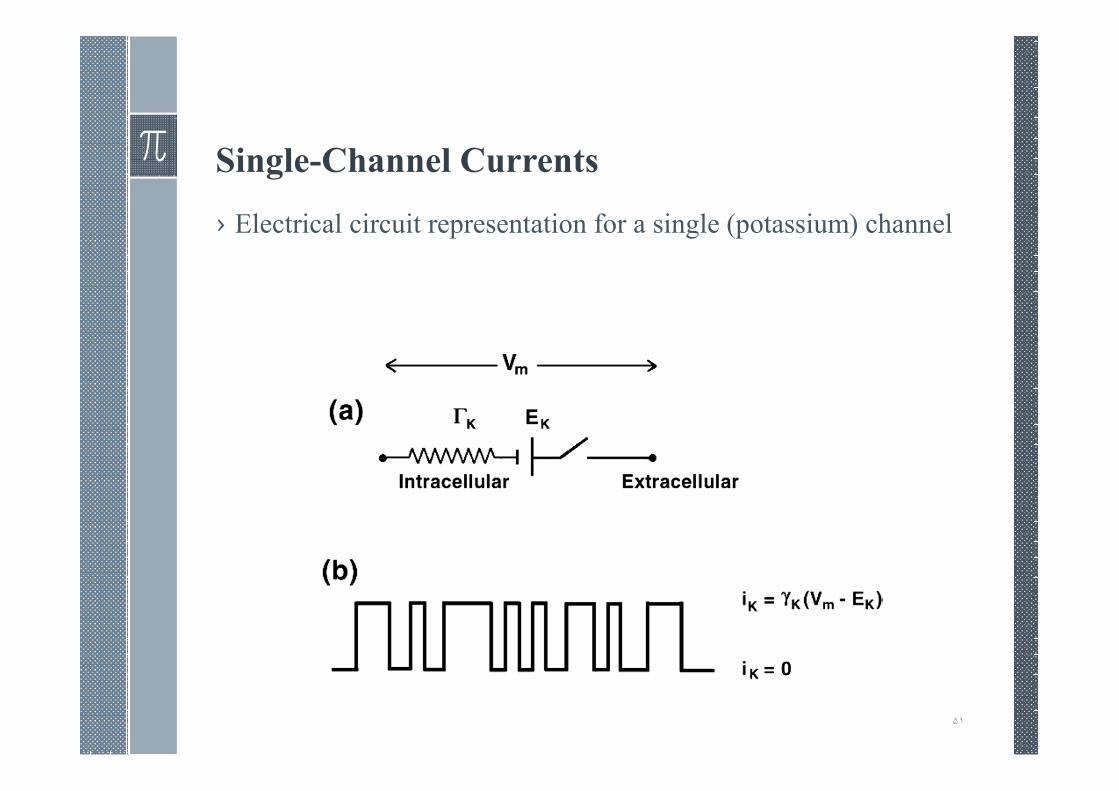
Single-Channel Currents
۵١
› Electrical circuit representation for a single (potassium) channel
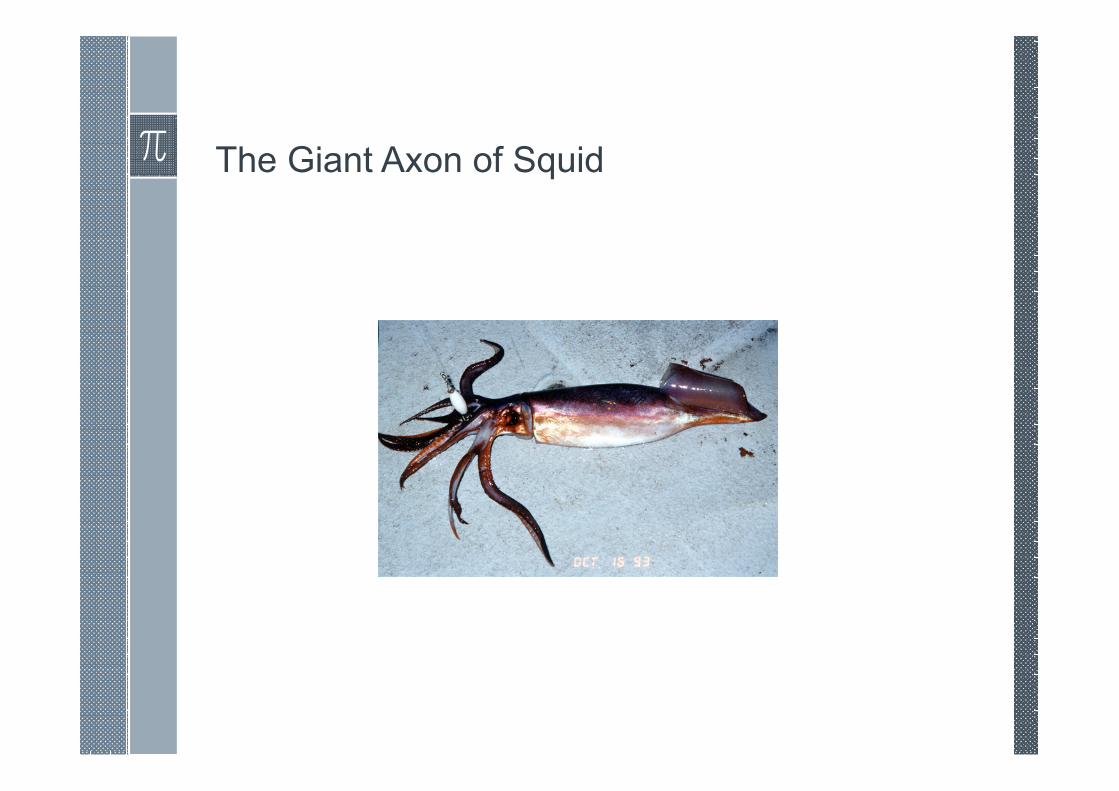
The Giant Axon of Squid
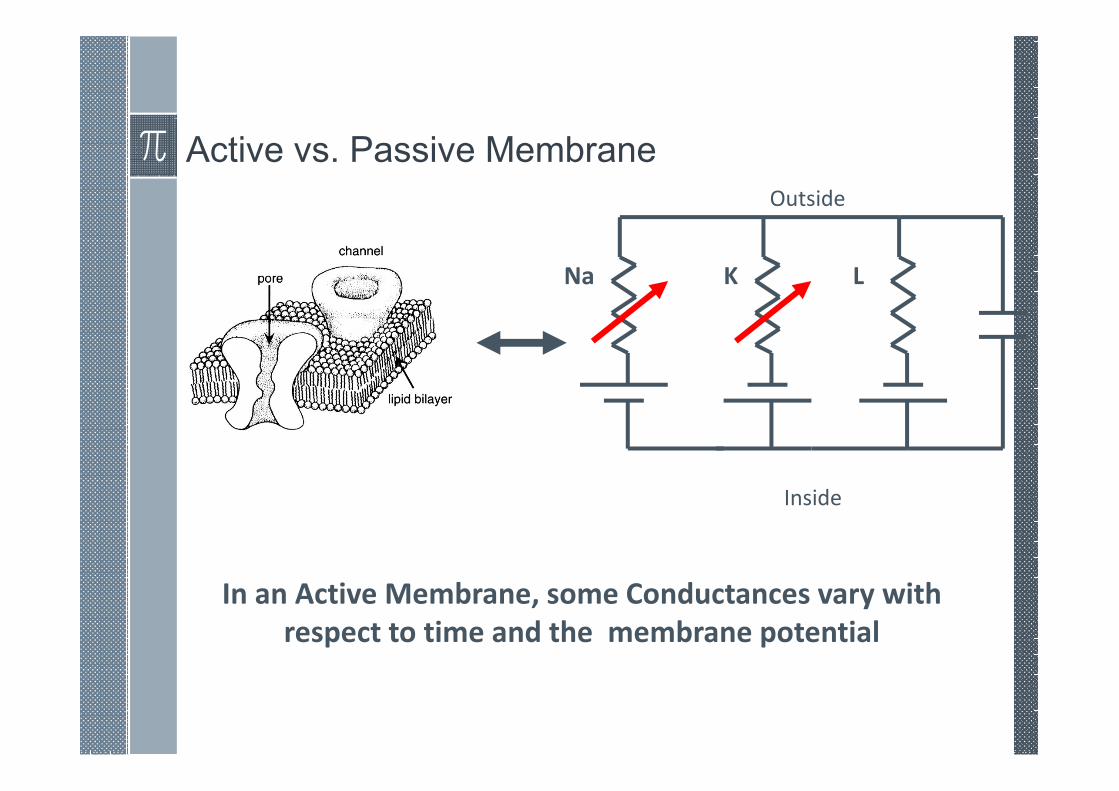
Active vs. Passive Membrane
Na K L
In an Active Membrane, some Conductances vary with
respect to time and the membrane potential
Inside
Outside
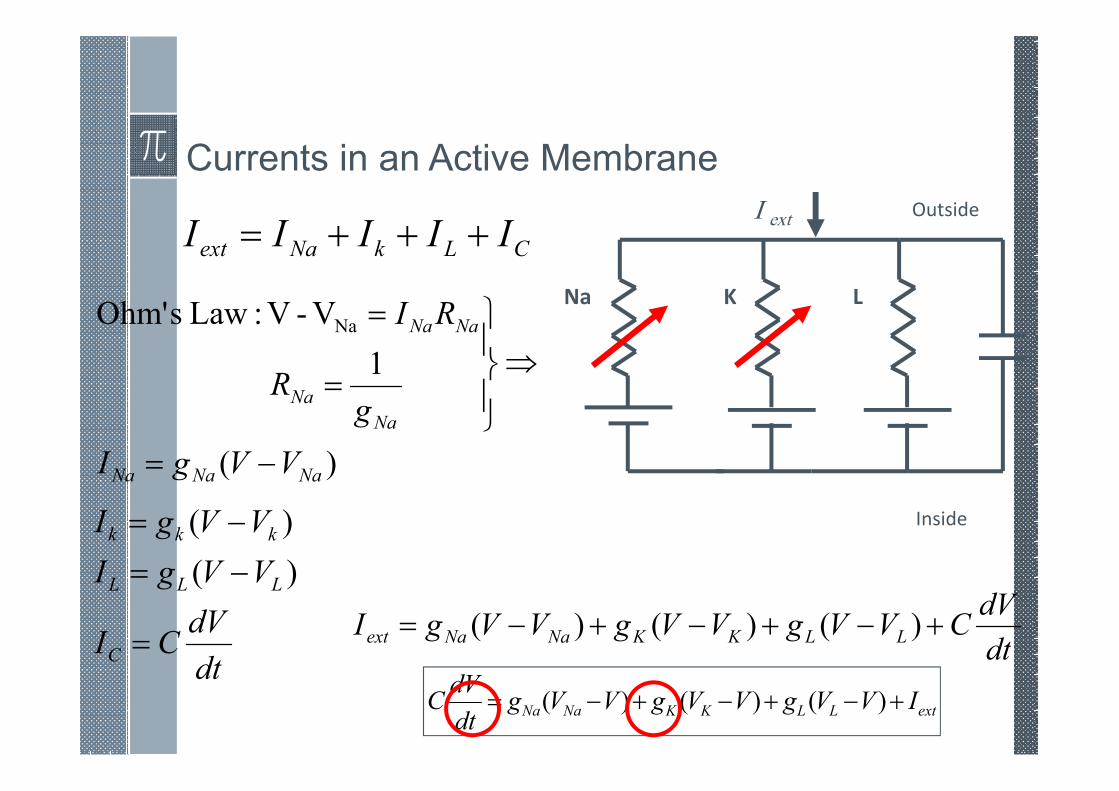
Currents in an Active Membrane
CLkNaext IIIII +++=
)(
1
V-V :Law sOhm' Na
NaNaNa
Na
Na
NaNa
VVgI
gR
RI
−=
⇒
=
=
)(
)(
dt
dVCI
VVgI
VVgI
C
LLL
kkk
=
−=
−=
Na K L
Inside
OutsideI ext
dt
dVCVVgVVgVVgI LLKKNaNaext +−+−+−= )()()(
extLLKKNaNa IVVgVVgVVgdt
dVC +−+−+−= )()()(
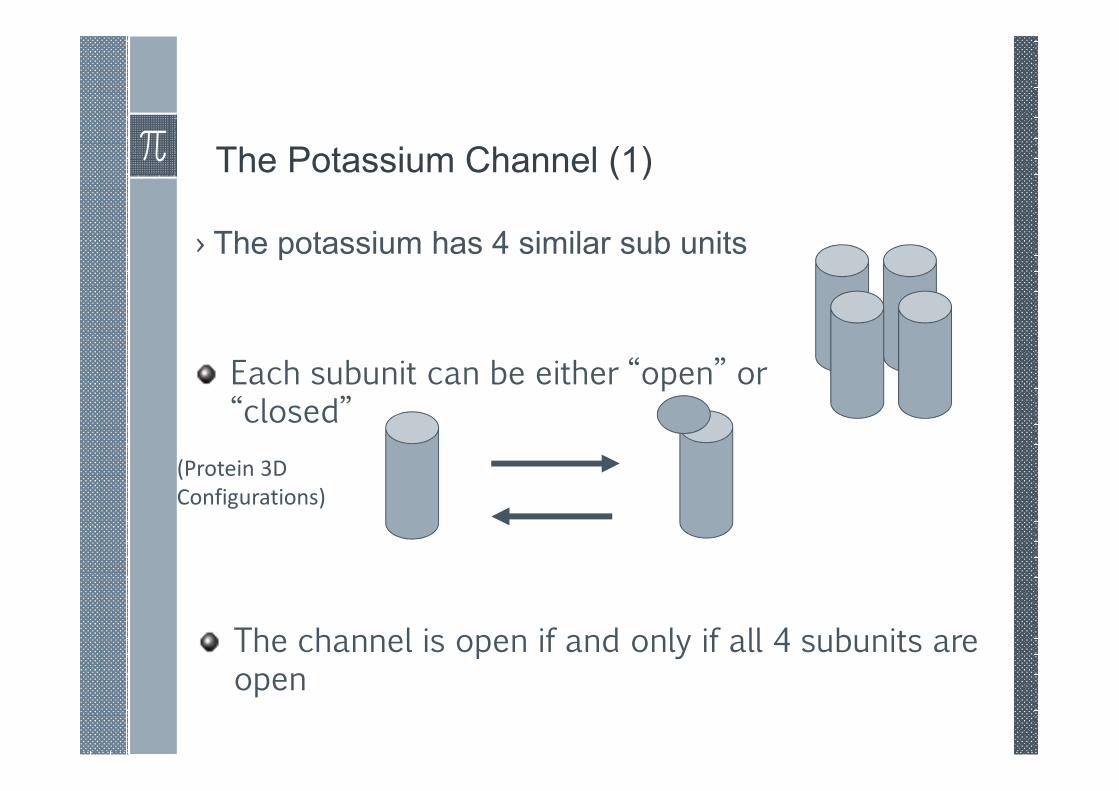
The Potassium Channel (1)
› The potassium has 4 similar sub units
Each subunit can be either “open” or “closed”
(Protein 3D
Configurations)
The channel is open if and only if all 4 subunits are open
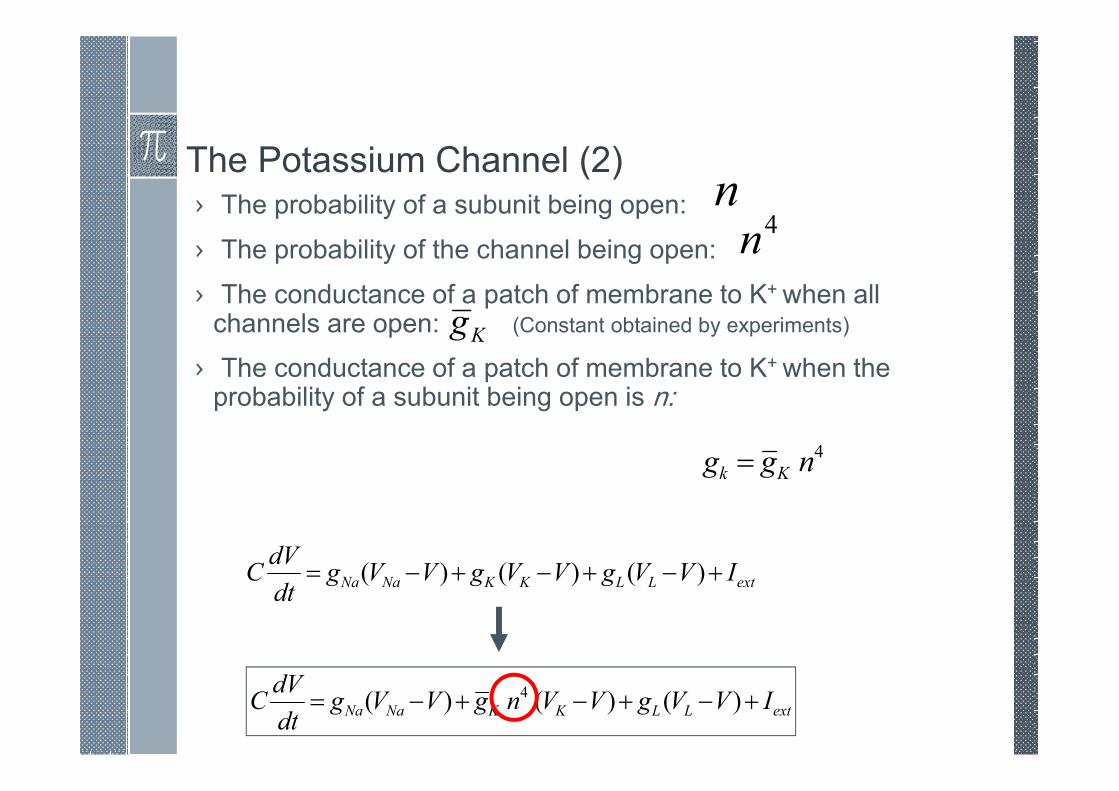
The Potassium Channel (2)› The probability of a subunit being open:
› The probability of the channel being open:
› The conductance of a patch of membrane to K+ when all channels are open: (Constant obtained by experiments)
› The conductance of a patch of membrane to K+ when the probability of a subunit being open is n:
n4n
Kg
4 ngg Kk =
extLLKKNaNa IVVgVVgVVgdt
dVC +−+−+−= )()()(
extLLKKNaNa IVVgVVngVVgdt
dVC +−+−+−= )()( )( 4
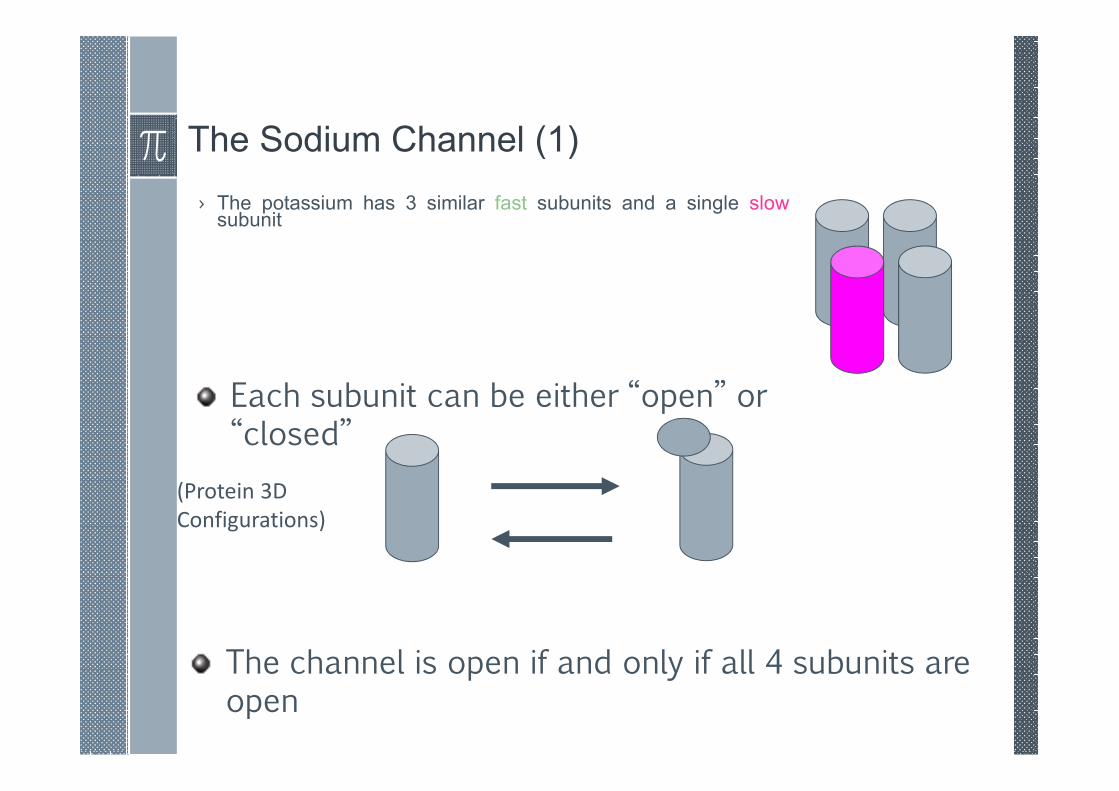
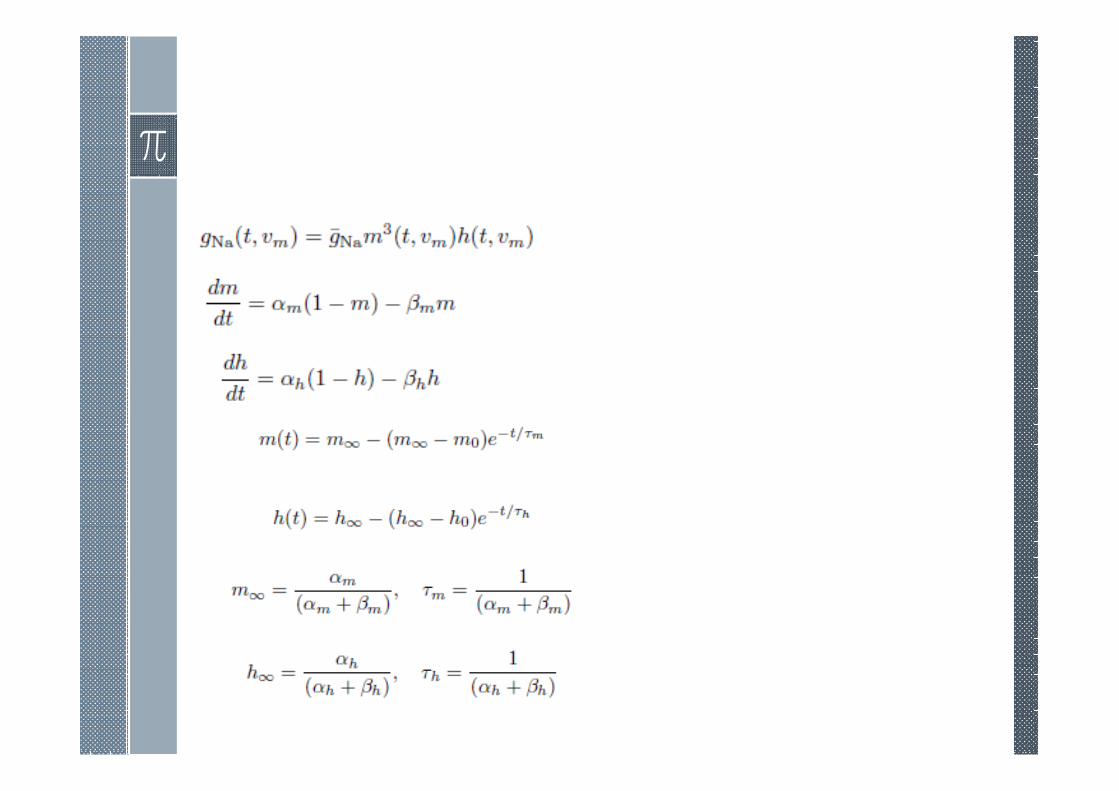
The Sodium Channel (1)
› The potassium has 3 similar fast subunits and a single slowsubunit
Each subunit can be either “open” or “closed”
(Protein 3D
Configurations)
The channel is open if and only if all 4 subunits are open
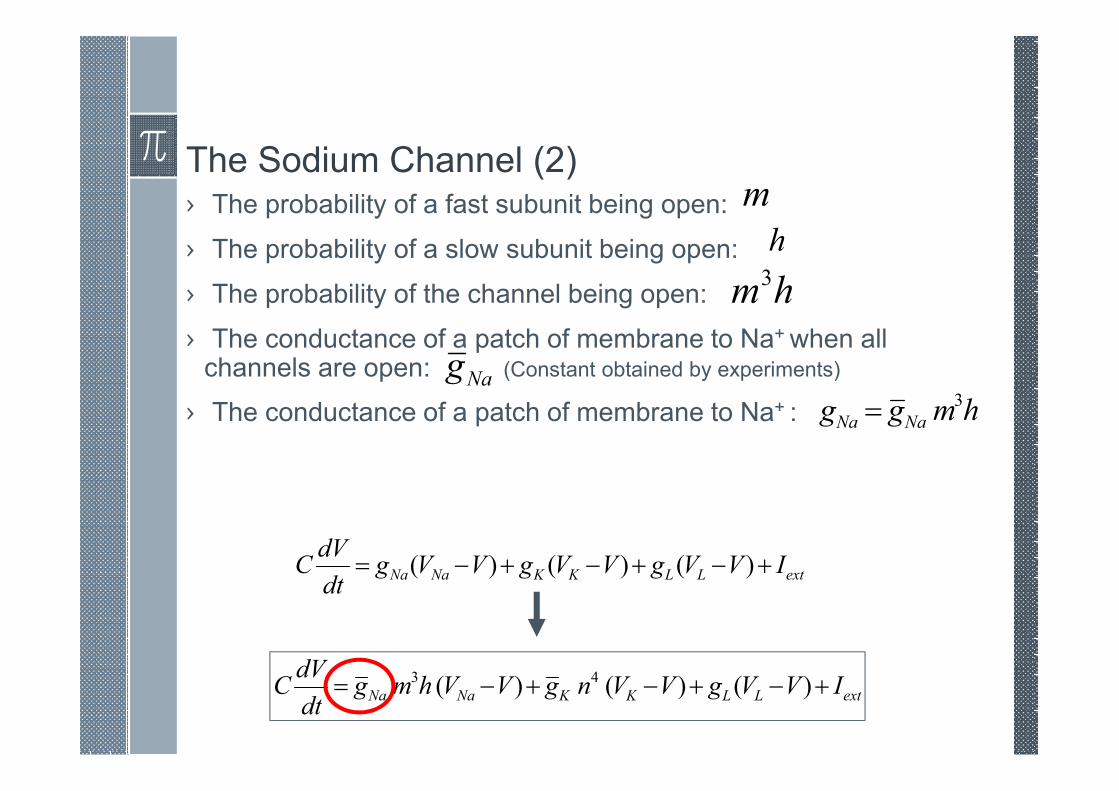
The Sodium Channel (2)› The probability of a fast subunit being open:
› The probability of a slow subunit being open:
› The probability of the channel being open:
› The conductance of a patch of membrane to Na+ when all channels are open: (Constant obtained by experiments)
› The conductance of a patch of membrane to Na+ :
m
hm3
Nag
hmgg NaNa
3 =
extLLKKNaNa IVVgVVgVVgdt
dVC +−+−+−= )()()(
extLLKKNaNa IVVgVVngVVhmgdt
dVC +−+−+−= )()( )( 43
h
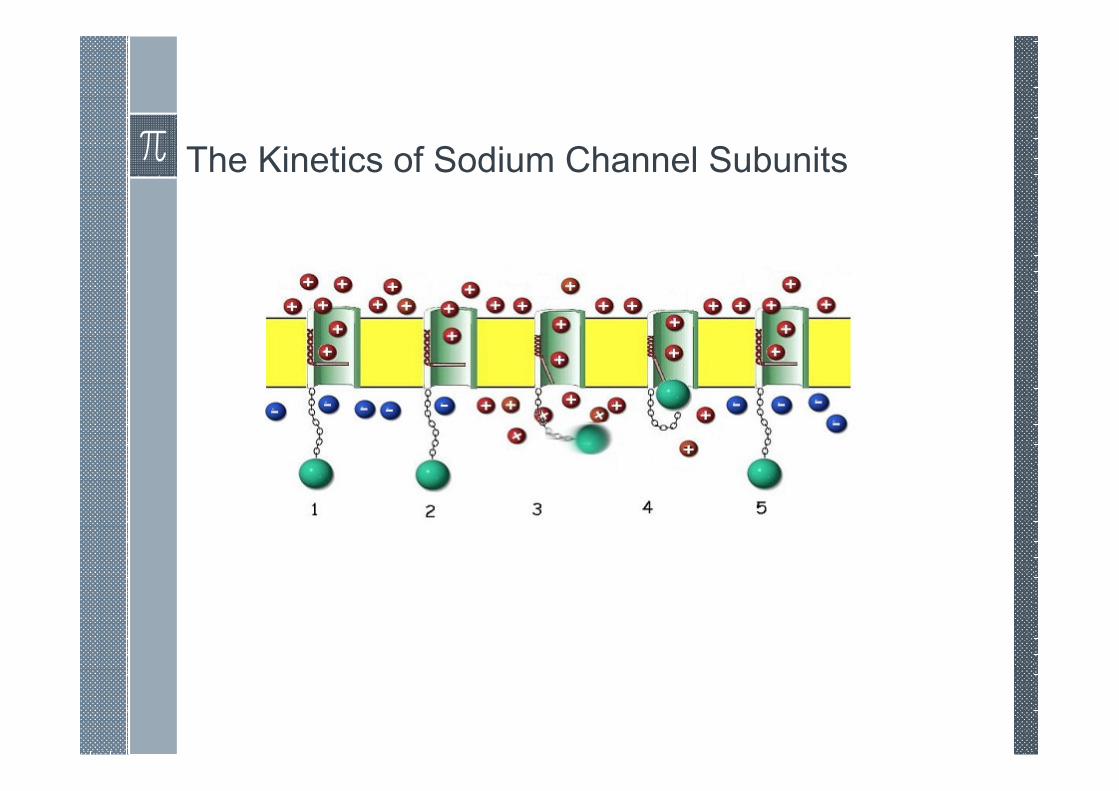
The Kinetics of Sodium Channel Subunits
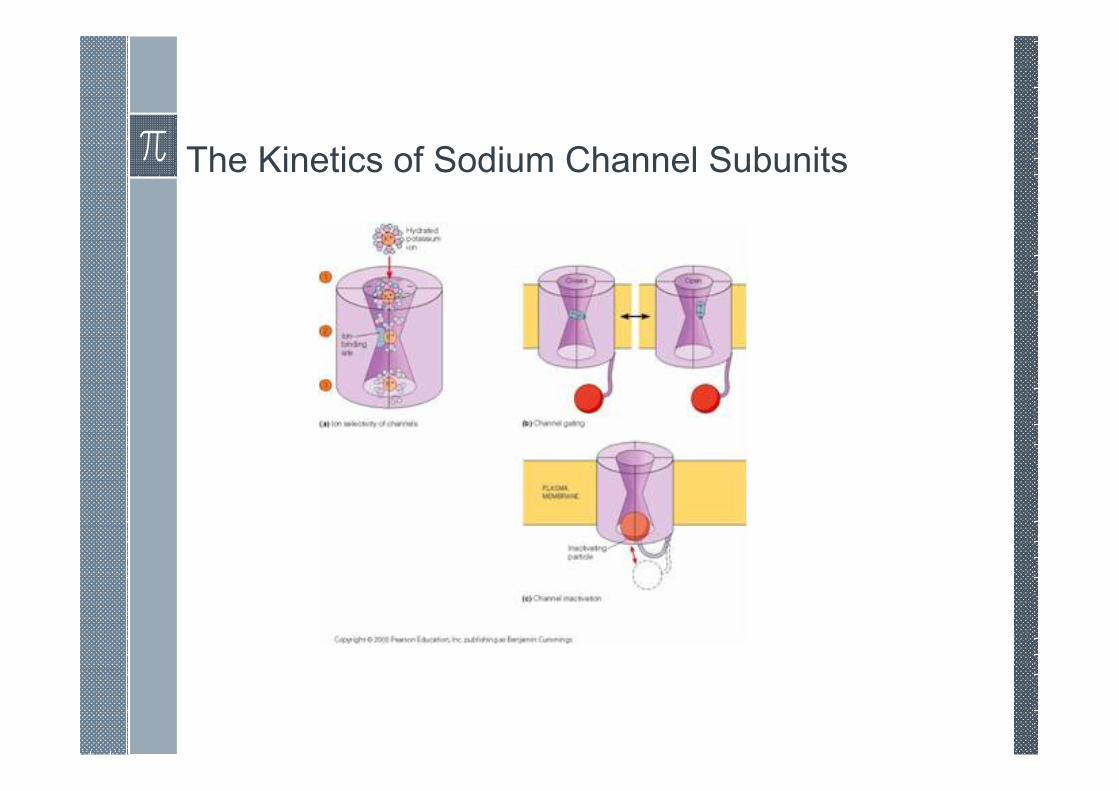
The Kinetics of Sodium Channel Subunits
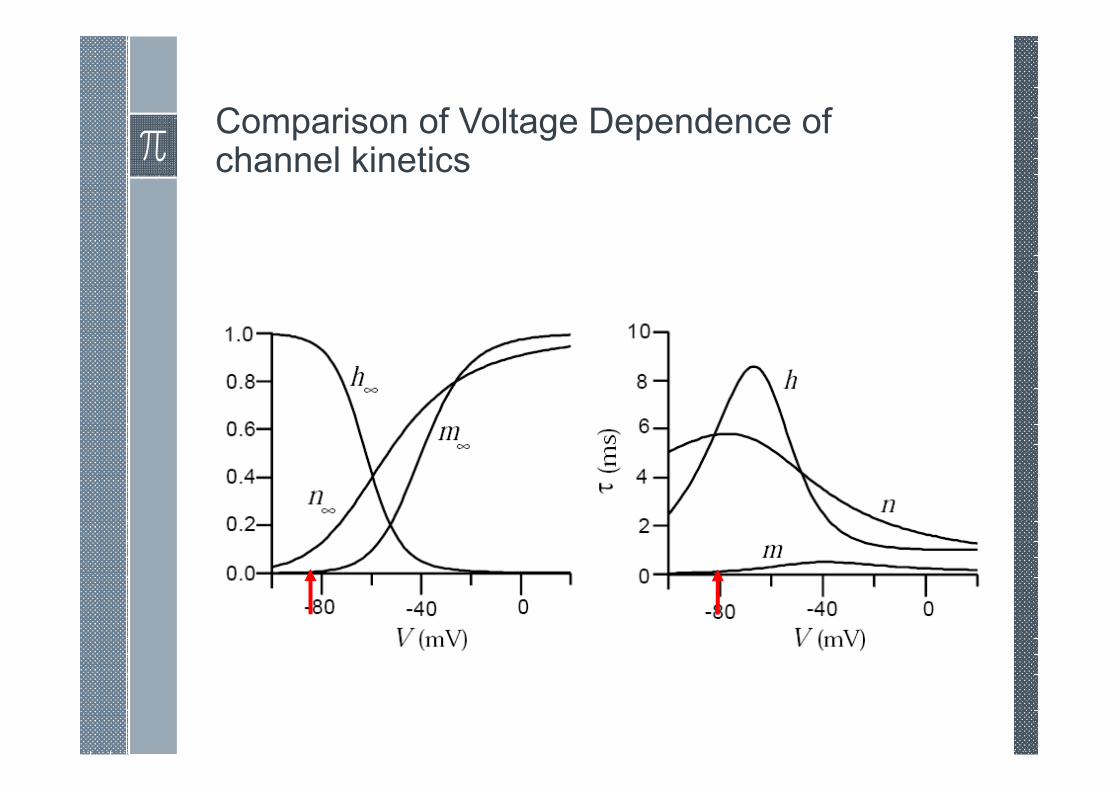
Comparison of Voltage Dependence of channel kinetics
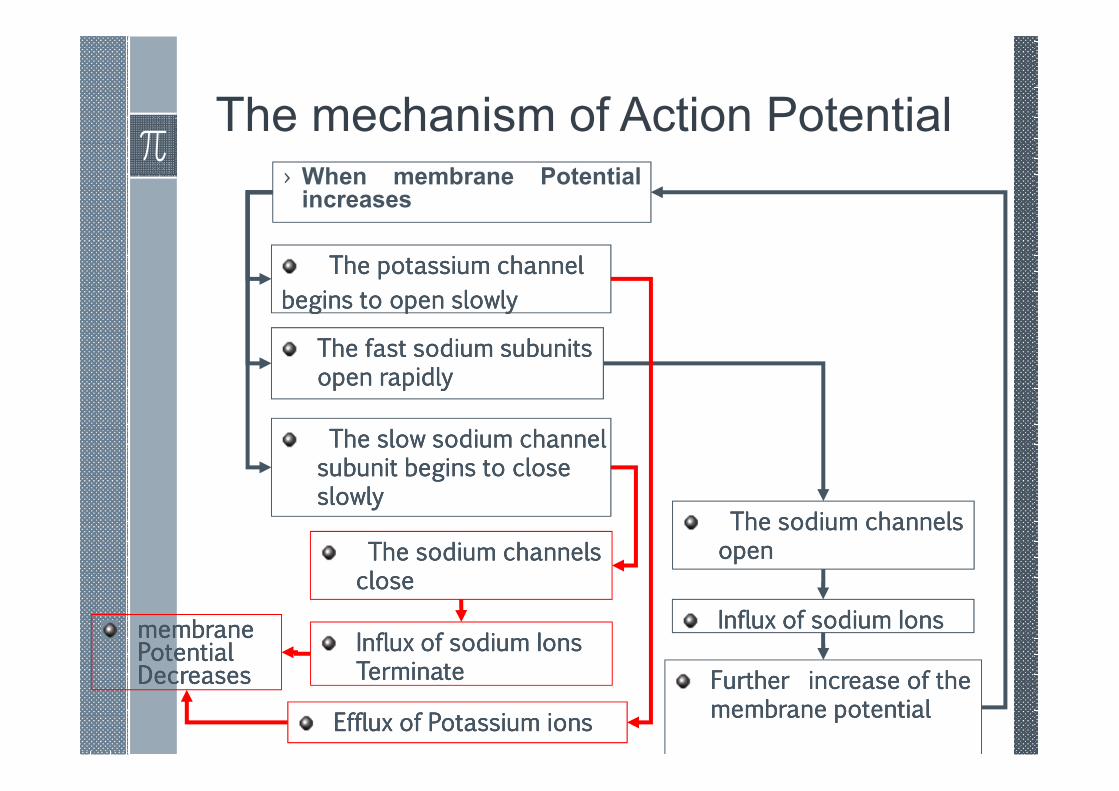
The mechanism of Action Potential› When membrane Potentialincreases
The fast sodium subunits The fast sodium subunits The fast sodium subunits The fast sodium subunits open rapidlyopen rapidlyopen rapidlyopen rapidly
The slow sodium channel The slow sodium channel The slow sodium channel The slow sodium channel subunit begins to close subunit begins to close subunit begins to close subunit begins to close slowlyslowlyslowlyslowly
The potassium channel The potassium channel The potassium channel The potassium channel
begins to open slowlybegins to open slowlybegins to open slowlybegins to open slowly
The sodium channels The sodium channels The sodium channels The sodium channels openopenopenopen
Influx of sodium IonsInflux of sodium IonsInflux of sodium IonsInflux of sodium Ions
Further increase of the Further increase of the Further increase of the Further increase of the membrane potentialmembrane potentialmembrane potentialmembrane potential
The sodium channels The sodium channels The sodium channels The sodium channels closeclosecloseclose
Influx of sodium Ions Influx of sodium Ions Influx of sodium Ions Influx of sodium Ions TerminateTerminateTerminateTerminate
Efflux of Potassium ionsEfflux of Potassium ionsEfflux of Potassium ionsEfflux of Potassium ions
membrane membrane membrane membrane Potential Potential Potential Potential Decreases Decreases Decreases Decreases
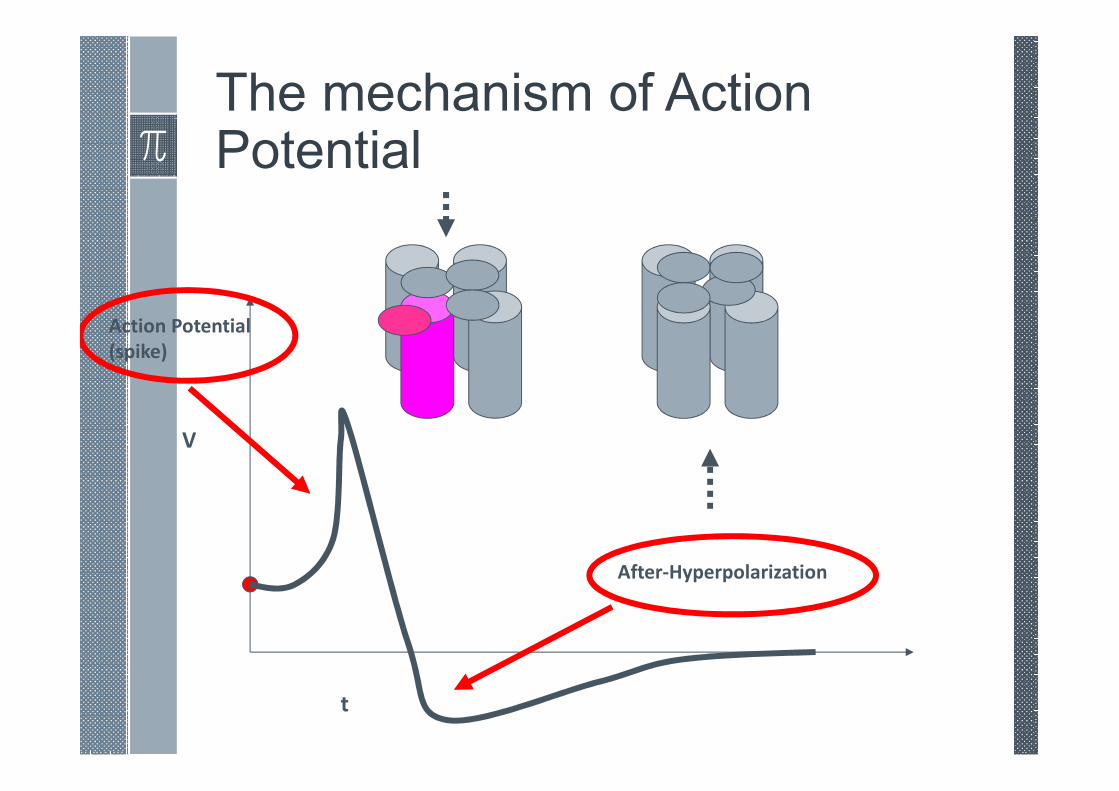
The mechanism of Action Potential
V
t
Action Potential
(spike)
After-Hyperpolarization
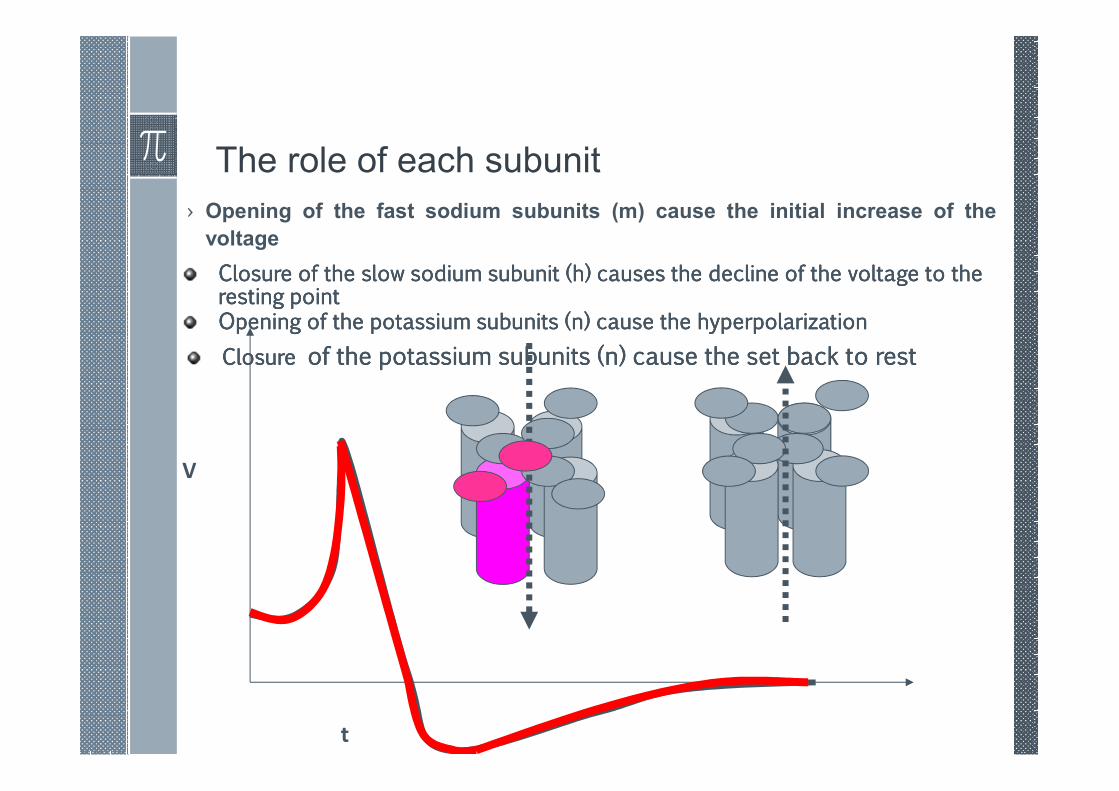
The role of each subunit
› Opening of the fast sodium subunits (m) cause the initial increase of the
voltage
V
t
Closure of the slow sodium subunit (h) causes the decline of the voltage to the Closure of the slow sodium subunit (h) causes the decline of the voltage to the Closure of the slow sodium subunit (h) causes the decline of the voltage to the Closure of the slow sodium subunit (h) causes the decline of the voltage to the resting pointresting pointresting pointresting pointOpening of the potassium subunits (n) cause the hyperpolarizationOpening of the potassium subunits (n) cause the hyperpolarizationOpening of the potassium subunits (n) cause the hyperpolarizationOpening of the potassium subunits (n) cause the hyperpolarization
ClosureClosureClosureClosure of the potassium subunits (n) cause the set back to restof the potassium subunits (n) cause the set back to restof the potassium subunits (n) cause the set back to restof the potassium subunits (n) cause the set back to rest
Question
• Action Potential Generation has a voltage threshold: If themembrane voltage increases more than the threshold, an actionpotential will be initiated; otherwise the membrane voltage setsback quickly to the resting potential.
• Now a question should be ask:
Is it always true?
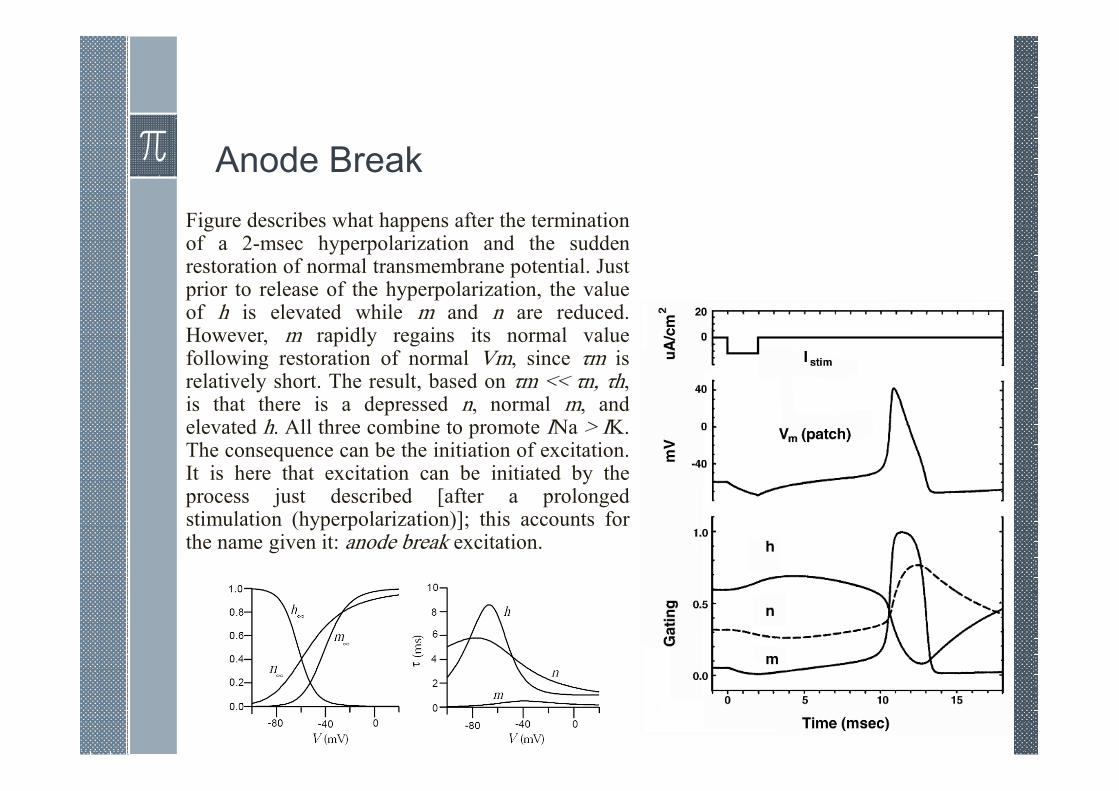
Anode Break
Figure describes what happens after the terminationof a 2-msec hyperpolarization and the suddenrestoration of normal transmembrane potential. Justprior to release of the hyperpolarization, the valueof h is elevated while m and n are reduced.However, m rapidly regains its normal valuefollowing restoration of normal Vm, since τm isrelatively short. The result, based on τm << τn, τh,is that there is a depressed n, normal m, andelevated h. All three combine to promote INa > IK.The consequence can be the initiation of excitation.It is here that excitation can be initiated by theprocess just described [after a prolongedstimulation (hyperpolarization)]; this accounts forthe name given it: anode break excitation.
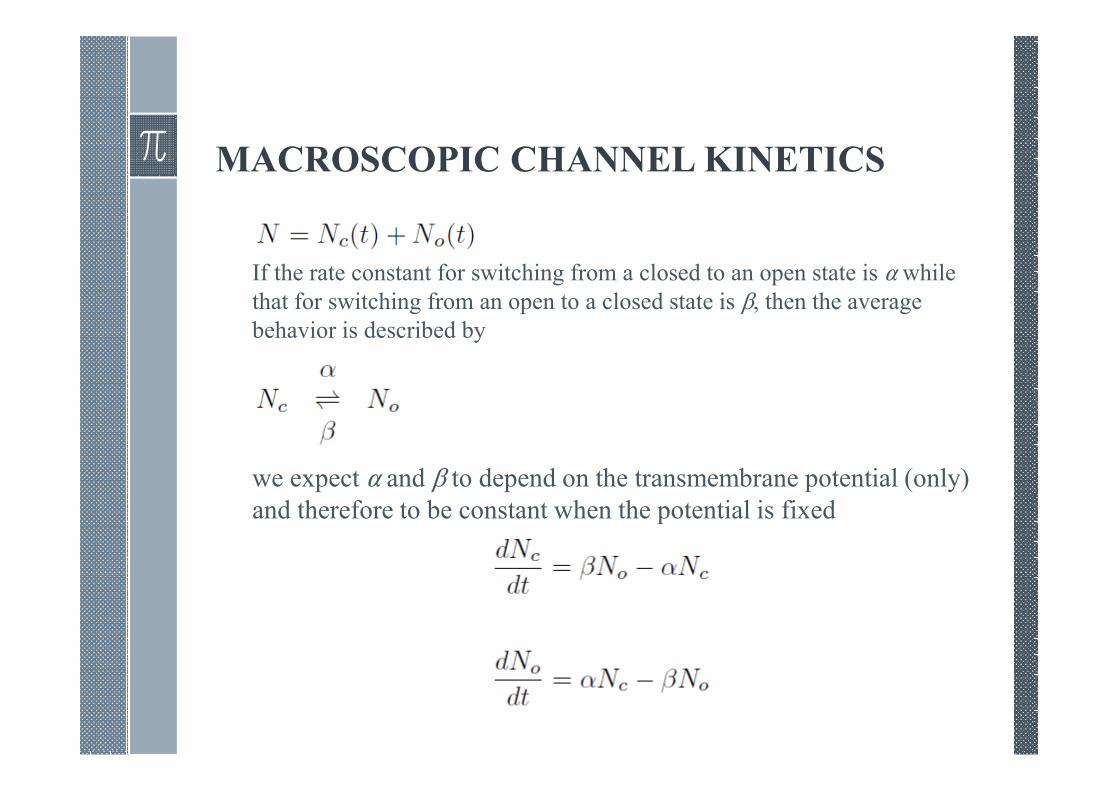
MACROSCOPIC CHANNEL KINETICS
If the rate constant for switching from a closed to an open state is α while
that for switching from an open to a closed state is β, then the average
behavior is described by
we expect α and β to depend on the transmembrane potential (only)
and therefore to be constant when the potential is fixed
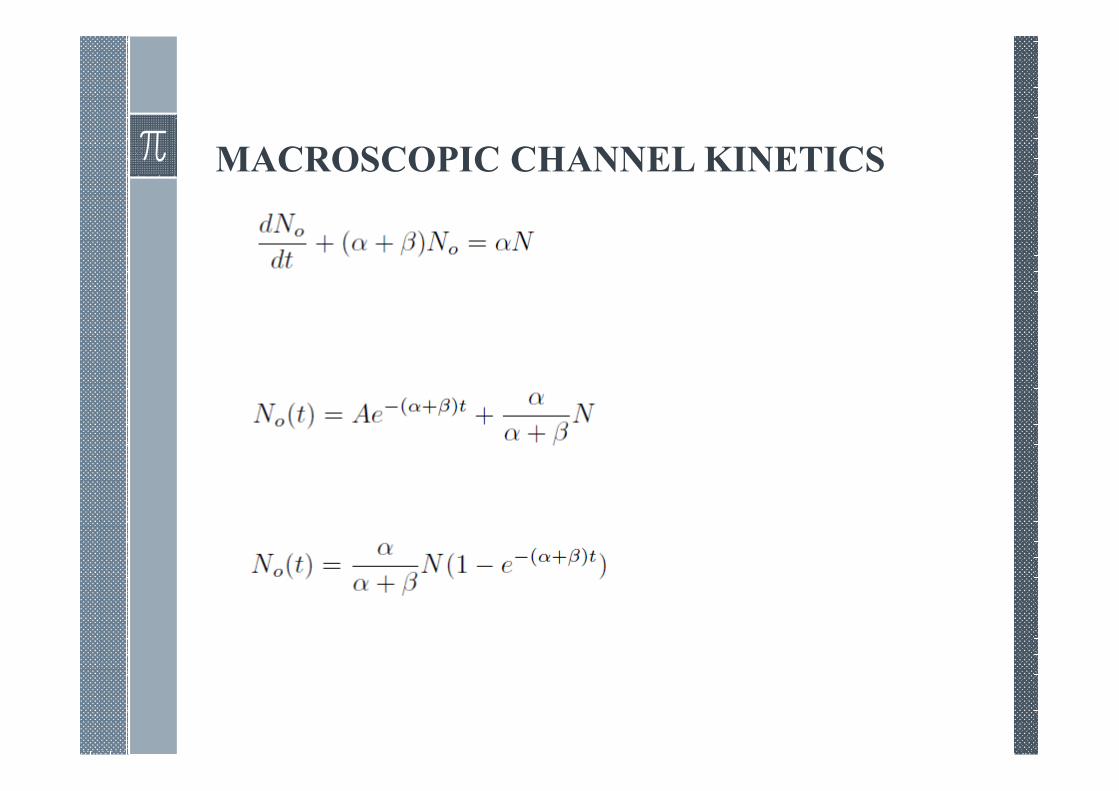
MACROSCOPIC CHANNEL KINETICS
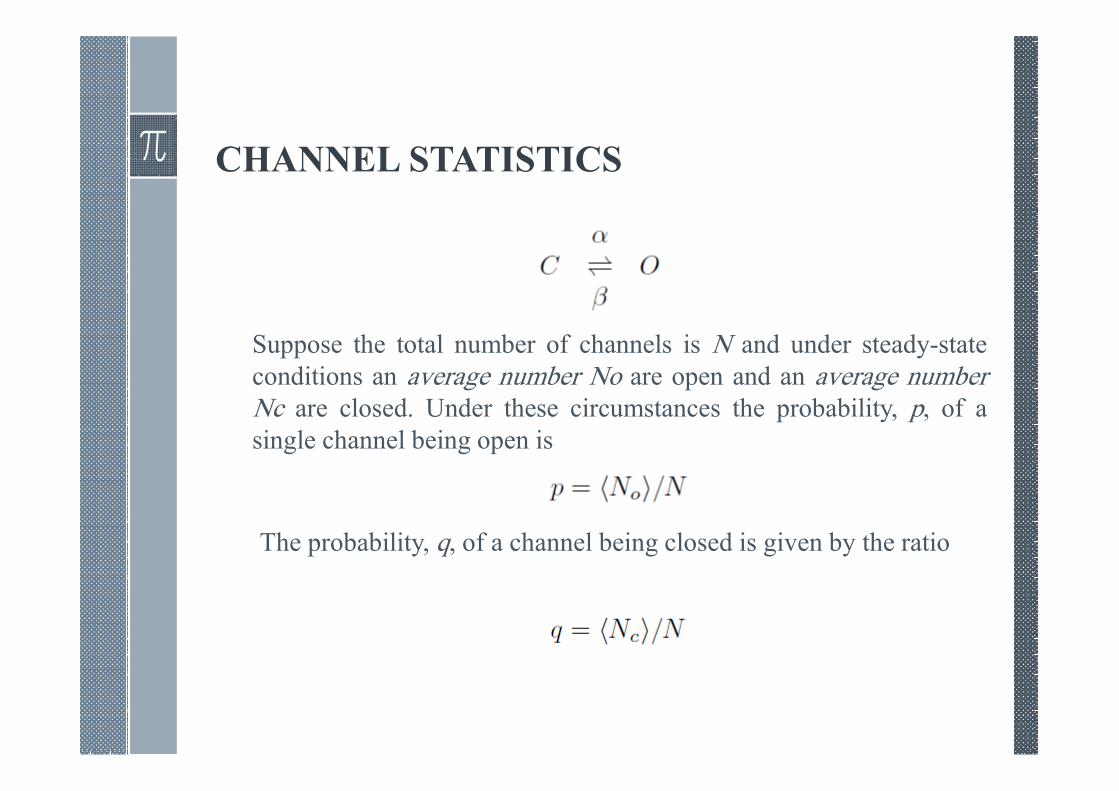
CHANNEL STATISTICS
Suppose the total number of channels is N and under steady-state
conditions an average number No are open and an average numberNc are closed. Under these circumstances the probability, p, of a
single channel being open is
The probability, q, of a channel being closed is given by the ratio
CHANNEL STATISTICS
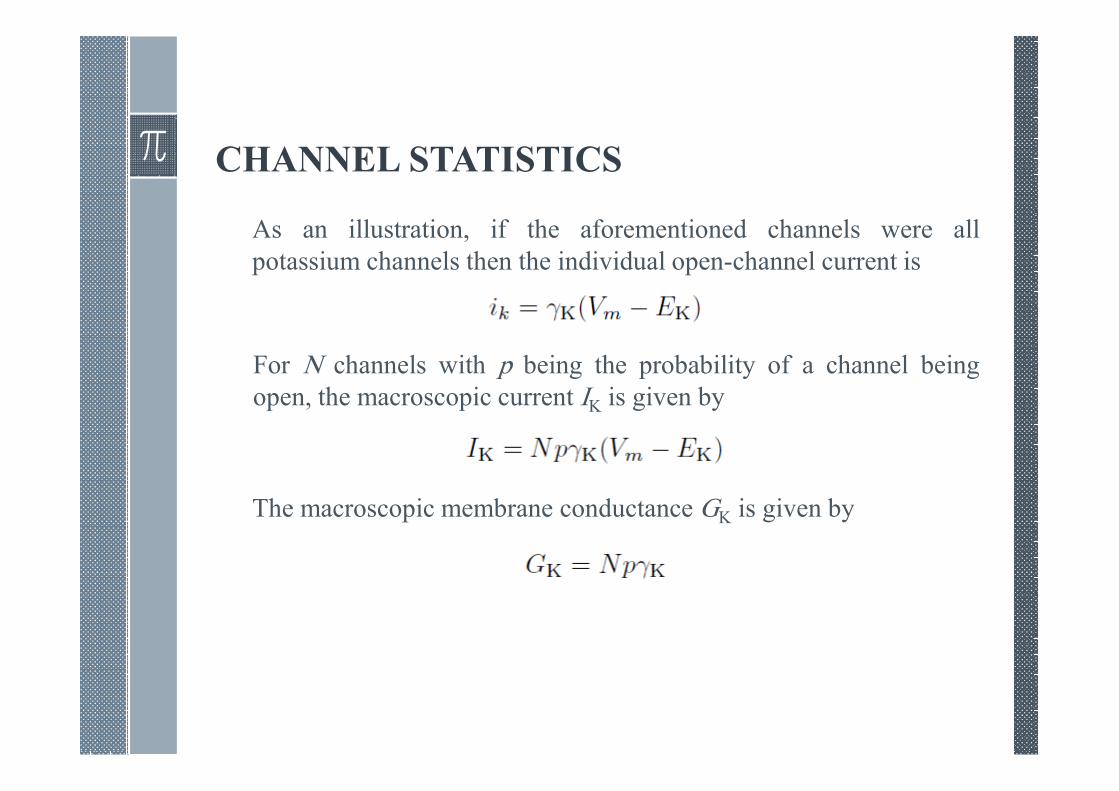
As an illustration, if the aforementioned channels were all
potassium channels then the individual open-channel current is
For N channels with p being the probability of a channel being
open, the macroscopic current IK is given by
The macroscopic membrane conductance GK is given by
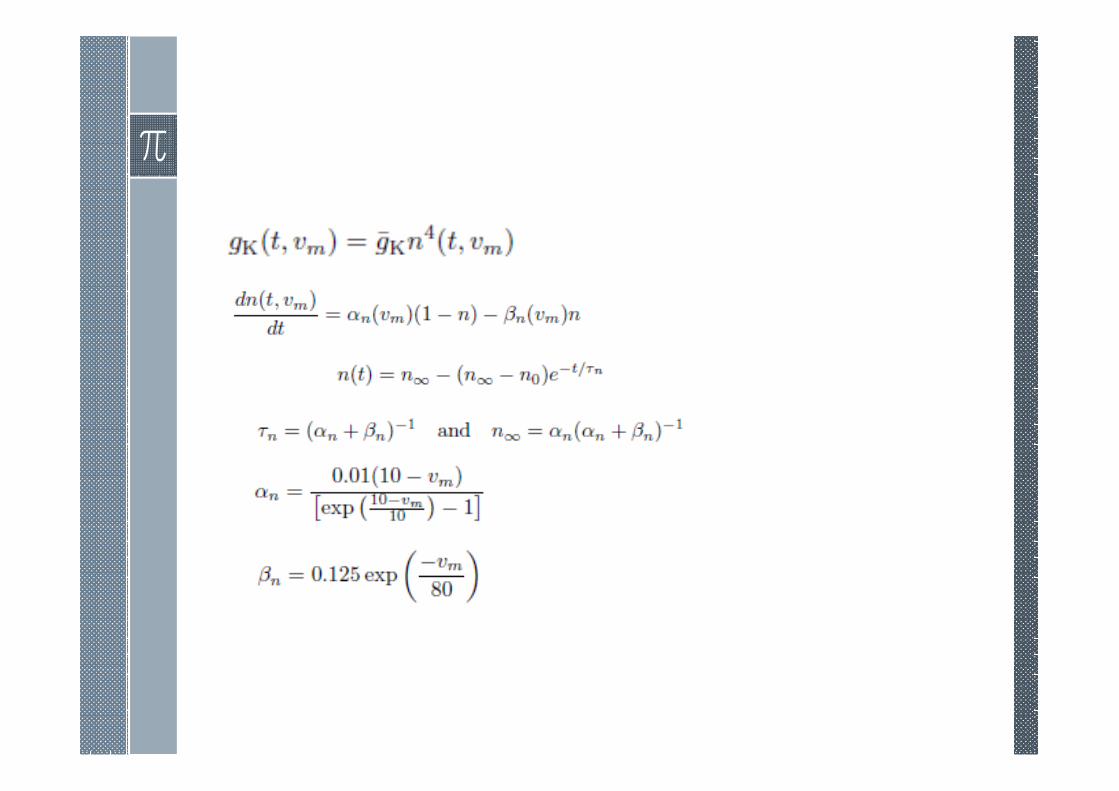
THE HODGKIN–HUXLEY MEMBRANE MODEL
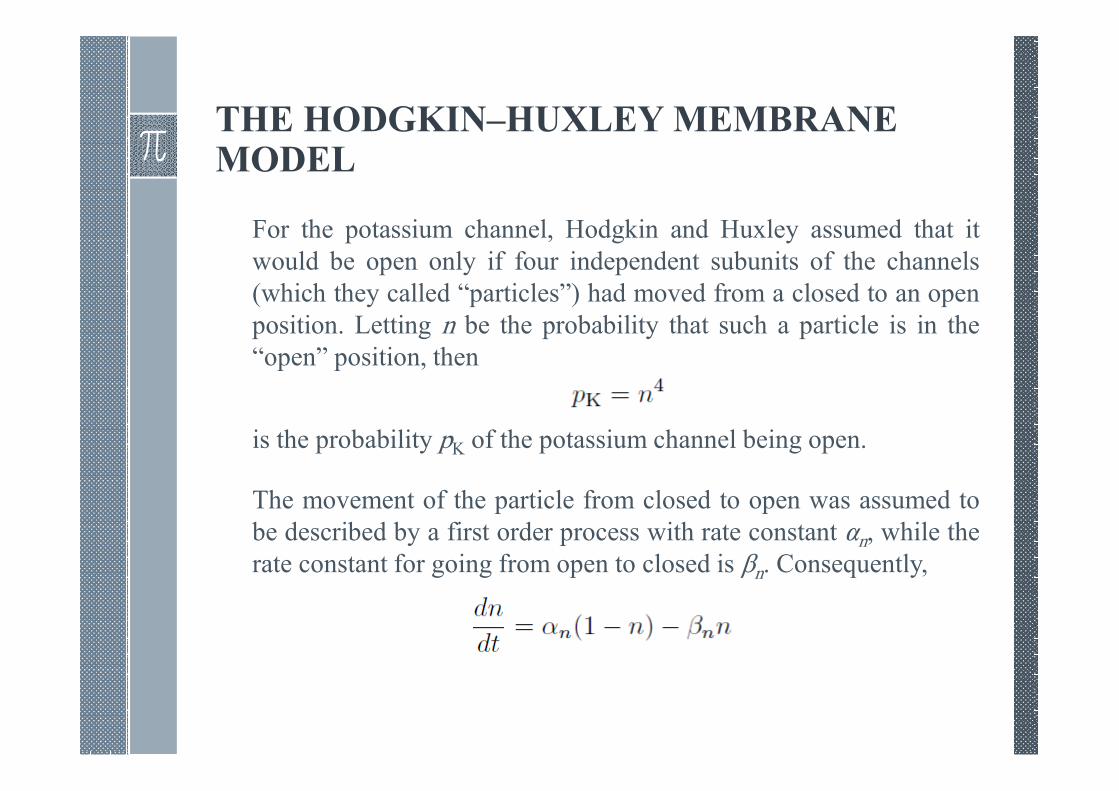
For the potassium channel, Hodgkin and Huxley assumed that it
would be open only if four independent subunits of the channels
(which they called “particles”) had moved from a closed to an open
position. Letting n be the probability that such a particle is in the
“open” position, then
is the probability pK of the potassium channel being open.
The movement of the particle from closed to open was assumed to
be described by a first order process with rate constant αn, while the
rate constant for going from open to closed is βn. Consequently,
THE HODGKIN–HUXLEY MEMBRANE MODEL
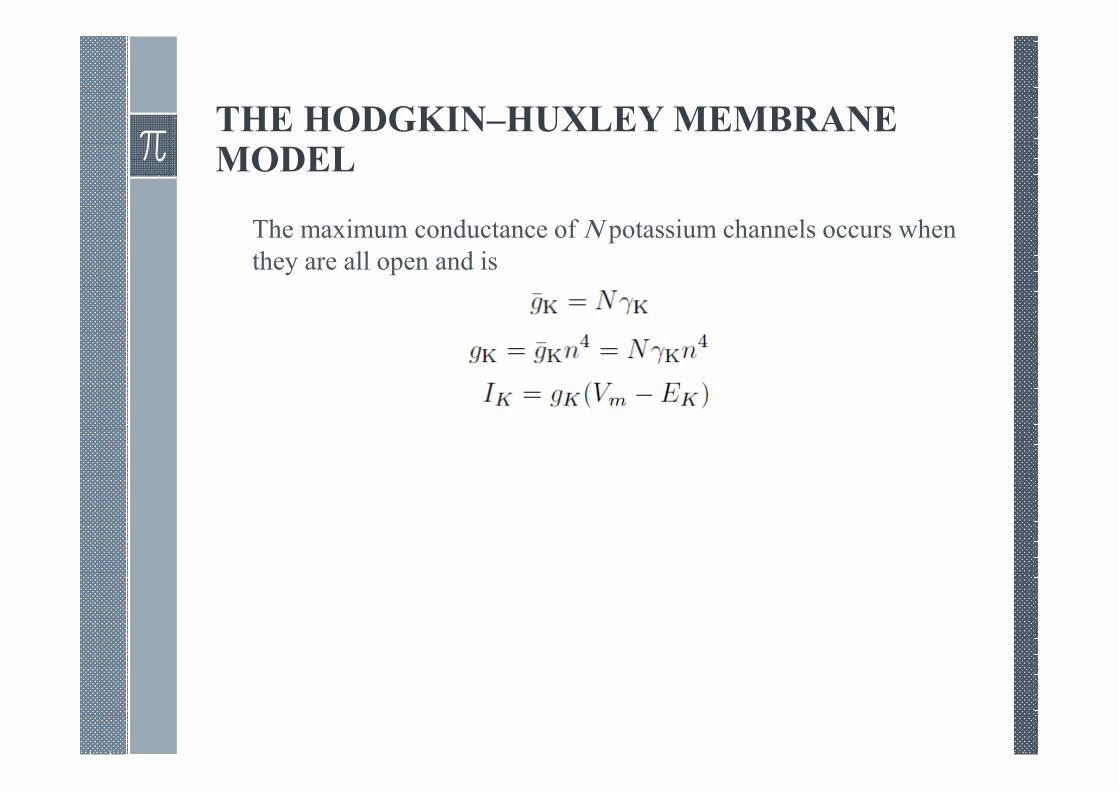
The maximum conductance of N potassium channels occurs when
they are all open and is
THE HODGKIN–HUXLEY MEMBRANE MODEL
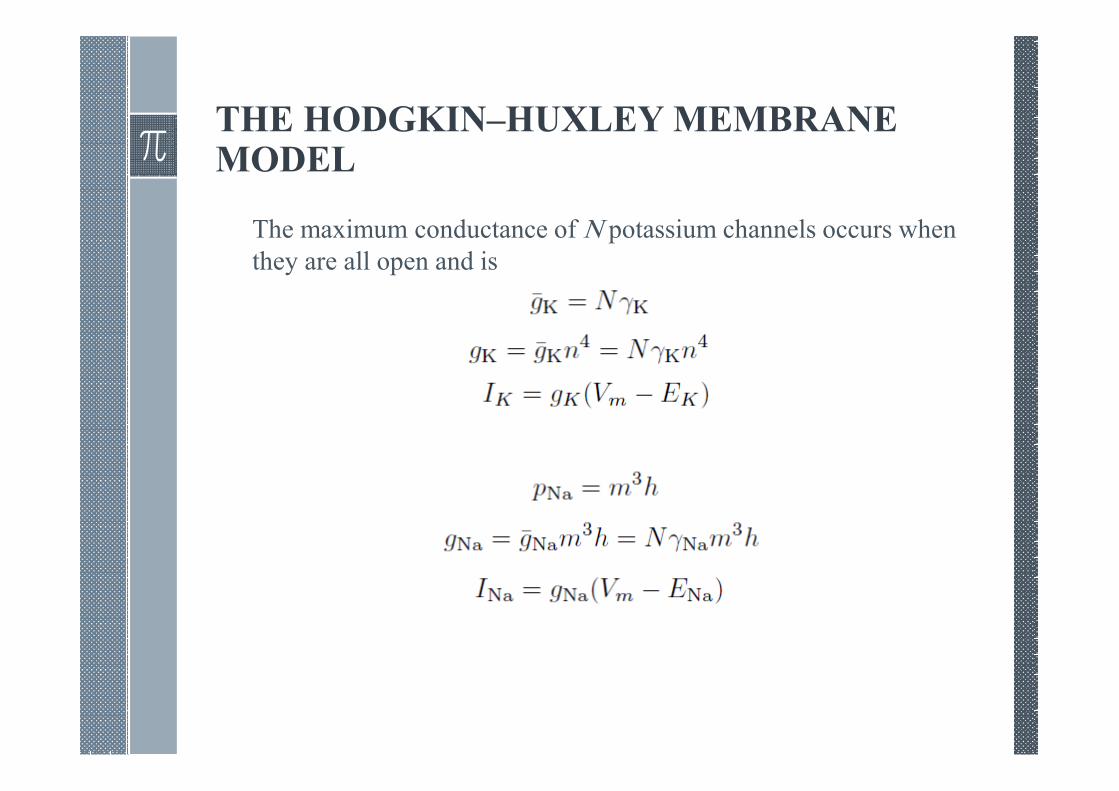
The maximum conductance of N potassium channels occurs when
they are all open and is
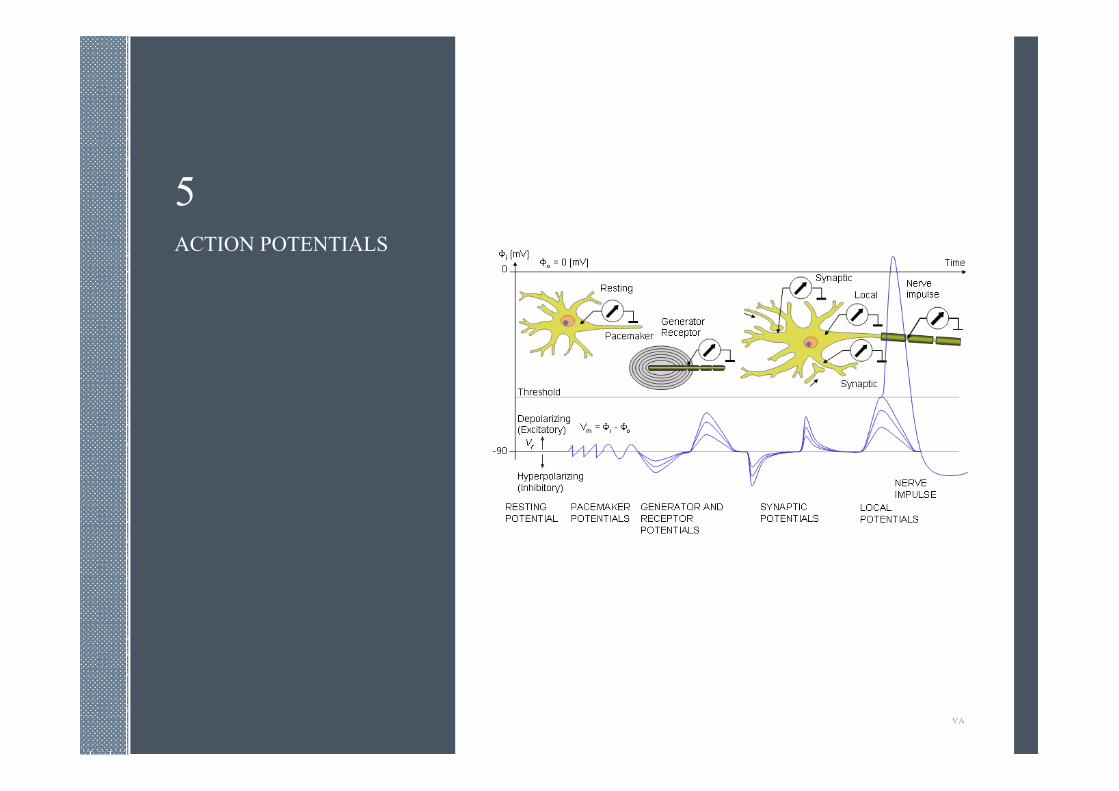
5ACTION POTENTIALS
٧٨
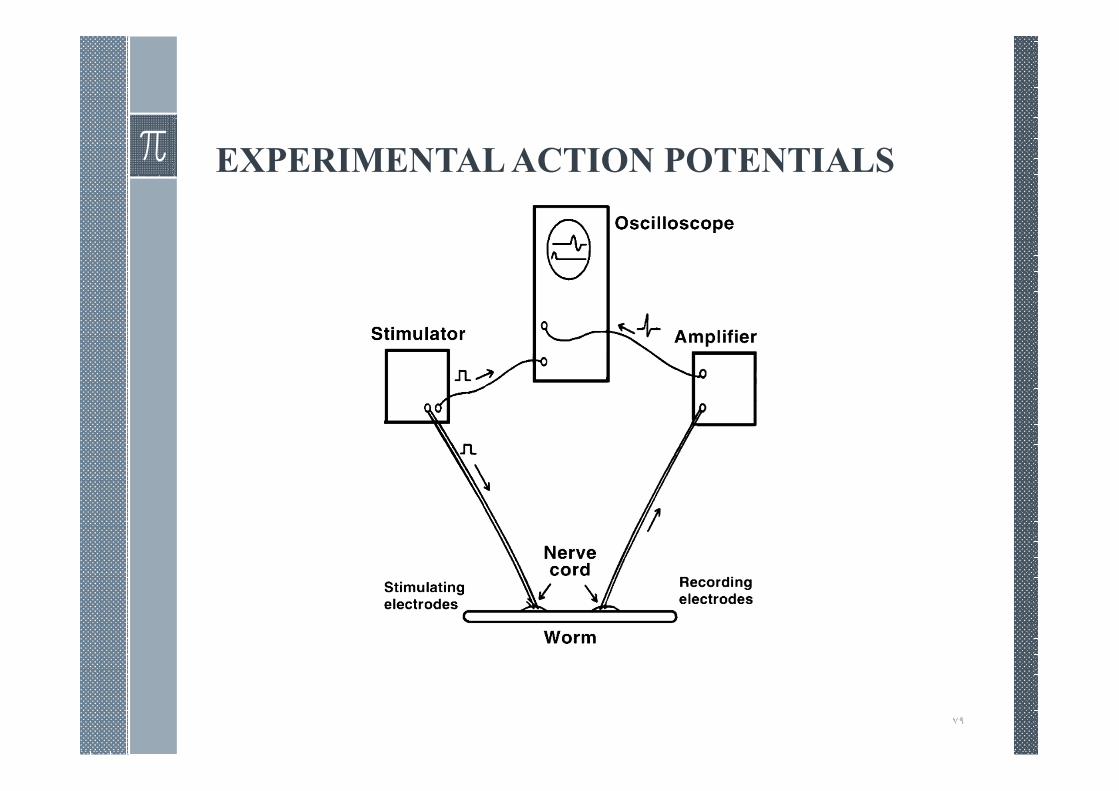
EXPERIMENTAL ACTION POTENTIALS
٧٩
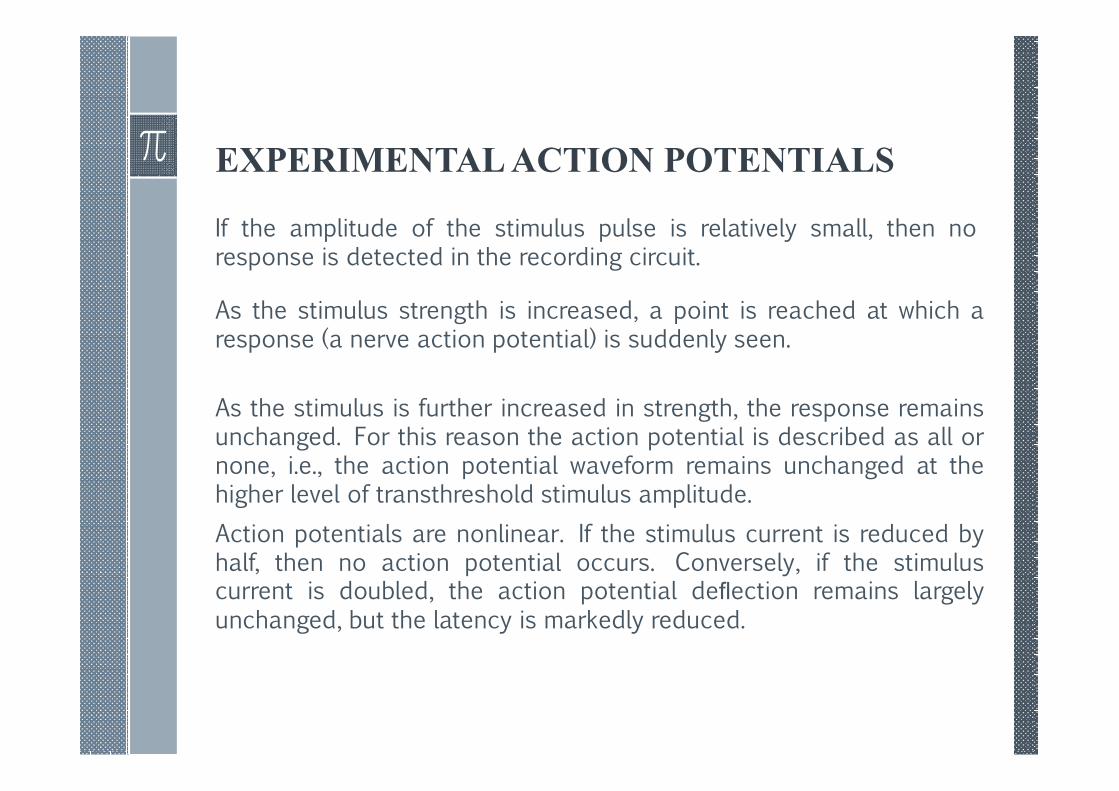
EXPERIMENTAL ACTION POTENTIALS
If the amplitude of the stimulus pulse is relatively small, then noresponse is detected in the recording circuit.
As the stimulus strength is increased, a point is reached at which aresponse (a nerve action potential) is suddenly seen.
As the stimulus is further increased in strength, the response remainsunchanged. For this reason the action potential is described as all ornone, i.e., the action potential waveform remains unchanged at thehigher level of transthreshold stimulus amplitude.
Action potentials are nonlinear. If the stimulus current is reduced byhalf, then no action potential occurs. Conversely, if the stimuluscurrent is doubled, the action potential deflection remains largelyunchanged, but the latency is markedly reduced.
Noteworthy AP Attributes
Action potentials have a number of noteworthy characteristics. These unusual characteristics include thresholding, differential response by diameter, and latency, as described in the following.
Threshold responseThreshold responseThreshold responseThreshold response
Fiber diameterFiber diameterFiber diameterFiber diameter
Threshold due to an external stimulating source is lower in a large fiber, roughly inversely proportional to the square root of the fiber diameter.
LatencyLatencyLatencyLatency
The latency until the appearance of an action potential for either fiber as a function of separation between stimulating and recording electrodes, if examined, would show a linear dependency, confirming the assertion of uniformity of propagation. The velocity of propagation within each fiber is proportional to the square root of its diameter.
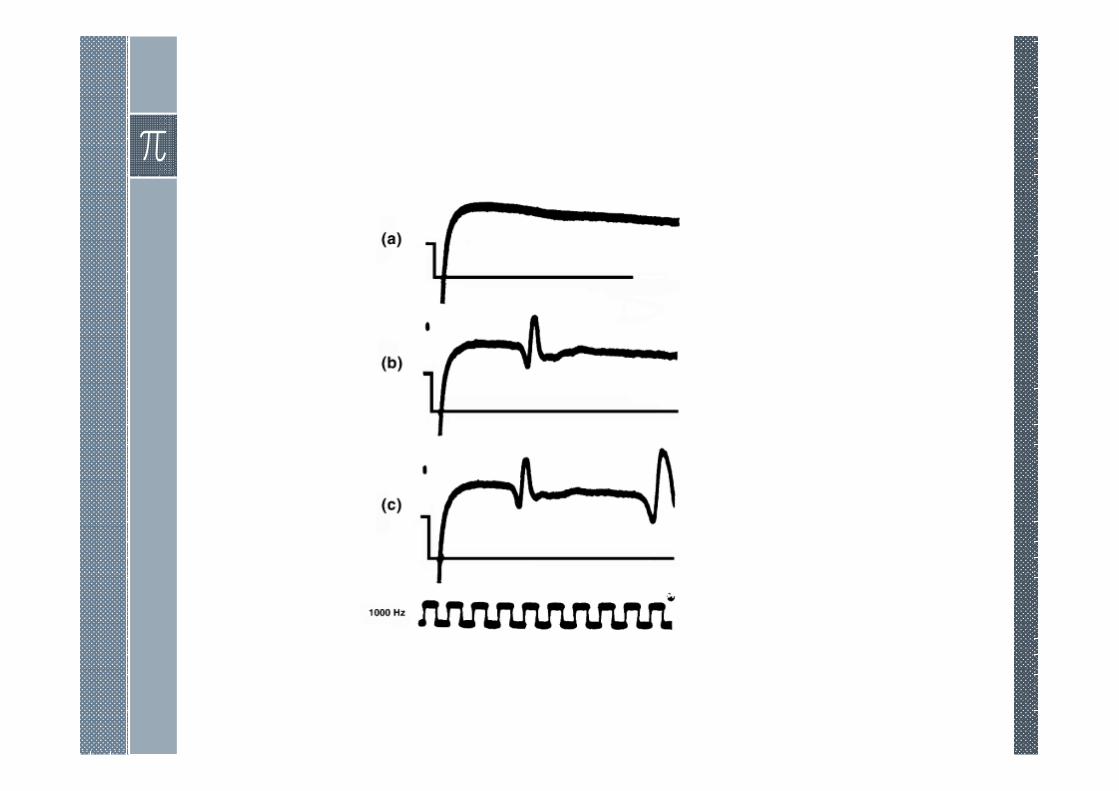
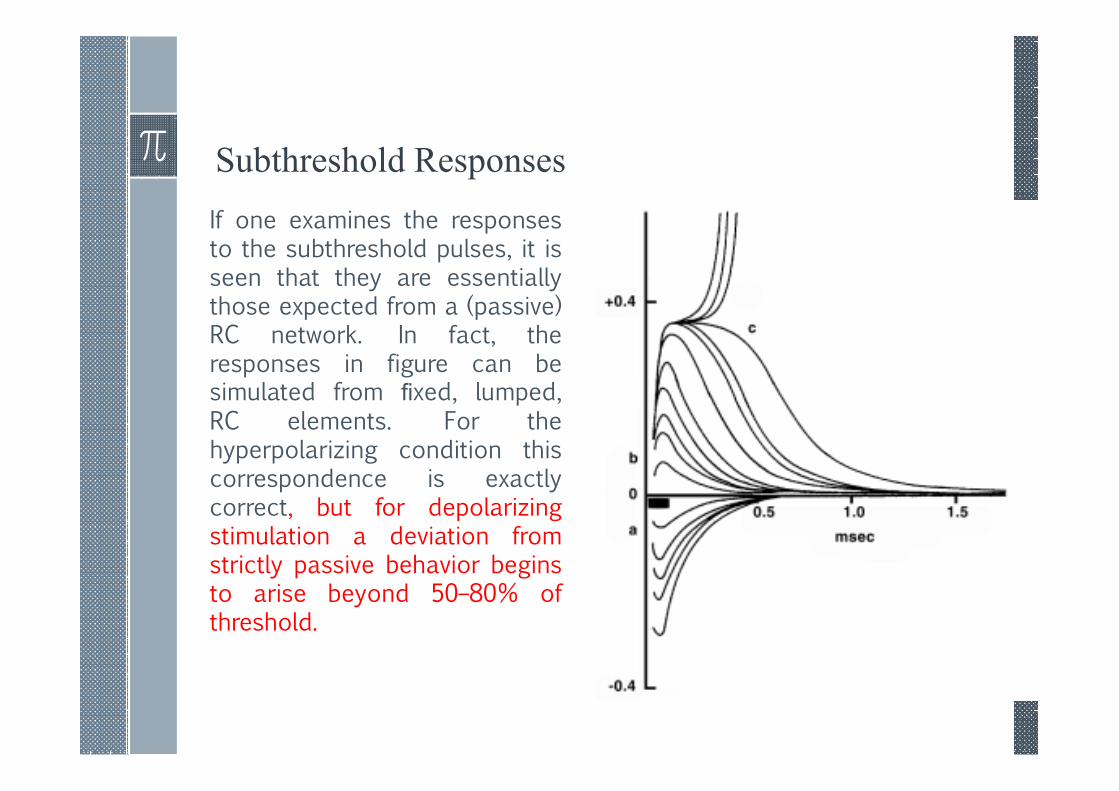
Subthreshold Responses
If one examines the responsesto the subthreshold pulses, it isseen that they are essentiallythose expected from a (passive)RC network. In fact, theresponses in figure can besimulated from fixed, lumped,RC elements. For thehyperpolarizing condition thiscorrespondence is exactlycorrect, but for depolarizingstimulation a deviation fromstrictly passive behavior beginsto arise beyond 50–80% ofthreshold.
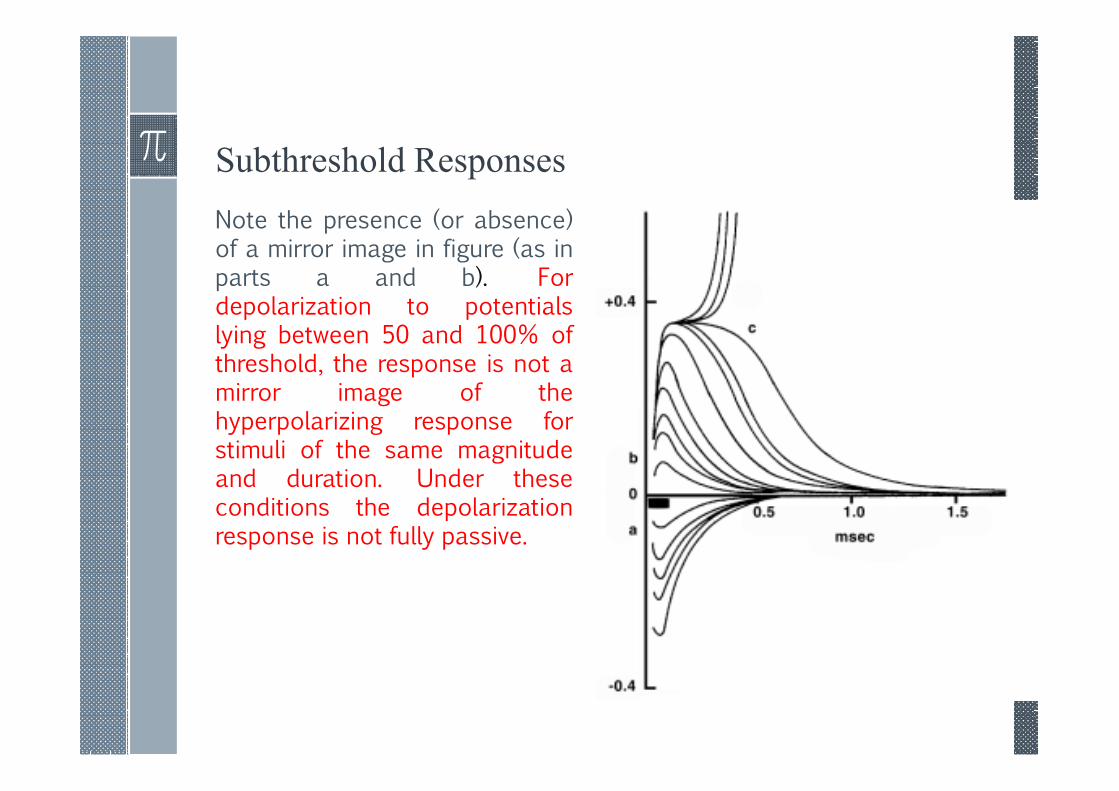
Subthreshold Responses
Note the presence (or absence)of a mirror image in figure (as inparts a and b). Fordepolarization to potentialslying between 50 and 100% ofthreshold, the response is not amirror image of thehyperpolarizing response forstimuli of the same magnitudeand duration. Under theseconditions the depolarizationresponse is not fully passive.
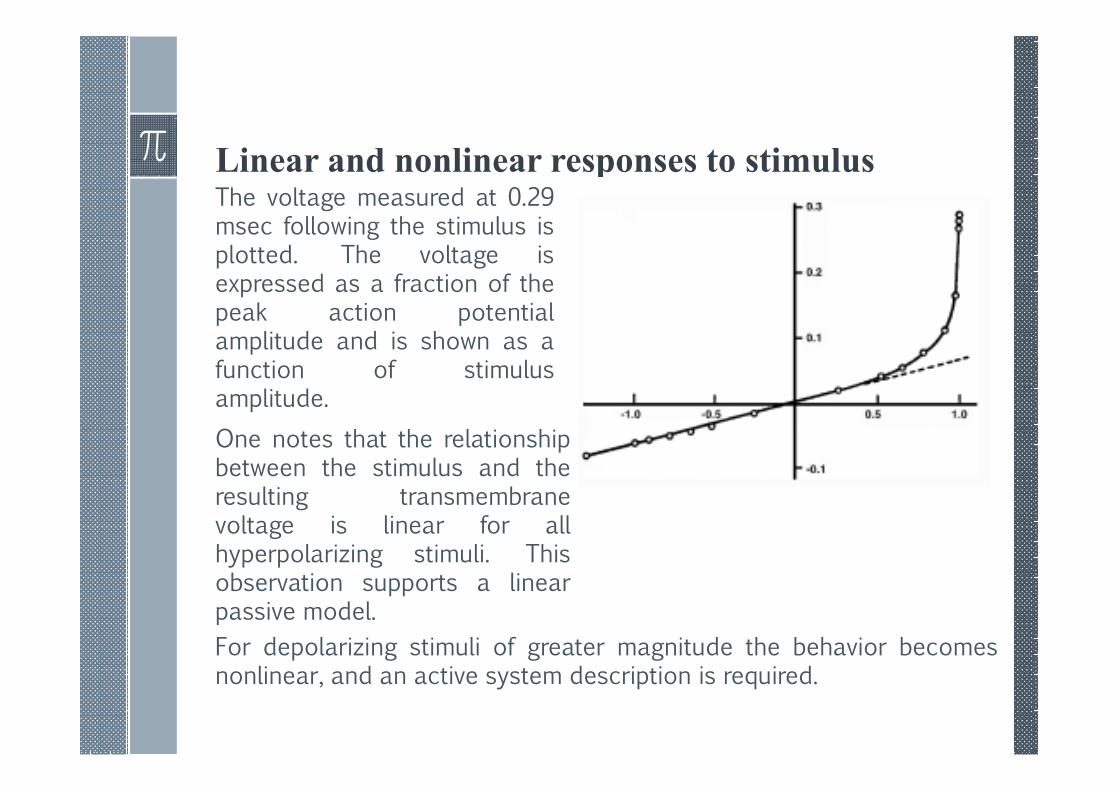
Linear and nonlinear responses to stimulusThe voltage measured at 0.29msec following the stimulus isplotted. The voltage isexpressed as a fraction of thepeak action potentialamplitude and is shown as afunction of stimulusamplitude.
One notes that the relationshipbetween the stimulus and theresulting transmembranevoltage is linear for allhyperpolarizing stimuli. Thisobservation supports a linearpassive model.
For depolarizing stimuli of greater magnitude the behavior becomesnonlinear, and an active system description is required.
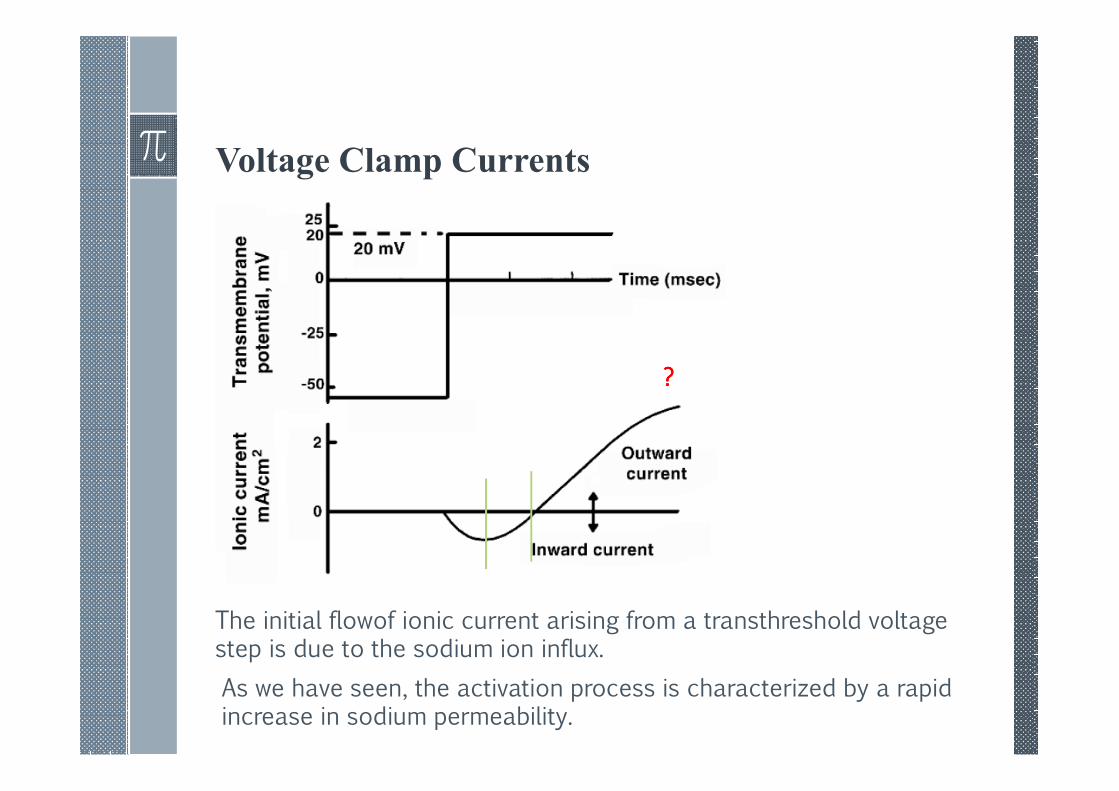
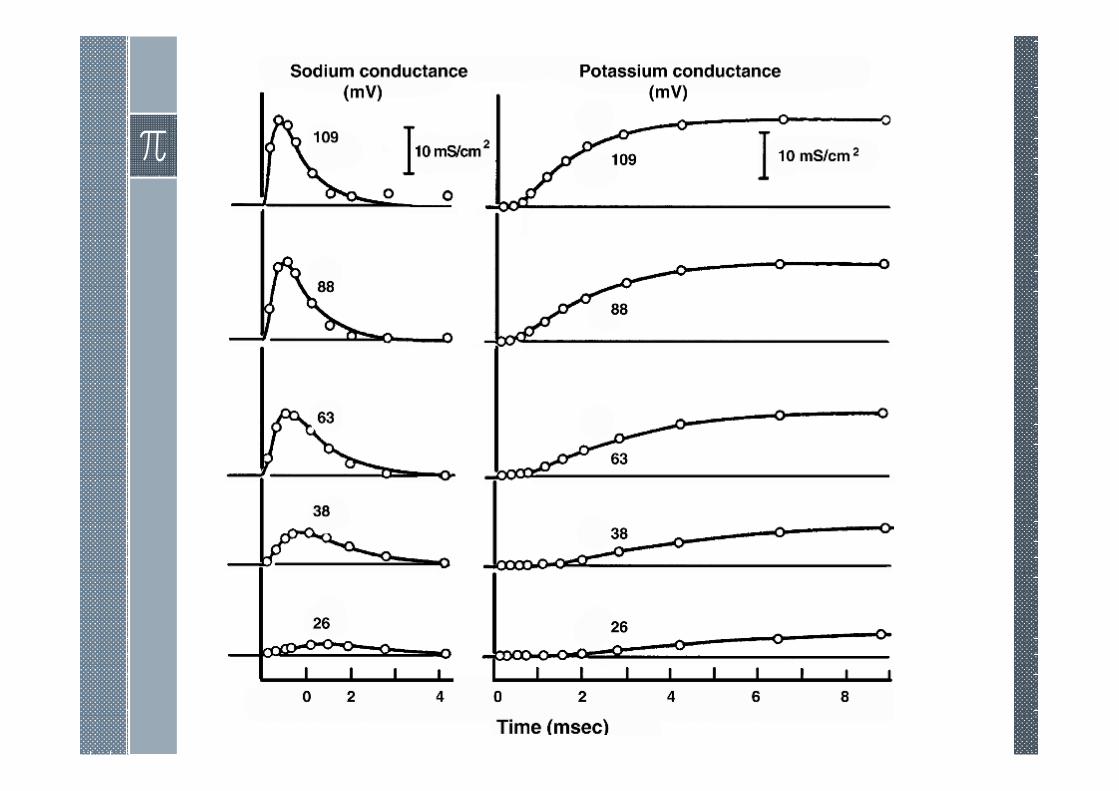
Voltage Clamp Currents
The initial flowof ionic current arising from a transthreshold voltage step is due to the sodium ion influx.
As we have seen, the activation process is characterized by a rapid increase in sodium permeability.
????
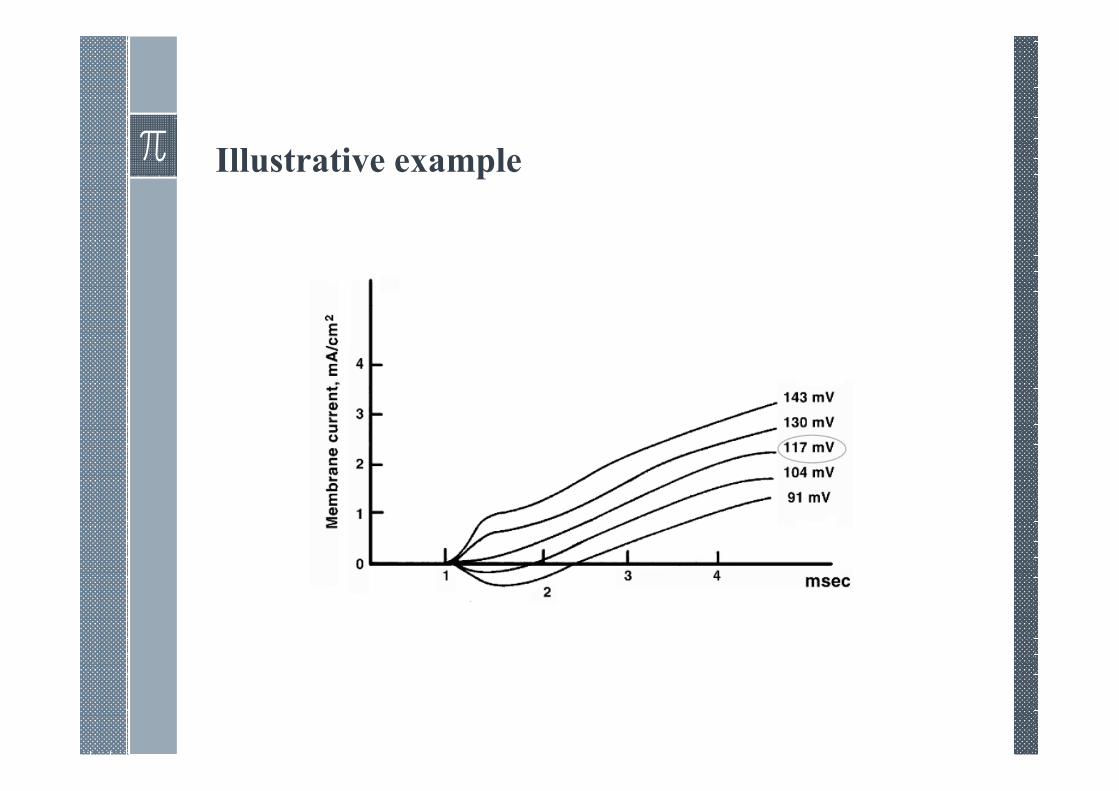
Illustrative example
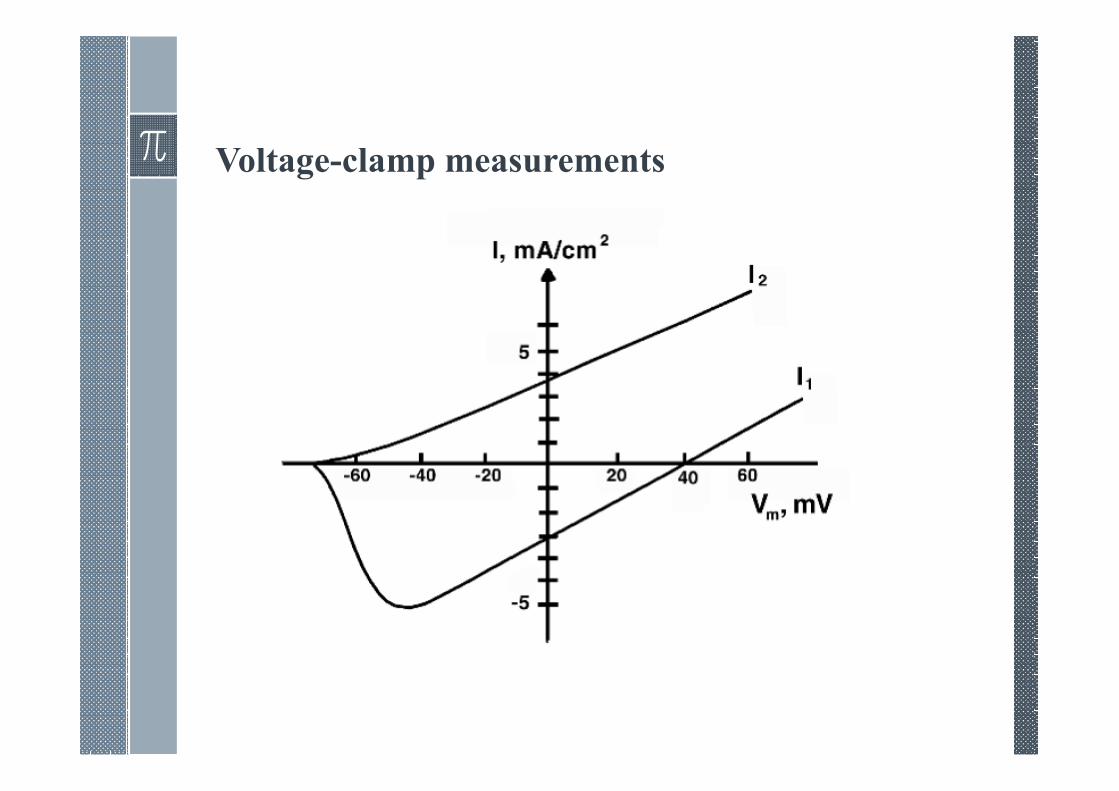
Voltage-clamp measurements
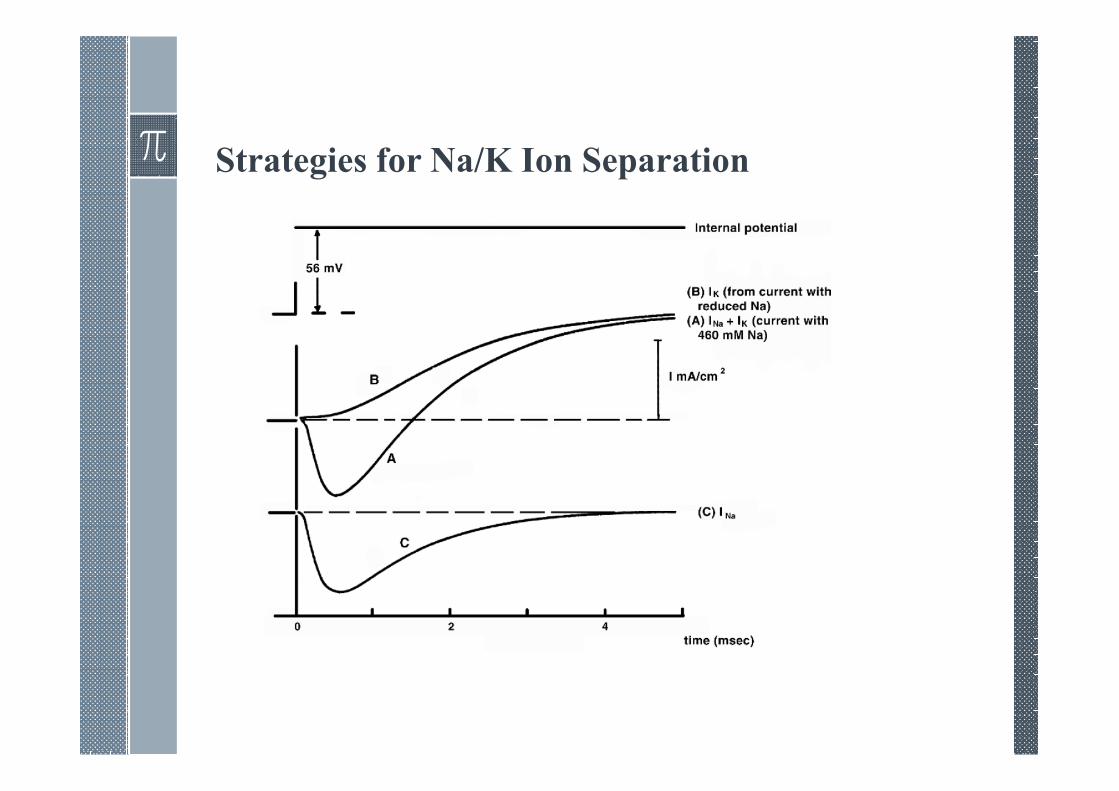
Strategies for Na/K Ion Separation
› A separation of the sodium and potassium currents is necessaryin order to model the behavior of each ionic component alone.
› Hodgkin and Huxley performed a series of voltage-clampexperiments for increasingly depolarizing values. For each valueof clamp voltage two experiments were performed.
› The first was for normal composition seawater and the secondwith a low-sodium seawater (replace 90% sodium chloride bycholine chloride while potassium and remaining chloride ionsare unchanged).
٨٩
Key assumptions
› The Hodgkin and Huxley ion separation procedure is based onthree assumptions:
1. Early current is sodium current alone.
2. Outside Na affects .
3. Ionic Independence.
٩٠
Strategies for Na/K Ion Separation
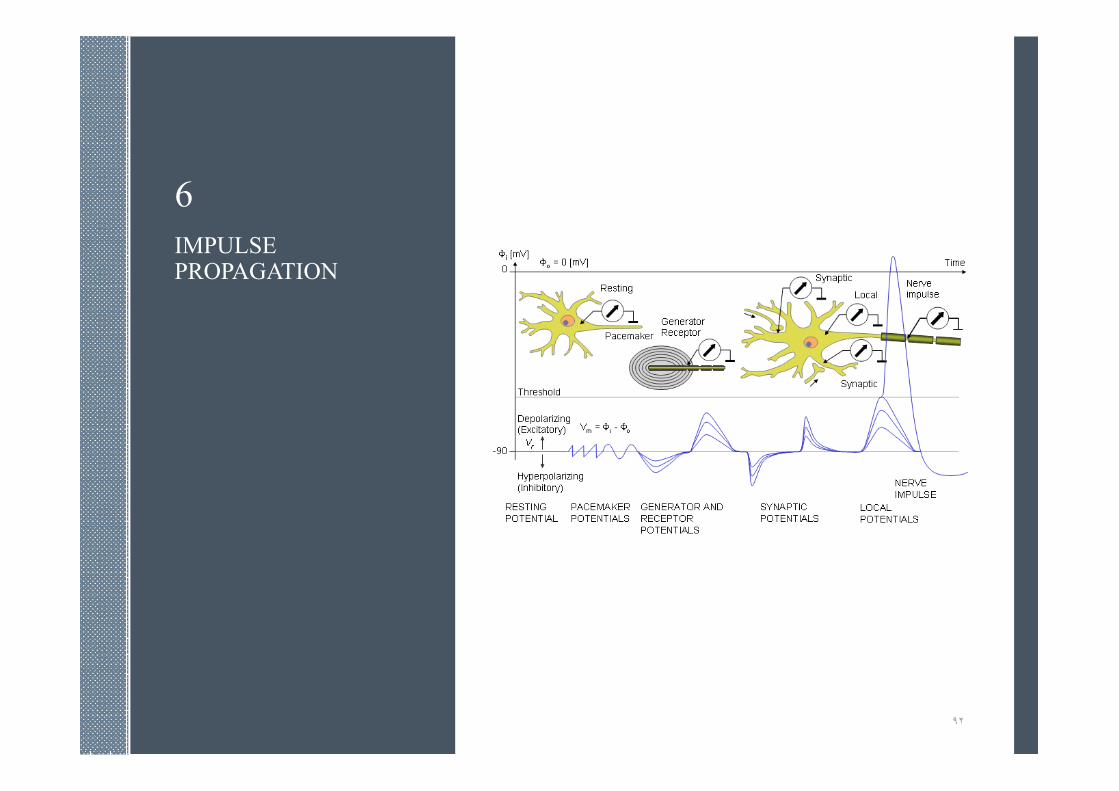
6
IMPULSE PROPAGATION
٩٢
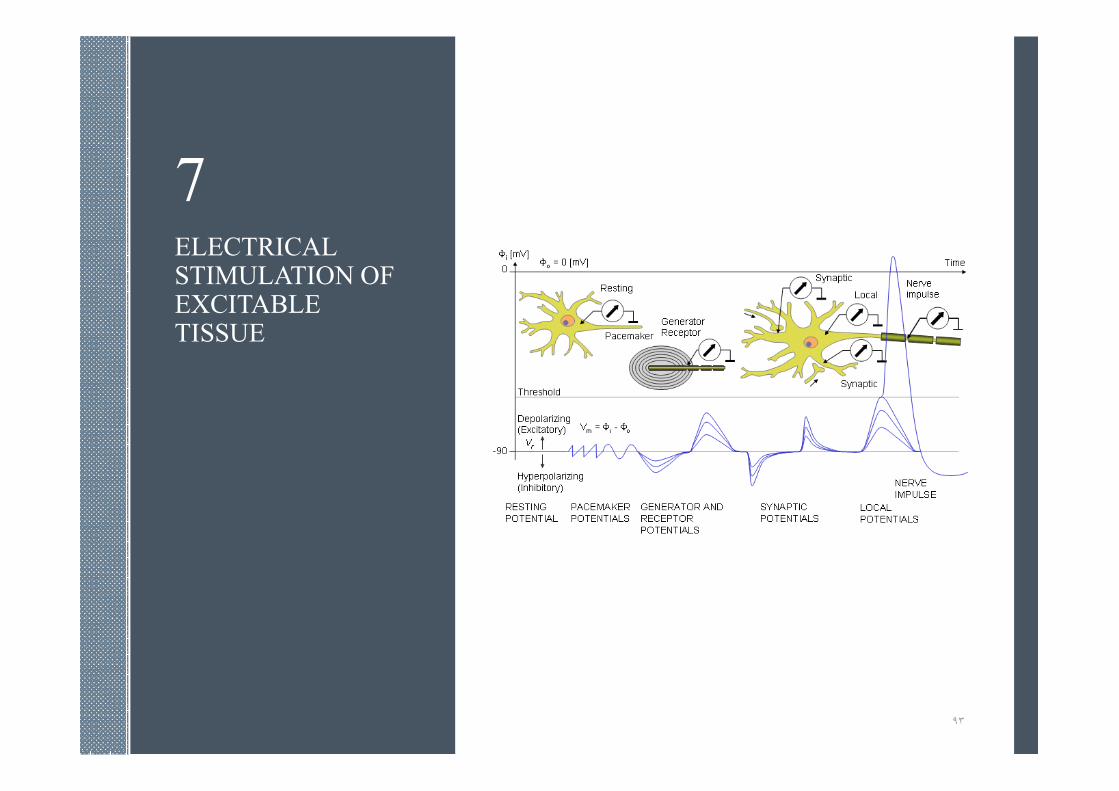
7ELECTRICAL STIMULATION OF EXCITABLE TISSUE
٩٣
INTRODUCTION
In designing systems for stimulation, a qualitative understandingtogether with mathematical descriptions of responses tostimulation are essential. The response of excitable cells tonaturally occurring or artificial stimuli is a subject of greatimportance in understanding natural function of nerve and muscle,because most stimuli are produced by the natural system itself.Both electric and magnetic field stimulation are used in researchinvestigations and in clinical diagnosis, therapy, and rehabilitation.This section focuses primarily on responses to electrical stimuli,which are more frequent, and examines several biologicalpreparations.
٩۴
INTRODUCTION
Analysis of stimuli focuses especially on mathematicalrelationships between the current applied as the stimulus and theresulting transmembrane potentials. Such knowledge, whenquantitative, then allows one to draw quantitative conclusionsabout the strength and duration of stimuli that will result intransmembrane potentials above the threshold level in new orfuture situations, as well as those already explored experimentally.
٩۵
INTRODUCTION
› The initial part of this section provide the simple mathematicsgiving the transmembrane voltages produced by a constantcurrent stimulus, in a spherical cell. These current–voltageequations then are manipulated to produce strength–durationcurves. A few real cells can be idealized as spherical, and theidealization is useful and interesting because, in a spherical cell,the response to stimulus depends only on time.
٩۶
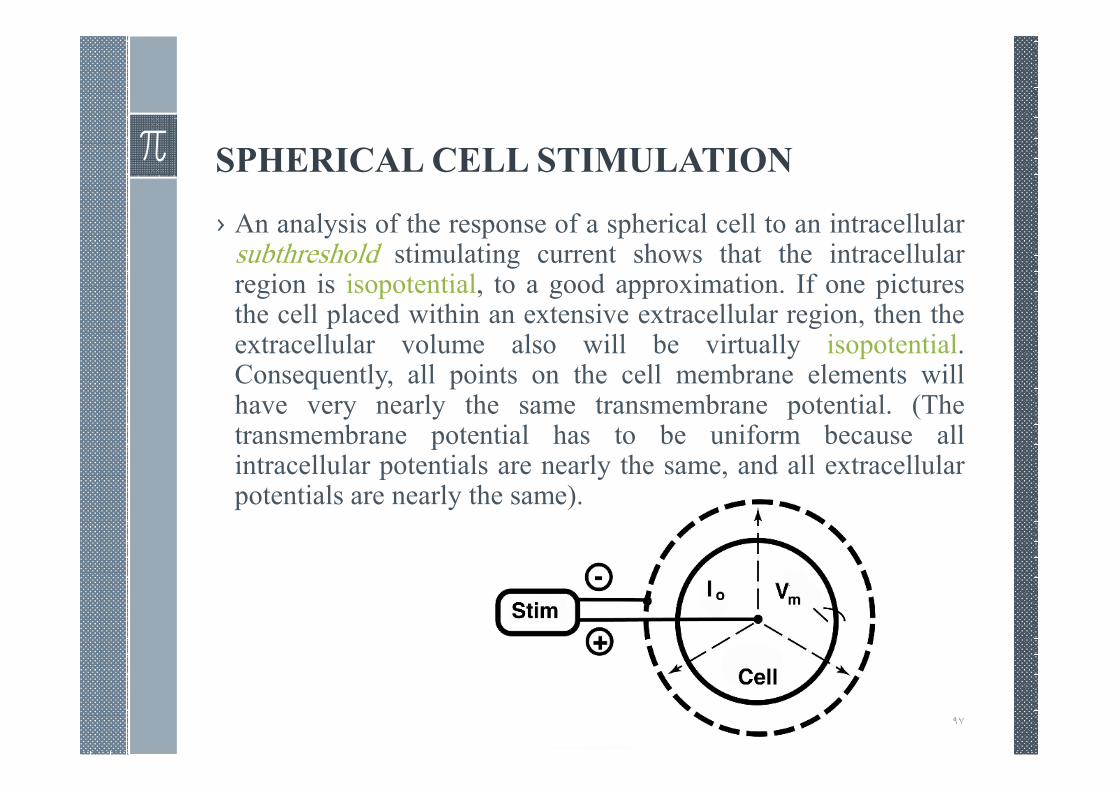
SPHERICAL CELL STIMULATION
› An analysis of the response of a spherical cell to an intracellularsubthreshold stimulating current shows that the intracellularregion is isopotential, to a good approximation. If one picturesthe cell placed within an extensive extracellular region, then theextracellular volume also will be virtually isopotential.Consequently, all points on the cell membrane elements willhave very nearly the same transmembrane potential. (Thetransmembrane potential has to be uniform because allintracellular potentials are nearly the same, and all extracellularpotentials are nearly the same).
٩٧
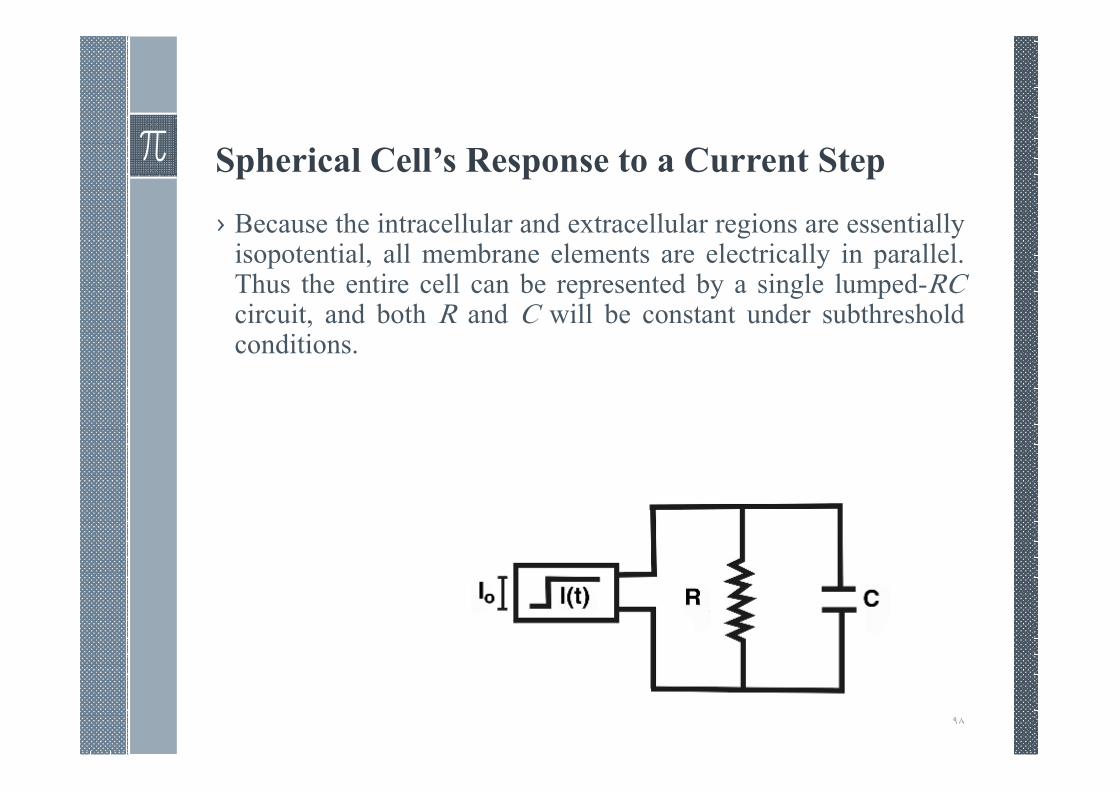
Spherical Cell’s Response to a Current Step
› Because the intracellular and extracellular regions are essentiallyisopotential, all membrane elements are electrically in parallel.Thus the entire cell can be represented by a single lumped-RCcircuit, and both R and C will be constant under subthresholdconditions.
٩٨
Spherical Cell’s Response to a Current Step
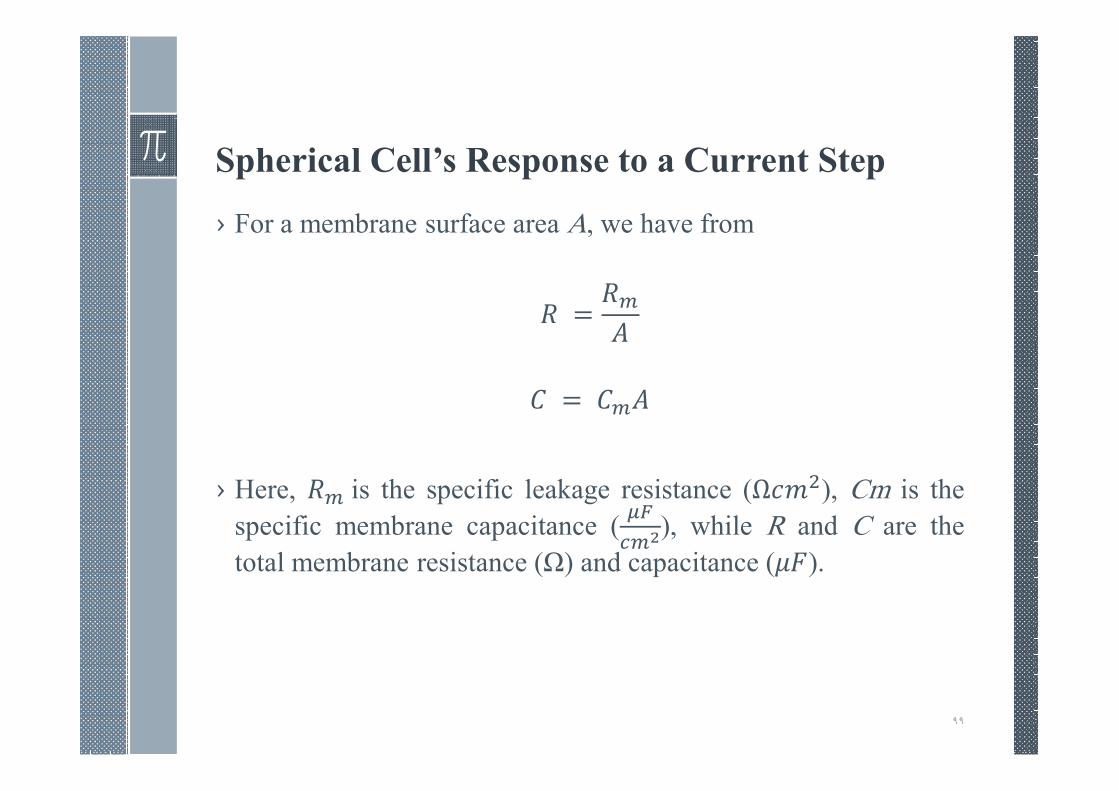
› For a membrane surface area A, we have from
( =(
)
= )
› Here, (is the specific leakage resistance (Ω+,-), Cm is the
specific membrane capacitance (./
01), while R and C are the
total membrane resistance (Ω) and capacitance (23).
٩٩
Spherical Cell’s Response to a Current Step
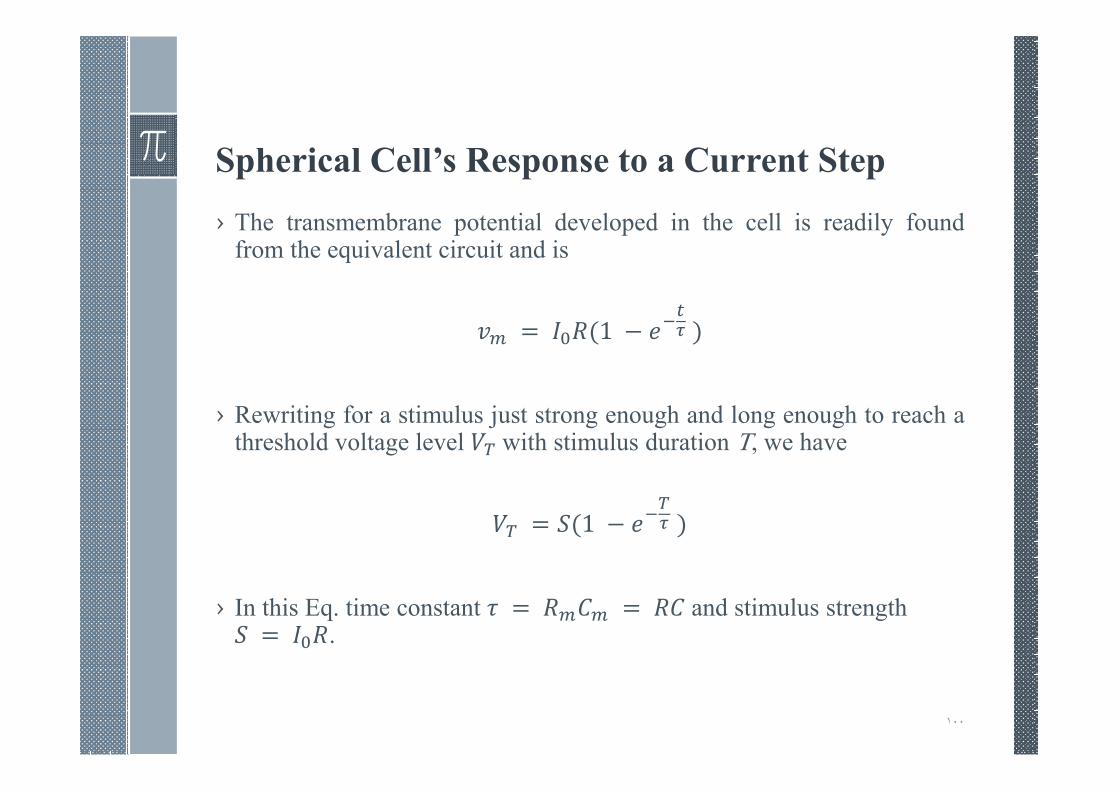
› The transmembrane potential developed in the cell is readily foundfrom the equivalent circuit and is
4 = 5((1 − 7!
8)
› Rewriting for a stimulus just strong enough and long enough to reach athreshold voltage level 9with stimulus duration T, we have
9 = :(1 − 7!
98 )
› In this Eq. time constant ; = ( = (and stimulus strength : = 5(.
١٠٠
Spherical Cell’s Response to a Current Step
› Note that parameter S is the steady-state voltage approached by4as t → ∞. The quantity S can be thought of as a measure ofthe depolarizing strength of the applied stimulus current 5; infact, it is the maximum depolarization that can be producedpassively by 5.
› τ & A???
١٠١
Strength–Duration
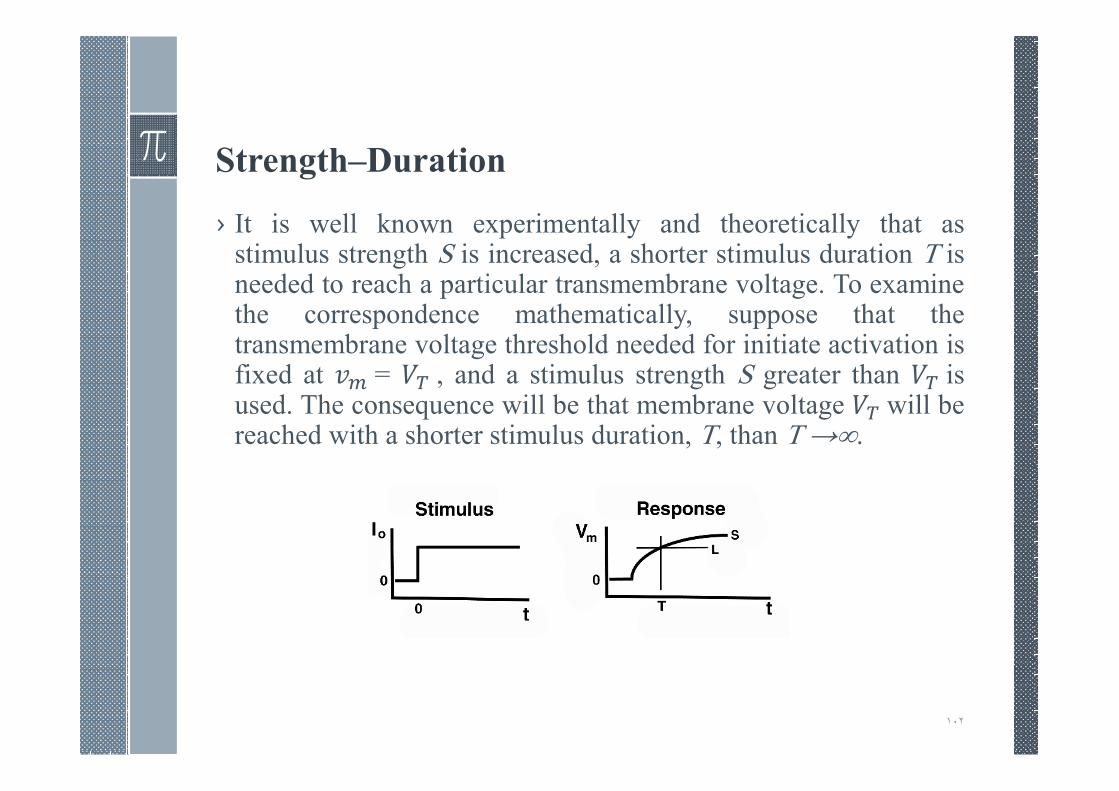
› It is well known experimentally and theoretically that asstimulus strength S is increased, a shorter stimulus duration T isneeded to reach a particular transmembrane voltage. To examinethe correspondence mathematically, suppose that thetransmembrane voltage threshold needed for initiate activation isfixed at 4= 9, and a stimulus strength S greater than 9isused. The consequence will be that membrane voltage 9will bereached with a shorter stimulus duration, T, than T →∞.
١٠٢
Strength–Duration
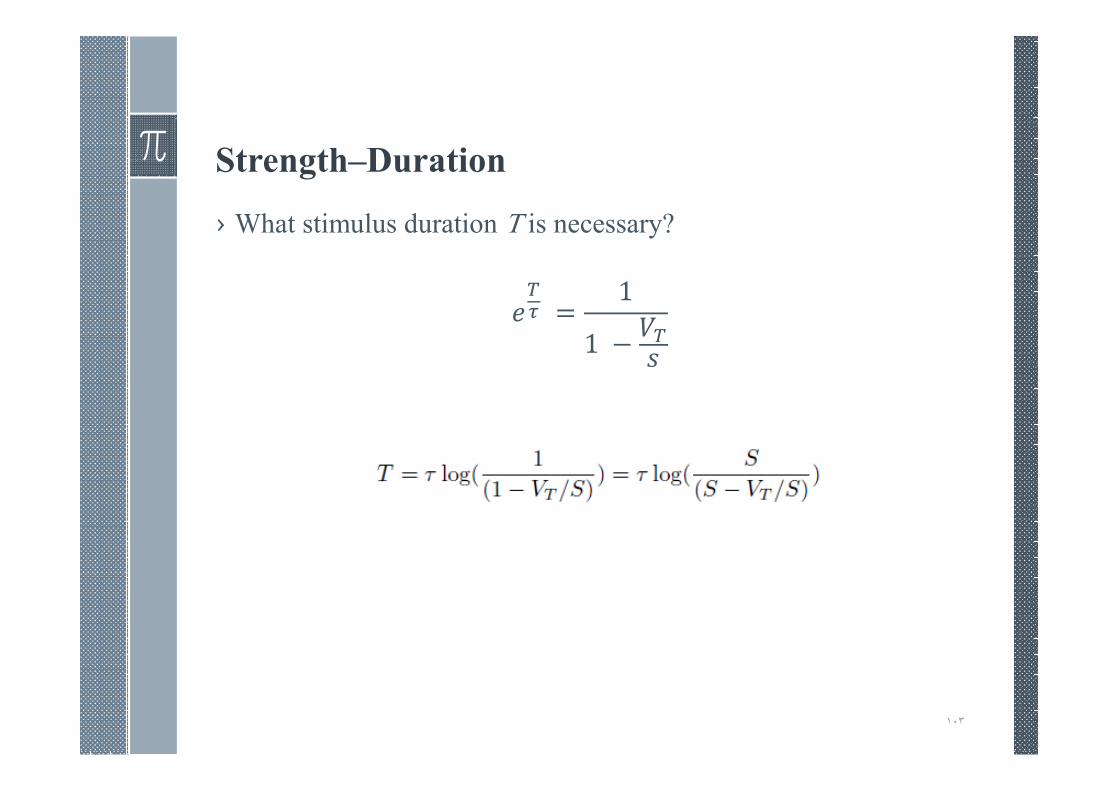
› What stimulus duration T is necessary?
798 =
1
1 −9
<
١٠٣
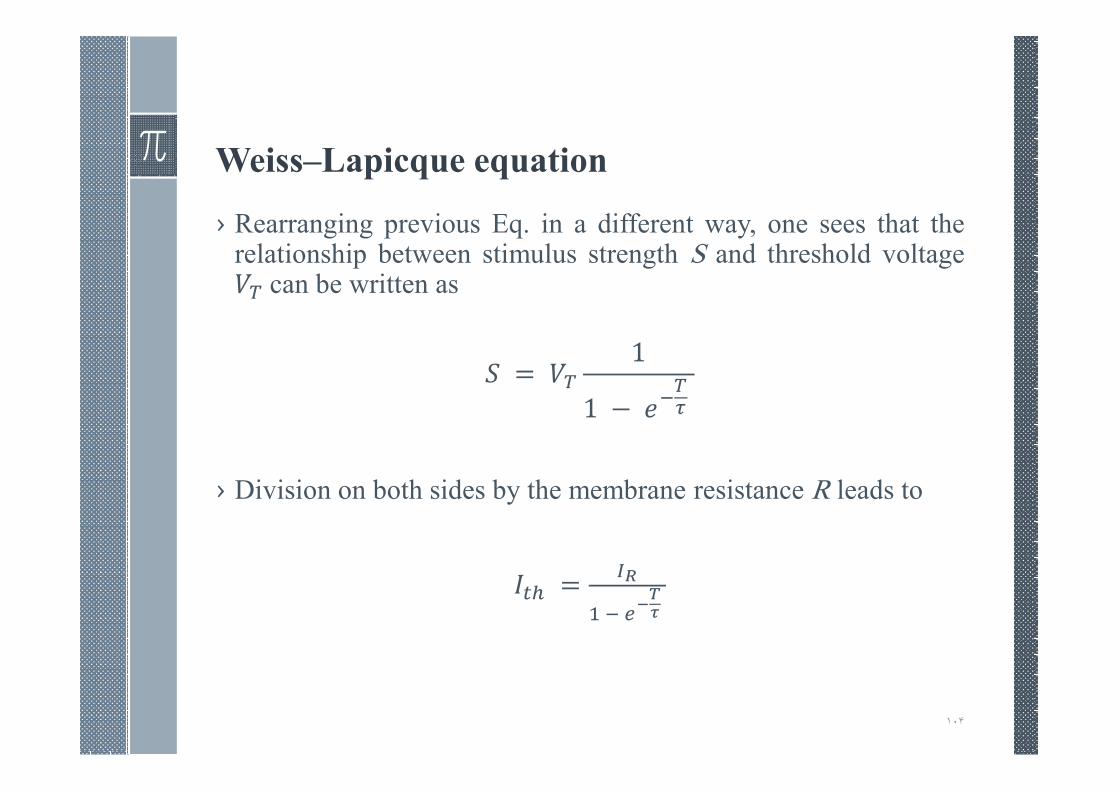
Weiss–Lapicque equation
› Rearranging previous Eq. in a different way, one sees that therelationship between stimulus strength S and threshold voltage9can be written as
: = 9
1
1 −7!
98
› Division on both sides by the membrane resistance R leads to
= =>?
@!"A
BC
١٠۴
Rheobase
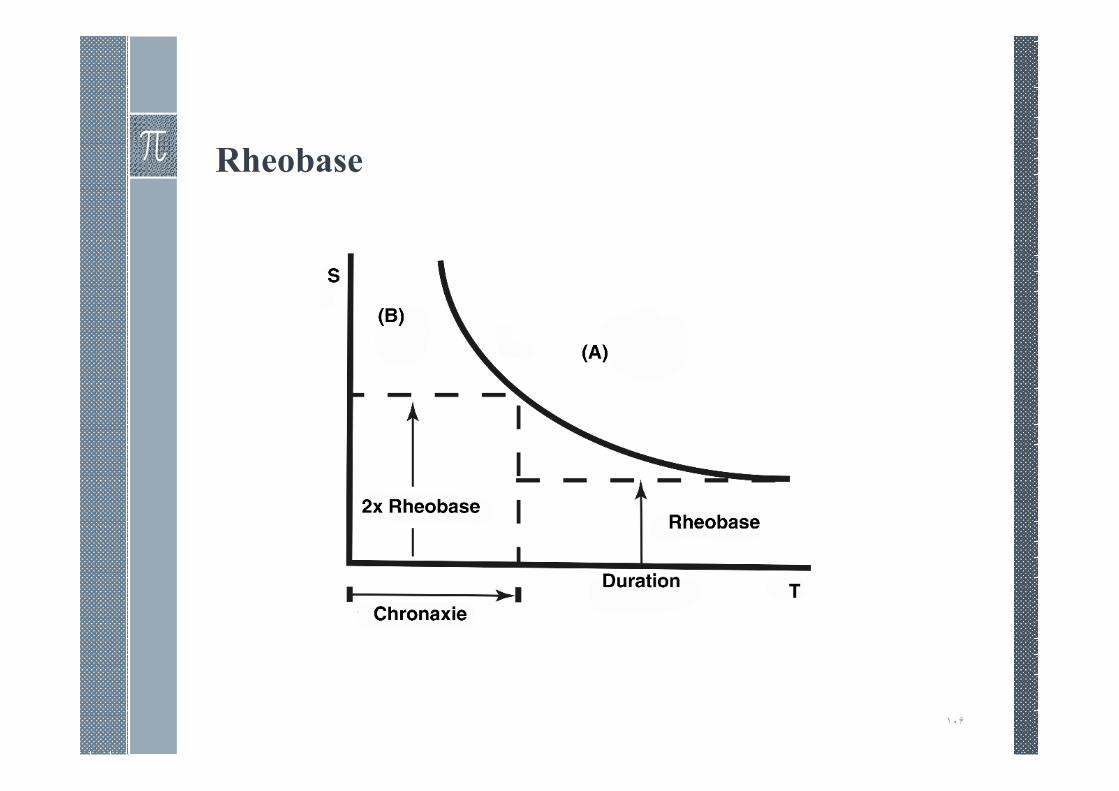
› D is named the rheobase, while =is the minimum currentrequired to reach threshold with stimulus duration T.
› The rheobase, D, is the minimum stimulus intensity that stillproduces a threshold value of transmembrane voltage, as thestimulation duration grows long (conceptually, as T → ∞). 9isthe strength at rheobase, or rheobase voltage.
١٠۵
Rheobase
١٠۶
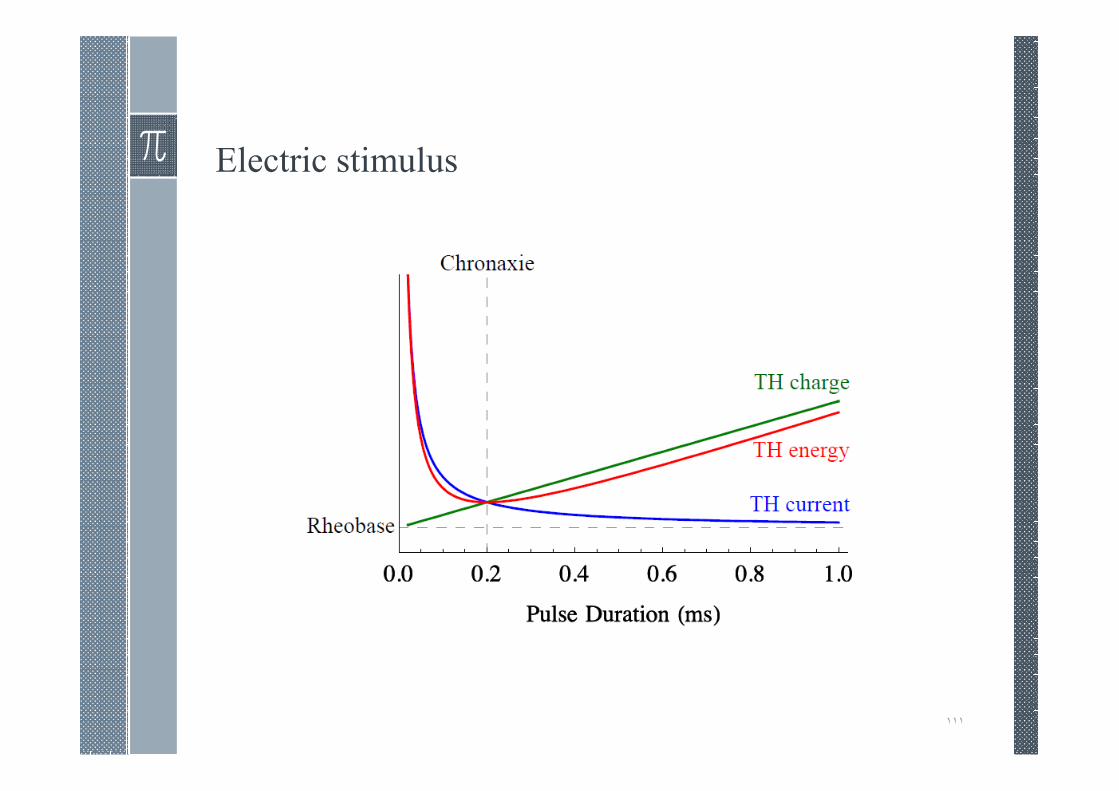
Chronaxie
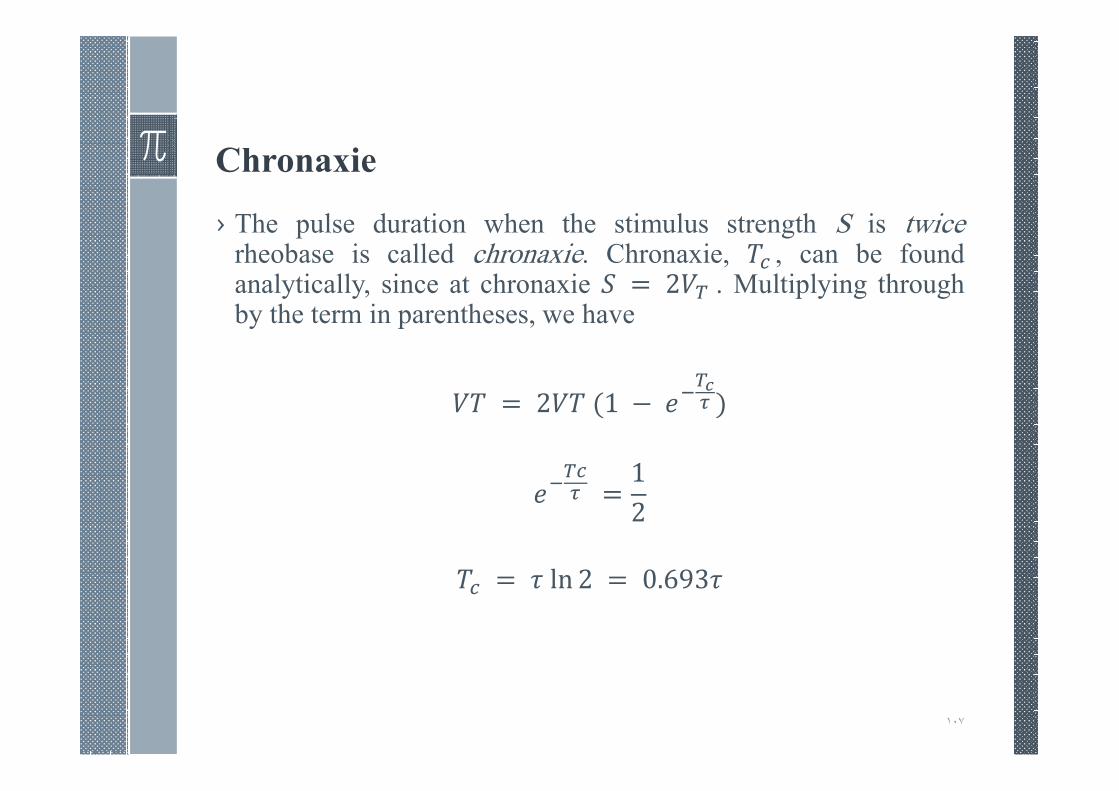
› The pulse duration when the stimulus strength S is twicerheobase is called chronaxie. Chronaxie, E0 , can be foundanalytically, since at chronaxie : = 29. Multiplying throughby the term in parentheses, we have
E = 2E(1 − 7!
9F8 )
7!
908 =
1
2
E0 = ;ln2 = 0.693;
١٠٧
Chronaxie
› Chronaxie is significant as a practical time period required toreach the threshold voltage when using a practical stimulusstrength. In a comparison of different membranes or the samemembrane under different conditions, chronaxie provides anominal measure of excitability.
١٠٨
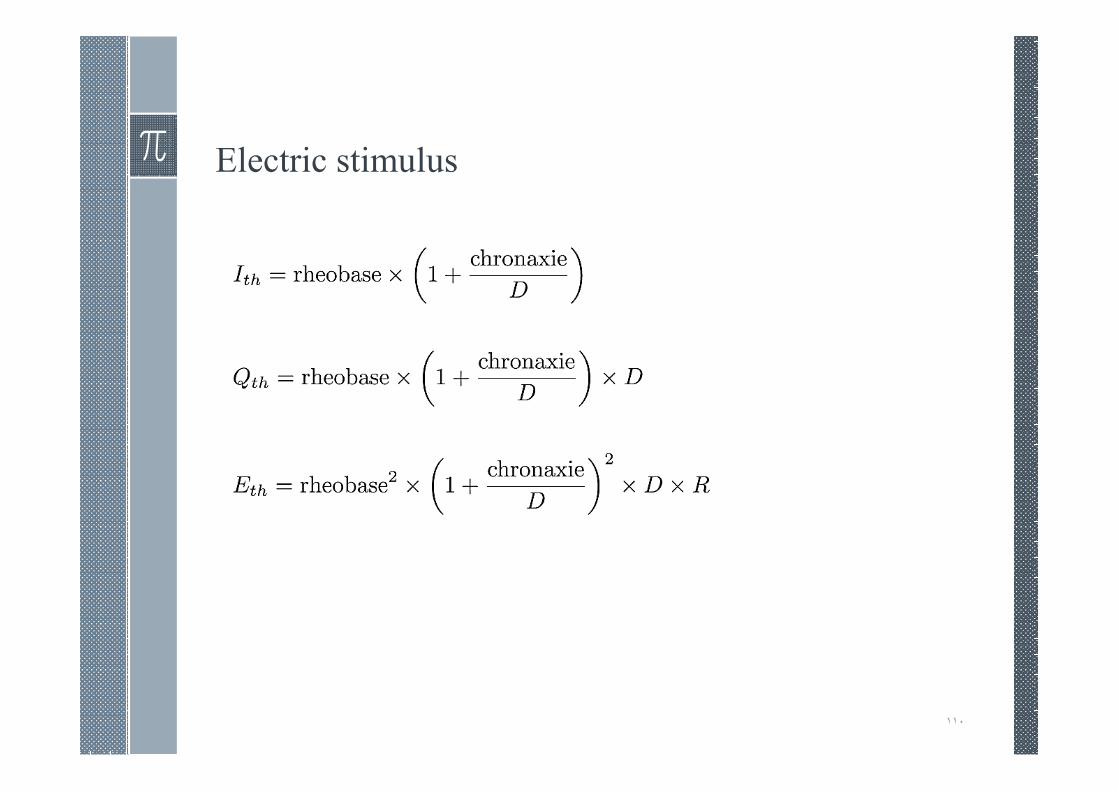
Electric stimulus
› Electric stimulus properties:
1. Pulse duration D in milliseconds (ms)
2. Current I in milliamps (mA)
3. Charge Q= ID in microcoulombs (µC)
4. Energy K = LMNOin millijoules (mJ)
١٠٩
Electric stimulus
١١٠
Electric stimulus
١١١
Comparison of chronaxies of different excitable tissues
› Myelinated nerve
› Unmyelinated nerve
› Skeletal muscle
› Smooth muscle
› Cardiac muscle
?
١١٢
١١٣
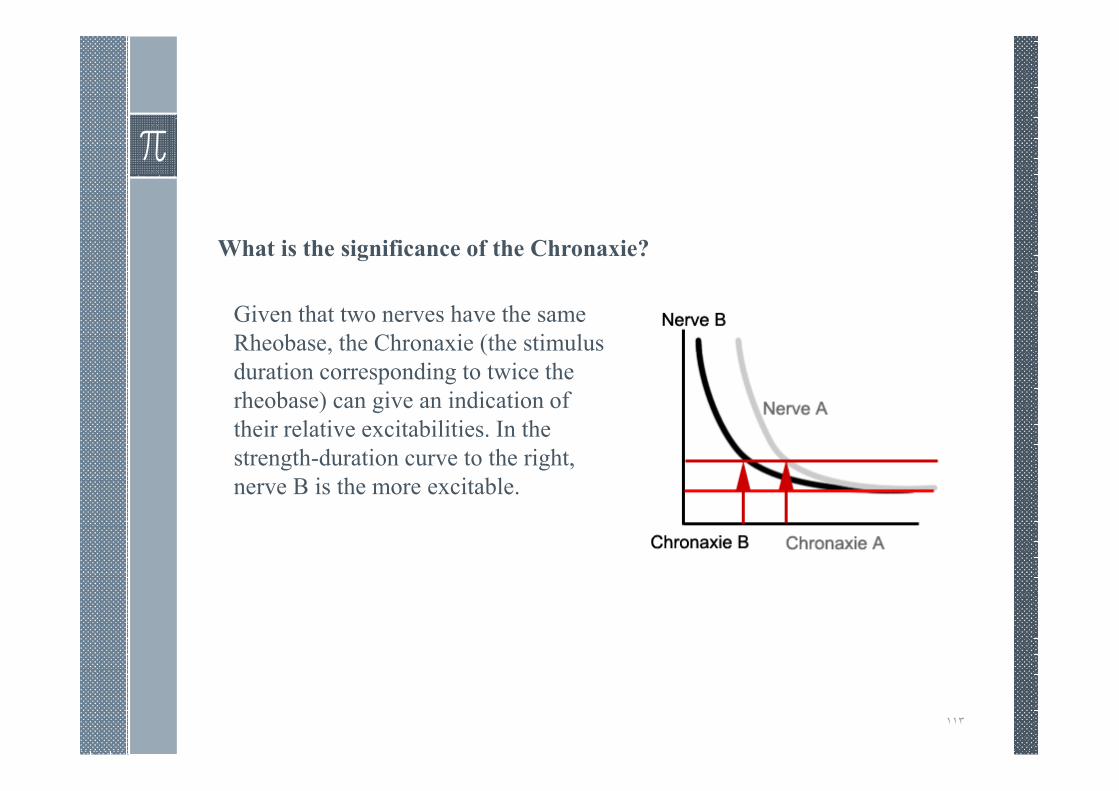
What is the significance of the Chronaxie?
Given that two nerves have the same
Rheobase, the Chronaxie (the stimulus
duration corresponding to twice the
rheobase) can give an indication of
their relative excitabilities. In the
strength-duration curve to the right,
nerve B is the more excitable.
١١۴
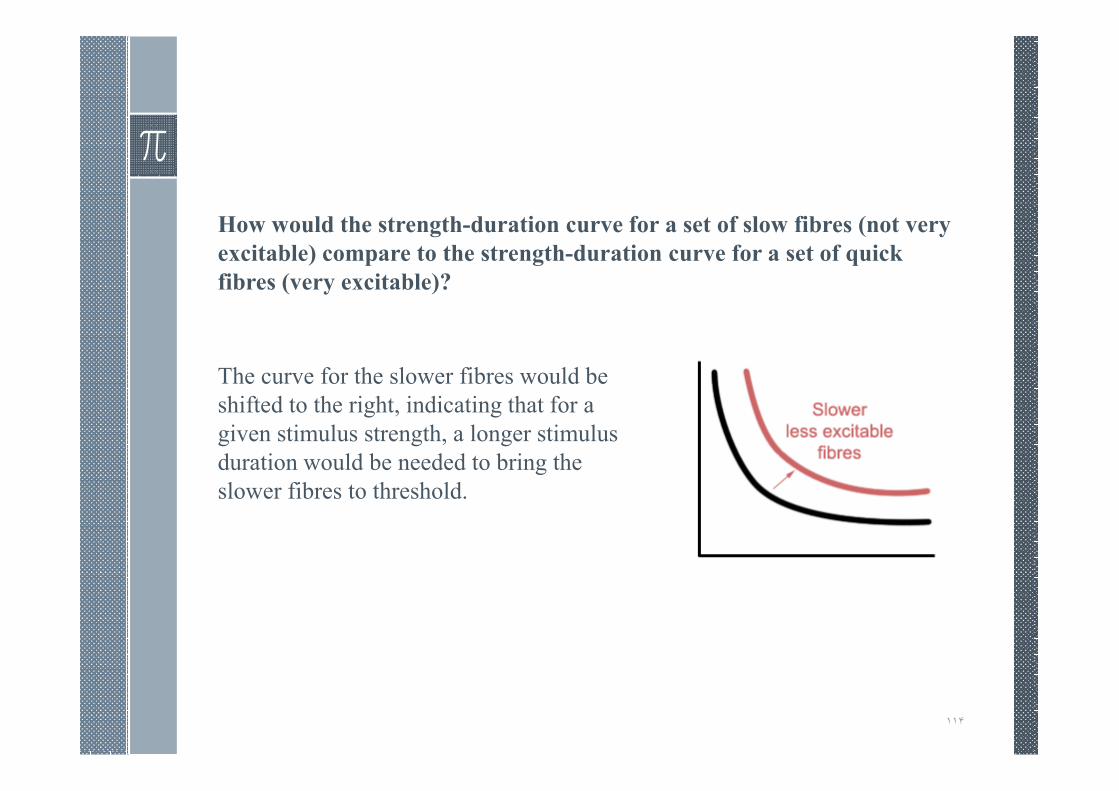
How would the strength-duration curve for a set of slow fibres (not very
excitable) compare to the strength-duration curve for a set of quick
fibres (very excitable)?
The curve for the slower fibres would be
shifted to the right, indicating that for a
given stimulus strength, a longer stimulus
duration would be needed to bring the
slower fibres to threshold.