Embed Size (px)
Citation preview

SEI report December 2019
Rocio Diaz-Chavez
Sofie Mortensen
Anna Wikman
Bioeconomy: tapping natural and human resources to achieve sustainability

Stockholm Environment Institute Linnégatan 87D 115 23 Stockholm, Sweden Tel: +46 8 30 80 44 www.sei.org Author contact: Rocio Diaz-Chavez [email protected] Editor: Andrew MashLayout: Richard Clay Cover photo: © Rocio Diaz-Chavez / SEI
This publication may be reproduced in whole or in part and in any form for educational or non-profit purposes, without special permission from the copyright holder(s) provided acknowledgement of the source is made. No use of this publication may be made for resale or other commercial purpose, without the written permission of the copyright holder(s).
Copyright © December 2019 by Stockholm Environment Institute
Stockholm Environment Institute is an international non-profit research and policy organization that tackles environment and development challenges. We connect science and decision-making to develop solutions for a sustainable future for all. Our approach is highly collaborative: stakeholder involvement is at the heart of our efforts to build capacity, strengthen institutions, and equip partners for the long term. Our work spans climate, water, air, and land-use issues, and integrates evidence and perspectives on governance, the economy, gender and human health. Across our eight centres in Europe, Asia, Africa and the Americas, we engage with policy processes, development action and business practice throughout the world.

ContentsList of Acronyms ..............................................................................................4
List of Figures ....................................................................................................4
Acknowledgements ........................................................................................4
Reference: ...........................................................................................................4
Summary ..............................................................................................5
1. Introduction .....................................................................................6
2. Methodology ...................................................................................7
3. Sustainability in the bioeconomy ..............................................8
4. The bioeconomy and Agenda 2030 ..........................................9
4.1 The poverty framework and the bioeconomy ........................ 12
4.2 Gender, poverty and equality frameworks ..............................14
5. The use of sustainability indicators ....................................... 17
6. Sustainability indicators for the bioeconomy ...................... 19
6.1 Selected standards and certification schemes ...................20
6.2. Proposal for sustainability indicators on the
bioeconomy ............................................................................................. 21
7. Conclusions and recommendations ........................................25
8. References ................................................................................... 26
Annex ................................................................................................. 29
4 Stockholm Environment Institute
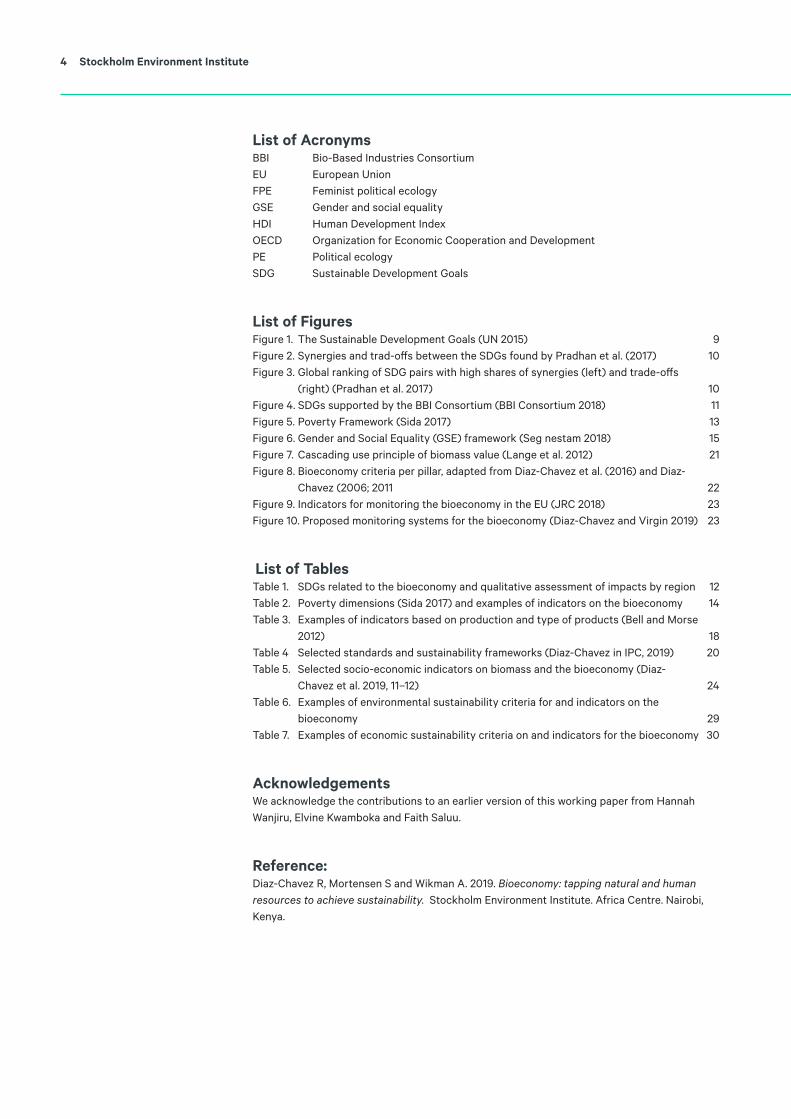
List of AcronymsBBI Bio-Based Industries ConsortiumEU European UnionFPE Feminist political ecologyGSE Gender and social equalityHDI Human Development Index OECD Organization for Economic Cooperation and DevelopmentPE Political ecologySDG Sustainable Development Goals
List of Figures
List of TablesTable 1. SDGs related to the bioeconomy and qualitative assessment of impacts by region 12Table 2. Poverty dimensions (Sida 2017) and examples of indicators on the bioeconomy 14Table 3. Examples of indicators based on production and type of products (Bell and Morse
2012) 18Table 4 Selected standards and sustainability frameworks (Diaz-Chavez in IPC, 2019) 20Table 5. Selected socio-economic indicators on biomass and the bioeconomy (Diaz-
Chavez et al. 2019, 11 –12) 24Table 6. Examples of environmental sustainability criteria for and indicators on the
bioeconomy 29Table 7. Examples of economic sustainability criteria on and indicators for the bioeconomy 30
AcknowledgementsWe acknowledge the contributions to an earlier version of this working paper from Hannah Wanjiru, Elvine Kwamboka and Faith Saluu.
Reference: Diaz-Chavez R, Mortensen S and Wikman A. 2019. Bioeconomy: tapping natural and human resources to achieve sustainability. Stockholm Environment Institute. Africa Centre. Nairobi, Kenya.
Figure 1. The Sustainable Development Goals (UN 2015) 9Figure 2. Synergies and trad-offs between the SDGs found by Pradhan et al. (2017) 10Figure 3. Global ranking of SDG pairs with high shares of synergies (left) and trade-offs
(right) (Pradhan et al. 2017) 10Figure 4. SDGs supported by the BBI Consortium (BBI Consortium 2018) 11Figure 5. Poverty Framework (Sida 2017) 13Figure 6. Gender and Social Equality (GSE) framework (Seg nestam 2018) 15Figure 7. Cascading use principle of biomass value (Lange et al. 2012) 21Figure 8. Bioeconomy criteria per pillar, adapted from Diaz-Chavez et al. (2016) and Diaz-
Chavez (2006; 2011 22Figure 9. Indicators for monitoring the bioeconomy in the EU (JRC 2018) 23Figure 10. Proposed monitoring systems for the bioeconomy (Diaz-Chavez and Virgin 2019) 23

Bioeconomy: tapping natural and human resources to achieve sustainability 5
Summary
An increased understanding of the “bioeconomy” and its application has led to better forms of monitoring its outcomes in terms of sustainability. The bioeconomy is context-contingent so assessments of its sustainability cannot just take one form. Any sustainability assessment of the bioeconomy needs to consider the characteristics of the specific region as well as the involvement of stakeholders
Four pillars of sustainability can be applied when monitoring the bioeconomy: environmental, economic, social and policy/governance. When monitoring the bioeconomy, the aims are to provide better information on the sustainability of the achievements in this novel sector, to systematize the available data and to help inform decision making.
The main aim of the bioeconomy is to use bio-based feedstocks, processes and products in a way that contributes to a reduction in greenhouse gas emissions compared to fossil fuel-based value chains. This enables novel sectors and value chains with added value to adopt the cascading use principle either in the global North or the global South. The main difference between the two regions is that there are infrastructure and logistics available in the North that are not yet fully available in the South. Nonetheless, in both cases the bioeconomy presents opportunities for sustainable development, including contributions to several of the UN Sustainable Development Goals, such as on the promotion of social and gender equity and poverty reduction.
This working paper presents an overview of sustainability assessment frameworks and indicators, such as certification and standards. It also reflects on the questions that need to be asked with regard to gender equity and poverty reduction, although it is currently too soon to assess their full integration into indicators based on the current level of available information. These questions relate more to aspirations for more equitable societies to which the bioeconomy may be able to contribute, but cannot provide the whole solution. The working paper also presents an overview of the characteristics and usefulness of current indicators as a response to the need to monitor the activities and impacts of the bioeconomy. It is aimed primarily at decision makers, with a view to establishing a baseline and a review in some selected areas.
Finally, the working paper makes recommendations on the design of an evaluation system, focused on areas that can directly demonstrate the benefits of the bioeconomy:
a) Economic impact demonstrated in at least two areas, using indicators such as regional economic development;
b) Job creation and benefits for workers (including increased wages), as part of a socio-economic indicator that allows monitoring over a period of time or per sector;
c) Increased capacity building in the region, in relation to the skills needed in the bioeconomy and how it can support social development;
d) The value added by value chains, products, processes and sectors, which should be part of the bioeconomy rather than just the agricultural or forestry sectors;
e) Reduced greenhouse gas emissions in those value chains where bioproducts are replacing fossil fuel-derived products; and
e) An improvement on the Human Development Index, to make a general index that can help monitor progress in a region using a horizontal analysis.
The proposed criteria and evaluation framework are intended to be neither static nor final. They are proposed in the light of experience of the bioenergy sector, as it is increasingly applied around the world, and the growing body of literature. Many of these efforts are still new in many areas of the global South.

6 Stockholm Environment Institute
1. Introduction
The concept of a “bioeconomy” has gained global attention in research and policy circles in recent years. Many argue that substituting a bio-based, or renewables-based, economy for the fossil fuels-based economy will help to resolve the complex challenges that the world is facing today. The term bioeconomy was developed in 1997 but the definition has evolved over time as international organizations have supported it through their various national or regional strategies (see e.g. OECD 2001; and European Commission Bioeconomy Strategy 2018). Views on the bioeconomy vary according to the perspective on the capacity of the economy and resources to address global societal challenges (Haapala et al. 2015). Some definitions of the bioeconomy make the food, health care, chemicals and energy sectors key components. Others focus on driving forces such as sustainability, competitiveness and welfare provision (Haapala et al. 2015). According to the European Commission Bioeconomy Strategy (2018), the bioeconomy covers all the sectors and systems that depend on biological resources and the functioning of all animals, plants, micro-organisms, derived biomass and organic waste. All those economic and industrial sectors which rely on biological resources and processes to produce food, feedstocks and other bio-based products are also part of the bioeconomy (EC, 2018).
Current definitions perceive the bioeconomy as a large system that binds together natural resources, technologies, markets, people and policies. In addition to the preservation of natural resources for future generations, the bioeconomy strives to optimally manage environmental resources for current generations (Lewandowski 2018). It has been suggested that the transition to a bioeconomy will address pertinent issues related to climate change, food security, health, industrial restructuring and energy security (Haapala et al. 2015). The use of renewable resources will substitute for the use of non-renewable resources, and more attention will be paid to minimizing industrial waste. In a nutshell, the bioeconomy aims to save resources and reduce environmental pollution in line with the principles of sustainable development and the circular economy. Furthermore, the concept brings together all the processes in the value chain that previously worked independently to meet consumers’ demands and expectations. To guarantee a sustainable and developing bioeconomy, governments are asked to promote various enterprises in their countries that serve the goals of saving resources and minimizing environmental pollution (Ahlheim 2018).
According to Birch and Tyfield (2012), issues in the bioeconomy are difficult to categorize, especially from a socio-economic perspective. While the bioeconomy may be a “tool” for sustainable development, the concept should be perceived neither as a new economic phenomenon, nor as a new discipline within the social sciences, but as a driver of sustainability (Pfau et al. 2014). The bioeconomy could contribute to sustainable futures in various ways, but a positive impact is not always certain. Significant efforts will be needed on knowledge acquisition, policymaking and institutional frameworks, both nationally and through international collaboration. This is expected to set the bioeconomy in the right direction to consider what will work for the welfare of people and the environment (Maciejczak 2015). Thus, it is crucial to acknowledge that the transition to sustainable economies will not automatically result in more equal or just societies, and that the bioeconomy might have unintended social consequences (Egenolf and Bringezu 2019; Piggot et al. 2019). In fact, if not properly assessed and addressed, many current challenges in the mainstream economy, such as gender and social inequalities and poverty, are likely to continue or even deepen within the bioeconomy (Alvarez 2013; Harcourt & Nelson 2015; Resurrección 2017). On the other hand, several positive impacts have been attributed to the use of biomass for bioenergy and to the bioeconomy (Diaz-Chavez et al. 2016). Nonetheless, current social impacts are poorly understood (Mattila et al. 2018).
The main objective of this working paper is to provide insight into the benefits of the bioeconomy, in particular its contribution to achieving the Sustainable Development Goals (SDGs), with a focus on gender mainstreaming and reducing poverty. In addition, a means of monitoring the bioeconomy, particularly in developing countries, is proposed.

Bioeconomy: tapping natural and human resources to achieve sustainability 7
2. Methodology
This working paper is based on a mixed methodology and a top-to-bottom and bottom-to-top analysis. The overall methodology is based on a literature review of how the bioeconomy is defined and of its application. A review of the possible contributions of the bioeconomy to achieving the SDGs provides an understanding of how power over natural resources (political ecology) is still an issue for consideration when developing the bioeconomy, particularly in developing countries. A general overview of the application of two additional frameworks was also undertaken: (a) the Sida multidimensional framework for assessing poverty; and (b) the SEI gender and social equity programme.
A benchmarking of some of the current sustainability standards provides an understanding of the application of the bioeconomy to value chains and its contribution to sustainability. As with any sustainability standard, however, the bioeconomy “does not guarantee progress towards sustainability”.
Finally, a general framework for monitoring the bioeconomy, particularly in developing countries, was developed to support current efforts.
Various limitations of this working paper need to be considered, such as the differences among the concepts, and in the application of and power over natural resources that exist between the global North and the global South. These are most obviously reflected in the supply chains, in gender considerations and in the aspirational objectives that many frameworks consider when assessing sustainability against the realities of the global South.

8 Stockholm Environment Institute
3. Sustainability in the bioeconomy
Generally speaking, sustainability calls for the harmonization of various factors in the social, environmental and economic spheres that are constantly changing over time. Long-term sustainability requires a coherent balance between the physical environment and the growing demands of the human population (Munasinghe & McNeely 1995). A bioeconomy is considered sustainable if resources are spent reasonably and in the most efficient ways to produce high-value products with minimal impacts on the environment (EC, 2018). A bioeconomy should enhance a country’s stability through the provision of core resources, such as food, fuel and other material needs, while also creating sustainable industries. Bioenergy presents opportunities to reduce GHG emissions in the energy system (Sanders and van der Hoeven 2008). However, broader considerations on the interconnections between industries and the entire life-cycle of bio-based products must be taken into account (Bioeconomy 2018). Furthermore, in addition to ensuring environmental sustainability, socio-economic dimensions and social sustainability should also be taken into account when prioritizing in a sustainable economy. Thus, it is crucial to assess who has access to and control over the benefits created by the bioeconomy, and how outcomes might benefit some while marginalizing others depending on factors such as gender, class, ethnicity, race, age, religion, sexuality and location.
Several factors will influence the future of the bioeconomy, such as global economics, the surrounding political environment, technological issues, and gender and social norms. Nowhere will the bioeconomy succeed without confronting numerous challenges (Haapala et al. 2015).
It will be highly challenging to predict the future of the bioeconomy due to the complexities that affect specific sectors and other unforeseeable developments. While the bioeconomy may be one method of climate change mitigation, industrial production can have negative impacts on biodiversity, ecosystems and social systems if not sustainably managed (Leal Filho et al. 2018; Hasenheit et al. 2016). For instance, the bioeconomy could contribute to reducing GHG emissions while also triggering new GHG emissions and inducing adverse effects on both people and the environment. Similarly, land conversion could lead to a loss of resources and livelihoods for groups of smallholders (Mills 2015). In addition to ensuring optimal use of biological resources, the bioeconomy could eventually lead to competition between food supply and biomass energy production, which could subsequently trigger food insecurity (Bourguignon 2017). There could also be competition between technologies used at different levels, such as bioenergy versus bio products, where the latter will be disadvantaged because of the greater support given to bioenergy. Regardless of the chosen angle for assessment and discussion, the sustainability of the bioeconomy will largely depend on the synergies between production of biomass feedstock and conversion procedures (Buchholz et al. 2009). The level of sustainability will also depend on whether the bioeconomy improves, reinforces or deepens existing societal inequalities (Diaz-Chavez et al. 2016).

Bioeconomy: tapping natural and human resources to achieve sustainability 9
Figure 1. The Sustainable Development Goals (UN 2015)
4. The bioeconomy and Agenda 2030
The United Nations published the Sustainable Development Goals in 2015 to put developing and developed countries on a path to sustainable development (United Nations, 2015). The goals set in Agenda 2030 seek to ensure human well-being, environmental protection and economic prosperity. The Agenda has 17 goals (see Figure 1) and 169 targets, which involve some interdependencies and cross-cutting issues that will need to be evaluated to make policy a reality (Schmidt et al. 2012; Costanza et al. 2016; Rickels et al. 2016).
Various frameworks have been proposed for characterizing these interactions (Nilsson et al. 2017; Pradhan et al. 2017). These studies have attempted to link methodologies to identify the closest synergies and trade-offs among the SDGs. The purpose of these frameworks is to provide scientific analyses of these interactions that were lacking in Agenda 2020 and to stimulate more science-policy exchange
For instance, Pradhan et al. (2017) used data from the United Nations Statistics Division (in Pradhan, 2017) on 122 indicators for 227 countries’ national-level and country-disaggregated data on gender, age, urban and rural population, and income between 1983 and 2016 to identify significant positive and negative correlations. The study found synergies and negative correlations among various SDGs. There were also positive and negative correlations between the SDG pairs. SDG 1 (no poverty), for instance, expressed synergies with most of the other SDGs, while SDG 12 (responsible consumption and production) and SDG 15 (life on land) demonstrated trade-offs with most of the other SDGs. These are also the SDGs most closely linked to the bioeconomy.
The indicators where most synergies were found were for SDG 1 (no poverty), SDG 11 (sustainable cities and communities) and SDG 13 (climate action). These were all part of the Millennium Development Goals and share international data and development indices. On the other hand, those showing the largest trade-offs were SDG 8 (decent work and economic growth), SDG 9 (industry, innovation and infrastructure), SDG 12 (responsible consumption and production) and SDG 15 (life on land) (Pradhan et al. 2017). According to the authors, these goals are currently in conflict with most of the other SDGs, and thus antagonistic to sustainable development (see Figure 3).
Another framework for assessing synergies among SDGs was published by the International Science Council in 2017. The methodology entailed the use of expert judgments to identify causal and functional relations among the SDGs. These mostly found synergies for SDGs 2, 3, 7 and 14.

10 Stockholm Environment Institute
Figure 3. Global ranking of SDG pairs with high shares of synergies (left) and trade-offs (right) (Pradhan et al. 2017)
Figure 2. Synergies and trad-offs between the SDGs found by Pradhan et al. (2017)

Bioeconomy: tapping natural and human resources to achieve sustainability 11
According to the report, because the methodology was based on causal and functional relations, the usefulness of the exercise was in promoting coherence among policies at different levels, such as in international agreements and on governance and jurisdiction. This will be an important aspect to consider in the context of the bioeconomy.
Three of the four future actions suggested in the report (ICSU 2017) are linked to bioeconomy analysis and implementation. First, is to continue the assessment exercise, mainly with a focus on the process of mapping interactions and assessing the degree of interdependency to encourage cross-sectoral and cross-disciplinary dialogue. Second, is mapping “existing institutions and actors to assess [the] strengths and weaknesses of [the] status quo for delivering the SDGs” (page 222). A third (the fourth in the original document) is to adopt an integrated approach to monitoring, evaluating and reviewing progress towards achievement of the SDGs as a whole, rather than focusing on individual indicators and targets. This may also be a consideration when carrying out assessments of the bioeconomy in a more integrated way rather than solely through specific indicators.
The link to the SDGs was also reviewed by the European Union (EU) Bio-Based Industries Consortium (BBI) to assess where contributions to achieving the SDGs can be made by the bioeconomy. The BBI has represented the private sector in a Public-Private Partnership with the EU since 2014. It supports innovative bio-based demonstration and flagships projects. Figure 4 shows the links to the SDGs that the BBI supports through different projects. The focus is on: (a) renewable resources (SDGs 2, 13, 14, 15); (b) biorefining and products (SDGs 6,7,9,12,17); and (c) sustainable growth (SDGs 3,8,11,13,17). The BBI argues that “Public Private Partnerships and policy coherence will be key to enable the huge opportunities that the circular bioeconomy can bring in achieving the SDGs” (BBI 2018, p.5).
Figure 4. SDGs supported by the BBI Consortium (BBI Consortium 2018)

12 Stockholm Environment Institute
Following on from these interlinkages, the SEI Initiative “Governing Bioeconomy Pathways” has also considered several SDGs linked to the bioeconomy. Table 1 shows the main SDGs and the interlinkages between them and the bioeconomy. As mentioned above, the contextualization between the global North and the global South has stronger links. Gomez San Juan et al. (2019) uses case studies to provide a detailed explanation of the specific issues related to the targets in each SDG and the bioeconomy. Table 1 only shows the strongest links by region. Emerging economies such as Brazil, Colombia, India and Mexico are included in the global South but they do of course differ from other economies there.
Table 1. SDGs related to the bioeconomy and qualitative assessment of impacts by region
SDGS related to bioeconomy Global North Global South
SDG 1 on poverty reduction
SDG 2: End hunger, achieve food security and improved nutrition, and promote sustainable agriculture
SDG 7: Ensure access to affordable, reliable, sustainable, and modern energy for all
SDG 9: Build resilient infrastructure, promote inclusive and sustainable industrialization, foster innovation
SDG 12: Ensure sustainable consumption and production patterns
SDG 13: Take urgent action to combat climate change and its Impacts
SDG 14 marine resources
SDG 15: Protect, restore, and promote sustainable use of terrestrial ecosystems, sustainably manage forests, combat desertification, and halt and reverse land degradation and halt biodiversity loss
Code: Impact in the region: Green/Strong: bioeconomy may contribute to achieve the goal; Yellow/medium: the bioeconomy may contribute to achieve the goal but may take longer or more effort, including economic, political, social, etc.; Red/weak: the bioeconomy may contribute in the region but is not highly relevant
The emphasis on these SDGs also shows a similarity with the BBI proposal, although some SDGs were excluded not because they have no links with the bioeconomy, but because of the limitations placed on the work. SDG1 and SDG2 were considered alongside other SDGs, particularly with regard to providing employment and therefore contributing to improving livelihoods, especially in the global South. The other SDG considered in this working paper is SDG 5 on gender equality. The sections below provide insights into these SDGs and the bioeconomy.
4.1 The poverty framework and the bioeconomySida’s conceptual framework “dimensions of poverty” acknowledges that poverty takes numerous forms and is not always just an issue of a lack of resources, such as income or land/tenure rights. Rather than trying to explain poverty, it explores its dimensions by asking “who is poor and in what way?”. Exploring these questions is a crucial step towards trying to understand and describe intergenerational or chronic poverty, for instance, or to capture inequalities between groups or genders (Sida 2017) (see Figure 5). Combining dimensions of poverty with bioeconomy indicators has the potential to describe how a transition to a bioeconomy would affect the more vulnerable groups in society (Diaz-Chavez et al. 2016).

Bioeconomy: tapping natural and human resources to achieve sustainability 13
Sida’s poverty framework defines four dimensions of poverty:
1. Resources, meaning power over resources, both material and non/material, a decent income, physical and human capital, professional skills, agricultural tools, ecosystem services, time and social networks;
2. Opportunities and choice, meaning access to services and opportunities to use resources to move out of poverty;
3. Power and voice to articulate concerns, needs and rights, and to take part in public and private decision making; and
4. Human security, meaning the opportunity to exercise human rights, even in periods of conflict and insecurity or violence.
Figure 5. Poverty Framework (Sida 2017)
Comparing the poverty framework with SDG 1 provides a broader understanding of various dimensions of poverty and how they are considered more or less of a priority. The indicators for SDG 1 deal with five main themes (UN, 2015): (a) economic poverty and the international poverty line; (b) nationally determined poverty lines and dimensions; (c) social protection; (d) basic services and tenure rights; and (e) vulnerability to disasters/shocks.
Economic poverty, social protection through decent work, tenure rights and resilience to disasters (economic, social and environmental) should arguably be taken into account when creating indicators for a sustainable bioeconomy, to enable the voices of the poor. Table 2 shows the four dimensions of the poverty framework and examples of some criteria and indicators to be considered in the bioeconomy that could help to reduce poverty.

14 Stockholm Environment Institute
Poverty must be understood holistically, as multifaceted and complex, and as affecting women, men, girls and boys in different ways, at different times and on different scales. It must be acknowledged that poverty is not just an issue of a lack of income or land/tenure rights. Its complexity requires strategies for tackling intergenerational and chronic poverty, as well as incorporating poor people’s perspectives and the rights perspective. To understand how poverty manifests itself and is experienced, it is necessary to understand who is poor and in what dimensions, as well as the underlying causes of poverty, risk and vulnerability.
Frameworks and indicators lead on to the questions of not only of “how” a bioeconomy can be sustainable, but who is benefiting from this sustainability and whether the poor are benefiting. This is in the same line as the “who are the winners and losers?” questions explored above, using the lens of feminist political ecology (FPE). To be able to explore these issues, indicators must not only deal with the sector, but also explore the situation for poor people, according to their age, gender and ethnicity. This demonstrates the link with the SDGs and their synergies and trade-offs.
Regarding gender, it is essential to consider vulnerable groups, particularly in rural areas where many bioeconomy-related activities take place in developing countries. In many societies, these vulnerable groups are women, girls, youth and the elderly (Diaz-Chavez 2012). The focus on gender and the link to poverty in some of these regions is explained in section 4.2.
4.2 Gender, poverty and equality frameworksThe transition to a bioeconomy will have big impacts on the wider societal context. These will include gender and social equality concerns, as is demonstrated in a number of studies on gender and the bioeconomy, as well as gender and sustainability certification (Alvarez 2013; Arndt et al. 2011; Kent et al. 2018; Kent and Farrell 2015; Meinzen-Dick et al. 2014; Smith 2013). Furthermore, while women and men have generally been found to be equally interested in sustainable production, they may not have the same ability to adapt their practices due to differentiated access to resources, knowledge, labour, finances and decision-making processes (Meinzen-Dick et al. 2014). It will therefore be crucial to include gender and social equality issues in any indicator framework for ensuring social sustainability.
Gender indicator frameworks are being used increasingly to measure gender inequality. Among the more notable indexes are the UN Gender Inequality Index and the OECD Social Institutions and Gender Index, both of which use various indicators to measure gender inequality at the
Table 2. Poverty dimensions (Sida 2017) and examples of indicators on the bioeconomy
Four dimensions Examples of indicators
(Access to) Resources• Power over resources, both material and non-material
• Decent income and professional skills
• Agricultural tools and ecosystem services
Opportunities & choice• Access to services
• Opportunities to use resources to move out of poverty
Power & voice• To articulate concerns, needs and rights
• To participate in private and/or public decision making
Human security• Opportunities to exercise human rights
• Resilience (economic, environmental and social)
• Conflicts and risks/safety

Bioeconomy: tapping natural and human resources to achieve sustainability 15
national level. While this enables international comparison, they do not provide an understanding of regional or sectoral differences (Permanyer 2010).
In response to this problem, the Stockholm Environment Institute and SERVIR have developed a subnational index for Vietnam and Cambodia (see Figure 6 ).1 At the sectoral level, the use of gender indicators in voluntary sustainability standards and frameworks is gaining increased attention (Smith et al. 2018). Gender is not directly mentioned in the Global Bioenergy Partnership Sustainability Indicators set (GBEP, 2011) but the collection of gender disaggregated data is encouraged. Sustainability standards are not generally designed with the aim of measuring outcomes for gender and social equality. They therefore commonly fail to address the underlying structural power dynamics that reinforce gender inequalities (Smith et al. 2018).
Measuring gender inequality is a complex task and the findings will vary depending on the indicators that are used and whether these are quantitative or qualitative (Kabeer 2005; Permanyer 2010; Smith et al. 2018). Employment and wage issues are covered best in the seven most prominent sustainability standards, but less attention is paid to issues such as resource rights, unpaid care work and access to decision making.
In order to address issues of gender inequality, it is important not only to map differentiated access to resources, opportunities and benefits, but also to identify the reasons for this differentiated access, and to ask who the winners and losers would be from the transition to a bioeconomy. It will be important to identify: (a) the structural drivers and social norms that affect who gains and who loses; (b) any new forms of exclusion and vulnerability that are being
1 http://usf-gsal.maps.arcgis.com/apps/webappviewer/index.html?id=6f24dcbd81c849c09a4f9daca8e5b6ff; http://www.arcgis.com/home/item.html?id=03c91f47945e4b69b56c094ca161771b
Figure 6. Gender and Social Equality (GSE) framework (Segnestam 2018)

16 Stockholm Environment Institute
produced; (c) how sustainability is framed within the bioeconomy by different groups, such as state bodies and private sector companies; and (d) how the bioeconomy leads to trade-offs between environmental sustainability and social well-being.
In addition, there are questions about how changes in access to and control over resources, such as land and water rights, technology and knowledge, such as information, discourses and social norms – as well as decision-making processes at various scales and the division of labour or access to and control over jobs – will affect gender and social relations. Finally, income and benefit distribution at all levels from the wider economy to small scale producers – including contributions to local, regional and national economies and welfare, as well as local, rural, urban and indigenous peoples’ and communities’ development – will all be affected.
To monitor these questions, the development of gender indicators to measure the outcomes of the bioeconomy has drawn on concepts from feminist political ecology, which emerged as a subfield of political ecology (PE). While PE addresses the issue of unequal and differentiated access to and control over resources at the local, regional and global scales, FPE adds a gender dimension and a special focus on social equality and social justice (Resurrección 2017). It has also added strands from feminist philosophy on situated knowledge and embodied experience, as well as critiques of the dominant techno-centric framings of environmental issues. FPE thus helps to provide an understanding of the complexity of changing institutions, resource relations and family life, and the attributed multi-scalar gender dimensions and power dynamics of the politics of environmental degradation and conservation, including in the bioeconomy (Elmhirst 2011). Moving at various levels from embodied experiences to discourses, an FPE analysis helps to inform a holistic but contextualized response to gender and social justice as it reveals how power structures and social norms shape the benefits of the bioeconomy for different groups, and how they reproduce gendered social identities, relations and rights (Harcourt and Nelson 2015; Resurrección 2017).
To operationalize this, a range of quantitative and qualitative indicators have been identified that interrogate issues such as: Who does what? Who owns what? Who has access to or controls what? Who knows what? Who benefits? (FAO n.d.) Just as important is why and how all this is changing due to the movement to a bioeconomy. Problem persist, however, with regard to the practicality of the indicators used, the availability of data and implementation.
There is no guarantee that the bioeconomy will be equally beneficial to all groups in society. It may even reinforce or deepen existing gender and social inequalities. The technocratic approach to the bioeconomy often sidelines the potentially adverse socio-economic, cultural and gendered impacts. A gender and social equality (GSE) lens can help to unpack the power relations that are “benefiting and providing options and resources for some by harming and restricting options and resources for others” (Weber 2015, p.6), and how this differs among social groups defined by a combination of, for example, gender, class, ethnicity and age (Arora-Jonsson 2014)
However, it is not uncommon for current research that integrates GSE issues to document the various inequalities without discussing the underlying structures and processes that cause those inequalities. These are the structures and processes that need to be understood and transformed in order to unleash the potential of the bioeconomy to contribute to a more equal and just society. It is therefore about shifting power to increase equality among actors at all levels of society, from the household to the international, and in all spheres from the public sector to the private sector, academia and civil society.

Bioeconomy: tapping natural and human resources to achieve sustainability 17
5. The use of sustainability indicators
There are various ways to measure sustainability. A common method is through multi-criteria assessment using indicators. Indicators are useful because they can provide information over a period, organize and group data (index), and assess data against a threshold or a baseline. Criteria and indicators are widely used in sustainability frameworks and standards. For sustainability assessments to be useful, socio-economic and environmental indicators must target stakeholder needs (Dale et al. 2017). In addition, indicators can help to determine what direction to take to address an issue and help to highlight alternatives to fix problems (Egenolf & Bringezu 2019). Indicators also provide a means of producing and analysing information. They are useful for sharing and comparing information, facilitating decision making and providing information to different stakeholders, including the general public (Bell & Morse 2012). They help to analyse and compare performance across population groups or geographic areas and can be useful for determining policy priorities.
Indicators can be useful as proxies or substitutes for measuring conditions that are so complex that no direct measurement is possible. Indicators have three basic functions: simplification, quantification and communication. Indicators generally simplify in order to make complex phenomena quantifiable so that information can be communicated (University of Reading n.d.). They are used to communicate and provide information to the wider public, as well as to support new forms of information-sharing and citizen science. New approaches, such as key and headline indicators and indices, should be tested to assess their capacity to meet these needs.
The use of indicators on sustainable development was developed by the UN to assess the achievement of Agenda 21. These were divided into social, economic, environmental and institutional indicators. The Agenda 21 document called for the development of indicators to measure sustainability. The selection of indicators can present challenges because some aspects can be directly measured and are attributable to a specific issue (e.g. a supply chain, employment, profitability, public reporting) while others may require considerable research to obtain data or a value. In addition, some indicators are quantitative and others qualitative (Diaz-Chavez et al. 2016).
According to Dahl (2012), to be effective indicators should be:
• Relevant to the system or problem they are working on;• Easy to understand by all users and actors without the need for experts;• Reliable: containing valid information;• Based on accessible data: information should be readily available or capable of being
collected while there is still time to act.• Cost-efficient in terms of the amount of data needed in a limited time; and• Time and space contingent: as reflected mainly in their scale (from the local to the regional
and national) and time scale (monthly, annual, etc.).
Izac and Swift (1994, in Bell and Morse 2012) propose indicators based on products, byproducts and amenities (see Table 3). The indicators also need to incorporate time and scale dimensions. For instance, the largest unit is the village. There are relevant parameters at each scale.

18 Stockholm Environment Institute
Good quality data is critical but so too is its proper interpretation to ensure that its use is robust. Where new data sets are to be collected, it will be necessary to describe the methodology employed. A clear reference point needs to be established for ease of interpretation. For instance, changes in soil quality can only be determined if the baseline is well known. If a trend is established, this will provide better results as components change overtime.
Table 3. Examples of indicators based on production and type of products (Bell and Morse 2012)
Cropping system Scales farm Village
Products Ratio of annual yield for all products to potential and/or farmer’s target yield
Profit from farm production
Ratio of profit to farmer’s target income
Economic efficiency Social welfare
Amenities Quality of drinking water
Source and availability of fuel
Availability of drinking water
Byproducts Soil PH, acidity, and aluminium content
Soil loss and compaction
Ratio of soil microbial biomass to total soil organic content
Abundance of key pests and weed species
Ratio of aggradation to degradation of land area
Nutritional status of households
Nutritional status of community stream turbidity, nutrient concentration and acidity
Human diseases and diverse sectors
Biodiversity and complexity

Bioeconomy: tapping natural and human resources to achieve sustainability 19
6. Sustainability indicators for the bioeconomy
An indicator is a quantitative or qualitative measure of how close an organization or entity is to achieving a set goal or policy outcome (Diaz-Chavez 2006). Many sets of indicators have been developed across the world to describe given situations, assess performance and monitor changes in particular processes. They are used to identify challenges and opportunities in various sectors. This section explores the use of indicators on the bioeconomy. Indicators can be used to assess social, economic, environmental or sustainability issues. Several programmes and initiatives have developed indicators at the international level that can be applied to the regional or national level. Other indicators are sector-oriented or applied at the project or programme level.
Sustainability assessments are often multi-criteria assessments, in which indicators are developed to monitor the effects of bio-based feedstocks and products, energy use and production, technologies and industrial development at the local, regional or national levels. Indicators can also support monitoring systems to enable a “continuous and systematic process of data collection” on an activity, programme, strategy or intervention (EU 2017, 303).
In the bioeconomy, indicators are highly valued for measuring the production of bioproducts, use levels of biotechnology and the environmental impacts on human health and well-being (Talavyria 2017). International organizations such as the Global Bioenergy Partnership and institutions such as the Organization for Economic Cooperation and Development (OECD) have used indicators to analyse levels and distribution of income, education, and health and well-being at the regional and national levels (Diaz-Chavez 2014). In addition, indicators are useful for monitoring and assessing the progress made towards achieving sustainability (Wolfslehner et al. 2016).
Indicators can be used as a basis for monitoring the bioeconomy. The information produced can be used differently and aggregated at different levels of action, with a focus on the national level but also taking account of the global impacts of domestic production and consumption (Egenolf and Bringezu 2019). Such indicators can consolidate competencies and provision, and lead to the revision of actions in the technological development chain, or the alteration of policy actions, regulatory requirements and action plans in order to achieve transformations. Importantly, bioeconomy indicators can assess various aspects of development, such as success, productivity, outputs and efficiency, as well as downward trends and uncertainty in the bioeconomy (Egenolf & Bringezu 2019). According to Fadillah and Idrus (2019), the use of indicators can assess, quantify and classify the key drivers of progress and innovation in the bioeconomy. They can measure success using measurable benchmarks and become criteria in the development of strategic reference points. The use of indicators is largely for policy-orientated outcomes and inputs, and it often provides an empirical reference point for assessing the drivers of the bioeconomy and whether it is on the right track.
An important requirement of a sustainability indicator on the bioeconomy is the balanced integration of the environmental, social, economic and institutional structures that influence sustainable development. According to Diaz-Chavez (2014), several studies indicate that more attention has been directed towards environmental and economic indicators while there has been little emphasis on socio-economic indicators. These are important elements of monitoring developments over time that should be applied to the supply chain of most bio-based products (Diaz-Chavez 2014). The application of indicators at the local level is crucial to allow policymakers and other decision makers to identify problems related to the bioeconomy and provide solutions for sustainable development (Diaz-Chavez 2014). A system of indicators is needed for analysing the bioeconomy and to help visualize bioeconomy-related prospects for developing countries.
The concept of a bioeconomy provides a number of opportunities to address societal challenges. Measuring the bioeconomy using indicators is still in its early stages and faces several methodological challenges (Karvonen et al. 2017). Social indicators are used to analyse a

20 Stockholm Environment Institute
particular social phenomenon in a society as whole (Acevedo et al. 2015). Social indicators have recently gained popularity as a result of concerns about the production of biofuels in developing countries. However, they tend to be more difficult to monitor and quantify as this requires more in-depth studies, such as household surveys, which are time-consuming and expensive (Wesseler & von Braun 2017). In addition, some aspects cannot be measured at all while others provide an inherent measure. Social and economic indicators have been gaining greater attention in the bioeconomy debate than environmental ones.
6.1 Selected standards and certification schemes Various standards and certification systems have been used to address or monitor sustainability issues. Most of these have their basis in bioenergy uses for biomass. Although several address the issue in practical terms, many contain aspirational criteria particularly with regard to human rights. From an environmental point of view, land use and land use change have been the most critical considerations in proposals to use biomass to reduce greenhouse gas emissions linked to the use of fossil fuels.
Table 4 lists selected sustainability standards and frameworks related to bioenergy and the bioeconomy, and the sustainability issues they address (Diaz-Chavez in IPCC 2019)
Table 4 Selected standards and sustainability frameworks (Diaz-Chavez in IPCC, 2019)
Scheme Sustainability issues covered by scheme
Environmental Social Economic
Number Acronym Name Commodity/process
Cer�fica�on scheme
GHG Bio-
diversity
Carbon stock
Soil Air Water
Land use manage-
menta
Land rights
Labour condi�ons
Food securityb
Manage
ment prac�ces
Good business prac�ces
Wages c
1 ISCC
Interna�onal Sustainability & Carbon Cer�fica�on
All feedstocks, all supply chains
√ √ √ √ √ √ √ √ √ √ √ √
2 Bonsucro BonsucroEU Sugar cane and derived products √ √ √ √ √ √ √ √ √ √ √
3 RTRS Roundtable on Responsible Soy EU
Soy based products √ √ √ √ √ √ √ √ √ √ √
4 RSB Roundtable on Sustainable Biomaterials EU
Biomass for biofuels and biomaterials
√ √ √ √ √ √ √ √ √ √ √ √ √
5 SAN Sustainable Agriculture
Linked to Rain Forest Alliance √ √ √ √ √ √ √ √
6 RSPO RED Roundtable on Sustainable Palm Oil RED
wide range of different biofuels and bioliquids √ √ √ √ √ √ √ √ √ √ √ √
7 PFSC
Programme for Endorsement of Forest Cer�fica�on
Forest management
√ √ √ √ √ √ √ √ √ d √
8 FSC Forest Stewardship Council
Forest Management √ √ √ √ √ √ √ √ √ √
9 SBP
Sustainable Biomass Programme
woody biomass, mostly wood pellets and wood chips √ √ √ √ √ √ √ √ √ √ √
10 ISO 13065:2015 Bioenergy biomass and process √ √ √ √ √ √ √ √ √ √e √ √
11 ISO 14055-1:2017
Land Degrada�on and Deser�fica�on land use management √ √ √ √ √ √

Bioeconomy: tapping natural and human resources to achieve sustainability 21
Although there has been some increase in the number of companies certified as complying with these standards, and with EU regulations in particular, the real improvement has been in the amount of GHG emissions reduced or the number of employees protected (Roundtable on Sustainable Biomaterial 2019), as well as the support provided to governments with their bioenergy policies.2
For bioeconomy strategies to be effective, a system needs to be in place to monitor sustainability issues and assess progress towards sustainability, or its targets and goals. Section 6.2 outlines the current EU monitoring system and a proposal for monitoring in developing countries and more generally.
2 See e.g. the website of the Global Bioenergy Partnership, <http://www.globalbioenergy.org>.
6.2. Proposal for sustainability indicators on the bioeconomyAn important feature of the bioeconomy is the possibility of extending biomass production and processing beyond food, feed and fibre, to include a range of value-added products with potential applications in many sectors, such as the agriculture, forestry, health, tourism and energy sectors. The cascading use principle presents opportunities for the use of biomass in additional products with added value (Figure 7).
In order to assess sustainability, some important issues regarding the use of biomass in the bioeconomy must be considered. First, there is the issue of the feedstock, its type, characteristics and origin, and so on. Then there is the impact of production and the products. Finally, there is the issue of the use of the products and their final disposal or reuse. Thus, an assessment should examine the entire value chain and all of its environmental, social and economic impacts.
Four pillars of sustainability need to be considered when monitoring sustainability in the bioeconomy: environmental, social, economic and policy/governance (Diaz-Chavez et al. 2016; Diaz-Chavez 2014). Sustainability assessment and monitoring must also be context-specific, or related to the people and the geographic area in which it is being assessed. Figure 8 presents examples of criteria for assessing sustainability in the bioeconomy across the four pillars.
There are a plethora or frameworks and proposals for assessing sustainability in the bioeconomy. Most of these are derived from the sustainability criteria proposed for bioenergy (see Diaz-Chavez et al. 2016). There are also technical standards for bioproducts and processes within the European Standardization system (CEN), such as CEN 16575 on terminology, CEN 16785 and CEN 16640 on bioproducts and CEN 16670 on the life-cycle assessment of bioproducts, among others.
Figure 7. Cascading use principle of biomass value (Lange et al. 2012)

22 Stockholm Environment Institute
Figure 8 shows the many criteria used to assess bioenergy and bioenergy sector feedstocks, including in advanced technologies. The lessons learned in terms of sustainability from biofuels production in particular have been reviewed in several European Commission technical reports (see Diaz-Chavez et al. 2016). These emphasize environmental criteria. For social assessment in particular, the use of alternative indicators and indices provides a better understanding of the benefits of biomass use.
The current use of indicators in the EU monitoring system is shown in Figure 9. Three main criteria are used, mainly related to the economic pillar: turnover, value added and job creation. These criteria are subdivided by sector or bioeconomy-related activity. It is important to note that the focus is mainly economic.
As mentioned above, the indicators for the bioeconomy must consider the specificity of the geographic area, the timeline and the characteristics of the bioeconomy itself. In the global South, high value molecules (see figure 7) can be difficult to obtain due to the lack of infrastructure and of investment in technology. Nonetheless, the bioeconomy can still focus on improving value chains compared to traditional value chains, involving all stakeholders; and, most importantly, on the type of governance applied or required under local conditions. Thus, the indicators selected can still fit the general characteristics of indicators discussed above to support a monitoring system even in its early stages of application.
Figure 8. Bioeconomy criteria per pillar, adapted from Diaz-Chavez et al. (2016) and Diaz-Chavez (2006; 2011)

Bioeconomy: tapping natural and human resources to achieve sustainability 23
Based on previous work on frameworks for bioenergy and the bioeconomy (see JRC, 2018, Diaz-Chavez 2014), two proposals for a monitoring system are shown in Figure 10. One focuses on the regional scale and is applied to a proposed review of landscape governance; the other is focused more on the supply chain and/or production. Both represent systems of standards. The idea, however, is not to gather or supply information in order to comply with a standard, but rather to monitor the movement towards sustainability in the activities related to the bioeconomy.
Figure 9. Indicators for monitoring the bioeconomy in the EU (JRC 2018)
Figure 10. Proposed monitoring systems for the bioeconomy (Diaz-Chavez and Virgin 2019)
Monitoring
• Geographical scale• Landscape governance• Indicators (relevant/
balanced)
• Supply chain and/or product
• Indicators (relevant/balanced)
Given that social indicators should have a wide focus, it is recommended that alternative indices should be considered, such as the Human Development Index (HDI), which incorporates other indicators related to the SEI gender framework, the Sida poverty framework and several of the SDGs (Diaz-Chavez et al. 2019). For the economic pillar, in addition to those proposed by European Commission’s Joint Research Centre (JRC 2018), two indicators are mainly used (including in disaggregated form): gross domestic product and job creation, although job creation is also considered a socio-economic indicator.
Diaz-Chavez et al. (2019) develops a methodology on socio-economic indicators applied to bioenergy production. The assessment is a mixed method that uses secondary data from the literature, statistical data from the census and data from interviews with stakeholders either in the selected states or with links to the sector.

24 Stockholm Environment Institute
There are difficulties attributing some socio-economic indicators to the bioenergy sector or the bioeconomy, as they incorporate synergies with traditional sectors such as agriculture, forestry and industry. Use of the HDI involves three social dimensions: decent standard of living, health and knowledge. These dimensions have a strong link with local communities. The Gini Index assesses inequality of income and is also related to the Sida poverty framework and the SDGs (Diaz-Chavez et al. 2019).
While some of the social and economic indicators have been criticized, for instance, for double counting across sectors (as shown in Figure 9), the data is easier to gather and to present meaningfully to stakeholders and decision makers, which means that criteria on having a “good indicator” can be met. The main challenge is to find quantitative or qualitative data that can be used for these purposes that is reliable, and cost-effective and not too time-consuming to collect.
A monitoring system based on these types of indicator will provide a way to strategically plan the future bioeconomy using a cross section of policy agendas that will examine better forms of production, while at the same time meeting the development goals of the population and addressing the main SDGs. Diaz-Chavez et al. (2016, 85) describes the development of a “consistent and transparent framework or minimum applicable criteria and indicators for sustainability assessment of bioproducts that are transparent and can be adapted to regional-specific conditions” as one of the major challenges connected to the bioeconomy.
Table 5. Selected socio-economic indicators on biomass and the bioeconomy (Diaz-Chavez et al. 2019, 11 –12)
Impact Examples of indicators Applied to the case study
Basic information
Framework conditions Location, average yield
Socio-economic
Contribution to local economy Value added, employment HDI
Gini
Number of workers/producers
Working conditions and rights Employment benefits Sustainable reports
Gender Benefits Equity issues
Land rights/property Land rights and conflicts Land tenure
Certification Compliance Indications of certification schemes used
Logistics Available infrastructure Available infrastructure

Bioeconomy: tapping natural and human resources to achieve sustainability 25
7. Conclusions and recommendations
This working paper presents an overview of the usefulness of indicators for assessing sustainability either as a monitoring system or in different types of sustainability assessment of the bioeconomy. The main objective of the working paper is to provide an insight into assessing the benefits of and beneficiaries from the bioeconomy. To this end, a qualitative assessment of the application of the SDGs to the bioeconomy in the global North and global South was presented.
Other studies have argued that some of the SDGs related to the bioeconomy might have greater positive impacts in regions of the global South (see Gomez De San Juan et al, 2019). The other focus of the working paper was on mainstreaming gender and including poverty reduction when proposing means of monitoring the bioeconomy, particularly in developing countries. This identified a number of synergies and opportunities that assessments or monitoring systems might provide with achieving the SDGs. These are also addressed in the SEI guidelines on gender and equity.
Monitoring systems are still under development and the proposals use various methodologies and types of indicator. The main message to keep in mind is that the purpose of the bioeconomy is to cut greenhouse gas emissions and develop alternative economic and social opportunities in a new sector, using bioresources as feedstocks or intermediate products. Among the main challenges facing sustainability assessments of bio-based products and biorefineries are:
Considering the specific characteristics of the region and local population and stakeholders for the assessment: the bioeconomy is based on biomass and therefore context must be taken into account.
• Considering that one framework does not fit all but that the approaches to deciding on the specific indicators may be a better alternative: this is also related to the contextuality not just in terms of geographical regions, but also of objectives, production, materials, and so on.
• The need for reliable data that fulfils the characteristics of a “good” indicator, such as cost-effectiveness, and time and spatial significance, along with consistent collection methods: this should also be decided in terms of the characteristics of indicators as previously suggested
• The concept of the bioeconomy offers several opportunities to address societal challenges but there is still as need to quantify several of these. While qualitative measurements should also be acceptable in economic assessments, they make such assessments more difficult.
• The biggest challenge continues to be how to unleash the potential of the bioeconomy to contribute to a more equal and just society; this may be difficult to achieve, particularly in the global South were the bioeconomy is still emerging.
In addition, issues of governance must be considered alongside policies, regulations and standards. There is a need to advance the dialogue on synergies between science, policy and the decision-making process.
Future sustainability assessments should consider the whole supply chain and all the stakeholders involved. In developing countries, where logistics and infrastructure may not yet be supportive of an advanced bioeconomy sector, improving supply chains and adding value to traditional sectors may be a way to foster the bioeconomy. Finally, more and better research on sustainability assessment is required that includes additional criteria, such as poverty reduction, gender equity, and health and safety in the bioeconomy.

26 Stockholm Environment Institute
8. References
Acevedo TA, Ruiz M. M. and Lobato-Calleros, O. (2015). Additional
indicators to promote social sustainability within government
programs: equity and efficiency. Sustainability, 7. 9251–9267. DOI:
10.3390/su7079251.
Ahlheim, M. (2018). Environmental economics, the bioeconomy
and the role of government. https://www.researchgate.net/
publication/321777713_Environmental_Economics_the_Bioeconomy_
and_the_Role_of_Government
Alvarez, I. (2013). Increasing the Gender Gap: The Impacts of the
Bioeconomy and Markets in Environmental Services on Women.
Global Forest Coalition.
Arndt, C., Benfica, R. and Thurlow, J. (2011). Gender implications of
biofuels expansion in Africa: The case of Mozambique. World
Development, 39(9). 1649–1662. https://doi.org/10.1016/j.
worlddev.2011.02.012
Arora-Jonsson, S. (2014). Forty years of gender research and
environmental policy: Where do we stand? Women’s Studies
International Forum, 47. 295–308. DOI:10.1016/j.wsif.2014.02.00
Biobased Industries Consortium. (2018). Bioeconomy and the UN
Sustainable Development Goals: A view from the Bio-based
Industries Consortium. July 2018.
Url:file:///C:/Users/Diaz-Chavez/OneDrive%20-%20SEI/Funds%202018/
Bioeconomy%20Initiative%202018/2019/meeting%20June%202019/
Lit/Bioeconomy_and_the_SDGs_July%202018.pdf
Bell, S. and Morse, S. (2012). Sustainability Indicators: Measuring the
Immeasurable? Routledge. London.
Birch K and Tyfield D. (2012). Theorizing the bioeconomy: biovalue,
biocapital, bioeconomics or.. what? Science, Technology, & Human
Values. 38(3). 299–327
Bourguignon, D. (2017). Bioeconomy challenges and opportunities.
European Parliament Brief. http://www.europarl.europa.eu/RegData/
etudes/BRIE/2017/595890/EPRS_BRI(2017)595890_EN.pdf
Buchholz, Thomas & Luzadis, Valerie & Volk, Timothy. (2009).
Sustainability criteria for bioenergy systems: Results from
an expert survey. Journal of Cleaner Production. 17. 10.1016/j.
jclepro.2009.04.015.
Costanza, R., Daly L., Fioramonti, L., Giovannini, E., Kubiszewski, I., Fogh
Mortensen, L., Pickett, K., Ragnarsdottir, K., Vogli, R. and Wilkinson,
R. (2016) The UN Sustainable Development Goals and the Dynamics
of Well-being. https://issuu.com/thesolutionsjournaldigital/docs/
per_costanza
Dahl, A. L. (2012). Achievements and gaps in indicators for sustainability.
Ecological Indicators, 17. 14–19.
Dale V. et al. (2017). Status and prospects for renewable energy using
wood pellets from the southeastern United States. Bioenergy. DOI:
10.1111
Diaz-Chavez, R. A. (2006). Measuring sustainability in peri-urban areas:
case study of Mexico City. In The Peri-Urban Interface in Developing
Areas: Approaches to Sustainable Natural and Human Resource Use.
McGregor, D., Simon, D. and Thompson, D. (eds). Earthscan .London
Diaz-Chavez, R. A. (2011). Assessing biofuels: aiming for sustainable
development or complying with the market? Energy Policy, 39(10).
5763–5769.
Diaz-Chavez, R. (2012). Rural and social development guideline.
Roundtable for Sustainable Biomaterials. http://rsb.org/pdfs/
guidelines/12-04-30-RSB-GUI-01-005-02-Rural-and-Social-
Development-Guidelines.pdf
Diaz-Chavez, R. (2014). Indicators for socio-economic sustainability
assessment. In Socio-Economic Impacts of Bioenergy Production.
D. Rutz & R. Janssen (eds), pp. 17–37. Cham: Springer International
Publishing. https://doi.org/10.1007/978-3-319-03829-2_2
Diaz-Chavez, R., Stichnothe, H. and Johnson, K. (2016). Sustainability
considerations for the future bioeconomy. In Developing the Global
Bioeconomy. Technical, Market, and Environmental Lessons from
Bioenergy. Lamers et al. (eds). 1st edn. Academic Press. 2016
Diaz-Chavez, R., Walter, A. and Gerber, P. (2019). Socio-economic
assessment of the pellets supply chain in the USA. IEA Bioenergy
Task 40. January 2019
Diaz-Chavez, R. and Virgin, I. (2019). From bioenergy to bioeconomy:
Same sustainability assessment in the North and global South?
European Biomass Conference, Lisbon, Portugal, 27–31 May
Egenolf V and Bringezu S. (2019). Conceptualization of an indicator
system for assessing the sustainability of the bioeconomy.
Sustainability, 11(2). 443. https://doi.org/10.3390/su11020443
Elmhirst, R. (2011). Introducing new feminist political ecologies. Geoforum,
42(2). 129–132. https://doi.org/10.1016/j.geoforum.2011.01.006
European Commission (2018). Bioeconomy: the European way to use our
natural resources: action plan 2018. http://edepot.wur.nl/467092
European Union. (2017). Tool #41: Monitoring arrangements and
indicators https://ec.europa.eu/info/sites/info/files/file_import/
better-regulation-toolbox-41_en_0.pdf Accessed August 2019
Bioeconomy: tapping natural and human resources to achieve sustainability 27
Fadillah, K. and Idrus, A. N. (2019). Developing an Index for Quantifying
Economic Impacts: The Bioeconomy Contribution Index
FAO. (n.d.). Core Set of Gender Indicators in Agriculture (p. 1). http://www.
fao.org/3/a-bb172e.pdf Accessed March 2019
Global Bioenergy Partnership (GBEP). (2011). The Global Bioenergy
Partnership Sustainability Indicators for Bioenergy. Rome. Italy
Gomez San Juan M, Bogdanski A and Dubois O. 2019. Towards
Sustainable Bioeconomy. Lessons learned from case studies. Food
and Agriculture Organisation. Environmental and Natural Resources
Management. Working Paper 73. http://www.fao.org/3/ca4352en/
ca4352en.pdf Accessed September 2019.
Haapala, A., Härkönen, J., Leviäkangas, P., Kess, P., Häggman, H., Arvola,
J., Stoor, T. and Ämmälä, A. (2015). Bioeconomy potential: focus on
northern Finland. Int. J. Sustainable Economy, 7(1) 2015
Harcourt, W. and Nelson, I. L. (eds). (2015). Practicing Feminist Political
Ecologies: Moving Beyond the “Green Economy”. London. Zed Books
Hasenheit, M., Gerdes, H., Kiresiewa, Z. and Beekman, V. (2016). Summary
report on the social, economic and environmental impacts of the
bioeconomy BioSTEP. 29
International Council for Science (ICSU), (2017). A Guide to SDG
Interactions: from Science to Implementation. [D.J. Griggs, M.
Nilsson, A. Stevance and D. McCollum (eds). International Council for
Science. Paris
IPCC. (2019). Chapter 7: Risk management and decision making in
relation to sustainable development. Coordinating Lead Authors:
Margot Hurlbert (Canada), Jagdish Krishnaswamy (India). Lead
Authors: Carlos Fernando Mena (Ecuador), Edouard Davin (France),
Francis Johnson (Sweden), John Morton (UK), Soojeong Myeong
(Republic of Korea), David Viner (United Kingdom), Koko Warner
(United States of America), Anita Wreford (New Zealand), Sumaya
Zakieldeen (Sudan), Zinta Zommers (Latvia), Diaz-Chavez (Mexico).
JRC. (2018). Bioeconomy at the JRC. Architect Biennale: Venice. EC Joint
Research Centre, Directorate for Sustainable Resources, Bioeconomy
Unit Luisa Marelli. 17 Sep. 2018. https://www.forestindustries.se/
siteassets/dokument/forestindustries.se/bioeconomy/bioeconomy-
at-the-jcr-luisa-marelli.pdf
Kabeer, N. (2005). Gender equality and women’s empowerment: A critical
analysis of the third millennium development goal 1. Gender &
Development, 13(1). 13–24.
Karvonen, J., Halder, P., Kangas, J. and Pekka, L. (2017). Indicators and
tools for assessing sustainability impacts of the forest bioeconomy.
Forest Ecosystems, 4(2). 2017.
Kent, J., Fannin, M. and Dowling, S. (2018). Gender dynamics in the
donation field: human tissue donation for research, therapy
and feeding. Sociology of Health & Illness. DOI https://doi.
org/10.1111/1467-9566.12803
Kent, J. and Farrell, A.-M. (2015). Risky bodies in the plasma bioeconomy:
a feminist analysis. Body & Society, 21(1), 29–57. https://doi.
org/10.1177/1357034X13520331
Leal Filho, W., Pociovalisteanu, D.-M., Borges de Brito, P.R. and Borges de
Lima, I. (eds) (2018). Towards a Sustainable Bioeconomy: Principles,
Challenges and Perspectives. Springer.
Lange, L., Bech, L., Busk, P. B., Grell ,M. N., Huang, Y., Lange, M., Linde, T.,
Pilgaard, P., Roth, D. and Xiaoxue Tong. (2012). The importance of
fungi and of mycology for a global development of the bioeconomy.
IMA Fungus, 3(1). 87–92. DOI: 10.5598/imafungus.2012.03.01.09
Lewandowski, I. et al. (2018). Bioeconomy Shaping the Transition to
a Sustainable, Biobased Economy. https://www.springer.com/gp/
book/9783319681511
Maciejczak, M. (2015). What are the Production Determinants of
Bioeconomy? Scientific Journal Warsaw University of Life Sciences –
SGGW. Problems of World Agriculture 15 (4). 137–146
Mattila, T. J., Judl, J., Macombe, C. and Leskinen, P. (2018). Evaluating
social sustainability of bioeconomy value chains through integrated
use of local and global methods. Biomass and Bioenergy, 109.
276–283. https://doi.org/10.1016/j.biombioe.2017.12.019
Meinzen-Dick, R., Kovarik, C. and Quisumbing, A. R. (2014). Gender and
sustainability: annual review of environment and resources, 39(1).
29–55. https://doi.org/10.1146/annurev-environ-101813-013240
Mills, E. (2015). The Bioeconomy: A Primer. TNI and Hands on the Land.
https://www.tni.org/files/publication-downloads/tni_primer_the_
bioeconomy.pdf
Munasinghe, M. and McNeely, J. (1995). Key concepts and terminology of
sustainable development. In Defining and Measuring Sustainability.
Munasinghe, M. and McNeely, J. (eds). United Nations University and
the World Bank. Washington. 19–56
Nilsson, M., Griggs, D., Visbeck, M., Ringler, C. and McCollum, D. (2017).
A framework for understanding sustainable development goal
interactions. In A Guide to SDG Interactions: from Science to
Implementation. Griggs, D. J., Nilsson, M., Stevance, A. and McCollum,
D. (eds). International Council for Science, Paris
OECD 2001
Permanyer, I. (2010). The measurement of multidimensional gender
inequality: continuing the debate. Social Indicators Research, 95(2).
181–198. DOI: 10.1007/s11205-009-9463-4

28 Stockholm Environment Institute
Pfau, S.F., Hagens, J. E., Dankbaar, B. and Smits, A. J. M. (2014). Visions of
sustainability in bioeconomy research. Sustainability, 6(3). 1222–1249
Piggot, G., Boyland, M., Down, A. and Torre, A. R. (2019). Realizing a just and
equitable transition away from fossil fuels. SEI Discussion Brief. 12
Pradhan, P., Rybski, L. C. D., Lucht, W. and Kropp, J. (2017). A systematic
study of sustainable development goal (SDG) interactions. Earth’s
Future. DOI: 10.1002/2017EF000632
Resurrección, B. P. (2017). Gender and environment in the global South:
From “women, environment and development” to feminist political
ecology. In Routledge Handbook of Gender and Environment
MacGregor, S. (ed.). Abingdon, Oxon; New York, NY. Routledge. 71–85
Rickels, W., Dovern, J., Hoffman, J., Quaas, M. F., Schmidt, J.O.
and Visbeck, M. (2016). Indicators for monitoring sustainable
development goals: An application to oceanic development
in the European Union. Earths’s Future, 4. 252–267.
DOI:10.1002/2016EF000353
Roundtable on Sustainable Biomaterial (2019). A Year of Growth:
Reviewing 2018, Geneva, 2019, <https://rsb.org/wp-content/
uploads/2019/06/RSB-Annual-Review-2018-Final_compressed.pdf>
Sanders, J. and van der Hoeven, D. (2008). Opportunities for a bio-based
economy in the Netherlands. Energies, 1. 105–119. DOI: 10.3390/
en1030105
Schmidt, O., Padel, S. and Levidw, L. (2012). The bioeconomy concept and
knowledge base in a public goods and farmer perspective. Bio-based
and Applied Economics, 1. 47–63.
Segnestam, L. (2018). Integrating gender and social equality into
sustainable development research: A guidance note. October 2018.
Version 1.0. Stockholm Environment Institute, Stockholm
Sida. (2017). Dimensions of poverty: Sida’s conceptual
framework. https://www.sida.se/contentassets/
f3e30b6727e8450887950edb891c05af/22161.pdf
Smith, S. (2013). Assessing the gender impacts of fairtrade. Social
Enterprise Journal, 9(1). 102–122. DOI: 10.1108/17508611311330037
Smith, S., Busiello, F., Taylor, G. and Jones, E. (2018). Voluntary
Sustainability Standards and Gender Equality in Global Value Chains
Geneva. International Centre for Trade and Sustainable Development
(ICTSD). 56
Talavyria M. P. (2017). Indicators for analysis of the bioeconomy in
Ukraine. http://www.irbis-nbuv.gov.ua/cgi-bin/irbis_nbuv/cgiirbis_64.
exe?C21COM=2&I21DBN=UJRN&P21DBN=UJRN&IMAGE_FILE_
DOWNLOAD=1&Image_file_name=PDF/E_apk_2017_3_8.pdf
United Nations. 2015. Sustainable Development Goals. https://www.
un.org/sustainabledevelopment/sustainable-development-goals/
Accessed June 2019
University of Reading. n.d. Indicators of Sustainable Development. http://
www.ecifm.rdg.ac.uk/inofsd.htm Accessed June 2019
Weber, L. (2015). Defining contested concepts. In Race, Gender, Sexuality,
and Social Class: Dimensions of Inequality and Identity. Ferguson, S.
J. (ed.). SAGE Publications. London. 5–16. https:// uk.sagepub.com/
sites/default/files/upm-binaries/70370_Ferguson_ Chapter_1.pdf
Wesseler, J. and von Braun, J. (2017). Measuring the bioeconomy:
Economics and policies. Annual Review of Resource Economics. 9.
275–298
Wolfslehner, B., Linser, S. and Pülzl, H. (2016). Forest bioeconomy: a new
scope for sustainability indicators. Joensuu: EFI

Bioeconomy: tapping natural and human resources to achieve sustainability 29
Annex
Table 4 shows examples of sustainability criteria and indicators for the bioeconomy, and their possible links to the different frameworks explained in section 3: (a) the Sida Poverty and Equity framework; (b) the SEI Gender and equality framework; and (c) the Sustainable Development Goals. The links can be interpreted as direct or indirect, depending on the criteria and /or indicator.
Table 6. Examples of environmental sustainability criteria for and indicators on the bioeconomy
Indicator Description Indicator/Metric Poverty and
equity
Gender and social equality
SDG
Environmental Indicators
1. Changes in ecosystems and/or ecosystem services
Protecting and conserving biodiversity, maintaining ecosystem services, and sustainably managing living natural resources are fundamental to sustainable development
Number of acres/hectares converted to bioeconomy initiatives
Assess the extent to which ecosystem services have been affected positively or negatively
√ √ √
2. Greenhouse gas savings/climate change
Life Cycle Assessment inventory for GHG
Emissions saved from bioproducts vs fossil fuels in products production and use
√
3. Waste management /Pollution
Managing waste resources generated: solid waste, waste water, etc.
Percentage of solid waste, waste water being recycled
Assess waste management practices
Magnitude of noise pollution
- Mechanisms put in place to avoid air pollution
- exposure to air, noise, water, waste pollution
√ √
4. Water resources Water resources under the jurisdiction of the project/proposal/activity
Estimated quantity of water extracted from the body and % returned (note the status: raw sewage or treated). Or % of water redistributed to project
Water pollution
Loss of water access by communities
√ √ √
5. Pesticides/chemicals usage
Production and use of chemicals and or pesticides from biomaterials vs fossil fuels
Assess the production and use of bioproducts in this category vs fossil fuels
√
6. Resilience Resilience to shocks (environmental disasters)/exposure to environmental and climate change risks
Number affected disaggregated by different identities
√
7. Agricultural sector (rural/urban divide) land
Strengthening the agricultural sector (underdevelopment)
Added value to the traditional agricultural sector by the bioeconomy
√

30 Stockholm Environment Institute
Table 7. Examples of economic sustainability criteria on and indicators for the bioeconomy
Indicator DescriptionIndicator/Metric (Quantitative/qualitative)
Poverty and
equity
Gender and social equality
SDG
Economic Indicators
1 Employment status/decent jobs/ income generated for small farmers
Assess sustainability of bioeconomy in relation to number of people employed in the sectors
Temporary migrant workers ratio
Permanent employment vs short term/contractor
• -Number of persons employed at various stages of bio product supply chain.
• -Average number of days /hours people work per year in the full value chain in bioeconomy.
• -Number of jobs created in the full value chain in the bioeconomy.
• -Minimum wages earned for workers in bioeconomy sectors.
• Number of enterprises registered in the bioeconomy sector
• Proportion provided with training/education to do the job
√ √ √
2. Resilience to economic and social shocks/instability
Sustainability of the value chain √ √ √
3. Total value added Levels of dependence on non-renewable resources (high or low)
• Sum of value added generated from biomass development process, i.e. in all production processes of main products and byproducts.
• Value of GDP per capita
• Value added at local level
√ √ √
4. Total Net Profit (TNP)
Assess sustainability of bioeconomy industries; either making profits or losses
• Value of net profit generated from conversion /processing of main products and byproducts
√
5. Productivity Assessment of productivity of bioeconomy industries
• Ratio of productivity efficiency (high or low).
• Volume of bioproducts generated per year.
• Life-cycle costs; the minimum costs of production in manufacturing bio resources such as biofuels.
6. Investments in research and development/ technology
-A list of investments in production of bioeconomy goods and services
-Levels of investment in transportation of bio-raw materials to factories
-Technological investments in storage facilities for bio-raw materials
- Channels for disseminating research outcomes and innovation skills to target audiences in bioeconomy, i.e. business community, policymakers and local community
• Percentage use of new technologies/innovation skills in bioeconomy.
• Percentage of sectors/industries utilizing newer technologies in the production of bioeconomy goods and services.
• Percentage of groups with access to research materials and outcomes.
• Percentage of people accessing training and extension services.
√ √ √
7. Net energy balance/ Access to Modern Energy and energy security
Enhanced access to energy is also expected to influence, if not improve, other socio-economic conditions such as education, health, income and the environment in communities.
• Percentage use of new technologies/innovation skills in bioeconomy.
• Percentage of sectors/industries utilizing newer technologies in the production of bioeconomy goods and services.
• Percentage of groups with access to research materials and outcomes.
• Percentage of people accessing training and extension services.
√ √ √

Bioeconomy: tapping natural and human resources to achieve sustainability 31
Table 8. Examples of social sustainability criteria on and indicators for the bioeconomy
Indicator DescriptionIndicator/Metric (Quantitative /qualitative)
Poverty and
equity
Gender and social equality
SDG
Social Indicators
1. Employment Employment in all stages of the value chain for bioproducts
Jobs in the different stages of the value chain classified as permanent, seasonal, etc.
Average income
√ √ √
2. Working conditions Exposure to environmental impacts from the bioeconomy supply chain
Sick leave days per employee, per year
health measures (e.g. sick-leave analysis, health activities)
Number of accidents per year
(unit: No.)
√ √ √
3. Education and knowledge capital
To maintain society’s productivity, potential skills and capacities. There is a need for training and education that maintains the stock of knowledge
literacy rates
Average schooling
Information access
Percentage of employees participating in training per total employees
√ √ √
4. Equity Equity can be understood broadly as shared, equal rights, rules and responsibilities between all individuals in a society; the level of equity among people varies greatly around the globe
For example, if each member of a society is treated the same, irrespective of their sex, age, race, religion, marital status or political beliefs and they should not be hampered by discrimination.
Income distribution
Percentage of female employees in management positions
Percentage of disabled employees
Percentage of foreign employees (unit: % and category)
√ √ √
5. Human Development Index, food security and Gini
-Assess adult literacy levels in bioeconomy issues; living standards of people engaged in bioeconomy
Average life expectancy at birth, size of reduction in child mortality rates (under five years), improved maternal health care
Adult education and enrolment at primary, secondary and tertiary levels,
Percentage of people making a decent living; Purchasing Power Parity (PPP) and inflation rates
√ √ √
6. Institutional processes/ representation/ voice
Good governance on different issues linked to the bioeconomy
Proportion in relevant decision-making bodies (identify relevant decision-making bodies)
Proportion included in environmental and social impact assessment (ESIA)
√ √ √
7. Land use and rights Land use/land use change land ownership/tenure rights if agriculture or forestry sector involved directly (first generation) in bioeconomy
Proportion with tenure rights (formal/customary) to land, forest, water, animals (ownership, inheritance, sale)
Proportion with lease rights/contract farming
Proportion landless
Proportion lost land
√ √ √

Visit us
sei.org
@SEIresearch @SEIclimate
SEI Headquarters Linnégatan 87D Box 24218
104 51 Stockholm Sweden
Tel: +46 8 30 80 44
Måns Nilsson
Executive Director
SEI AfricaWorld Agroforestry Centre
United Nations Avenue
Gigiri P.O. Box 30677
Nairobi 00100 Kenya
Tel: +254 20 722 4886
Philip Osano
Centre Director
SEI Asia10th Floor, Kasem Uttayanin Building,
254 Chulalongkorn University,
Henri Dunant Road, Pathumwan, Bangkok,
10330 Thailand
Tel: +66 2 251 4415
Niall O’Connor
Centre Director
SEI TallinnArsenal Centre
Erika 14, 10416
Tallinn, Estonia
Lauri Tammiste
Centre Director
SEI OxfordFlorence House 29 Grove Street
Summertown Oxford
OX2 7JT UK
Tel: +44 1865 42 6316
Ruth Butterfield
Centre Director
SEI US Main Office11 Curtis Avenue
Somerville MA 02144-1224 USA
Tel: +1 617 627 3786
Michael Lazarus
Centre Director
SEI US Davis Office400 F Street
Davis CA 95616 USA
Tel: +1 530 753 3035
SEI US Seattle Office1402 Third Avenue Suite 900
Seattle WA 98101 USA
Tel: +1 206 547 4000
SEI YorkUniversity of York
Heslington York
YO10 5DD UK
Tel: +44 1904 32 2897
Chris West
Acting Centre Director
SEI Latin AmericaCalle 71 # 11–10
Oficina 801
Bogota Colombia
Tel: +57 1 6355319
David Purkey
Centre Director