Embed Size (px)
Citation preview

BIOE 301
Lecture Two

Review of Lecture 1
Course organization Course goals Four questions we will answer Technology assessment – The big
picture What is health? Role of WHO Health data and uses

Technology Assessment Biological Plausibility
Does the biology support the technology? Technical Feasibility
Safely and reliably deliver technology to patients? Clinical Trials
Sensitivity & specificity in a relevant population? Disease-free survival & 5-year survival in a relevant
population? Patient Outcomes
Does the technology improve the patient’s health? Societal Outcomes
Cost and ethical implications of the technology?
Littenberg B. Technology Assessment in Medicine. Academic Med 67:424, 1992

Uses of Technology Assessment
Consensus guidelines Policy decisions about use of technology Based on review of data, group judgment
US Preventive Services Taskforce Guide to Clinical Preventive Services HIV Screening
Periodic screening is recommended for all persons at increased risk of infection, for all pregnant women at risk for infection, and for infants born to high risk women. All patients should be counseled about effective means to avoid HIV infection.

Use of Technology Assessment
IOM Review of Health Care Quality in US Only 55% of patients in US receive care
consistent with consensus guidelines 18,000 Americans die each year from heart
attacks because they did not receive preventive medicines, even though they should have.
More Americans are killed every year as s result of medical errors than by breast cancer, AIDS, and motor vehicle accidents.
Delay between discovery of new technologies and widespread use averages:
17 years

Overview of Lecture 2
Health data and uses What are the major health problems
worldwide? Ages 0-4
A Tale of Two Girls

Health Data
Incidence Rate Prevalence Rate Mortality Rate Infant Mortality Rate Relative Risk DALY
Disability adjusted life year Measures years of disability free life lost
when a person contracts a disease. Combines mortality and morbidity.

DALY
Examples: Stroke: 6 DALYs Car accidents: 9 DALYs Self inflicted injuries: 17 DALYs Violence: 9 DALYs Lower respiratory infections: 1 DALY HIV: 28 DALYs

Life Expectancy at Birth (2000)

Infant Mortality Rate (2002)

Gross National Income per Capita at PPP (2001)

Access to Safe Water (2000)

Internet Users (2002)

Economic Data
Per capita GDP Per capita health spending Purchasing power parity
Take into account true costs of goods and services
How much does a loaf of bread cost? Human Development Index
Average achievements in health, education and income.

HDI
Green = High developmentYellow & Orange = Medium development
Red: Low Development


One View of The World Developed Countries Developing Countries
There is no universally accepted definition of what a developing country is
Usually categorized by a per capita income criterion
Low income developing countries: <$400 Middle income developing countries: $400-
$4,000 WTO members decide for themselves if
they are a developing country; brings certain rights

UN: Least Developed Countries
In 1971, UN created a least developed country member category Countries apply for this status Low national income (<$900 per capita
GDP) Low levels of human capital development Economic vulnerability Originally 25 LDCs
As of 2005, 637 million people live in world’s 49 least developed countries
Population growth in LDCs expected to triple by 2050

Map of LDCs
Health and Other Data in LDCs
Average per capita GDP: LDCs: $235 All other developed countries: $24,522
Average life expectancy: LDCs: 51 years Botswana – expected to be only 27 years by 2010 Industrialized nations: 78 years
1 child in 10 dies before his or her 1st bday in LDCs
40% of all children under 5 are underweight or suffering from stunted growth in LDCs
Half the population in LDCs is illiterate

Health and Other Data in LDCs
Mortality rate for children under five: LDCs: 151/1,000 live births High income countries: 6/1,000 live births
Average annual health care expenditures: LDCs: $16/person High income countries: $1,800/person
A child born today in an LDC is more than 1,000 times more likely to die of measles than one born in an industrialized country.

2
Group 1 = communicable diseases, maternal/perinatal conditions, nutritional deficienciesGroup 2 = Non-communicable diseases (cardiovascular, cancer, mental disorders)Group 3 = Injuries
Developed Countries
6.4%
85.8%
7.8%
Group 1 Group 2 Group 3
Developing Countries
40.1%
50.4%
9.5%
Group 1 Group 2 Group 3
2002

Ratio of Mortality Rate
0.0
1.0
2.0
3.0
4.0
5.0
6.0
7.0
0-4 5-14 15-29 30-44 45-59 60-69 70-79 80+
Age Group
Mo
rtal
ity
Rat
e in
Dev
elo
pin
g C
ou
ntr
ies
/ M
ort
alit
y R
ate
in D
evel
op
ed C
ou
ntr
ies

Child Mortality 10 million children under the age of 5 die
every year 98% of these deaths occur in developing countries Number of children who die each year in developing
countries is more than two times the number of children born each year in the US and Canada
2/3 of deaths could be prevented today with available technology feasible for low income countries
40% of deaths in this age group occur in first month of life (neonatal period)
25% of deaths occur in childbirth and first week of life (perinatal period)
Leading causes of mortality: ages 0-4
Developing world1. Perinatal conditions2. Lower respiratory infections3. Diarrheal diseases4. Malaria
Developed world1. Perinatal conditions2. Congenital anomalies3. Lower respiratory infections4. Unintentional injuries

Perinatal Conditions
2.5 million children each year die in perinatal period
>500,000 women die from complications due to childbirth
Most perinatal deaths are a result of inadequate access to healthcare Low birth weight Birth asphyxia Birth trauma Acquire infections during childbirth

Perinatal Conditions
Birth Asphyxia Baby does not breathe at birth Umbilical cord wrapped around baby’s
neck Birth Trauma
Mechanical forces in obstructed labor prevent descent through birth canal
Can result in intracranial hemmorhage, blunt trauma to internal organs, injury to spinal cord

Perinatal Conditions Strongly related to conditions during
childbirth
No good screening tests to indicate who will need emergency care

Perinatal Conditions Infections acquired during exposure in
maternal genital tract Infections of the umbilical cord Many cultures:
Don’t celebrate child’s birth until after first weeks of life
Mother and child isolated during this period Can reduce incidence of infection Can result in delays in seeking healthcare

Simple Technologies
Partograph
PATH Delivery Kit

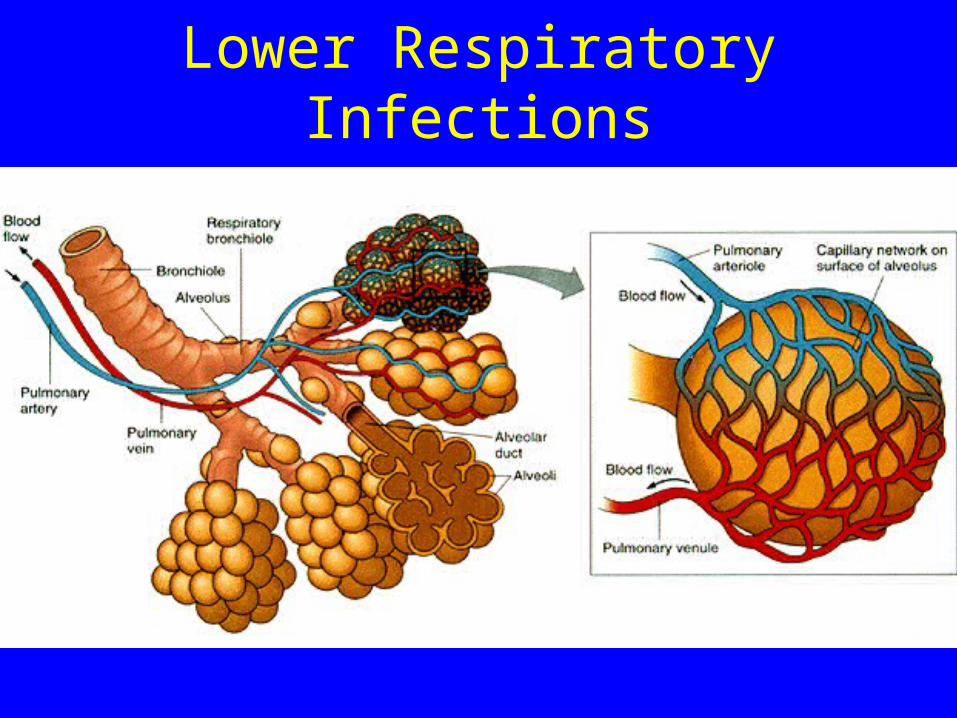
Lower Respiratory Infections
One million children each year die from lower respiratory tract infections, mostly pneumonia
Pneumonia: Infection of the lungs Multiple organisms cause pneumonia Newborns: acquire from maternal
genital tract Older children: acquire from community Can interfere with ability to oxygenate
blood in lungs
Lower Respiratory Infections

Pneumonia
Symptoms: Fever, cough, chest pain, breathlessness Can be fatal
Until 1936, was leading cause of death in US
Can be cured with antibiotics

Causes of Pneumonia Bacterial Infection
Causes about ½ of all cases Streptococcus pneumoniae, Haemophilus
influenzae, Staphylococcus aureus and pertussis Treated with antibiotics
Viral Infection Causes about ½ of all cases Respiratory syncytial virus (RSV), influenza
virus, parainfluenza virus and measles. SARS is an emerging cause of pneumonia Usually resolve on their own Serious cases: Use oxygen and antiviral drugs

Diagnosis of Pneumonia Chest X-ray Viral vs. Bacterial:
Complete blood count Sputum Fluid from lungs
Developing Countries: Treat all pneumonias in
children with antibiotics Has reduced mortality May encourage
antibiotic resistance

Direct Fluorescence Assay
Collect nasal secretions Spin down cells Place cells on slide Immerse in alcohol Apply solution containing antibodies
which bind to viruses Antibodies are coupled to fluorescent
dye Examine with fluorescence microscope

Diarrheal Disease
Serious gastrointestinal disease, with frequent, watery stools
Caused by viral or bacterial infection of the GI tract Bacteria: Escherichia coli, Vibrio
cholerae Viral: Rotavirus
Less common in neonates Frequently related in unsafe drinking
water

Diarrheal Disease
Can rapidly lead to death due to dehydration
How does this happen? Ordinary digestion:
Food mixed with water in stomach 98% of water is reabsorbed as mixture
passes through colon Infection interferes with fluid
reabsorption Loss of 10% of bodily fluids death

Oral Rehydration Therapy
1 liter of water, 1 teaspoon of salt, 8 teaspoons of sugar
Reduced mortality to diarrhea from 4.6 million deaths per year to 1.8 million deaths per year in 2000
Developed in 1960s “Most significant medical advance of
the century.” The Lancet, 1978

How Does ORT Work?
Epithelial cells which line colon are responsible for fluid reabsorption They reabsorb osmotically active
products of digestion, sodium Water follows
Toxins produced by bacteria bind to epithelial cells in gut and cause cells to secrete chloride and interfere with ability to absorb sodium watery diarrhea

How Does ORT Work?
What if you give patients more water to drink? Just get more diarrhea
Discovery in 1950s: New method of sodium transport which
depends on glucose, not affected by bacteria which produce diarrhea
Theorize: Provide glucose can increase sodium
transport

Oral Rehydration Therapy
1975 WHO and UNICEF: 90 mM sodium 20 mM potassium 80 mM chloride 30 mM bicarbonate 111 mM glucose
Packet of ORT: 10 cents US use of ORT

Vaccines to Prevent Diarrhea
Rotavirus causes 30% of deaths due to diarrheal disease
Found in every country, Highly contagious
Almost every child will have one rotavirus infection before they are 3 years old
Vaccine developed 80%-100% effective FDA approved in 1998 Post-licensure surveillance 1/12,000 fatal complication rate

Malaria
Spread by mosquitos which carry a parasite
40% of world’s population live in malaria endemic countries
300 million cases of malaria per year African children: 1.6-5.4
episodes/year 1 million children under the age of 5
die each year from malaria

Malaria Incidence Rates

Malaria Mosquitos transit parasite to humans Parasites evade human immune
system Travel to liver and multiply Then attach to red blood cells,
consume hemoglobin Symptoms:
Fever, headache, vomiting, severe anemia Can produce cerebral malaria
Permanent neurologic damage

Insecticide Treated Nets Pregnant women:
Increased susceptibility to malaria Anemia can result in low birth weight
babies Pregnant women and babies should
sleep under insecticide treated nets 25% reduction in low birth weight babies 20% reduction in infant deaths Cost:
$1.70 Retreatment: 3-6 cents

Congenital Anomalies
2-3% of children are born with a birth defect
400,000 children die each year as a result
Accounts for a higher fraction of childhood deaths in developed countries (16.9%) than in developing countries (4%)

Causes of Congenital Anomalies
Cause Classification Example
Genetic Chromosomal Down syndrome
Single gene Cystic fibrosis
Environmental Infectious disease Congenital rubella syndrome
Maternal nutritional deficiency—folic acid
Neural tube defects
Complex Congenital malformations involving
single organ system
Congenital heart disease

Unintentional Injuries
Result in the deaths of: 15,000 children per year in developed
countries (4th leading cause of death) 273,000 children per year in developing
countries (9th leading cause of death) Causes:
Drownings (82,000 deaths) Road traffic injuries (58,000 deaths)
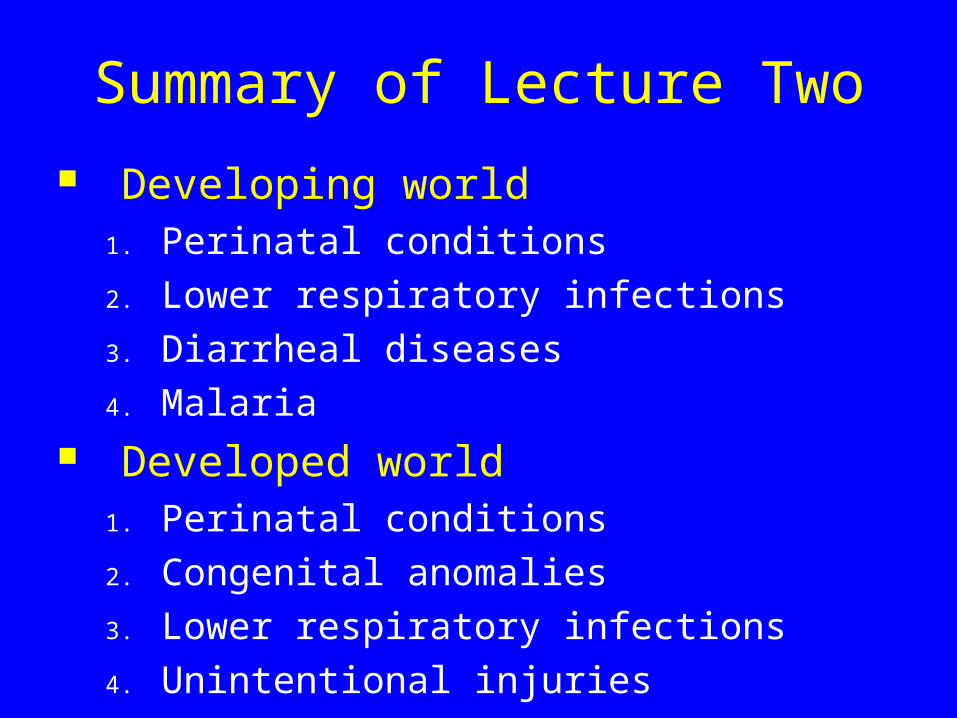
Summary of Lecture Two
Developing world1. Perinatal conditions2. Lower respiratory infections3. Diarrheal diseases4. Malaria
Developed world1. Perinatal conditions2. Congenital anomalies3. Lower respiratory infections4. Unintentional injuries

Assignments Due Next Time
HW2