Embed Size (px)
Citation preview
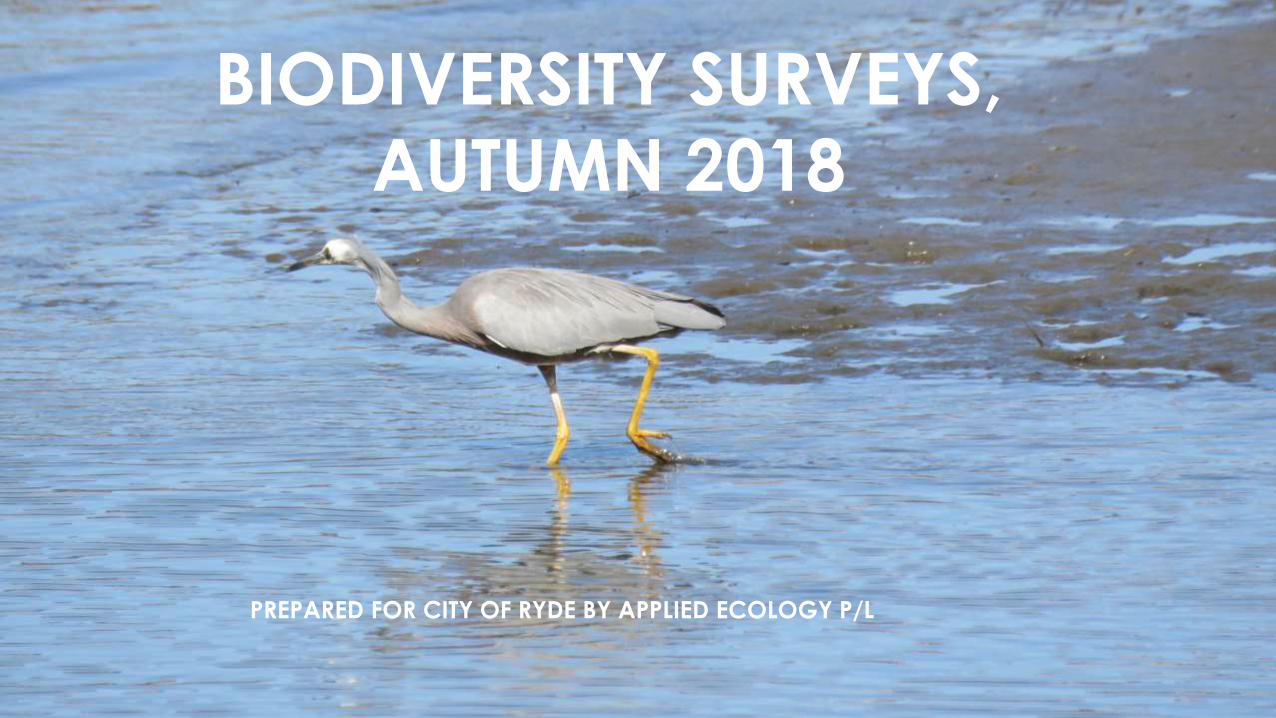
BIODIVERSITY SURVEYS,
AUTUMN 2018
PREPARED FOR CITY OF RYDE BY APPLIED ECOLOGY P/L

INTRODUCTION Presented by Anne Carey and Dr Meredith
Brainwood, Applied Ecology P/L
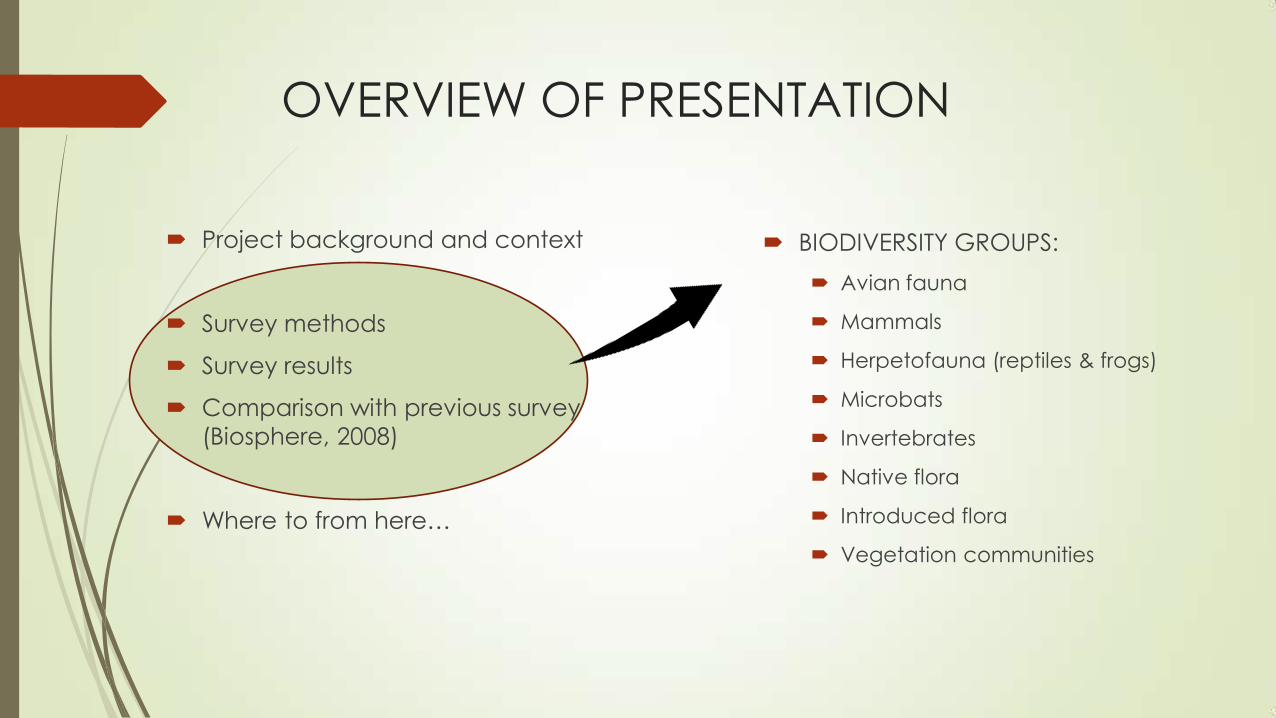
OVERVIEW OF PRESENTATION
Project background and context
Survey methods
Survey results
Comparison with previous survey
(Biosphere, 2008)
Where to from here…
BIODIVERSITY GROUPS:
Avian fauna
Mammals
Herpetofauna (reptiles & frogs)
Microbats
Invertebrates
Native flora
Introduced flora
Vegetation communities
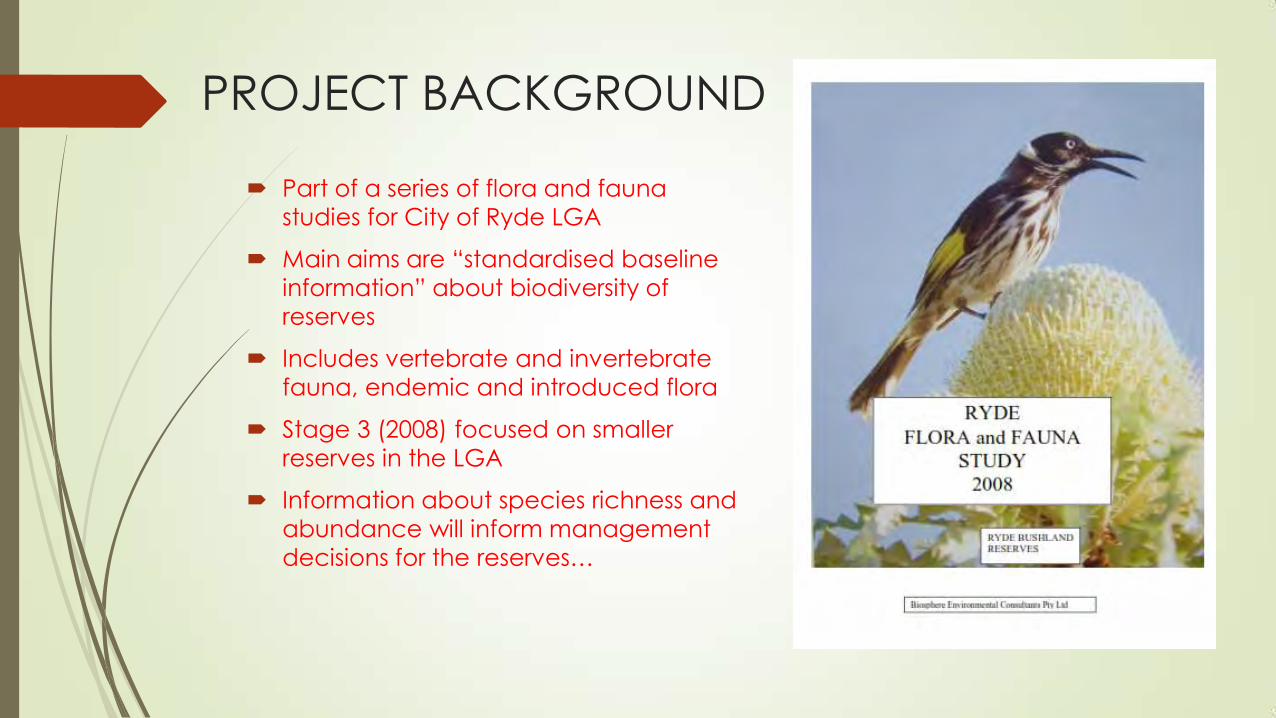
PROJECT BACKGROUND
Part of a series of flora and fauna
studies for City of Ryde LGA
Main aims are “standardised baseline
information” about biodiversity of
reserves
Includes vertebrate and invertebrate
fauna, endemic and introduced flora
Stage 3 (2008) focused on smaller
reserves in the LGA
Information about species richness and
abundance will inform management
decisions for the reserves…
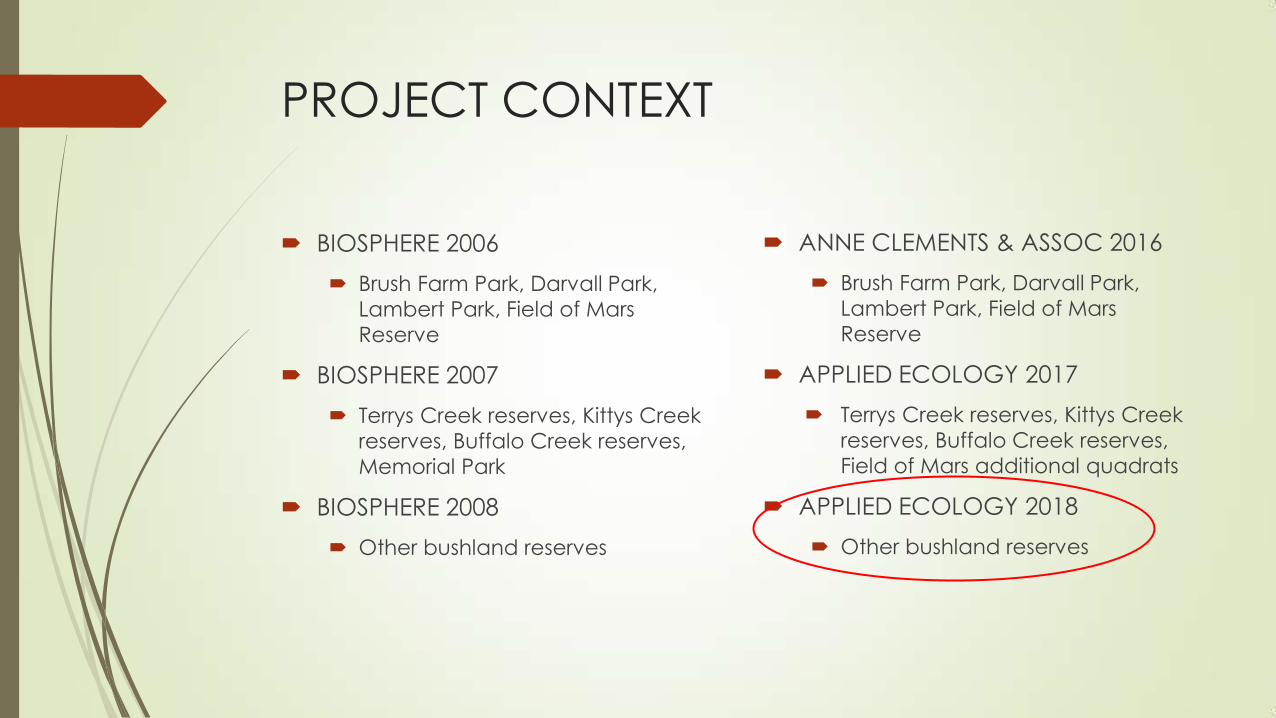
PROJECT CONTEXT
BIOSPHERE 2006
Brush Farm Park, Darvall Park,
Lambert Park, Field of Mars
Reserve
BIOSPHERE 2007
Terrys Creek reserves, Kittys Creek
reserves, Buffalo Creek reserves,
Memorial Park
BIOSPHERE 2008
Other bushland reserves
ANNE CLEMENTS & ASSOC 2016
Brush Farm Park, Darvall Park,
Lambert Park, Field of Mars
Reserve
APPLIED ECOLOGY 2017
Terrys Creek reserves, Kittys Creek
reserves, Buffalo Creek reserves,
Field of Mars additional quadrats
APPLIED ECOLOGY 2018
Other bushland reserves
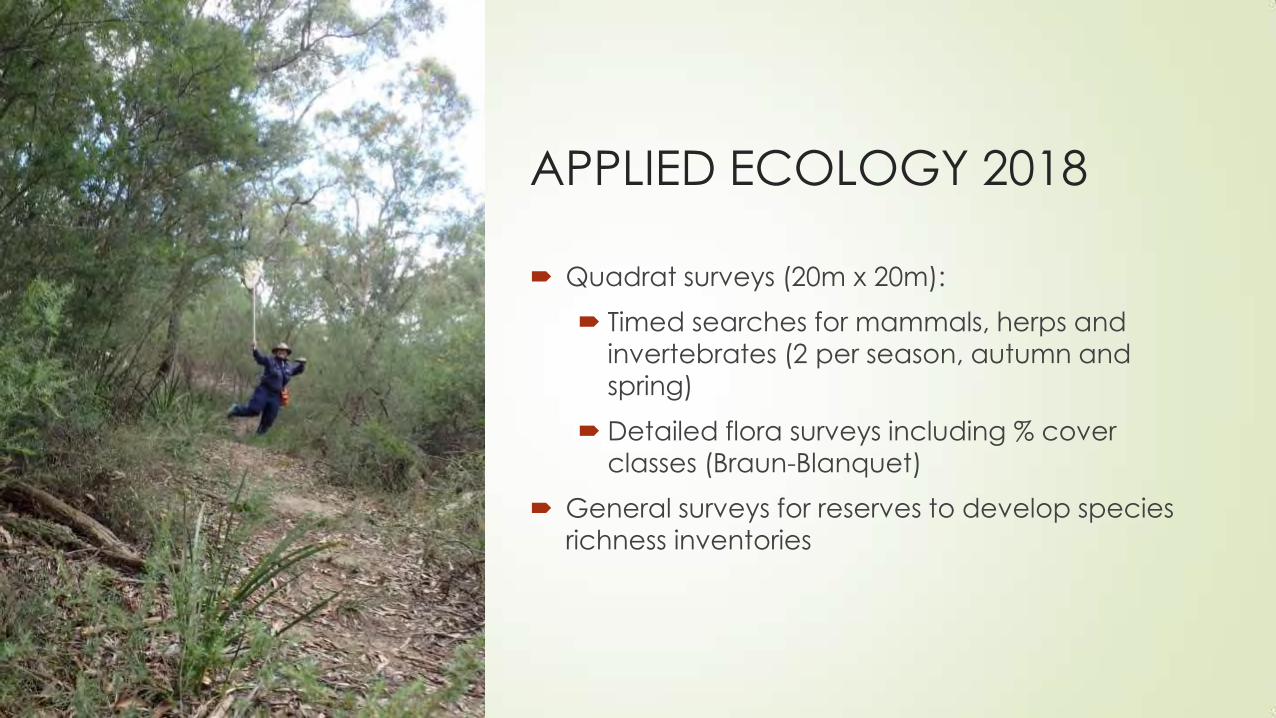
APPLIED ECOLOGY 2018
Quadrat surveys (20m x 20m):
Timed searches for mammals, herps and
invertebrates (2 per season, autumn and spring)
Detailed flora surveys including % cover
classes (Braun-Blanquet)
General surveys for reserves to develop species richness inventories
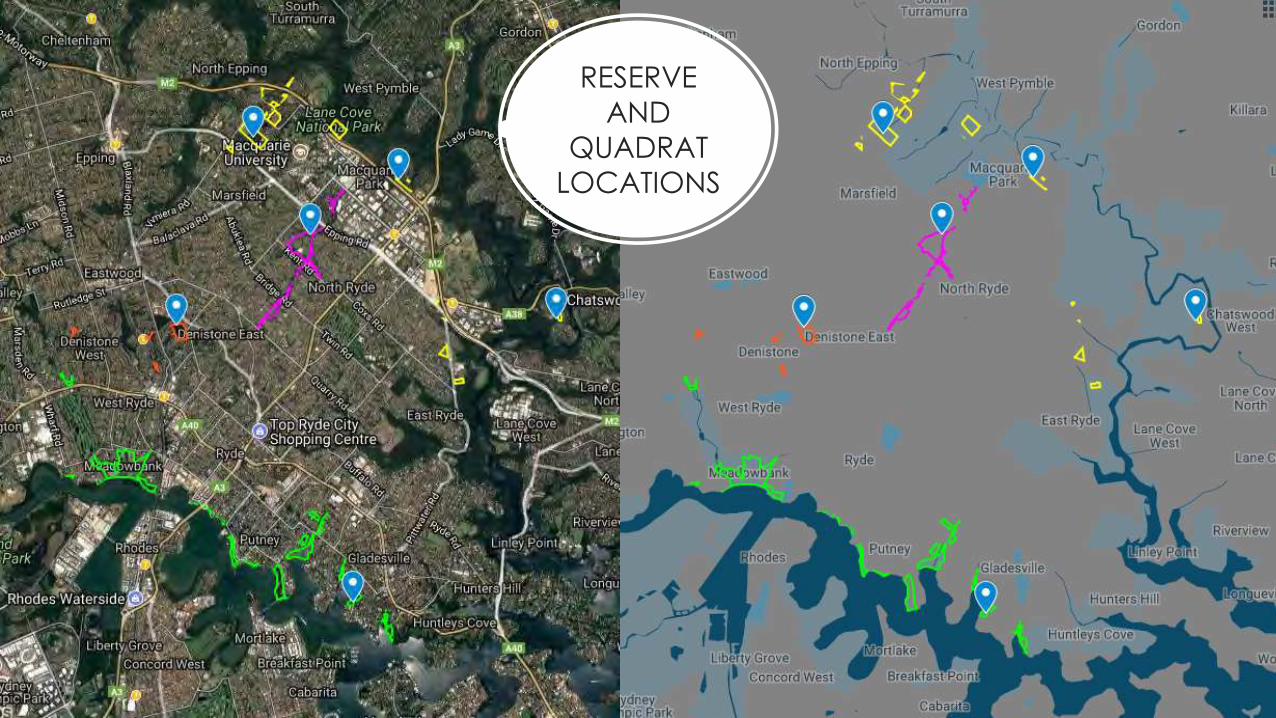
RESERVE
AND
QUADRAT
LOCATIONS
SURVEY METHODOLOGIES BASED ON METHODS DESCRIBED BY BIOSPHERE 2006-2008
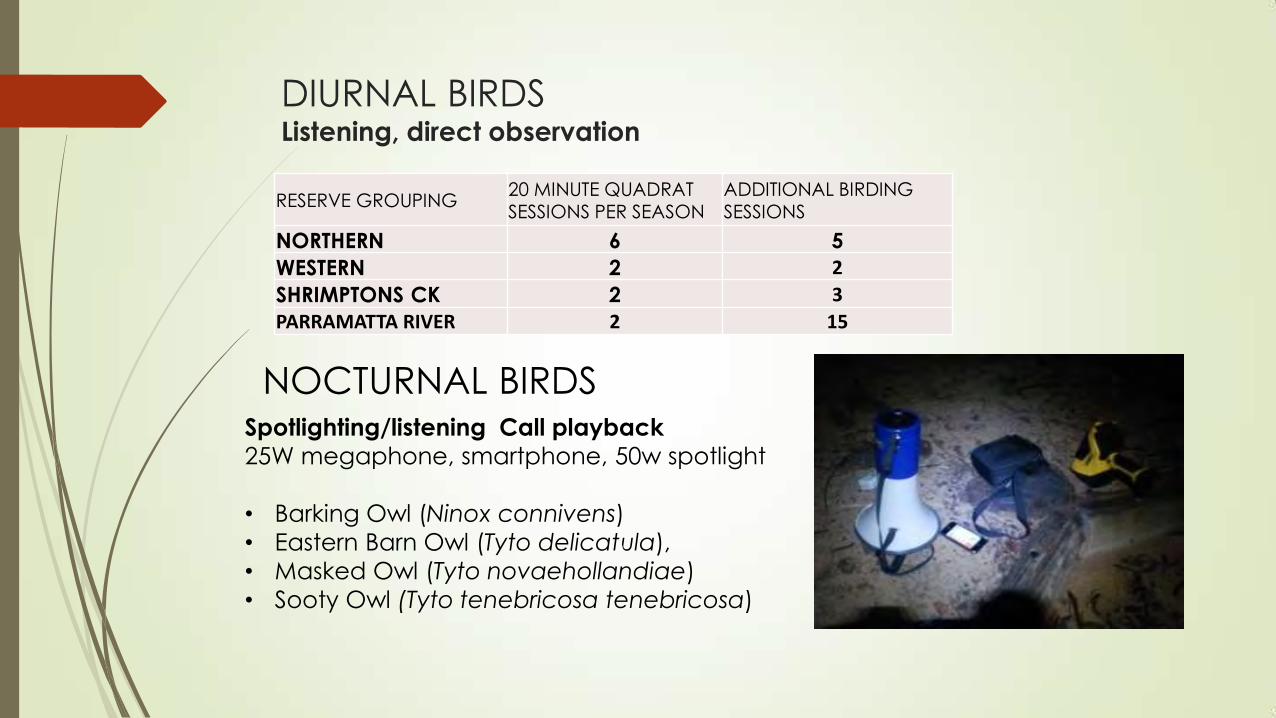
DIURNAL BIRDS Listening, direct observation
NOCTURNAL BIRDS Spotlighting/listening Call playback
25W megaphone, smartphone, 50w spotlight
• Barking Owl (Ninox connivens)
• Eastern Barn Owl (Tyto delicatula),
• Masked Owl (Tyto novaehollandiae)
• Sooty Owl (Tyto tenebricosa tenebricosa)
RESERVE GROUPING 20 MINUTE QUADRAT SESSIONS PER SEASON
ADDITIONAL BIRDING SESSIONS
NORTHERN 6 5
WESTERN 2 2
SHRIMPTONS CK 2 3
PARRAMATTA RIVER 2 15
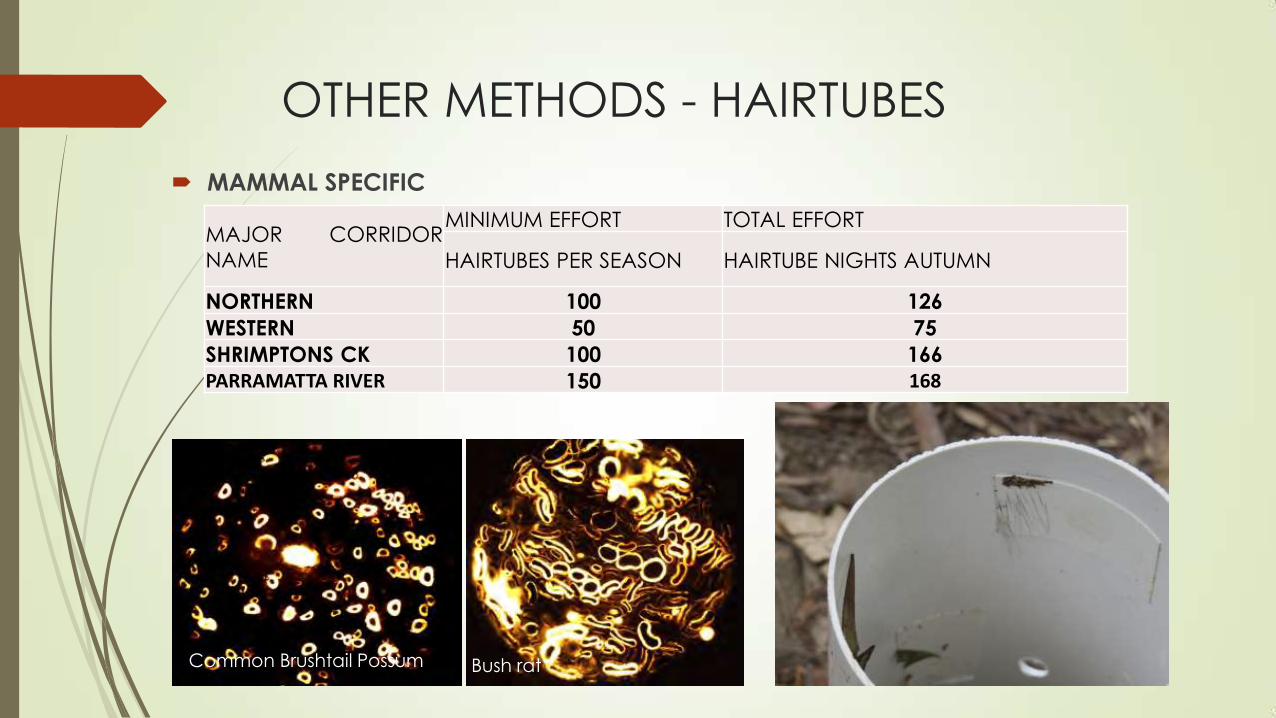
OTHER METHODS - HAIRTUBES
MAMMAL SPECIFIC
Common Brushtail Possum Bush rat
MAJOR CORRIDOR
NAME
MINIMUM EFFORT TOTAL EFFORT
HAIRTUBES PER SEASON HAIRTUBE NIGHTS AUTUMN
NORTHERN 100 126
WESTERN 50 75
SHRIMPTONS CK 100 166
PARRAMATTA RIVER 150 168
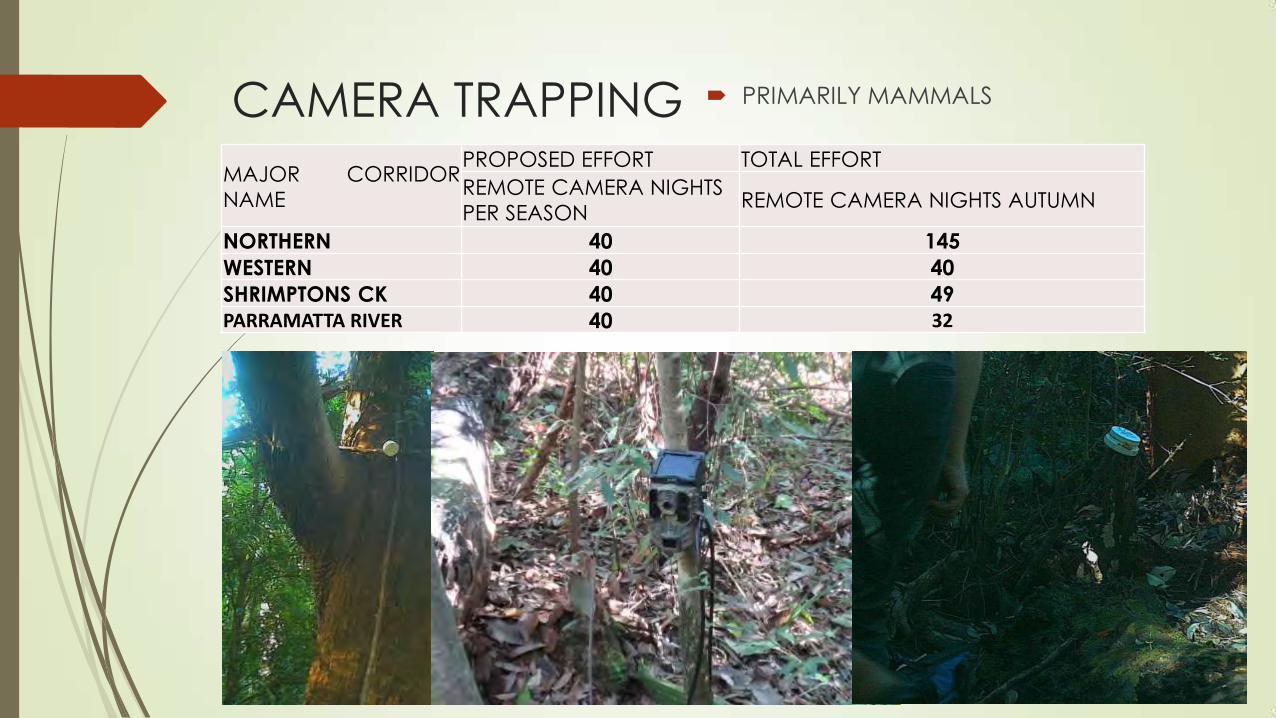
CAMERA TRAPPING PRIMARILY MAMMALS
MAJOR CORRIDOR
NAME
PROPOSED EFFORT TOTAL EFFORT
REMOTE CAMERA NIGHTS
PER SEASON REMOTE CAMERA NIGHTS AUTUMN
NORTHERN 40 145
WESTERN 40 40
SHRIMPTONS CK 40 49 PARRAMATTA RIVER 40 32
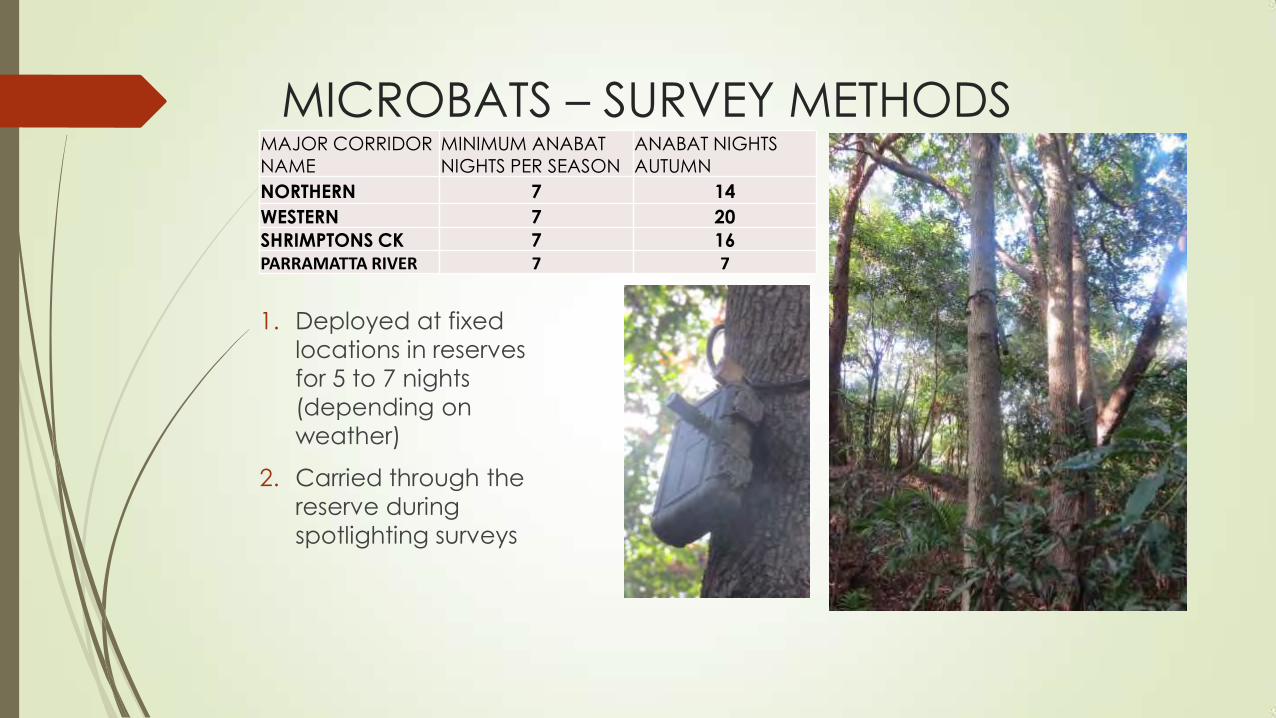
MICROBATS – SURVEY METHODS
1. Deployed at fixed
locations in reserves
for 5 to 7 nights
(depending on
weather)
2. Carried through the
reserve during
spotlighting surveys
MAJOR CORRIDOR NAME
MINIMUM ANABAT NIGHTS PER SEASON
ANABAT NIGHTS AUTUMN
NORTHERN 7 14
WESTERN 7 20
SHRIMPTONS CK 7 16 PARRAMATTA RIVER 7 7
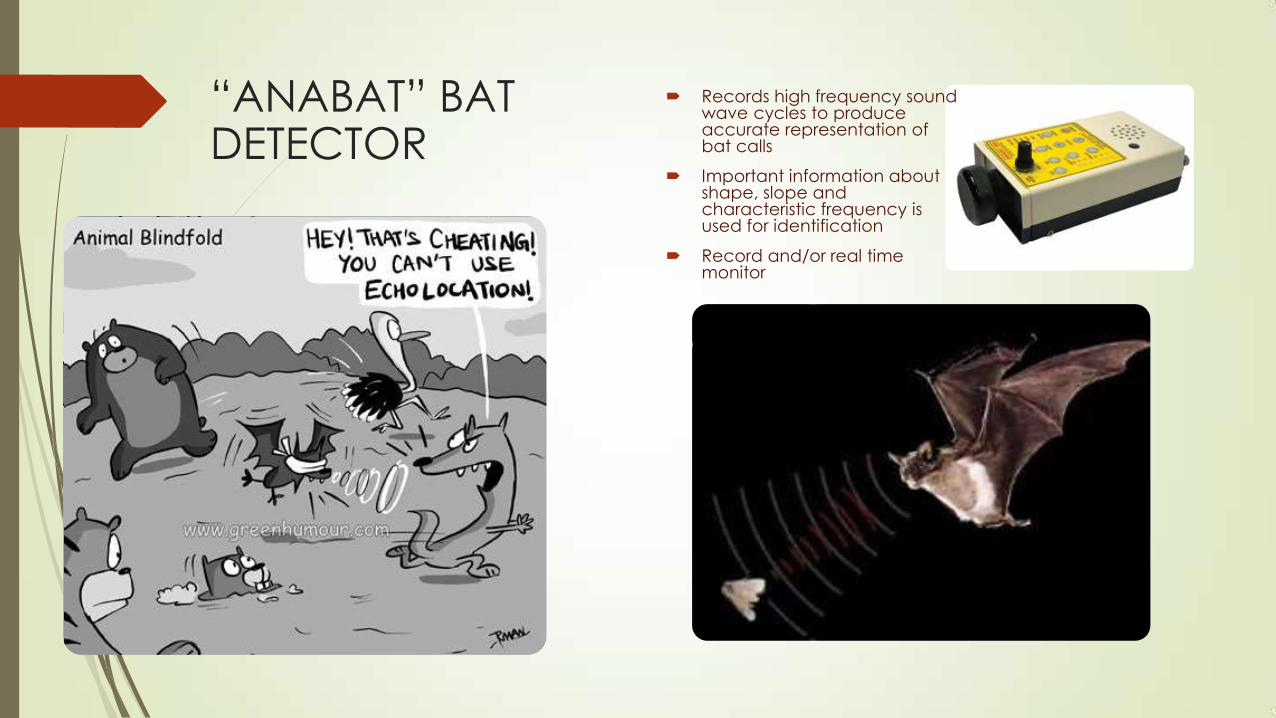
“ANABAT” BAT DETECTOR
Records high frequency sound wave cycles to produce accurate representation of bat calls
Important information about shape, slope and characteristic frequency is used for identification
Record and/or real time monitor
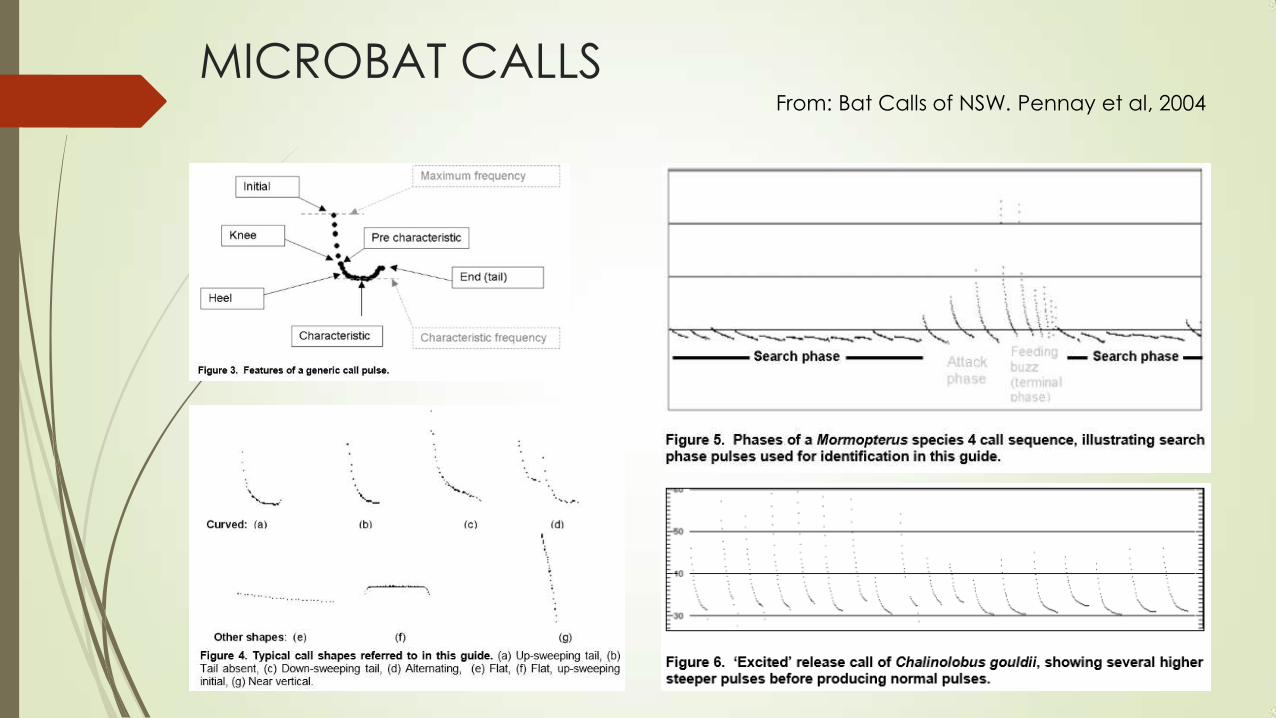
MICROBAT CALLS
From: Bat Calls of NSW. Pennay et al, 2004
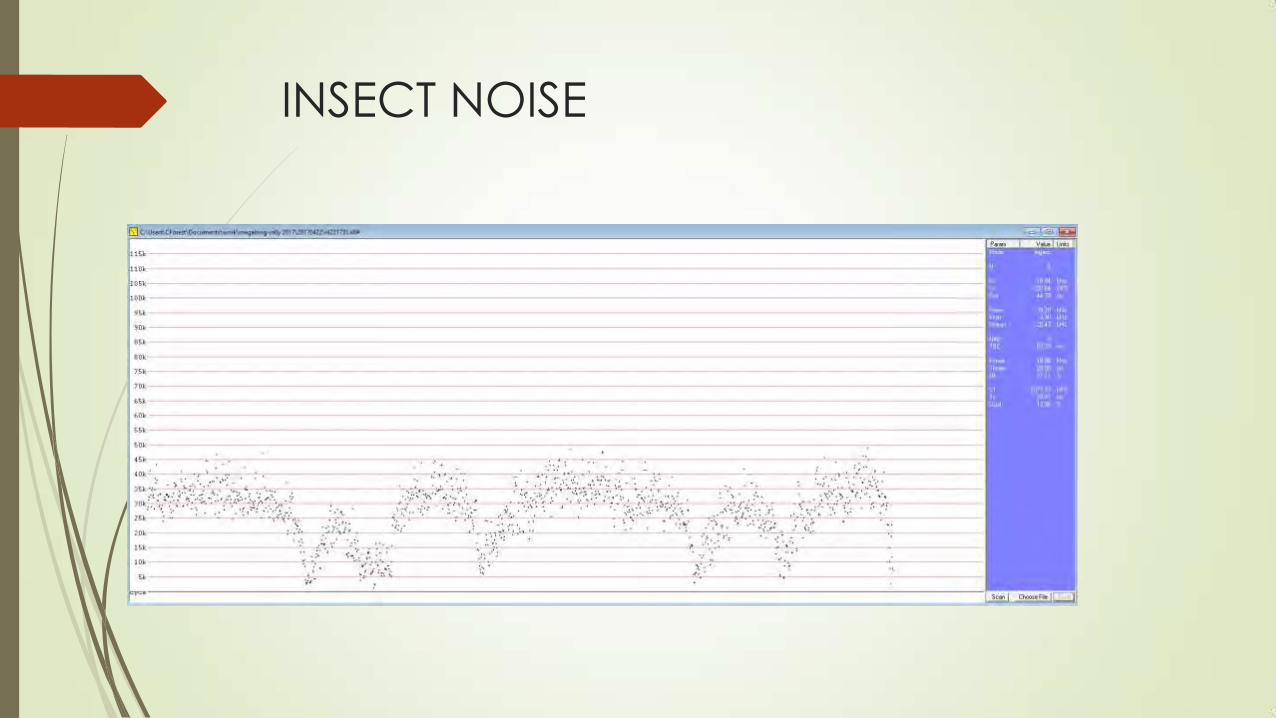
INSECT NOISE
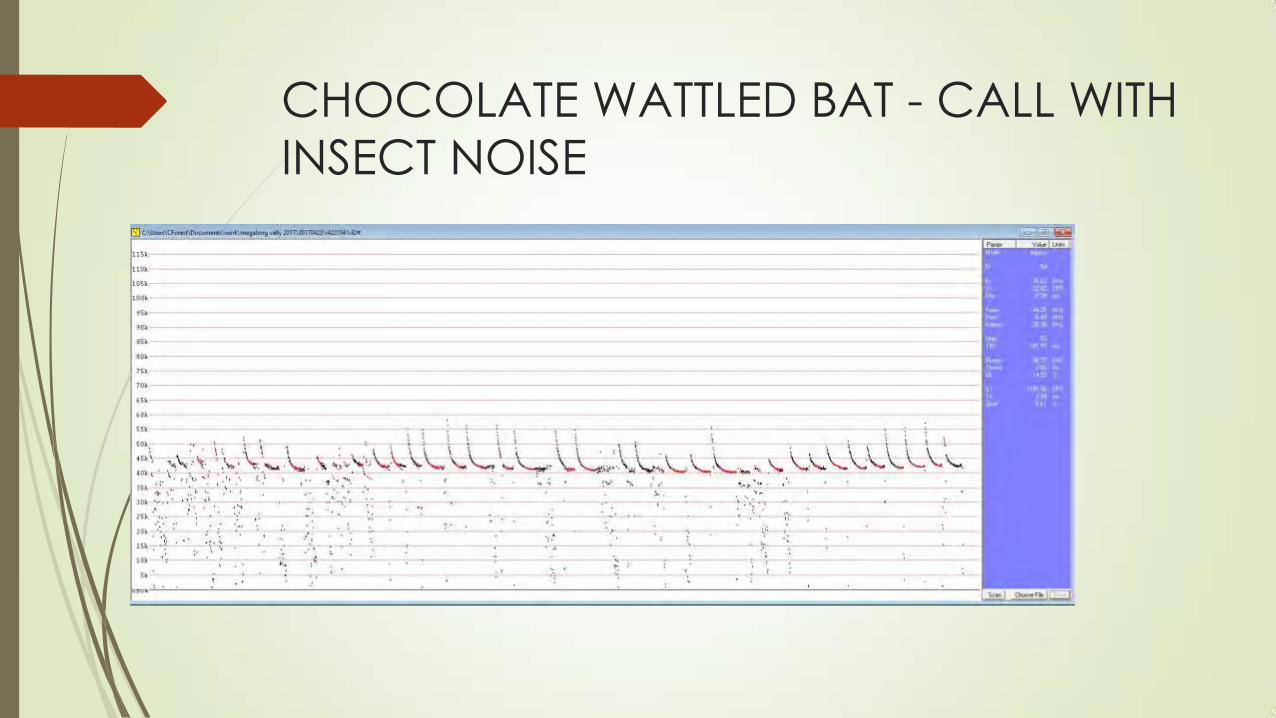
CHOCOLATE WATTLED BAT - CALL WITH
INSECT NOISE

REAL TIME CALL
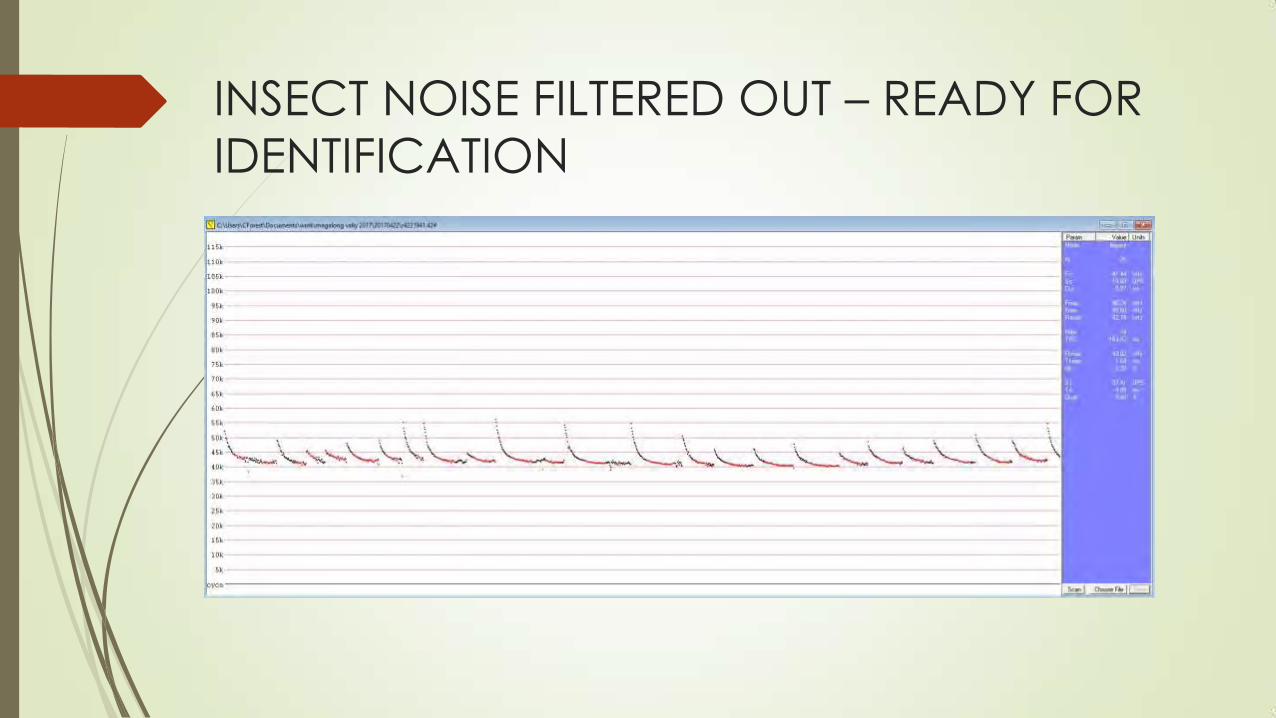
INSECT NOISE FILTERED OUT – READY FOR
IDENTIFICATION
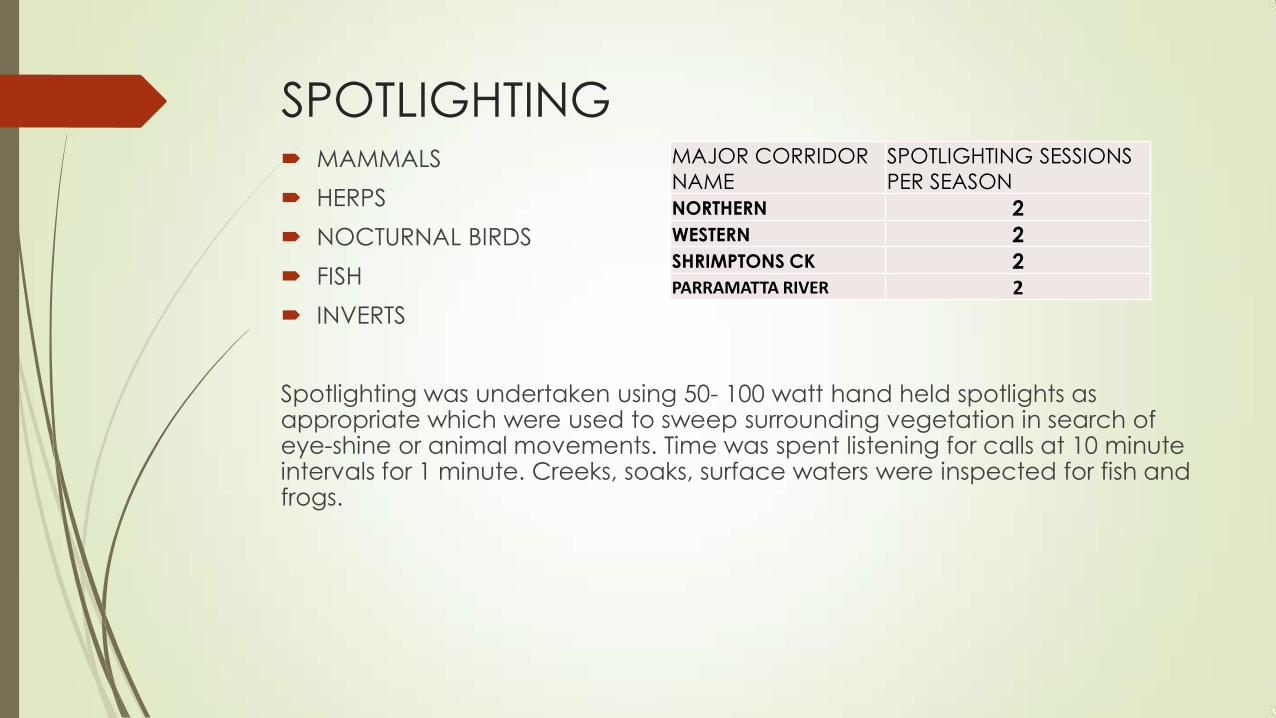
SPOTLIGHTING MAMMALS
HERPS
NOCTURNAL BIRDS
FISH
INVERTS
Spotlighting was undertaken using 50- 100 watt hand held spotlights as appropriate which were used to sweep surrounding vegetation in search of eye-shine or animal movements. Time was spent listening for calls at 10 minute intervals for 1 minute. Creeks, soaks, surface waters were inspected for fish and frogs.
MAJOR CORRIDOR
NAME SPOTLIGHTING SESSIONS
PER SEASON
NORTHERN 2
WESTERN 2 SHRIMPTONS CK 2 PARRAMATTA RIVER 2
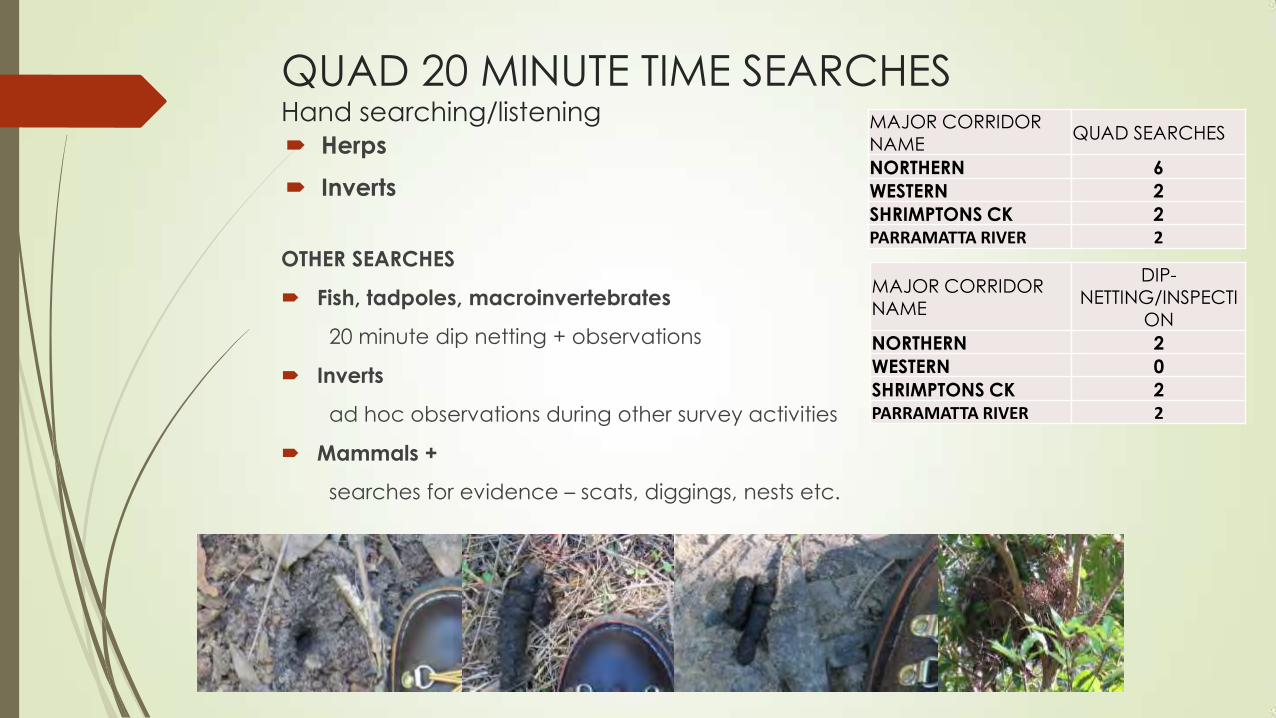
QUAD 20 MINUTE TIME SEARCHES Hand searching/listening
Herps
Inverts
MAJOR CORRIDOR NAME
QUAD SEARCHES
NORTHERN 6
WESTERN 2
SHRIMPTONS CK 2 PARRAMATTA RIVER 2
OTHER SEARCHES
Fish, tadpoles, macroinvertebrates
20 minute dip netting + observations
Inverts
ad hoc observations during other survey activities
Mammals +
searches for evidence – scats, diggings, nests etc.
MAJOR CORRIDOR NAME
DIP-NETTING/INSPECTI
ON
NORTHERN 2
WESTERN 0
SHRIMPTONS CK 2
PARRAMATTA RIVER 2
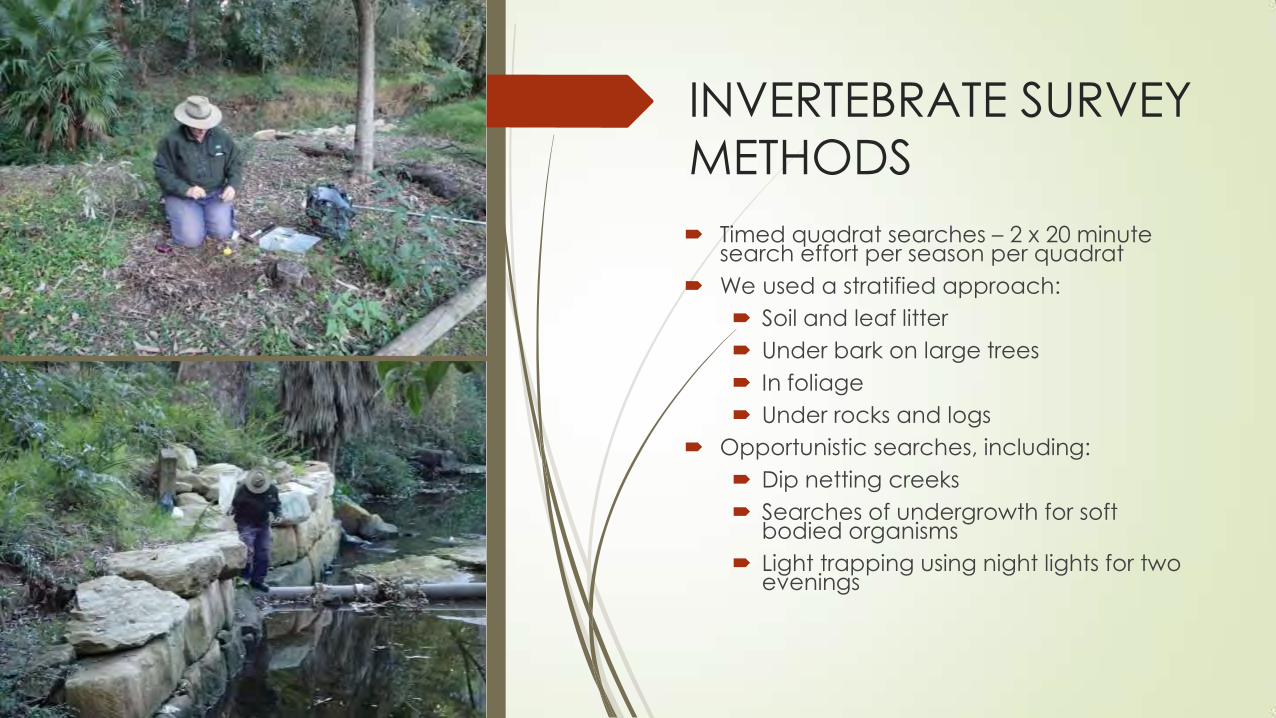
INVERTEBRATE SURVEY
METHODS
Timed quadrat searches – 2 x 20 minute search effort per season per quadrat
We used a stratified approach:
Soil and leaf litter
Under bark on large trees
In foliage
Under rocks and logs
Opportunistic searches, including:
Dip netting creeks
Searches of undergrowth for soft bodied organisms
Light trapping using night lights for two evenings
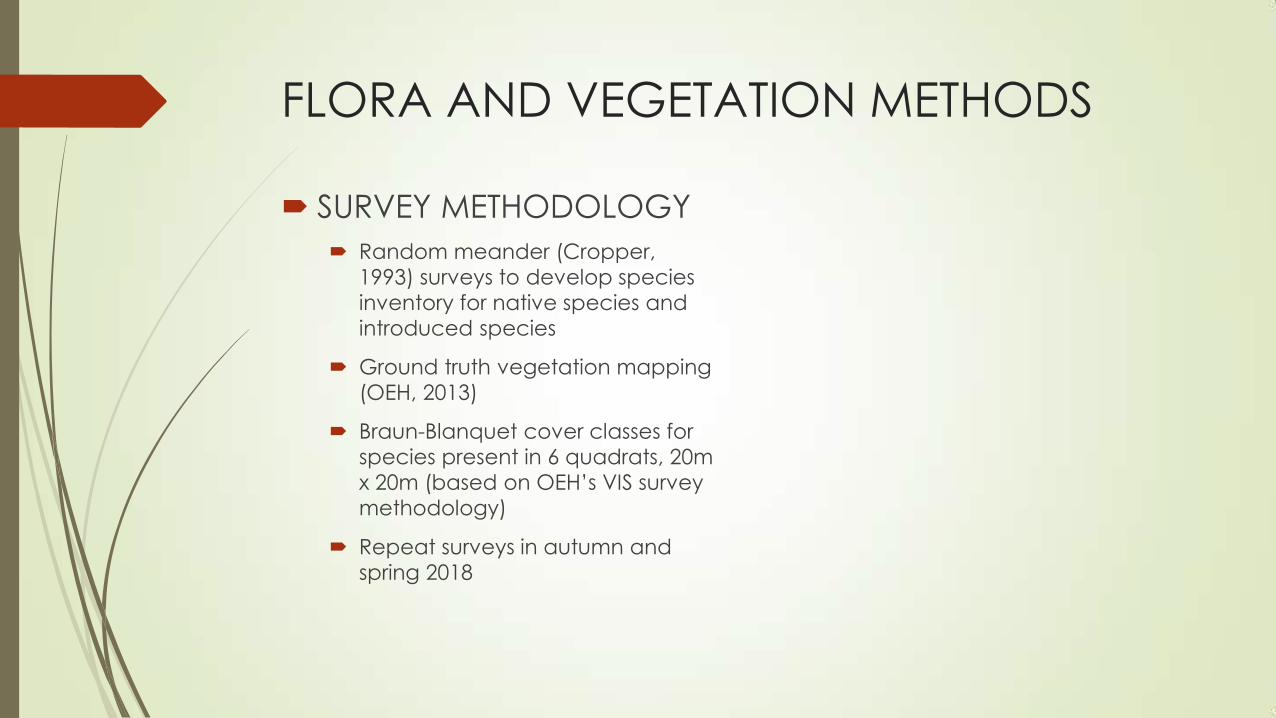
FLORA AND VEGETATION METHODS
SURVEY METHODOLOGY
Random meander (Cropper,
1993) surveys to develop species
inventory for native species and
introduced species
Ground truth vegetation mapping
(OEH, 2013)
Braun-Blanquet cover classes for
species present in 6 quadrats, 20m
x 20m (based on OEH’s VIS survey
methodology)
Repeat surveys in autumn and
spring 2018
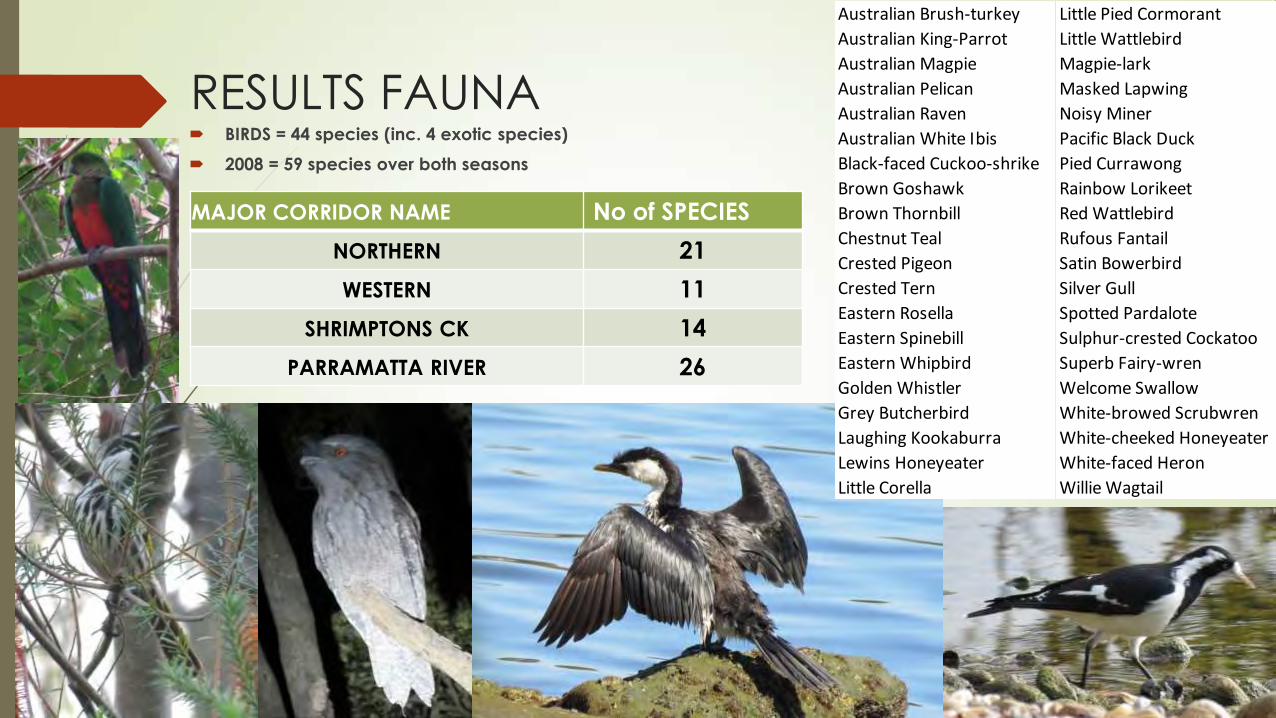
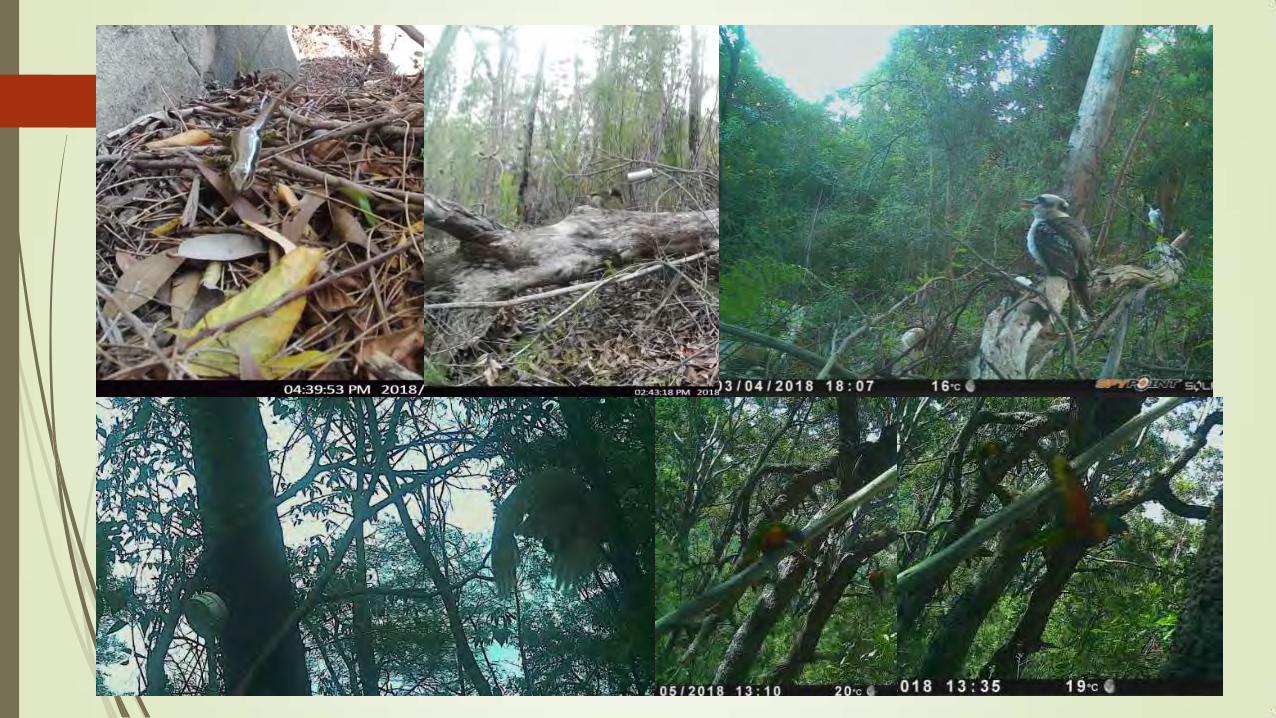
RESULTS FAUNA BIRDS = 44 species (inc. 4 exotic species)
2008 = 59 species over both seasons
MAJOR CORRIDOR NAME No of SPECIES
NORTHERN 21
WESTERN 11
SHRIMPTONS CK 14
PARRAMATTA RIVER 26
Australian Brush-turkey
Australian King-Parrot
Australian Magpie
Australian Pelican
Australian Raven
Australian White Ibis
Black-faced Cuckoo-shrike
Brown Goshawk
Brown Thornbill
Chestnut Teal
Crested Pigeon
Crested Tern
Eastern Rosella
Eastern Spinebill
Eastern Whipbird
Golden Whistler
Grey Butcherbird
Laughing Kookaburra
Lewins Honeyeater
Little Corella
Little Pied Cormorant
Little Wattlebird
Magpie-lark
Masked Lapwing
Noisy Miner
Pacific Black Duck
Pied Currawong
Rainbow Lorikeet
Red Wattlebird
Rufous Fantail
Satin Bowerbird
Silver Gull
Spotted Pardalote
Sulphur-crested Cockatoo
Superb Fairy-wren
Welcome Swallow
White-browed Scrubwren
White-cheeked Honeyeater
White-faced Heron
Willie Wagtail
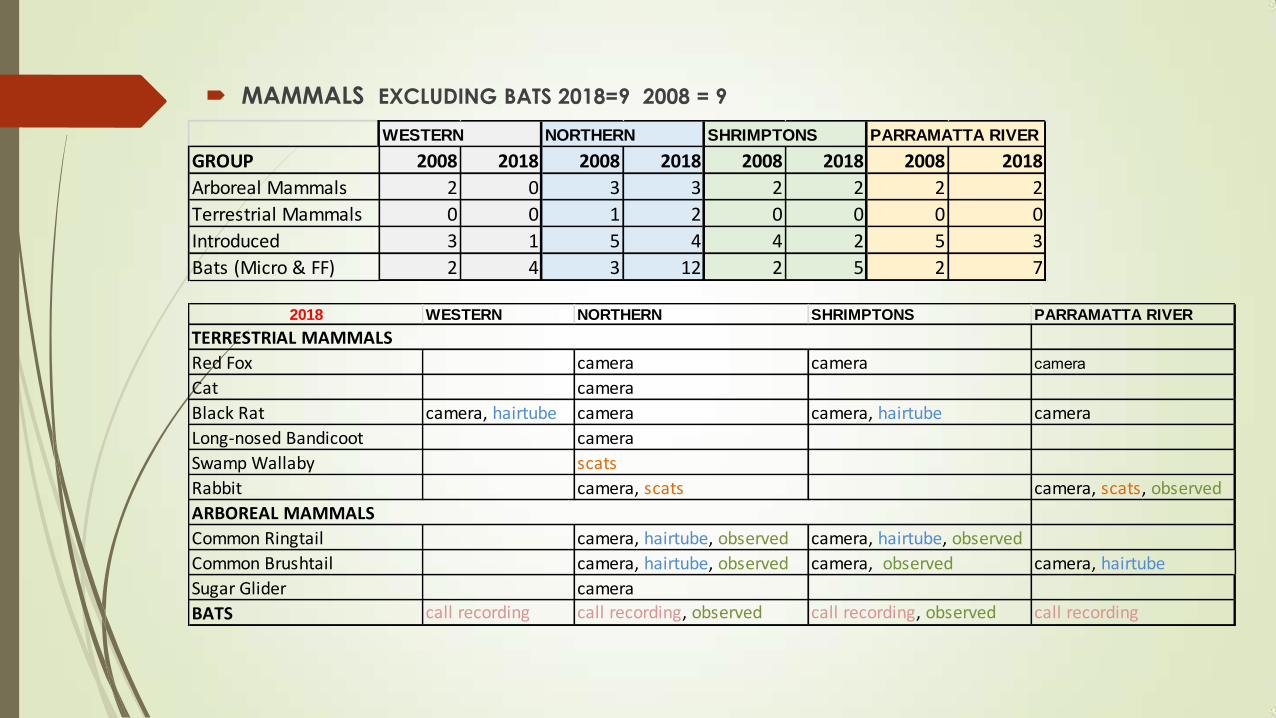
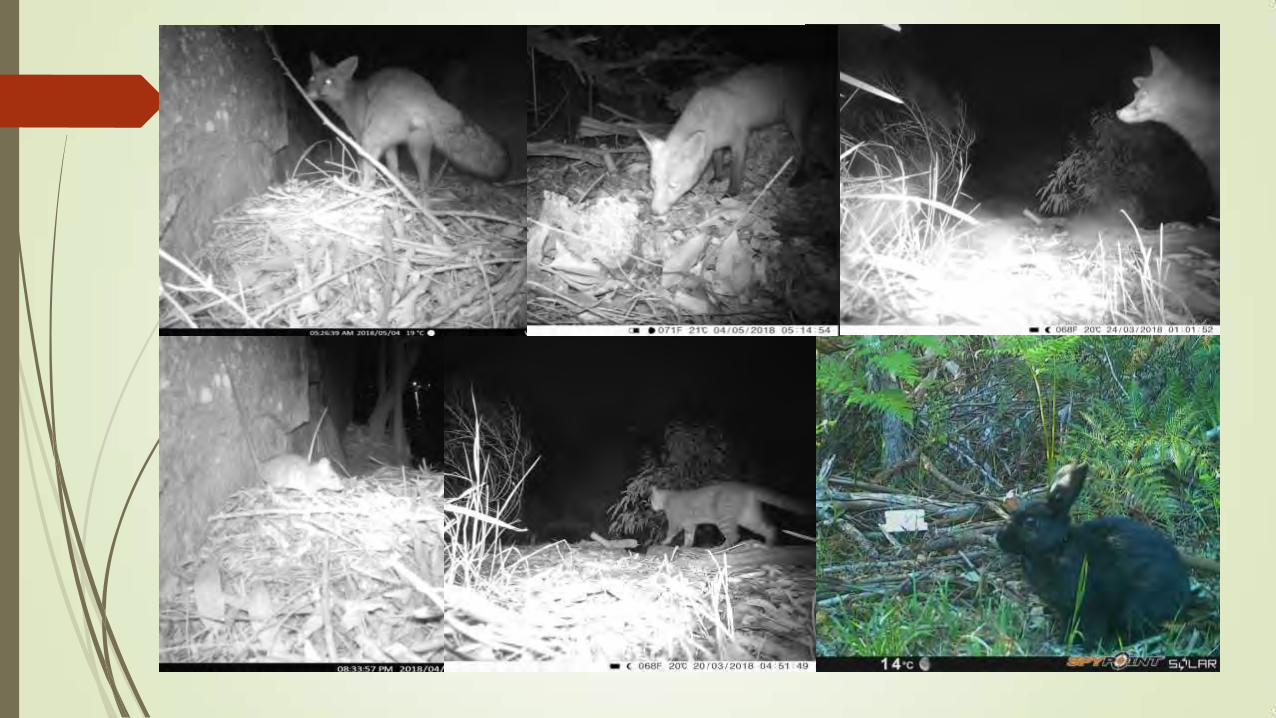
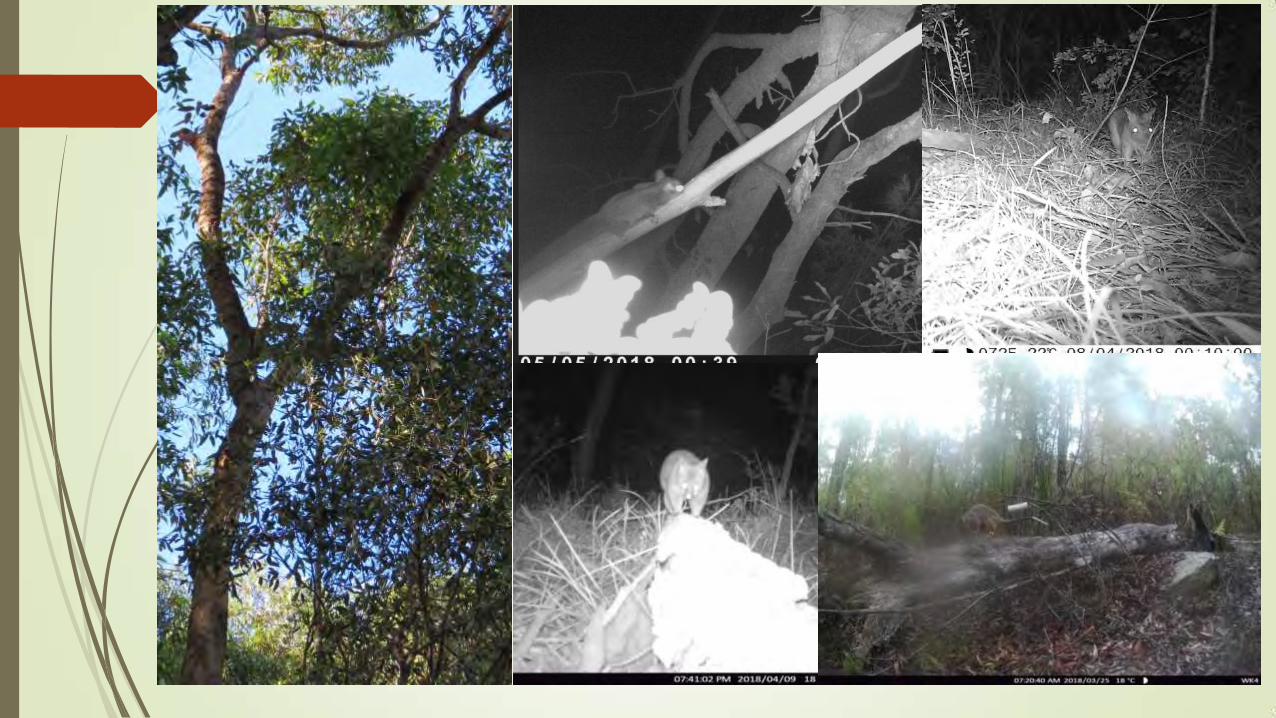
MAMMALS EXCLUDING BATS 2018=9 2008 = 9
2018 WESTERN NORTHERN SHRIMPTONS PARRAMATTA RIVER
Red Fox camera camera cameraCat camera
Black Rat camera, hairtube camera camera, hairtube camera
Long-nosed Bandicoot camera
Swamp Wallaby scats
Rabbit camera, scats camera, scats, observed
Common Ringtail camera, hairtube, observed camera, hairtube, observed
Common Brushtail camera, hairtube, observed camera, observed camera, hairtube
Sugar Glider camera
BATS call recording call recording, observed call recording, observed call recording
TERRESTRIAL MAMMALS
ARBOREAL MAMMALS
WESTERN NORTHERN SHRIMPTONS PARRAMATTA RIVER
GROUP 2008 2018 2008 2018 2008 2018 2008 2018
Arboreal Mammals 2 0 3 3 2 2 2 2
Terrestrial Mammals 0 0 1 2 0 0 0 0
Introduced 3 1 5 4 4 2 5 3
Bats (Micro & FF) 2 4 3 12 2 5 2 7
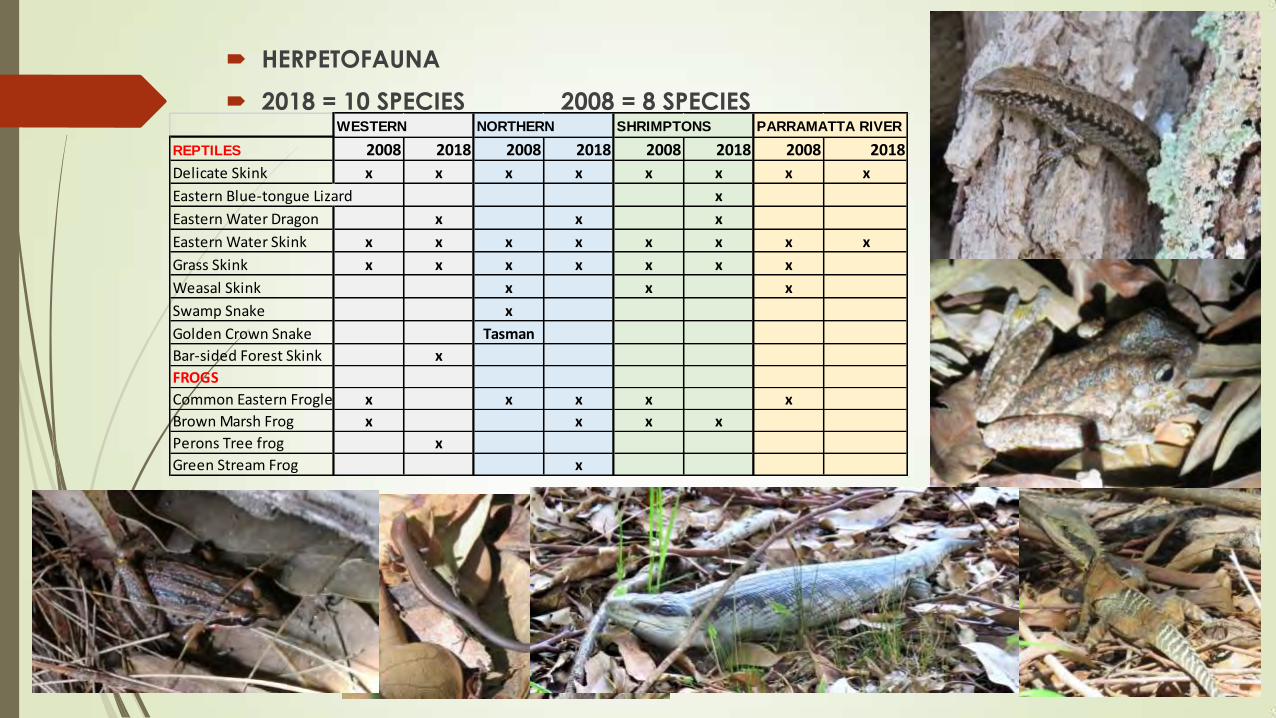
HERPETOFAUNA
2018 = 10 SPECIES 2008 = 8 SPECIES WESTERN NORTHERN SHRIMPTONS PARRAMATTA RIVER
REPTILES 2008 2018 2008 2018 2008 2018 2008 2018
Delicate Skink x x x x x x x x
Eastern Blue-tongue Lizard x
Eastern Water Dragon x x x
Eastern Water Skink x x x x x x x x
Grass Skink x x x x x x x
Weasal Skink x x x
Swamp Snake x
Golden Crown Snake Tasman
Bar-sided Forest Skink x
FROGS
Common Eastern Froglet x x x x x
Brown Marsh Frog x x x x
Perons Tree frog x
Green Stream Frog x
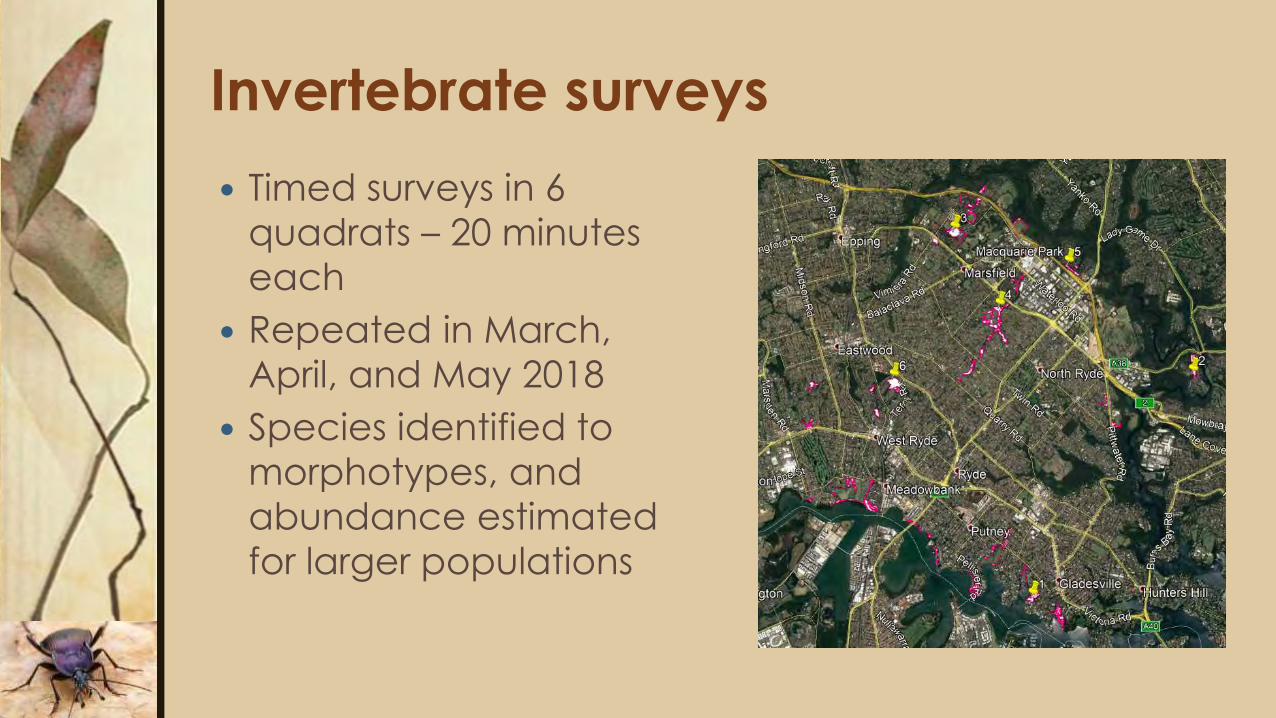
Invertebrate surveys
Timed surveys in 6
quadrats – 20 minutes
each
Repeated in March,
April, and May 2018
Species identified to
morphotypes, and
abundance estimated
for larger populations
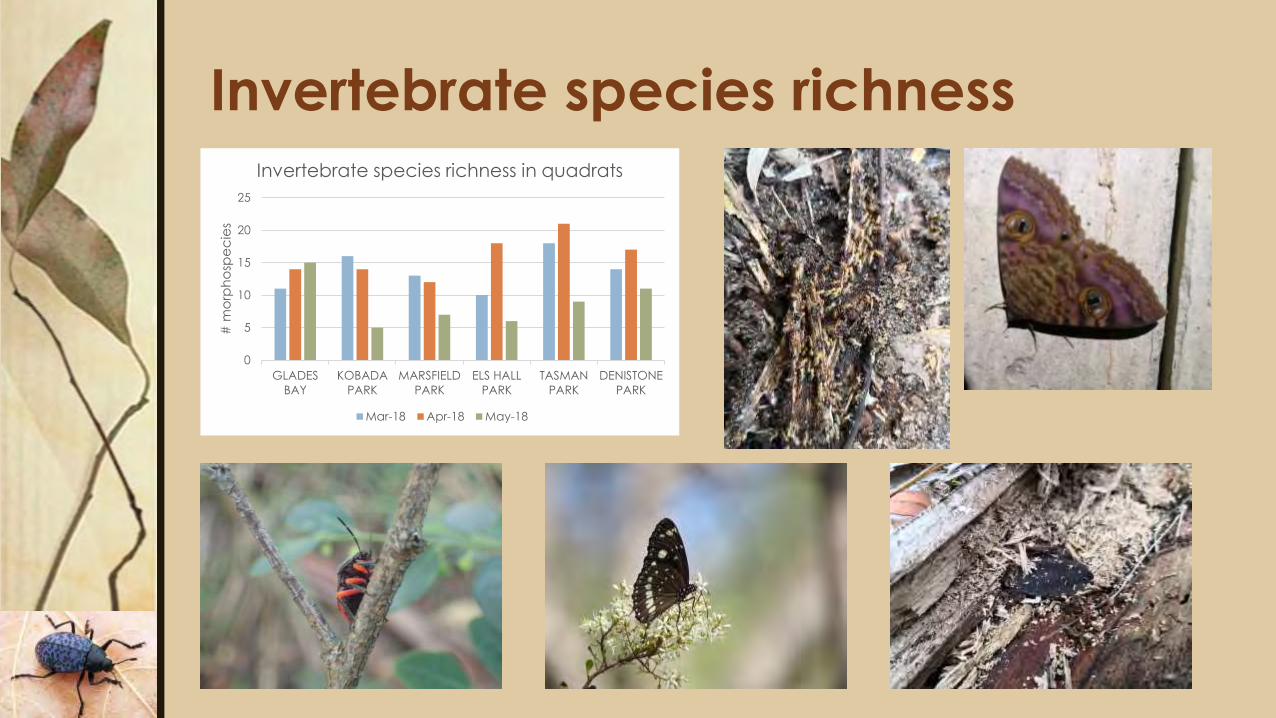
Invertebrate species richness
0
5
10
15
20
25
GLADES
BAY
KOBADA
PARK
MARSFIELD
PARK
ELS HALL
PARK
TASMAN
PARK
DENISTONE
PARK
# m
orp
ho
spe
cie
s
Invertebrate species richness in quadrats
Mar-18 Apr-18 May-18
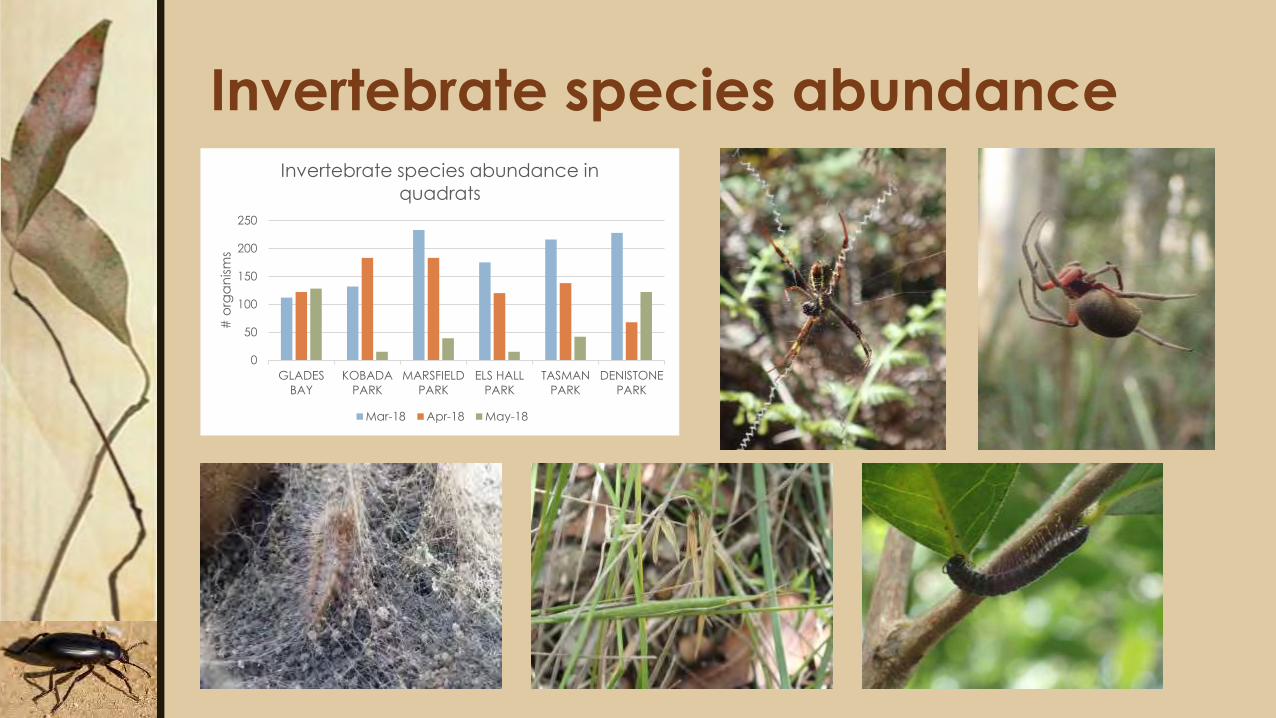
Invertebrate species abundance
0
50
100
150
200
250
GLADES
BAY
KOBADA
PARK
MARSFIELD
PARK
ELS HALL
PARK
TASMAN
PARK
DENISTONE
PARK
# o
rga
nis
ms
Invertebrate species abundance in
quadrats
Mar-18 Apr-18 May-18
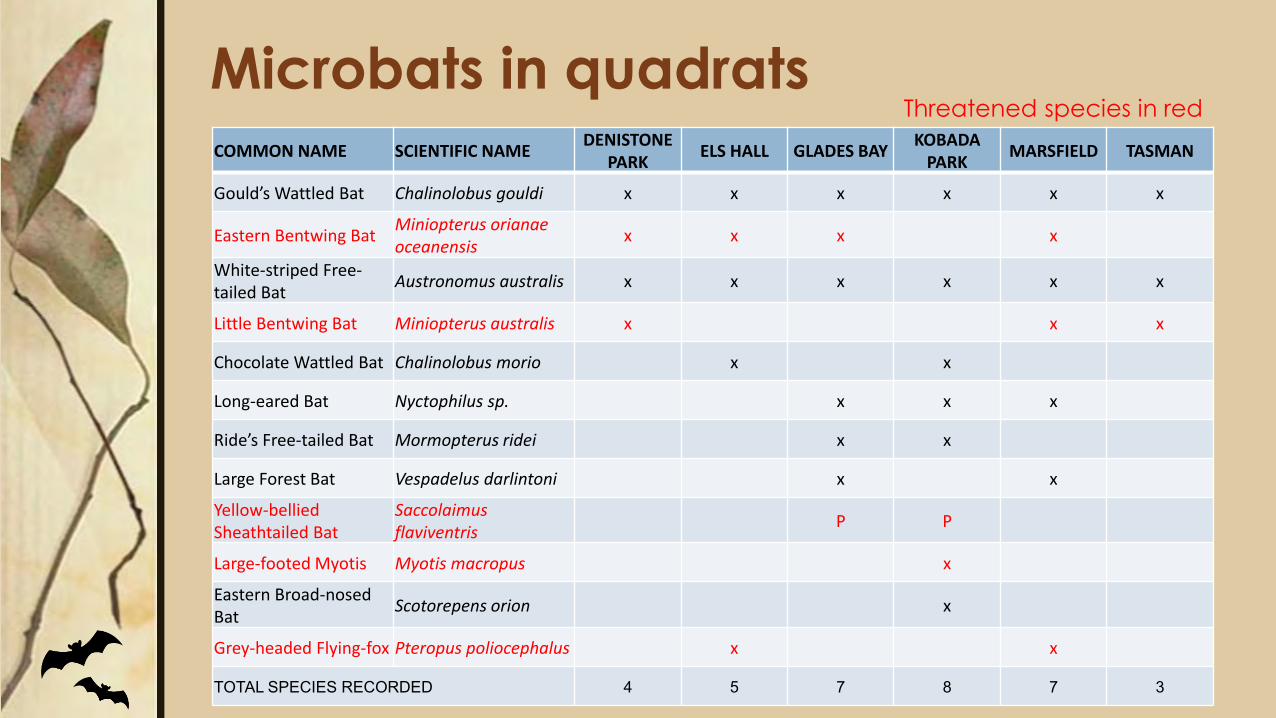
Microbats in quadrats COMMON NAME SCIENTIFIC NAME
DENISTONE PARK
ELS HALL GLADES BAY KOBADA
PARK MARSFIELD TASMAN
Gould’s Wattled Bat Chalinolobus gouldi x x x x x x
Eastern Bentwing Bat Miniopterus orianae oceanensis
x x x x
White-striped Free-tailed Bat
Austronomus australis x x x x x x
Little Bentwing Bat Miniopterus australis x x x
Chocolate Wattled Bat Chalinolobus morio x x
Long-eared Bat Nyctophilus sp. x x x
Ride’s Free-tailed Bat Mormopterus ridei x x
Large Forest Bat Vespadelus darlintoni x x
Yellow-bellied Sheathtailed Bat
Saccolaimus flaviventris
P P
Large-footed Myotis Myotis macropus x
Eastern Broad-nosed Bat
Scotorepens orion x
Grey-headed Flying-fox Pteropus poliocephalus x x
TOTAL SPECIES RECORDED 4 5 7 8 7 3
Threatened species in red
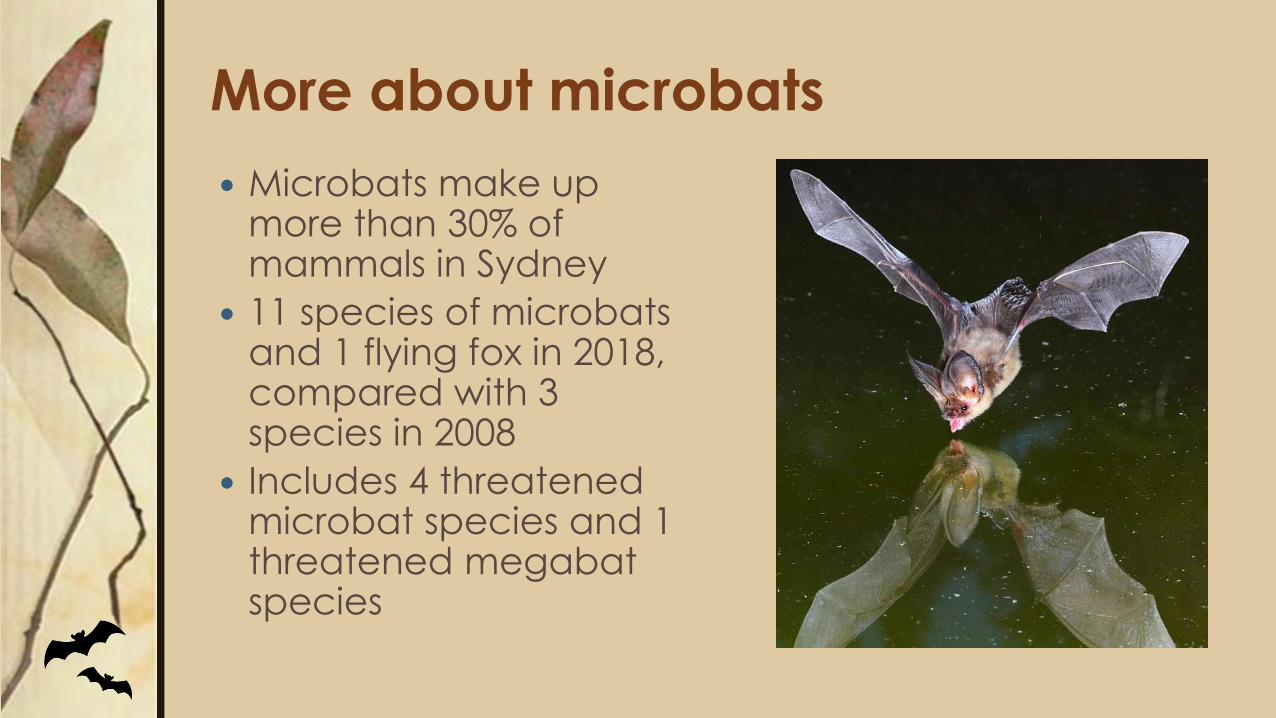
More about microbats
Microbats make up more than 30% of mammals in Sydney
11 species of microbats and 1 flying fox in 2018, compared with 3 species in 2008
Includes 4 threatened microbat species and 1 threatened megabat species
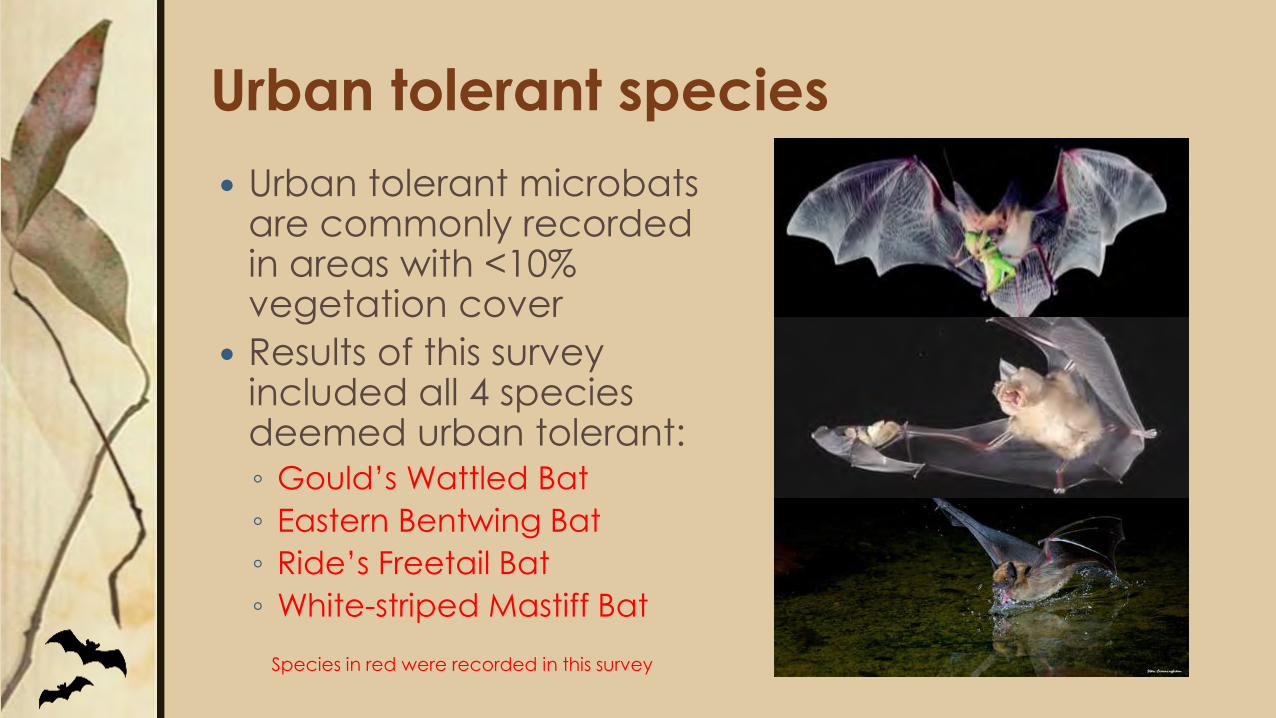
Urban tolerant species
Urban tolerant microbats are commonly recorded in areas with <10% vegetation cover
Results of this survey included all 4 species deemed urban tolerant: ◦ Gould’s Wattled Bat
◦ Eastern Bentwing Bat
◦ Ride’s Freetail Bat
◦ White-striped Mastiff Bat
Species in red were recorded in this survey
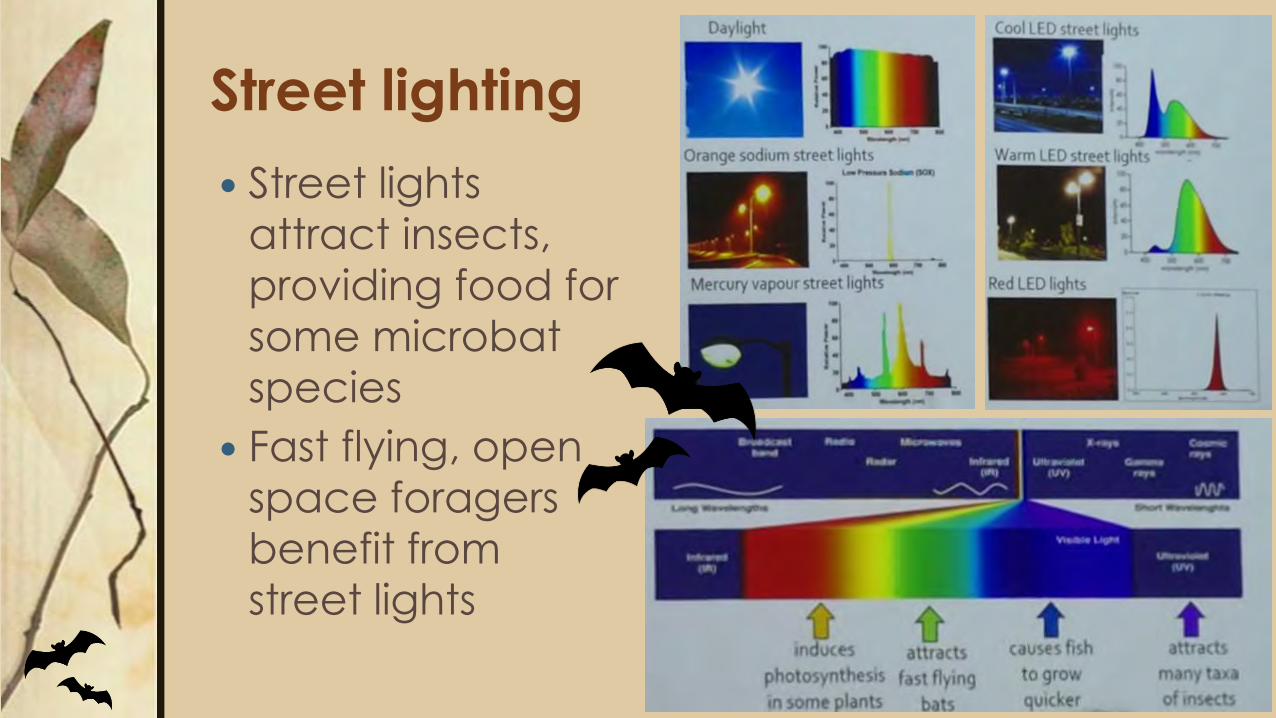
Street lighting
Street lights
attract insects,
providing food for
some microbat
species
Fast flying, open
space foragers
benefit from
street lights
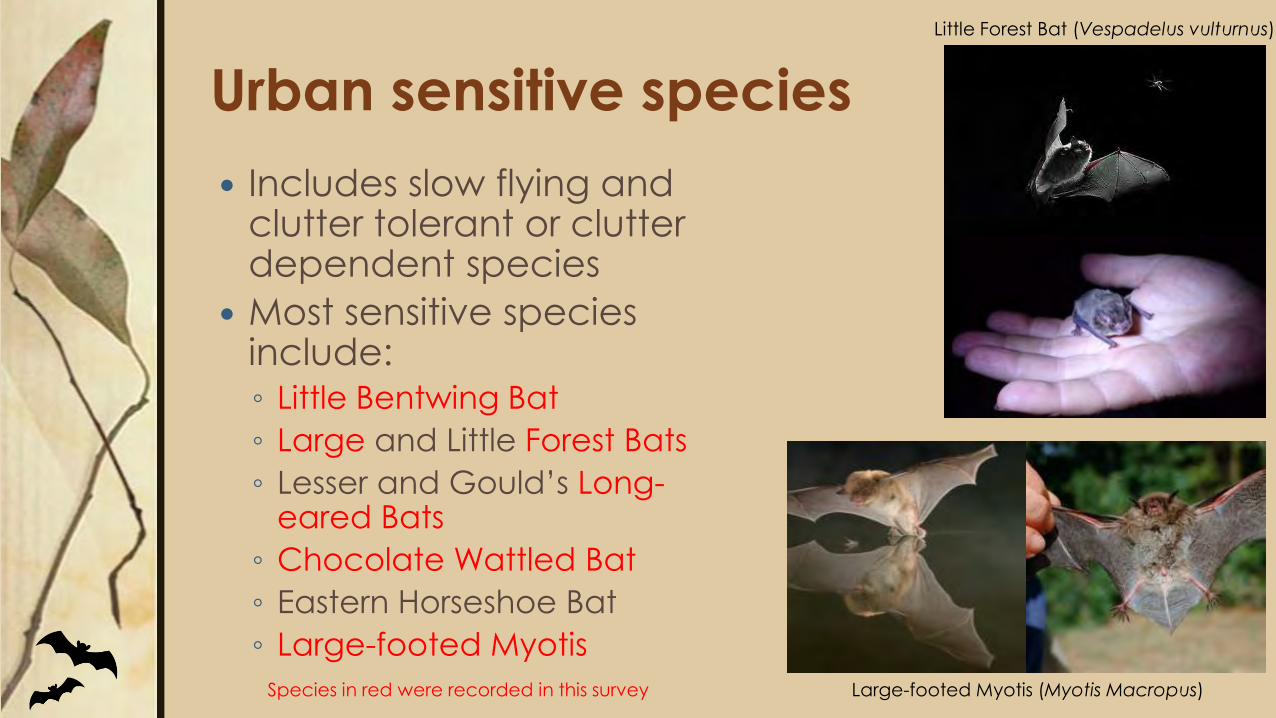
Urban sensitive species
Includes slow flying and clutter tolerant or clutter dependent species
Most sensitive species include: ◦ Little Bentwing Bat
◦ Large and Little Forest Bats
◦ Lesser and Gould’s Long-eared Bats
◦ Chocolate Wattled Bat
◦ Eastern Horseshoe Bat
◦ Large-footed Myotis
Species in red were recorded in this survey Large-footed Myotis (Myotis Macropus)
Little Forest Bat (Vespadelus vulturnus)
Natural insecticides
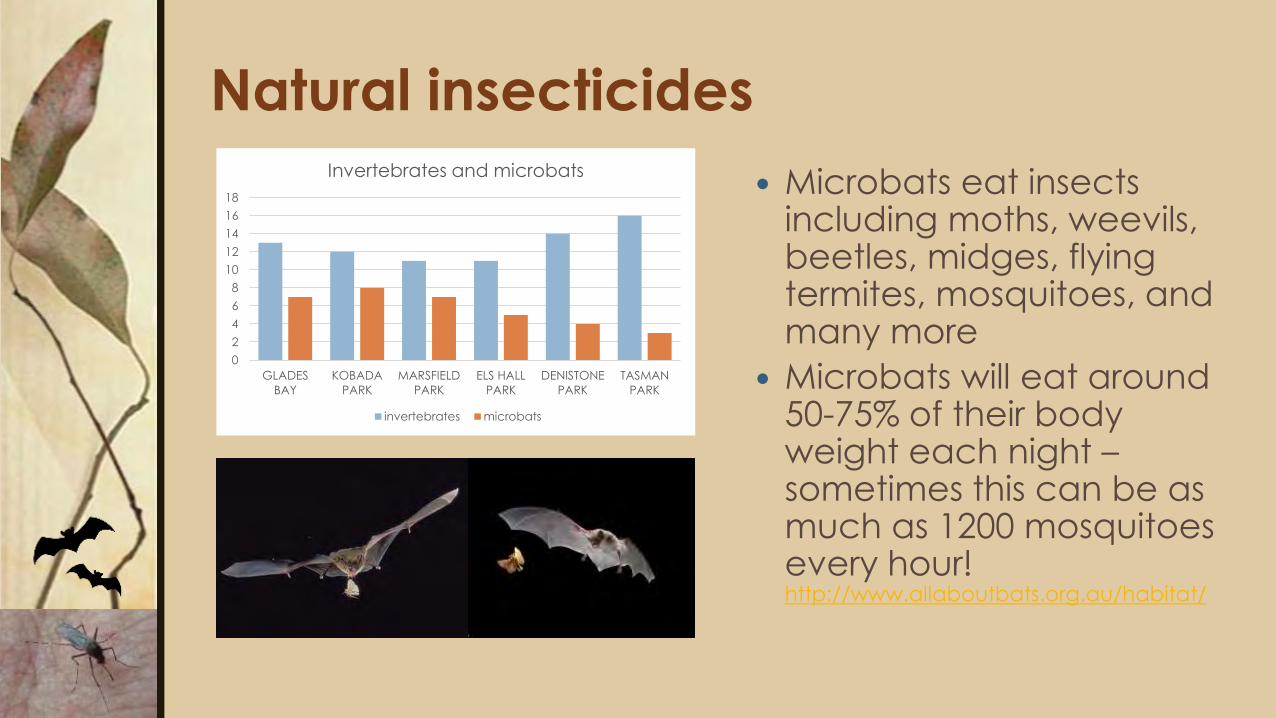
Microbats eat insects including moths, weevils, beetles, midges, flying termites, mosquitoes, and many more
Microbats will eat around 50-75% of their body weight each night – sometimes this can be as much as 1200 mosquitoes every hour! http://www.allaboutbats.org.au/habitat/
0
2
4
6
8
10
12
14
16
18
GLADES
BAY
KOBADA
PARK
MARSFIELD
PARK
ELS HALL
PARK
DENISTONE
PARK
TASMAN
PARK
Invertebrates and microbats
invertebrates microbats
Overview of flora and vegetation
Vegetation communities in reserves
Results of autumn surveys - changes in quadrat
cover
Role of bioturbation in ecosystem health
Realistic outcomes for vegetation
management in these reserves
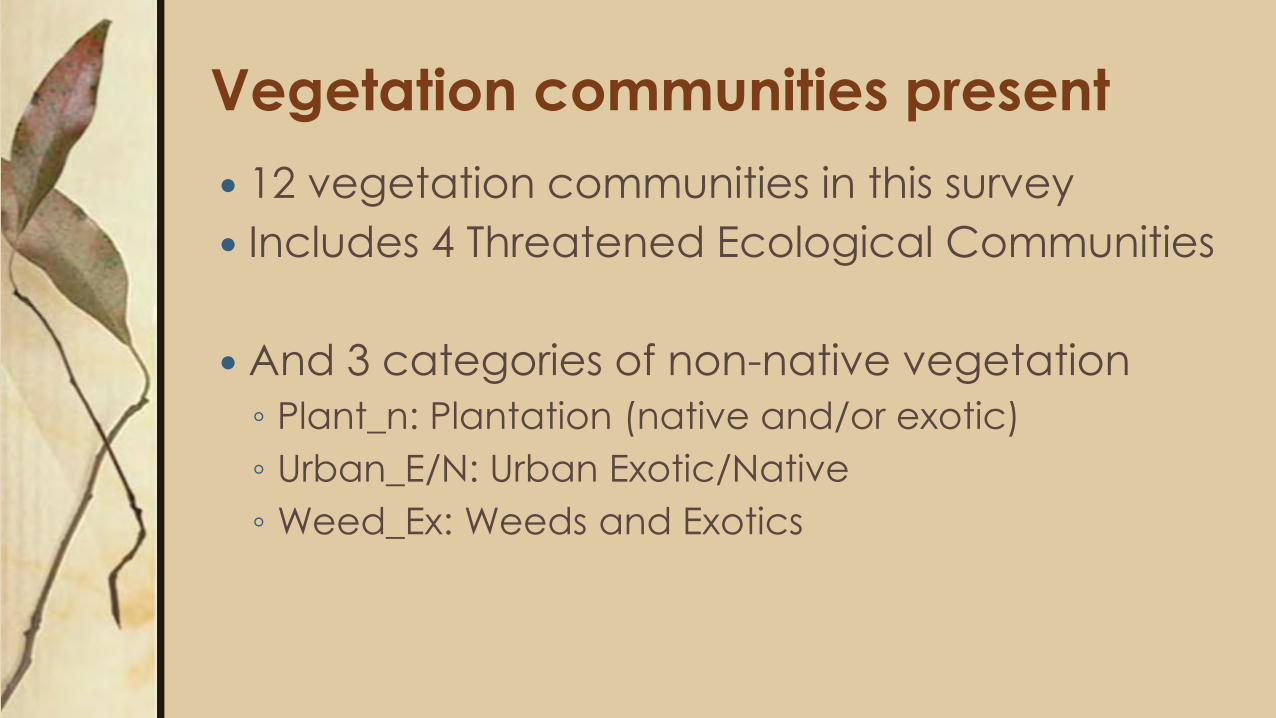
Vegetation communities present
12 vegetation communities in this survey
Includes 4 Threatened Ecological Communities
And 3 categories of non-native vegetation
◦ Plant_n: Plantation (native and/or exotic)
◦ Urban_E/N: Urban Exotic/Native
◦ Weed_Ex: Weeds and Exotics
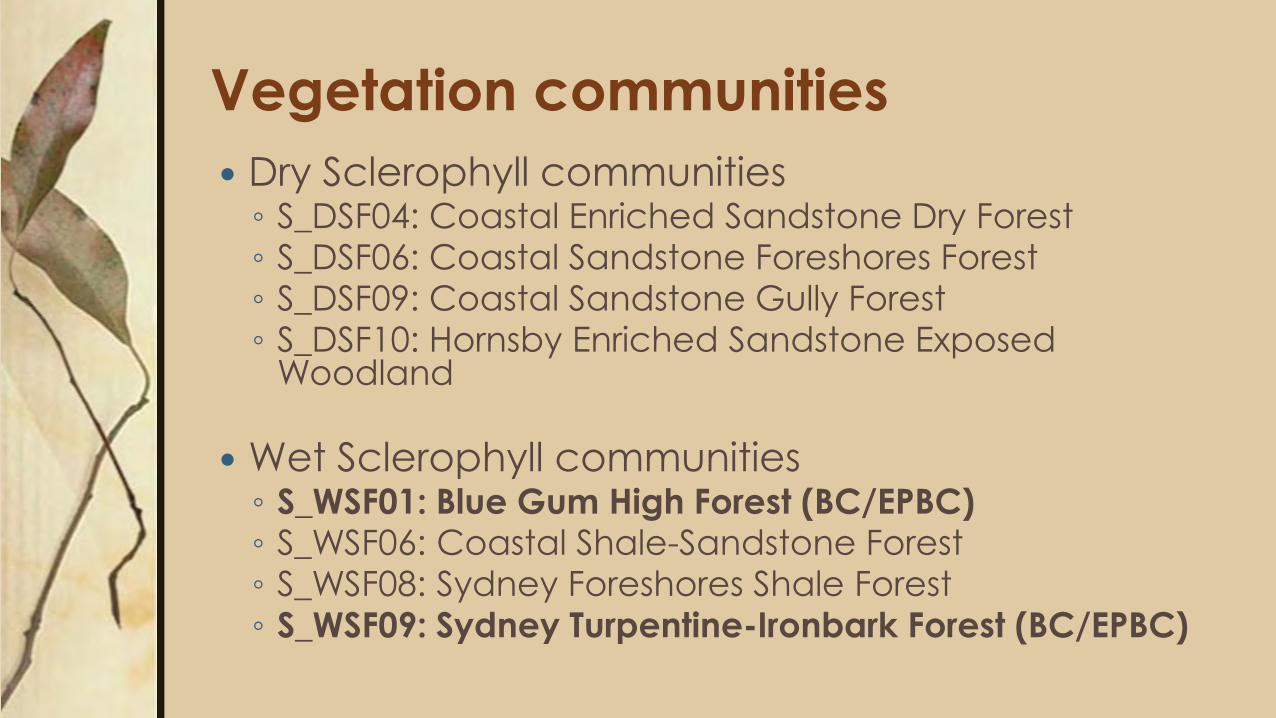
Vegetation communities
Dry Sclerophyll communities ◦ S_DSF04: Coastal Enriched Sandstone Dry Forest ◦ S_DSF06: Coastal Sandstone Foreshores Forest ◦ S_DSF09: Coastal Sandstone Gully Forest ◦ S_DSF10: Hornsby Enriched Sandstone Exposed
Woodland
Wet Sclerophyll communities ◦ S_WSF01: Blue Gum High Forest (BC/EPBC) ◦ S_WSF06: Coastal Shale-Sandstone Forest ◦ S_WSF08: Sydney Foreshores Shale Forest ◦ S_WSF09: Sydney Turpentine-Ironbark Forest (BC/EPBC)
Vegetation communities (cont.)
Estuarine communities
◦ S_SW01: Estuarine Mangrove Forest
◦ S_SW02: Estuarine Saltmarsh (BC)
Other native vegetation
◦ S_FoW08: Estuarine Swamp Oak Forest (BC)
◦ S_RF02: Coastal Sandstone Gallery Rainforest
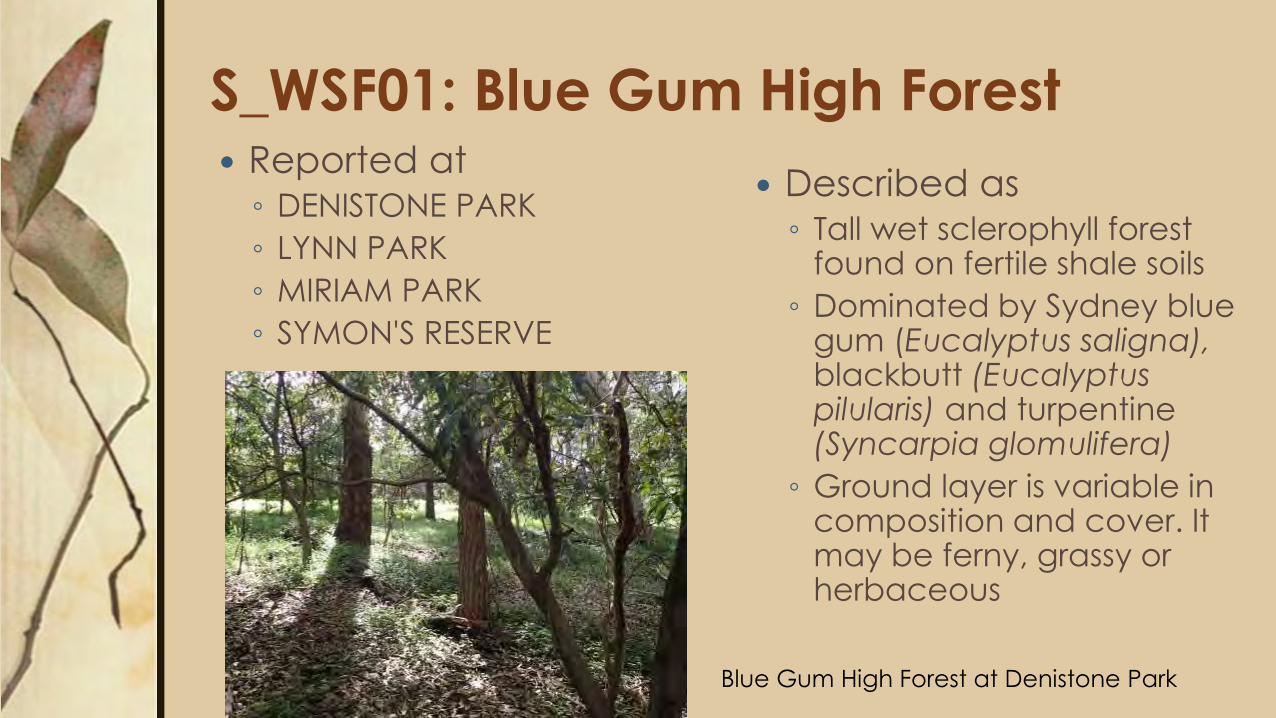
S_WSF01: Blue Gum High Forest Reported at ◦ DENISTONE PARK
◦ LYNN PARK
◦ MIRIAM PARK
◦ SYMON'S RESERVE
Described as ◦ Tall wet sclerophyll forest
found on fertile shale soils
◦ Dominated by Sydney blue gum (Eucalyptus saligna), blackbutt (Eucalyptus pilularis) and turpentine (Syncarpia glomulifera)
◦ Ground layer is variable in composition and cover. It may be ferny, grassy or herbaceous
Blue Gum High Forest at Denistone Park
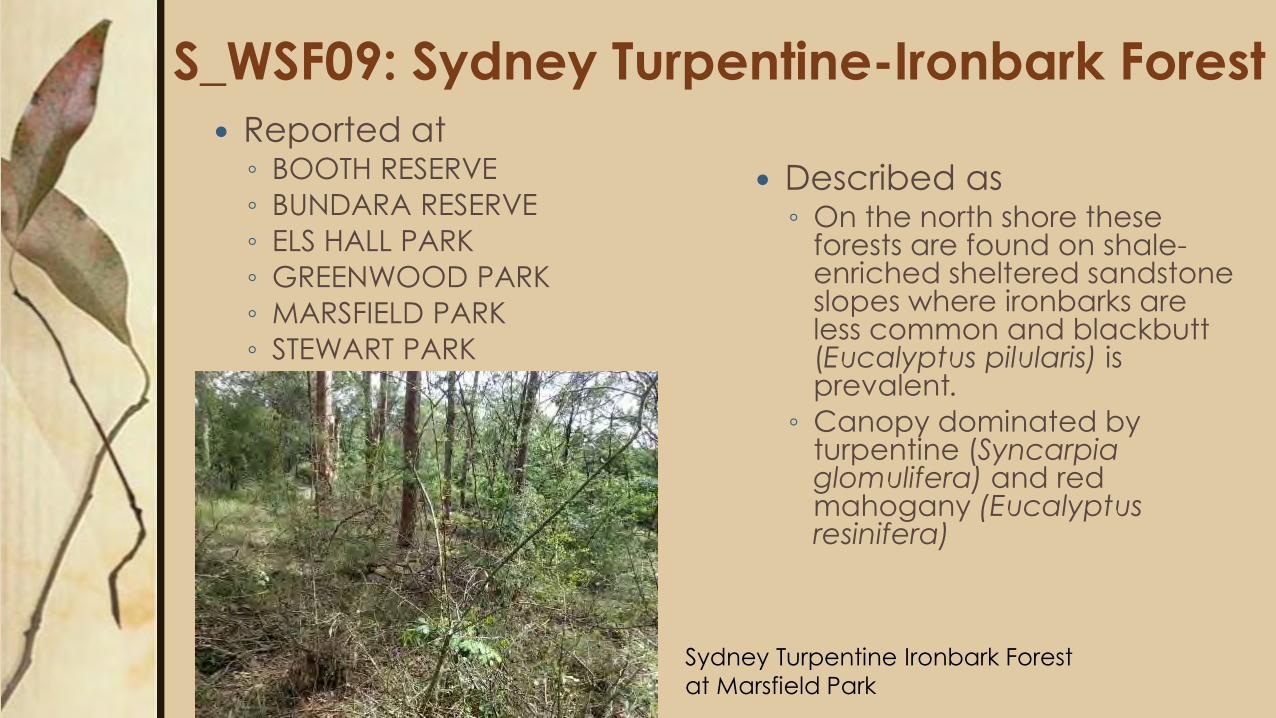
S_WSF09: Sydney Turpentine-Ironbark Forest
Reported at ◦ BOOTH RESERVE
◦ BUNDARA RESERVE
◦ ELS HALL PARK
◦ GREENWOOD PARK
◦ MARSFIELD PARK
◦ STEWART PARK
Described as ◦ On the north shore these
forests are found on shale-enriched sheltered sandstone slopes where ironbarks are less common and blackbutt (Eucalyptus pilularis) is prevalent.
◦ Canopy dominated by turpentine (Syncarpia glomulifera) and red mahogany (Eucalyptus resinifera)
Sydney Turpentine Ironbark Forest
at Marsfield Park
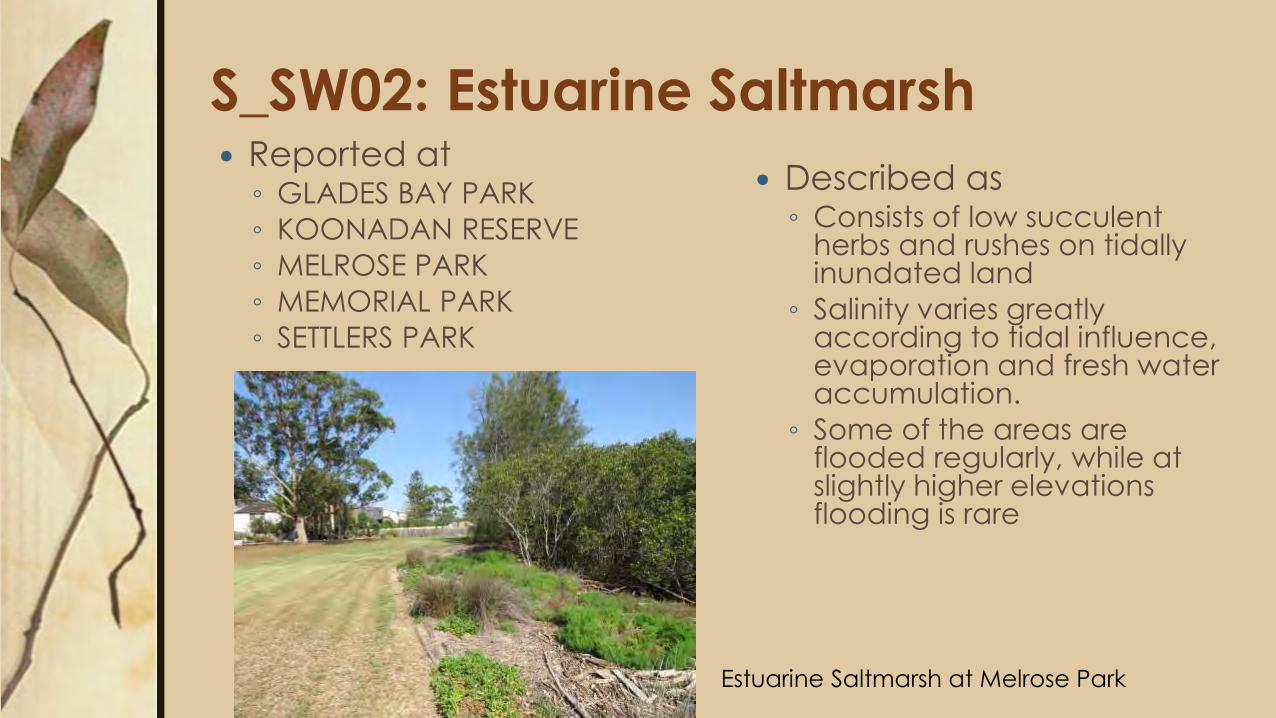
S_SW02: Estuarine Saltmarsh Reported at ◦ GLADES BAY PARK
◦ KOONADAN RESERVE
◦ MELROSE PARK
◦ MEMORIAL PARK
◦ SETTLERS PARK
Described as ◦ Consists of low succulent
herbs and rushes on tidally inundated land
◦ Salinity varies greatly according to tidal influence, evaporation and fresh water accumulation.
◦ Some of the areas are flooded regularly, while at slightly higher elevations flooding is rare
Estuarine Saltmarsh at Melrose Park
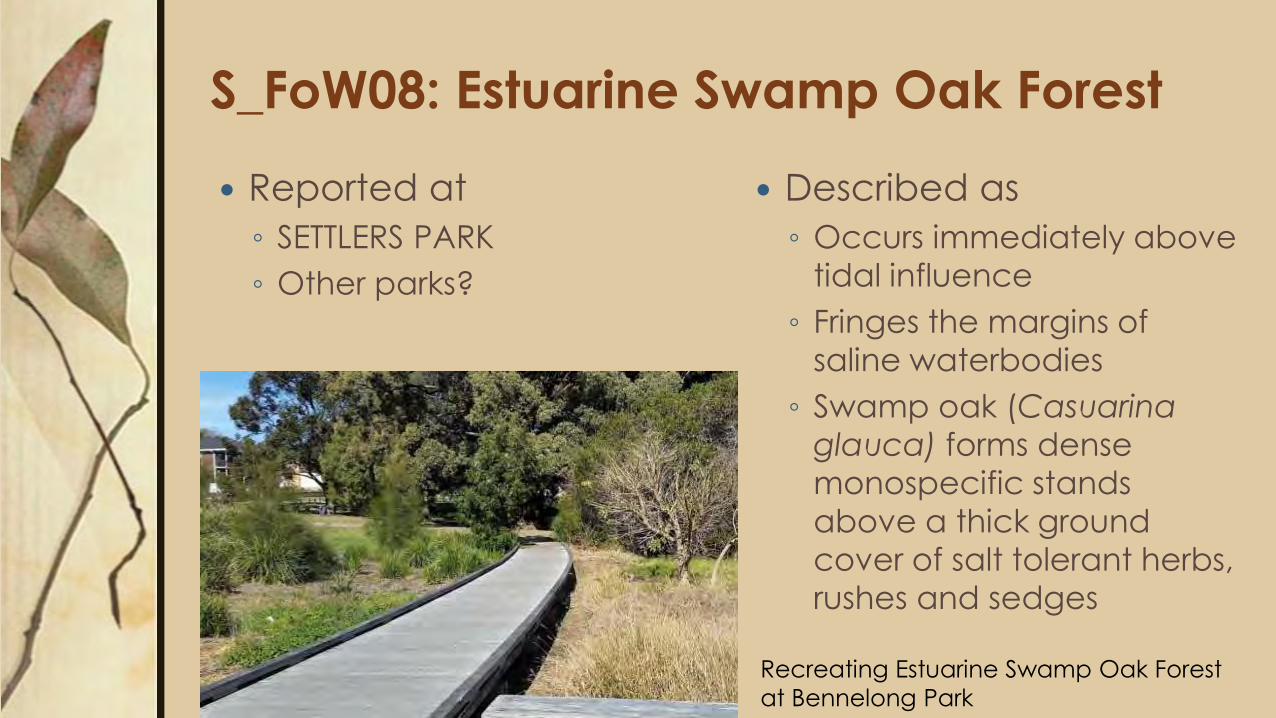
S_FoW08: Estuarine Swamp Oak Forest
Reported at
◦ SETTLERS PARK
◦ Other parks?
Described as
◦ Occurs immediately above
tidal influence
◦ Fringes the margins of
saline waterbodies
◦ Swamp oak (Casuarina
glauca) forms dense
monospecific stands
above a thick ground
cover of salt tolerant herbs,
rushes and sedges
Recreating Estuarine Swamp Oak Forest
at Bennelong Park
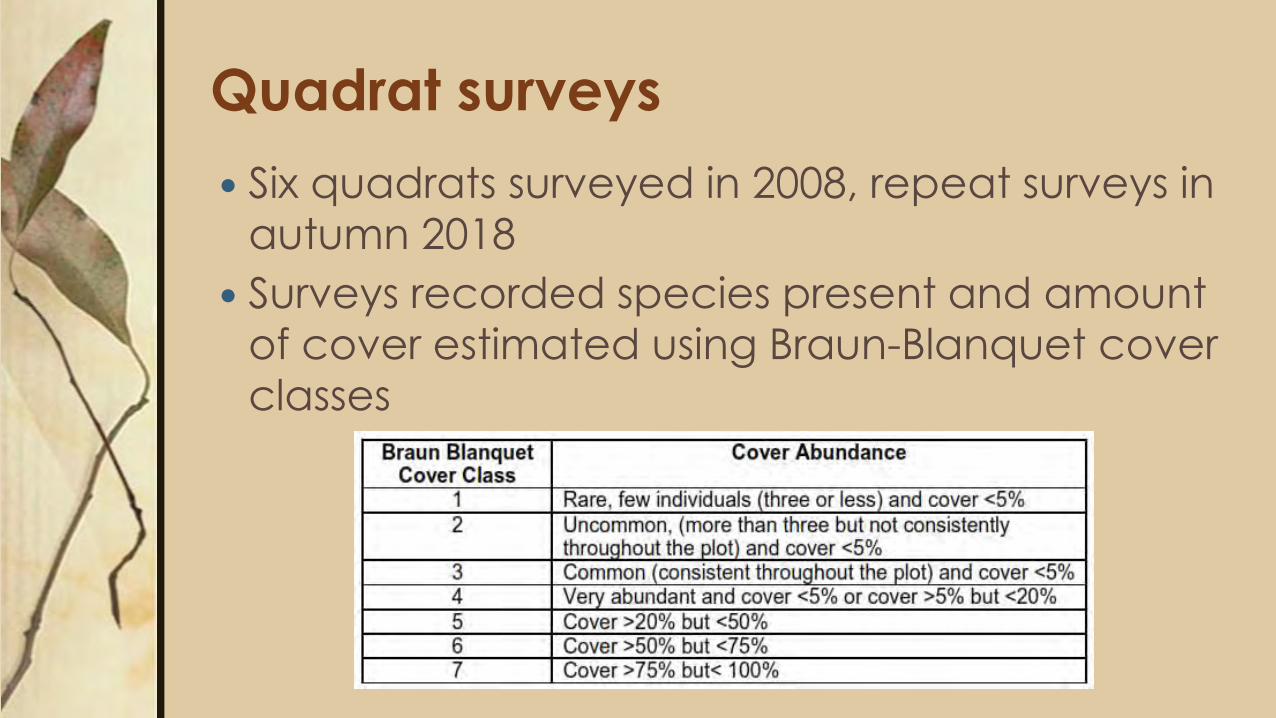
Quadrat surveys
Six quadrats surveyed in 2008, repeat surveys in
autumn 2018
Surveys recorded species present and amount
of cover estimated using Braun-Blanquet cover
classes
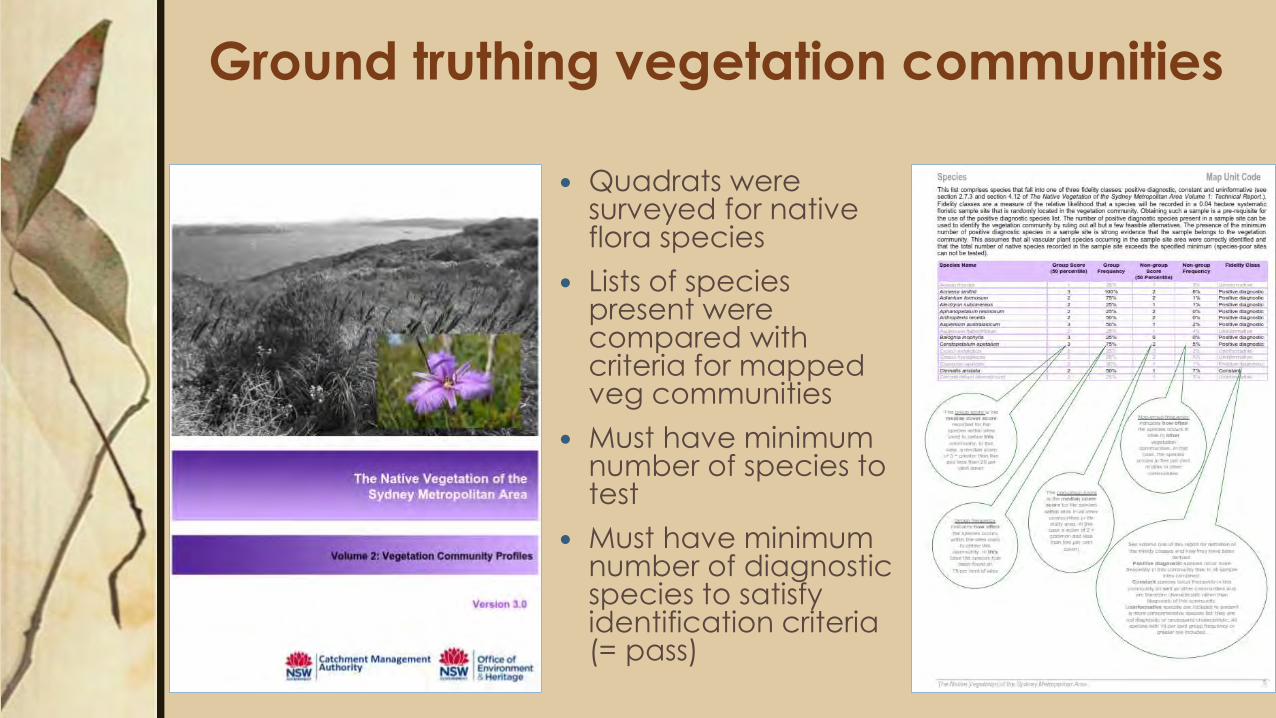
Ground truthing vegetation communities
Quadrats were surveyed for native flora species
Lists of species present were compared with criteria for mapped veg communities
Must have minimum number of species to test
Must have minimum number of diagnostic species to satisfy identification criteria (= pass)
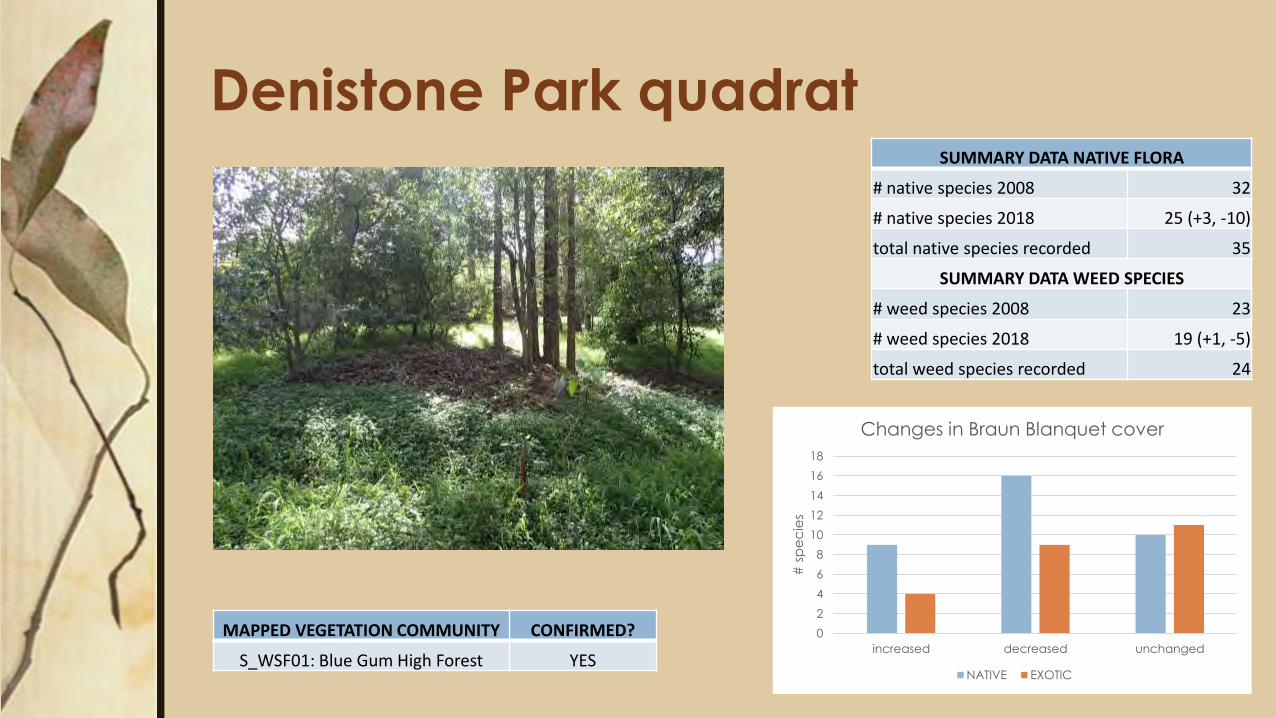
Denistone Park quadrat SUMMARY DATA NATIVE FLORA
# native species 2008 32
# native species 2018 25 (+3, -10)
total native species recorded 35
SUMMARY DATA WEED SPECIES
# weed species 2008 23
# weed species 2018 19 (+1, -5)
total weed species recorded 24
0
2
4
6
8
10
12
14
16
18
increased decreased unchanged
# s
pe
cie
s
Changes in Braun Blanquet cover
NATIVE EXOTIC
MAPPED VEGETATION COMMUNITY CONFIRMED?
S_WSF01: Blue Gum High Forest YES
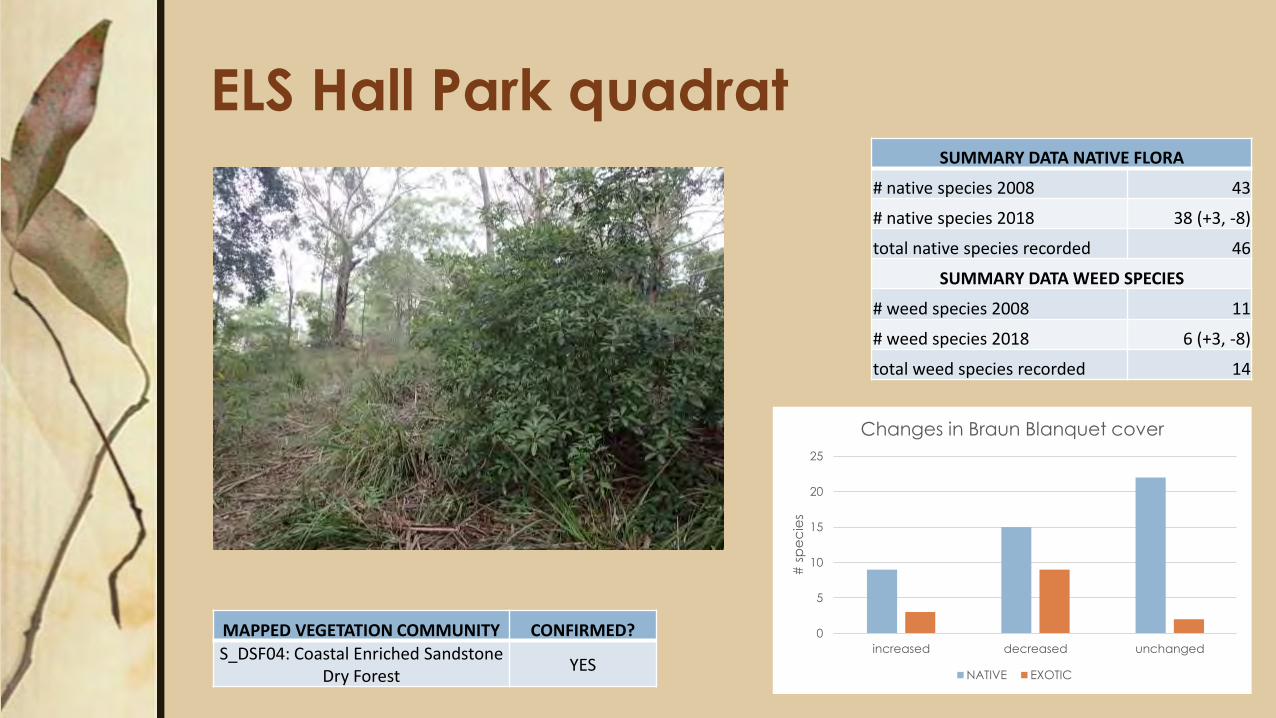
ELS Hall Park quadrat SUMMARY DATA NATIVE FLORA
# native species 2008 43
# native species 2018 38 (+3, -8)
total native species recorded 46
SUMMARY DATA WEED SPECIES
# weed species 2008 11
# weed species 2018 6 (+3, -8)
total weed species recorded 14
MAPPED VEGETATION COMMUNITY CONFIRMED? S_DSF04: Coastal Enriched Sandstone
Dry Forest YES
0
5
10
15
20
25
increased decreased unchanged
# s
pe
cie
s
Changes in Braun Blanquet cover
NATIVE EXOTIC
Glades Bay Park quadrat
MAPPED VEGETATION COMMUNITY CONFIRMED? S_DSF06: Coastal Sandstone
Foreshores Forest YES
SUMMARY DATA NATIVE FLORA
# native species 2008 24
# native species 2018 24 (+2, -2)
total native species recorded 26
SUMMARY DATA WEED SPECIES
# weed species 2008 7
# weed species 2018 9 (+3, -1)
total weed species recorded 10
0
2
4
6
8
10
12
14
increased decreased unchanged
# s
pe
cie
s
Changes in Braun Blanquet cover
NATIVE EXOTIC
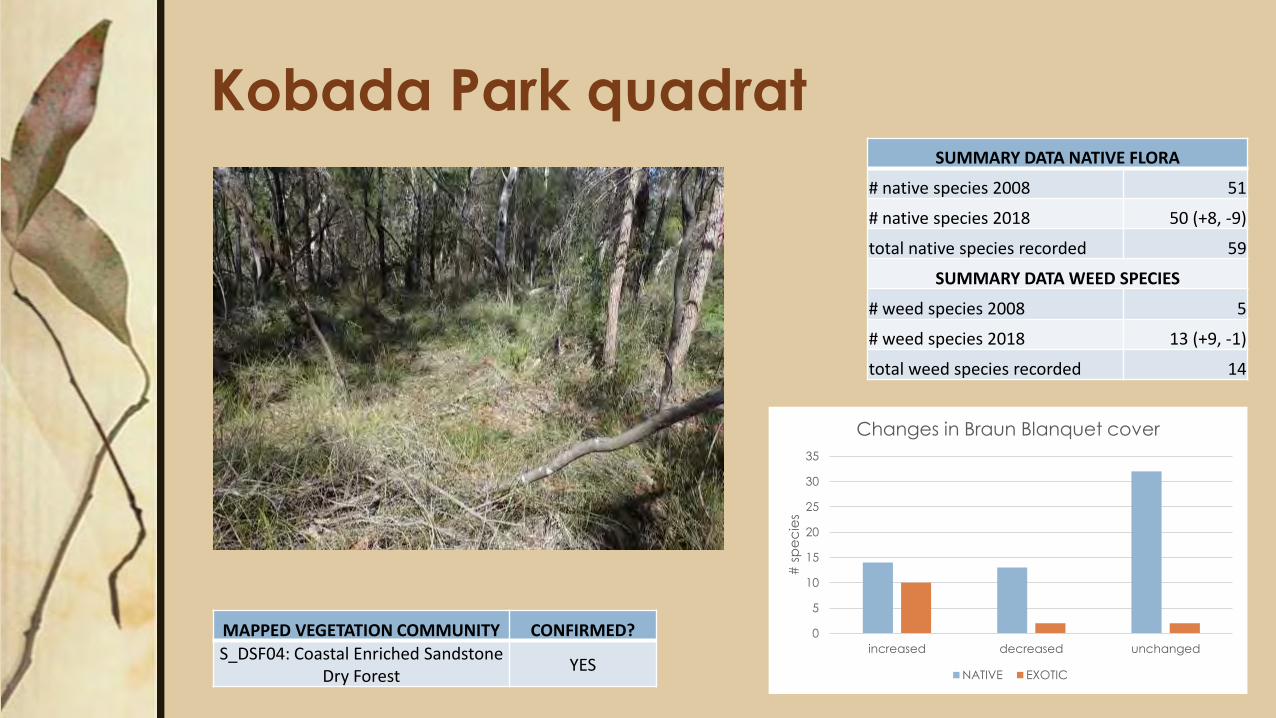
Kobada Park quadrat
MAPPED VEGETATION COMMUNITY CONFIRMED? S_DSF04: Coastal Enriched Sandstone
Dry Forest YES
SUMMARY DATA NATIVE FLORA
# native species 2008 51
# native species 2018 50 (+8, -9)
total native species recorded 59
SUMMARY DATA WEED SPECIES
# weed species 2008 5
# weed species 2018 13 (+9, -1)
total weed species recorded 14
0
5
10
15
20
25
30
35
increased decreased unchanged
# s
pe
cie
s
Changes in Braun Blanquet cover
NATIVE EXOTIC
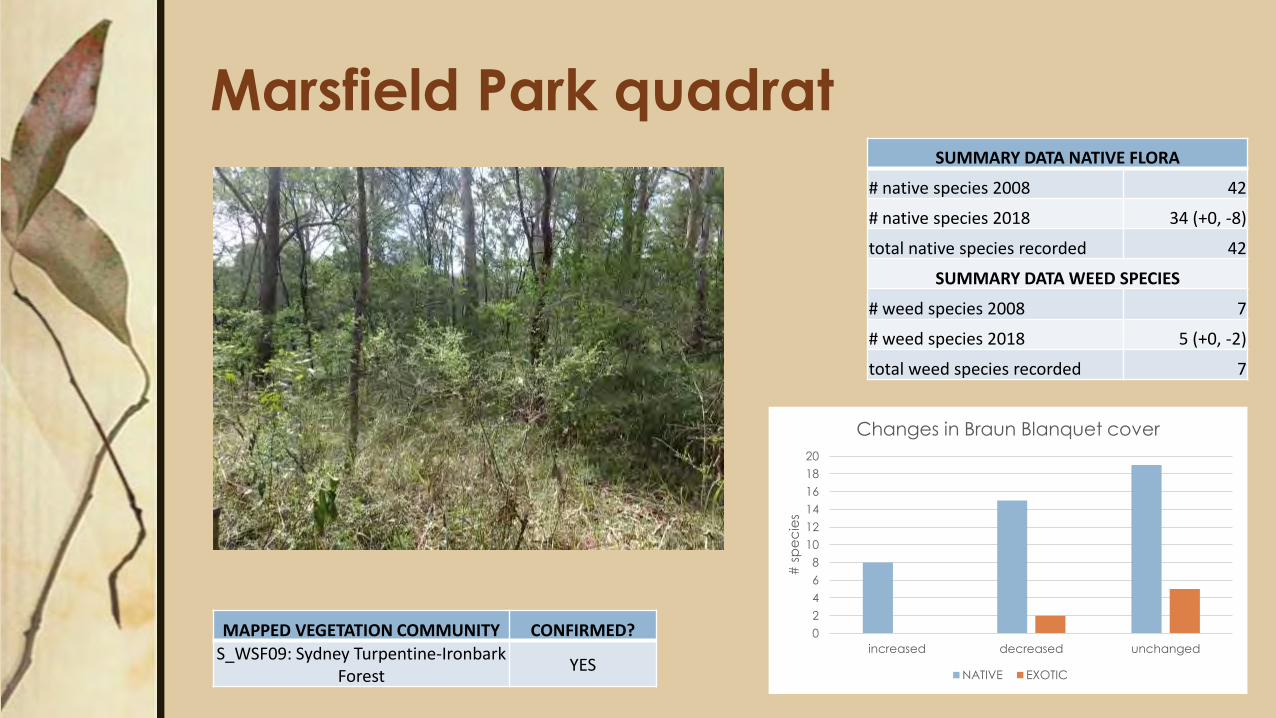
Marsfield Park quadrat
MAPPED VEGETATION COMMUNITY CONFIRMED? S_WSF09: Sydney Turpentine-Ironbark
Forest YES
SUMMARY DATA NATIVE FLORA
# native species 2008 42
# native species 2018 34 (+0, -8)
total native species recorded 42
SUMMARY DATA WEED SPECIES
# weed species 2008 7
# weed species 2018 5 (+0, -2)
total weed species recorded 7
0
2
4
6
8
10
12
14
16
18
20
increased decreased unchanged
# s
pe
cie
s
Changes in Braun Blanquet cover
NATIVE EXOTIC
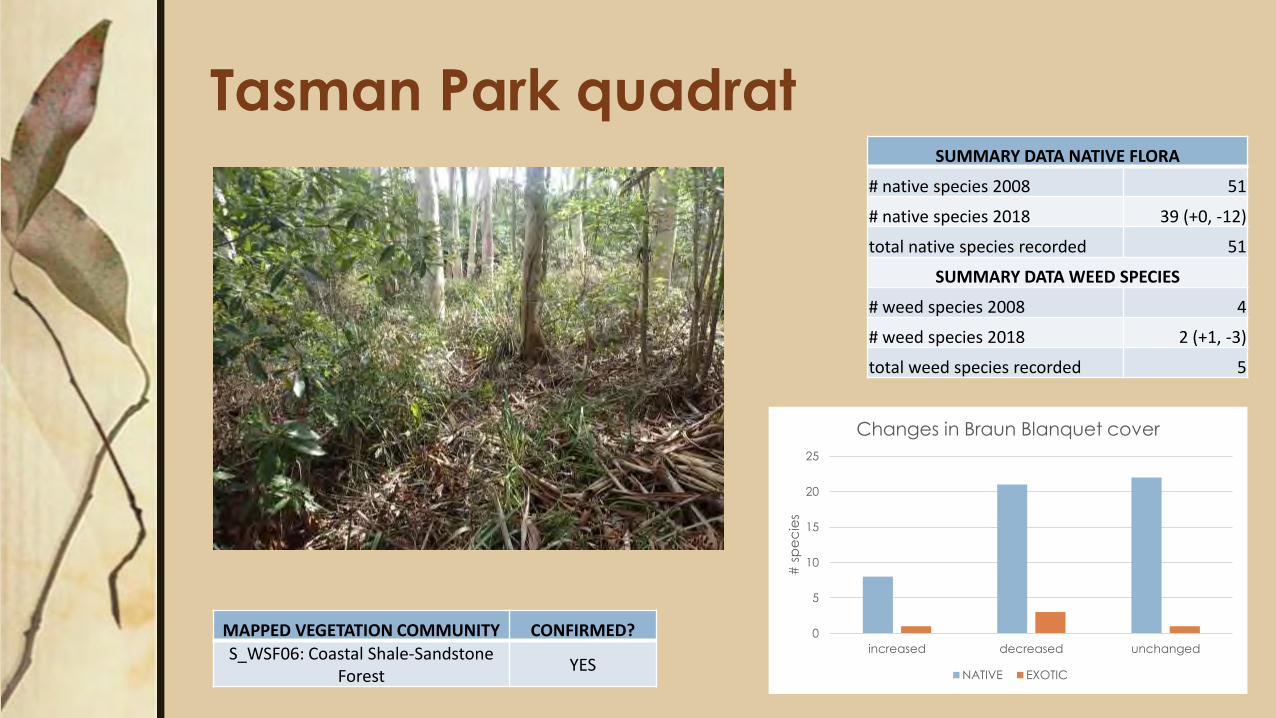
Tasman Park quadrat
MAPPED VEGETATION COMMUNITY CONFIRMED? S_WSF06: Coastal Shale-Sandstone
Forest YES
SUMMARY DATA NATIVE FLORA
# native species 2008 51
# native species 2018 39 (+0, -12)
total native species recorded 51
SUMMARY DATA WEED SPECIES
# weed species 2008 4
# weed species 2018 2 (+1, -3)
total weed species recorded 5
0
5
10
15
20
25
increased decreased unchanged
# s
pe
cie
s
Changes in Braun Blanquet cover
NATIVE EXOTIC
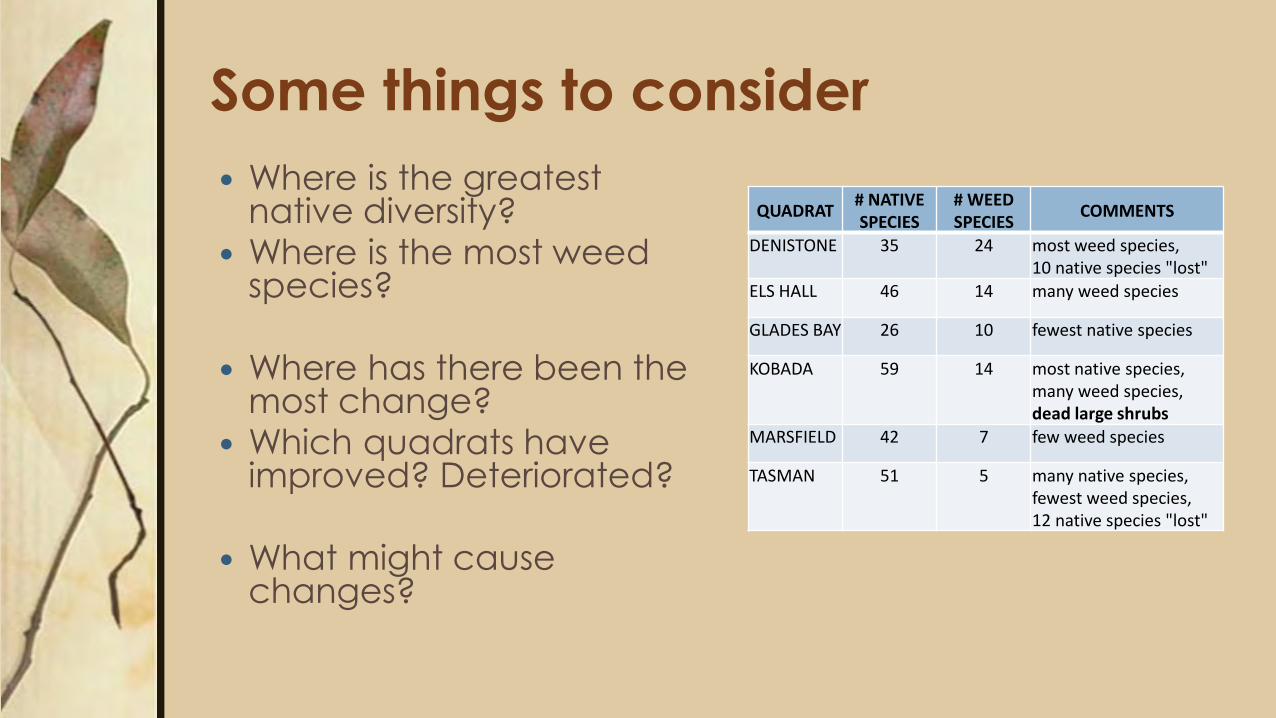
Some things to consider
Where is the greatest native diversity?
Where is the most weed species?
Where has there been the most change?
Which quadrats have improved? Deteriorated?
What might cause changes?
QUADRAT # NATIVE SPECIES
# WEED SPECIES
COMMENTS
DENISTONE 35 24 most weed species, 10 native species "lost"
ELS HALL 46 14 many weed species
GLADES BAY 26 10 fewest native species
KOBADA 59 14 most native species, many weed species, dead large shrubs
MARSFIELD 42 7 few weed species
TASMAN 51 5 many native species, fewest weed species, 12 native species "lost"
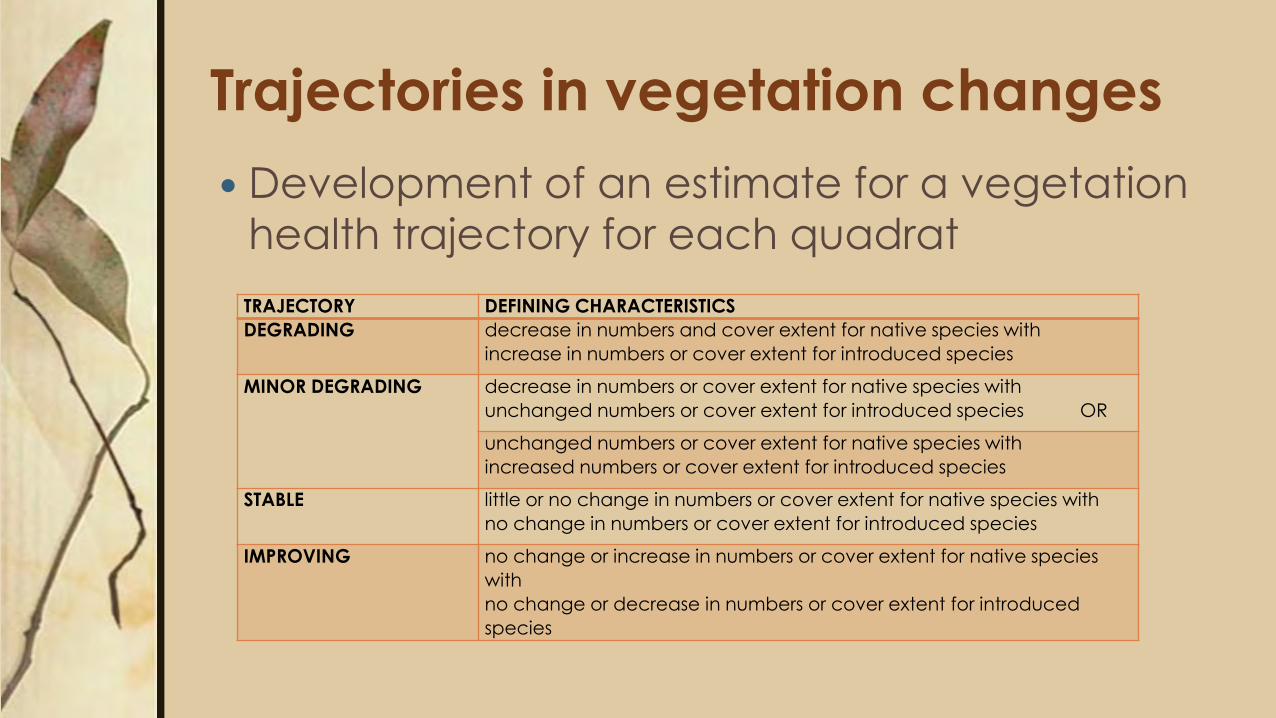
Trajectories in vegetation changes
Development of an estimate for a vegetation
health trajectory for each quadrat
TRAJECTORY DEFINING CHARACTERISTICS
DEGRADING decrease in numbers and cover extent for native species with
increase in numbers or cover extent for introduced species
MINOR DEGRADING decrease in numbers or cover extent for native species with
unchanged numbers or cover extent for introduced species OR
unchanged numbers or cover extent for native species with
increased numbers or cover extent for introduced species
STABLE little or no change in numbers or cover extent for native species with
no change in numbers or cover extent for introduced species
IMPROVING no change or increase in numbers or cover extent for native species
with
no change or decrease in numbers or cover extent for introduced
species
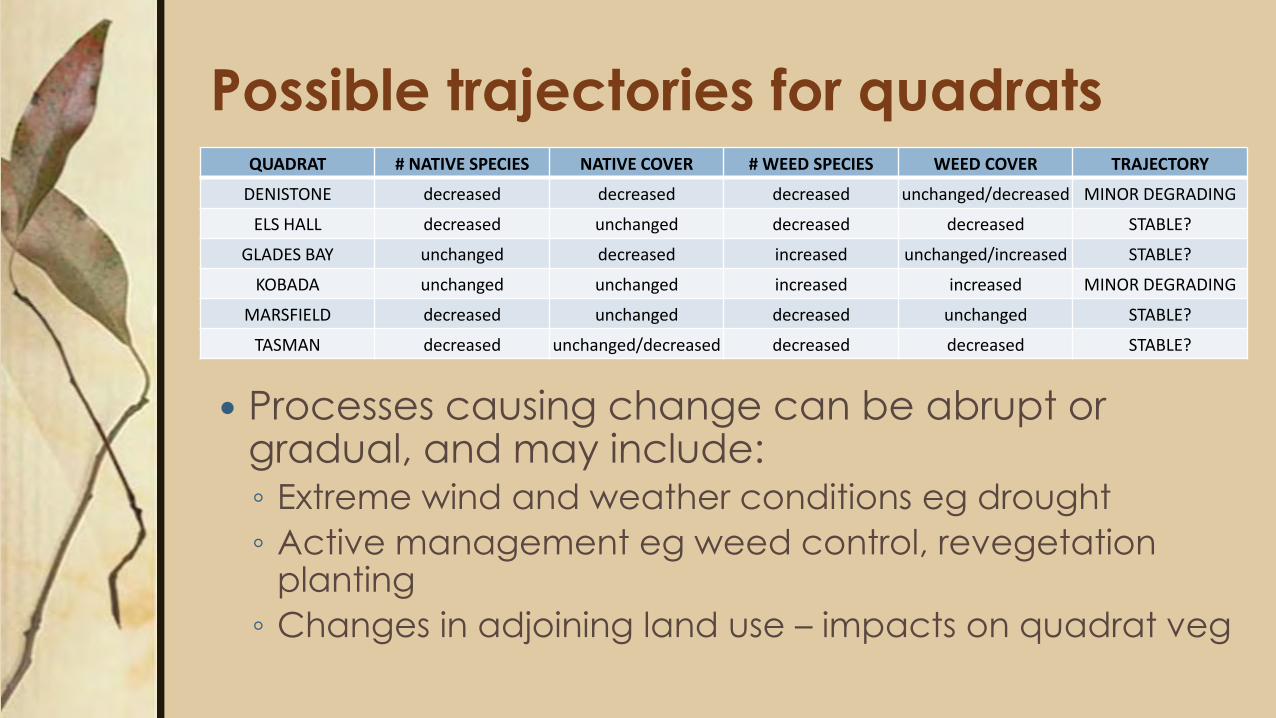
Possible trajectories for quadrats
Processes causing change can be abrupt or gradual, and may include: ◦ Extreme wind and weather conditions eg drought
◦ Active management eg weed control, revegetation planting
◦ Changes in adjoining land use – impacts on quadrat veg
QUADRAT # NATIVE SPECIES NATIVE COVER # WEED SPECIES WEED COVER TRAJECTORY
DENISTONE decreased decreased decreased unchanged/decreased MINOR DEGRADING
ELS HALL decreased unchanged decreased decreased STABLE?
GLADES BAY unchanged decreased increased unchanged/increased STABLE?
KOBADA unchanged unchanged increased increased MINOR DEGRADING
MARSFIELD decreased unchanged decreased unchanged STABLE?
TASMAN decreased unchanged/decreased decreased decreased STABLE?
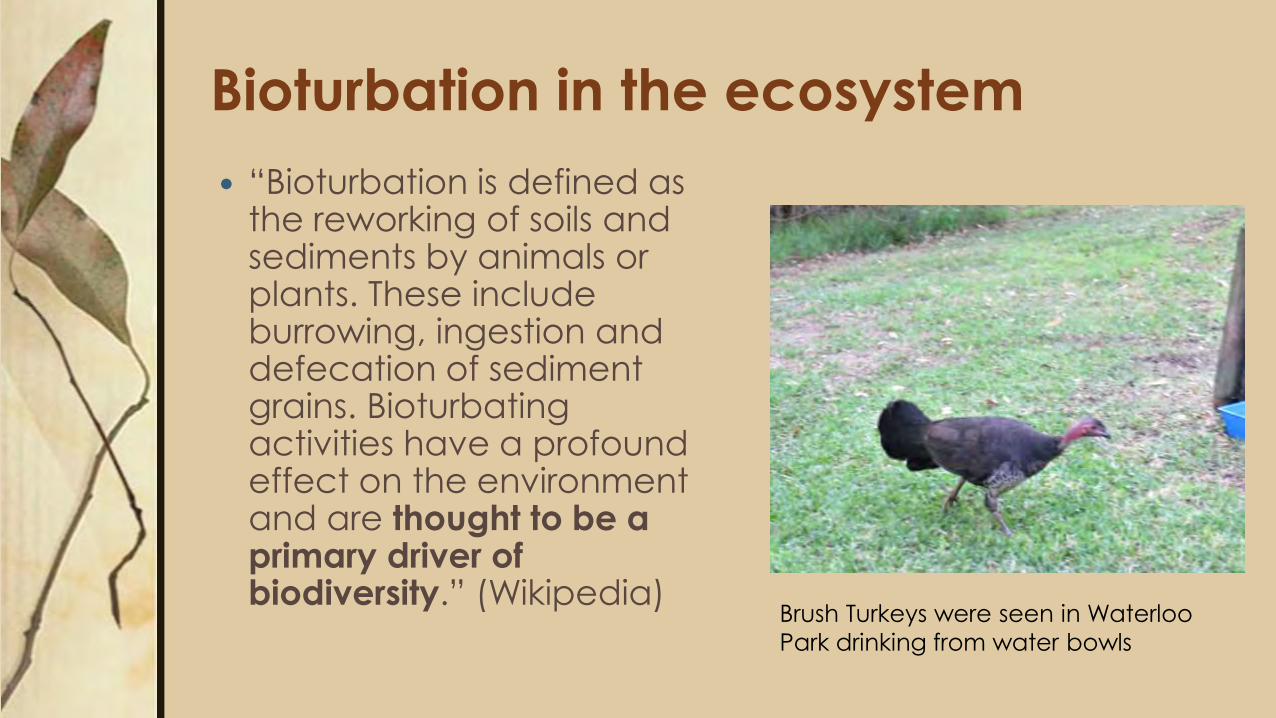
Bioturbation in the ecosystem
“Bioturbation is defined as the reworking of soils and sediments by animals or plants. These include burrowing, ingestion and defecation of sediment grains. Bioturbating activities have a profound effect on the environment and are thought to be a primary driver of biodiversity.” (Wikipedia)
Brush Turkeys were seen in Waterloo
Park drinking from water bowls
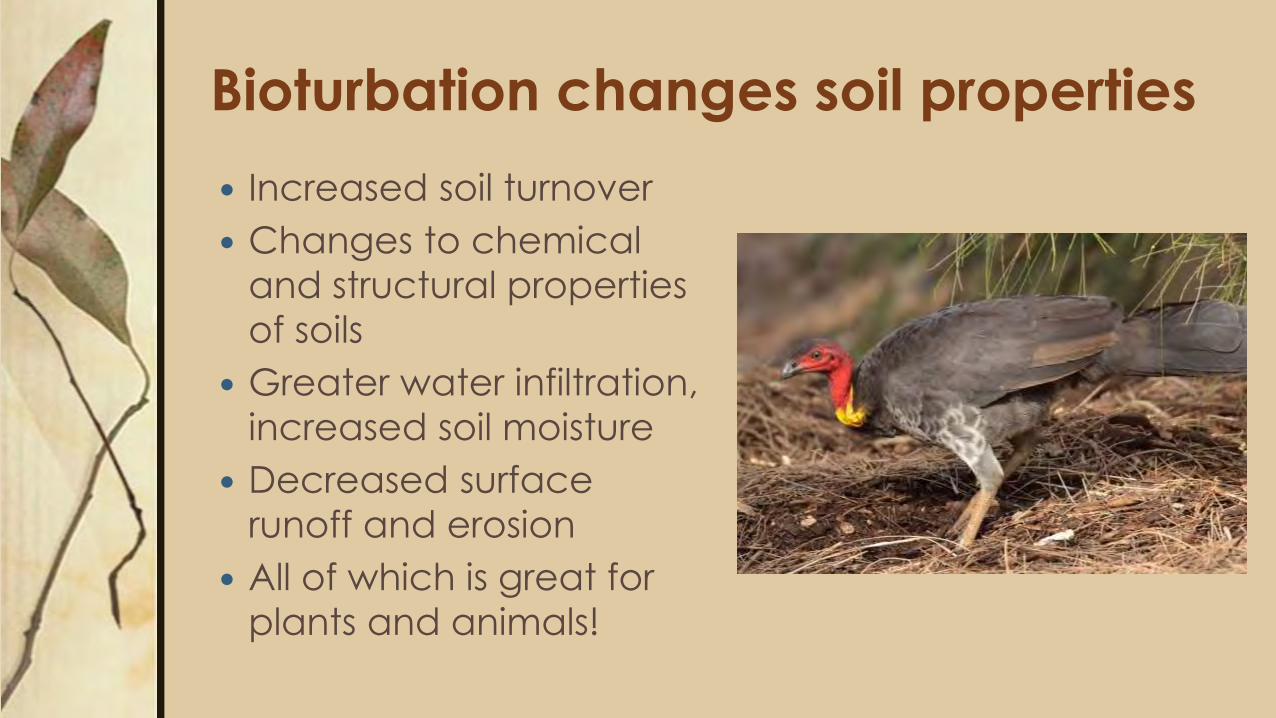
Bioturbation changes soil properties
Increased soil turnover
Changes to chemical
and structural properties
of soils
Greater water infiltration,
increased soil moisture
Decreased surface
runoff and erosion
All of which is great for
plants and animals!
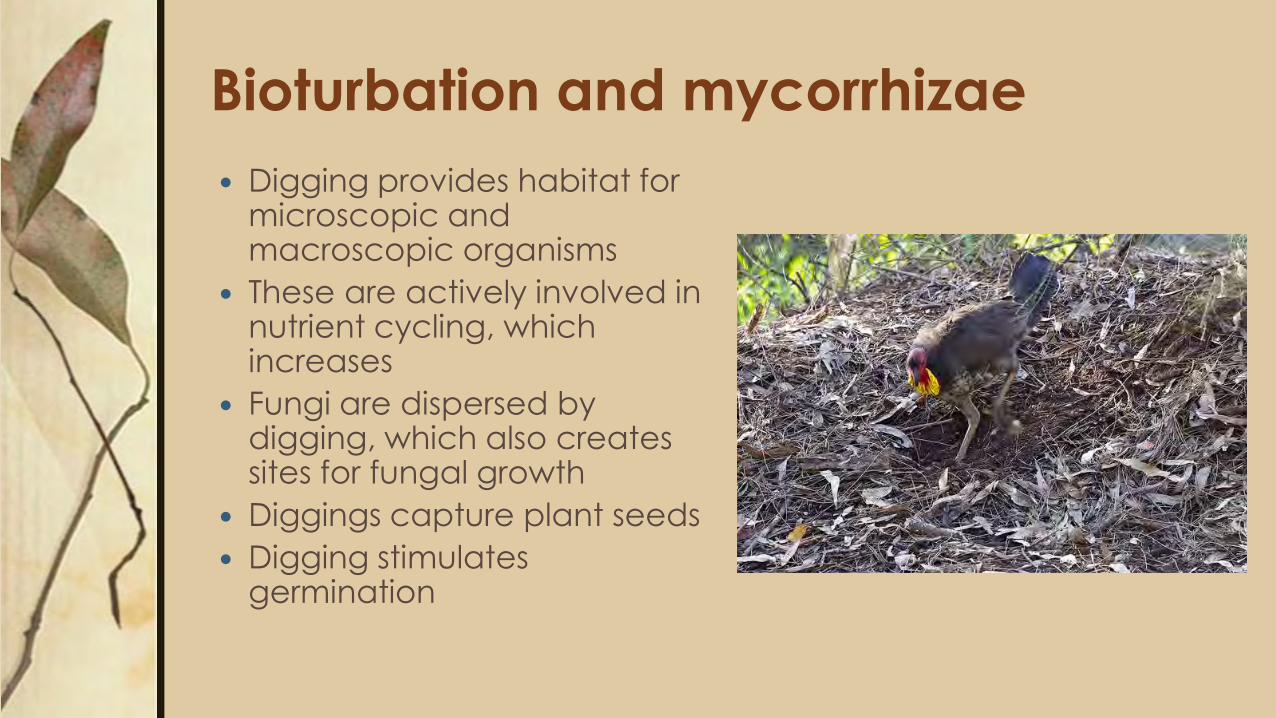
Bioturbation and mycorrhizae
Digging provides habitat for microscopic and macroscopic organisms
These are actively involved in nutrient cycling, which increases
Fungi are dispersed by digging, which also creates sites for fungal growth
Diggings capture plant seeds
Digging stimulates germination
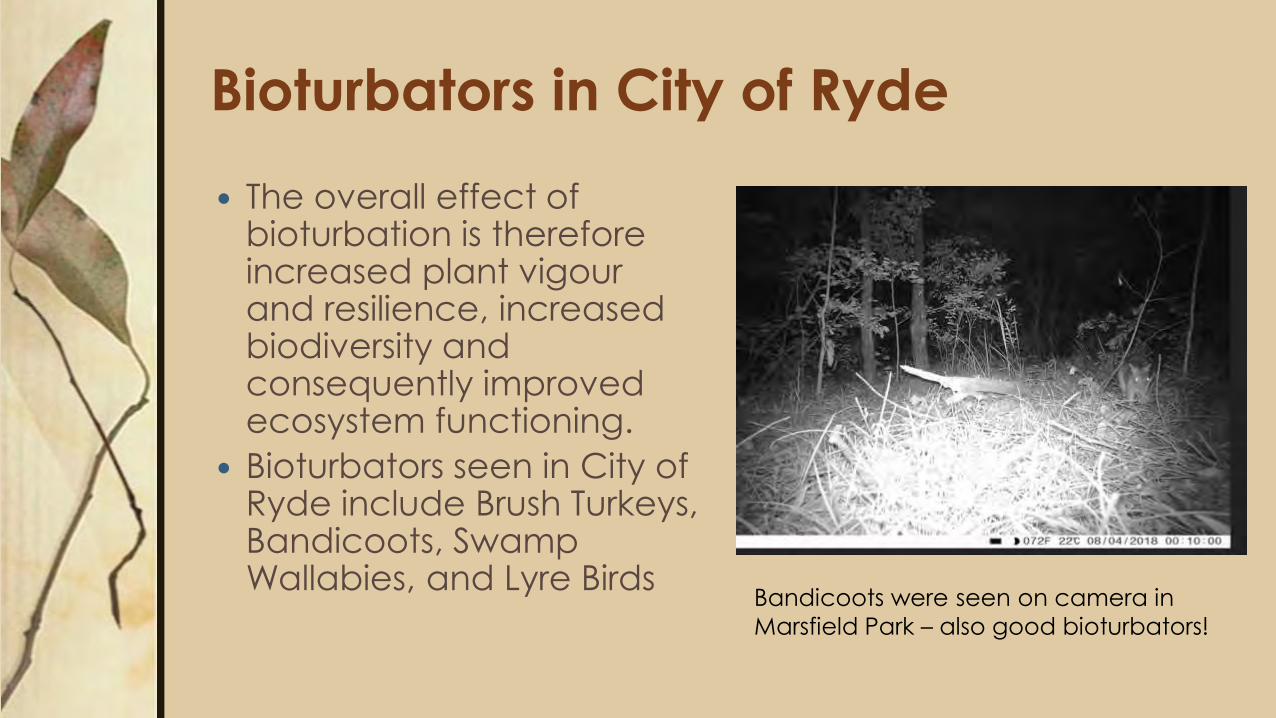
Bioturbators in City of Ryde
The overall effect of bioturbation is therefore increased plant vigour and resilience, increased biodiversity and consequently improved ecosystem functioning.
Bioturbators seen in City of Ryde include Brush Turkeys, Bandicoots, Swamp Wallabies, and Lyre Birds
Bandicoots were seen on camera in
Marsfield Park – also good bioturbators!
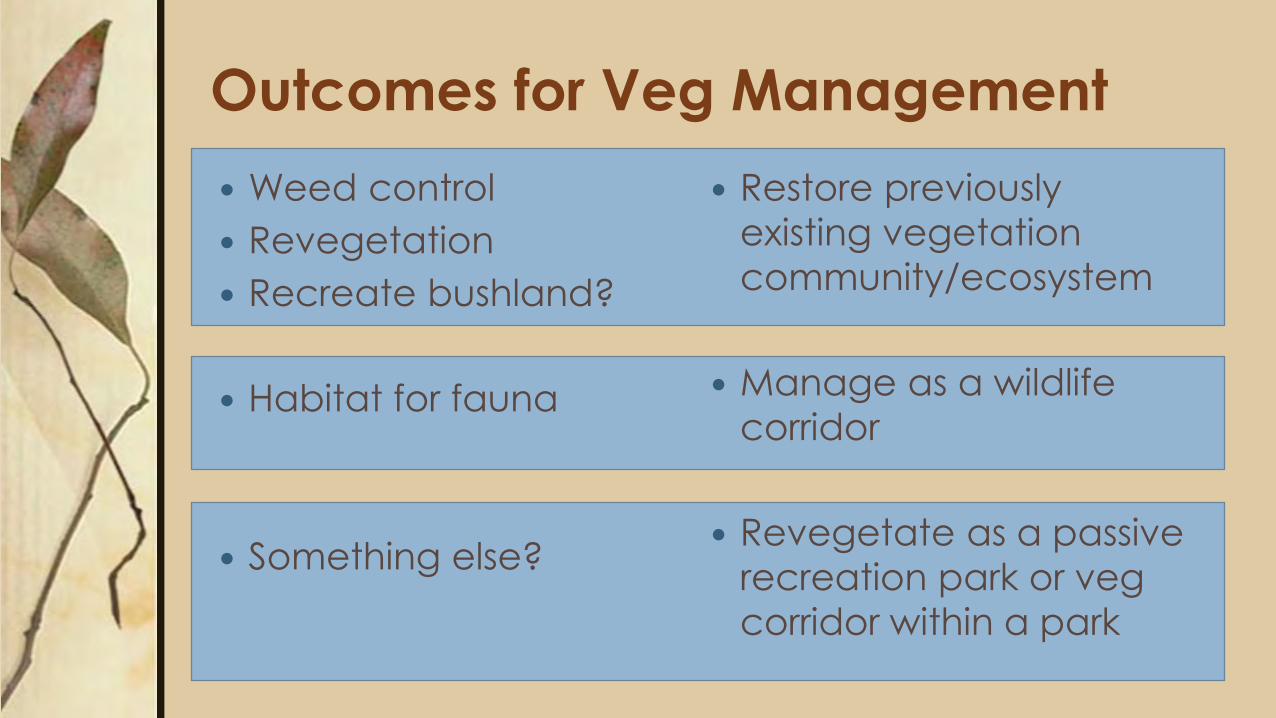
Outcomes for Veg Management
Weed control
Revegetation
Recreate bushland?
Habitat for fauna
Something else?
Restore previously
existing vegetation
community/ecosystem
Manage as a wildlife
corridor
Revegetate as a passive
recreation park or veg
corridor within a park
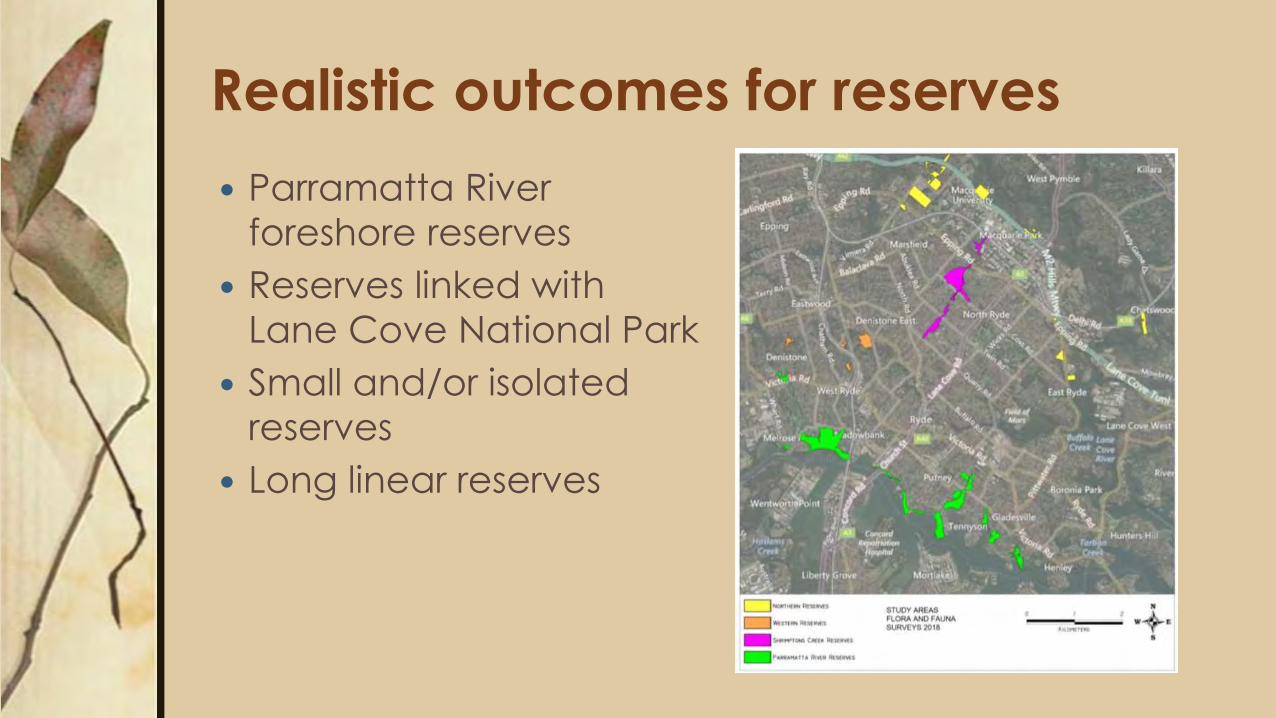
Realistic outcomes for reserves
Parramatta River
foreshore reserves
Reserves linked with
Lane Cove National Park
Small and/or isolated
reserves
Long linear reserves
WHERE TO FROM
HERE…
Spring surveys to repeat autumn (and
2008) surveys
Extensive vegetation surveys
Ground truthing vegetation communities
mapped in patches in all reserves
Convert 2008 results
Compile results for 2018 (autumn and
spring surveys) and compare with 2008
surveys