Embed Size (px)
Citation preview
Biodiversity Rapid AssessmentBiodiversity Rapid AssessmentTechniques:Techniques:
MacKinnon ListsMacKinnon Lists
Aidan MaccormickAidan MaccormickUniversity of St AndrewsUniversity of St Andrews
The Conservation ChallengeThe Conservation Challenge
• Many sites potentially important for conservation lack basic biodiversity Many sites potentially important for conservation lack basic biodiversity informationinformation
- E.g. Species lists, distribution, habitat relationships and distributions in - E.g. Species lists, distribution, habitat relationships and distributions in abundanceabundance
• What’s the best method for efficiently and accurately collecting What’s the best method for efficiently and accurately collecting biodiversity data?biodiversity data?
- Collected relatively rapidly- Collected relatively rapidly
- Comparable between sites- Comparable between sites
- Whole communities- Whole communities
Good quality Good quality biodiversity biodiversity informationinformation
Protected areas designProtected areas design
Species conservation assessmentsSpecies conservation assessments
Monitoring population trends Monitoring population trends
Potential Solutions Potential Solutions • Directly count all individuals?Directly count all individuals?
- Theoretically the perfect solution but often practically - Theoretically the perfect solution but often practically impossible (size of sites, time, costs etc.)impossible (size of sites, time, costs etc.)
• Count just individuals detected?Count just individuals detected?- More practical but confounded by effort, changes in - More practical but confounded by effort, changes in detectability over time etc.detectability over time etc.
• Standardise effort while counting? Encounter/capture Standardise effort while counting? Encounter/capture rate: e.g. individuals per day, per hour, per trap etcrate: e.g. individuals per day, per hour, per trap etc- More comparable but still sensitive to observer expertise , - More comparable but still sensitive to observer expertise , changes in detectability over time etc.changes in detectability over time etc.
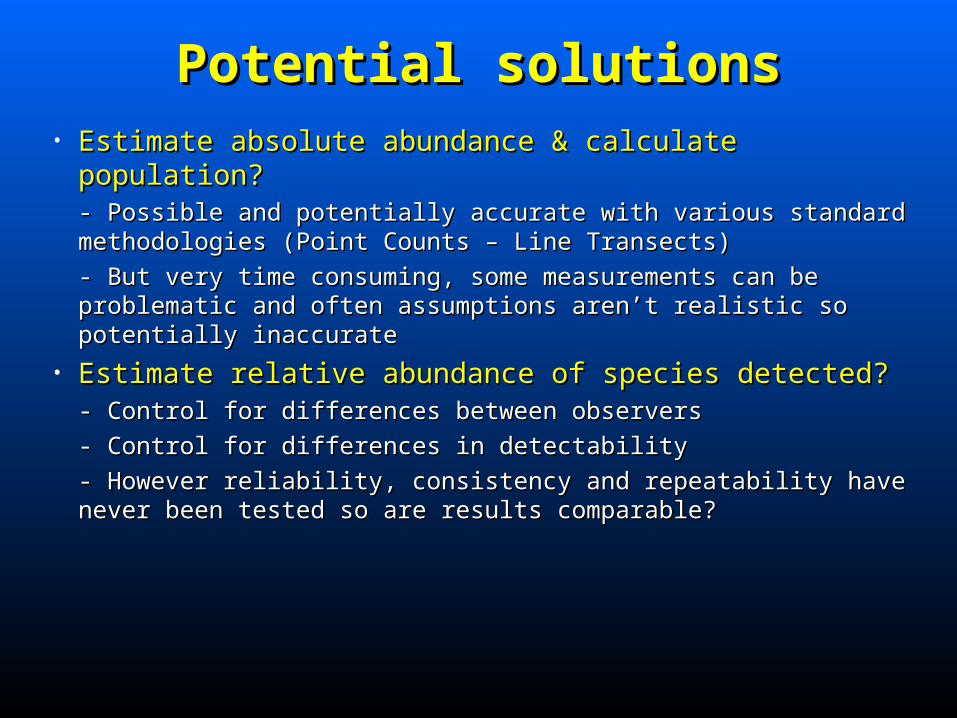
Potential solutionsPotential solutions• Estimate absolute abundance & calculate population?Estimate absolute abundance & calculate population?
- Possible and potentially accurate with various standard - Possible and potentially accurate with various standard methodologies (Point Counts – Line Transects)methodologies (Point Counts – Line Transects)
- But very time consuming, some measurements can be problematic - But very time consuming, some measurements can be problematic and often assumptions aren’t realistic so potentially inaccurateand often assumptions aren’t realistic so potentially inaccurate
• Estimate relative abundance of species detected?Estimate relative abundance of species detected?- Control for differences between observers- Control for differences between observers
- Control for differences in detectability- Control for differences in detectability
- However reliability, consistency and repeatability have never been - However reliability, consistency and repeatability have never been tested so are results comparable?tested so are results comparable?
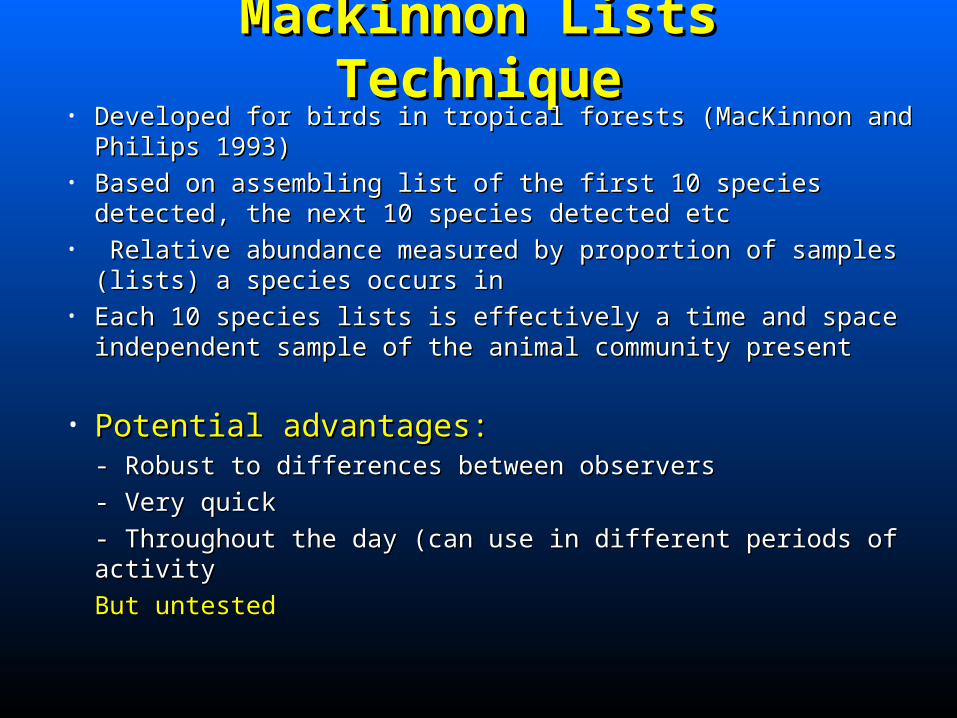
Mackinnon Lists TechniqueMackinnon Lists Technique• Developed for birds in tropical forests (MacKinnon and Philips 1993)Developed for birds in tropical forests (MacKinnon and Philips 1993)• Based on assembling list of the first 10 species detected, the next 10 Based on assembling list of the first 10 species detected, the next 10
species detected etcspecies detected etc• Relative abundance measured by proportion of samples (lists) a Relative abundance measured by proportion of samples (lists) a
species occurs inspecies occurs in• Each 10 species lists is effectively a time and space independent Each 10 species lists is effectively a time and space independent
sample of the animal community present sample of the animal community present
• Potential advantages:Potential advantages:- Robust to differences between observers- Robust to differences between observers
- Very quick- Very quick
- Throughout the day (can use in different periods of activity- Throughout the day (can use in different periods of activity
But untestedBut untested
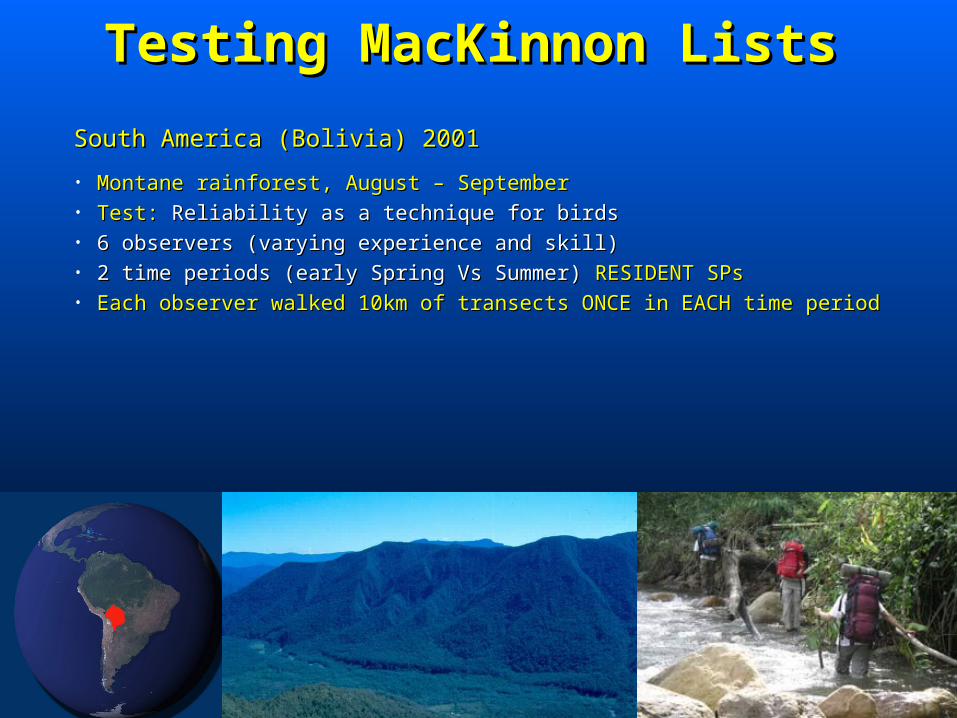
Testing MacKinnon ListsTesting MacKinnon Lists
South America (Bolivia) 2001South America (Bolivia) 2001
• Montane rainforest, August – SeptemberMontane rainforest, August – September• Test:Test: Reliability as a technique for birds Reliability as a technique for birds• 6 observers (varying experience and skill)6 observers (varying experience and skill)• 2 time periods (early Spring Vs Summer) 2 time periods (early Spring Vs Summer) RESIDENT SPsRESIDENT SPs• Each observer walked 10km of transects ONCE in EACH time periodEach observer walked 10km of transects ONCE in EACH time period
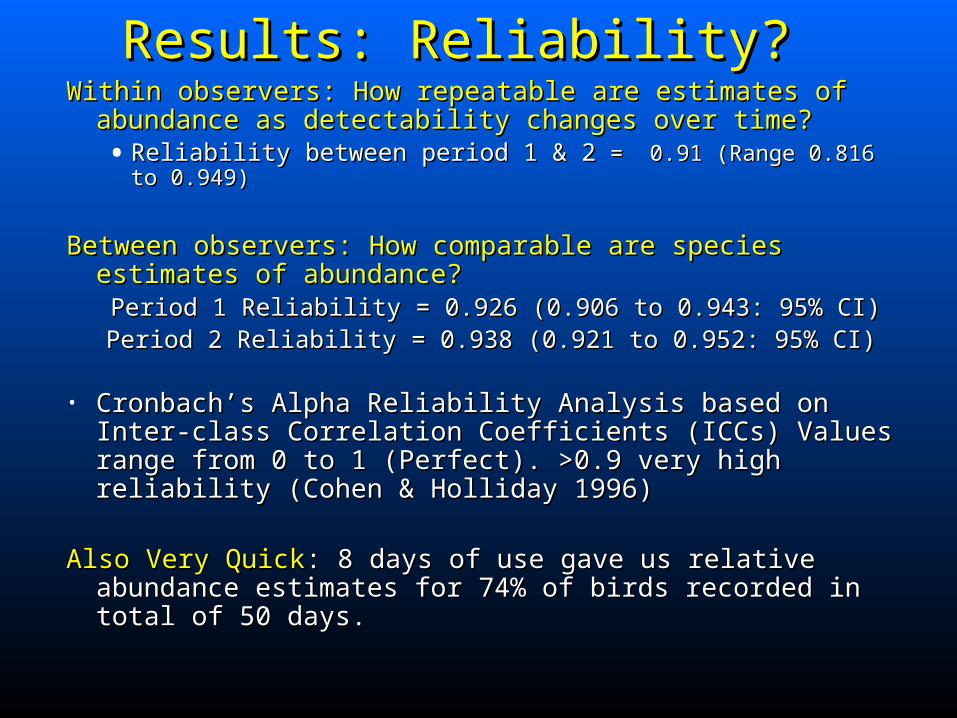
Results: Reliability?Results: Reliability?Within observers: How repeatable are estimates of abundance as Within observers: How repeatable are estimates of abundance as
detectability changes over time?detectability changes over time?• Reliability between period 1 & 2 Reliability between period 1 & 2 = 0.91 (Range 0.816 to 0.949)= 0.91 (Range 0.816 to 0.949)
Between observers: How comparable are species estimates of Between observers: How comparable are species estimates of abundance?abundance? Period 1 Reliability = 0.926 (0.906 to 0.943: 95% CI)Period 1 Reliability = 0.926 (0.906 to 0.943: 95% CI)Period 2 Reliability = 0.938 (0.921 to 0.952: 95% CI)Period 2 Reliability = 0.938 (0.921 to 0.952: 95% CI)
• Cronbach’s Alpha Reliability Analysis based on Inter-class Cronbach’s Alpha Reliability Analysis based on Inter-class Correlation Coefficients (ICCs) Values range from 0 to 1 Correlation Coefficients (ICCs) Values range from 0 to 1 (Perfect). >0.9 very high reliability (Cohen & Holliday 1996)(Perfect). >0.9 very high reliability (Cohen & Holliday 1996)
Also Very QuickAlso Very Quick: 8 days of use gave us relative abundance : 8 days of use gave us relative abundance estimates for 74% of birds recorded in total of 50 days.estimates for 74% of birds recorded in total of 50 days.
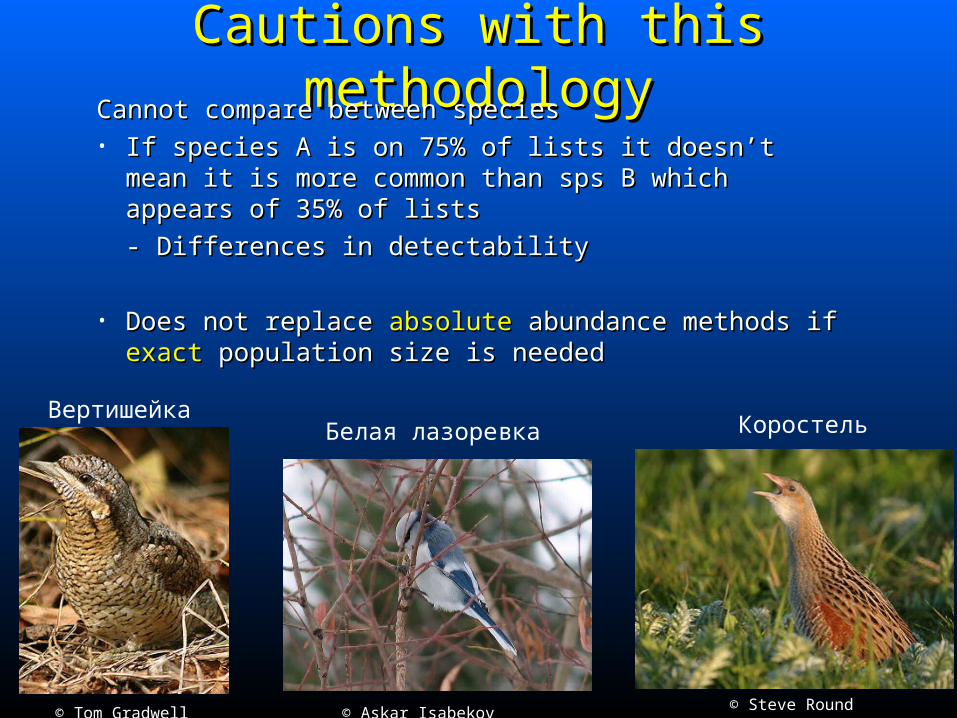
Cautions with this methodologyCautions with this methodologyCannot compare between species Cannot compare between species • If species A is on 75% of lists it doesn’t mean it is more If species A is on 75% of lists it doesn’t mean it is more
common than sps B which appears of 35% of listscommon than sps B which appears of 35% of lists
- Differences in detectability- Differences in detectability
• Does not replace Does not replace absoluteabsolute abundance methods if abundance methods if exactexact population size is needed population size is needed
© Tom Gradwell © Steve Round© Askar Isabekov
ВертишейкаБелая лазоревка Коростель
• ButterfliesButterflies- Either by visual identification along transects or a - Either by visual identification along transects or a combination of visual identification and netting along combination of visual identification and netting along transects (UK Butterfly Monitoring System)transects (UK Butterfly Monitoring System)
• Amphibians & Reptiles Amphibians & Reptiles - Ideal for use with nocturnal/diuranl Visual Encounter - Ideal for use with nocturnal/diuranl Visual Encounter SurveysSurveys
• Fish Fish - Could be used with trapping or netting- Could be used with trapping or netting
• Other terrestrial invertebratesOther terrestrial invertebrates- Could be used with trapping techniques (randomisation?)- Could be used with trapping techniques (randomisation?)
Other taxonomic groupsOther taxonomic groups
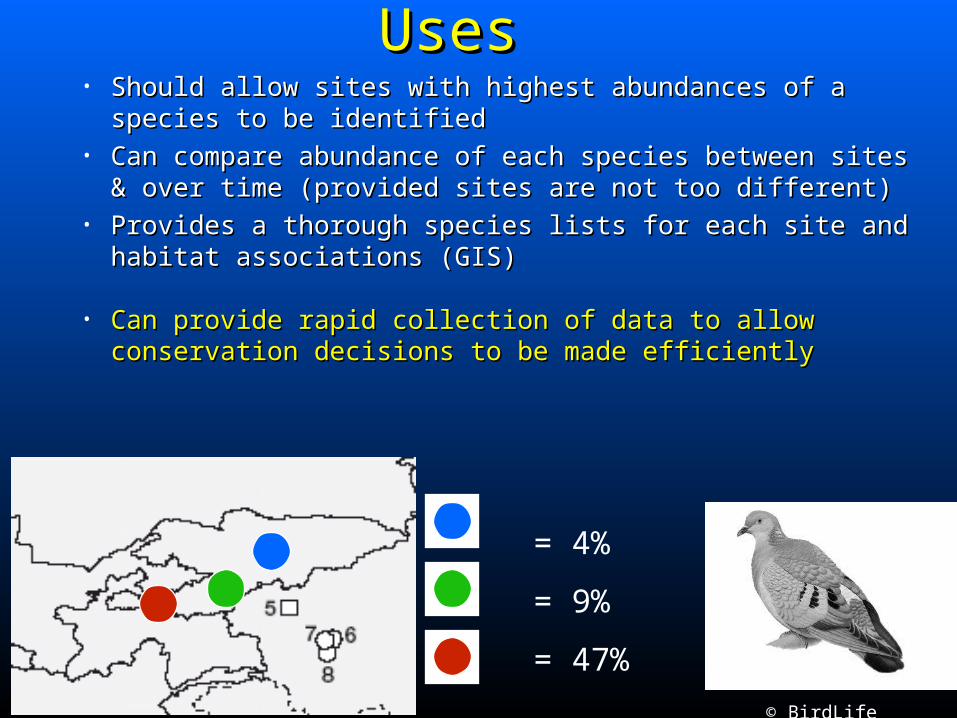
UsesUses• Should allow sites with highest abundances of a species to be Should allow sites with highest abundances of a species to be
identifiedidentified• Can compare abundance of each species between sites & over time Can compare abundance of each species between sites & over time
(provided sites are not too different) (provided sites are not too different) • Provides a thorough species lists for each site and habitat Provides a thorough species lists for each site and habitat
associations (GIS)associations (GIS)
• Can provide rapid collection of data to allow conservation decisions Can provide rapid collection of data to allow conservation decisions to be made efficientlyto be made efficiently
© BirdLife
= 4%
= 9%
= 47%
AcknowledgementsAcknowledgements
• Co-authors on this project, Ross Macleod, Karl Evans, Co-authors on this project, Ross Macleod, Karl Evans, Sebastian Herzog, Steven Ewing & Rosalind Bryce Sebastian Herzog, Steven Ewing & Rosalind Bryce
• Thanks to Armonia (the Bolivian Birdlife partner) for Thanks to Armonia (the Bolivian Birdlife partner) for logistical supportlogistical support
• Many thanks to BP Conservation Programme, Royal Many thanks to BP Conservation Programme, Royal Geographic Society, Thriplow Charitable Trust, Oxford Geographic Society, Thriplow Charitable Trust, Oxford University, Glasgow University, Gilchrist Educational University, Glasgow University, Gilchrist Educational Trust, SRGS, British Ecological Society & Russel Trust Trust, SRGS, British Ecological Society & Russel Trust for essential financial supportfor essential financial support


![Mackinnon J (Judith) [REDACTED] - Scottish Government...From: Mackinnon J (Judith) [REDACTED]@gov.scot> Sent: 25 May 2020 13:24 To: Mackinnon J (Judith) [REDACTED]@gov.scot> Subject:](https://img.pdfslide.us/doc/110x75/60b10ef1822da453294ca193/mackinnon-j-judith-redacted-scottish-government-from-mackinnon-j-judith.jpg)