Embed Size (px)
Citation preview
Biodiversity Net Gain (BNG) in Corporate Natural Capital Accounting (CNCA) Technical Report
November 2017
BNG in CNCA Technical Report
Forest Trends and eftec 1 November 2017
This document has been prepared by: Economics for the Environment Consultancy Ltd (eftec) 4 City Road London EC1Y 2AA www.eftec.co.uk Forest Trends Association 1203 19th Street, NW, 4th Floor Washington, DC 20036 www.forest-trends.org Study team: Ian Dickie, Adams Koshy (eftec) Kerry ten Kate, Amrei von Hase (Forest Trends) Reviewers: Ece Ozdemiroglu (eftec) Kerry ten Kate (Forest Trends) Katie Bolt (RSPB) Suggested Citation: Dickie, Ian, Koshy, Adams, ten Kate, Kerry and von Hase, Amrei. 2018. Biodiversity Net Gain in Corporate Natural Capital Accounting. Technical Report. Acknowledgements The study team would like to thank the John D. and Catherine T. MacArthur Foundation for helping to sponsor the development of this analysis. We would also like to thank Julia Baker at Balfour Beatty for all her help in the development of the case study, and Katie Bolt for her external peer review. Disclaimer This publication has been prepared for general guidance on matters of interest only, and does not constitute professional advice. You should not act upon the information contained in this publication without obtaining specific professional advice. No representation or warranty (express or implied) is given as to the accuracy or completeness of the information contained in this publication, and, to the extent permitted by law Economics for the Environment Consultancy Ltd, their members, employees and agents do not accept or assume any liability, responsibility or duty of care for any consequences of you or anyone else acting, or refraining to act, in reliance on the information contained in this publication or for any decision based on it. eftec offsets its carbon emissions through a biodiversity-friendly voluntary offset purchased from the World Land Trust (http://www.carbonbalanced.org) and only prints on 100% recycled paper.

BNG in CNCA Technical Report
Forest Trends and eftec 2 November 2017
Contents ACRONYMS AND ABBREVIATIONS .......................................................................................................... 4
EXECUTIVE SUMMARY ............................................................................................................................ 5
PROBLEM STATEMENT ............................................................................................................................ 6
2. PLANNING FOR BIODIVERSITY NET GAIN ........................................................................................... 8
2.1 Planning at the policy level ........................................................................................................... 8
2.2 Planning at the project level ......................................................................................................... 9
3. NATURAL CAPITAL ACCOUNTING..................................................................................................... 12
3.1 Natural Capital ............................................................................................................................ 12
3.2 Natural Capital Accounting ......................................................................................................... 13
3.3 Corporate Natural Capital Accounting (CNCA) ........................................................................... 14
4. LINKS BETWEEN BNG AND NCA ........................................................................................................ 17
4.1 BNG and CNCA Overlaps ............................................................................................................. 17
4.2 Combining BNG and CNCA .......................................................................................................... 19
5. WHEN IS A JOINT NNL-CNCA NEEDED?............................................................................................. 20
6. RECORDING A PROJECT OFFSET IN THE CNCA .................................................................................. 21
6.1 Accounting process ..................................................................................................................... 21
6.2 Implementation timeline ............................................................................................................ 23
6.3 Steps in producing an Offset-CNCA ............................................................................................ 23
6.4 Key factors and risks ................................................................................................................... 24
6.5 Guidance on Step by Step Accounting process ........................................................................... 27
7. CASE STUDY: Joint BNG-CNCA account Showing No Net Loss for a Transport Infrastructure
Upgrade................................................................................................................................................. 30
7.1 Overview ..................................................................................................................................... 30
7.2 Implementing the joint BNG-CNCA framework .......................................................................... 32
7.3 Alternative approaches to balance sheet presentation ............................................................. 62
7.4 Conclusions ................................................................................................................................. 64
8. GLOSSARY, WITH TERMINOLOGY COMPARISON .............................................................................. 65
REFERENCES .......................................................................................................................................... 72
ANNEX 1: MITIGATION HIERARCHY INCLUDING BIODIVERSITY OFFSETS ......................................... 73
ANNEX 2: CNCA FRAMEWORK .......................................................................................................... 75
A2.1 STAGE 1: Planning ................................................................................................................. 75
A2.2 STAGE 2: Development ......................................................................................................... 75
A2.3 STAGE 3: Review ................................................................................................................... 76
ANNEX 3: SPECIFIC APPLICATIONS OF THE CNCA TO THE BIODIVERSITY OFFSET PLANNING
PROCESS …………………………………………………………………………………………………………………………………….77
BNG in CNCA Technical Report
Forest Trends and eftec 3 November 2017
A3.1 Use of CNCA for monitoring .................................................................................................. 77
A3.2 Use in 3rd party offsets .......................................................................................................... 78

BNG in CNCA Technical Report
Forest Trends and eftec 4 November 2017
ACRONYMS AND ABBREVIATIONS BOMP Biodiversity Offset Management Plan CISL Cambridge Institute for Sustainability Leadership CNCA Corporate Natural Capital Accounting CSR Corportate Social Responsibility EP&L Environmental Profit and Loss NCA Natural Capital Accounting NCP Natural Capital Protocol NNL No Net Loss BNG Biodiversity Net Gain TBL Triple Bottom Line
BNG in CNCA Technical Report
Forest Trends and eftec 5 November 2017
EXECUTIVE SUMMARY A natural capital account can be used to quantify and compare the wider environmental benefits of planning for No Net Loss or Net Gain of Biodiversity (BNG for short). However, such accounts have tended to over-simplify biodiversity and its ecosystem services in the past. Using a BNG methodology, through a biodiversity metric, can improve this aspect of natural capital accounting frameworks and help organisations to show credible accounts with respect to biodiversity.
This paper defines a way of using Corporate Natural Capital Accounting (CNCA) to measure and report the wider environmental impacts of applying best practice methods (i.e. following the mitigation hierarchy) to achieve BNG of biodiversity (or some alternative defined goal).
The method is tested through a proof of concept case study of upgrading transport infrastructure. The upgrade involves unavoidable vegetation clearance for operational and safety reasons, and therefore requires biodiversity offsets of residual losses to achieve BNG.
The natural capital physical accounts and monetary accounts record the size and value of air quality regulation, climate regulation and recreational impacts of the scheme and offset. Costs of both are recorded in the maintenance cost account. These different elements are combined to give the net impact in the CNCA balance sheet, using both the biophysical biodiversity metric and monetary values for the changes to other natural capital assets.
The biodiversity metric is a biophysical measure that combines habitat type, distinctiveness and land cover and is recorded in the biodiversity account. It is based on Government guidance on biodiversity offsetting in England (Defra, 2012).
The CNCA and BNG methods complement one another and are enhanced when combined:
The CNCA statements can reflect the loss of natural capital when biodiversity is damaged, and the benefits of mitigation when implementing steps of the mitigation hierarchy, including investment in a biodiversity offset.
The use of an indicator of biodiversity from BNG assessments can help measure biodiversity in the asset register, and make net biodiversity impacts clear in a natural capital balance sheet.
The accounts also capture reasons for the change in natural capital asset values (mainly recreation) and the distribution of these impacts, giving additional evidence to project planners and decision-makers.
The accounting structure can be consistently applied ex-post, during and ex-ante, and thus can also be used to monitor both the biodiversity and wider natural capital impacts of a scheme.
This paper is thought to be one of the first attempts to reflect the quantified application of the mitigation hierarchy with a view to achieving a net gain of biodiversity, including a biodiversity offset, in a natural capital account for a development project. Anyone interested in further information about this work is invited to contact:
Ian Dickie (eftec): [email protected] or Kerry ten Kate (Forest Trends): [email protected]
BNG in CNCA Technical Report
Forest Trends and eftec 6 November 2017
PROBLEM STATEMENT
Global population, economic growth, and ongoing loss of biodiversity and ecosystems1 (see Box 1.1) have resulted in increased attention on the dependence of economies on natural systems (Global Biodiversity Outlook 3, 2010), and the risk to business of biodiversity and ecosystem loss2.
Box 1.1: Pressures on Biodiversity "Biological diversity" is the variability among living organisms from all sources including, inter alia, terrestrial, marine and other aquatic ecosystems and the ecological complexes of which they are part; this includes diversity within species, between species and of ecosystems. (CBD Art 2) Global Biodiversity Outlook 3 (GBO-3) found that all major pressures on biodiversity were increasing. These included:
Loss, degradation and fragmentation of natural habitats
Overexploitation of biological resources
Pollution, in particular the build-up of nutrients such as nitrogen and phosphorus in the environment
The impacts of invasive alien species on ecosystems and the services they provide to people
Climate change and acidification of the oceans, associated with the build-up of greenhouse gases in the atmosphere.
GBO-3 also warned that some ecosystems were being pushed towards critical thresholds or tipping points. If these thresholds were passed, there was a real risk of dramatic loss of biodiversity and degradation of a broad range of services on which people depend for their livelihoods and well-being. The poor would suffer the earliest and most severe impacts, but ultimately all societies and economies would be affected. Source: GBO 3: https://www.cbd.int/doc/publications/gbo/gbo3-final-en.pdf Secretariat of the Convention on Biological Diversity (2010) Global Biodiversity Outlook 3. Montréal, 94.
In response, governments and companies worldwide have begun to account for the gains and losses in the stock of natural capital that result from their economic activity, using methods and terminology documented in the Natural Capital Protocol (2016). At the same time, these organisations are setting associated policy goals on biodiversity and ecosystem loss to achieve No Net Loss or a Biodiversity Net Gain (NNL/BNG), see Box 1.2. For example, some 100 governments have policies related to improving the application of the mitigation hierarchy, biodiversity offsets or compensation, and some make specific reference to NNL/BNG (The Biodiversity Consultancy, 2016; ten Kate and Crowe, 2014; CDC Biodiversité, 2014)3. Since 1 January 2012, the International Finance Corporation (IFC) and the Equator Principles Association (now 90 financial institutions)4 require clients with impacts on natural and critical habitat to demonstrate no net loss of biodiversity for natural habitat, where feasible, and a net gain of biodiversity for critical habitat. In 2016, the World Bank updated its own safeguard policies related to impact mitigation (including reference to BNG) and IUCN – The World Conservation Union – adopted a policy on biodiversity offsets in August 2016. In addition, some 40 companies now have ‘No Net Loss’/’Net Gain’/’Net Positive Impact’ or similar commitments; and the 50 CEOs of manufacturing and retailing companies that comprise the Board of The Consumer Goods Forum
1 See: https://www.cbd.int/gbo/gbo4/publication/gbo4-en.pdf
2 e.g. https://www.mercer.com/content/dam/mercer/attachments/global/wef-global-risks-report-2016-mercer.pdf
3 For more research in this area, please see: www.wildbusiness.org/research
4 http://www.equator-principles.com/
BNG in CNCA Technical Report
Forest Trends and eftec 7 November 2017
have ‘pledged to mobilise resources within our respective businesses to help achieve zero net deforestation by 2020’5.
Box 1.2: Biodiversity Net Gain or an alternative goal? Governments and companies around the world are embracing the need to address the loss of biodiversity by setting goals for biodiversity and commitments to reach these, through government policy, corporate policy and financial safeguards. Some phrase their goals in terms of ‘Biodiversity Net Gain’ or ‘Net Positive Impact’, some in terms of ‘No Net Loss’, and others define alternative conservation outcomes for biodiversity. (See the BBOP Roadmaps for Business and for Government for more information.) For simplicity, this Resource Paper refers to Biodiversity Net Gain (BNG) as the goal used in the integrated Biodiversity-Natural Capital Account, but users can adapt the framework to reflect the goal that best reflects their circumstances.
Although natural capital accounting and BNG reporting have developed (largely) independently, these concepts are intrinsically tied together: as a change in biodiversity represents a change in natural capital. Therefore, this raises questions about the link between natural capital accounting and the objectives to attain BNG goals, as well as understanding how emerging and innovative natural capital accounting methods do justice to biodiversity and ecosystem services. Biodiversity presents specific challenges, with its representation natural capital accounting leaving room for improvement (University of Cambridge Institute for Sustainability Leadership, 2016). This report sets out a methodology for preparing Natural Capital Balance Sheets linked to project (or regional) BNG goals for biodiversity. This represents a step forward in accounting for BNG biodiversity goals as these Balance Sheets explicitly address biodiversity and ecosystem services’ impacts and desired outcomes, which have been absent or unclear in reporting to date. The remainder of this report is structured as follows:
Section 2: provides a summary of the methodology for measuring and planning for biodiversity net gain.
Section 3: describes the different natural capital accounting approaches, particularly focusing on the Corporate Natural Capital Accounting (CNCA) framework.
Section 4: outlines the links between the BNG methodology and the CNCA framework.
Section 5: presents the conditions under which a joint BNG and CNCA account would be considered beneficial.
Section 6: is the detailed outline of the joint BNG and CNCA methodology.
Section 7: presents a case study of the joint methodology applied to a transport infrastructure upgrade project.
Section 8: is a detailed glossary of the different terminology used in each methodology. In addition, there are four supporting annexes:
Annex 1: a detailed outline of the steps in the mitigation hierarchy and offsets methodology.
Annex 2: a detailed outline of the steps in the CNCA framework.
Annex 3: an outline of the application of the CNCA framework as a monitoring tool in the biodiversity offset planning process.
Annex 4: two potential applications of the CNCA framework to the biodiversity offset planning process, for monitoring and in 3rd party offsets.
5 http://www.theconsumergoodsforum.com/sustainability-strategic-focus/climate-change/deforestation

BNG in CNCA Technical Report
Forest Trends and eftec 8 November 2017
2. PLANNING FOR BIODIVERSITY NET GAIN Since 2012, there has been a growing commitment by governments, intergovernmental bodies, banks, export credit agencies, individual companies and non-governmental organisations to achieve ‘No Net Loss’ and a ‘Net Gain’ (or ‘Net Positive Impact’) on biodiversity, i.e. BNG. This section outlines the method for planning for BNG, which currently takes place at two levels:
Planning for Biodiversity Net Gain at the policy level – which focuses on the impacts on biodiversity from economic activities at the national, regional or local levels; and
Planning for Biodiversity Net Gain at the project level – which focuses on the impacts on biodiversity from the development of individual projects.
The following subsections provide an overview of the current methodology and relevance to this project. Although, this project is primarily concerned with merging BNG with natural capital accounting (NCA) at a project level, the methods developed are likely suitable to be scaled up to the policy level, once experience is gained in their implementation.
2.1 Planning at the policy level
Governments are introducing BNG goals in a number of ways. For example, they set out, within legislation, a requirement that project proponents undertake an environmental impact assessment (EIA); assess the predicted impacts on biodiversity of their proposed project; and indicate the mitigation measures they would take in order to arrive at no net loss/net gain of biodiversity, by following the mitigation hierarchy steps (first avoid, then minimise, restore and finally offset residual impacts). The national systems on BNG typically comprise the following key parts:
Law and policy: Government policy on the mitigation hierarchy, including biodiversity offsets, typically comprises elements such as: the policy commitment (including an aspirational goal and more detail on how, programmatically, government will put this into practice); the legal basis clarifying whether the policy is mandatory or voluntary and (if the former) how it is established in law; and guidelines on how regulators should apply and developers comply with the policy, including process and content.
Data gathering and capacity building: to underpin BNG delivery and serve as the basis for landscape-level planning and definition of ‘exchange rules’ (like for like or better) and metrics to calculate residual losses and offsets’ gains.
Mechanisms for implementation of mitigation measures: Proponents often have the choice of implementing their own offsets, paying in lieu fees to government, or purchasing the biodiversity credits they need from third party suppliers such as conservation banks. Where this type of market mechanism is an option for the supply of biodiversity offsets, the basic elements are units of trade (credits), trading rules, standards and credit registers.
Approaches for monitoring, evaluation, enforcement and adaptive learning: including pilot approaches to support the evolution of policy design and implementation.
Much of the effort around the world on natural capital accounting currently concerns accounting at the national level, particularly the improvement of national income accounts6. As a result, it would be useful
6 See https://www.wavespartnership.org/ and https://unstats.un.org/UNSD/envaccounting/eea_project/
BNG in CNCA Technical Report
Forest Trends and eftec 9 November 2017
to explore how national policy goals for BNG of biodiversity could be integrated with these national accounting
frameworks 7. In time, individual organisational accounts, such as the biophysical and financial accounts described in this paper, could be aggregated and contribute to national level accounts and national policy goals of BNG.
2.2 Planning at the project level
Project developers need to comply with all national, regional or local policy that sets out how impacts on biodiversity from their project should be mitigated (see Section 2.1, above). In the absence of clear policy, or if the developer is planning for BNG on a voluntary basis8, they follow the mitigation hierarchy of ‘avoid, minimise, restore and offset residual impacts’ (BBOP, 2009). The developer is likely to follow two broad stages:
Designing mitigation measures to avoid, minimise, restore and (finally) to offset residual impacts; and
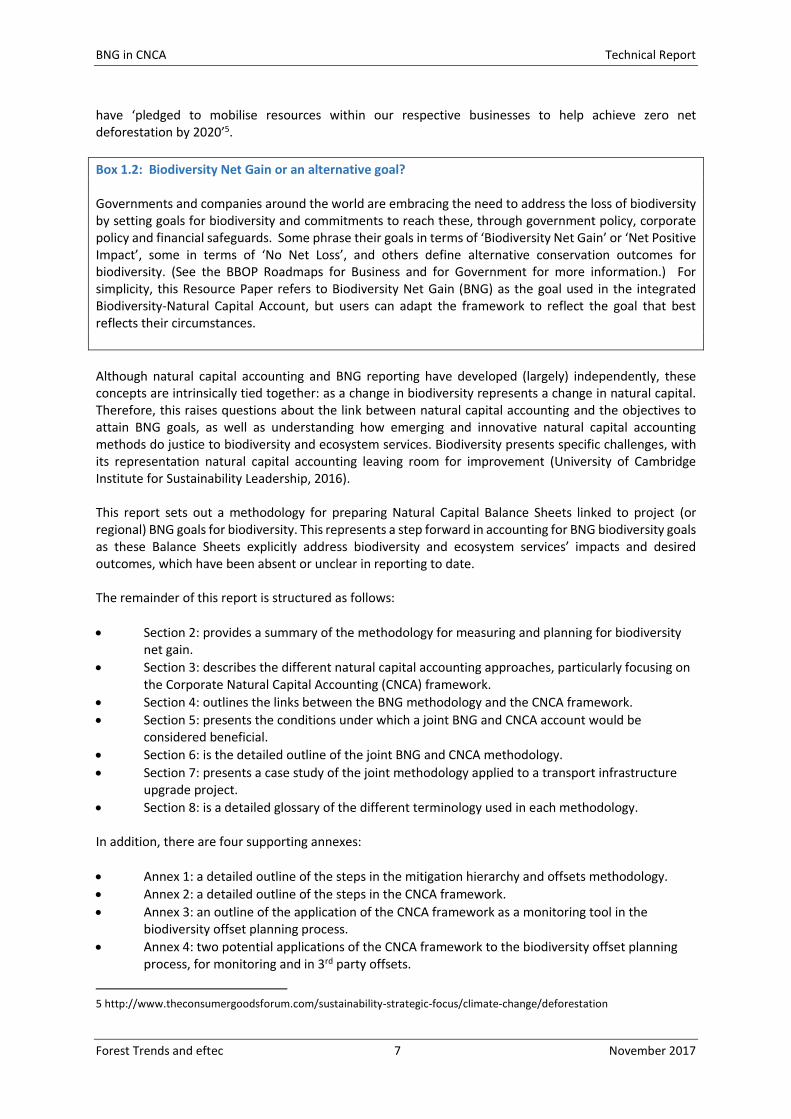
Implementing these measures over the long term. The following subsections provide an outline of these stages. Designing mitigation measures Figure 2.1 summarises the mitigation hierarchy. These are the primary steps involved in designing the mitigation measures. For a more detailed outline see BBOP (2009). Figure 2.1: Mitigation Hierarchy
7 For instance, the estimated benefits and the costs associated with investment in activities to attain and then maintain
NNL/NG of biodiversity could be recorded within national natural capital accounts. However, national level natural capital
accounts are not the focus of this paper, which concentrates instead on corporate natural capital accounting by sub-
national level entities such as companies, local authorities, major landowners and conservation organisations.
8 For instance, because of a corporate commitment to NNL/NG or to meet loan conditions from financial institutions.
BNG in CNCA Technical Report
Forest Trends and eftec 10 November 2017
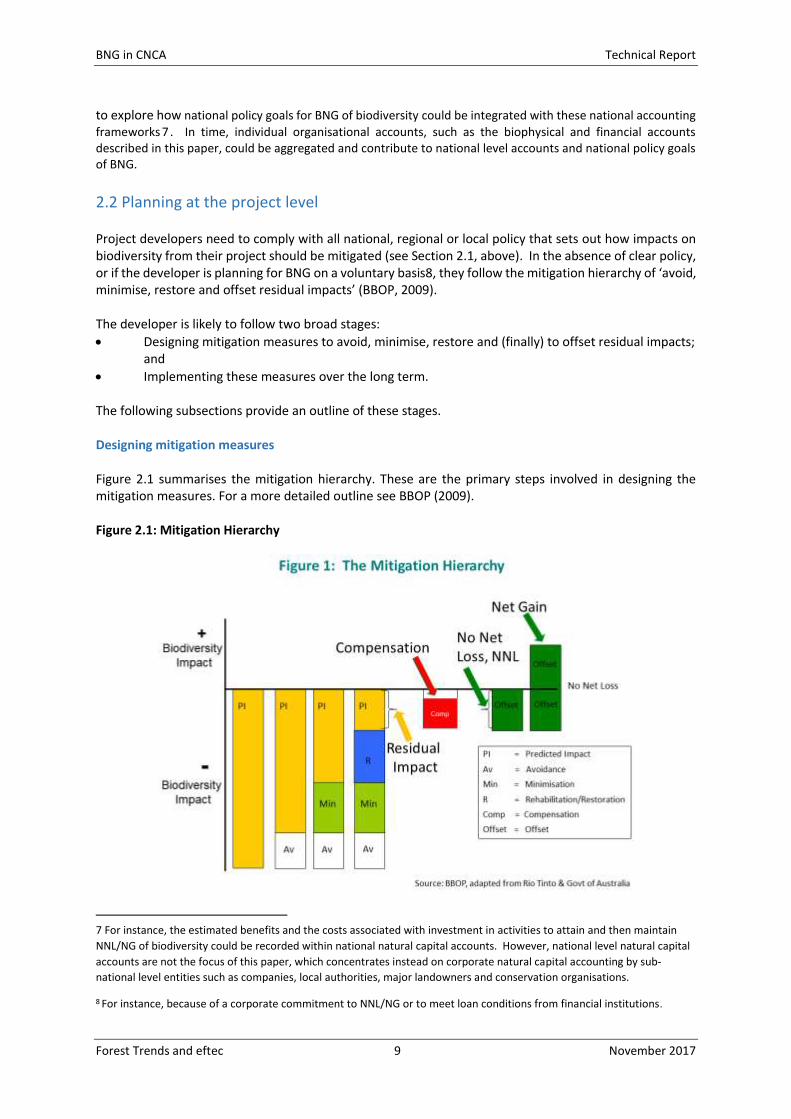
Notes: Based on the BBOP Biodiversity Offset Design Handbook (in black) and the Cost Benefit Handbook (in grey).
These steps are usually followed in a chronological order, but as they are interdependent steps, there is considerable flexibility in how the design of mitigation measures is best approached, depending on the specific local context. This figure also integrates the related (but not necessarily sequential) activities described in the two handbooks:
The BBOP Cost-Benefit Handbook - which focus on accounting for people’s use and cultural values of biodiversity in the offset design and implementation process; and
The Biodiversity Offset Implementation Handbook – which focuses on actions involved in implementing a successful biodiversity offset.
These steps provide a key part of the contextual and biophysical information required to develop a natural capital account.
BNG in CNCA Technical Report
Forest Trends and eftec 11 November 2017
Implementation in the long term Having defined the location of the offset areas (in a single location, or as a composite) and the nature of offset activities, it is necessary to put in place the mechanisms to ensure effective offset implementation, permanence and good governance. The success of long-term mitigation measures (including biodiversity offsets) depends on ensuring that an effective institutional and management structure is in place; that financial flows are sufficient; and that systems are in place to ensure that the mitigation objectives are achieved. Recording the offset design with natural capital accounting is intended to ensure that the value of mitigation measures is recognised (whether quantified or monetised) within the business’ accounts and, as a result, is more effectively delivered and monitored over time. Measuring biodiversity net gain Biodiversity is measured in this report using a biophysical metric for biodiversity units. Following government guidance in England on biodiversity offsetting (Defra, 2012), this metric is an indicator that combines the distinctiveness, condition and area of defined land. The greater the distinctiveness (measured as low (2), medium (4) or high (6)), the better the condition (measured as poor (1), moderate (2) or good (3)) and the greater the area (measured in hectares), the greater the biodiversity units measured on the land. It is a measure of the stock of biodiversity at the site, i.e. a measure of biodiversity that can be maintained over time. It can also be used to project the stock following activities on the site. As the outcome of these activities is uncertain, the biodiversity units are adjusted using risk factors, such as:
the ‘time to target condition’ measure of the likelihood that a certain biodiversity unit will be formed in a number of years’ time;
a ‘difficulty’ factor, a measure of the difficulty of achieving the intended restoration; and
a ‘spatial’ risk factor, the ecological risks from the change in location of the habitat. The primary risk factor of interest in is the time to target condition factor. Therefore, when measuring no net loss, biodiversity units allow us to measure the (current) stock of the biodiversity at a site, and the change in stock due to the impact and offsetting activities, following the mitigation hierarchy (Figure 2.1).
BNG in CNCA Technical Report
Forest Trends and eftec 12 November 2017
3. NATURAL CAPITAL ACCOUNTING
3.1 Natural Capital
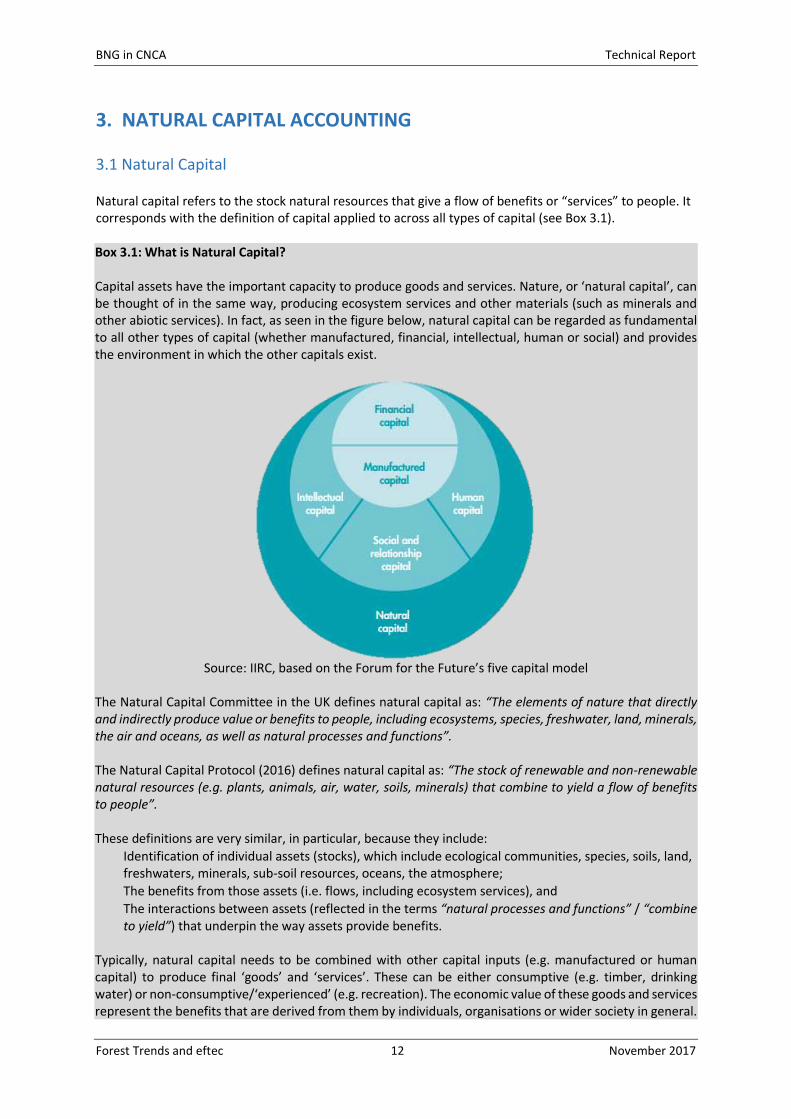
Natural capital refers to the stock natural resources that give a flow of benefits or “services” to people. It corresponds with the definition of capital applied to across all types of capital (see Box 3.1). Box 3.1: What is Natural Capital? Capital assets have the important capacity to produce goods and services. Nature, or ‘natural capital’, can be thought of in the same way, producing ecosystem services and other materials (such as minerals and other abiotic services). In fact, as seen in the figure below, natural capital can be regarded as fundamental to all other types of capital (whether manufactured, financial, intellectual, human or social) and provides the environment in which the other capitals exist.
Source: IIRC, based on the Forum for the Future’s five capital model
The Natural Capital Committee in the UK defines natural capital as: “The elements of nature that directly and indirectly produce value or benefits to people, including ecosystems, species, freshwater, land, minerals, the air and oceans, as well as natural processes and functions”. The Natural Capital Protocol (2016) defines natural capital as: “The stock of renewable and non-renewable natural resources (e.g. plants, animals, air, water, soils, minerals) that combine to yield a flow of benefits to people”. These definitions are very similar, in particular, because they include:
Identification of individual assets (stocks), which include ecological communities, species, soils, land, freshwaters, minerals, sub-soil resources, oceans, the atmosphere;
The benefits from those assets (i.e. flows, including ecosystem services), and
The interactions between assets (reflected in the terms “natural processes and functions” / “combine to yield”) that underpin the way assets provide benefits.
Typically, natural capital needs to be combined with other capital inputs (e.g. manufactured or human capital) to produce final ‘goods’ and ‘services’. These can be either consumptive (e.g. timber, drinking water) or non-consumptive/‘experienced’ (e.g. recreation). The economic value of these goods and services represent the benefits that are derived from them by individuals, organisations or wider society in general.
BNG in CNCA Technical Report
Forest Trends and eftec 13 November 2017
The term ‘capital’ is familiar to business and has been useful to help explain environmental management concepts to private sector decision-makers. In particular, natural capital accounting can be a helpful concept in the attempt to integrate environmental impacts and dependencies into the financial accounting and planning processes that inform business’ decision making. Natural capital accounting also aligns well with a global move towards integrated reporting, since it tracks the different forms of capital that companies use to create value over time, including natural capital9. As a result, accounting for natural capital is an essential part of accounting for the true value of a company.
3.2 Natural Capital Accounting
In the broadest sense of the term, natural capital accounting (NCA) refers to any method that ‘takes into account’ an organisation’s impacts and dependencies on natural capital assets (eftec et al., 2016), or ‘consider [them] in decision-making’ (A4S, 2015). NCA can involve the methods that measure impacts and dependencies, and does not necessarily require monetary valuation (NCP, 2016), but should allow for standardised comparisons across different timescales, spatial scales, benefits (e.g. ecosystem services) and organisations. Therefore, CSR reports without any quantiative information do not count as natural capital accounts. Natural capital accounting can bring two key benefits of (in particular financial) accounting to environmental management. Firstly, financial accounting has a widely recognised structure for presenting an organisation’s financial performance data that is consistent between organisations and over time. Environmental data, on the other hand, are collected in different units (inevitably) and analysed separately. Secondly, financial accounting distinguishes between increased flows of finance (profit and loss), and changes to wealth (value of assets and liabilities). Most environmental data, however, is about the flows (e.g. emissions, extraction etc) over a given period, but not about the quality or quantity of the stock of assets. This paper is interested in seeing how these benefits could be realised for BNG decisions through natural capital accounting. Therefore, NCA is defined tightly as: the use of a framework to measure and value an organisation’s natural capital impacts and/or dependencies in a systematic and repeatable manner. To date, there has been relatively slow progress in the application of appropriate planning and accounting tools to biodiversity in business. According to the Cambridge Institute for Sustainability Leadership (CISL), “There is growing understanding across sectors of the dependency upon the natural environment and biodiversity for productivity and resilience in production systems” (CISL, 2016). The CISL report acknowledges that businesses’ awareness of their dependencies upon natural capital and the flow of services they provide has “tended to focus on water usage and carbon emissions, often neglecting impacts on other critical aspects of natural capital such as ecosystems and biodiversity. While recognition of companies’ dependency on biodiversity and ecosystem services is growing, there is still a dearth of practical approaches for business to measure their impacts in such a way that they underpin strategies to enhance, restore and protect natural capital.” Although the report primarily focuses on the Environmental Profit and Loss (EP&L) accounting method, these observations also apply to other NCA methods, as set out in Table 3.1.
9 According to the International Integrated Reporting Council (IIRC), natural capital is one six forms of capital which
companies draws from to create value over time (IIRC, 2016). See also eftec (2016) for JNCC.
BNG in CNCA Technical Report
Forest Trends and eftec 14 November 2017
Table 3.1: NCA methods Methods Description Environmental Profit and Loss (EP&L)
Compares the scale and/or value of environmental impacts along a business value chain and is useful to identify the most material issues to inform the management of natural capital risks and opportunities across complex supply chains.
Triple Bottom Line (TBL) Accounts for organisational performance in three distinct parts: social, environmental and financial and often provides a monetary/non-monetary overview of the current state of the each category.
Corporate Natural Capital Accounting (CNCA)
Uses an accounting process to produce a balance sheet and income statement for natural capital. It can assess whether the value of natural capital assets (i.e. their ability to produce benefits into the future) is being maintained (or enhanced/ degraded).
Of these methods, the CNCA is the only one to explicitly take a long term forward looking perspective, by reporting in a balance sheet the value of natural capital assets and liabilities as the discounted sum of their future benefits and costs (respectively)10. Changes to the balance sheet from one point in time to the next (for example, this could be one year to the next or across multiple years) allows the CNCA reporting statements to record changes in natural capital across time, relative to the state of the natural capital assets during a ‘baseline’ year (e.g. the preceding year or the first year the account was reported). The statements can also show the reason for the changes (essentially whether due to the business’ own decisions or external factors). Other natural capital accounting methods such as EP&L and TBL, on the other hand, are about reporting the flow of benefits or activities that happened in the past time periods. They also provide a less direct comparison to financial accounts (particularly relating to assets and liabilities).
3.3 Corporate Natural Capital Accounting (CNCA)
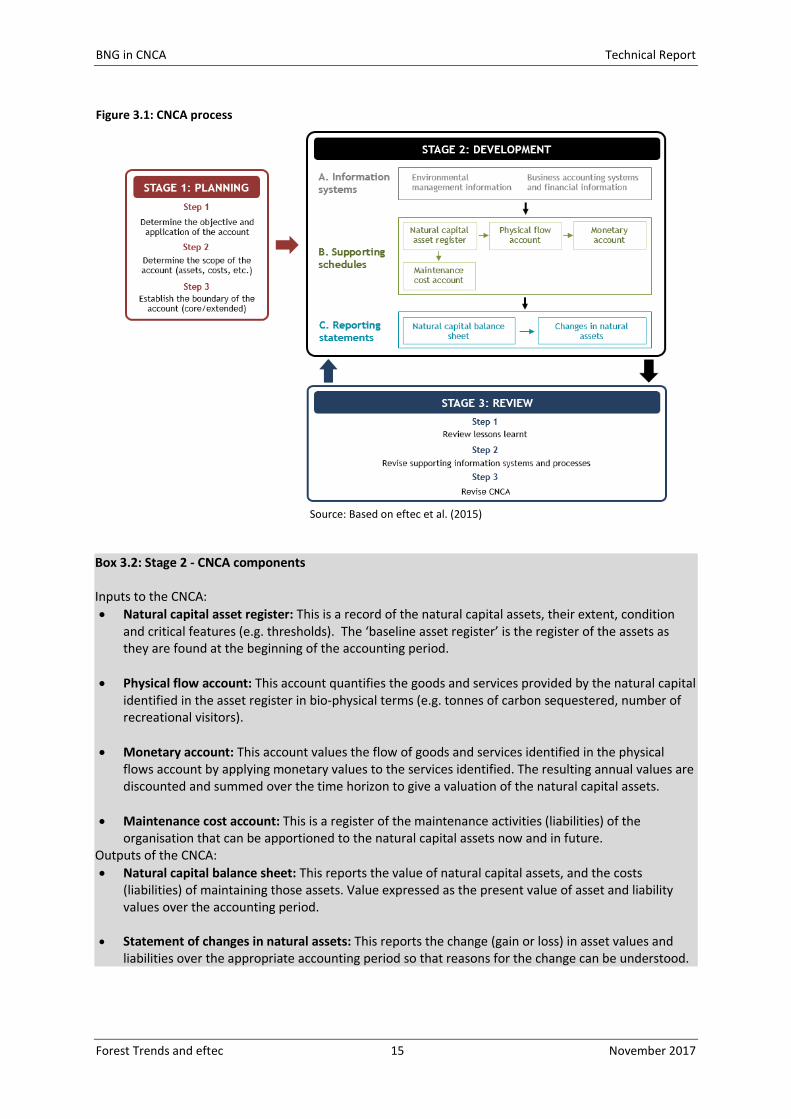
Corporate Natural Capital Accounting (CNCA) was developed for the Natural Capital Committee in the UK by eftec, RSPB and PwC to help organisations monitor and measure the health and value of the natural capital they own and/or manage (eftec et al., 2015). It was developed to improve natural capital accounting and management, in particular, to help answer the question ‘Is natural capital capital being managed sustainably?’, in line with the first Committee’s terms of reference and the UK Government’s objective to ‘improve the quality of our natural environment’ (HM Government, 2011). The CNCA Process The process of preparing the CNCA involves three stages: planning the accounts, development of the accounts and their review – as set out in Figure 3.1 below. See Box 3.2 for a description of the key schedules and statements for Stage 2 of the CNCA process. A summary explaining each of these steps is provided in Annex 2, and a more detailed description of the steps of the CNCA can be found in eftec et al. (2015). These accounts show changes in the natural capital against a baseline over time. As a result, when factors surrounding the company change (e.g. changes in the requirements in environmental regulations, or changes to the local population around a site), it may be necessary to have a dynamic baseline.
10 This requires thinking about whether future flows of benefits will be maintained (e.g. whether they are renewable, and/or whether they are being managed sustainably. Forecasting future flows can be difficult, and often an assumption is made that current flows will continue, but even so it is useful to make this assumption explicit.
BNG in CNCA Technical Report
Forest Trends and eftec 15 November 2017
Figure 3.1: CNCA process
Source: Based on eftec et al. (2015)
Box 3.2: Stage 2 - CNCA components Inputs to the CNCA:
Natural capital asset register: This is a record of the natural capital assets, their extent, condition and critical features (e.g. thresholds). The ‘baseline asset register’ is the register of the assets as they are found at the beginning of the accounting period.
Physical flow account: This account quantifies the goods and services provided by the natural capital identified in the asset register in bio-physical terms (e.g. tonnes of carbon sequestered, number of recreational visitors).
Monetary account: This account values the flow of goods and services identified in the physical flows account by applying monetary values to the services identified. The resulting annual values are discounted and summed over the time horizon to give a valuation of the natural capital assets.
Maintenance cost account: This is a register of the maintenance activities (liabilities) of the organisation that can be apportioned to the natural capital assets now and in future.
Outputs of the CNCA:
Natural capital balance sheet: This reports the value of natural capital assets, and the costs (liabilities) of maintaining those assets. Value expressed as the present value of asset and liability values over the accounting period.
Statement of changes in natural assets: This reports the change (gain or loss) in asset values and liabilities over the appropriate accounting period so that reasons for the change can be understood.
BNG in CNCA Technical Report
Forest Trends and eftec 16 November 2017
Comparison of CNCA and Financial Accounting The CNCA framework reflects elements of the conventional financial accounting approach, from journals to reporting statements (a balance sheet and income statement). However, there are a number of key differences:
CNCA covers a broader asset base: The scope of financial accounts is the stock of (invested) capital and its monetised flow of goods and services, and will include natural capital assets only so far as they produce market benefits. Although there is some overlap, the CNCA provides information on a broader asset base as it adds information on natural capital assets, valuing and monitoring their market and non-market benefits;
Control of assets: Financial accounts only reference natural capital assets that are under the direct control of the organisation, or liabilities for which it is directly liable. The CNCA takes a broader view, allowing for the impacts of the company on the natural capital that results in gains and losses for third parties (i.e. external impacts). It also allows for the management of land which the company itself doesn’t own, but has some management responsibility for. This includes the land of its agents or suppliers where activities (such as biodiversity offsets) take place; and
Link natural capital liabilities with natural capital assets: A financial account might consider potential future liabilities (e.g. stewardship requirements) as contingent liabilities, particularly if they impact upon revenues and invested capital. However, the CNCA links the value of these liabilities with the underlying natural capital asset they relate to – allowing for better management of the assets;
Wider (societal) perspective: Financial accounts only (directly) considers the benefits and costs to the organisation preparing the accounts, while the CNCA considers the benefits and costs on both the organisation (‘private’) and to society as a whole (‘external’ or public);
Time-perspective: Financial accounting statements only take a snapshot at a point in time (i.e. the time when the balance sheet was prepared) or over a defined historical period (i.e. the last financial year for the income statement). By contrast, the CNCA is a forward-looking approach, valuing capitalised benefits and costs over a period into the future (the time horizon), which is more useful for planning and project management;
Accounting period: The accounting period is a defined period of time for which the account is produced. For financial accounts, this is often one year. For CNCA, the accounting period can be longer than a year, depending on the objectives of the organisation11. The CNCA is also used to define changes between two different points in time (i.e. the start and end of the accounting period), with the statement of changes in natural assets relating to changes between these two points (for example, between the current state of the natural capital and the projected, improved state). Note, this is different to the time horizon used to estimate the capitalised value of natural capital assets and liabilities over time.
11 For instance, it could be the life of a mine, or the period over which an organisation has impacts on natural capital and
then rectifies these, achieving NNL/NG.
BNG in CNCA Technical Report
Forest Trends and eftec 17 November 2017
4. LINKS BETWEEN BNG AND NCA
Biodiversity is an integral element of natural capital, but enjoyment of biodiversity (e.g. knowledge of its existence) is also regarded as a benefit from natural capital. Thus, measuring and monitoring BNG goals and natural capital accounting (NCA) are intrinsically linked:
Damage to biodiversity represents a loss of natural capital;
All actions in the mitigation hierarchy12 can be seen as an investment in natural capital; and
Both are measured in a forward-looking way. Biodiversity is a stock that needs to be maintained into the future, and natural capital is measured as a stock that produces goods and services into the future.
4.1 BNG and CNCA Overlaps NCA methods were designed to capture changes in natural capital stocks, the benefits they provide and the costs of managing them, which include the impacts on biodiversity and offsetting residual damages. The biodiversity metrics used in the mitigation hierarchy can potentially be used in natural capital accounting. In CNCA, they can be used as an indicator of the natural capital stock in the asset register, or as a measure of the flow of benefits to people from natural capital in the physical flow account. Although minimisation and restoration activities can be accounted for relatively easily under NCA methods, the estimation and formulation of offsets in an NCA is a challenging and (to date) uncharted methodology. This is particularly the case as mitigation relates to multiple activities, stakeholders and generally several locations, and a part of the mitigation measures include costed offset activities. Therefore, the focus of the remainder of this chapter is on integrating biodiversity offset design and implementation into NCA methods, particularly focusing on the CNCA. In fact, there are a number of similarities between the methodology set out under BBOP (2009), on the design and development of mitigation measures, including offsets, and the CNCA methodology. This provides the following opportunities for integration: 1. Both BNG and CNCA methods are designed for a spatially defined area for which the organisation developing the account has a management responsibility. This defined area should encompass the location(s) where biodiversity is directly and indirectly affected by the organisation’s activities (the loss of biodiversity) and the area(s) where mitigation activities (including offsets) take place. This also sets the scope for the collection and reporting of relevant information, which is necessary for BNG and NCA methodology. 2. CNCA records a ‘physical asset register’ which can include biodiversity stock metrics, and a ‘physical flow’ account (where goods and services relating to or arising from the biodiversity13 can be recorded). This means that the CNCA does not rely on monetary values for the benefits of biodiversity. The metrics and amount of biodiversity present before damage should be recorded in the asset register. The ‘No Net Loss’ or ‘Net Gain’ balance should then be measured in the same bio-physical terms to see the change. The application of the mitigation hierarchy should include the loss-gain calculation to estimate the biodiversity
12 The Mitigation Hierarchy involves measures to avoid, minimise, restore and offset damage to biodiversity (see e.g.
BBOP, 2012, IFC PS6, 2012). The focus of this is paper is on offsetting and CNCA, but the preceding steps of the hierarchy
are also reflected in the account, and CNCA is considered suitable for capturing all parts of the mitigation hierarchy.
13 These goods and services may include benefits to people who gain welfare from knowing about the continued existence of wildlife for its own sake, for the benefits of others now and for the future generation.
BNG in CNCA Technical Report
Forest Trends and eftec 18 November 2017
offset required to make good the residual biodiversity impacts caused by the project. These offset activities and their location should be recorded in a costed Biodiversity Offset Management Plan (BOMP). However, in the highly likely event that the biodiversity offset activities are carried out by a third party (rather than by the developer themselves), care would be needed to ensure that the offset provider records a biodiversity loss when the biodiversity ‘gain’ is transferred to the developer which purchases the offset, to avoid double-counting. 3. CNCA records a liability, which reflects the ‘maintenance’ costs of maintaining the natural capital at a certain condition (e.g. before the development). There are three forms of maintenance costs relevant to biodiversity offsets:
The costs relating to the implementation of the offset activity: the BOMP should include the financial costs of establishing the offset to achieve ‘No Net Loss’ or ‘Net Gain’. The total (discounted) costs over time of implementing the mitigation hierarchy, including establishment of an offset (the investment in the ‘credit’ side of the offset) can be recorded in the maintenance cost account. This will be intrinsically linked to the cost of the biodiversity credits themselves.
The financial liability: If the offset is achieved through a market mechanism (i.e. the purchase of biodiversity credits from a third party), then ex-ante, the CNCA of the developer would show the cost of the credits as a contingent liability in the financial accounts and their financial accounts. The financial accounts of the organisation providing the offset would show a revenue (the payment for the offset) and a maintenance cost liability (the cost of the ongoing offset actions).
The ongoing maintenance costs: there are ongoing maintenance costs to ensure that the planned improvement is achieved and maintained. This should also be included in the BOMP and the total (discounted) of these costs over time are a part of the implementation of the mitigation hierarchy recorded in the maintenance cost account.
After the offset is implemented, on sale of the credit, the biodiversity units are (effectively) transferred from the offset provider to the project developer, the ongoing maintenance accounted for and the financial liability met.
4. CNCA is forward looking, calculating predicted asset values as the discounted sum of the values into the future. Therefore, it can reflect whether biodiversity outcomes are sustained over time. Planning of the mitigation hierarchy (including the BOMP) is (in general) forward looking, covering the period needed to attain BNG, and maintain it thereafter. The offset should also last at least as long as the impacts endure and preferably in perpetuity. The CNCA can explicitly record/monitor implementation of good practice, which is to secure the sums needed to ensure the mitigation measures can be implemented over the long term through certain financial and legal arrangements, for example by establishing a trust fund. When planning for BNG alone, a discount rate is sometimes applied to the predicted biodiversity gains through offset activities, since the losses are certain and occur in the short term, whereas the gains mature over time and the outcomes of restoration can be uncertain. However, when the BNG information is being used to inform a CNCA, in order to avoid double discounting, no discount rate should be applied at the planning stage, since a discount rate is applied in the monetary accounts. 5. They derive a measure of net impact: CNCA generates a ‘natural capital balance sheet’. A balance sheet for a biodiversity metrics provides a way to show B NG is achieved. This includes both the net biodiversity impact using the relevant biodiversity metric(s), and the net natural capital impact using the monetary values.
BNG in CNCA Technical Report
Forest Trends and eftec 19 November 2017
4.2 Combining BNG and CNCA As Section 4.1 shows, CNCA has a significant amount of overlap with the current methodology of estimating biodiversity offsets, but also complements this method. In particular, the CNCA process has been identified to develop this analysis, due to its long-term perspective (point 4) and its presentation of natural capital assets and liabilities (2 and 3) in a balance sheet (5). Thus the CNCA statements can reflect the loss of natural capital when biodiversity is damaged, and the benefits of mitigation when implementing steps of the mitigation hierarchy, including investment in a biodiversity offset. The two methods also complement one another. CNCA reflects flows of benefits from a range of ecosystem services, which BNG doesn’t. However, CNCA may not give adequate visibility to biodiversity commitments and outcomes: the costs can be recorded under liabilities, and delivery reflected in the asset register, but the benefits cannot always be valued in monetary the monetary flow account in the same way as other natural capital benefits. The limitations to approaches for monetary valuation of biodiversity can make it difficult to ensure that changes to biodiversity are explicitly reflected in a CNCA balance sheet. Therefore, where biodiversity impacts are significant (and thus BNG approaches are relevant) there is a case to include a biodiversity indicator within the CNCA balance sheet. BNG approaches provide a systematic way to identify and measure biodiversity indicators. Therefore, the following sections focus on the process for integrating the BNG goals methodology with the corporate natural capital accounting framework to produce a joint NNL-CNCA methodology.

BNG in CNCA Technical Report
Forest Trends and eftec 20 November 2017
5. WHEN IS A JOINT NNL-CNCA NEEDED?
As outlined in Section 4, there are key overlaps and added benefits by undertaking CNCA alongside the design of mitigation measures planned to achieve BNG (including biodiversity offsets). In particular, this joint framework can help with setting the baseline, identifying options and monitoring progress. However, a CNCA is not required in all situations where the BNG planning is undertaken. Figure 5.1 (below) presents a decision tree of the conditions under which a CNCA account can complement the use of offsets. A CNCA can also be adopted for other purposes. Figure 5.1: Decision tree on whether a joint BNG and CNCA account is required
Therefore, it is recommended that a joint CNCA account is produced in conjunction with the biodiversity offset design process if:
an offset is required, either under funding requirements and/or because of corporate or government policies; and
there are significant effects on natural capital that go beyond the impacts on biodiversity (e.g. impact on air quality benefits or recreational opportunities to the local community from changes in vegetation from development).

BNG in CNCA Technical Report
Forest Trends and eftec 21 November 2017
6. RECORDING A PROJECT OFFSET IN THE CNCA
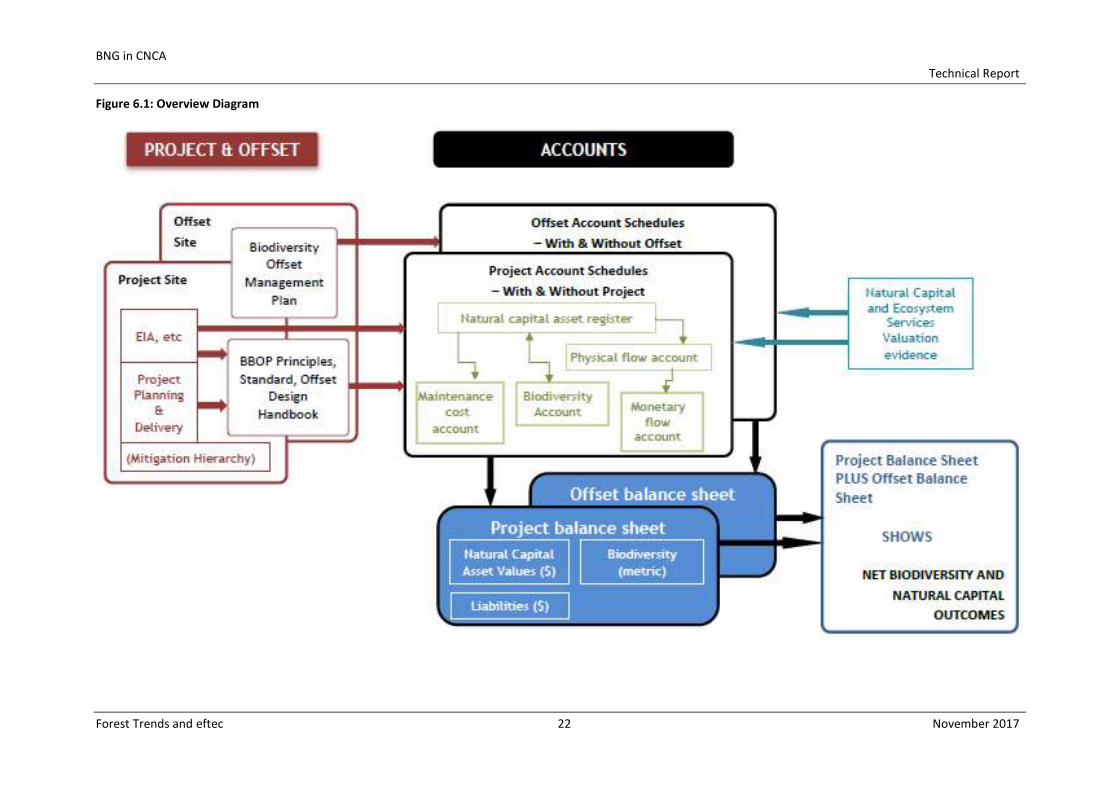
The following combines the mitigation hierarchy process (including biodiversity offsets) with the Corporate Natural Capital Accounting (CNCA) framework. As shown in Figure 6.1, it is developed through two distinct accounts, for:
the project site – where a development or activity and associated mitigation activities (avoidance, minimisation, on-site restoration) are taking place and the need for an offset to address residual impacts has been identified; and
the offset site - where gains are generated to offset residual impacts with the aim of achieving BNG. The approach described assumes good practice is followed in both processes (the application of the mitigation hierarchy and CNCA)14.
6.1 Accounting process
To complete the accounts for the project site(s) and the offset site(s), the following statements are produced for each site:
Natural capital assets register;
Biodiversity account – this records the changes in the biodiversity of the site over time, measured in a biodiversity metric.
Physical flow account;
Monetary flow account;
Maintenance cost account;
The natural capital balance sheet. This gives baseline values (without the project, at time T0) and values for the expected project/offset impact (at time T1). These are also produced for the offset site(s), at least to give values for the expected offset actions and their outcomes (at time T1). Accounting for the full set of transactions, including the implementation of the biodiversity offsets in the future, allows us to establish whether the project is able to achieve No Net Loss (or a Net Gain). Adjustments to this broad approach can include:
Where the project site and offset site are contiguous, all impacts may be captured in a single account. However, this requires that the scope of the account to include the offset site as part of the baseline.
Where the project or offset site are likely to change during the accounting period (e.g. because they are in dynamic environments and/or because the project has a relatively long time-frame), a dynamic baseline account may be necessary.
14 See: eftec et al. (2015); BBOP (2015)
BNG in CNCA
Technical Report
Forest Trends and eftec 22 November 2017
Figure 6.1: Overview Diagram
BNG in CNCA Technical Report
Forest Trends and eftec 23 November 2017
The process outlined is considered suitable for a development project or specific activity as well as for more general, ongoing land management processes. In fact, the use of CNCA to account for (broader) land management processes is encouraged. This process can record the costs and outcomes of the first three steps of the mitigation hierarchy (Figure 2.1), and other aspects of natural capital management. However, the main focus of this method is to link the biodiversity offsets, which are most likely to be in a different location from the project, and the CNCA process. The suggested method builds on the steps in the BBOP Offset Design Handbook (Steps 1-8, below), using specific data produced through these steps (which may also draw on environmental impact assessment (EIA) and other documents) to input into the CNCA process. The project site account includes baseline data (a ‘no-project’ scenario) and a statement of changes as a result of the project (‘with-project’ scenario). Similarly, the offset site account should include a baseline (‘no offset’ scenario) and a ‘with offset scenario’. Each account then gives the gross asset value of natural capital and a separate biodiversity metric, and total maintenance provisions. Summing the two accounts (for the project and the offset) gives a conclusion or ‘offset implementation balance sheet’ indicating whether natural capital assets (in monetary terms), and biodiversity (in the offset metric), are being maintained (no net loss) or otherwise, through the combined impacts of the project and offset.
6.2 Implementation timeline
The timeline of this process is driven by the project and offset timetable, as this is more time-dependent and linked to the actual timescales of the development or activity on the project site; while CNCA can (in theory) be applied ex-ante or ex-post to a specified point or window of time. The timing of the offset design should be considered early on in the planning of the development/ activity. However, in general, not all of the required data is known this early on. For example, the quantum of residual damage to biodiversity after the mitigation hierarchy15 has been followed, or the area of land where any offset may then take place and the activities required to bring about the necessary gain may not be known. Alternatively, with only minor adjustments, the process could be picked up at a later stage (in project development or activity), using the same steps and giving the same management information. Given that, in practice, the need for compensation (such as a biodiversity offset) is not always (rightly or wrongly) identified at the outset of a project or activity, the methods involved need to be flexible to different circumstances.
6.3 Steps in producing an Offset-CNCA
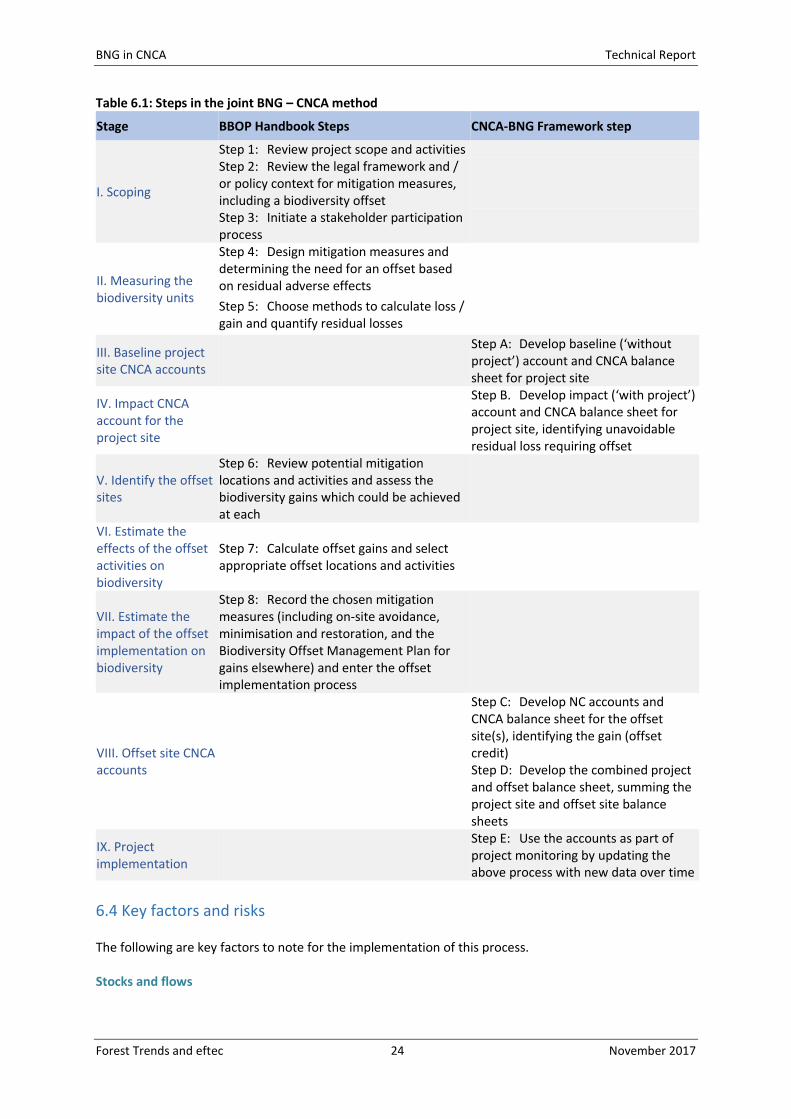
The overall process has nine stages (I-XI), which includes steps primarily associated with the mitigation hierarchy and BNG (step A-E) and steps associated with CNCA (step 1-8). While there is flexibility, the suggested order of analysis is presented below and applied in the case study in Section 7. NOTE: Ensure biodiversity impacts are recorded in the same metrics in the project account as in the offset account. This may mean retrospective revision of the project account to reflect the offset metric chosen
15 Standard definition FT
BNG in CNCA Technical Report
Forest Trends and eftec 24 November 2017
Table 6.1: Steps in the joint BNG – CNCA method
Stage BBOP Handbook Steps CNCA-BNG Framework step
I. Scoping
Step 1: Review project scope and activities Step 2: Review the legal framework and / or policy context for mitigation measures, including a biodiversity offset
Step 3: Initiate a stakeholder participation process
II. Measuring the biodiversity units
Step 4: Design mitigation measures and determining the need for an offset based on residual adverse effects
Step 5: Choose methods to calculate loss / gain and quantify residual losses
III. Baseline project site CNCA accounts
Step A: Develop baseline (‘without project’) account and CNCA balance sheet for project site
IV. Impact CNCA account for the project site
Step B. Develop impact (‘with project’) account and CNCA balance sheet for project site, identifying unavoidable residual loss requiring offset
V. Identify the offset sites
Step 6: Review potential mitigation locations and activities and assess the biodiversity gains which could be achieved at each
VI. Estimate the effects of the offset activities on biodiversity
Step 7: Calculate offset gains and select appropriate offset locations and activities
VII. Estimate the impact of the offset implementation on biodiversity
Step 8: Record the chosen mitigation measures (including on-site avoidance, minimisation and restoration, and the Biodiversity Offset Management Plan for gains elsewhere) and enter the offset implementation process
VIII. Offset site CNCA accounts
Step C: Develop NC accounts and CNCA balance sheet for the offset site(s), identifying the gain (offset credit)
Step D: Develop the combined project and offset balance sheet, summing the project site and offset site balance sheets
IX. Project implementation
Step E: Use the accounts as part of project monitoring by updating the above process with new data over time
6.4 Key factors and risks
The following are key factors to note for the implementation of this process. Stocks and flows
BNG in CNCA Technical Report
Forest Trends and eftec 25 November 2017
‘Stocks’ equate to the quantity and condition of natural capital, including biodiversity, and its capacity to provide goods and services, including ecosystem services. Biodiversity is part of the stock of natural capital. In the context of natural capital accounting, natural capital is a ‘stock’, which, in principle, can be measured in physical terms. Metrics could, for example, include species richness and abundance, extent (area) and condition of habitats. These biophysical metrics represent critical information for assessing the long term sustainability of the benefits from natural capital and are therefore a fundamental component of the CNCA framework. The stock of biodiversity would be recorded in the natural capital asset register. The ‘baseline’ asset register in the project site account records the stock (area and condition score16) as it would have been ‘without the project’ at the start of the accounting period. The changes in the stock due to the project (the residual biodiversity losses) are recorded as a loss in the project account, and the investment in the offset (the gain) is recorded in the offset site account. ‘Flows’ refer to the rates of ecosystem services provided over time17 by the stock of natural capital over the accounting period (e.g. the rate of absorption of waste, or rate of sequestration of carbon). Ecosystem services and other goods and services from the natural capital covered by the account are recorded in physical terms in the physical flow account, measured using metrics appropriate to each service. Where possible, these services are valued in monetary terms, and their annual values over the time horizon of the account recorded in the monetary flow account. The values of services over time are added together and discounted to give a value of the natural capital assets that produce them. The without-project anticipated flow of ecosystem services would be recorded in the ‘baseline’ project site physical flow account. The changes to ecosystem services expected from the natural capital assets over time as the project and offset are carried out would be recorded in the ‘with-project’ and ‘with-offset’ physical flow accounts. Project site account and offset site account The activities at each stage of the mitigation hierarchy needed to achieve and maintain BNG (according to the loss-gain calculation) would be captured in the Environmental Management Plan and Biodiversity Offset Management Plan, accompanied by the associated budget. The first three stages of the hierarchy, that take place at the project site, would be reflected in the project site account. The offset stage would be reflected in the offset site account. The without-project anticipated costs of maintaining the stock of biodiversity would be recorded in the baseline project site maintenance account. The budget specified in the Biodiversity Offset Management Plan, would appear as a liability in the offset site maintenance cost account. Table 6.2 outlines potential risks and possible solutions that have been identified during the development of this methodology.
16 For example, relative to a close-to-pristine benchmark site of the same ecosystem.
17 For example, the volume of water flowing per day, fish landings per year.
BNG in CNCA Technical Report
Forest Trends and eftec 26 November 2017
Table 6.2: Risks and potential risk management associated with the joint BNG – CNCA method Possible problem Possible solution Jump straight to monetary values and not look at biodiversity losses and gains: Risk of omitting impacts that are not possible to offset and accounting for gains that are not ‘like-for-like or better’.
Monetary values can only be accurately defined based on physical measures of the flows of services (for asset values) and an understanding of management requirements (for liabilities). The process of completing each CNCA accounting schedule ensures this information is captured, and makes it clear how it links to monetary values. Notes to the accounts and the interpretation of the results should explicitly state whether any material impacts are not captured in the biodiversity metrics and monetary valuations in the account.
Not follow the Mitigation Hierarchy rigorously: Risk of avoidable impacts not being avoided; risk of unrealistic mitigation; risk of impacting irreplaceable biodiversity which cannot be offset; risk of jumping to ‘offsets’ without proper avoidance, minimisation and restoration.
Follow the BNG method to define mitigation measures, including a Biodiversity Offset Management Plan, according to best practice (e.g. BBOP Standard).
Biodiversity and ecosystem services insufficiently assessed in the accounts: Similar risks as for ‘Monetary valuation’ above. Also: risk of non-substitutable ecosystem services being traded-off.
Follow the BNG method to define mitigation measures, including a Biodiversity Offset Management Plan (based on a loss-gain calculation).
Timescales of analysis The account should start from a baseline year prior to project site operations commencing (i.e. pre-impact). This can be compiled retrospectively if necessary and feasible18. The accounting period should cover the time period from the baseline year at least until the development project is completed. The time horizon over which impacts are assessed within the account must cover at least the time period until BNG is achieved and being maintained (i.e. offsets are implemented). This may be well beyond the completion of project operations. Good practice is for the project developer’s responsibility for the offset, after it is established, to include maintaining it into the long term (and preferably into perpetuity) in collaboration with the offset providers, in line with a Biodiversity Offset Implementation Plan. Therefore, the valuation of assets in the CNCA schedules should look forward over the same time horizon. In accounting terms, valuation of activities ‘in perpetuity’ could be capped for practicality. This depends on the assets in question, and on discount rates chosen - impacts after 100 years may not be material to the decision, if typical UK public sector discount rates are used (or earlier if higher rates) (HMT Green Book, 2013). The time period is distinct to the frequency that these accounts are updated:
For financial accounting purposes, the accounts would only need to be prepared once for the accounting period. That said, if that period is long, it would be helpful to prepare interim accounts periodically – say every 5 years. That way CNCA can be used as a tool for planning mitigation / restoration actions, and for monitoring progress. And if some costs (e.g. of fuel) were updated
18 Depending on the availability of data and the ability to produce a robust ‘starting situation’/baseline.
BNG in CNCA Technical Report
Forest Trends and eftec 27 November 2017
annually, these might be entered automatically in the organisation’s financial accounts and could link to update the costs in the (C)NCA automatically.
Certain other aspects of the accounts (e.g. the monetary values of flows of the biodiversity, reflecting people’s preferences) could be updated perhaps every 5 years, to reflect better bio-physical and valuation evidence.
For the BNG accounting, it’s important to monitor biodiversity losses and gains at interim periods to check, for instance, that the size of the residual losses has not changed, that restoration is proceeding satisfactorily and that the temporal losses are not greater than assumed in the plans.
6.5 Guidance on Step by Step Accounting process I. Scoping Steps 1, 2 and 3 of the BBOP Offsets design handbook broadly match the first three steps of the CNCA process. They define the parameters of the process, such as:
The geographical scope: both the boundary of the project, and the area over which it will have impacts (the ‘area of influence’).
Timescales: including the time period of the account, and the time horizon over which impacts are assessed as well as the mitigation measures.
Specifying a baseline in which the project and offset do not take place. The output is a clear statement of the objective of the accounting process, the spatial and legal scope of the account, and the timescales (accounting year; duration of project/ activity). II. Measuring the biodiversity units See BBOP Offsets Handbook Steps 4 and 5. III. Baseline project site CNCA accounts The account is prepared according to the process shown in Figure 6.2.
The natural capital assets at the site are identified and described in the asset register. This should include all the biodiversity present at the site.
Based on the asset register: 1. The annual costs of maintaining these assets (e.g. site maintenance costs) are identified.
Current annual costs should already be recorded in conventional financial accounts and planned costs included in management plans and regulatory requirements.19
2. The current biodiversity status of the site is measured in appropriate metrics (e.g. extent, condition) and recorded in the biodiversity account.
3. The key ecosystem services are identified, using site information and expert knowledge, in an ecosystem services matrix.
4. The physical flows of these ecosystem services are estimated for each year of the time horizon, based on site data or modelling/ estimates.
19 However, if the target state of the natural capital is beyond the current and/or planned level, this may not be reflected in
company information.
BNG in CNCA Technical Report
Forest Trends and eftec 28 November 2017
5. These flows are valued over the time horizon in monetary terms where possible, also based on site data or modelling/ estimates, and applying expert judgement where necessary.
The annual monetary values of maintenance costs and service flows are capitalised (calculating the sum of the discounted values from each year of time horizon – see Section 6.3), using an appropriate discount rate. The total capitalised value of the service flows gives a valuation of the natural capital assets.
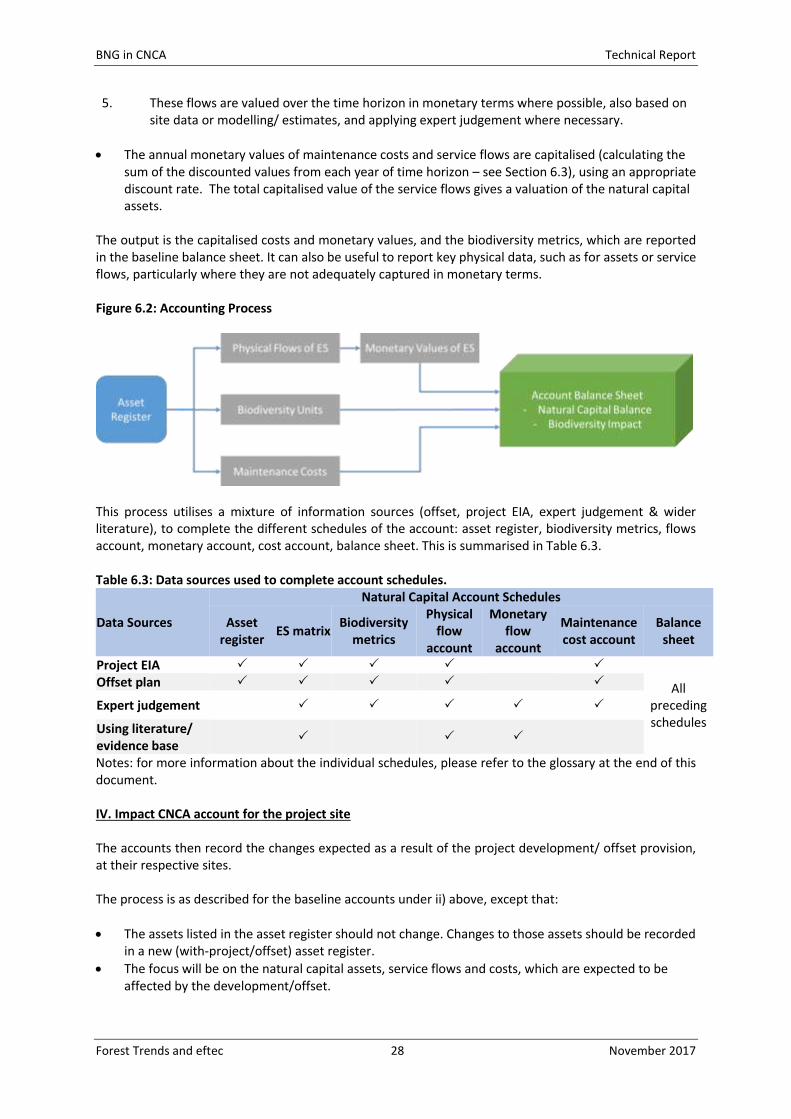
The output is the capitalised costs and monetary values, and the biodiversity metrics, which are reported in the baseline balance sheet. It can also be useful to report key physical data, such as for assets or service flows, particularly where they are not adequately captured in monetary terms. Figure 6.2: Accounting Process
This process utilises a mixture of information sources (offset, project EIA, expert judgement & wider literature), to complete the different schedules of the account: asset register, biodiversity metrics, flows account, monetary account, cost account, balance sheet. This is summarised in Table 6.3. Table 6.3: Data sources used to complete account schedules.
Data Sources
Natural Capital Account Schedules
Asset register
ES matrix Biodiversity
metrics
Physical flow
account
Monetary flow
account
Maintenance cost account
Balance sheet
Project EIA
All preceding schedules
Offset plan
Expert judgement
Using literature/ evidence base
Notes: for more information about the individual schedules, please refer to the glossary at the end of this document. IV. Impact CNCA account for the project site The accounts then record the changes expected as a result of the project development/ offset provision, at their respective sites. The process is as described for the baseline accounts under ii) above, except that:
The assets listed in the asset register should not change. Changes to those assets should be recorded in a new (with-project/offset) asset register.
The focus will be on the natural capital assets, service flows and costs, which are expected to be affected by the development/offset.
BNG in CNCA Technical Report
Forest Trends and eftec 29 November 2017
The maintenance costs can record changes to site management costs in implementing the mitigation hierarchy.
The costs of the offset should be recorded in both accounts: o In the project account, as a legal or discretionary liability; and o In the offset account as a revenue (the payment being received) and a liability (based on
the contracted obligation to provide the gains for the offset). o The recognition of the costs will depend on the terms of the contract, timing of the
money received from the offset site and whether the prescribed improvements are delivered. Until the improvement (as set out in a contract) is completed, the offset site manager has a liability to the project site manager.
As work progresses, information may be added to the baseline account. For example, the biodiversity offset metric may be updated as impacts from the development and its offset are understood in more detail.
The outputs are the estimated changes to the capitalised costs and services monetary values, and the biodiversity metric, which are reported in the with-project/offset balance sheet. It can also be useful to report key physical data, such as for assets or service flows, particularly where they are not adequately captured in monetary terms. V. Identify the offset sites See BBOP Offsets Handbook Step 6. VI. Estimate the effects of the offset activities on the biodiversity units See BBOP Offsets Handbook Step 7. VII. Estimate the impact of the offset implementation on the biodiversity units See BBOP Offsets Handbook Step 8. VIII. Offset site CNCA accounts This combines information from the project and offset impact accounts to create a balance sheet for the project site that shows the effect of integrating the biodiversity offset with the biodiversity impacts at the project site. This will explicitly record:
Net changes to the value of natural capital assets (loss and gain) from combined impacts of project and offset;
Net changes to biodiversity (using the biodiversity metric(s) applied in the offset design process); and
Changes to the maintenance costs at the project and offset sites, reflecting the full costs of the mitigation hierarchy.
IX. Project implementation The accounts can be used to monitor the progress of the project and offset over time. For example, as the project is implemented different mitigation hierarchy actions may be identified and undertaken that change the impact of the project on biodiversity. The costs of such actions, and the resulting changes to the biodiversity metrics and natural capital values, can be recorded in the respective parts of the accounts.
BNG in CNCA Technical Report
Forest Trends and eftec 30 November 2017
7. CASE STUDY: Joint BNG-CNCA account Showing No Net Loss for a
Transport Infrastructure Upgrade
PLEASE NOTE: This case study has been constructed using summary and approximate information for purely illustrative purposes to test the method being developed on a representative, real-world work-in-progress project. It should not be taken to represent the actual impacts nor mitigation measures (including biodiversity offsets) of transport projects, nor the policies or views of any specific project.
7.1 Overview
Balfour Beatty is supporting various clients to deliver Biodiversity Net Gain on their projects by following the Mitigation Hierarchy. One such example, which involves upgrading transport infrastructure, is applied as a case study here. The framework (Section 6) is applied here on a purely illustrative basis. Approximate project site management and offset implementation information has been used to construct a set of accounts that reflect the biodiversity units calculation used to inform the design of the offsets (Defra, 2012); the change in the value of natural capital assets; and the costs of the project site mitigation measures and biodiversity offset management actions. Ultimately, the primary output of this framework is the resulting balance sheet (Table 7.1).
BNG in CNCA Technical Report
Forest Trends and eftec 31 November 2017
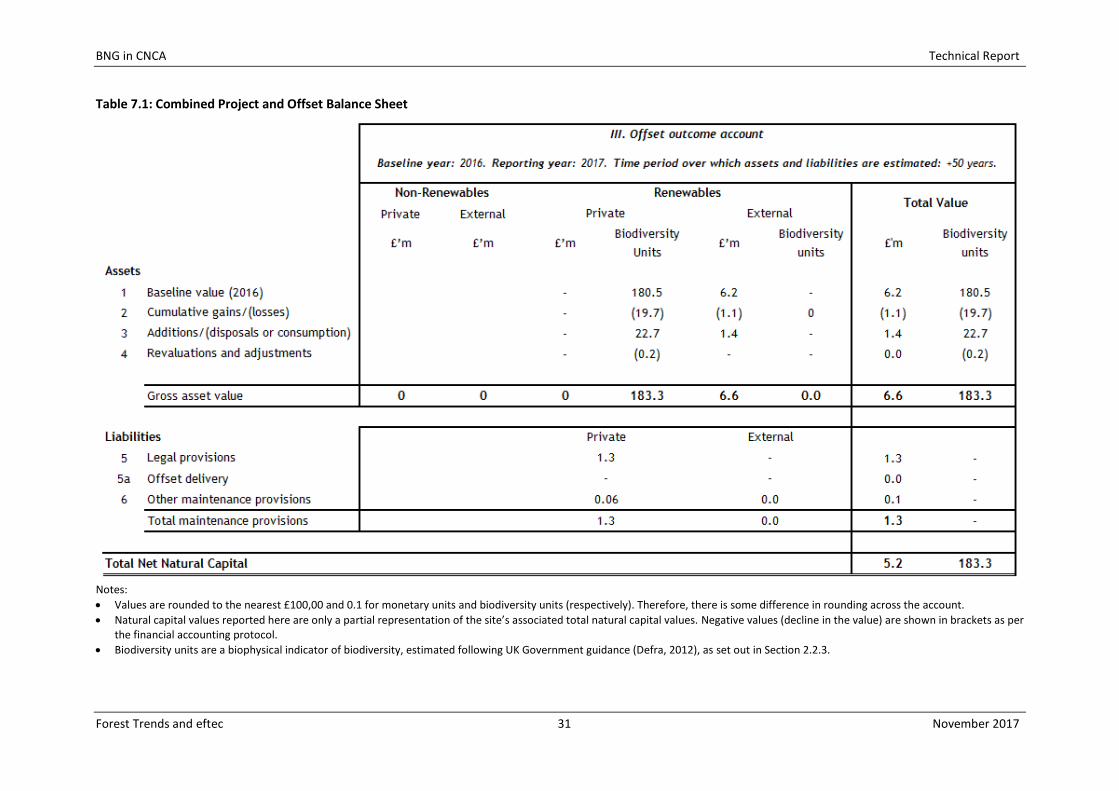
Table 7.1: Combined Project and Offset Balance Sheet
Notes:
Values are rounded to the nearest £100,00 and 0.1 for monetary units and biodiversity units (respectively). Therefore, there is some difference in rounding across the account.
Natural capital values reported here are only a partial representation of the site’s associated total natural capital values. Negative values (decline in the value) are shown in brackets as per the financial accounting protocol.
Biodiversity units are a biophysical indicator of biodiversity, estimated following UK Government guidance (Defra, 2012), as set out in Section 2.2.3.
BNG in CNCA Technical Report
Forest Trends and eftec 32 November 2017
The balance sheet indicates that over 50+ years:
The biodiversity units see a small net gain. The transport site before the upgrade has 180.5 biodiversity units (the baseline). Overall, (net) residual losses as a result of the project amount to 19.7 units. This figure accounts for: loss from the activity (-28.1), the on-project site regrowth of affected habitats and some reseeding work (+8.4). An accounting revaluation is applied to the positive impact of the regrowth, as some of the biodiversity outcomes are only realised in the future (-0.2 units). Finally, the biodiversity gained through the biodiversity offsets is predicted to amount to 22.7 units20. Therefore, after the project and offset, the predicted outcome of the project is 183.3 biodiversity units, i.e. a net gain of 2.8 units.
The value of natural capital also sees a small net gain. Similar to the biodiversity units, the project causes a decline here of around £1m from the baseline of £6.2m. However, offsetting activities produce benefits in addition to restoring biodiversity that increase the natural capital asset values by approx. £1.4m, resulting in a new net natural capital asset value of approx. £6.6m (i.e. an increase of £0.3m). These are only partial estimates of the natural capital value, which only relate to: (especially) the recreational benefits (for the offset sites only), the climate regulation and air quality benefits (for both project and offset sites).
Natural capital liabilities experience a small increase in value: estimated management costs relating to the transport verge vegetation management (~£1.3m) are included under legal liabilities in the balance sheet as this kind of management is legally required for a safe transport network. The additional cost of the offset (~£57k) is defined as optional (i.e. under ‘other maintenance provisions’), as the Net Gain goal is a voluntary undertaking on their part, rather than a mandatory requirement.
The following subsections provide an overview of the methodology and how these estimates were computed.
7.2 Implementing the joint BNG-CNCA framework
This section outlines the process involved in the development of the joint BNG-CNCA account. The steps outlined for the joint BNG-CNCA methodology (Section 6) are presented in grey boxes. I. Scoping For this case study, the project site is the footprint (or ‘redline’ boundary) of the transport upgrade scheme. Often, for a transport upgrade scheme, all the woody and overhanging vegetation at the site must be removed in order to construct and safely operate the new infrastructure. This results in residual losses to biodiversity that must be offset. Steps 1 and 2 of the joint BNG-CNCA framework involve the scoping and development of evidence of the impacts of the project, including: the EIA, the project and delivery plans etc. These steps provide the context for the case study and a key source of information for the accounts. Step 1: Review project scope and activities Step 2: Review the legal framework and / or policy context for mitigation measures, including a biodiversity offset
20 This is after accounting for biodiversity units already generated at the offset sites, i.e. only the ‘true’ gains in biodiversity units, and the
time for the offsets to become established.
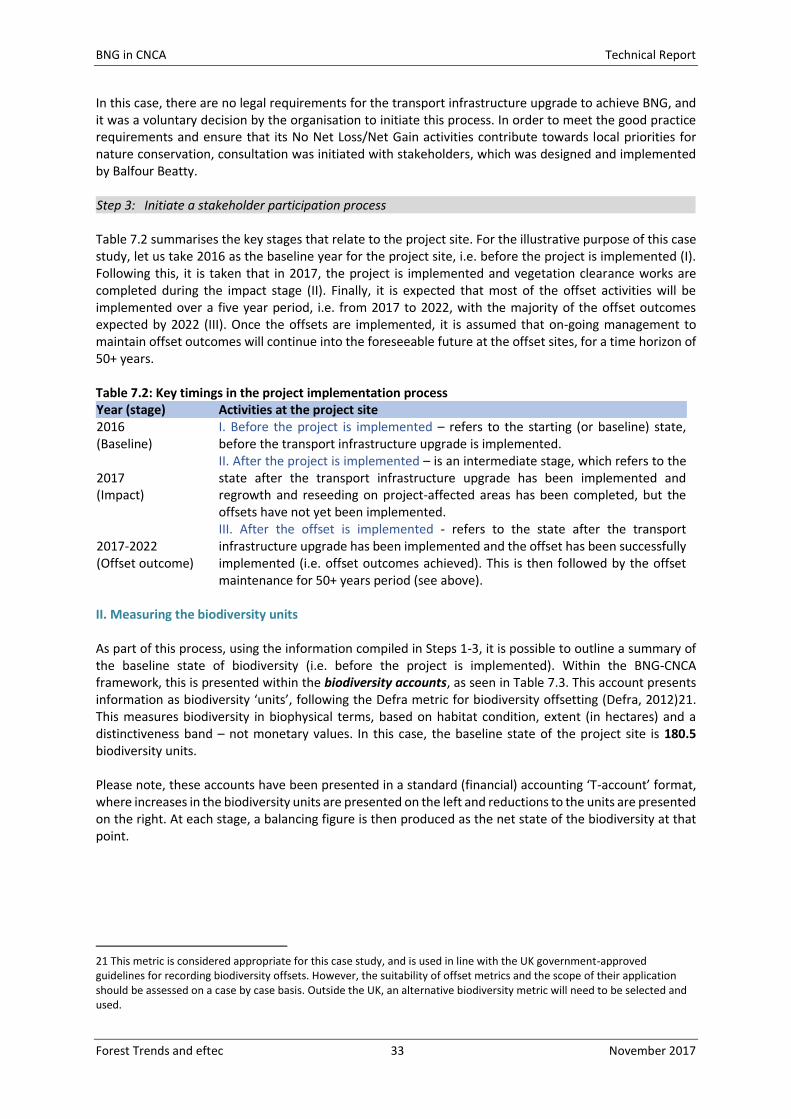
BNG in CNCA Technical Report
Forest Trends and eftec 33 November 2017
In this case, there are no legal requirements for the transport infrastructure upgrade to achieve BNG, and it was a voluntary decision by the organisation to initiate this process. In order to meet the good practice requirements and ensure that its No Net Loss/Net Gain activities contribute towards local priorities for nature conservation, consultation was initiated with stakeholders, which was designed and implemented by Balfour Beatty. Step 3: Initiate a stakeholder participation process Table 7.2 summarises the key stages that relate to the project site. For the illustrative purpose of this case study, let us take 2016 as the baseline year for the project site, i.e. before the project is implemented (I). Following this, it is taken that in 2017, the project is implemented and vegetation clearance works are completed during the impact stage (II). Finally, it is expected that most of the offset activities will be implemented over a five year period, i.e. from 2017 to 2022, with the majority of the offset outcomes expected by 2022 (III). Once the offsets are implemented, it is assumed that on-going management to maintain offset outcomes will continue into the foreseeable future at the offset sites, for a time horizon of 50+ years. Table 7.2: Key timings in the project implementation process Year (stage) Activities at the project site 2016 (Baseline)
I. Before the project is implemented – refers to the starting (or baseline) state, before the transport infrastructure upgrade is implemented.
2017 (Impact)
II. After the project is implemented – is an intermediate stage, which refers to the state after the transport infrastructure upgrade has been implemented and regrowth and reseeding on project-affected areas has been completed, but the offsets have not yet been implemented.
2017-2022 (Offset outcome)
III. After the offset is implemented - refers to the state after the transport infrastructure upgrade has been implemented and the offset has been successfully implemented (i.e. offset outcomes achieved). This is then followed by the offset maintenance for 50+ years period (see above).
II. Measuring the biodiversity units As part of this process, using the information compiled in Steps 1-3, it is possible to outline a summary of the baseline state of biodiversity (i.e. before the project is implemented). Within the BNG-CNCA framework, this is presented within the biodiversity accounts, as seen in Table 7.3. This account presents information as biodiversity ‘units’, following the Defra metric for biodiversity offsetting (Defra, 2012)21. This measures biodiversity in biophysical terms, based on habitat condition, extent (in hectares) and a distinctiveness band – not monetary values. In this case, the baseline state of the project site is 180.5 biodiversity units. Please note, these accounts have been presented in a standard (financial) accounting ‘T-account’ format, where increases in the biodiversity units are presented on the left and reductions to the units are presented on the right. At each stage, a balancing figure is then produced as the net state of the biodiversity at that point.
21 This metric is considered appropriate for this case study, and is used in line with the UK government-approved guidelines for recording biodiversity offsets. However, the suitability of offset metrics and the scope of their application should be assessed on a case by case basis. Outside the UK, an alternative biodiversity metric will need to be selected and used.
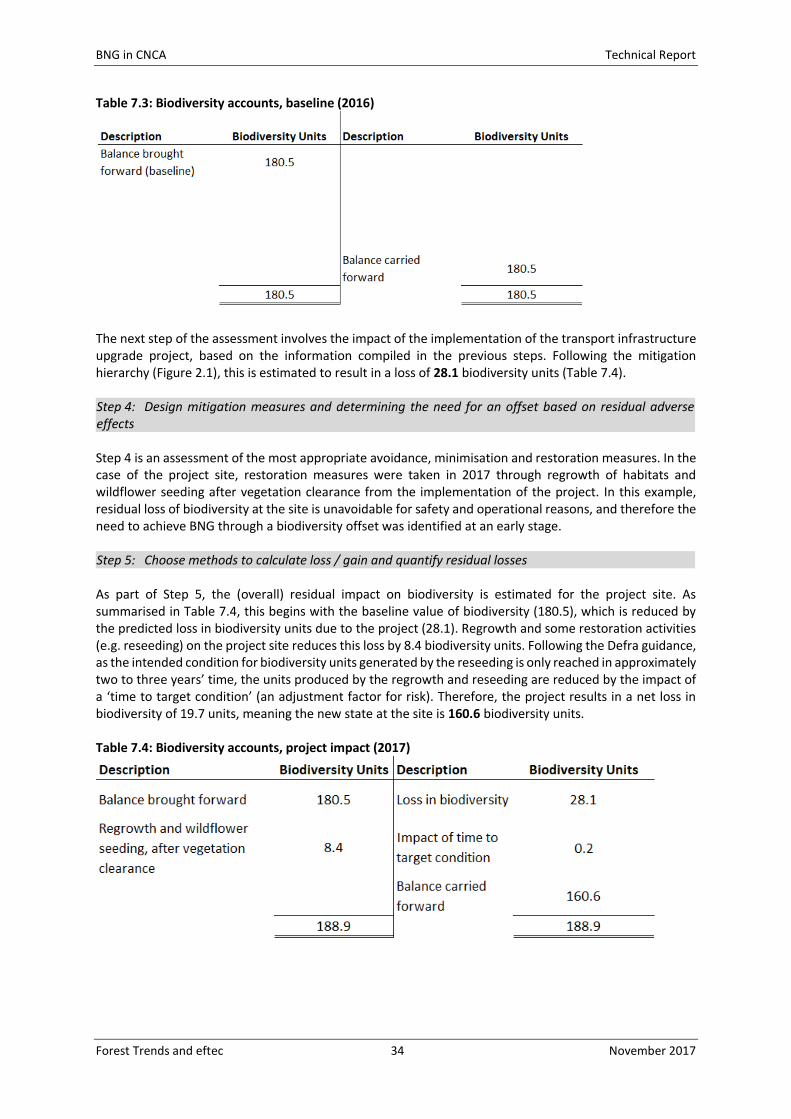
BNG in CNCA Technical Report
Forest Trends and eftec 34 November 2017
Table 7.3: Biodiversity accounts, baseline (2016)
The next step of the assessment involves the impact of the implementation of the transport infrastructure upgrade project, based on the information compiled in the previous steps. Following the mitigation hierarchy (Figure 2.1), this is estimated to result in a loss of 28.1 biodiversity units (Table 7.4). Step 4: Design mitigation measures and determining the need for an offset based on residual adverse effects Step 4 is an assessment of the most appropriate avoidance, minimisation and restoration measures. In the case of the project site, restoration measures were taken in 2017 through regrowth of habitats and wildflower seeding after vegetation clearance from the implementation of the project. In this example, residual loss of biodiversity at the site is unavoidable for safety and operational reasons, and therefore the need to achieve BNG through a biodiversity offset was identified at an early stage. Step 5: Choose methods to calculate loss / gain and quantify residual losses As part of Step 5, the (overall) residual impact on biodiversity is estimated for the project site. As summarised in Table 7.4, this begins with the baseline value of biodiversity (180.5), which is reduced by the predicted loss in biodiversity units due to the project (28.1). Regrowth and some restoration activities (e.g. reseeding) on the project site reduces this loss by 8.4 biodiversity units. Following the Defra guidance, as the intended condition for biodiversity units generated by the reseeding is only reached in approximately two to three years’ time, the units produced by the regrowth and reseeding are reduced by the impact of a ‘time to target condition’ (an adjustment factor for risk). Therefore, the project results in a net loss in biodiversity of 19.7 units, meaning the new state at the site is 160.6 biodiversity units. Table 7.4: Biodiversity accounts, project impact (2017)

BNG in CNCA Technical Report
Forest Trends and eftec 35 November 2017
III. Baseline project site CNCA accounts Following the decision tree presented in Figure 5.1, the project team felt there was a strong case for highlighting the impacts on natural capital at both the project site and the offset site(s). The following discussion outlines the development of the baseline CNCA account for the project site (Step A). For a more detailed outline of the CNCA framework, see Annex 2. Step A: Develop baseline (‘without project’) account and CNCA balance sheet for project site Given the overlap in the planning stage of the CNCA account and the initial steps in the Biodiversity Offset Design, there is no need to re-do the initial stage of the CNCA framework. For the illustrative purpose of this case study it is also assumed that organisation involved in the upgrade works did not account for the implementation of the vegetation clearance regime initially22. This will then be adjusted in the impact accounts. Ecosystem service matrix Based on a review of available information on the project site, the following (provisional) list of ecosystem services were developed for this case study23:
Air quality regulation – the (regulatory) services provided by the air quality regulation provided by the vegetation on the project site.
Climate regulation – the (regulatory) services provided by the carbon sequestration from the vegetation on the project site.
Water regulation – the (regulatory) services provided by vegetation to filter, reduce run-off etc. of water that flows through the project site (e.g. due to rain fall).
Noise regulation – the (regulatory) services provided by the vegetation in absorbing the ambient noise, particularly (in this case) relating to the transport activities.
Visual screening – the services provided by trees and foliage, in providing a screen to limit the view of the transport activities for the surrounding community.
Biodiversity – supporting the existence of wildlife which is valued and enjoyed as an amenity by people. As a service, it is both the benefits from the enjoyment of biodiversity and from knowledge of its existence. This is in addition to the stock of biodiversity (which is not given a monetary value, but measured using the Defra guidance24).
This information is then summarised in an ecosystem service matrix (Table 7.5) (eftec et al., 2015). The matrix provides a summary of the key ecosystem services that are identified for the project site. It distinguishes between what is accounted for under the financial accounts and the CNCA accounts. For example, noise reduction can be a material concern for design of transport infrastructure, affecting financial costs. The matrix also provides a simplified summary of the relative significance of each of the ecosystem services, based on information on the land cover and the data compiled in the previous steps. The significance is
22 Please note, this is a generalisation for illustrative purposes – highlight the distinction between the baseline and impact
stages. In the case of transport upgrade projects, as vegetation clearance is a norm, this is expected to have been
integrated upfront, into their decision-making process.
23 The primary ecosystem services are classified as ‘regulatory’ services, as defined by the UKNEA. See: http://uknea.unep-
wcmc.org/EcosystemAssessmentConcepts/EcosystemServices/tabid/103/Default.aspx
24 Natural England and Defra (2012) Biodiversity Offsetting Pilots Technical Paper: the metric for the biodiversity offsetting
pilot in England. March 2012
https://www.gov.uk/government/publications/technical-paper-the-metric-for-the-biodiversity-offsetting-pilot-in-england
BNG in CNCA Technical Report
Forest Trends and eftec 36 November 2017
measured on a simple three-point scale: ‘significant’ ecosystem services on land cover; ‘possible’, but not significant ecosystem services on land cover; and ‘no’ ecosystem services on land cover. In the case of biodiversity, all units were deemed ‘significant’ as it was considered arbitrary to distinguish between ‘possible’ and ‘significant’ between the different biodiversity values on the different land covers. On the other hand, recreational benefits were included (partly) to illustrate that there are a number of services that are not of relevance to this site25. However, it is important to note that this is only a subset of the wider set of ecosystem services from the UK National Ecosystem Assessment and a more detailed evaluation may be able to identify and assess more ecosystem services for the project site. Finally, this matrix distinguishes between whether these ecosystem services are covered in the accounts. However, as this is only intended as an illustrative case study, the project site accounts focus on: (1) climate regulation; (2) air quality regulation; and (3) biodiversity. The noise regulation and visual screening services could be investigated further in a more detailed study.
25 There is no recreational value from this site as access is restricted, due to security concerns surrounding transport infrastructure.
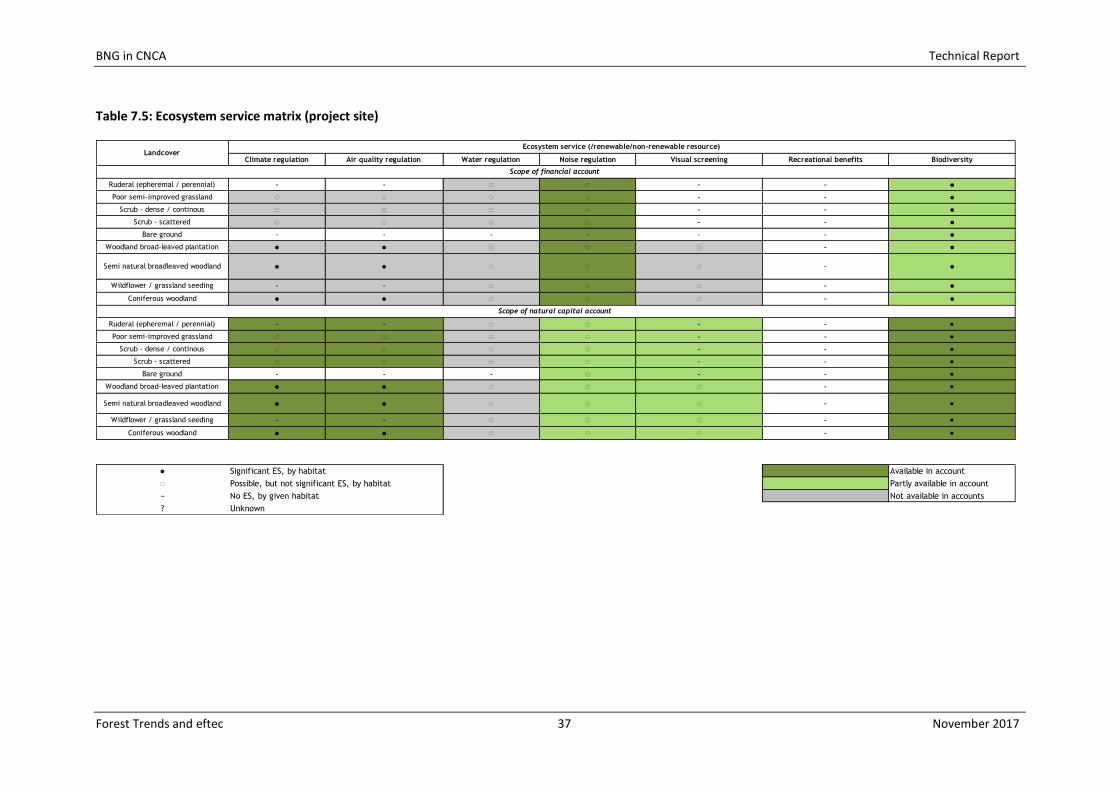
BNG in CNCA Technical Report
Forest Trends and eftec 37 November 2017
Table 7.5: Ecosystem service matrix (project site)
Climate regulation Air quality regulation Water regulation Noise regulation Visual screening Recreational benefits Biodiversity
Ruderal (epheremal / perennial) - - ◌ ◌ - - ●
Poor semi-improved grassland ◌ ◌ ◌ ◌ - - ●
Scrub - dense / continous ◌ ◌ ◌ ◌ - - ●
Scrub - scattered ◌ ◌ ◌ ◌ - - ●
Bare ground - - - - - - ●
Woodland broad-leaved plantation ● ● ◌ ◌ ◌ - ●
Semi natural broadleaved woodland ● ● ◌ ◌ ◌ - ●
Wildflower / grassland seeding - - ◌ ◌ ◌ - ●
Coniferous woodland ● ● ◌ ◌ ◌ - ●
Ruderal (epheremal / perennial) - - ◌ ◌ - - ●
Poor semi-improved grassland ◌ ◌ ◌ ◌ - - ●
Scrub - dense / continous ◌ ◌ ◌ ◌ - - ●
Scrub - scattered ◌ ◌ ◌ ◌ - - ●
Bare ground - - - ◌ - - ●
Woodland broad-leaved plantation ● ● ◌ ◌ ◌ - ●
Semi natural broadleaved woodland ● ● ◌ ◌ ◌ - ●
Wildflower / grassland seeding - - ◌ ◌ ◌ - ●
Coniferous woodland ● ● ◌ ◌ ◌ - ●
● Significant ES, by habitat Available in account
◌ Possible, but not significant ES, by habitat Partly available in account
− No ES, by given habitat Not available in accounts
? Unknown
Landcover
Scope of financial account
Scope of natural capital account
Ecosystem service (/renewable/non-renewable resource)

BNG in CNCA Technical Report
Forest Trends and eftec 38 November 2017
Project site asset register The information from the above steps are then used to develop a summary of the project site’s features, whether qualitative or quantitative, in the asset register. Table 7.6 below summarises the key forms of vegetated land cover at the project site26, which forms part of the asset register. Table 7.6: Excerpt from project site asset register (baseline)
Broad habitat type Total area (hectares)
Woodland 16.9
Grassland 7.5
Total area 24.5
To maintain confidentiality of the project site, no further information on the site is presented in this report. Project site physical flow accounts The physical flow accounts use the information from the asset register, the biodiversity accounts and the ecosystem service matrix to estimate the physical flow of the ecosystem services. Table 7.7 provides a summary of the annual tonnes of pollutants reduced due to habitat on the project site, before the development. For this initial assessment, the iTree model27 was used to estimate annual emissions reductions for the different forms of habitat on the project site. Table 7.7: Summary of the air quality physical flow account (baseline), project site
Pollutant Annual emissions reductions
(tonnes/year)
Carbon Monoxide 0.05
Sulphur Dioxide 0.15
Nitrogen Dioxide 1.04
PM10 particulates 1.50
PM2.5 particulates 0.004
Ozone 2.10
Similarly, Table 7.8 summarises the tonnes of carbon sequestered per year at the project site. Table 7.8: Summary of the climate regulation physical flow account (baseline), project site
Annual sequestration
(tonnes/year)
Carbon sequestration (CO₂) 305.2
Project site monetary flow accounts The monetary flow accounts use the information from the physical flow accounts to estimate the annual monetary value of the ecosystem services.
26 Please note, to maintain confidentiality, the built-up land (relating to the transport infrastructure) is not accounted for in
these figures.
27 It is assumed that the project site is located in an urban setting and woodland and scrubland have an age of 45 years.
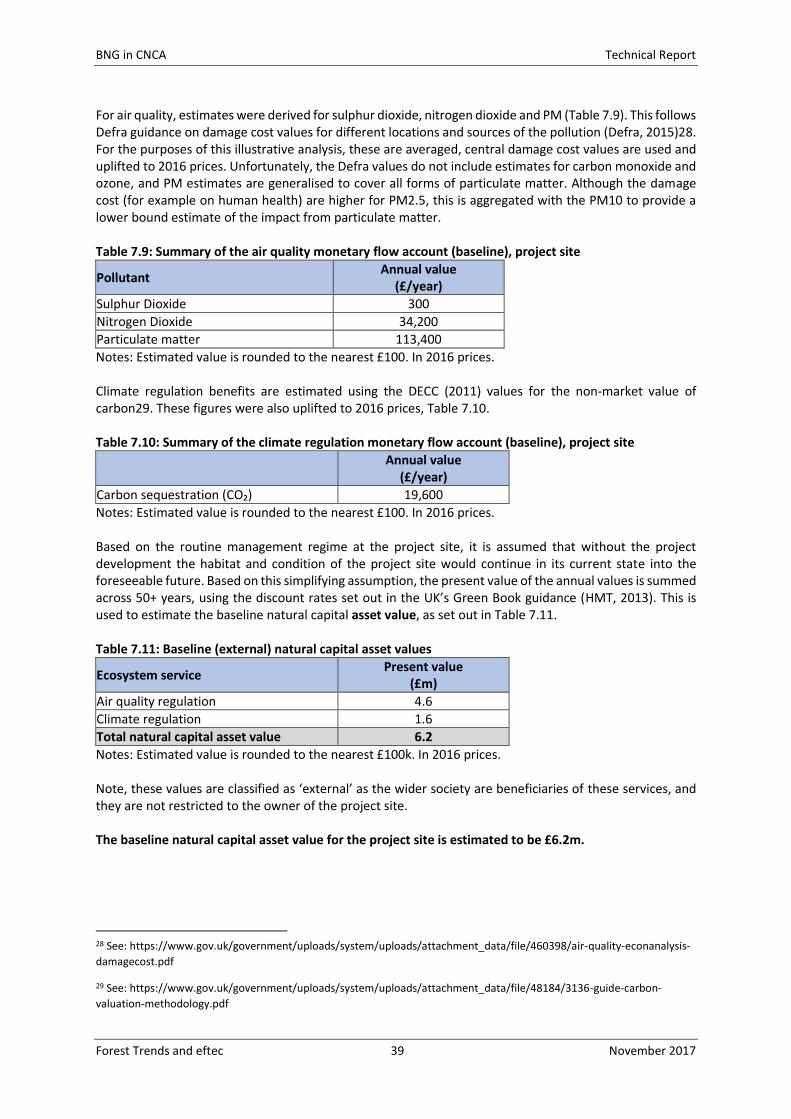
BNG in CNCA Technical Report
Forest Trends and eftec 39 November 2017
For air quality, estimates were derived for sulphur dioxide, nitrogen dioxide and PM (Table 7.9). This follows Defra guidance on damage cost values for different locations and sources of the pollution (Defra, 2015)28. For the purposes of this illustrative analysis, these are averaged, central damage cost values are used and uplifted to 2016 prices. Unfortunately, the Defra values do not include estimates for carbon monoxide and ozone, and PM estimates are generalised to cover all forms of particulate matter. Although the damage cost (for example on human health) are higher for PM2.5, this is aggregated with the PM10 to provide a lower bound estimate of the impact from particulate matter. Table 7.9: Summary of the air quality monetary flow account (baseline), project site
Pollutant Annual value
(£/year)
Sulphur Dioxide 300
Nitrogen Dioxide 34,200
Particulate matter 113,400
Notes: Estimated value is rounded to the nearest £100. In 2016 prices. Climate regulation benefits are estimated using the DECC (2011) values for the non-market value of carbon29. These figures were also uplifted to 2016 prices, Table 7.10. Table 7.10: Summary of the climate regulation monetary flow account (baseline), project site
Annual value
(£/year)
Carbon sequestration (CO₂) 19,600
Notes: Estimated value is rounded to the nearest £100. In 2016 prices. Based on the routine management regime at the project site, it is assumed that without the project development the habitat and condition of the project site would continue in its current state into the foreseeable future. Based on this simplifying assumption, the present value of the annual values is summed across 50+ years, using the discount rates set out in the UK’s Green Book guidance (HMT, 2013). This is used to estimate the baseline natural capital asset value, as set out in Table 7.11. Table 7.11: Baseline (external) natural capital asset values
Ecosystem service Present value
(£m)
Air quality regulation 4.6
Climate regulation 1.6
Total natural capital asset value 6.2
Notes: Estimated value is rounded to the nearest £100k. In 2016 prices. Note, these values are classified as ‘external’ as the wider society are beneficiaries of these services, and they are not restricted to the owner of the project site. The baseline natural capital asset value for the project site is estimated to be £6.2m.
28 See: https://www.gov.uk/government/uploads/system/uploads/attachment_data/file/460398/air-quality-econanalysis-
damagecost.pdf
29 See: https://www.gov.uk/government/uploads/system/uploads/attachment_data/file/48184/3136-guide-carbon-
valuation-methodology.pdf
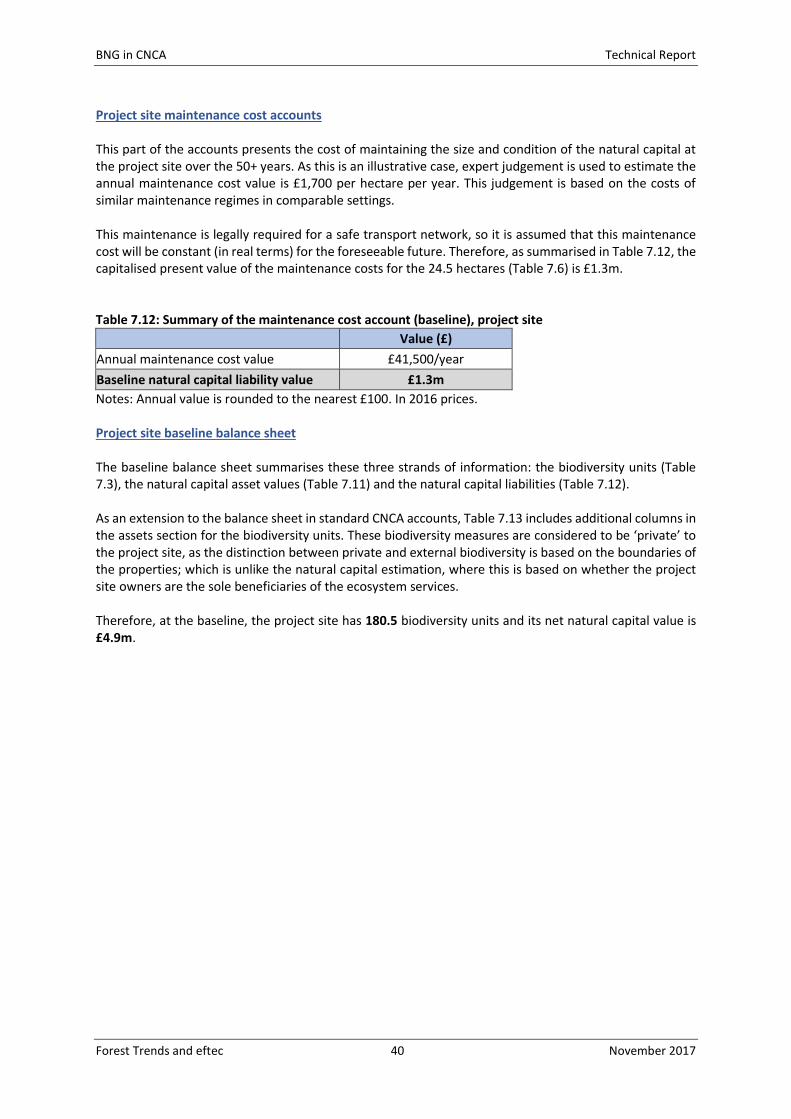
BNG in CNCA Technical Report
Forest Trends and eftec 40 November 2017
Project site maintenance cost accounts This part of the accounts presents the cost of maintaining the size and condition of the natural capital at the project site over the 50+ years. As this is an illustrative case, expert judgement is used to estimate the annual maintenance cost value is £1,700 per hectare per year. This judgement is based on the costs of similar maintenance regimes in comparable settings. This maintenance is legally required for a safe transport network, so it is assumed that this maintenance cost will be constant (in real terms) for the foreseeable future. Therefore, as summarised in Table 7.12, the capitalised present value of the maintenance costs for the 24.5 hectares (Table 7.6) is £1.3m. Table 7.12: Summary of the maintenance cost account (baseline), project site
Value (£)
Annual maintenance cost value £41,500/year
Baseline natural capital liability value £1.3m
Notes: Annual value is rounded to the nearest £100. In 2016 prices. Project site baseline balance sheet The baseline balance sheet summarises these three strands of information: the biodiversity units (Table 7.3), the natural capital asset values (Table 7.11) and the natural capital liabilities (Table 7.12). As an extension to the balance sheet in standard CNCA accounts, Table 7.13 includes additional columns in the assets section for the biodiversity units. These biodiversity measures are considered to be ‘private’ to the project site, as the distinction between private and external biodiversity is based on the boundaries of the properties; which is unlike the natural capital estimation, where this is based on whether the project site owners are the sole beneficiaries of the ecosystem services. Therefore, at the baseline, the project site has 180.5 biodiversity units and its net natural capital value is £4.9m.
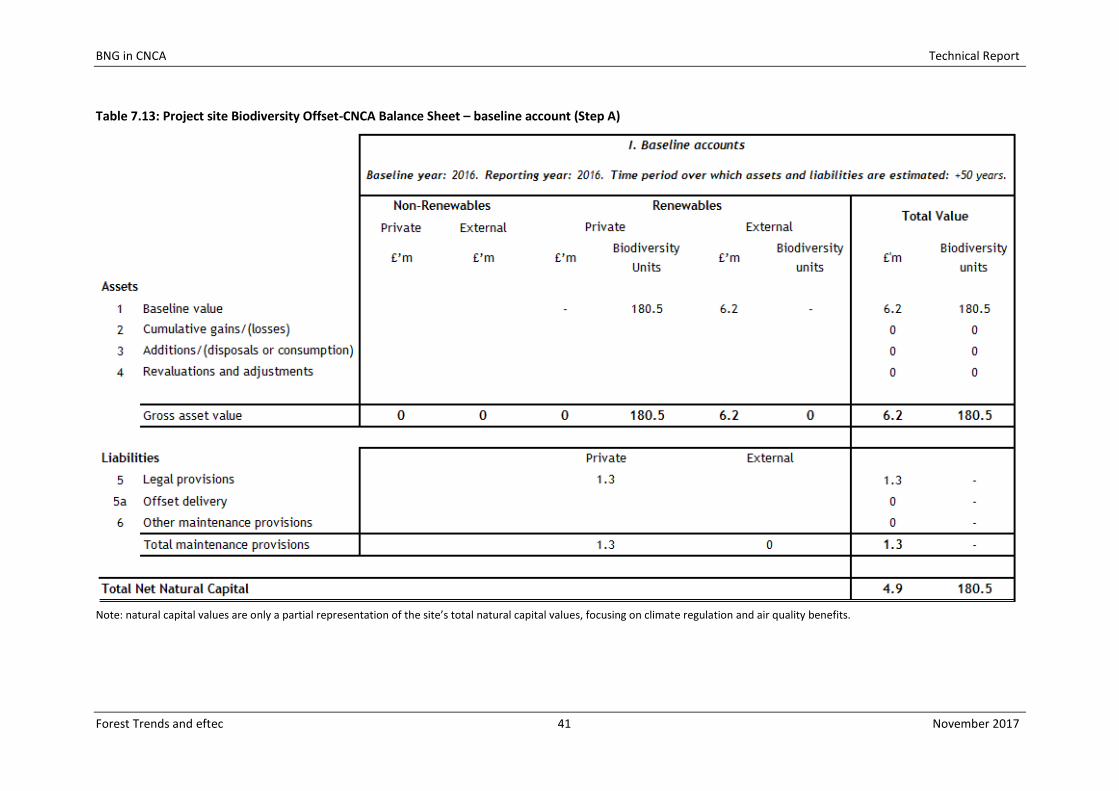
BNG in CNCA Technical Report
Forest Trends and eftec 41 November 2017
Table 7.13: Project site Biodiversity Offset-CNCA Balance Sheet – baseline account (Step A)
Note: natural capital values are only a partial representation of the site’s total natural capital values, focusing on climate regulation and air quality benefits.
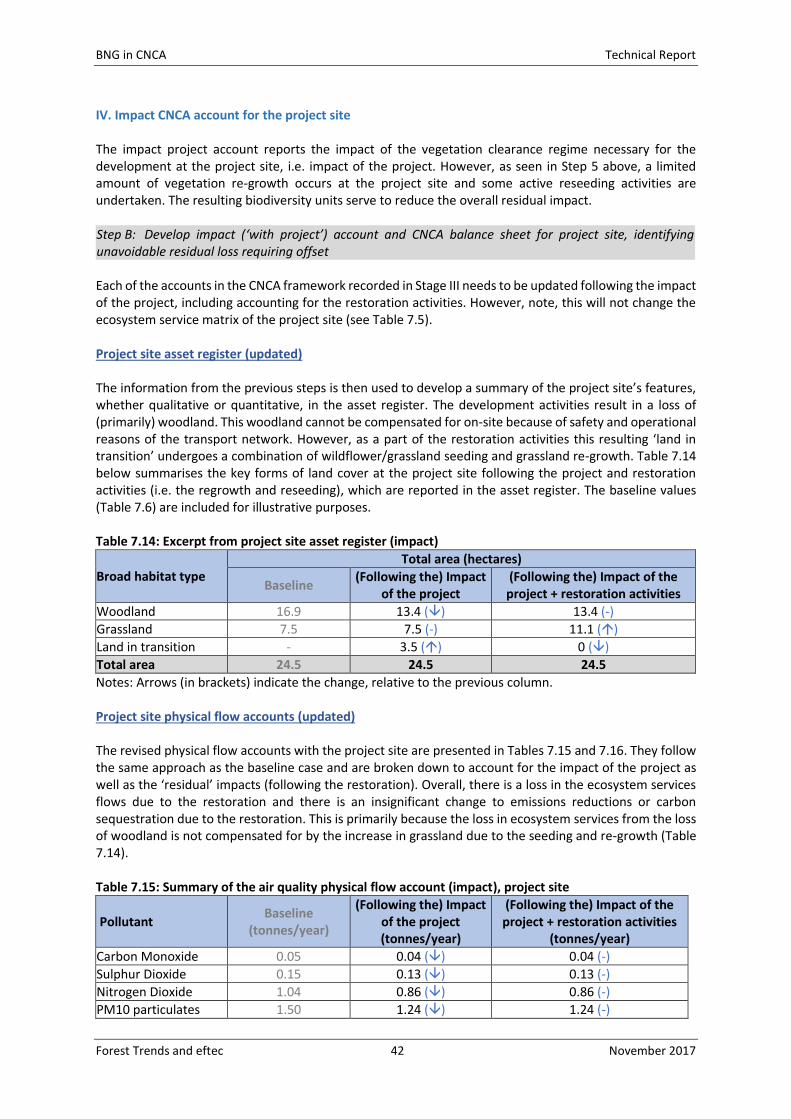
BNG in CNCA Technical Report
Forest Trends and eftec 42 November 2017
IV. Impact CNCA account for the project site The impact project account reports the impact of the vegetation clearance regime necessary for the development at the project site, i.e. impact of the project. However, as seen in Step 5 above, a limited amount of vegetation re-growth occurs at the project site and some active reseeding activities are undertaken. The resulting biodiversity units serve to reduce the overall residual impact. Step B: Develop impact (‘with project’) account and CNCA balance sheet for project site, identifying unavoidable residual loss requiring offset Each of the accounts in the CNCA framework recorded in Stage III needs to be updated following the impact of the project, including accounting for the restoration activities. However, note, this will not change the ecosystem service matrix of the project site (see Table 7.5). Project site asset register (updated) The information from the previous steps is then used to develop a summary of the project site’s features, whether qualitative or quantitative, in the asset register. The development activities result in a loss of (primarily) woodland. This woodland cannot be compensated for on-site because of safety and operational reasons of the transport network. However, as a part of the restoration activities this resulting ‘land in transition’ undergoes a combination of wildflower/grassland seeding and grassland re-growth. Table 7.14 below summarises the key forms of land cover at the project site following the project and restoration activities (i.e. the regrowth and reseeding), which are reported in the asset register. The baseline values (Table 7.6) are included for illustrative purposes. Table 7.14: Excerpt from project site asset register (impact)
Broad habitat type Total area (hectares)
Baseline (Following the) Impact
of the project (Following the) Impact of the project + restoration activities
Woodland 16.9 13.4 () 13.4 (-)
Grassland 7.5 7.5 (-) 11.1 ()
Land in transition - 3.5 () 0 ()
Total area 24.5 24.5 24.5
Notes: Arrows (in brackets) indicate the change, relative to the previous column. Project site physical flow accounts (updated) The revised physical flow accounts with the project site are presented in Tables 7.15 and 7.16. They follow the same approach as the baseline case and are broken down to account for the impact of the project as well as the ‘residual’ impacts (following the restoration). Overall, there is a loss in the ecosystem services flows due to the restoration and there is an insignificant change to emissions reductions or carbon sequestration due to the restoration. This is primarily because the loss in ecosystem services from the loss of woodland is not compensated for by the increase in grassland due to the seeding and re-growth (Table 7.14). Table 7.15: Summary of the air quality physical flow account (impact), project site
Pollutant Baseline
(tonnes/year)
(Following the) Impact of the project (tonnes/year)
(Following the) Impact of the project + restoration activities
(tonnes/year)
Carbon Monoxide 0.05 0.04 () 0.04 (-)
Sulphur Dioxide 0.15 0.13 () 0.13 (-)
Nitrogen Dioxide 1.04 0.86 () 0.86 (-)
PM10 particulates 1.50 1.24 () 1.24 (-)
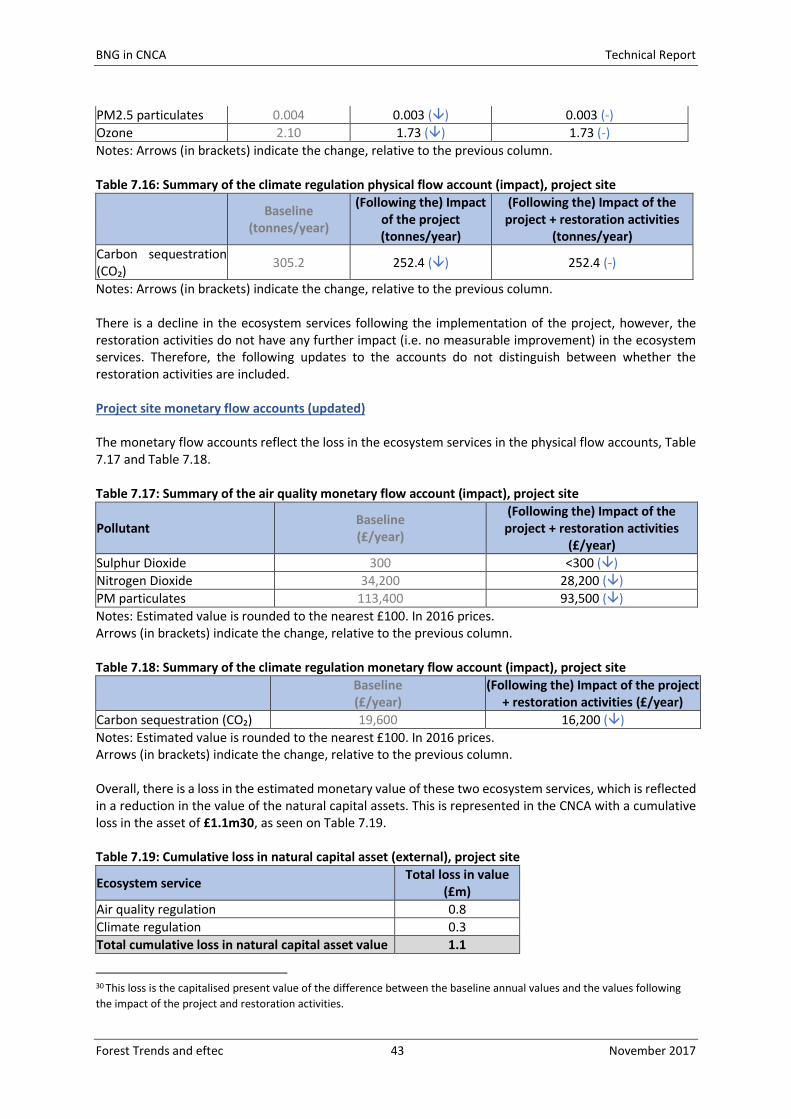
BNG in CNCA Technical Report
Forest Trends and eftec 43 November 2017
PM2.5 particulates 0.004 0.003 () 0.003 (-)
Ozone 2.10 1.73 () 1.73 (-)
Notes: Arrows (in brackets) indicate the change, relative to the previous column. Table 7.16: Summary of the climate regulation physical flow account (impact), project site
Baseline
(tonnes/year)
(Following the) Impact of the project (tonnes/year)
(Following the) Impact of the project + restoration activities
(tonnes/year)
Carbon sequestration (CO₂)
305.2 252.4 () 252.4 (-)
Notes: Arrows (in brackets) indicate the change, relative to the previous column. There is a decline in the ecosystem services following the implementation of the project, however, the restoration activities do not have any further impact (i.e. no measurable improvement) in the ecosystem services. Therefore, the following updates to the accounts do not distinguish between whether the restoration activities are included. Project site monetary flow accounts (updated) The monetary flow accounts reflect the loss in the ecosystem services in the physical flow accounts, Table 7.17 and Table 7.18. Table 7.17: Summary of the air quality monetary flow account (impact), project site
Pollutant Baseline (£/year)
(Following the) Impact of the project + restoration activities
(£/year)
Sulphur Dioxide 300 <300 ()
Nitrogen Dioxide 34,200 28,200 ()
PM particulates 113,400 93,500 ()
Notes: Estimated value is rounded to the nearest £100. In 2016 prices. Arrows (in brackets) indicate the change, relative to the previous column. Table 7.18: Summary of the climate regulation monetary flow account (impact), project site
Baseline (£/year)
(Following the) Impact of the project + restoration activities (£/year)
Carbon sequestration (CO₂) 19,600 16,200 ()
Notes: Estimated value is rounded to the nearest £100. In 2016 prices. Arrows (in brackets) indicate the change, relative to the previous column. Overall, there is a loss in the estimated monetary value of these two ecosystem services, which is reflected in a reduction in the value of the natural capital assets. This is represented in the CNCA with a cumulative loss in the asset of £1.1m30, as seen on Table 7.19. Table 7.19: Cumulative loss in natural capital asset (external), project site
Ecosystem service Total loss in value
(£m)
Air quality regulation 0.8
Climate regulation 0.3
Total cumulative loss in natural capital asset value 1.1
30 This loss is the capitalised present value of the difference between the baseline annual values and the values following
the impact of the project and restoration activities.
BNG in CNCA Technical Report
Forest Trends and eftec 44 November 2017
Notes: In 2016 prices. Project site maintenance cost accounts (updated) It is assumed that there is no change in vegetation maintenance practices following the project implementation and no additional management costs relating to the restoration activities compared to the baseline. Therefore, as presented in Table 7.12, the capitalised present value of the maintenance costs remains at £1.3m. Project site impact account balance sheet (updated) The impact account balance sheet summarises the biodiversity units (Table 7.4), the natural capital asset values (Table 7.19) and the natural capital liabilities (Table 7.12). Note, this follows the same approach as the baseline accounts, but the reporting year is no longer the baseline year of 2016, but 2017, following the impact of the implementation of the project and the restoration activities (i.e. reseeding and revegetation) have been carried out. Values are still in 2016 prices. As seen in Table 7.20, there is a fall in the biodiversity units from 180.5 to 160.631 (the balance carried forward in Table 7.4). This reflects the impact from the implementation of the project (-28.1) as well as the increase from the regrowth and reseeding (+8.4), to produce a net residual loss of -19.7 units. Similar to the natural capital asset value changes, this residual loss in the biodiversity units is accounted for as a cumulative loss in the biodiversity units at the baseline. However, given that the revegetation, regrowth and reseeding will not achieve its stated condition for a number of years, the resulting effect of the time to target condition (loss of 0.2 units) is accounted as a revaluation32. There is also a reduction in the net natural capital asset at the project site from £4.9m (Table 7.13) to £3.9m, due to the loss in natural capital assets (Table 7.19) and no predictable change in the natural capital liabilities. Note, as society is the ultimate beneficiary of both of these services, this is classified as ‘external’ to the organisation in the balance sheet. At this stage of the analysis, offsets have not been identified yet and hence are not accounted for in the above. What we know so far is that offsets need to generate at least 19.9 biodiversity units, identified using the DEFRA approach, to achieve BNG.
31 This is also the same value that is reflected in the impact biodiversity account (Table 7.4) balance carried forward.
32 This is because this is an effective discounting factor and not reflective of the biophysical changes in the state of the
biodiversity or natural capital.

BNG in CNCA Technical Report
Forest Trends and eftec 45 November 2017
Table 7.20: Project site Biodiversity Offset-CNCA Balance Sheet – impact account (Step B)
Note: In line with standard accounting practices negative values are presented in brackets ‘(…)’. Natural capital values are only a partial representation of the site’s total natural capital values, focusing on climate regulation and air quality benefits.
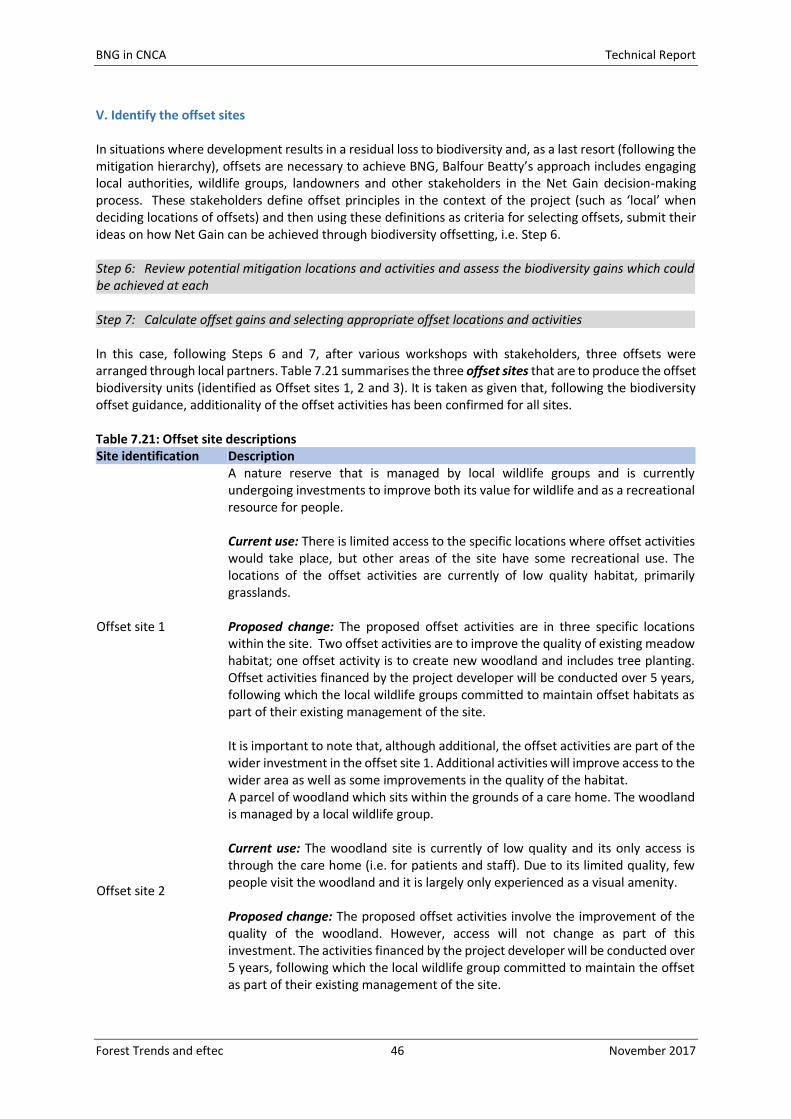
BNG in CNCA Technical Report
Forest Trends and eftec 46 November 2017
V. Identify the offset sites In situations where development results in a residual loss to biodiversity and, as a last resort (following the mitigation hierarchy), offsets are necessary to achieve BNG, Balfour Beatty’s approach includes engaging local authorities, wildlife groups, landowners and other stakeholders in the Net Gain decision-making process. These stakeholders define offset principles in the context of the project (such as ‘local’ when deciding locations of offsets) and then using these definitions as criteria for selecting offsets, submit their ideas on how Net Gain can be achieved through biodiversity offsetting, i.e. Step 6. Step 6: Review potential mitigation locations and activities and assess the biodiversity gains which could be achieved at each Step 7: Calculate offset gains and selecting appropriate offset locations and activities In this case, following Steps 6 and 7, after various workshops with stakeholders, three offsets were arranged through local partners. Table 7.21 summarises the three offset sites that are to produce the offset biodiversity units (identified as Offset sites 1, 2 and 3). It is taken as given that, following the biodiversity offset guidance, additionality of the offset activities has been confirmed for all sites. Table 7.21: Offset site descriptions Site identification Description
Offset site 1
A nature reserve that is managed by local wildlife groups and is currently undergoing investments to improve both its value for wildlife and as a recreational resource for people. Current use: There is limited access to the specific locations where offset activities would take place, but other areas of the site have some recreational use. The locations of the offset activities are currently of low quality habitat, primarily grasslands. Proposed change: The proposed offset activities are in three specific locations within the site. Two offset activities are to improve the quality of existing meadow habitat; one offset activity is to create new woodland and includes tree planting. Offset activities financed by the project developer will be conducted over 5 years, following which the local wildlife groups committed to maintain offset habitats as part of their existing management of the site. It is important to note that, although additional, the offset activities are part of the wider investment in the offset site 1. Additional activities will improve access to the wider area as well as some improvements in the quality of the habitat.
Offset site 2
A parcel of woodland which sits within the grounds of a care home. The woodland is managed by a local wildlife group. Current use: The woodland site is currently of low quality and its only access is through the care home (i.e. for patients and staff). Due to its limited quality, few people visit the woodland and it is largely only experienced as a visual amenity. Proposed change: The proposed offset activities involve the improvement of the quality of the woodland. However, access will not change as part of this investment. The activities financed by the project developer will be conducted over 5 years, following which the local wildlife group committed to maintain the offset as part of their existing management of the site.
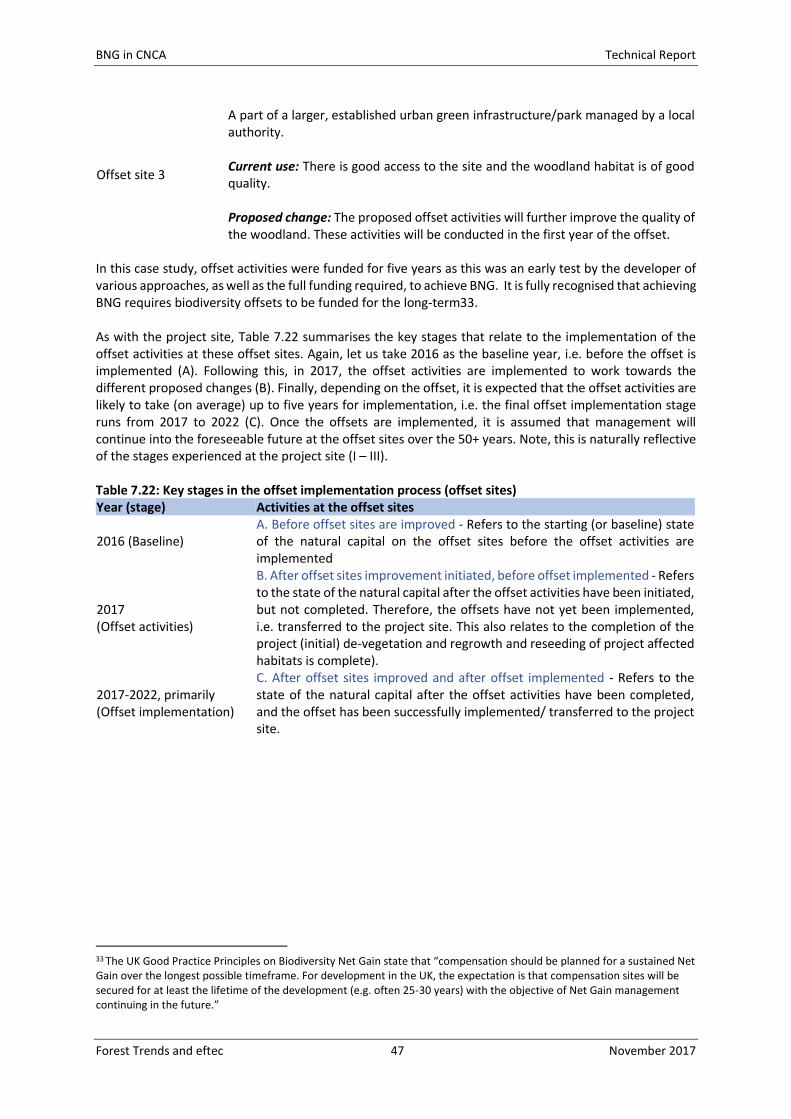
BNG in CNCA Technical Report
Forest Trends and eftec 47 November 2017
Offset site 3
A part of a larger, established urban green infrastructure/park managed by a local authority. Current use: There is good access to the site and the woodland habitat is of good quality. Proposed change: The proposed offset activities will further improve the quality of the woodland. These activities will be conducted in the first year of the offset.
In this case study, offset activities were funded for five years as this was an early test by the developer of various approaches, as well as the full funding required, to achieve BNG. It is fully recognised that achieving BNG requires biodiversity offsets to be funded for the long-term33. As with the project site, Table 7.22 summarises the key stages that relate to the implementation of the offset activities at these offset sites. Again, let us take 2016 as the baseline year, i.e. before the offset is implemented (A). Following this, in 2017, the offset activities are implemented to work towards the different proposed changes (B). Finally, depending on the offset, it is expected that the offset activities are likely to take (on average) up to five years for implementation, i.e. the final offset implementation stage runs from 2017 to 2022 (C). Once the offsets are implemented, it is assumed that management will continue into the foreseeable future at the offset sites over the 50+ years. Note, this is naturally reflective of the stages experienced at the project site (I – III). Table 7.22: Key stages in the offset implementation process (offset sites) Year (stage) Activities at the offset sites
2016 (Baseline) A. Before offset sites are improved - Refers to the starting (or baseline) state of the natural capital on the offset sites before the offset activities are implemented
2017 (Offset activities)
B. After offset sites improvement initiated, before offset implemented - Refers to the state of the natural capital after the offset activities have been initiated, but not completed. Therefore, the offsets have not yet been implemented, i.e. transferred to the project site. This also relates to the completion of the project (initial) de-vegetation and regrowth and reseeding of project affected habitats is complete).
2017-2022, primarily (Offset implementation)
C. After offset sites improved and after offset implemented - Refers to the state of the natural capital after the offset activities have been completed, and the offset has been successfully implemented/ transferred to the project site.
33 The UK Good Practice Principles on Biodiversity Net Gain state that “compensation should be planned for a sustained Net Gain over the longest possible timeframe. For development in the UK, the expectation is that compensation sites will be secured for at least the lifetime of the development (e.g. often 25-30 years) with the objective of Net Gain management continuing in the future.”
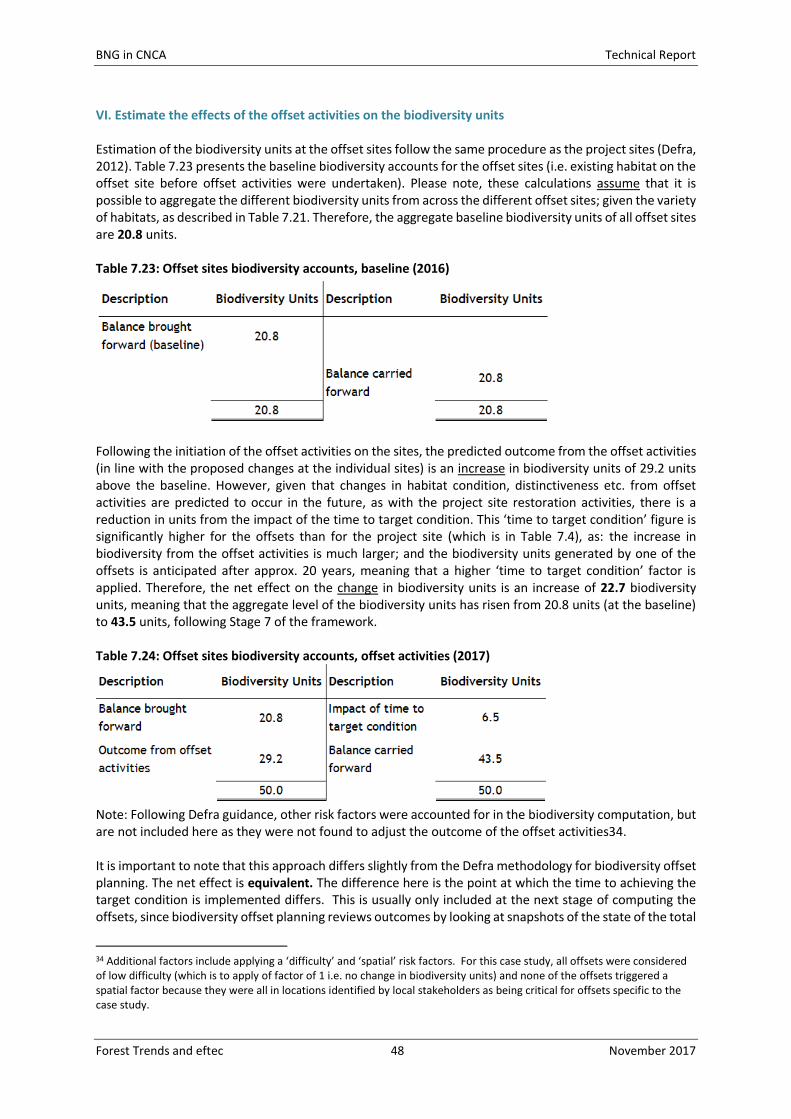
BNG in CNCA Technical Report
Forest Trends and eftec 48 November 2017
VI. Estimate the effects of the offset activities on the biodiversity units Estimation of the biodiversity units at the offset sites follow the same procedure as the project sites (Defra, 2012). Table 7.23 presents the baseline biodiversity accounts for the offset sites (i.e. existing habitat on the offset site before offset activities were undertaken). Please note, these calculations assume that it is possible to aggregate the different biodiversity units from across the different offset sites; given the variety of habitats, as described in Table 7.21. Therefore, the aggregate baseline biodiversity units of all offset sites are 20.8 units. Table 7.23: Offset sites biodiversity accounts, baseline (2016)
Following the initiation of the offset activities on the sites, the predicted outcome from the offset activities (in line with the proposed changes at the individual sites) is an increase in biodiversity units of 29.2 units above the baseline. However, given that changes in habitat condition, distinctiveness etc. from offset activities are predicted to occur in the future, as with the project site restoration activities, there is a reduction in units from the impact of the time to target condition. This ‘time to target condition’ figure is significantly higher for the offsets than for the project site (which is in Table 7.4), as: the increase in biodiversity from the offset activities is much larger; and the biodiversity units generated by one of the offsets is anticipated after approx. 20 years, meaning that a higher ‘time to target condition’ factor is applied. Therefore, the net effect on the change in biodiversity units is an increase of 22.7 biodiversity units, meaning that the aggregate level of the biodiversity units has risen from 20.8 units (at the baseline) to 43.5 units, following Stage 7 of the framework. Table 7.24: Offset sites biodiversity accounts, offset activities (2017)
Note: Following Defra guidance, other risk factors were accounted for in the biodiversity computation, but are not included here as they were not found to adjust the outcome of the offset activities34. It is important to note that this approach differs slightly from the Defra methodology for biodiversity offset planning. The net effect is equivalent. The difference here is the point at which the time to achieving the target condition is implemented differs. This is usually only included at the next stage of computing the offsets, since biodiversity offset planning reviews outcomes by looking at snapshots of the state of the total
34 Additional factors include applying a ‘difficulty’ and ‘spatial’ risk factors. For this case study, all offsets were considered of low difficulty (which is to apply of factor of 1 i.e. no change in biodiversity units) and none of the offsets triggered a spatial factor because they were all in locations identified by local stakeholders as being critical for offsets specific to the case study.
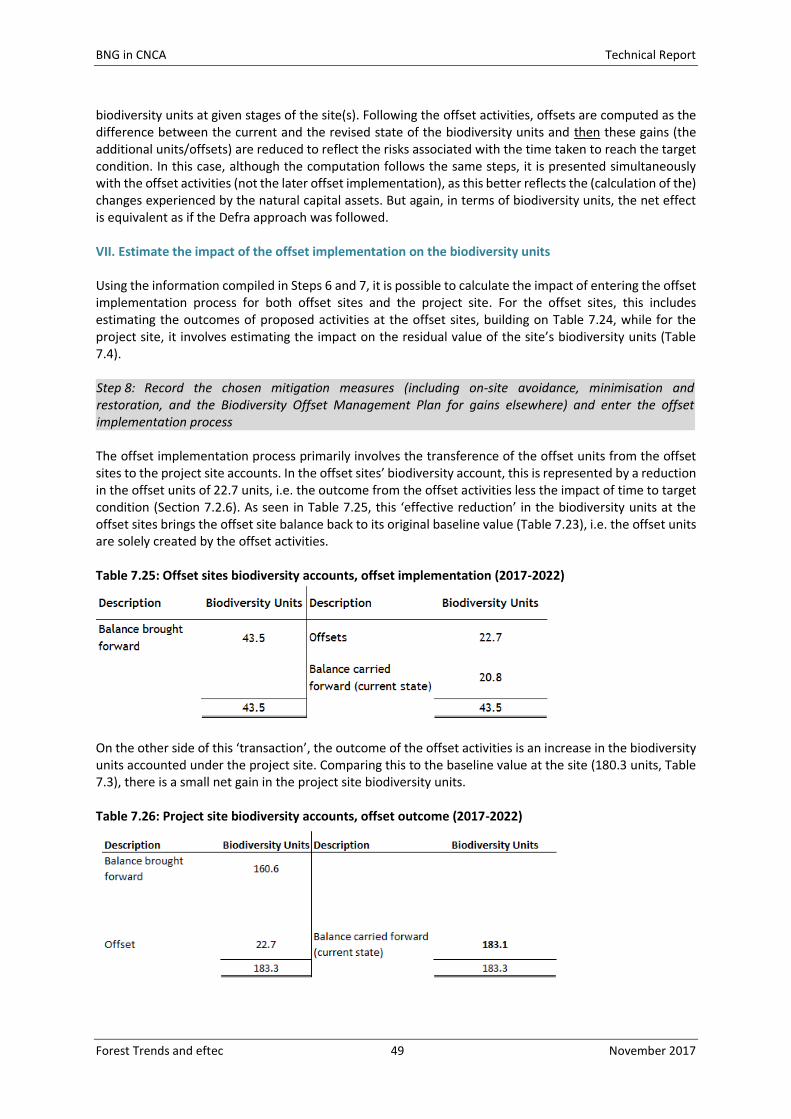
BNG in CNCA Technical Report
Forest Trends and eftec 49 November 2017
biodiversity units at given stages of the site(s). Following the offset activities, offsets are computed as the difference between the current and the revised state of the biodiversity units and then these gains (the additional units/offsets) are reduced to reflect the risks associated with the time taken to reach the target condition. In this case, although the computation follows the same steps, it is presented simultaneously with the offset activities (not the later offset implementation), as this better reflects the (calculation of the) changes experienced by the natural capital assets. But again, in terms of biodiversity units, the net effect is equivalent as if the Defra approach was followed. VII. Estimate the impact of the offset implementation on the biodiversity units Using the information compiled in Steps 6 and 7, it is possible to calculate the impact of entering the offset implementation process for both offset sites and the project site. For the offset sites, this includes estimating the outcomes of proposed activities at the offset sites, building on Table 7.24, while for the project site, it involves estimating the impact on the residual value of the site’s biodiversity units (Table 7.4). Step 8: Record the chosen mitigation measures (including on-site avoidance, minimisation and restoration, and the Biodiversity Offset Management Plan for gains elsewhere) and enter the offset implementation process The offset implementation process primarily involves the transference of the offset units from the offset sites to the project site accounts. In the offset sites’ biodiversity account, this is represented by a reduction in the offset units of 22.7 units, i.e. the outcome from the offset activities less the impact of time to target condition (Section 7.2.6). As seen in Table 7.25, this ‘effective reduction’ in the biodiversity units at the offset sites brings the offset site balance back to its original baseline value (Table 7.23), i.e. the offset units are solely created by the offset activities. Table 7.25: Offset sites biodiversity accounts, offset implementation (2017-2022)
On the other side of this ‘transaction’, the outcome of the offset activities is an increase in the biodiversity units accounted under the project site. Comparing this to the baseline value at the site (180.3 units, Table 7.3), there is a small net gain in the project site biodiversity units. Table 7.26: Project site biodiversity accounts, offset outcome (2017-2022)
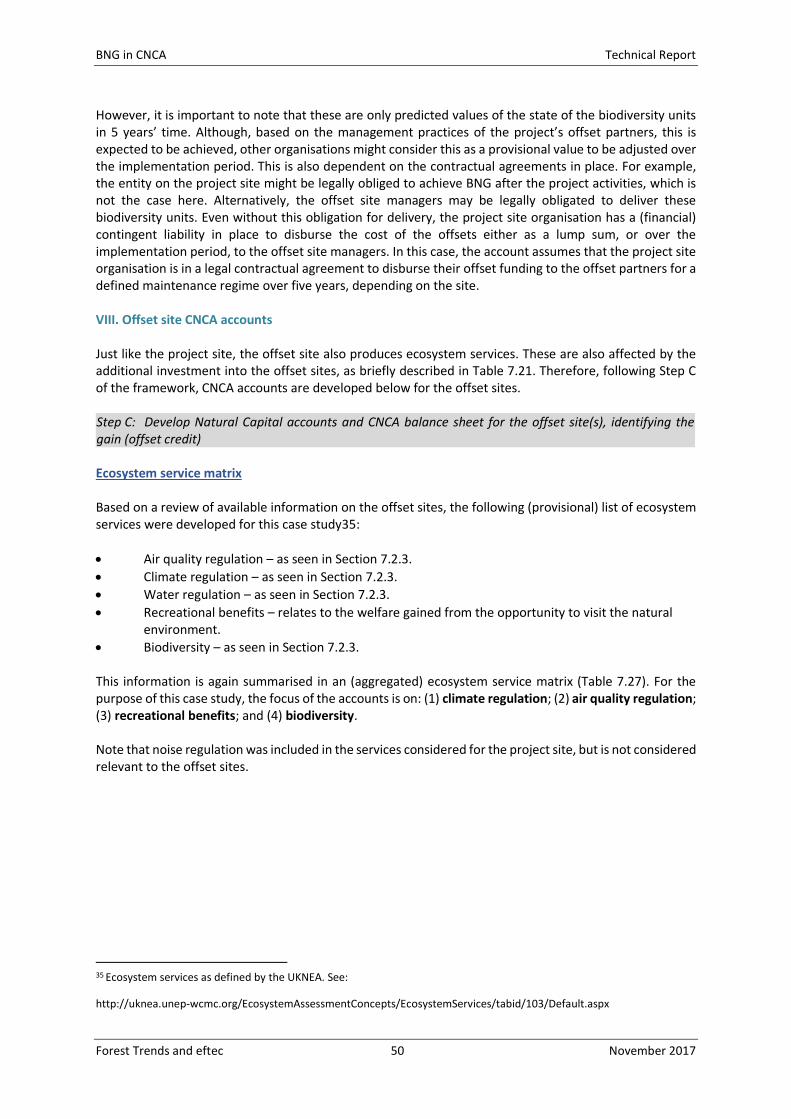
BNG in CNCA Technical Report
Forest Trends and eftec 50 November 2017
However, it is important to note that these are only predicted values of the state of the biodiversity units in 5 years’ time. Although, based on the management practices of the project’s offset partners, this is expected to be achieved, other organisations might consider this as a provisional value to be adjusted over the implementation period. This is also dependent on the contractual agreements in place. For example, the entity on the project site might be legally obliged to achieve BNG after the project activities, which is not the case here. Alternatively, the offset site managers may be legally obligated to deliver these biodiversity units. Even without this obligation for delivery, the project site organisation has a (financial) contingent liability in place to disburse the cost of the offsets either as a lump sum, or over the implementation period, to the offset site managers. In this case, the account assumes that the project site organisation is in a legal contractual agreement to disburse their offset funding to the offset partners for a defined maintenance regime over five years, depending on the site. VIII. Offset site CNCA accounts Just like the project site, the offset site also produces ecosystem services. These are also affected by the additional investment into the offset sites, as briefly described in Table 7.21. Therefore, following Step C of the framework, CNCA accounts are developed below for the offset sites. Step C: Develop Natural Capital accounts and CNCA balance sheet for the offset site(s), identifying the gain (offset credit) Ecosystem service matrix Based on a review of available information on the offset sites, the following (provisional) list of ecosystem services were developed for this case study35:
Air quality regulation – as seen in Section 7.2.3.
Climate regulation – as seen in Section 7.2.3.
Water regulation – as seen in Section 7.2.3.
Recreational benefits – relates to the welfare gained from the opportunity to visit the natural environment.
Biodiversity – as seen in Section 7.2.3. This information is again summarised in an (aggregated) ecosystem service matrix (Table 7.27). For the purpose of this case study, the focus of the accounts is on: (1) climate regulation; (2) air quality regulation; (3) recreational benefits; and (4) biodiversity. Note that noise regulation was included in the services considered for the project site, but is not considered relevant to the offset sites.
35 Ecosystem services as defined by the UKNEA. See:
http://uknea.unep-wcmc.org/EcosystemAssessmentConcepts/EcosystemServices/tabid/103/Default.aspx
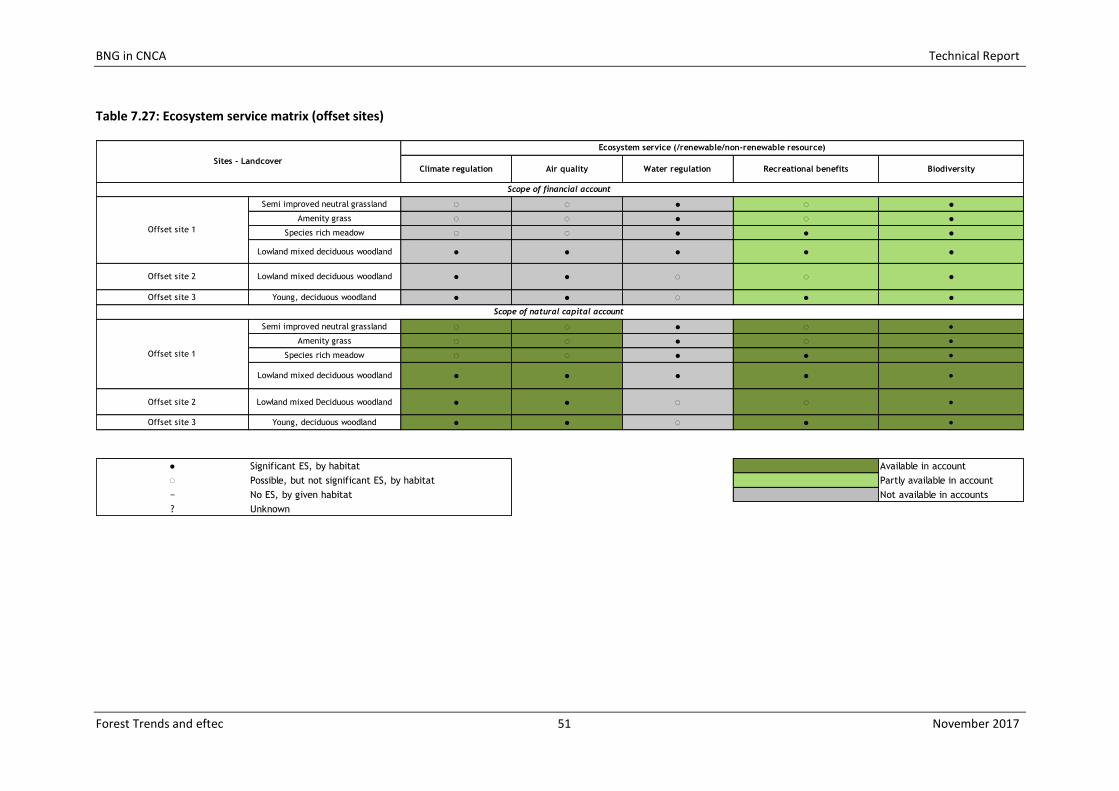
BNG in CNCA Technical Report
Forest Trends and eftec 51 November 2017
Table 7.27: Ecosystem service matrix (offset sites)
Climate regulation Air quality Water regulation Recreational benefits Biodiversity
Semi improved neutral grassland ◌ ◌ ● ◌ ●
Amenity grass ◌ ◌ ● ◌ ●
Species rich meadow ◌ ◌ ● ● ●
Lowland mixed deciduous woodland ● ● ● ● ●
Offset site 2 Lowland mixed deciduous woodland ● ● ◌ ◌ ●
Offset site 3 Young, deciduous woodland ● ● ◌ ● ●
Semi improved neutral grassland ◌ ◌ ● ◌ ●
Amenity grass ◌ ◌ ● ◌ ●
Species rich meadow ◌ ◌ ● ● ●
Lowland mixed deciduous woodland ● ● ● ● ●
Offset site 2 Lowland mixed Deciduous woodland ● ● ◌ ◌ ●
Offset site 3 Young, deciduous woodland ● ● ◌ ● ●
● Significant ES, by habitat Available in account
◌ Possible, but not significant ES, by habitat Partly available in account
− No ES, by given habitat Not available in accounts
? Unknown
Scope of natural capital account
Offset site 1
Sites - Landcover
Ecosystem service (/renewable/non-renewable resource)
Scope of financial account
Offset site 1

BNG in CNCA Technical Report
Forest Trends and eftec 52 June 2017
Like before, the following accounts report the state before (the baseline, in 2016) and after the offset activities (in 2017) on the offset sites. Offset sites’ Asset Register The information from the above steps is then used to develop a summary of the offset sites in the asset register. Table 7.28 below summarises the key forms of land cover at these sites, both before and after the offset activities. It is taken as given that after the offset activities’ stage, the land cover will not change. Table 7.28: Excerpt from offset sites’ asset register
Broad habitat type Total area (hectares)
Baseline (2016) (Following) Offset activities
(2017)
Woodland 2.2 2.6 ()
Grassland 3.0 2.6 ()
Total area 5.2 5.2
Note: Arrows (in brackets) indicate the change, relative to the previous column. Offset sites’ physical flow accounts The physical flow accounts use the information from the asset register and the biodiversity accounts to estimate the physical flow of the ecosystem services. Table 7.29 provides a summary of the annual tonnes of pollutants reduced due to the offset sites: before the offset activities (baseline) and after the offset activities. Similarly, Table 7.30 provides a summary of the annual carbon sequestered at the offset sites. Overall, there is a gain in the ecosystem services flows due to the offset activities from the improvements in the habitat, and particularly from the planting of woodland. Table 7.29: Summary of the air quality physical flow account, offset sites
Pollutant Baseline (tonnes/year) (Following) Offset activities
(tonnes/year)
Carbon Monoxide 0.003 0.003 ()
Sulphur Dioxide 0.01 0.01 ()
Nitrogen Dioxide 0.06 0.07 ()
PM10 particulates 0.09 0.10 ()
PM2.5 particulates 0.0002 0.0003 ()
Ozone 0.12 0.14 ()
Note: Arrows (in brackets) indicate the change, relative to the previous column. Table 7.30: Summary of the climate regulation physical flow account, offset sites
Baseline (tonnes/year) (Following) Offset activities
(tonnes/year)
Carbon sequestration (CO₂) 33.1 37.6 ()
Note: Arrows (in brackets) indicate the change, relative to the previous column. Offset sites’ monetary flow accounts The monetary flow accounts for air quality regulation (Table 7.31) and climate regulation (Table 7.32) reflects the gains in the physical flow accounts.
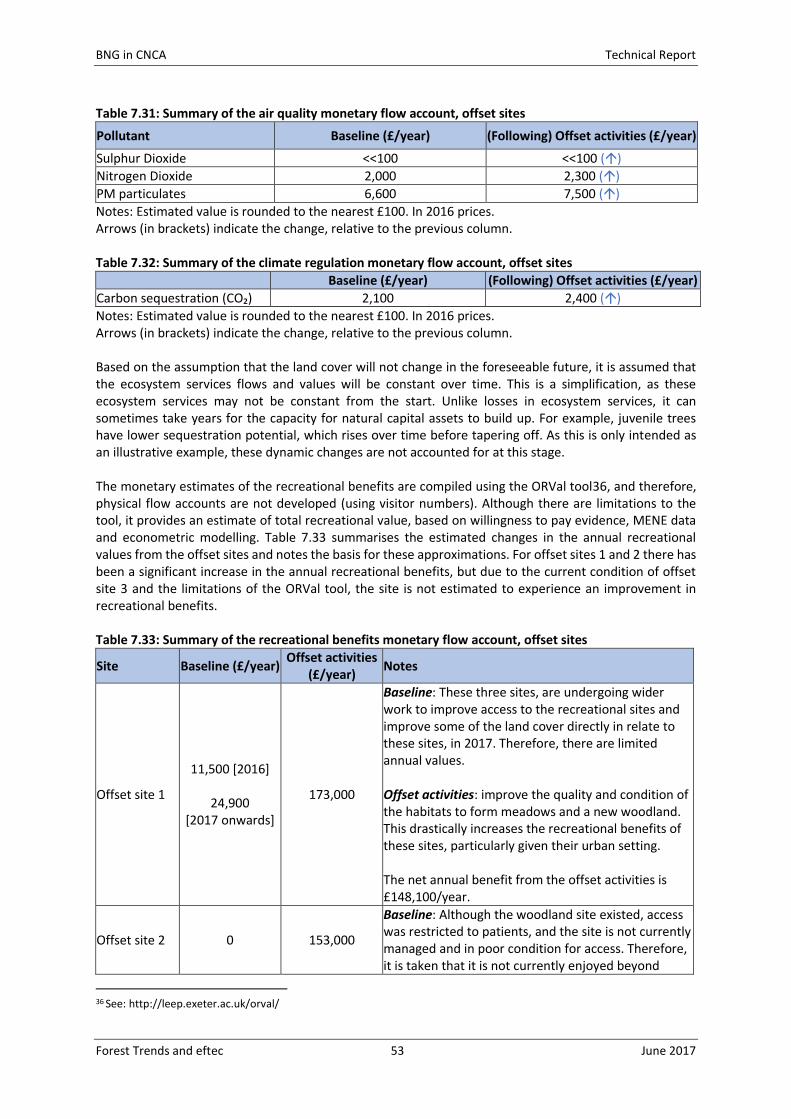
BNG in CNCA Technical Report
Forest Trends and eftec 53 June 2017
Table 7.31: Summary of the air quality monetary flow account, offset sites
Pollutant Baseline (£/year) (Following) Offset activities (£/year)
Sulphur Dioxide <<100 <<100 ()
Nitrogen Dioxide 2,000 2,300 ()
PM particulates 6,600 7,500 ()
Notes: Estimated value is rounded to the nearest £100. In 2016 prices. Arrows (in brackets) indicate the change, relative to the previous column. Table 7.32: Summary of the climate regulation monetary flow account, offset sites
Baseline (£/year) (Following) Offset activities (£/year)
Carbon sequestration (CO₂) 2,100 2,400 ()
Notes: Estimated value is rounded to the nearest £100. In 2016 prices. Arrows (in brackets) indicate the change, relative to the previous column. Based on the assumption that the land cover will not change in the foreseeable future, it is assumed that the ecosystem services flows and values will be constant over time. This is a simplification, as these ecosystem services may not be constant from the start. Unlike losses in ecosystem services, it can sometimes take years for the capacity for natural capital assets to build up. For example, juvenile trees have lower sequestration potential, which rises over time before tapering off. As this is only intended as an illustrative example, these dynamic changes are not accounted for at this stage. The monetary estimates of the recreational benefits are compiled using the ORVal tool36, and therefore, physical flow accounts are not developed (using visitor numbers). Although there are limitations to the tool, it provides an estimate of total recreational value, based on willingness to pay evidence, MENE data and econometric modelling. Table 7.33 summarises the estimated changes in the annual recreational values from the offset sites and notes the basis for these approximations. For offset sites 1 and 2 there has been a significant increase in the annual recreational benefits, but due to the current condition of offset site 3 and the limitations of the ORVal tool, the site is not estimated to experience an improvement in recreational benefits. Table 7.33: Summary of the recreational benefits monetary flow account, offset sites
Site Baseline (£/year) Offset activities
(£/year) Notes
Offset site 1
11,500 [2016]
24,900 [2017 onwards]
173,000
Baseline: These three sites, are undergoing wider work to improve access to the recreational sites and improve some of the land cover directly in relate to these sites, in 2017. Therefore, there are limited annual values. Offset activities: improve the quality and condition of the habitats to form meadows and a new woodland. This drastically increases the recreational benefits of these sites, particularly given their urban setting. The net annual benefit from the offset activities is £148,100/year.
Offset site 2 0 153,000
Baseline: Although the woodland site existed, access was restricted to patients, and the site is not currently managed and in poor condition for access. Therefore, it is taken that it is not currently enjoyed beyond
36 See: http://leep.exeter.ac.uk/orval/

BNG in CNCA Technical Report
Forest Trends and eftec 54 June 2017
providing a view of natural vegetation in the wider care home grounds – which are not valued here. Therefore, no recreational value is estimated. Offset activities: are intended to clean up this woodland space and make it safe and enjoyable to access for the patients. Although this is a significant increase in value, the associated visitor numbers would imply that patients staying at the care home and one accompanying attendant/family member visit approximately once a week to achieve these values. Further visits would be made by out-patients. The values are therefore considered reasonable. The net annual benefit from the offset activities is £153,000/year.
Offset site 3 174,500 174,500
Baseline: This site is already a well-used, accessible urban green space. Offset activities: target specific activities around the management of the woodland. However, given the available tools’ lack of sensitivity to such small changes in habitat, it is not possible to estimate any noticeable change in the recreational value. The net annual benefit from the offset activities is £0/year.
Note: Only a part of the net annual benefits over the time horizon are attributable to the project site holder’s investment, while the rest is attributed to the offset provider. Aggregating the three benefits (/ecosystem services) over the accounting period results in present value of baseline natural capital assets at £6.6m, as set out in Table 7.34. The analysis also indicates that there is a significant improvement in the ecosystem services, particularly driven by additional recreational benefits, due to the offset activities and the continued management of these sites beyond the initial five years. Therefore, there is an increase in the asset value of these services. In the CNCA framework, this is measured as a cumulative gains of £9.4m. Table 7.34: Cumulative gains in natural capital asset (external) (present value)
Ecosystem service Baseline
(£m) Cumulative gain
(£m)
Air quality regulation 0.3 0.04 ()
Climate regulation 0.2 0.03 ()
Recreational benefits 6.2 9.4()
Total value in natural capital asset value 6.6 9.4 ()
Notes: Estimated value is rounded to the nearest £0.1m/1 significant figure, therefore there may be some slight differences in rounding. In 2016 prices. They are all classified as ‘external’ , as society is still the ultimate beneficiary of all three of these services.
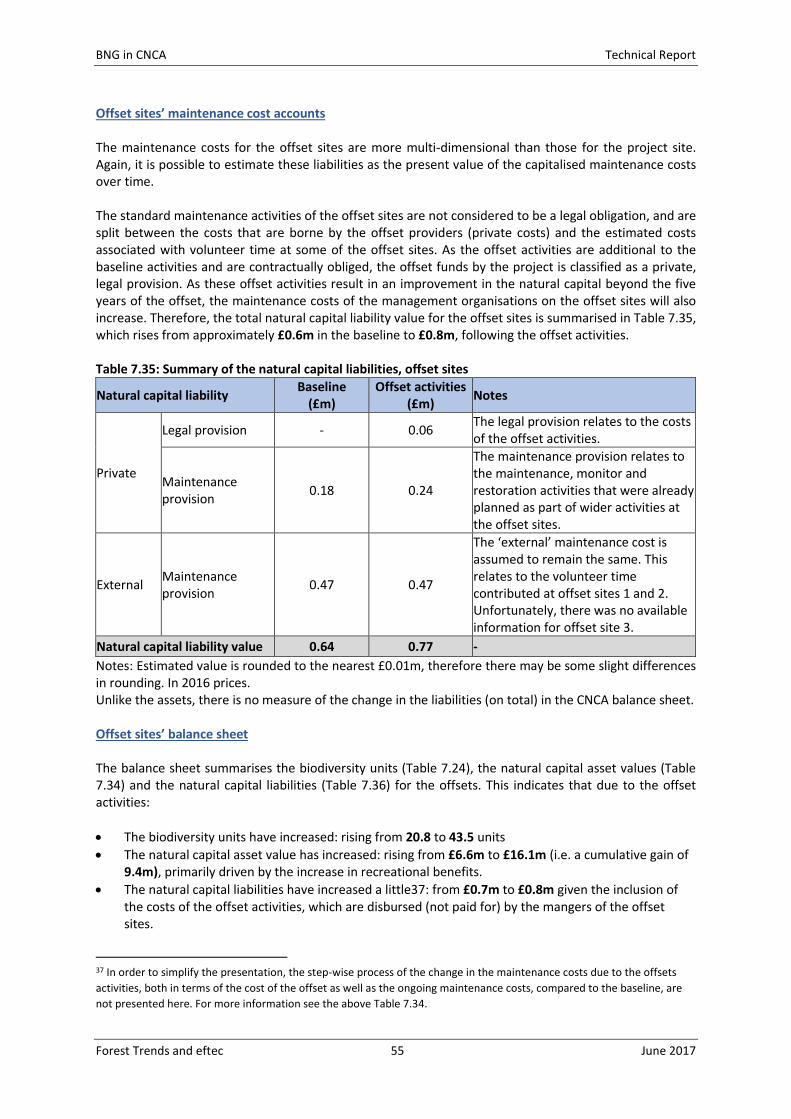
BNG in CNCA Technical Report
Forest Trends and eftec 55 June 2017
Offset sites’ maintenance cost accounts The maintenance costs for the offset sites are more multi-dimensional than those for the project site. Again, it is possible to estimate these liabilities as the present value of the capitalised maintenance costs over time. The standard maintenance activities of the offset sites are not considered to be a legal obligation, and are split between the costs that are borne by the offset providers (private costs) and the estimated costs associated with volunteer time at some of the offset sites. As the offset activities are additional to the baseline activities and are contractually obliged, the offset funds by the project is classified as a private, legal provision. As these offset activities result in an improvement in the natural capital beyond the five years of the offset, the maintenance costs of the management organisations on the offset sites will also increase. Therefore, the total natural capital liability value for the offset sites is summarised in Table 7.35, which rises from approximately £0.6m in the baseline to £0.8m, following the offset activities. Table 7.35: Summary of the natural capital liabilities, offset sites
Natural capital liability Baseline
(£m) Offset activities
(£m) Notes
Private
Legal provision - 0.06 The legal provision relates to the costs of the offset activities.
Maintenance provision
0.18 0.24
The maintenance provision relates to the maintenance, monitor and restoration activities that were already planned as part of wider activities at the offset sites.
External Maintenance provision
0.47 0.47
The ‘external’ maintenance cost is assumed to remain the same. This relates to the volunteer time contributed at offset sites 1 and 2. Unfortunately, there was no available information for offset site 3.
Natural capital liability value 0.64 0.77 -
Notes: Estimated value is rounded to the nearest £0.01m, therefore there may be some slight differences in rounding. In 2016 prices. Unlike the assets, there is no measure of the change in the liabilities (on total) in the CNCA balance sheet. Offset sites’ balance sheet The balance sheet summarises the biodiversity units (Table 7.24), the natural capital asset values (Table 7.34) and the natural capital liabilities (Table 7.36) for the offsets. This indicates that due to the offset activities:
The biodiversity units have increased: rising from 20.8 to 43.5 units
The natural capital asset value has increased: rising from £6.6m to £16.1m (i.e. a cumulative gain of 9.4m), primarily driven by the increase in recreational benefits.
The natural capital liabilities have increased a little37: from £0.7m to £0.8m given the inclusion of the costs of the offset activities, which are disbursed (not paid for) by the mangers of the offset sites.
37 In order to simplify the presentation, the step-wise process of the change in the maintenance costs due to the offsets
activities, both in terms of the cost of the offset as well as the ongoing maintenance costs, compared to the baseline, are
not presented here. For more information see the above Table 7.34.
BNG in CNCA Technical Report
Forest Trends and eftec 56 June 2017
In addition, the financial accounts for the offset sites could now also include the costs of the offset as a contingent liability (i.e. ~£0.06m) which needs to be spent (or amortised) over the course of the five years of the offset activities.
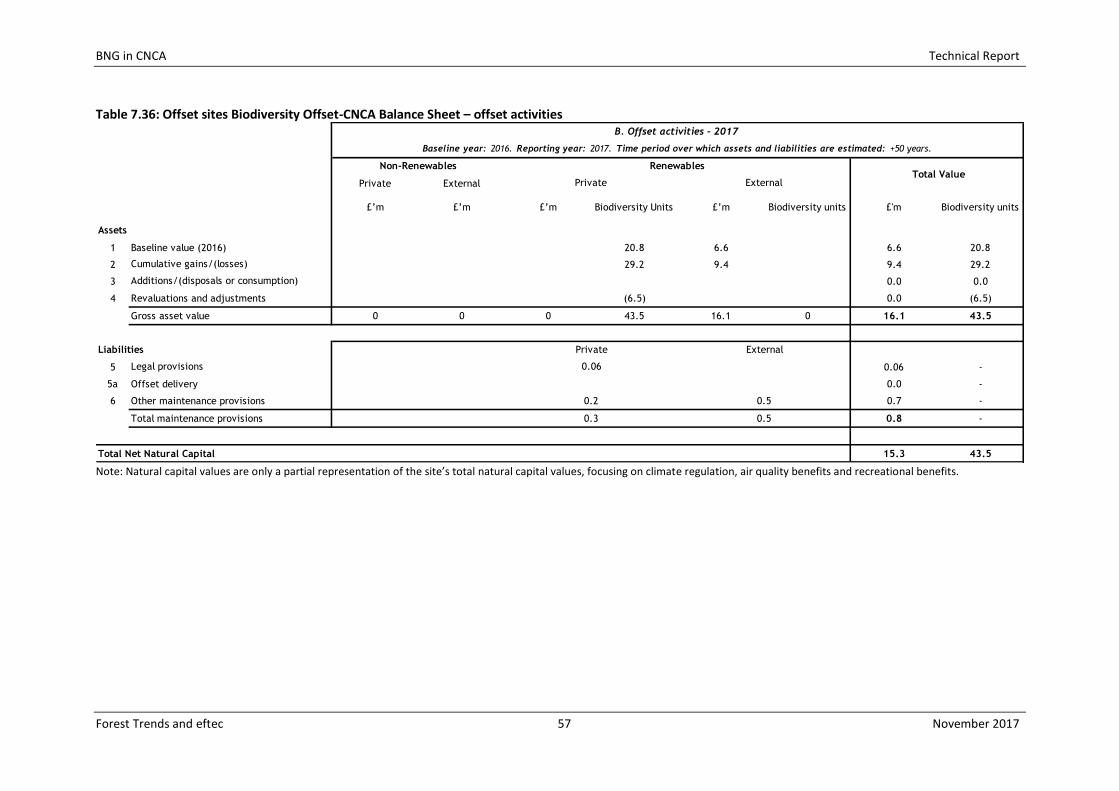
BNG in CNCA Technical Report
Forest Trends and eftec 57 November 2017
Table 7.36: Offset sites Biodiversity Offset-CNCA Balance Sheet – offset activities
Note: Natural capital values are only a partial representation of the site’s total natural capital values, focusing on climate regulation, air quality benefits and recreational benefits.
Private External
£’m £’m £’m Biodiversity Units £’m Biodiversity units £'m Biodiversity units
1 Baseline value (2016) 20.8 6.6 6.6 20.8
2 29.2 9.4 9.4 29.2
3 0.0 0.0
4 (6.5) 0.0 (6.5)
Gross asset value 0 0 0 43.5 16.1 0 16.1 43.5
5 0.06 -
5a Offset delivery 0.0 -
6 0.7 -
0.8 -
15.3 43.5
0.06
0.2
0.3 0.5
0.5
Baseline year: 2016. Reporting year: 2017. Time period over which assets and liabilities are estimated: +50 years.
Cumulative gains/(losses)
B. Offset activities - 2017
Non-Renewables Renewables Total Value
Private External
Assets
Additions/(disposals or consumption)
Revaluations and adjustments
Liabilities ExternalPrivate
Legal provisions
Other maintenance provisions
Total maintenance provisions
Total Net Natural Capital
BNG in CNCA Technical Report
Forest Trends and eftec 58 June 2017
VIII. Offset site CNCA accounts (combined) This final step links the project site balance sheet with the outcomes from the activities covered in the offset sites’ balance sheet. Given that the CNCA accounts are forward-looking, the reporting year remains at 2017, but the complete set of steps for the implementation of the offsets in the offset site accounts, as well as the offset outcomes, are integrated into the project site accounts. Step D: Develop the combined project and offset balance sheet, summing the project site and offset site balance sheets Implementation of the offsets Beginning with the offset site accounts and revisiting the biodiversity account in Table 7.25, the implementation of the offset involves the transfer of the 22.7 units of biodiversity (effectively) out of the biodiversity accounts of the offset sites. This can best be seen below in the offset sites’ offset implementation stage balance sheet, where the 22.7 biodiversity units are removed from the private column and transferred to the external column to represent the transference to the external party, i.e. the project site. The transfer also reflects the accounting for maintenance costs relating to the offset delivery. As seen in Table 7.36, this is accounted for as a private, legally obligated liability for the offset providers. However, over the scope of the 50+ years, these offsets will be disbursed and paid for by the project site organisation (the ‘external’ party). Therefore, although the natural capital liability value remains the same, the net effect on the accounts is a transfer from line [5] to a new line unique to this framework, line [5a] offset delivery, in order to reflect the forward-looking perspective of the accounts and in order to represent the source of the financing of the offsets.

BNG in CNCA Technical Report
Forest Trends and eftec 59 November 2017
Table 7.37: Offset sites Biodiversity Offset-CNCA Balance Sheet – offset implementation
Note: Natural capital values are only a partial representation of the site’s total natural capital values, focusing on climate regulation, air quality benefits and recreational benefits.
Private External
£’m £’m £’mBiodiversity
Units£’m
Biodiversity
units£'m
Biodiversity
units
1 Baseline value (2016) 20.8 6.6 6.6 20.8
2 29.2 8.0 8.0 29.2
3 (22.7) 1.4 22.7 1.4 0.0
4 (6.5) 0.0 (6.5)
Gross asset value 0 0 0 20.8 16.1 22.7 16.1 43.5
5 0.0 -
5a Offset delivery 0.06 -
6 0.7 -
0.8 -
15.3 43.5
0.2
0.2 0.5
0.5
0.06
Baseline year: 2016. Reporting year: 2017. Time period over which assets and liabilities are estimated: +50 years.
Cumulative gains/(losses)
C. Offset implementation - 2017
Non-Renewables Renewables Total Value
Private External
Assets
Additions/(disposals or consumption)
Revaluations and adjustments
Liabilities
Total Net Natural Capital
External
Legal provisions
Private
Other maintenance provisions
Total maintenance provisions
0.0
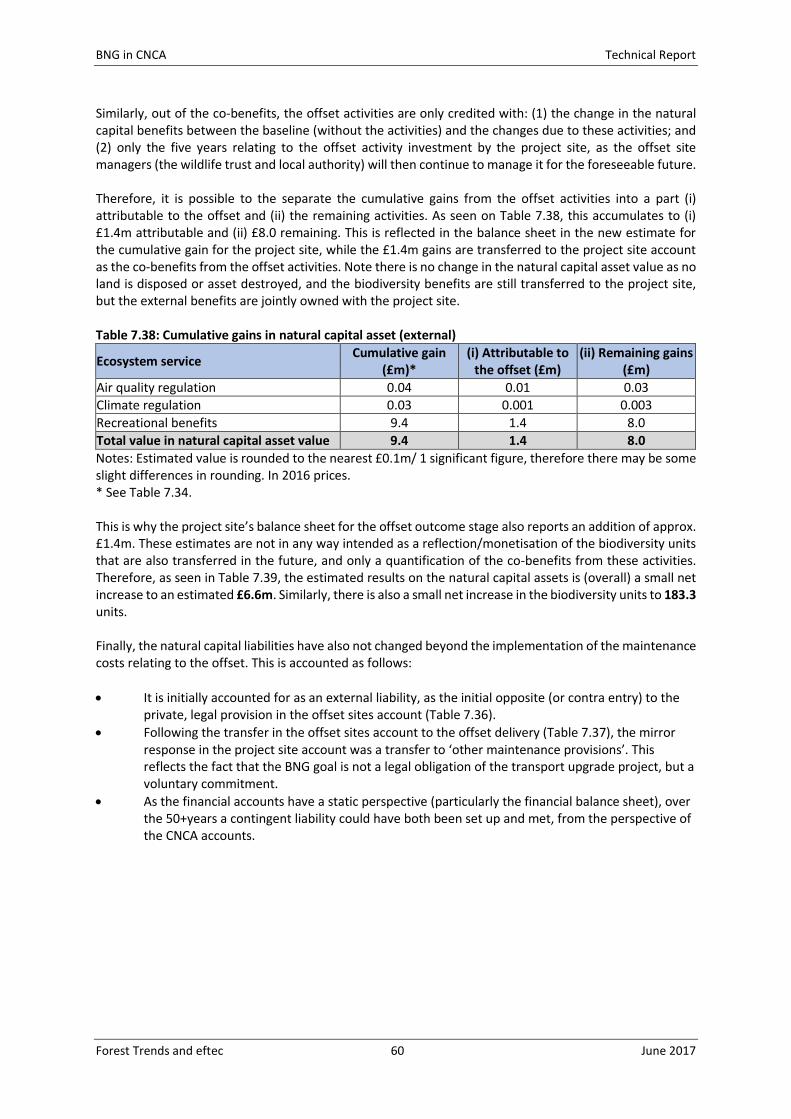
BNG in CNCA Technical Report
Forest Trends and eftec 60 June 2017
Similarly, out of the co-benefits, the offset activities are only credited with: (1) the change in the natural capital benefits between the baseline (without the activities) and the changes due to these activities; and (2) only the five years relating to the offset activity investment by the project site, as the offset site managers (the wildlife trust and local authority) will then continue to manage it for the foreseeable future. Therefore, it is possible to the separate the cumulative gains from the offset activities into a part (i) attributable to the offset and (ii) the remaining activities. As seen on Table 7.38, this accumulates to (i) £1.4m attributable and (ii) £8.0 remaining. This is reflected in the balance sheet in the new estimate for the cumulative gain for the project site, while the £1.4m gains are transferred to the project site account as the co-benefits from the offset activities. Note there is no change in the natural capital asset value as no land is disposed or asset destroyed, and the biodiversity benefits are still transferred to the project site, but the external benefits are jointly owned with the project site. Table 7.38: Cumulative gains in natural capital asset (external)
Ecosystem service Cumulative gain
(£m)* (i) Attributable to
the offset (£m) (ii) Remaining gains
(£m)
Air quality regulation 0.04 0.01 0.03
Climate regulation 0.03 0.001 0.003
Recreational benefits 9.4 1.4 8.0
Total value in natural capital asset value 9.4 1.4 8.0
Notes: Estimated value is rounded to the nearest £0.1m/ 1 significant figure, therefore there may be some slight differences in rounding. In 2016 prices. * See Table 7.34. This is why the project site’s balance sheet for the offset outcome stage also reports an addition of approx. £1.4m. These estimates are not in any way intended as a reflection/monetisation of the biodiversity units that are also transferred in the future, and only a quantification of the co-benefits from these activities. Therefore, as seen in Table 7.39, the estimated results on the natural capital assets is (overall) a small net increase to an estimated £6.6m. Similarly, there is also a small net increase in the biodiversity units to 183.3 units. Finally, the natural capital liabilities have also not changed beyond the implementation of the maintenance costs relating to the offset. This is accounted as follows:
It is initially accounted for as an external liability, as the initial opposite (or contra entry) to the private, legal provision in the offset sites account (Table 7.36).
Following the transfer in the offset sites account to the offset delivery (Table 7.37), the mirror response in the project site account was a transfer to ‘other maintenance provisions’. This reflects the fact that the BNG goal is not a legal obligation of the transport upgrade project, but a voluntary commitment.
As the financial accounts have a static perspective (particularly the financial balance sheet), over the 50+years a contingent liability could have both been set up and met, from the perspective of the CNCA accounts.
BNG in CNCA Technical Report
Forest Trends and eftec 61 November 2017
Table 7.39: Project sites Biodiversity Offset-CNCA Balance Sheet – offset implementation
Note: Natural capital values are only a partial representation of the site’s associated total natural capital values.
Private External
£’m £’m £’mBiodiversity
Units£’m
Biodiversity
units£'m
Biodiversity
units
1 Baseline value (2016) - 180.5 6.2 - 6.2 180.5
2 - (19.7) (1.1) 0 (1.1) (19.7)
3 - 22.7 1.4 - 1.4 22.7
4 - (0.2) - - 0.0 (0.2)
Gross asset value 0 0 0 183.3 6.6 0.0 6.6 183.3
5 1.3 -
5a Offset delivery 0.0 -
6 0.06 -
1.3 -
5.2 183.3
Private
III. Offset outcome
Non-Renewables Renewables Total Value
External
Assets
Cumulative gains/(losses)
Total Net Natural Capital
-
Other maintenance provisions 0.0
-
1.3
0.06
1.3
Legal provisions
-
0.0Total maintenance provisions
Additions/(disposals or consumption)
Revaluations and adjustments
Liabilities ExternalPrivate
Baseline year: 2016. Reporting year: 2017. Time period over which assets and liabilities are estimated: +50 years.
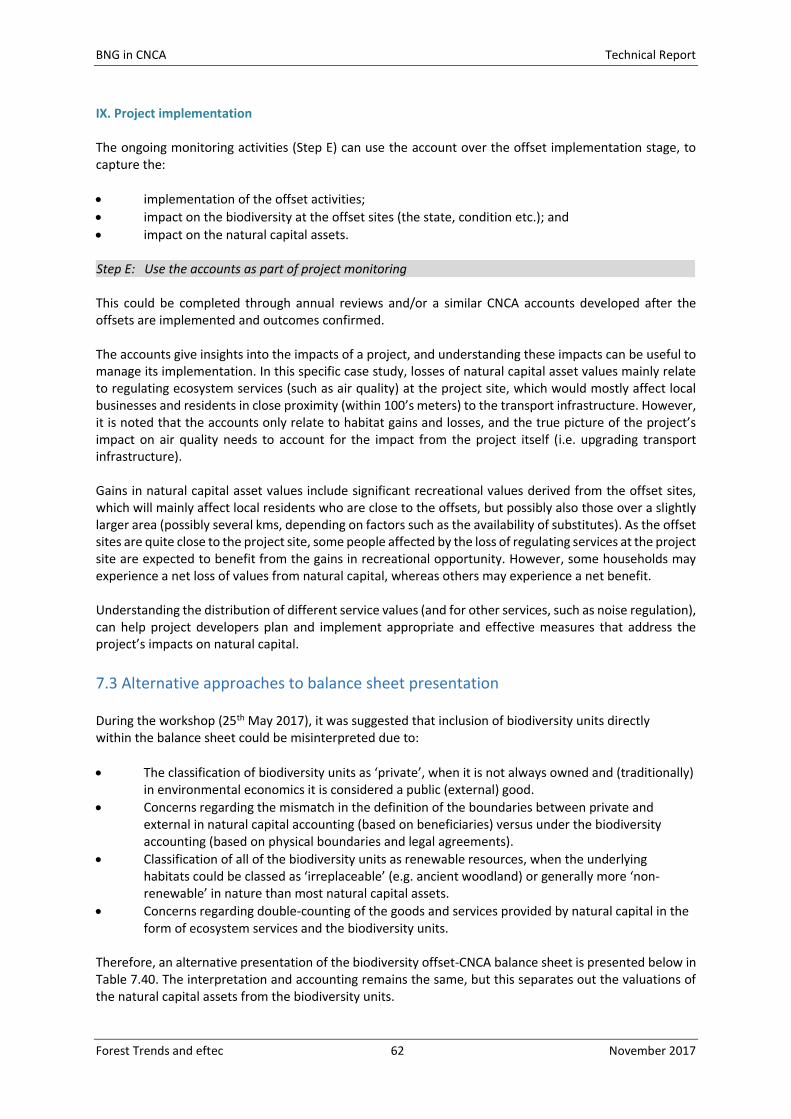
BNG in CNCA Technical Report
Forest Trends and eftec 62 November 2017
IX. Project implementation The ongoing monitoring activities (Step E) can use the account over the offset implementation stage, to capture the:
implementation of the offset activities;
impact on the biodiversity at the offset sites (the state, condition etc.); and
impact on the natural capital assets. Step E: Use the accounts as part of project monitoring This could be completed through annual reviews and/or a similar CNCA accounts developed after the offsets are implemented and outcomes confirmed. The accounts give insights into the impacts of a project, and understanding these impacts can be useful to manage its implementation. In this specific case study, losses of natural capital asset values mainly relate to regulating ecosystem services (such as air quality) at the project site, which would mostly affect local businesses and residents in close proximity (within 100’s meters) to the transport infrastructure. However, it is noted that the accounts only relate to habitat gains and losses, and the true picture of the project’s impact on air quality needs to account for the impact from the project itself (i.e. upgrading transport infrastructure). Gains in natural capital asset values include significant recreational values derived from the offset sites, which will mainly affect local residents who are close to the offsets, but possibly also those over a slightly larger area (possibly several kms, depending on factors such as the availability of substitutes). As the offset sites are quite close to the project site, some people affected by the loss of regulating services at the project site are expected to benefit from the gains in recreational opportunity. However, some households may experience a net loss of values from natural capital, whereas others may experience a net benefit. Understanding the distribution of different service values (and for other services, such as noise regulation), can help project developers plan and implement appropriate and effective measures that address the project’s impacts on natural capital.
7.3 Alternative approaches to balance sheet presentation During the workshop (25th May 2017), it was suggested that inclusion of biodiversity units directly within the balance sheet could be misinterpreted due to:
The classification of biodiversity units as ‘private’, when it is not always owned and (traditionally) in environmental economics it is considered a public (external) good.
Concerns regarding the mismatch in the definition of the boundaries between private and external in natural capital accounting (based on beneficiaries) versus under the biodiversity accounting (based on physical boundaries and legal agreements).
Classification of all of the biodiversity units as renewable resources, when the underlying habitats could be classed as ‘irreplaceable’ (e.g. ancient woodland) or generally more ‘non-renewable’ in nature than most natural capital assets.
Concerns regarding double-counting of the goods and services provided by natural capital in the form of ecosystem services and the biodiversity units.
Therefore, an alternative presentation of the biodiversity offset-CNCA balance sheet is presented below in Table 7.40. The interpretation and accounting remains the same, but this separates out the valuations of the natural capital assets from the biodiversity units.
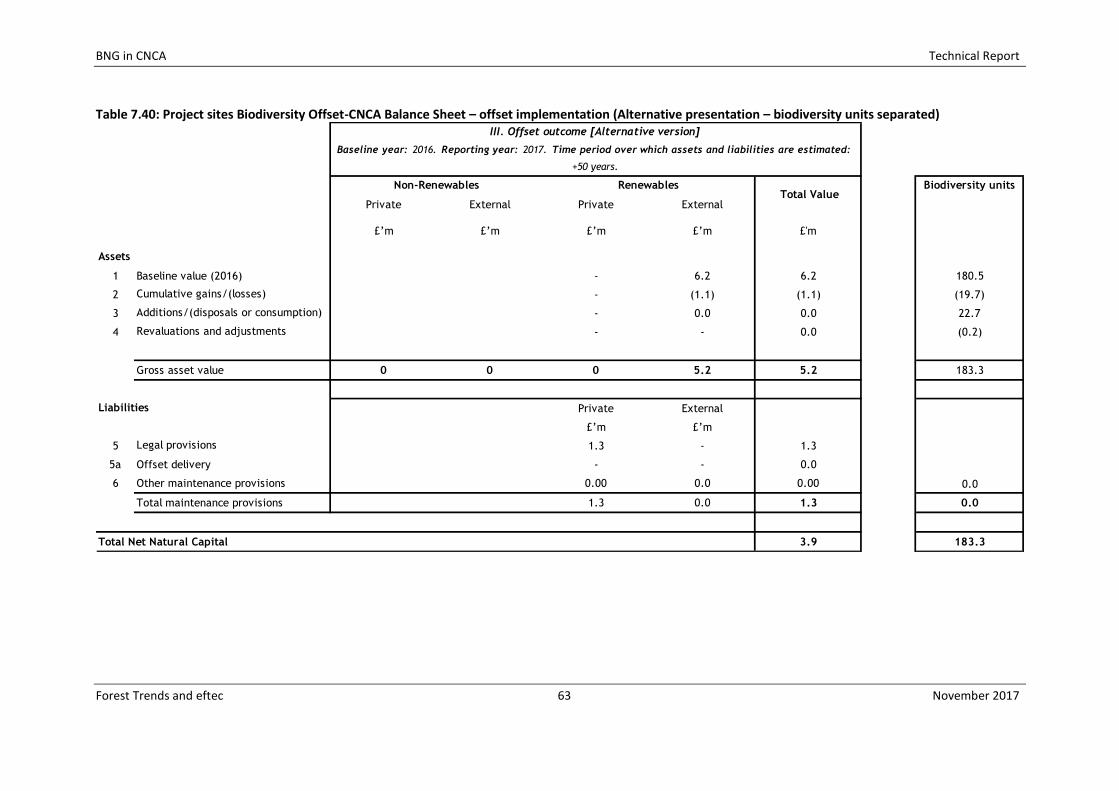
BNG in CNCA Technical Report
Forest Trends and eftec 63 November 2017
Table 7.40: Project sites Biodiversity Offset-CNCA Balance Sheet – offset implementation (Alternative presentation – biodiversity units separated)
Private External Private External
£’m £’m £’m £’m £'m
1 Baseline value (2016) - 6.2 6.2 180.5
2 - (1.1) (1.1) (19.7)
3 - 0.0 0.0 22.7
4 - - 0.0 (0.2)
Gross asset value 0 0 0 5.2 5.2 183.3
Private External
£’m £’m
5 1.3 - 1.3
5a Offset delivery - - 0.0
6 0.00 0.0 0.00 0.0
1.3 0.0 1.3 0.0
3.9 183.3
Biodiversity units
Total maintenance provisions
Total Net Natural Capital
Other maintenance provisions
Legal provisions
Additions/(disposals or consumption)
Revaluations and adjustments
Liabilities
Assets
Cumulative gains/(losses)
III. Offset outcome [Alternative version]
Baseline year: 2016. Reporting year: 2017. Time period over which assets and liabilities are estimated:
+50 years.
Non-Renewables Renewables Total Value
BNG in CNCA Technical Report
Forest Trends and eftec 64 November 2017
7.4 Conclusions This paper developed a method to combine BNG of biodiversity (through mitigation measures and including a biodiversity offset) with the natural capital accounting structure of a CNCA: the joint BNG-CNCA framework. The case study in Section 7 provides proof of concept for the method developed in the preceding Sections. In the case study, the accounts for the project site and offset sites are brought together to give a balance sheet. This balance sheet demonstrates a small net gain in biodiversity units and values of natural capital assets. Analysing changes in natural capital asset values relating to the losses and gains in habitat offers insights into the distribution of costs and benefits from the project and offset activities and outcomes. This can be useful to manage a project’s impacts. In general, it is important to note, this framework could also be used to account for projects targeted at biodiversity conservation investment. In the case study, while society experiences a net gain in values from natural capital, some households may experience a net loss, whereas others may experience a net benefit. Understanding this distribution of different service values can help project developers plan and implement appropriate and effective measures that address the project’s impacts on natural capital. The integration of natural capital analysis with BNG approaches could support different uses of the results, including:
Internal reporting on project-specific analysis and decision-making;
Internal reporting on multiple sites and/or at an organisational level; and
External reporting to regulators and/or other stakeholders. The level of detail and presentational form of the accounts and balance sheet might differ according to the target audience of this analysis. For example, for internal use, integrated decision making combining natural capital analysis and biodiversity analysis will likely be key; while a more segmented approach could be required for external stakeholders. This also raises the issue of the need for standardisation of reporting, but given that this work is experimental and aims to start development of appropriate approaches for analysis38, this may be some time away. Further challenges to address in developing this work include to:
Test the method on a wider range of examples/ case studies in different organisational, project, governance and environment contexts;
Understand and give guidance on accounting for the possible trade-offs between natural capital and the biodiversity units as well as the integration into supply chain thinking;
More explicitly integrate the other steps in the impact mitigation hierarchy (avoid, minimise, restore – prior to offsetting), into the accounting process;
Explore the use of different baselines / counterfactual scenarios (against which biodiversity losses and gains are evaluated) in the accounting;
Extend the accounts by valuing a wider number of goods and services. At present the case study gives only a partial estimate of the natural capital value, so presents just a rough guide for decision-makers. With more resources, further services could be valued, but there are always likely to be some impacts that are not fully valued; and
Integration of the gains in natural capital arising because of the biodiversity management with other broader environmental impacts the project (e.g. emissions from transport) to assess the project’s broader impacts on natural capital.
38 Note: a similar focus could be made on soil or other biophysical metrics that are of concern.
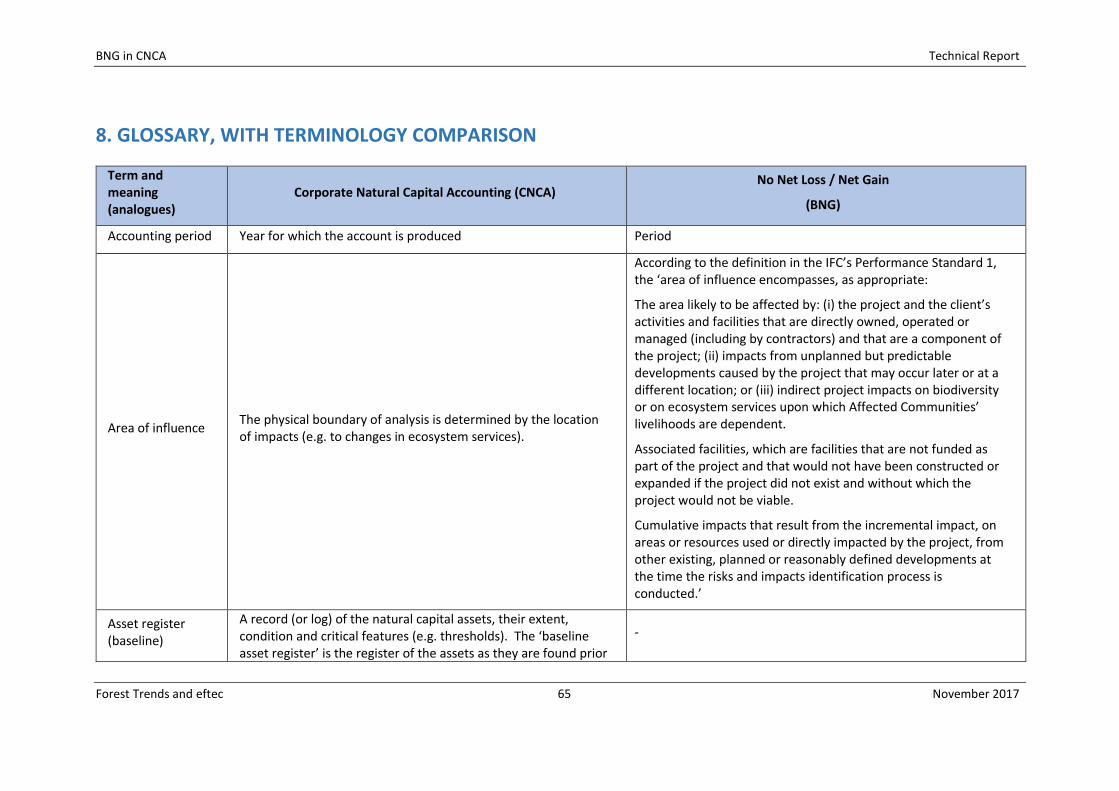
BNG in CNCA Technical Report
Forest Trends and eftec 65 November 2017
8. GLOSSARY, WITH TERMINOLOGY COMPARISON
Term and meaning (analogues)
Corporate Natural Capital Accounting (CNCA) No Net Loss / Net Gain
(BNG)
Accounting period Year for which the account is produced Period
Area of influence The physical boundary of analysis is determined by the location of impacts (e.g. to changes in ecosystem services).
According to the definition in the IFC’s Performance Standard 1, the ‘area of influence encompasses, as appropriate:
The area likely to be affected by: (i) the project and the client’s activities and facilities that are directly owned, operated or managed (including by contractors) and that are a component of the project; (ii) impacts from unplanned but predictable developments caused by the project that may occur later or at a different location; or (iii) indirect project impacts on biodiversity or on ecosystem services upon which Affected Communities’ livelihoods are dependent.
Associated facilities, which are facilities that are not funded as part of the project and that would not have been constructed or expanded if the project did not exist and without which the project would not be viable.
Cumulative impacts that result from the incremental impact, on areas or resources used or directly impacted by the project, from other existing, planned or reasonably defined developments at the time the risks and impacts identification process is conducted.’
Asset register (baseline)
A record (or log) of the natural capital assets, their extent, condition and critical features (e.g. thresholds). The ‘baseline asset register’ is the register of the assets as they are found prior
-
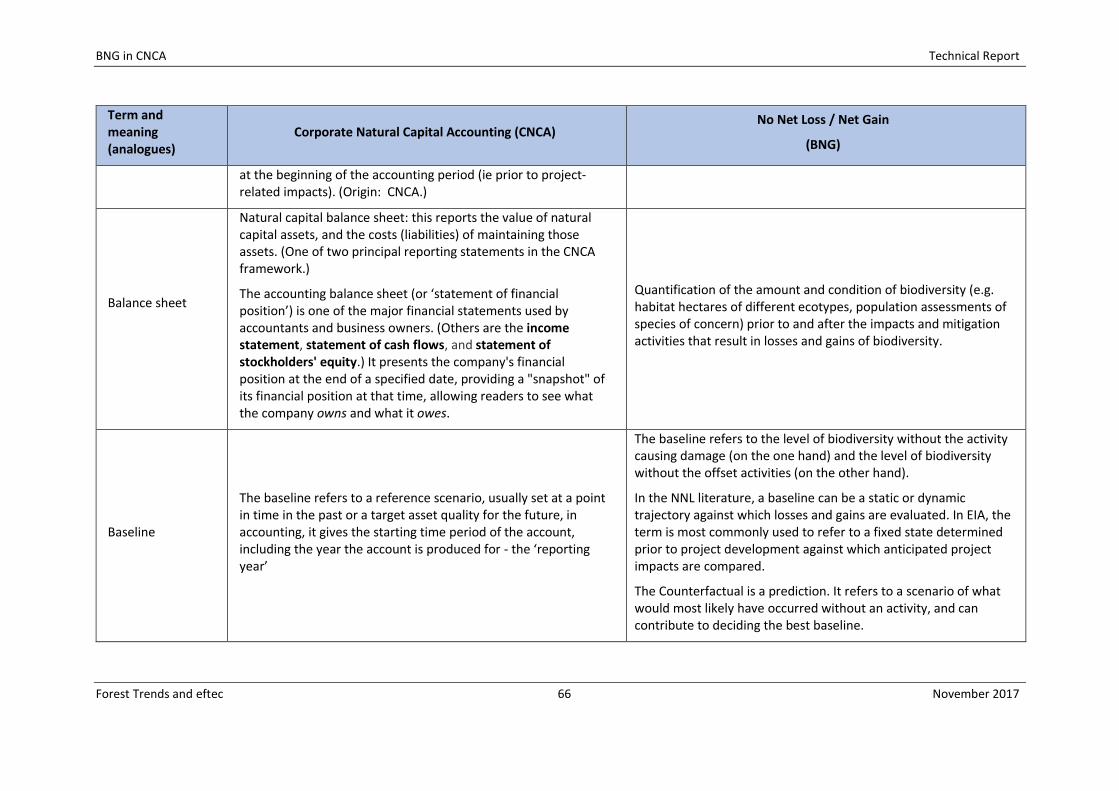
BNG in CNCA Technical Report
Forest Trends and eftec 66 November 2017
Term and meaning (analogues)
Corporate Natural Capital Accounting (CNCA) No Net Loss / Net Gain
(BNG)
at the beginning of the accounting period (ie prior to project-related impacts). (Origin: CNCA.)
Balance sheet
Natural capital balance sheet: this reports the value of natural capital assets, and the costs (liabilities) of maintaining those assets. (One of two principal reporting statements in the CNCA framework.)
The accounting balance sheet (or ‘statement of financial position’) is one of the major financial statements used by accountants and business owners. (Others are the income statement, statement of cash flows, and statement of stockholders' equity.) It presents the company's financial position at the end of a specified date, providing a "snapshot" of its financial position at that time, allowing readers to see what the company owns and what it owes.
Quantification of the amount and condition of biodiversity (e.g. habitat hectares of different ecotypes, population assessments of species of concern) prior to and after the impacts and mitigation activities that result in losses and gains of biodiversity.
Baseline
The baseline refers to a reference scenario, usually set at a point in time in the past or a target asset quality for the future, in accounting, it gives the starting time period of the account, including the year the account is produced for - the ‘reporting year’
The baseline refers to the level of biodiversity without the activity causing damage (on the one hand) and the level of biodiversity without the offset activities (on the other hand).
In the NNL literature, a baseline can be a static or dynamic trajectory against which losses and gains are evaluated. In EIA, the term is most commonly used to refer to a fixed state determined prior to project development against which anticipated project impacts are compared.
The Counterfactual is a prediction. It refers to a scenario of what would most likely have occurred without an activity, and can contribute to deciding the best baseline.
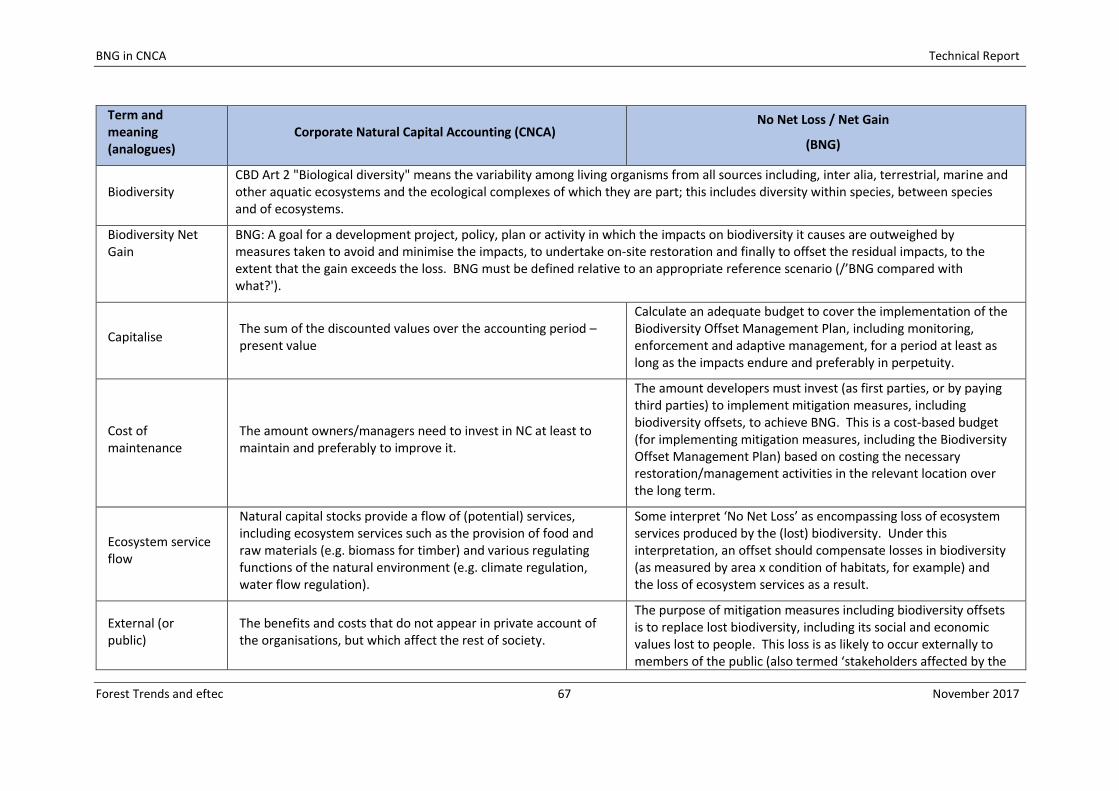
BNG in CNCA Technical Report
Forest Trends and eftec 67 November 2017
Term and meaning (analogues)
Corporate Natural Capital Accounting (CNCA) No Net Loss / Net Gain
(BNG)
Biodiversity CBD Art 2 "Biological diversity" means the variability among living organisms from all sources including, inter alia, terrestrial, marine and other aquatic ecosystems and the ecological complexes of which they are part; this includes diversity within species, between species and of ecosystems.
Biodiversity Net Gain
BNG: A goal for a development project, policy, plan or activity in which the impacts on biodiversity it causes are outweighed by measures taken to avoid and minimise the impacts, to undertake on-site restoration and finally to offset the residual impacts, to the extent that the gain exceeds the loss. BNG must be defined relative to an appropriate reference scenario (/’BNG compared with what?').
Capitalise The sum of the discounted values over the accounting period – present value
Calculate an adequate budget to cover the implementation of the Biodiversity Offset Management Plan, including monitoring, enforcement and adaptive management, for a period at least as long as the impacts endure and preferably in perpetuity.
Cost of maintenance
The amount owners/managers need to invest in NC at least to maintain and preferably to improve it.
The amount developers must invest (as first parties, or by paying third parties) to implement mitigation measures, including biodiversity offsets, to achieve BNG. This is a cost-based budget (for implementing mitigation measures, including the Biodiversity Offset Management Plan) based on costing the necessary restoration/management activities in the relevant location over the long term.
Ecosystem service flow
Natural capital stocks provide a flow of (potential) services, including ecosystem services such as the provision of food and raw materials (e.g. biomass for timber) and various regulating functions of the natural environment (e.g. climate regulation, water flow regulation).
Some interpret ‘No Net Loss’ as encompassing loss of ecosystem services produced by the (lost) biodiversity. Under this interpretation, an offset should compensate losses in biodiversity (as measured by area x condition of habitats, for example) and the loss of ecosystem services as a result.
External (or public)
The benefits and costs that do not appear in private account of the organisations, but which affect the rest of society.
The purpose of mitigation measures including biodiversity offsets is to replace lost biodiversity, including its social and economic values lost to people. This loss is as likely to occur externally to members of the public (also termed ‘stakeholders affected by the
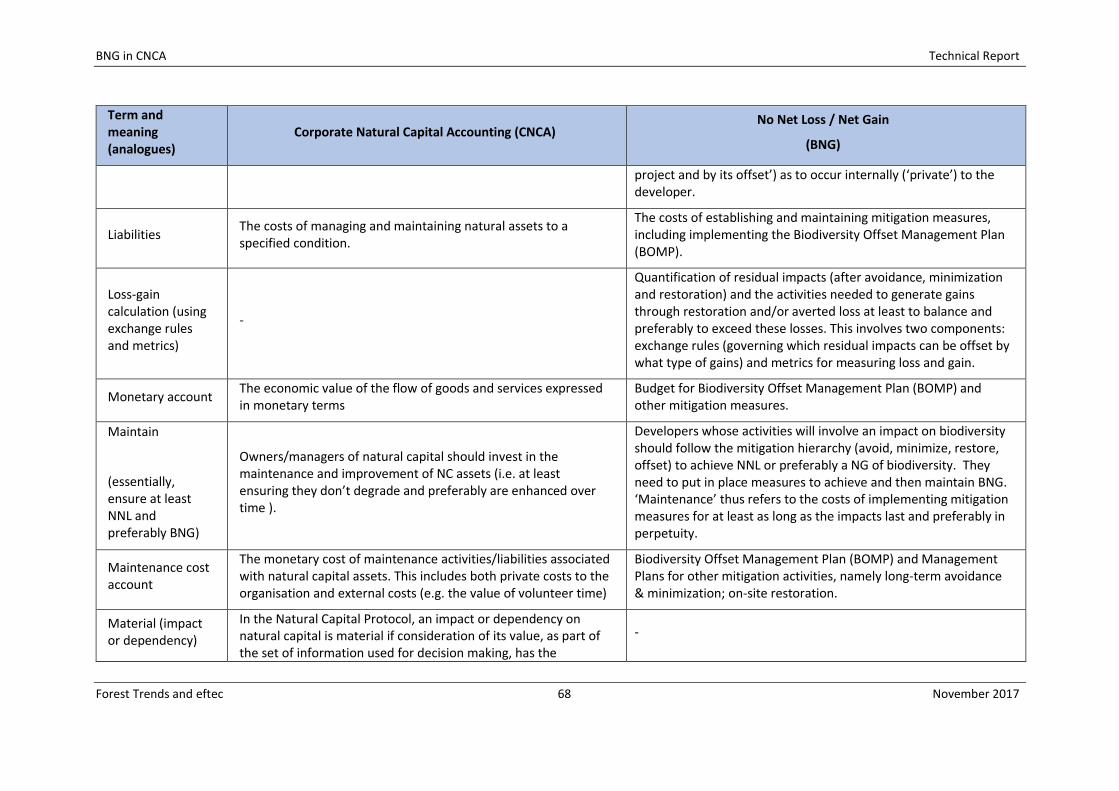
BNG in CNCA Technical Report
Forest Trends and eftec 68 November 2017
Term and meaning (analogues)
Corporate Natural Capital Accounting (CNCA) No Net Loss / Net Gain
(BNG)
project and by its offset’) as to occur internally (‘private’) to the developer.
Liabilities The costs of managing and maintaining natural assets to a specified condition.
The costs of establishing and maintaining mitigation measures, including implementing the Biodiversity Offset Management Plan (BOMP).
Loss-gain calculation (using exchange rules and metrics)
-
Quantification of residual impacts (after avoidance, minimization and restoration) and the activities needed to generate gains through restoration and/or averted loss at least to balance and preferably to exceed these losses. This involves two components: exchange rules (governing which residual impacts can be offset by what type of gains) and metrics for measuring loss and gain.
Monetary account The economic value of the flow of goods and services expressed in monetary terms
Budget for Biodiversity Offset Management Plan (BOMP) and other mitigation measures.
Maintain
(essentially, ensure at least NNL and preferably BNG)
Owners/managers of natural capital should invest in the maintenance and improvement of NC assets (i.e. at least ensuring they don’t degrade and preferably are enhanced over time ).
Developers whose activities will involve an impact on biodiversity should follow the mitigation hierarchy (avoid, minimize, restore, offset) to achieve NNL or preferably a NG of biodiversity. They need to put in place measures to achieve and then maintain BNG. ‘Maintenance’ thus refers to the costs of implementing mitigation measures for at least as long as the impacts last and preferably in perpetuity.
Maintenance cost account
The monetary cost of maintenance activities/liabilities associated with natural capital assets. This includes both private costs to the organisation and external costs (e.g. the value of volunteer time)
Biodiversity Offset Management Plan (BOMP) and Management Plans for other mitigation activities, namely long-term avoidance & minimization; on-site restoration.
Material (impact or dependency)
In the Natural Capital Protocol, an impact or dependency on natural capital is material if consideration of its value, as part of the set of information used for decision making, has the
-
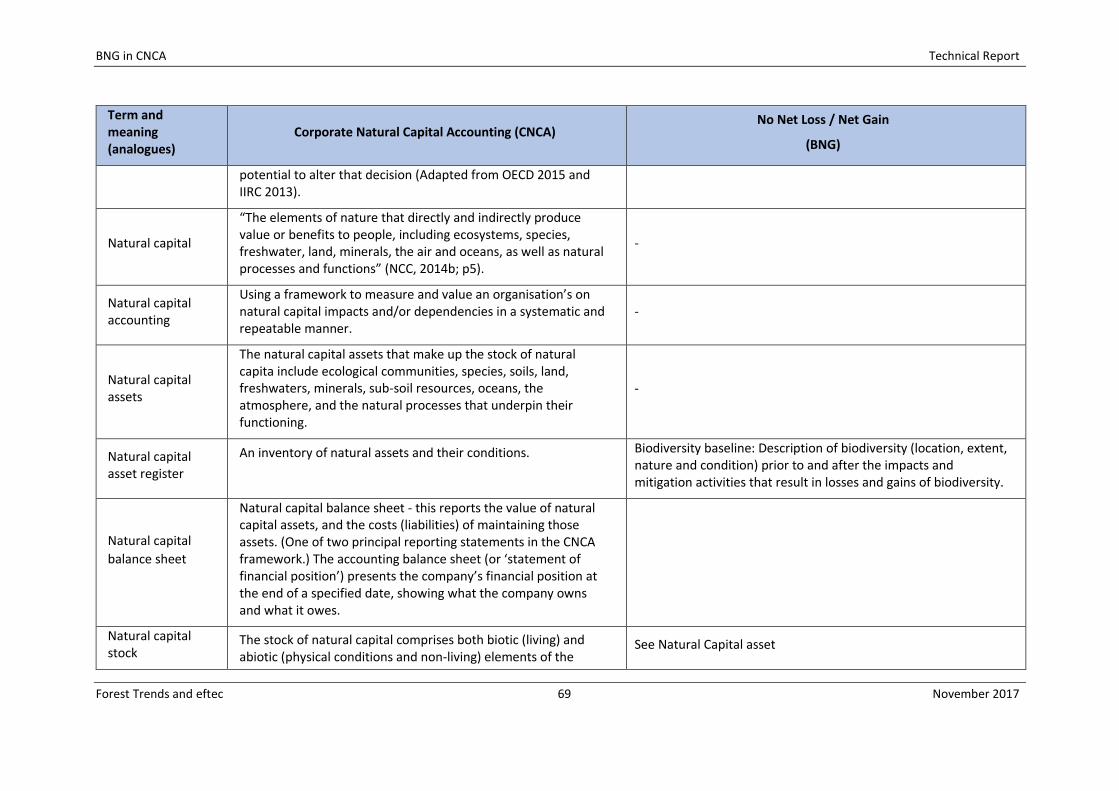
BNG in CNCA Technical Report
Forest Trends and eftec 69 November 2017
Term and meaning (analogues)
Corporate Natural Capital Accounting (CNCA) No Net Loss / Net Gain
(BNG)
potential to alter that decision (Adapted from OECD 2015 and IIRC 2013).
Natural capital
“The elements of nature that directly and indirectly produce value or benefits to people, including ecosystems, species, freshwater, land, minerals, the air and oceans, as well as natural processes and functions” (NCC, 2014b; p5).
-
Natural capital accounting
Using a framework to measure and value an organisation’s on natural capital impacts and/or dependencies in a systematic and repeatable manner.
-
Natural capital assets
The natural capital assets that make up the stock of natural capita include ecological communities, species, soils, land, freshwaters, minerals, sub-soil resources, oceans, the atmosphere, and the natural processes that underpin their functioning.
-
Natural capital asset register
An inventory of natural assets and their conditions.
Biodiversity baseline: Description of biodiversity (location, extent, nature and condition) prior to and after the impacts and mitigation activities that result in losses and gains of biodiversity.
Natural capital
balance sheet
Natural capital balance sheet - this reports the value of natural capital assets, and the costs (liabilities) of maintaining those assets. (One of two principal reporting statements in the CNCA framework.) The accounting balance sheet (or ‘statement of financial position’) presents the company’s financial position at the end of a specified date, showing what the company owns and what it owes.
Natural capital stock
The stock of natural capital comprises both biotic (living) and abiotic (physical conditions and non-living) elements of the
See Natural Capital asset
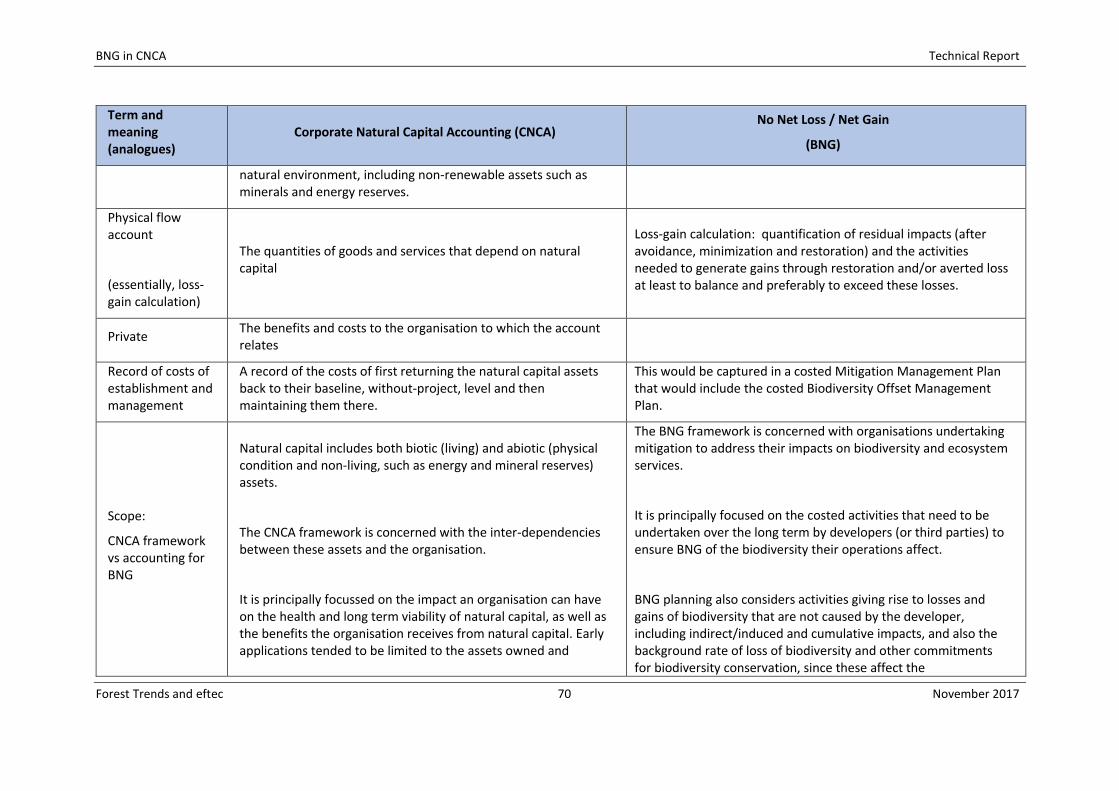
BNG in CNCA Technical Report
Forest Trends and eftec 70 November 2017
Term and meaning (analogues)
Corporate Natural Capital Accounting (CNCA) No Net Loss / Net Gain
(BNG)
natural environment, including non-renewable assets such as minerals and energy reserves.
Physical flow account
(essentially, loss-gain calculation)
The quantities of goods and services that depend on natural capital
Loss-gain calculation: quantification of residual impacts (after avoidance, minimization and restoration) and the activities needed to generate gains through restoration and/or averted loss at least to balance and preferably to exceed these losses.
Private The benefits and costs to the organisation to which the account relates
Record of costs of establishment and management
A record of the costs of first returning the natural capital assets back to their baseline, without-project, level and then maintaining them there.
This would be captured in a costed Mitigation Management Plan that would include the costed Biodiversity Offset Management Plan.
Scope:
CNCA framework vs accounting for BNG
Natural capital includes both biotic (living) and abiotic (physical condition and non-living, such as energy and mineral reserves) assets.
The CNCA framework is concerned with the inter-dependencies between these assets and the organisation.
It is principally focussed on the impact an organisation can have on the health and long term viability of natural capital, as well as the benefits the organisation receives from natural capital. Early applications tended to be limited to the assets owned and
The BNG framework is concerned with organisations undertaking mitigation to address their impacts on biodiversity and ecosystem services.
It is principally focused on the costed activities that need to be undertaken over the long term by developers (or third parties) to ensure BNG of the biodiversity their operations affect.
BNG planning also considers activities giving rise to losses and gains of biodiversity that are not caused by the developer, including indirect/induced and cumulative impacts, and also the background rate of loss of biodiversity and other commitments for biodiversity conservation, since these affect the
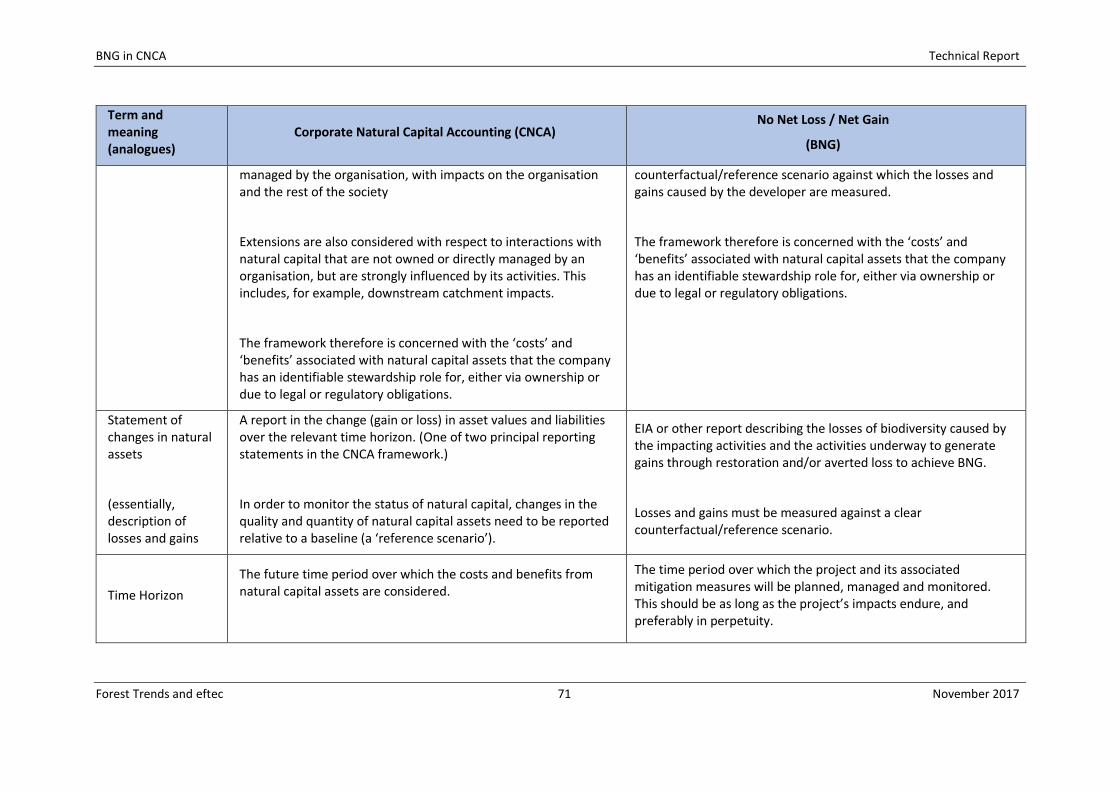
BNG in CNCA Technical Report
Forest Trends and eftec 71 November 2017
Term and meaning (analogues)
Corporate Natural Capital Accounting (CNCA) No Net Loss / Net Gain
(BNG)
managed by the organisation, with impacts on the organisation and the rest of the society
Extensions are also considered with respect to interactions with natural capital that are not owned or directly managed by an organisation, but are strongly influenced by its activities. This includes, for example, downstream catchment impacts.
The framework therefore is concerned with the ‘costs’ and ‘benefits’ associated with natural capital assets that the company has an identifiable stewardship role for, either via ownership or due to legal or regulatory obligations.
counterfactual/reference scenario against which the losses and gains caused by the developer are measured.
The framework therefore is concerned with the ‘costs’ and ‘benefits’ associated with natural capital assets that the company has an identifiable stewardship role for, either via ownership or due to legal or regulatory obligations.
Statement of changes in natural assets
(essentially, description of losses and gains
A report in the change (gain or loss) in asset values and liabilities over the relevant time horizon. (One of two principal reporting statements in the CNCA framework.)
In order to monitor the status of natural capital, changes in the quality and quantity of natural capital assets need to be reported relative to a baseline (a ‘reference scenario’).
EIA or other report describing the losses of biodiversity caused by the impacting activities and the activities underway to generate gains through restoration and/or averted loss to achieve BNG.
Losses and gains must be measured against a clear counterfactual/reference scenario.
Time Horizon
The future time period over which the costs and benefits from natural capital assets are considered.
The time period over which the project and its associated mitigation measures will be planned, managed and monitored. This should be as long as the project’s impacts endure, and preferably in perpetuity.
BNG in CNCA Technical Report
Forest Trends and eftec 72 November 2017
REFERENCES
Business and Biodiversity Offsets Programme (BBOP) (2012). Guidance Notes to the Standard on Biodiversity Offsets. Available from: http://bbop.forest-trends.org/guidelines/Standard_Guidance_Notes.pdf Business and Biodiversity Offsets Programme (BBOP) (2012). Standard on Biodiversity Offsets. Available from http://bbop.forest-trends.org/guidelines/Standard.pdf Business and Biodiversity Offsets Programme (BBOP) (2012). Resource Paper: No Net Loss and Loss-Gain Calculations in Biodiversity Offsets. Available from: http://bbop.forest-trends.org/guidelines/Resource_Paper_NNL.pdf Business and Biodiversity Offsets Programme (BBOP) (2009). Glossary with updates. BBOP, Washington, D.C. Available from http://bbop.forest-trends.org/guidelines/Updated_Glossary Business and Biodiversity Offsets Programme (BBOP) (2012). Biodiversity Offset Design Handbook-Updated. http://www.forest-trends.org/documents/files/doc_3101.pdf CDC Biodiversité (2014). La compensation écologique en France : quelles orientations pour la recherche? Defra (2012). Biodiversity Offsetting Pilots - Guidance for developers. https://www.gov.uk/government/uploads/system/uploads/attachment_data/file/69528/pb13743-bio-guide-developers.pdf Defra (2012). Biodiversity Offsetting Pilots - Technical Paper: the metric for the biodiversity offsetting pilot in England https://www.gov.uk/government/uploads/system/uploads/attachment_data/file/69531/pb13745-bio-technical-paper.pdf eftec, RSPB and PwC (2015). Developing Corporate Natural Capital Accounts. Final report for the Natural Capital Committee. And: Guidelines for the Natural Capital Committee. https://www.gov.uk/government/publications/natural-capital-committee-research-corporate-natural-capital-accounting HM Government (2011). The natural choice: securing the value of nature. [online] Available at: https://www.gov.uk/government/uploads/system/uploads/attachment_data/file/228842/8082.pdf HMT (2013). Green Book: Appraisal and Evaluation in Central Government. Natural Capital Coalition (2016). Natural Capital Protocol. [online] Available at: http://naturalcapitalcoalition.org/protocol/ ten Kate, K. and Crowe, MLA (2014). Biodiversity Offsets: Policy options for governments. An input paper for the IUCN Technical Study Group on Biodiversity Offsets. IUCN, Gland. https://portals.iucn.org/library/sites/library/files/documents/2014-028.pdf and http://www.forest-trends.org/publication_details.php?publicationID=4777 The Biodiversity Consultancy (2016). Government policies on biodiversity offsets. University of Cambridge Institute for Sustainability Leadership (CISL) (2016) Biodiversity and Ecosystem Services in Corporate Natural Capital Accounting: Synthesis report. Cambridge, UK: Cambridge Institute for Sustainability Leadership.
BNG in CNCA Technical Report
Forest Trends and eftec 73 November 2017
ANNEX 1: MITIGATION HIERARCHY INCLUDING BIODIVERSITY
OFFSETS
This annex presents a detailed outline of the steps in the mitigation hierarchy and offsets methodology. 1. Reviewing the development project’s scope and activities and b) Reviewing the landscape
context. To understand the purpose and scope of the development project and the main activities likely to take place throughout the different stages of its life cycle. Identify key decision ‘windows’ and suitable ‘entry points’ for integration of mitigation measures including biodiversity offsets and BNG considerations with project planning. Understand what is known about the broader landscape and the biodiversity it harbours, other land uses and programmes, projects and plans. Understand the development project and its impacts at various scales, and determine what are the gaps in available information. 2. Reviewing the legal framework and/or policy context for appropriate mitigation measures,
including biodiversity offsets To clarify any legal requirement to undertake an offset and understand the policy context within which a biodiversity offset would be designed and implemented. The policy context would cover a range of different government policies, financial or lending institutions’ policies, as well as internal company policies. 3. Initiating a stakeholder participation process To identify relevant stakeholders at an early stage and establish a process for their effective involvement in the design and implementation of mitigation measures and any biodiversity offset (crucial to understand and address potential costs and benefits, losses and gains from stakeholders’ perspectives.) 4. Determining the appropriate mitigation measures (avoid, minimise, restore, offset), including
whether there’s a need for a biodiversity offset to address predicted adverse residual impacts on biodiversity
To define the most appropriate avoidance, minimization and restoration measures and to confirm whether there are residual adverse effects on biodiversity remaining thereafter for which an offset is required and appropriate. To determine, based on best available information and risk assessment, whether an offset for any residual impacts would be feasible. 5. Choosing the approach and methods to quantify residual losses, predicted gains and BNG (the
loss/gain balance) To decide which exchange rules and metrics will be used to demonstrate that ‘no net loss’ will be achieved through application of the mitigation measures and the biodiversity offset and to quantify the residual loss using these metrics. This step involves various technical elements, including:
Setting an appropriate frame of reference (spatial, temporal, etc.)
Identifying and prioritizing biodiversity features for inclusion in the calculations
Defining the exchange rules (ie how similar the biodiversity conserved through the offset must be to the biodiversity lost – on a ‘like for like or better’ basis)
Deciding which metrics/currencies to use
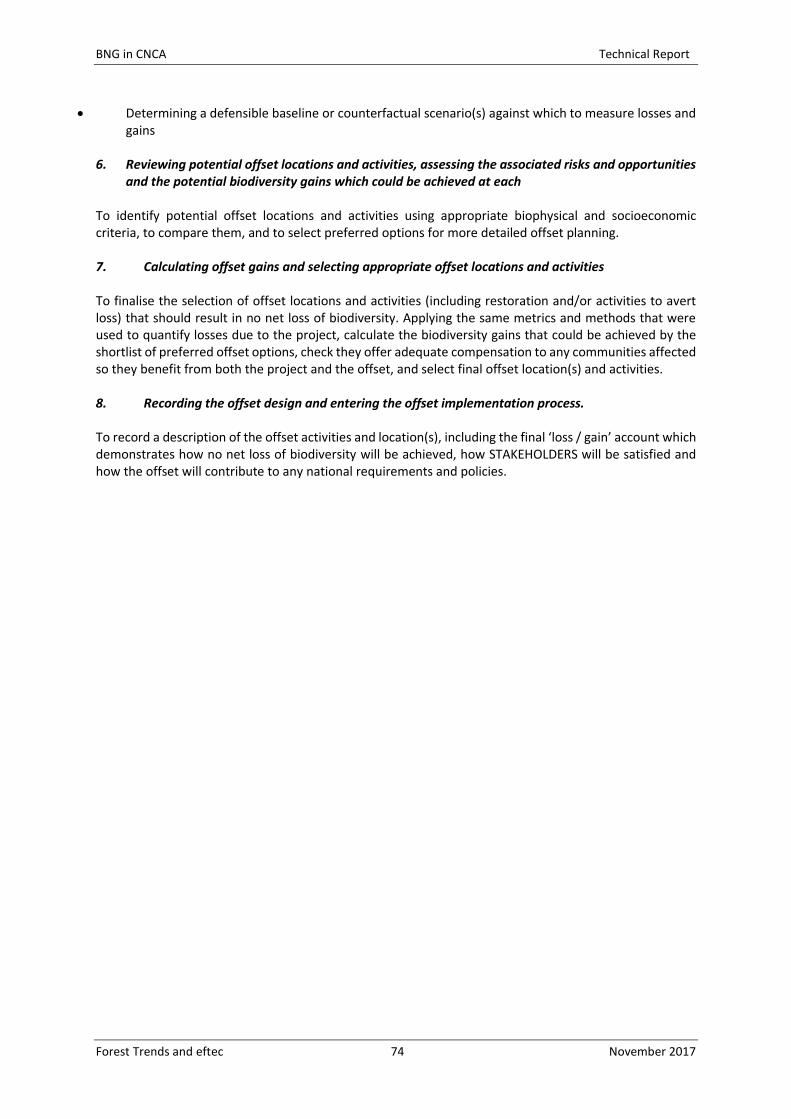
BNG in CNCA Technical Report
Forest Trends and eftec 74 November 2017
Determining a defensible baseline or counterfactual scenario(s) against which to measure losses and gains
6. Reviewing potential offset locations and activities, assessing the associated risks and opportunities
and the potential biodiversity gains which could be achieved at each To identify potential offset locations and activities using appropriate biophysical and socioeconomic criteria, to compare them, and to select preferred options for more detailed offset planning. 7. Calculating offset gains and selecting appropriate offset locations and activities To finalise the selection of offset locations and activities (including restoration and/or activities to avert loss) that should result in no net loss of biodiversity. Applying the same metrics and methods that were used to quantify losses due to the project, calculate the biodiversity gains that could be achieved by the shortlist of preferred offset options, check they offer adequate compensation to any communities affected so they benefit from both the project and the offset, and select final offset location(s) and activities. 8. Recording the offset design and entering the offset implementation process. To record a description of the offset activities and location(s), including the final ‘loss / gain’ account which demonstrates how no net loss of biodiversity will be achieved, how STAKEHOLDERS will be satisfied and how the offset will contribute to any national requirements and policies.
BNG in CNCA Technical Report
Forest Trends and eftec 75 November 2017
ANNEX 2: CNCA FRAMEWORK
This annex describes the original CNCA framework. For a more detailed outline of each step, please refer to eftec at al. (2015). Figure A2.1: The CNCA process
Source: Based on eftec et al. (2015)
A2.1 STAGE 1: Planning
Step 1: Defining the objectives of the account sets the context for the CNCA.
Step 2: Setting the scope involves specifying a baseline39, determining the stewardship criteria (management responsibility for assets included), the scope of costs and benefits, and time horizon40, etc. This scope also determines the data and information requirements.
Step 3: Setting the account boundary particularly involves setting a physical boundary to define the organisation’s zone of influence and their direct (or ‘private’) costs and benefits, versus those received (or incurred) by the rest of society (defined as the ‘external’ participant).
A2.2 STAGE 2: Development
Step 1: Identify assets and their services using the organisation’s information systems, combining the conventional accounts with natural capital management information. This feeds into the supporting schedules of the accounts.
39 Including the year the account is produced for - the ‘reporting year’.
40 The future time period over which the costs and benefits from natural capital assets are considered.
BNG in CNCA Technical Report
Forest Trends and eftec 76 November 2017
Step 2: Develop a natural capital asset register, which provides a record (or log) of the assets, their extent, condition and critical features (e.g. thresholds).
Step 3: Use information from the asset register to estimate the flows of goods and services produced by the natural capital assets – recorded in the physical flow account. Note that this need only be completed where information is available, and some assets will only be recorded as far as the asset register (i.e. move from Step 2 to Step 4).
Step 4: Apply monetary values to estimates from the physical flow account to produce values recorded in the monetary flow account. Once again, if no monetisation is possible this will only be recorded as far as the physical flow account.
Step 5: Based on the state of the natural capital recorded in the asset register and the objectives defined in STAGE 1, estimate the (monetary) costs of maintaining the natural capital within the maintenance cost account. This can distinguish legal obligations from discretionary expenditure to achieve targets set by the organisation.
Step 6: Capitalise41 the values presented in the monetary flow account and the maintenance cost account to estimate the natural capital assets and liabilities within the natural capital balance sheet. The estimation of these figures will be dependent on the time horizon for the account that is set by the organisation in Step 2. This is the first of two reporting statements.
Step 7: The second reporting statement records changes to the natural capital assets and liabilities over the accounting period – in the statement of changes in natural assets. Whether this is positive or negative reflects whether the value of changes in the total future flows of goods and services produced by the natural capital assets are greater or smaller (respectively) than any changes in the total future costs of managing those assets.
A2.3 STAGE 3: Review
Once an initial account is produced, the review stage involves an iterative process of developing an understanding of the flows of natural capital and associated maintenance costs and also improving the outputs of the CNCA accounts (particularly the reporting statements). Note, this is only a brief outline of the stepwise process of developing a CNCA account. For more information, please refer to the guidelines (eftec et al., 2015).
41 The capitalised value is the sum of the discounted values from each year along the time horizon.
BNG in CNCA Technical Report
Forest Trends and eftec 77 November 2017
ANNEX 3: SPECIFIC APPLICATIONS OF THE CNCA TO THE
BIODIVERSITY OFFSET PLANNING PROCESS
This annex outlines two further potential applications of the CNCA framework to the biodiversity offset planning process – use in monitoring, and to capture a 3rd party offset.
A3.1 Use of CNCA for monitoring
The CNCA framework could be used to monitor the mitigation hierarchy and offset implementation. Using the CNCA structure, the account can be updated at regular intervals (e.g. annually) which can show the progress in delivering the offset and associated costs (liabilities) and benefits (asset values). For example, the maintenance cost account would change as actual expenditures are made, the asset register would change as stocks of biodiversity are restored, and the physical flow account would change to reflect any increased flows of services. Any change in the physical flow account of services that are valued would result in a change in the monetary flow account. One schematic for offset implementation (set out in the BBOP Offset Implementation Handbook) is as follows: 1. Establish the mitigation activities and where will they be carried out. (Please see the BBOP
Biodiversity Offsets Design Handbook for steps from earliest conception to finalisation of the Biodiversity Offset Management Plan.)
2. Define how the mitigation measures (including offsets) will be operated and managed.
Define roles and responsibilities and potential stakeholders in offset implementation.
Establish legal arrangements.
Establish institutional arrangements. 3. Establish the long-term financial arrangements.
Define short- and long-term costs of implementing the mitigation measures (including offsets).
Select the best long-term funding option. 4. Put in place measures for monitoring and enforcement.
Define how the offset will be monitored and evaluated (linking implementation and impact performance).
Establish how the results of monitoring and evaluation will be used to improve project performance.
Consider certification and verification. 5. Apply CNCA (Step C, see Section 6.3 in the main report) to report on changes between the
baseline, impact (following the implementation of the project) and offset outcome (following implementation of the offsets) balance sheets. This should explicitly record changes in monetary values, and changes in biodiversity metrics and can be repeated over time to help monitor outcomes.
BNG in CNCA Technical Report
Forest Trends and eftec 78 November 2017
A3.2 Use in 3rd party offsets
The CNCA framework also aligns with the use of 3rd party offsets, in the mitigation hierarchy and offset implementation. In a 3rd party offset, the offset could be included as an ‘acquisition’. CNCA would provide a way for the offset credit provider to record the transaction, through:
A revenue: the payment for the offset.
A maintenance costs liability: the cost of the required offset actions (Step C of the joint framework).
A change in the reporting schedules and a gain on the balance sheet as a result of the offset actions (Step D of the joint framework).
A reduction in the biodiversity units on the balance sheet, as a result of selling the biodiversity credit (Step D of the joint framework).
The purchaser of the offset would then show a transfer from the 3rd party (external to the organisation) in their balance sheet. The cost of the offset would be recorded in their maintenance cost account and shown on the balance sheet as part of their liabilities There would need to be care taken so that the offset provider and purchaser did not both record the same biodiversity ‘gain’, this would be double-counting.
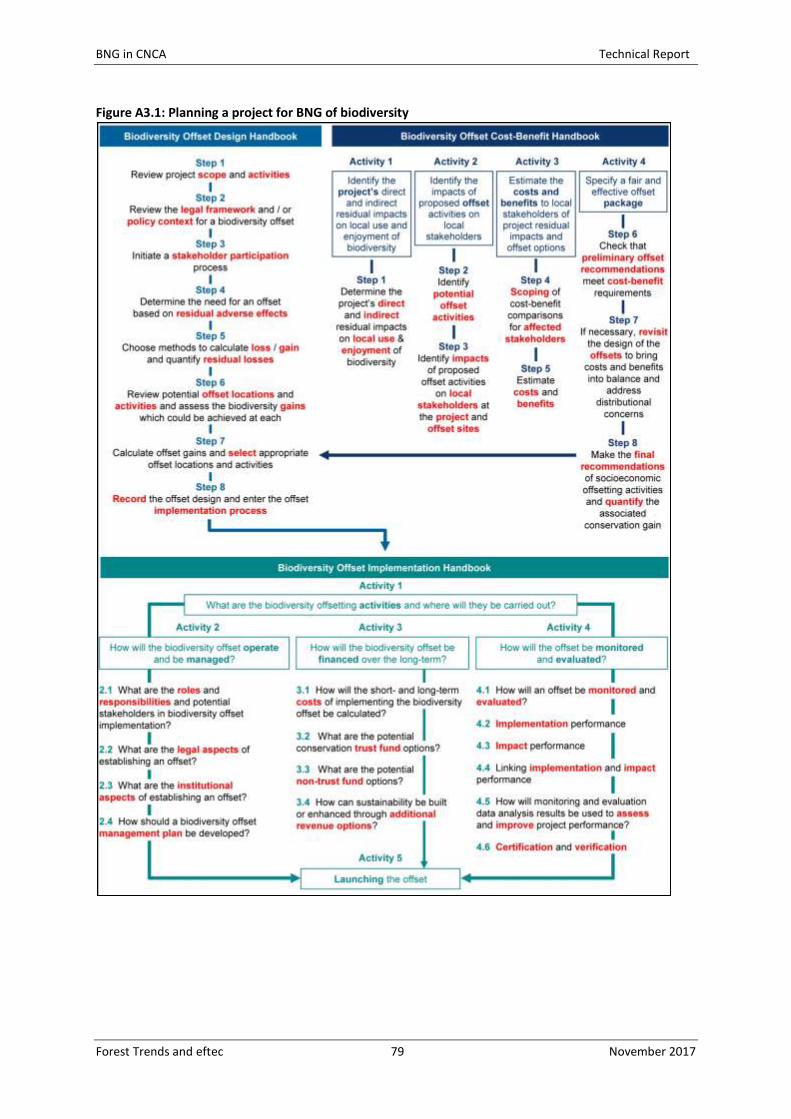
BNG in CNCA Technical Report
Forest Trends and eftec 79 November 2017
Figure A3.1: Planning a project for BNG of biodiversity
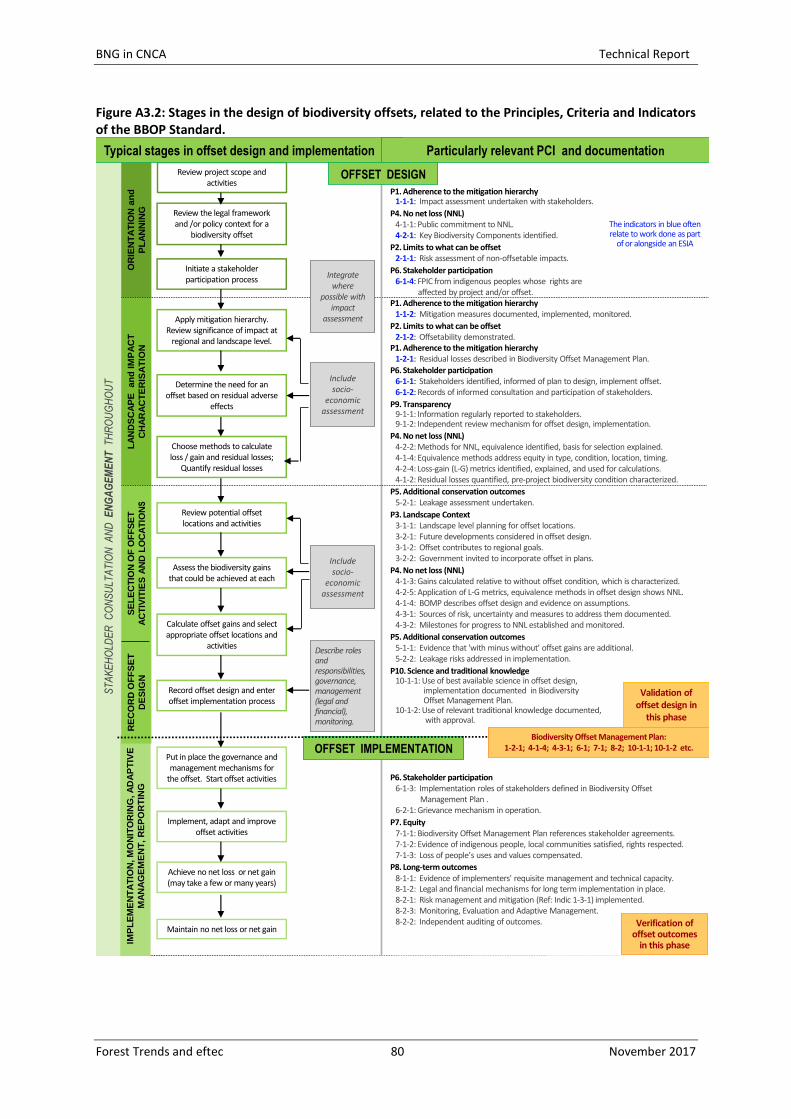
BNG in CNCA Technical Report
Forest Trends and eftec 80 November 2017
Figure A3.2: Stages in the design of biodiversity offsets, related to the Principles, Criteria and Indicators of the BBOP Standard.
Describe roles and responsibilities, governance, management (legal and financial), monitoring.
LA
ND
SC
AP
E
an
d I
MP
AC
T
CH
AR
AC
TE
RIS
AT
ION
SE
LE
CT
ION
OF
OF
FS
ET
AC
TIV
ITIE
S A
ND
LO
CA
TIO
NS
Review project scope and activities
Review potential offset locations and activities
Choose methods to calculate loss / gain and residual losses;
Quantify residual losses
Apply mitigation hierarchy. Review significance of impact at
regional and landscape level.
Determine the need for an offset based on residual adverse
effects
OR
IEN
TA
TIO
N a
nd
PL
AN
NIN
G Review the legal framework and /or policy context for a
biodiversity offset
ST
AK
EH
OLD
ER
C
ON
SU
LTA
TIO
N A
ND
ENGAGEMENT
TH
RO
UG
HO
UT
P1. Adherence to the mitigation hierarchy1-1-1: Impact assessment undertaken with stakeholders.
P4. No net loss (NNL)4-1-1: Public commitment to NNL.4-2-1: Key Biodiversity Components identified.
P2. Limits to what can be offset2-1-1: Risk assessment of non-offsetable impacts.
P6. Stakeholder participation6-1-4: FPIC from indigenous peoples whose rights are
affected by project and/or offset.P1. Adherence to the mitigation hierarchy
1-1-2: Mitigation measures documented, implemented, monitored.
P2. Limits to what can be offset2-1-2: Offsetability demonstrated.
P1. Adherence to the mitigation hierarchy1-2-1: Residual losses described in Biodiversity Offset Management Plan.
Include socio-
economic assessment
Assess the biodiversity gains that could be achieved at each
Calculate offset gains and select appropriate offset locations and
activities
Put in place the governance and management mechanisms for
the offset. Start offset activities
Implement, adapt and improve offset activities
Maintain no net loss or net gain
IMP
LE
ME
NT
AT
ION
, M
ON
ITO
RIN
G, A
DA
PT
IVE
MA
NA
GE
ME
NT
, R
EP
OR
TIN
G
P6. Stakeholder participation6-1-1: Stakeholders identified, informed of plan to design, implement offset.6-1-2: Records of informed consultation and participation of stakeholders.
P9. Transparency9-1-1: Information regularly reported to stakeholders.9-1-2: Independent review mechanism for offset design, implementation.
P4. No net loss (NNL)4-2-2: Methods for NNL, equivalence identified, basis for selection explained.4-1-4: Equivalence methods address equity in type, condition, location, timing.4-2-4: Loss-gain (L-G) metrics identified, explained, and used for calculations.4-1-2: Residual losses quantified, pre-project biodiversity condition characterized.
P5. Additional conservation outcomes5-2-1: Leakage assessment undertaken.
P3. Landscape Context3-1-1: Landscape level planning for offset locations.3-2-1: Future developments considered in offset design.3-1-2: Offset contributes to regional goals.3-2-2: Government invited to incorporate offset in plans.
P4. No net loss (NNL)4-1-3: Gains calculated relative to without offset condition, which is characterized.4-2-5: Application of L-G metrics, equivalence methods in offset design shows NNL.4-1-4: BOMP describes offset design and evidence on assumptions.4-3-1: Sources of risk, uncertainty and measures to address them documented.4-3-2: Milestones for progress to NNL established and monitored.
P5. Additional conservation outcomes5-1-1: Evidence that 'with minus without' offset gains are additional.5-2-2: Leakage risks addressed in implementation.
P10. Science and traditional knowledge 10-1-1: Use of best available science in offset design,
implementation documented in Biodiversity Offset Management Plan.
10-1-2: Use of relevant traditional knowledge documented, with approval.
Typical stages in offset design and implementation Particularly relevant PCI and documentation
P6. Stakeholder participation6-1-3: Implementation roles of stakeholders defined in Biodiversity Offset
Management Plan .6-2-1: Grievance mechanism in operation.
P7. Equity7-1-1: Biodiversity Offset Management Plan references stakeholder agreements.7-1-2: Evidence of indigenous people, local communities satisfied, rights respected.7-1-3: Loss of people’s uses and values compensated.
P8. Long-term outcomes8-1-1: Evidence of implementers' requisite management and technical capacity.8-1-2: Legal and financial mechanisms for long term implementation in place.8-2-1: Risk management and mitigation (Ref: Indic 1-3-1) implemented.8-2-3: Monitoring, Evaluation and Adaptive Management.8-2-2: Independent auditing of outcomes.
Achieve no net loss or net gain (may take a few or many years)
Integrate where
possible with impact
assessment
OFFSET DESIGN
Initiate a stakeholder participation process
OFFSET IMPLEMENTATION
Record offset design and enter offset implementation process
Validation of offset design in
this phase
Verification of offset outcomes
in this phase
The indicators in blue often relate to work done as part
of or alongside an ESIA
Include socio-
economic assessment
RE
CO
RD
OF
FS
ET
DE
SIG
N
Biodiversity Offset Management Plan:1-2-1; 4-1-4; 4-3-1; 6-1; 7-1; 8-2; 10-1-1; 10-1-2 etc.