Embed Size (px)
DESCRIPTION
Biodiversity Data Center meeting Copenhagen 29. Sept. 2009. How does the BDC support the user needs by the example of BAP and SEBI - ETC / BD. Water Policy. Data and Themes. Projects. News. BISE Biodiversity in Europe. Data and Themes. Biodiversity Policy. Projects. News. - PowerPoint PPT Presentation
Citation preview

Biodiversity Data Center meetingCopenhagen 29. Sept. 2009
How does the BDC support the user needs - by the example of BAP and SEBI -
ETC / BD

Data and Themes Water Policy
Projects News
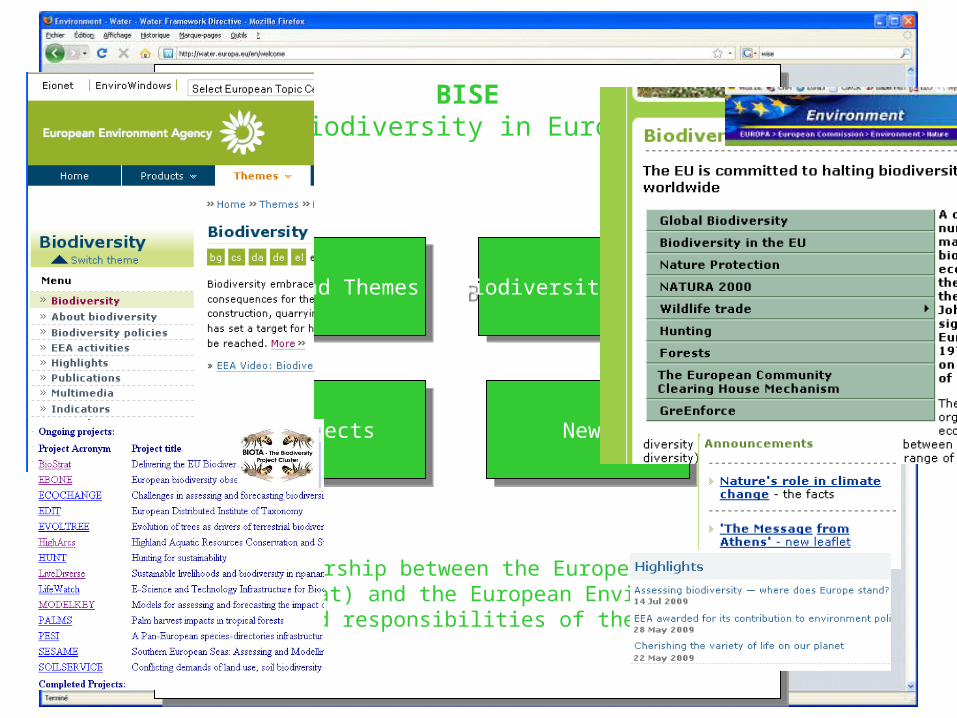
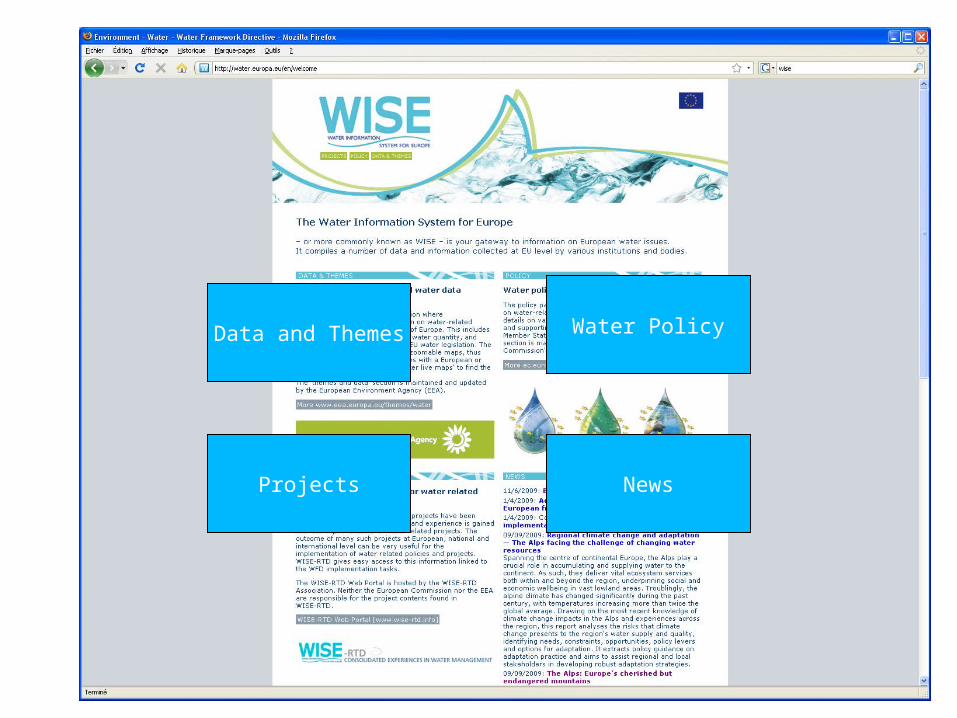
Data and ThemesData and Themes Biodiversity PolicyBiodiversity Policy
ProjectsProjects NewsNews
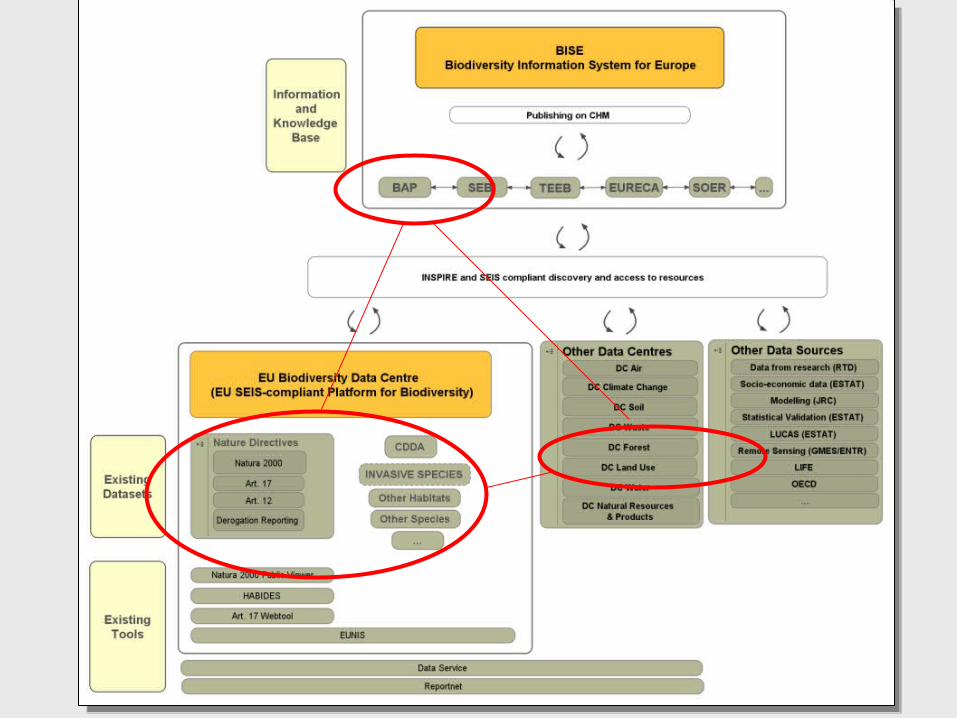
BISEBiodiversity in Europe
BISE is a partnership between the European Commission (Env, JRC, Eurostat) and the European Environment Agency
The main roles and responsibilities of the partners are …
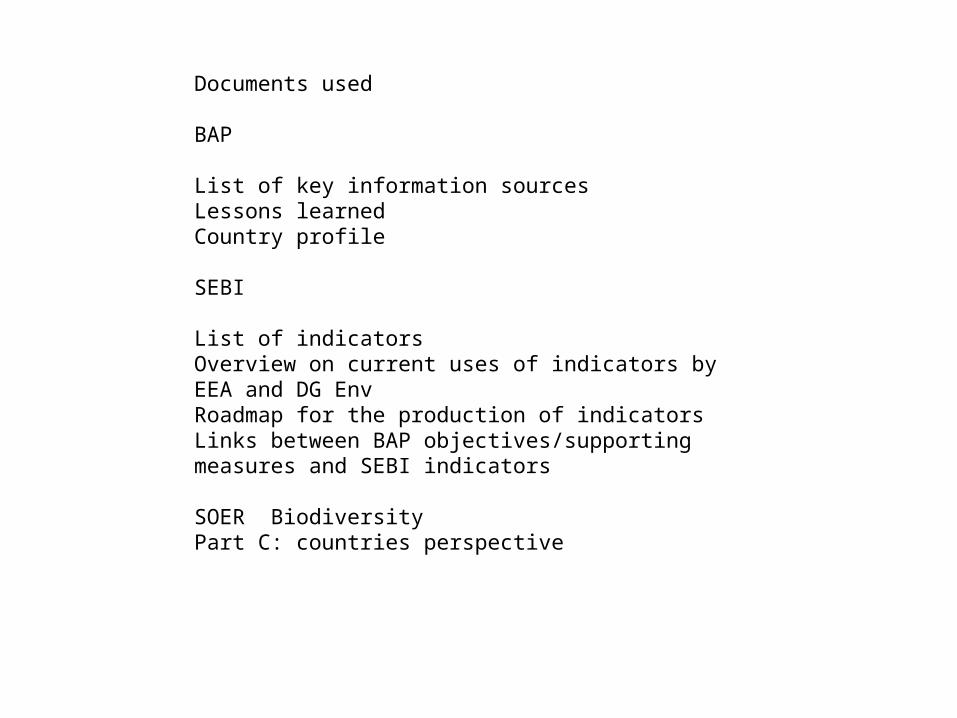
Documents used
BAP
List of key information sourcesLessons learnedCountry profile
SEBI
List of indicatorsOverview on current uses of indicators by EEA and DG EnvRoadmap for the production of indicatorsLinks between BAP objectives/supporting measures and SEBI indicators
SOER BiodiversityPart C: countries perspective
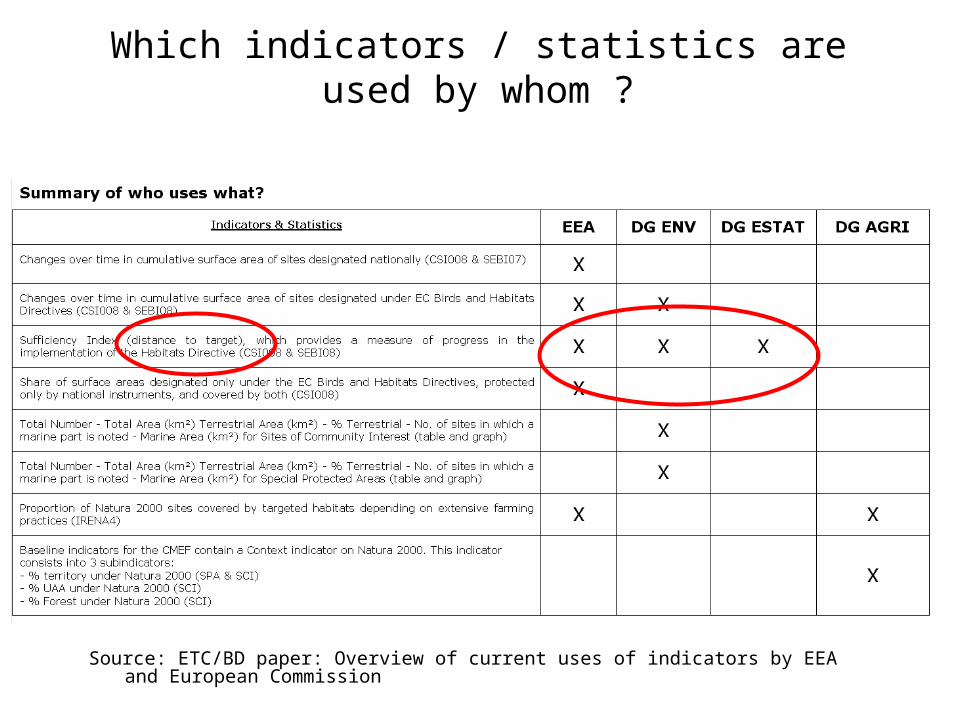
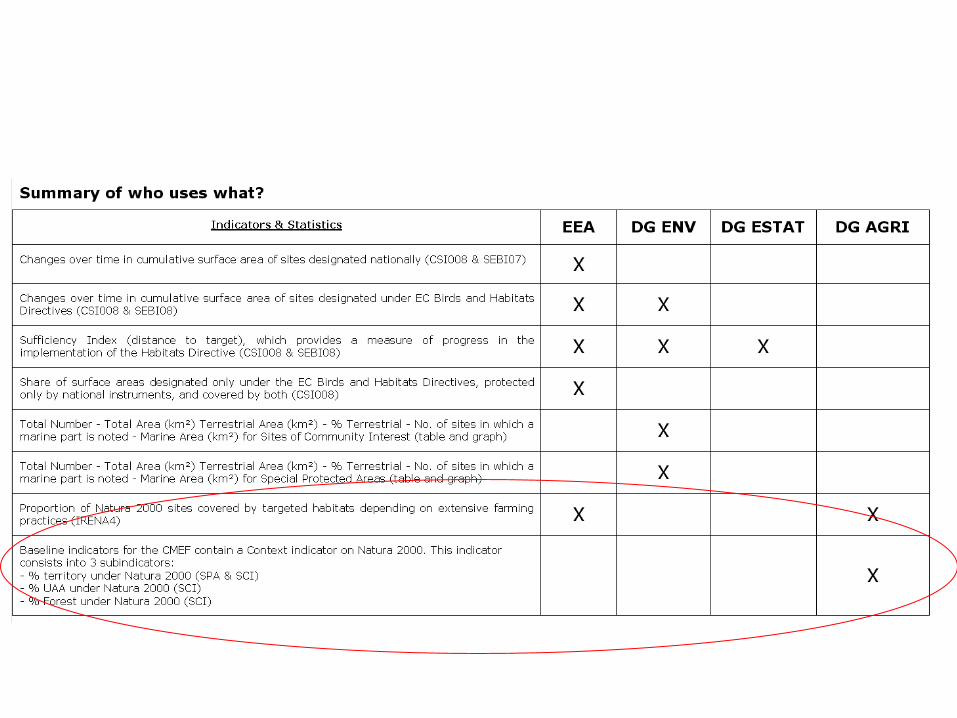
Which indicators / statistics are used by whom ?
Source: ETC/BD paper: Overview of current uses of indicators by EEA and European Commission
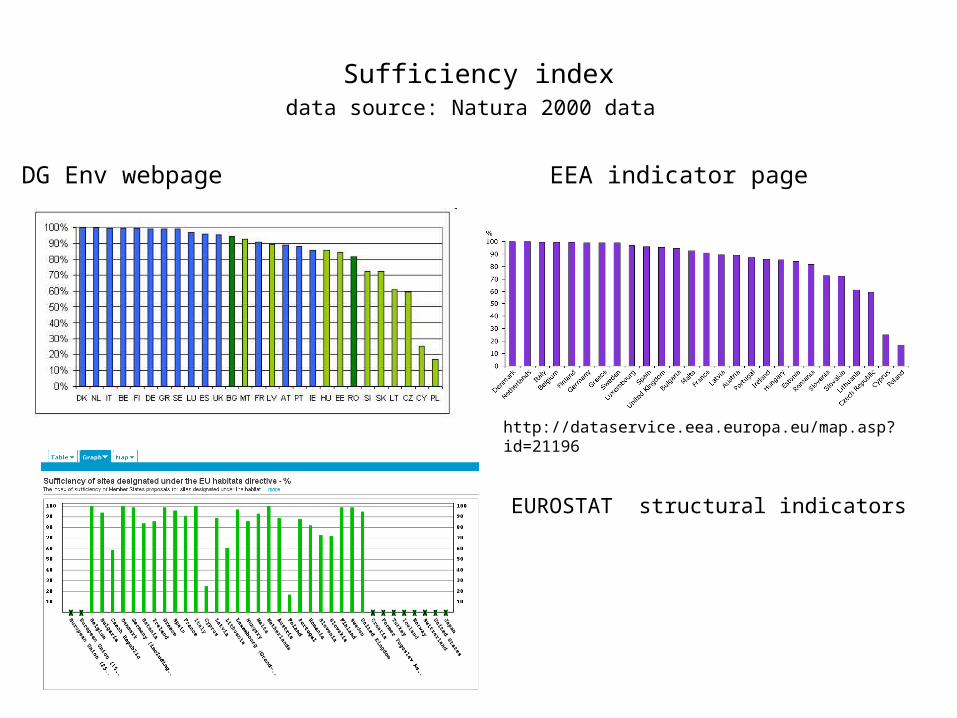
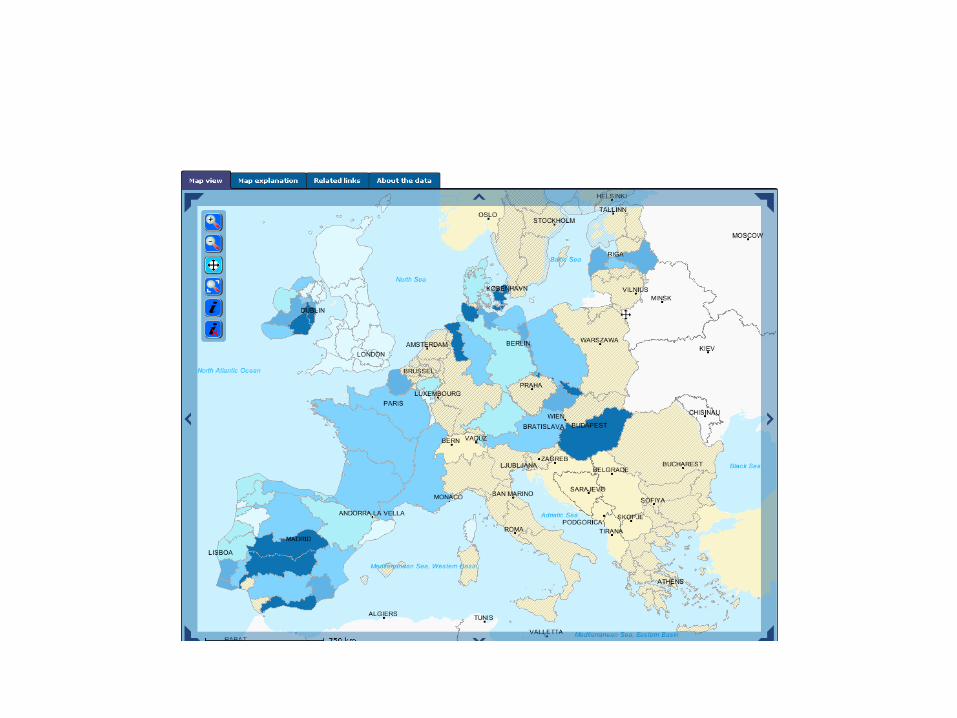
DG Env webpage
http://dataservice.eea.europa.eu/map.asp?id=21196
EEA indicator page
Sufficiency indexdata source: Natura 2000 data
EUROSTAT structural indicators
What is ongoing / needed next?
- MS report data via Reportnet- Qa/qc done automatic (in preparation) + manually (EEA / ETC_BD) - European Natura 2000 database compiled twice a year- Calculation of statistics implemented (?)- Data used in DG Env internal application - Filter for sensitive species implemented- Data (subset) used for public viewer (how to link to national documentation systems)- Versioning and audit trail is complex, how to improve documentation?- SDF under revision inter alia to fill the gap for percentage of marine area in sites parameter which is often needed for statistics - switch to xml is planned - adjustments of datastructure and qa/qc routines have to be made in early 2010 - import routines / integration in EUNIS planned (2009)
Data flow and production of indicator
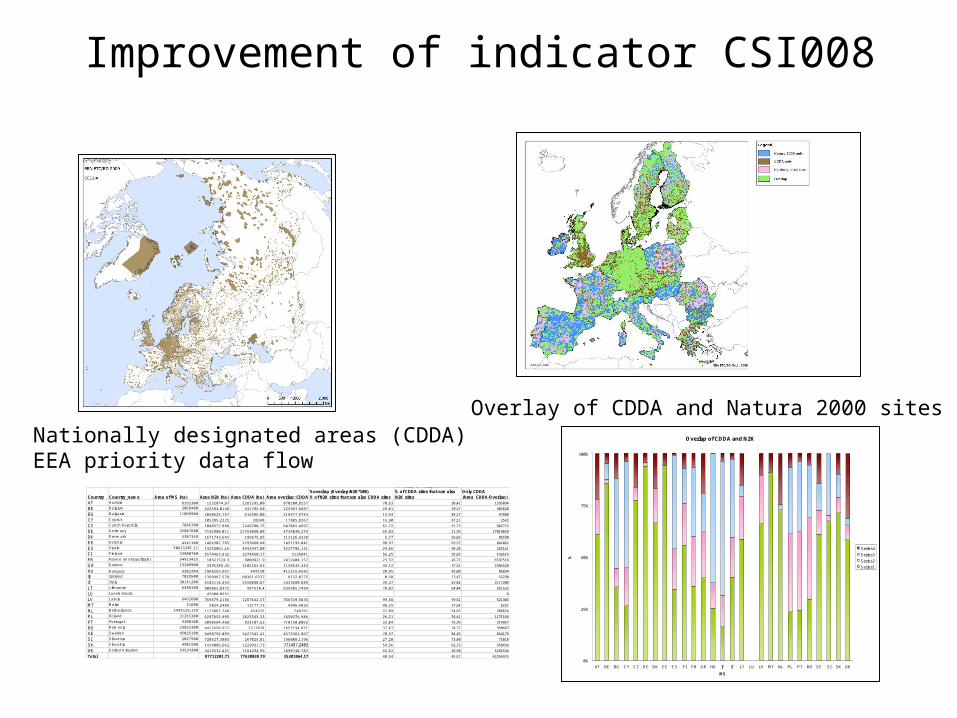
Improvement of indicator CSI008
Country Country_name Area of MS (ha) Area N2k (ha) Area CDDA (ha) Area overlap: CDDA within N2K (ha)%overlap (Overlap/N2K*100)% of N2K sites that are also CDDA sites
%overlap (Overlap/CDDA*100)% of CDDA sites that are also N2K sites
Only CDDA(Area_CDDA-Overlap)
AT Austria 8392300 1232074,97 2265295,00 870200,8257 70,63 38,41 1395094
BE Belgium 3068400 422594,0148 431795,60 125967,6687 29,81 29,17 305828
BG Bulgaria 11099900 3860625,747 616586,00 518977,9743 13,44 84,17 97608
CY Cyprus 105385,2225 20348 17805,8267 16,90 87,51 2543
CZ Czech Republic 7886700 1048377,888 1249780,75 647065,4997 61,72 51,77 602715
DE Germany 35807600 7192908,011 21764040,00 4735030,274 65,83 21,76 17029010
DK Denmark 4307348 1671743,645 199675,95 113126,4238 6,77 56,66 86550
EE Estonia 4541300 1466307,785 2293660,60 1451199,041 98,97 63,27 842462
ES Spain 50621201,11 14253061,16 4492947,00 4227786,131 29,66 94,10 265161
FI Finland 33800700 5574963,832 3278460,17 3135841 56,25 95,65 142619
FR France (metropolitain) 54913425 10321574,3 9009921,9 2412404,157 23,37 26,77 6597518
GR Greece 13208900 3395389,35 3105163,63 1158635,343 34,12 37,31 1946528
HU Hungary 9302204 1968265,967 499150 412316,4585 20,95 82,60 86834
IE I reland 7029500 1399967,578 60361,6337 8132,0775 0,58 13,47 52230
IT I taly 30141200 6182118,493 5550880,87 2433680,889 39,37 43,84 3117200
LT Lithuania 6488100 806865,8372 987510,4 635985,7434 78,82 64,40 351525
LU Luxembourg 45600,0991 0
LV Latvia 6462600 769579,2156 1287642,37 766339,5835 99,58 59,51 521303
MT Malta 31600 5034,3486 13177,72 4946,4835 98,25 37,54 8231
NL Netherlands 3495126,159 1123887,248 454315 248291 22,09 54,65 206024
PL Poland 31265300 6297653,995 2825545,33 1650376,986 26,21 58,41 1175168
PT Portugal 9200100 2098584,468 925107,63 710150,8063 33,84 76,76 214957
RO Romania 23832300 4422699,972 2217878 1657194,871 37,47 74,72 560683
SE Sweden 45025100 6498792,093 5427542,41 4573362,967 70,37 84,26 854179
SI Slovenia 2027500 720527,3803 267025,81 196008,1196 27,20 73,40 71018
SK Slovakia 4901500 1414086,662 1229931,73 771497,2403 54,56 62,73 458434
UK United Kingdom 24534300 3413532,421 7164294,95 1898740,782 55,62 26,50 5265554
Total 87712201,71 77638038,79 35381064,17 40,34 45,57 42256975
Overlap of CDDA and N2K
0%
25%
50%
75%
100%
AT BE BG CY CZ DE DK EE ES FI FR GR HU IE IT LT LU LV MT NL PL PT RO SE SI SK UK
MS
%
Series4
Series3
Series2
Series1
Nationally designated areas (CDDA)EEA priority data flow
Overlay of CDDA and Natura 2000 sites
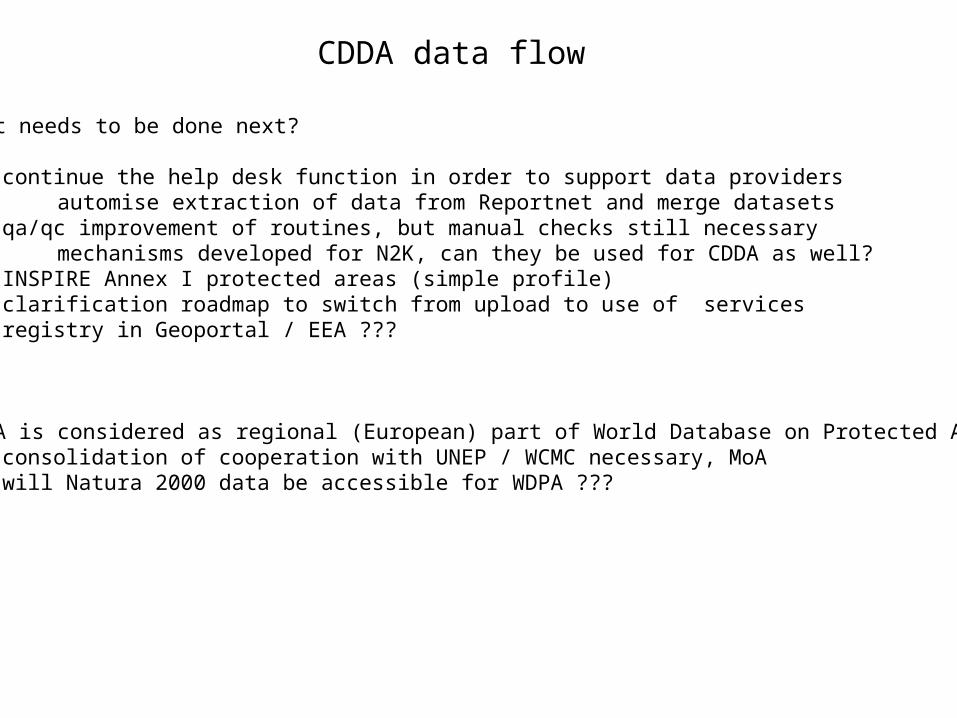
What needs to be done next?
continue the help desk function in order to support data providers automise extraction of data from Reportnet and merge datasets
qa/qc improvement of routines, but manual checks still necessary mechanisms developed for N2K, can they be used for CDDA as well?
INSPIRE Annex I protected areas (simple profile) clarification roadmap to switch from upload to use of services
registry in Geoportal / EEA ???
CDDA is considered as regional (European) part of World Database on Protected Areasconsolidation of cooperation with UNEP / WCMC necessary, MoAwill Natura 2000 data be accessible for WDPA ???
CDDA data flow

AU BENational
Sub-National
RegionalEuropean
CDDA
WDPAGlobal
…
….
Information Networking
INSPIRE
Registry
discovery services
Production of the Indicator
• CDDA and Natura2000 database maintained in BDC• Compilation of indicator by means of GIS• clarification responsibilities who will produce the indicator (ETC/BD ?)• Documentation of methodology to ensure repeatability• Indicator management system (IMS or easier to use alternative)• Data underlying the graph of the indicator located in BDC• Flexible tool to visualise data (graphs, maps)• easy way to link / use indicator for reports (e.g. BAP)
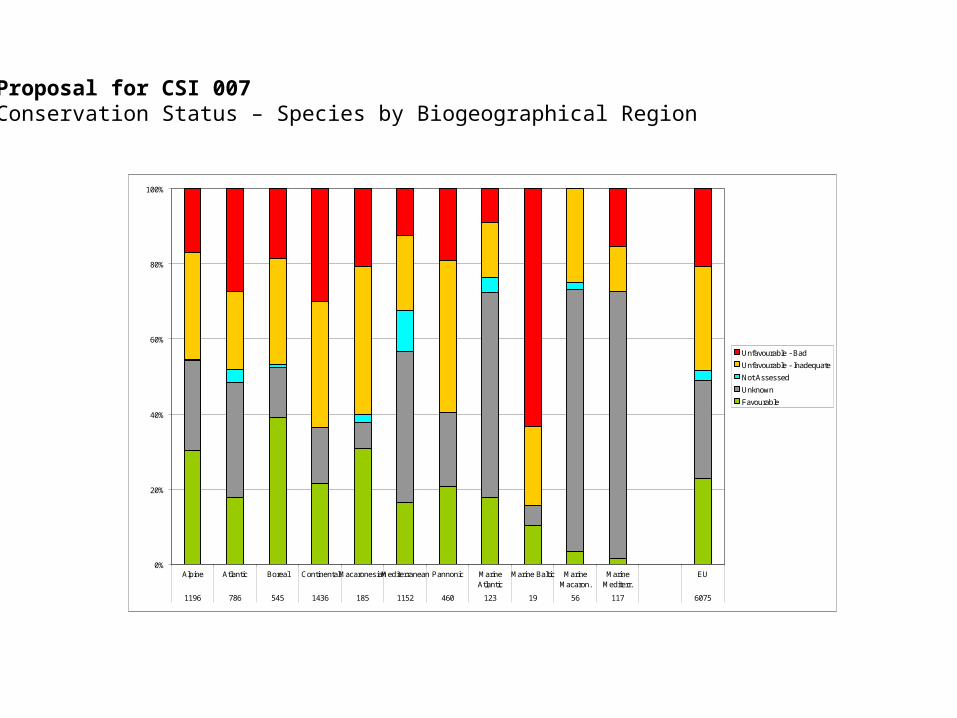
0%
20%
40%
60%
80%
100%
Alpine Atlantic Boreal ContinentalMacaronesianMediterranean Pannonic MarineAtlantic
Marine Baltic MarineMacaron.
MarineMediterr.
EU
1196 786 545 1436 185 1152 460 123 19 56 117 6075
Unfavourable - Bad
Unfavourable - Inadequate
Not Assessed
Unknown
Favourable
Proposal for CSI 007Conservation Status – Species by Biogeographical Region
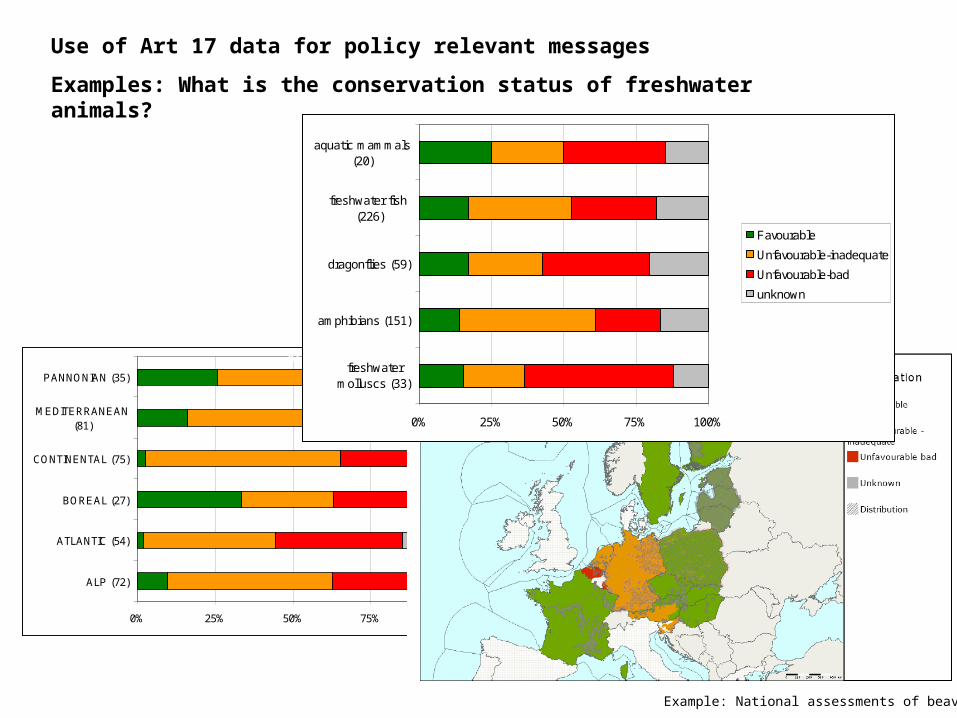
0% 25% 50% 75% 100%
ALP (72)
ATLANTIC (54)
BOREAL (27)
CONTINENTAL (75)
MEDITERRANEAN(81)
PANNONIAN (35)
Favourable
Unfavourable-inadequate
Unfavourable-bad
unknown
Use of Art 17 data for policy relevant messages
Examples: What is the conservation status of freshwater animals?
National assessments of beaver
Example: National assessments of beaver
0% 25% 50% 75% 100%
freshwatermolluscs (33)
amphibians (151)
dragonflies (59)
freshwater fish (226)
aquatic mammals(20)
Favourable
Unfavourable-inadequate
Unfavourable-bad
unknown
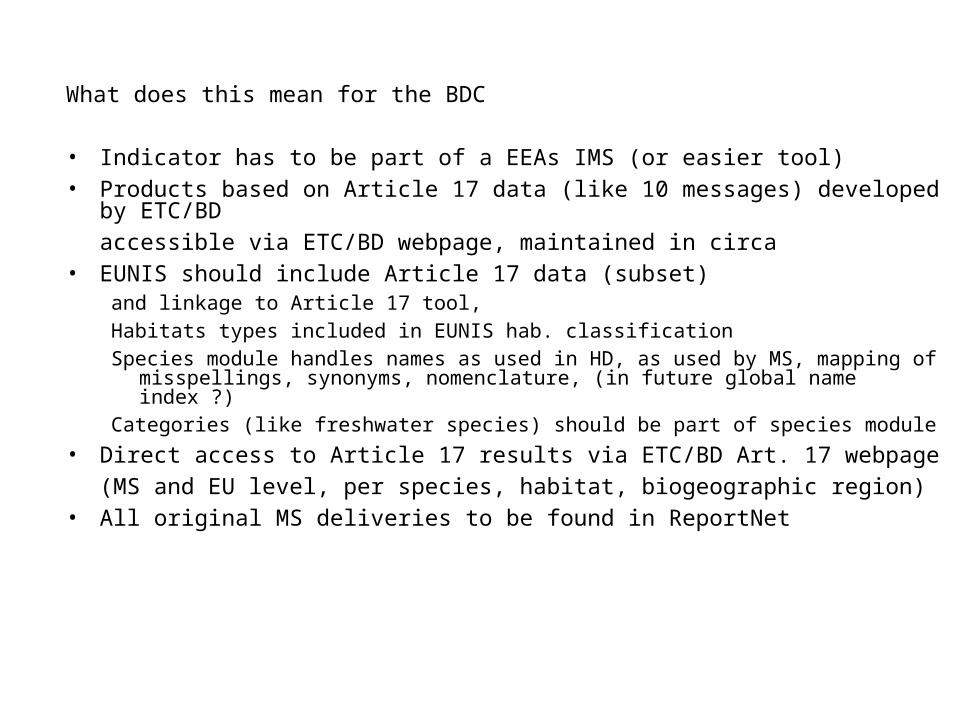
What does this mean for the BDC
• Indicator has to be part of a EEAs IMS (or easier tool)• Products based on Article 17 data (like 10 messages) developed by ETC/BD
accessible via ETC/BD webpage, maintained in circa• EUNIS should include Article 17 data (subset)
and linkage to Article 17 tool,
Habitats types included in EUNIS hab. classification
Species module handles names as used in HD, as used by MS, mapping of misspellings, synonyms, nomenclature, (in future global name index ?)
Categories (like freshwater species) should be part of species module
• Direct access to Article 17 results via ETC/BD Art. 17 webpage
(MS and EU level, per species, habitat, biogeographic region)• All original MS deliveries to be found in ReportNet
For information (statistics) that is required often and by different users (ENV, AGRI, …)/ regularly data analysis should be implemented
Comparison of what is inside and outside the networkse.g. % of main Annex I habitats within Natura 2000 network
% of certain CLC classes within Natura 2000 network (e.g. Forest, Grassland, …)
Statistics used for different spatial units EU, biogeographic level, per Member statebut based on same datasets
Who does this analysis regularly ?
Where do we maintain information (concepts) like: Which CLC considered as Forest in which context? What are the farmland species and habitats? What are marine habitats, species? Which are the invasive species? Habitats / species association?
BDC EUNIS-species module, EUNIS-habitats classification?ontology, list of excel files ?
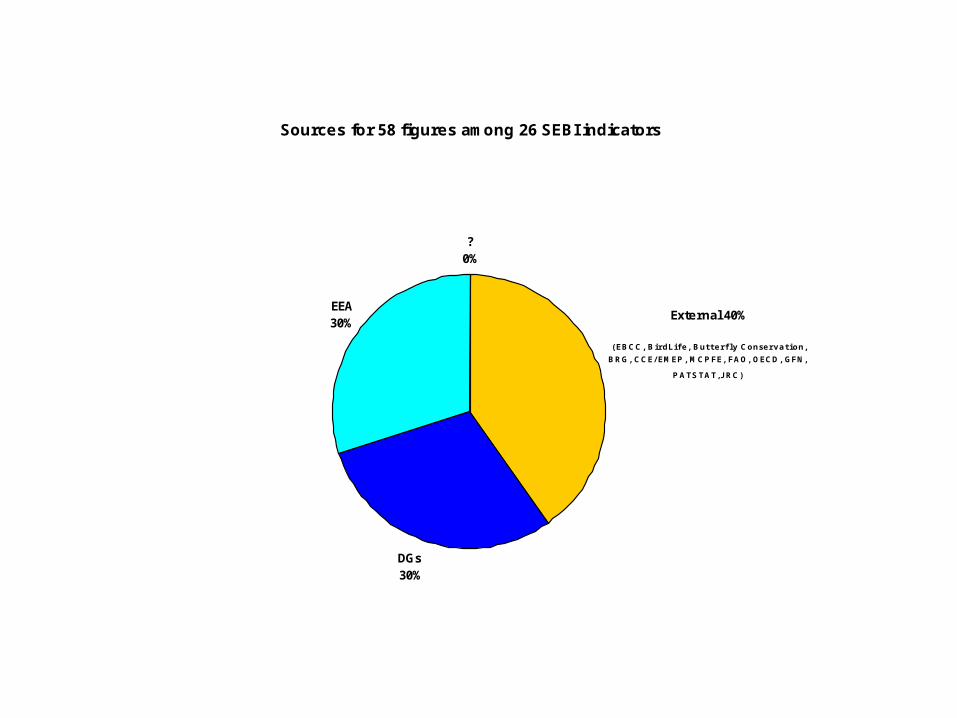
Sources for 58 figures among 26 SEBI indicators
DGs30%
EEA30%
?0%
External 40%
(EBCC, BirdLife, Butterfl y Conservation,
BRG, CCE/ EMEP, MCPFE, FAO, OECD, GFN,
PATSTAT,J RC)

Indicator produced by contractor (here: BRG)Data sources: for some countries national inventories availableFAO database (DADIS), reporting cycle?
BDC: raw data used for the calculation of the indicator should not be maintained in the BDC - but the data underlying the graph(IPR to clarify with contractor)
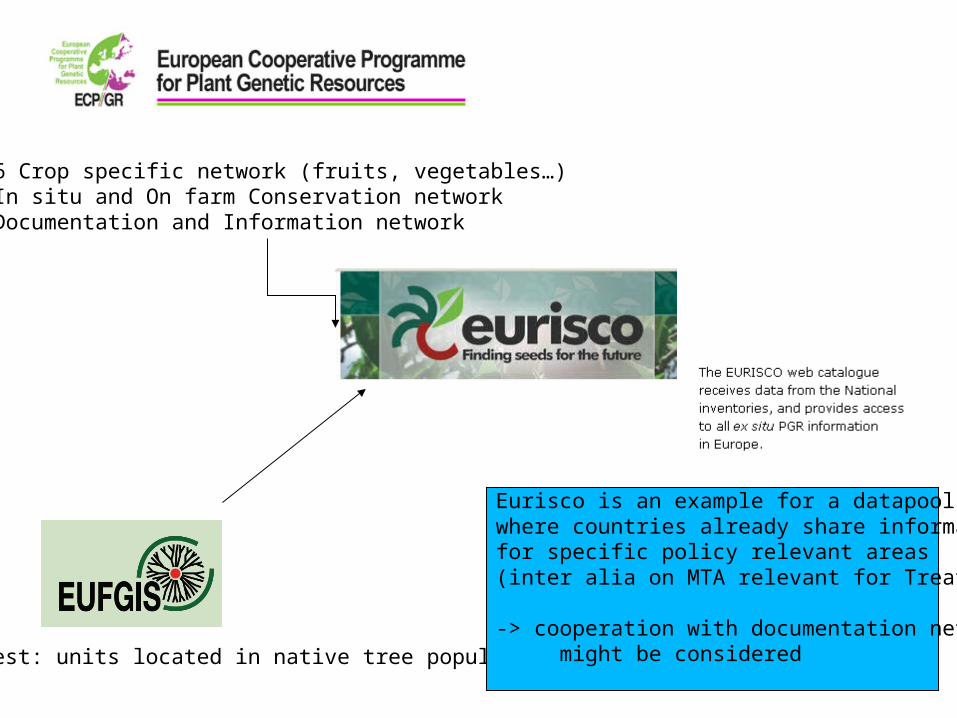
Forest: units located in native tree populations
• 6 Crop specific network (fruits, vegetables…)• In situ and On farm Conservation network • Documentation and Information network
Eurisco is an example for a datapool, where countries already share information for specific policy relevant areas(inter alia on MTA relevant for Treaty)
-> cooperation with documentation network might be considered
European Agricultural Fund for Rural Development (EAFRD)
Agricultural cross-compliance measures
INVEKOS data available for analysis ???

BAP and SOER
Both reports need data and information provided by countries(EC Member States, EEA EIONET, collaborating countries)
What is common for both reports, SEBI indicators are an important component of these reports
BAP country profile – SOER part C?
SENSE: Shared European National State of the EnvironmentAn EEA initiative for the national input to SOER 2010
Idea: to have uptodate information from the country in a structured waySENSE will use the XML-RDF format to automatically fetch, synchronise, publish and share national SOER information via the EEA website
Using RSS feed this information kept on national level can bee seen also as a delivery to Reportnet content registry

AU BENational
Sub-National
EuropeanEEA / EIONETCountry profiles
…
Extract relevant elements for BAPExtract relevant elements for SOER

Deliveries for BDC in 2009 + 2010should focus on:
• Further improvements for the main data flows• Production of SEBI indicators• Enhancement of EUNIS (incl portal)• Country profiles• Further analysis of DC requirements for BDC/BISE • Review and further development of concept paper
Discussion Governance structure
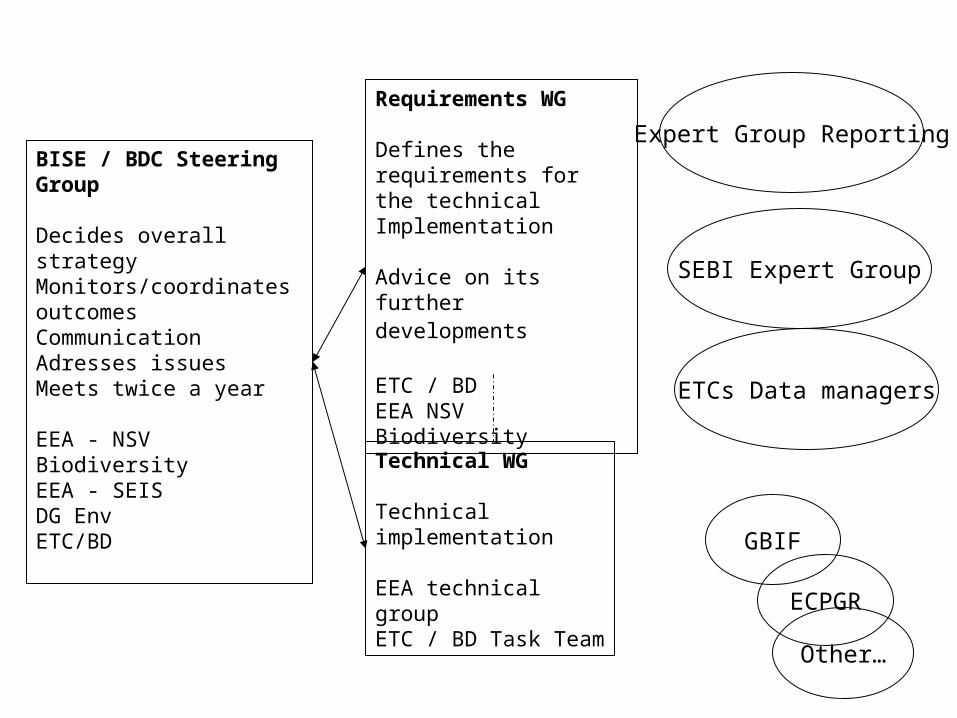
BISE / BDC Steering Group
Decides overall strategyMonitors/coordinates outcomesCommunicationAdresses issuesMeets twice a year
EEA - NSV BiodiversityEEA - SEISDG EnvETC/BD
Requirements WG
Defines the requirements for the technicalImplementation
Advice on its further developments
ETC / BDEEA NSV Biodiversity
Technical WG
Technical implementation
EEA technical groupETC / BD Task Team
GBIF
ECPGR
Other…
Expert Group Reporting
SEBI Expert Group
ETCs Data managers
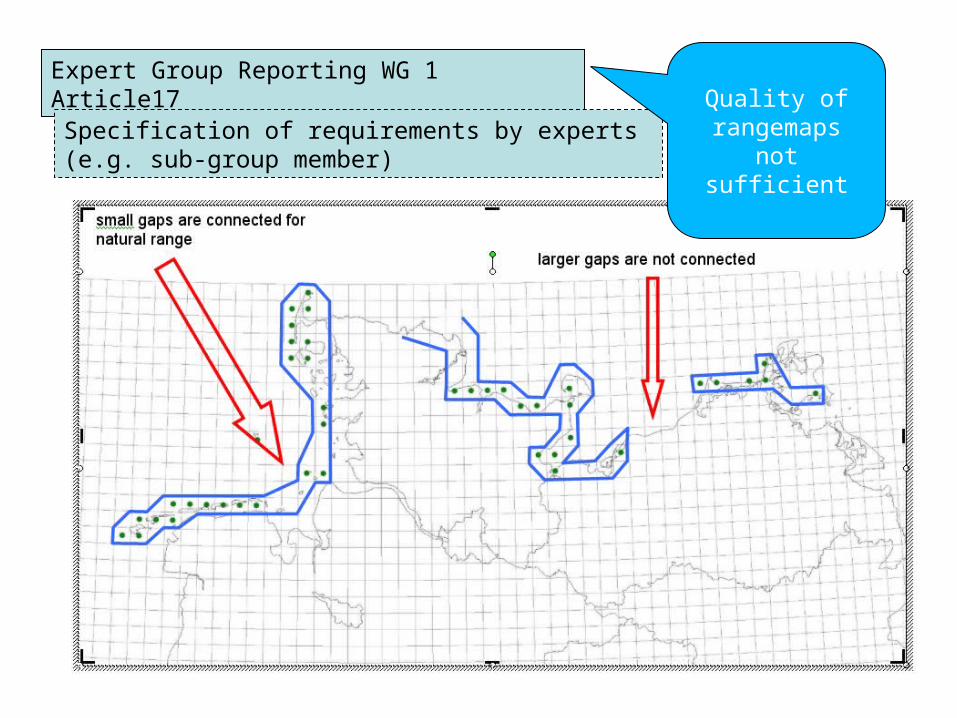
Expert Group Reporting WG 1 Article17
Specification of requirements by experts (e.g. sub-group member)
Quality of rangemaps not
sufficient

Expert Group Reporting WG 1 Article17
Specification of requirements by experts (e.g. sub-group member)
Requirements WG
Technical WGBISE/BDC Steering Committee
Implem. PlanService Rangemaps…..…..
make recommendation
oversee outcome
decision

end

Island - there are an Atlas http://www.floraislands.is/blomaval.htm Finland - atlas for vascular plants on http://www.luomus.fi/kasviatlas/ Also atlases and reporting gateways in FinlandNorway - vascular plants Artsobservationer - http://www.artsobservasjoner.no/ Danmark - Atlas Flora Danica on vascular plants - info http://www.botaniskforening.dk/1154.0.html - Sweden - Species gateway http://www.artportalen.se/default.asp For Birds are there atlases and reporting gateways in Finland For lichens there is an Internet atlas in Norway http://www.toyen.uio.no/botanisk/bot-mus/lav/soklavhb.htm
Red Data Books/Lists, National/Subnational Atlases, / Action Plans (A1.3)

Biodiversity Action Plan reporting BAP
2008 mid-term report2010 : Final report
SEBI Indicatorsinternationally agreeddescribe status of Biodiversityto measure change
State of the Environment Report SOEREEA Regulation to "publish a report on the state of, trends in and prospects for the environment 2010: next SOERevery five yearssupplemented by indicator reports focusing upon specific issues