Embed Size (px)
Citation preview

BIODEGRADATION TREAT ABILITY STUDY REPORT
BIOTREATABILITY SOIL PILE STUDIES
METACHEM PRODUCTSNEW CASTLE, DELAWARE
PRINTED ON:
MARCH 23, 2001 AR300001

CONESTOGA-ROVERS& ASSOCIATES
Route 113-559 W. Uwchlan Ave., Ste. #120, Exton, PA 19341Telephone; 610 280-0277 Facsimile: 610 280-0278www. CRAworld. com
March 23, 2001 Reference No. 14246
Mr. Hilary ThorntonUnited States Environmental Protection AgencyRegion IIIMail Call 3HS231650 Arch StreetPhiladelphia, Pennsylvania 19103
Dear Mr. Thornton:
Re: Results of Biodegradation Treatability StudyStandard Chlorine of Delaware SiteEPA Order No. III-96-73-DC_______
Transmitted with this letter are three (3) copies of the report on the results of the laboratorytreatability study for soil at the Standard Chlorine of Delaware (SCD) Site in Delaware City,Delaware. Conestoga-Rovers & Associates, Inc. (CRA) conducted the laboratory treatabilitystudy in accordance with the May 1998 Biodegradation Treatability Study Work Plan, and asupplement to that work plan, dated October 16,1998.
Six test conditions, including a control condition that was not subject to any treatment, otherthan to be maintained under anaerobic conditions, were performed. The variables in thetreatability conditions included: airflow rates; the addition of bulking agents, inorganicnutrients, organic substrate, and microbes; and, creating sequential anaerobic and aerobicconditions. All six test conditions, including the control, showed some degree of removal of thecompounds of concern. Under the laboratory conditions, all have been projected to meetcleanup criteria in timeframes less than 7 years.
Under optimized laboratory conditions, soil vapor extraction (SVE) and sequentialanaerobic/aerobic biodegradation treatments were shown to be the most effective potentialremedial alternatives in reducing contaminant concentration in the soil and meeting cleanupcriteria. The results of the laboratory treatability studies are being considered in developing thework plan for a field pilot test. We are focusing on a field program that would further test theeffects of variable airflow and the addition of microbes to optimize the on-site biodegradationtreatment scheme. The timeframe for meeting cleanup criteria under actual field conditions(versus the controlled and idealized laboratory conditions) will be assessed during the fieldpilot test. Two treatment technologies would be tested using the soil pile soils:
i) Sequential anaerobic/aerobic degradation (low airflow); andii) High airflow SVE.
1SO9OO1
EQUAL EMPLOYMENT OPPORTUNITY EMPLOYER Wortdwld* Engineering, Environmental, Construction, end IT Service*
AR300002

CONESTOQA-ROVERS& ASSOCIATES
March 23,2001 2 Reference No. 14246
Sequential anaerobic /aerobic degradation was effective in reducing the concentrations of all thechlorobenzenes. The chlorobenzenes were degraded biologically to non-toxic products. Thetime to reach the USEPA Record of Decision (ROD) criteria was longer than SVE for thelaboratory test, but times for all treatments are likely to be much longer under field conditionsand the relatively small time improvement for SVE is likely to be lost. SVE requires theinstallation and operation of energy intensive high flow aeration equipment and will generate aspent carbon waste stream for disposal. Sequential anaerobic/aerobic degradation wouldreduce the equipment cost by reducing the airflow and carbon requirements.
EPA's comments to this submittal will be considered as we further develop the Field Pilot TestWork Plan.
We look forward to your review and comments to this submittal. Please do not hesitate tocontact either of us (Alan Weston at 716-297-6150 or [email protected]; Dan Erdman610-363-3868 or derdman@cra world .com) if there are any questions.
Yours truly,
CONESTOGA-ROVERS & ASSOCIATES
Alan F. Weston, Ph.D.
Daniel E. Erdman, P.G., REA
DEE/sps/1Encl.
c.c.: Girma Mergia, Black & VeatchKurt Olinger, DNRECKen Hannon, Metachem
Worldwld* lngln*«rlng. Environment*!, Convtruetton, and IT ••rvlcaa
AR300003

BIODEGRADATION TREAT ABILITY STUDY REPORT
BIOTREATABILITY SOIL PILE STUDIES
METACHEM PRODUCTSNEW CASTLE, DELAWARE
Prepared By:
MARCH 2001REF. N0.14246 (1)This report is printed on recycled paper.
Conestoga-Rovers& Associates2055 Niagara Falls BoulevardNiagara Falls, New York 14304
Office: (716)297-6150Fax: (716) 297-2265 AR300004
EXECUTIVE SUMMARY
A Biodegradation Treatability Study Work Plan (BTSWP) for the Standard Chlorine ofDelaware Site (Site) in Delaware City, Delaware was submitted to the United StatesEnvironmental Protection Agency (USEPA) by Harding Lawson Associates (Harding)on May 21,1998. The BTSWP proposed two types of laboratory scale biodegradationtreatability studies: a microcosm study intended to assess the feasibility of usingindigenous microorganisms to degrade the Site Compounds of Concern (COCs) which,if proven feasible, would lead to a column study to evaluate the effectiveness ofbiological and combined biological/physical technologies. On reviewing thepreliminary results of the microcosm study in conjunction with an assessment of thephysical nature of the target soils (soils/sediments in the soil piles and sedimentationbasin, and undisturbed upland vadose zone soils) and the characteristics of the COCs, itwas determined that the experimental design should simulate the application of soilvapor extraction (SVE) and bioventing technologies. A supplement to the BTSWP wasprepared by Harding and submitted to USEPA on October 16,1998. The supplementpresented the experimental design of biopile and bioventing technologies.
Bench-scale soil piles were selected for the experimental design to most closely simulatethese technologies. The soil piles and sediments consolidated in the basin contain veryhigh concentrations of COCs (up to 150,000 milligrams per kilogram [mg/kgj, or15 percent by weight) in a fine-grained mix. The upland soils contain much lower butstill significant concentrations of the COCs, ranging from hundreds to thousands ofmg/Kg. The use of biopiles to treat these soils would allow for both abiotic stripping ofthe COCs as well as aerobic and anaerobic biodegradative processes. In addition, thesoil piles could be manipulated through the use of bulking agents and supplementalinorganic nutrients to improve biological and system performance. The biotreatabilitytests were considered to be remedy screening level tests, and the results were used onlyto establish the feasibility of biological and combined biological/physical treatmenteffectiveness.
The specific objectives of the soil pile experiments were to:
i) evaluate the feasibility of using supplied air to promote aerobic biodegradationof chlorobenzenes;
ii) evaluate the reduction in COC concentrations due to biological activity versusabiotic stripping;
iii) assess the ability of bulking agents and/or nutrients to enhance aerobicbiological processes;
14246 (1) CONESTOGA-ROVERS & ASSOCIATES
AR300005

iv) assess if the soil pile can be converted to anaerobic conditions after the aerationphase and, if so, determine the resulting biological effects on the COCs; and
v) assess whether one or more of the experimental conditions can meet the SiteRecord of Decision (ROD) Criteria for Site Cleanup (USEPA, Standard ChlorineROD, 1995).
The soil pile studies conducted evaluated six different test conditions. Test Condition 1was conducted on upland soils. Test Conditions 2 through 6 were conducted on-Site soilpile materials.
Test Condition 1 - designed to simulate standard bioventing technology in upland soilsusing a constant high airflow rate. Air exiting the soil pile was passed through anadsorptive medium to capture volatilized COCs.
Test Condition 2 - evaluated standard bioventing technology in soil pile materials usinga constant high airflow rate. As described for Test Condition 1, air exiting the soil pilewas passed through an adsorptive medium and the mass of COCs was quantifiedanalytically to provide an estimate of removal via volatilization.
Test Condition 3 - evaluated the impact of adding bulking agents, inorganic nutrients,organic substrate, and microbes in conjunction with reduced airflow rate on COCremoval. A high airflow rate was used for the first month to allow for maximum COCremoval by volatilization and reduce microbial toxicity. The airflow rate was reducedfor the next five months and the system was switched to bioventing treatment.
Test Condition 4 - intended to produce sequential anaerobic and aerobic conditions. Thesoil pile was amended as described for Test Condition 3. A high airflow rate was usedfor the first month to allow for maximum COC removal by volatilization and reducemicrobial toxicity. The soil pile was inundated with water and allowed to stand withoutaeration for three months to enhance anaerobic conditions and reductivedehalogenation. A low airflow rate was used for five months to establish bioventingconditions and allow for aerobic biodegradation.
Test Condition 5 - intended to study the effectiveness of bioventing without the additionof bulking agents, nutrients, and microbes. The soil pile was not amended. A highairflow rate was used for the first month to allow for maximum COC removal byvolatilization and to reduce microbial toxicity. The airflow rate was reduced for the nextfive months to establish bioventing and allow for aerobic biodegradation.
14246 (1) CONESTOGA-ROVERS & ASSOCIATES
AR300006

Test Condition 6 - used as a control test and was not subject to any treatment. It wasincluded in the study for comparison purposes.
All of the Site soils were screened to a uniform size and mixed with hand implements toapparent homogeneity before being placed in the test soil piles. Soil mixing reduced thevariation in COC concentration within individual test piles and provided preliminaryinformation on the effectiveness of material handling techniques for providinghomogeneous soils for future pilot and full-scale treatment evaluations. However, it isexpected that soil mixing and handling facilitated the loss of some COCs byvolatilization.
All six test conditions were conducted for 9.5 months. Air samples from each testcondition were analyzed on a weekly basis. Soil samples were collected each month andanalyzed for COCs. At the end of the test period, the carbon traps were analyzed forCOCs.
All six test conditions, including the control, showed some degree of COCs removal.The removal rates and the main pathway of removal of individual COCs varieddepending on the test conditions. The following conclusions are made based on theresults of the study:
i) the feasibility of using supplied air to promote aerobic biodegradation wasdemonstrated;
ii) both stripping and biological degradation occurred when air was supplied;
iii) the addition of microbial inoculum, nutrients, and bulking agents increased therate of biological degradation;
iv) sequential anaerobic/aerobic treatment enhanced the degradation of the higherchlorinated benzenes; and
v) SVE provided the shortest treatment time for the soil pile soils to reach the____ USEFA ROD cleanup criteria. ____ __________ ____ ____
The USEPA ROD specified cleanup criteria for on-Site soils and sediments at the Sitebased on the findings of the human-health risk assessment. The cleanup criteria werebased on the risk to a future worker and are 625 mg/Kg for total COCs with a ceilingconcentration of 450 mg/Kg for 1,4-dichlorobenzene (DCB). The treated soil must alsopass the Toxiciry Characteristic Leaching Procedure (TCLP) criteria (7.5 milligrams perliter [mg/L] for 1,4-DCB). The rate-limiting component was 1,4-DCB. Therefore, theaerobic treatments that reduced the amount of 1,4-DCB were the most effective
14246 (1) CONESTOGA-ROVERS & ASSOCIATES
AR300007

(11 months for upland soil and 25 months for soil pile soil). High airflow (SVE) reducedthe cleanup time by approximately 1 year when compared to low airflow (bioventing).However, the use of bioventing resulted in higher biodegradation rates of COCs andtherefore would be expected to consume less granular activated carbon.
Under optimized laboratory conditions, SVE and sequential anaerobic/aerobicbiodegradation treatments were shown to be effective as potential remedial alternativesto reduce COC concentrations in the soil and meet cleanup criteria. Field pilot testsusing larger volumes of soil (e.g., 10 to 20 yd3) are therefore recommended.
Two treatment technologies would be tested using the soil pile soils:
i) sequential anaerobic/aerobic degradation (low airflow); and
ii) high airflow SVE.
Sequential anaerobic/aerobic degradation was effective in reducing the concentrationsof all the chlorobenzenes. The chlorobenzenes were degraded biologically to non-toxicproducts. The time to reach the ROD criteria was longer than SVE for the laboratorytest, but times for all treatments are likely to be much longer under field conditions andthe relatively small time improvement for SVE is likely to be lost. SVE requires theinstallation and operation of energy intensive high flow aeration equipment and willgenerate a spent carbon waste stream for disposal. Sequential anaerobic/aerobicdegradation would reduce the equipment cost by reducing the airflow and carbonrequirements.
A plan for the Field Pilot Treatability Test will be developed on the basis of the findingsof this report. The Field Pilot Test Work Plan will be prepared for USEPA's review byApril 30,2001, provided USEPA's comments to this report are provided bymid-April 2001.
i«46 (1) CONESTOGA-ROVERS & ASSOCIATES
AR300008

TABLE OF CONTENTS
Page
EXECUTIVE SUMMARY
1.0 INTRODUCTION.......................,......................^
2.0 OBJECTIVES................................,................................^
3.0 EXPERIMENTAL DESIGN..................................................................................................^
4.0 FIELD SAMPLE COLLECTION........................................................................................... 74.1 SITE SOIL PILES................................................................................................. 74.2 UPLAND SOILS..................................................................................................?
5.0 SOIL PILE STUDY..................................................................................................................85.1 PREPARATION OF TEST SOILS..................................................................... 85.2 SOILCHARACTERIZATION...,......................................................................85.3 EXPERIMENTAL SET-UP.................................................................................95.4 OPERATION OF TREATMENT TANKS...................................................... 105.5 EXPERIMENTAL SAMPLING AND ANALYSIS........................................ 11
6.0 DISCUSSION OF RESULTS................................................................................................ 13
7.0 DATA MANAGEMENT .....................................................................................................167.1 DATA QUALITY OBJECTIVES......................................................................167.2 DATA INTERPRETATION.............................................................................^7.2.1 OBJECTIVE 1..................................................................................................... 167.2.2 OBJECTIVE 2.....................................................................................................177.2.3 OBJECTIVE 3.....................................................................................................177.2.4 OBJECTIVE 4.....................................................................................................187.2.5 OBJECTIVE 5.....................................................................................................18
8.0 CONCLUSIONS................................................................................................................... 20
9.0 RECOMMENDATIONS AND SCHEDULE..................................................................... 21
10.0 REFERENCES....................................................................................................................... 23
14246 (1) CONESTOGA-ROVERS & ASSOCIATES
AR300009

LIST OF FIGURES(Following Text)
FIGURE 5.1 SCHEMATIC OF EXPERIMENTAL SET-UP
FIGURE 5.2 EXPERIMENTAL SET-UP
FIGURE 6.1 ACCUMULATED LOSS OF 1,2-DICHLOROBENZENE
FIGURE 6.2 ACCUMULATED LOSS OF 1,3-DICHLOROBENZENE
FIGURE 6.3 ACCUMULATED LOSS OF 1,4-DICHLOROBENZENE
FIGURE 7.1A 1,4-DICHLOROBENZENE RESULTS - TEST CONDITION 1
FIGURE 7.1B TOTAL CHLOROBENZENE RESULTS - TEST CONDITION 1
FIGURE 7.2A 1,4-DICHLOROBENZENE RESULTS - TEST CONDITION 2
FIGURE 7.2B TOTAL CHLOROBENZENE RESULTS - TEST CONDITION 2
FIGURE 7.3A 1,4-DICHLOROBENZENE RESULTS - TEST CONDITION 3
FIGURE 7.3B TOTAL CHLOROBENZENE RESULTS - TEST CONDITION 3
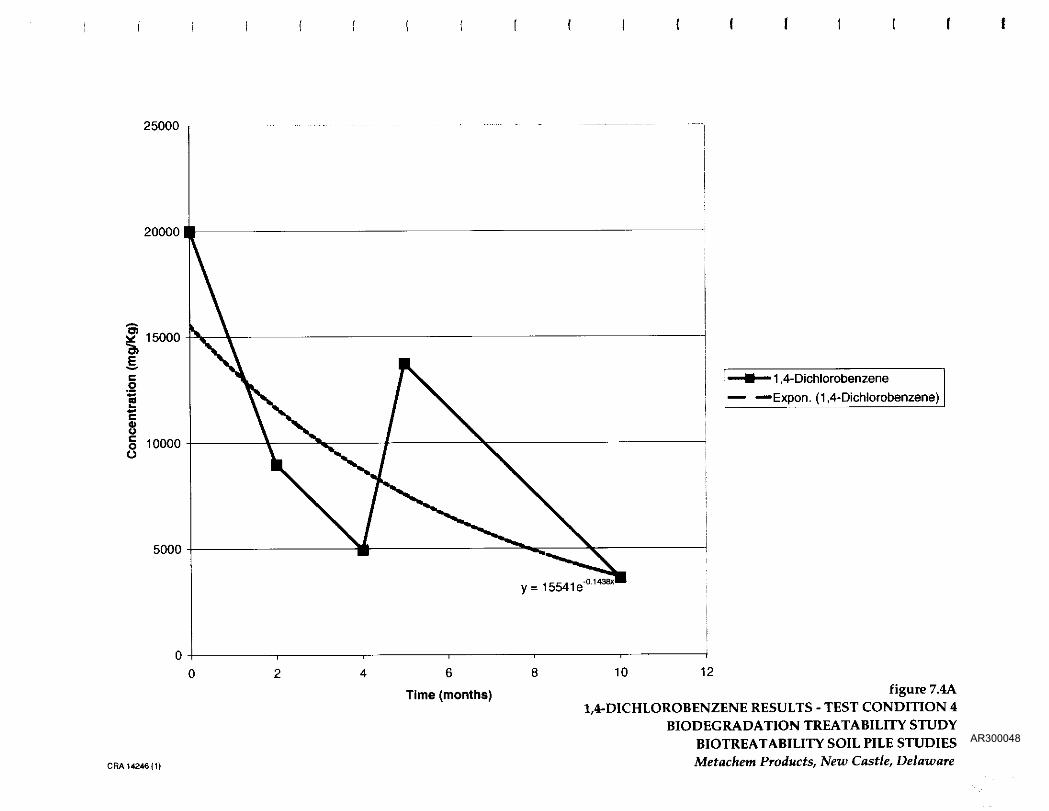
FIGURE 7.4A 1,4-DICHLOROBENZENE RESULTS - TEST CONDITION 4
FIGURE 7.4B TOTAL CHLOROBENZENE RESULTS - TEST CONDITION 4
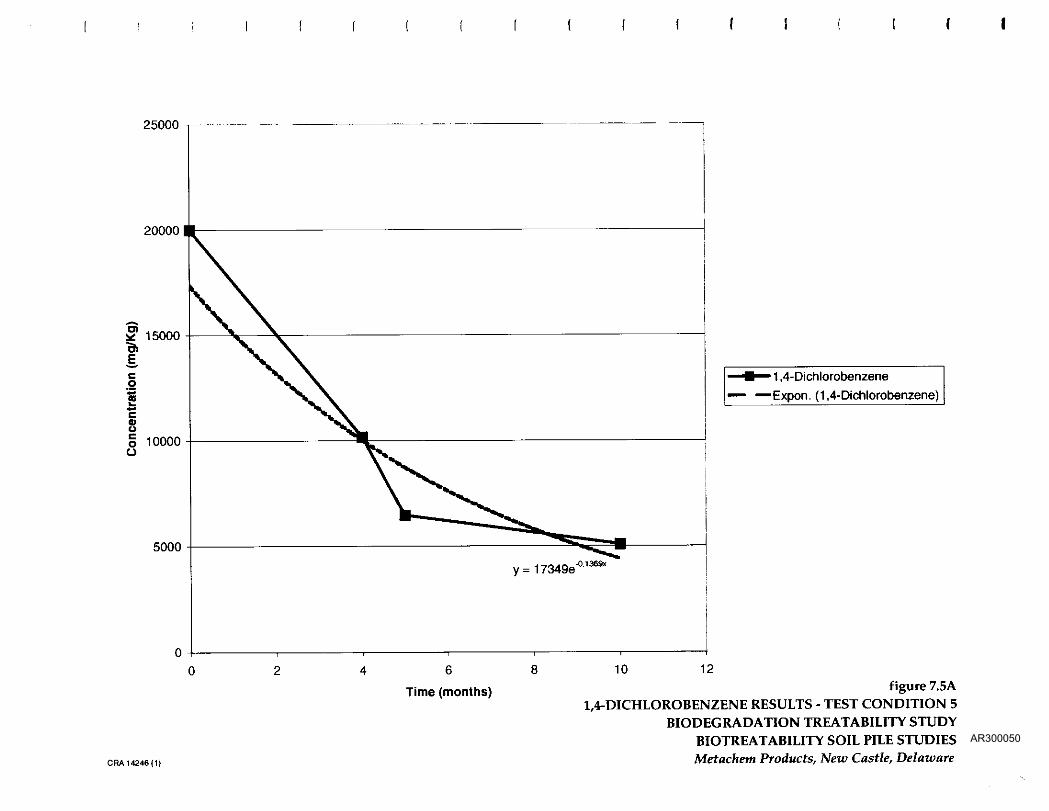
FIGURE 7.5A 1,4-DICHLOROBENZENE RESULTS - TEST CONDITION 5
FIGURE 7.5B TOTAL CHLOROBENZENE RESULTS - TEST CONDITION 5
FIGURE 7.6A 1,4-DICHLOROBENZENE RESULTS - TEST CONDITION 6
TIGURE 7.6B———TOTAL CHLOROBENZENE KHSULTS - TEST CONDITION 6
14246(1) CONESTOGA-ROVERS & ASSOCIATES
AR300010
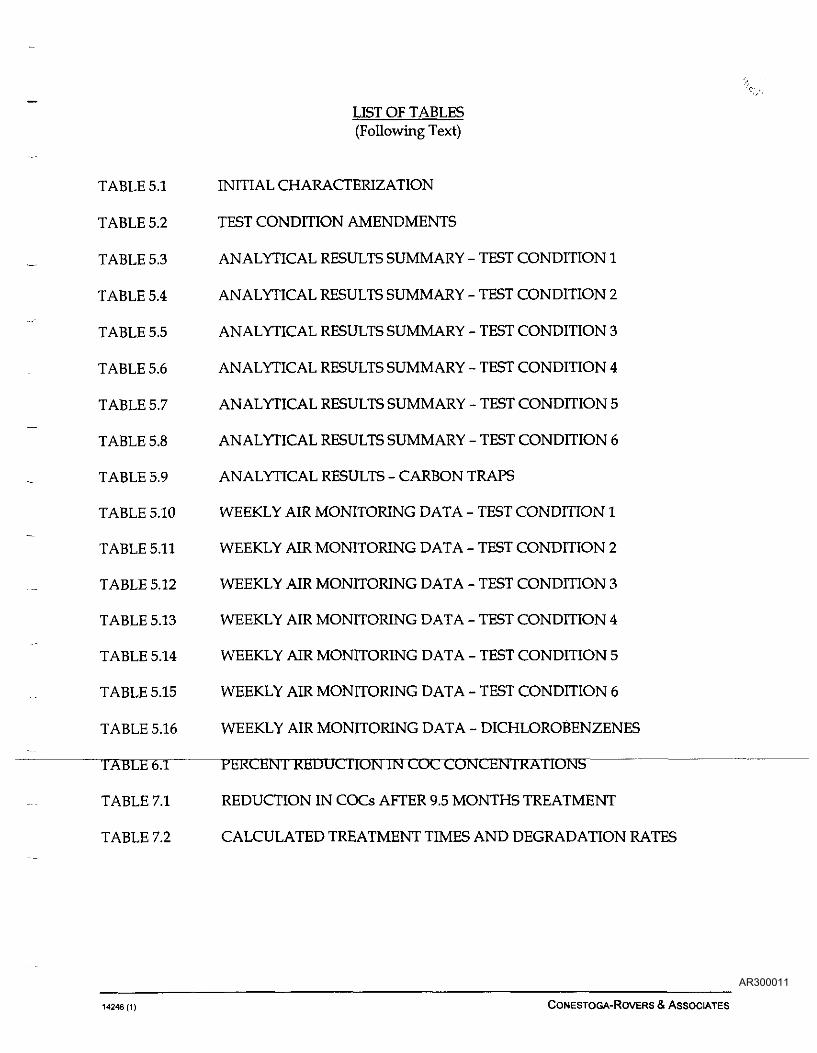
TABLE 5.1
TABLE 5.2
TABLE 5.3
TABLE 5.4
TABLE 5.5
TABLE 5.6
TABLE 5.7
TABLE 5.8
TABLE 5.9
TABLE 5.10
TABLE 5.11
TABLE 5.12
TABLE 5.13
TABLE 5.14
TABLE 5.15
TABLE 5.16
TABLE 6.1 "
LIST OF TABLES(Following Text)
INITIAL CHARACTERIZATION
TEST CONDITION AMENDMENTS
ANALYTICAL RESULTS SUMMARY - TEST CONDITION 1
ANALYTICAL RESULTS SUMMARY - TEST CONDITION 2
ANALYTICAL RESULTS SUMMARY - TEST CONDITION 3
ANALYTICAL RESULTS SUMMARY - TEST CONDITION 4
ANALYTICAL RESULTS SUMMARY - TEST CONDITION 5
ANALYTICAL RESULTS SUMMARY - TEST CONDITION 6
ANALYTICAL RESULTS - CARBON TRAPS
WEEKLY AIR MONITORING DATA - TEST CONDITION 1
WEEKLY AIR MONITORING DATA - TEST CONDITION 2
WEEKLY AIR MONITORING DATA - TEST CONDITION 3
WEEKLY AIR MONITORING DATA - TEST CONDITION 4
WEEKLY AIR MONITORING DATA - TEST CONDITION 5
WEEKLY AIR MONITORING DATA - TEST CONDITION 6
WEEKLY AIR MONITORING DATA - DICHLOROBENZENES
PhKCHNT REDUCTION IN CLXJ CONCENTRATIONS
TABLE 7.1 REDUCTION IN COCs AFTER 9.5 MONTHS TREATMENT
TABLE 7.2 CALCULATED TREATMENT TIMES AND DEGRADATION RATES
14246(1) CONESTOGA-ROVERS & ASSOCIATES
AR300011

LIST OF APPENDICES
APPENDIX A MODIFICATIONS TO EXPERIMENTAL DESIGN
APPENDIX B CHAIN OF CUSTODY
APPENDIX C DATA VALIDATION/USABILITY REPORT
14246(1) CONESTOGA-ROVERS & ASSOCIATES
AR300012

1.0 INTRODUCTION
A Biodegradation Treatability Study Work Plan (BTSWP) for the Standard Chlorine ofDelaware (SCO) Site (Site) in Delaware City, Delaware was submitted to the UnitedStates Environmental Protection Agency (USEPA) by Harding Lawson Associates(Harding) on May 21,1998. The BTSWP proposed two types of laboratory scalebiodegradation treatability studies: a microcosm study intended to assess the feasibilityof using indigenous microorganisms to degrade the Site Compounds of Concern (COCs)which, if proven feasible, would lead to a column study to evaluate the effectiveness ofbiological and combined biological/physical technologies. The results of the microcosmstudy were reported to USEPA in an interim report dated August 28,1998.
On reviewing the preliminary results of the microcosm study in conjunction with anassessment of the physical nature of the target soils (soils/sediments in the soil piles andsedimentation basin, and undisturbed upland vadose zone soils) and the characteristicsof the COCs, it was determined that the experimental design should simulate theapplication of SVE and bioventing technologies. A supplement to the BTSWP wasprepared by Harding and submitted to USEPA on October 16,1998. The supplementpresented the experimental design of SVE and bioventing technologies. USEPAconditionally approved the supplement on December 11,1998 and provided Metachemwith their comments. These comments were addressed in a letter to USEPA fromMetachem dated January 22,1999.
A combination of soil vapor extraction (SVE) and bioventing was chosen for thetreatability testing.
SVE systems rely on abiotic stripping of volatile components to achieve a reduction inthe concentration of chemicals in soil. SVE systems typically use high airflows in aneffort to increase the amount of chemicals stripped from the soil. SVE is capable ofreducing high contaminant concentrations to levels where biological degradation canoccur under bioventing conditions. Bioventing system applications and design, incontrast to SVE systems, utilize soil venting systems for oxygen transfer to stimulate insitu aerobic biodegradation of contaminants rather than contaminant stripping.Bioventing entails the use of low airflows for the transport of oxygen to the subsurface,where indigenous organisms are stimulated to aerobically metabolize organiccomponents. Bioventing systems are designed and configured to optimize oxygentransfer and oxygen utilization efficiency. Bioventing is a biological treatment approachand therefore requires the management of environmental conditions to ensuremaintenance of bioactivity. Management of soil moisture and soil nutrient levels toavoid inhibition of microbial respiration within the vadose zone is necessary and can be
14246 (i) 1 CONESTOGA-ROVERS & ASSOCIATES
AR300013

used to optimize contaminant biode gradation. Bioventing has been used primarily onsites contaminated with hydrocarbon fuels and polyaromatic hydrocarbons(DuPont 1993, USEPA1999).
It has been demonstrated that indigenous soil microbial communities are able tobiodegrade dichlorobenzenes and monochlorobenzene present in the soil under aerobicconditions (Nishino 1993, Thompson 1999). If the aerobic conditions are sustained, themicrobial population will expand and the degradation rates for the mono- anddichlorobenzenes will increase. A soil medium that can promote the diffusion of air oroxygen will allow higher degradation rates than a tight soil that does not allow fordiffusion throughout the matrix. Degradation is also dependent upon the presence ofnitrogen and phosphorus nutrients. These may need to be supplemented in order tomaintain an increased degradation rate. Highly chlorinated aromatic compounds suchas hexachlorobenzene, pentachlorobenzene, terrachlorobenzenes, and trichlorobenzenescan be degraded faster under anaerobic conditions to produce lower chlorinatedbenzenes (Ramanand et al., 1993) by a process known as reductive dehalogenation. Thelower chlorinated benzenes can subsequently be rapidly degraded under aerobicconditions. Anaerobic conditions could be used to degrade the higher chlorinatedbenzenes in the Metachem soil and convert them into low chlorinated compounds whichare readily degradable under aerobic treatment.
The soil piles and sediments consolidated in the basin contain very high concentrationsof COCs (up to 150,000 milligrams per kilogram [mg/kg], or 15 percent by weight) in afine grained mix. The use of biopiles to treat these soils would allow for both abioticstripping of the COCs as well as aerobic and anaerobic biodegradative processes. Theconcentrations of COCs in the upland soils are much lower but still significant, rangingfrom hundreds to thousands of mg/Kg. In selected areas of the Site, upland soils maybe amenable to in situ remedial technologies such as bioventing.
Bench-scale soil piles were selected for the experimental design to most closely simulatethese technologies. In addition, the soil piles were manipulated through the use ofbulking agents and supplemental inorganic nutrients to improve biological and systemperformance. The biotreatability tests were considered to be remedy screening leveltests, and the results were used only to establish the feasibility of biological andcombined biological/physical treatment effectiveness.
In November 1999, Metachem contracted with Conestoga-Rovers & Associates (CRA) tocarry out the work described in the supplement to the BTSWP. CRA reviewed thesupplement and suggested some modifications to improve the original design. The listof modifications and the rationale for each modification were provided to USEPA in a
14246 (1) 2 CONESTOGA-ROVERS & ASSOCIATES
AR300014

letter from Metachem dated January 4, 2000. These modifications are presented inAppendix A.
This report presents a description of the activities conducted during the treatabilitystudy, the results obtained, conclusions, and recommendations for full-scale application.
14246 (1) 3 CONESTOGA-ROVERS & ASSOCIATES
AR300015

2.0 OBJECTIVES
The specific objectives of the soil pile experiments were to:
i) evaluate the feasibility of using supplied air to promote aerobic biodegradationof chlorobenzenes;
ii) evaluate the reduction in COC concentrations due to biological activity versusabiotic stripping;
iii) assess the ability of bulking agents and/or nutrients to enhance aerobicbiological processes;
iv) assess whether the soil pile can be converted to anaerobic conditions after theaeration phase and, if so, determine the resulting biological effects on the COCs;and
v) assess whether one or more of the experimental conditions can meet the SiteRecord of Decision (ROD) criteria for Site cleanup (USEPA, Standard ChlorineROD 1995).
The cleanup levels specified in the ROD for the on-Site soils are 625 mg/Kg for totalCOCs, with a maximum concentration of 450 mg/Kg for 1,4-decachlorobiphenyl(1,4-DCB), specifically. In addition, the treated soil must also pass the Toxicity LeachateCharacteristic Procedure (TCLP) analysis.
14246(1) 4 CONESTOGA-ROVERS & ASSOCIATES
AR300016

3.0 EXPERIMENTAL DESIGN
The soil pile studies conducted evaluated six different test conditions:
Test Condition 1: The first test condition was designed to simulate standard SVEtechnology in upland soils using a constant high airflow rate. Air exiting the soil waspassed through an adsorptive media to capture volatilized COCs. The mass of adsorbedCOCs was quantified analytically to provide an estimate of COCs removed from the soilvia volatilization. This remediation approach is potentially suitable for use at selectedupland portions of the Site.
Test Condition 2: The second test condition evaluated standard SVE technology in soilpile materials using a constant high airflow rate. As described for Test Condition 1, airexiting the soil was passed through an adsorptive media and the mass of COCs wasquantified analytically to provide an estimate of removal via volatilization.
Test Condition 3: hi the field, airflow through the soil pile materials may be limited byconsolidation and compaction that has occurred over a number of years. The third testcondition therefore evaluated the impact of adding bulking agents, inorganic nutrients,organic substrate, and microbes in conjunction with reduced airflow rate on COCremoval. Bulking agents were added to increase the soil permeability. Fertilizers wereadded in solid form to further stimulate biological activity. A high airflow rate wasused for the first month to allow for maximum COC removal by volatilization and toreduce microbial toxicity. The airflow rate was reduced for the next 5 months tomaintain biological activity. This bioventing treatment method was consideredapplicable to the soil pile materials.
Test Condition 4: The fourth test condition used was intended to produce sequentialanaerobic/aerobic conditions. Past studies indicated that as more chlorine atoms aresubstituted on the aromatic ring (i.e., tri- and tetrachlorobenzene), the more difficult it is
____ for the compound to be aerobically metabolized. Standard biopile aeration will onlyenhance the transformation of compounds that can be degraded by aerobicbiodegradative processes. By creating anaerobic conditions within the soil pile, thepoly halo genated chlorobenzenes were expected to be successively dehalogenated byanaerobic metabolic processes. Once air was returned to the system, the lesshalogenated chlorobenzenes were expected to be degraded aerobically. This treatmentmethod was considered applicable to the soil pile materials.
While the transformation from an aerobic to an anaerobic environment may elicit a lagperiod in biological activity, the presence of facultative anaerobes would most likely
U246 (1) 5 CONESTOGA-ROVERS & ASSOCIATES
AR300017

accommodate this major environmental change without appreciable delay. The soil pilewas amended as described for Test Condition 3. A high airflow rate was used for thefirst month to allow for maximum COC removal by volatilization and to reducemicrobial toxicity. The soil pile was then inundated with water and allowed to standwithout aeration for 3 months to enhance anaerobic conditions and reductivedehalogenation. A low airflow rate was subsequently used for 5 months to reestablishaerobic conditions.
Test Condition 5: The fifth test condition was intended to study the effectiveness ofbioventing without the addition of bulking agents, nutrients, and microbes. The soil pilewas not amended. A high airflow rate was used for the first month to allow formaximum COC removal by volatilization and to reduce microbial toxicity. The airflowrate was reduced for the next five months to allow biological activity. This treatmentmethod was considered applicable to the soil pile materials.
Test Condition 6: The sixth test condition was a control test and was not subject to anytreatment. It was included in the study for comparison purposes.
The soil used for Test Condition 1 contained COC concentrations representative of thoseCOC concentrations expected in upland soil. The soil used for Test Conditions 2,3, 4, 5,and 6 contained COC concentrations representative of those concentrations expected inthe existing Site soil piles. All of the soils were screened to a uniform size and mixedwith hand implements to apparent homogeneity before being placed in the test soilpiles. Soil mixing reduced the variation in COC concentration within individual testpiles and provided preliminary information on the effectiveness of material handlingtechniques for providing homogeneous soils for future pilot and full-scale treatmentevaluations. Soil screening, mixing, and handling also enhanced the conditions for COClosses via volatilization.
Each experimental condition was sampled each month over the testing period toevaluate the removal of total COCs. In addition, soil pile gases were collected forestimating COC removal via volatilization and monitoring for biological activity.
Due to the high concentrations of COCs in the soil pile materials (up to 150,000 mg/Kg),the testing program was extended to 9.5 months.
14246 (1) 6 CONESTOGA-ROVERS & ASSOCIATES
AR300018

4.0 FIELD SAMPLE COLLECTION
Sample collection was performed in accordance with the procedures specified in theField Sampling Plan (FSP) and Quality Assurance Project Plan (QAPP). One compositeSite soil pile sample and one composite upland soil sample were collected for use in thePhase I biotreatability soil pile tests. The basis for this sampling rationale was to providesoil samples with high COC concentrations to assess possible inhibitory effects that highconcentration levels might have on degradation rates and to determine if removal couldbe enhanced through physical treatment.
Sample documentation including sample location, collection date and time, and analysiswere recorded on a label affixed to each sample container.
Chain of Custody records were filled out by field and laboratory personnel and includedsample designation, collection date and time, media, and analysis. The Chain ofCustody record accompanied the analytical samples at all times. A copy of the Chain ofCustody for the samples received by CRA are included as Appendix B.
4.1 SITE SOIL PILES
The Site soil pile sample used in the treatability study was collected from soil pile "B"located north of the SCD (Seep 1) facility. The sample was intended to represent thehigh COC concentrations (10,000 to 150,000 mg/Kg) that are present throughout theseexisting soil piles as indicated by the sample results reported in the RemedialInvestigation Report (Weston 1994). The sample was received at the CRA TreatabilityLaboratory in Niagara Falls, New York, in four 55-gallon steel drums onNovember 1,1999.
4.2 UPLAND SOILS
Upland soils used for the soil treatability study were collected from selected uplandlocations that had been shown to historically represent the target concentration range of1,000 to 10,000 mg/Kg. Approximately 100 pounds of soil was collected and packagedin one 55-gallon steel drum. It was received at the CRA Treatability Laboratory onNovember 1,1999.
14246 (1) 7 CONESTOGA-ROVERS & ASSOCIATES
AR300019
5.0 SOIL PILE STUDY
5.1 PREPARATION OF TEST SOILS
Solid pieces of chlorobenzenes (predominantly 1,4-DCB) were known to exist within thesoil piles. These solid pieces were not likely to be bioavailable and were, therefore, lessrelevant to the soil pile biotreatability study. Additionally, it was likely that treatment ofthe soil piles would include mechanical screening to remove these solids as well as otherlarge debris. In order to simulate this screening process, all large solids observed in thesoil samples (the Site soil pile soils and the upland soils) were removed by hand in thelaboratory to the extent practicable prior to testing. The remaining soils were sievedseparately through a #8 (2.36 millimeters [mm]) screen and then each soil was mixedmanually with hand tools to apparent homogeneity. The removed material was storeduntil the end of the experiment and then properly disposed of along with other testmaterials. The final total amount of soil pile material was approximately 400 pounds.
5-2 SOIL CHARACTERIZATION
Once each soil had been homogenized, two four-point composite samples were collectedfrom each homogenized pile. These samples were analyzed for several physical andchemical characteristics including:
i) total organic carbon (TOQ;
ii) ammonia nitrogen and orthophosphate phosphorus;
iii) microbial counts;
iv) water holding capacity;
v) soil moisture content (American Society for Testing and Materials (ASTM)Method D 2216-92); and
vi) concentrations of the following target COCs:
volatile organic compounds (VOCs) - benzene, toluene, chlorobenzene, 1,2-DCB,1,3-DCB, and 1,4-DCB, and
• semi-volatile organic compounds (SVOCs) - 1,2,3- and 1,3,5-trichlorobenzene;1,2,3,4- and 1,2,4,5-tetrachlorobenzene; pentachlorobenzene;hexachlorobenzene; and nitrobenzene.
These analyses followed standard USEPA analytical methodologies, except whereotherwise noted, and the data provided a baseline assessment of COC concentrations
14246 (1) 8 CONESTOGA-ROVERS & ASSOCIATES
AR300020

and background nutrient concentrations. The results of the initial characterization arepresented in Table 5.1.
5.3 EXPERIMENTAL SET-UP
The soil pile tests were conducted at the bench-scale. A schematic of the apparatus isprovided on Figure 5.1. The laboratory set-up is shown pictorially on Figure 5.2.
Each test condition soil pile was assembled in the following manner. A stainless steeltank 12 inches in diameter and 14 inches in height was used for each test condition.Each tank had a 3-inch high rack at the bottom. Below the rack was a spiral copper tubewith air exit holes. A nylon bag slightly larger than 12 inches square was packed with2 pound of glass beads (6 mm in diameter). The bag was placed on the rack and a layerof glass wool was placed on top of the bag. Following screening and mixing, 15 Kg ofthe soil was placed on top of the glass wool. The tank was capped with a stainless steellid. A Teflon gasket was used to seal the lid to the tank. The lid was held in place withclamps. The air inlet was in the middle of the lid. The inlet air was pretreated to removeimpurities by passing it through 20 pound of granular activated carbon (Calgon BPL4x10, Calgon Carbon Corporation, Pittsburgh, PA) in a plastic drum before the air wasintroduced into the tanks. Air was pulled through the soil using a vacuum pump andexited the tank via the copper tube. On the exit side of the soil treatment tank was aflow meter, a pressure gage, and a flow control needle valve. The air then passedthrough a plastic pail containing 2 Kg granular activated carbon and through thevacuum pump.
Airflow through each soil pile was controlled by two valves: one on the flow meter andone on the needle valve. The needle valve was used for fine control of the airflow. Asampling port was placed in-line after the flow meter and before the pressure gage.
Following the screening and mixing of the soil samples, 15 Kg of homogenized uplandsoil was placed in a treatment tank to represent Test Condition 1. For Test Condition 2,15 Kg of homogenized soil from the soil pile was placed in a treatment tank and leftunamended.
The homogenized soil from the soil pile samples used in Test Conditions 3 and 4 wereamended with organic and inorganic nutrients, microbial stock, and a bulking agent.The nutrients used were urea (60 grams) and potassium phosphate, dibasic (18 grains).The purpose of the nutrients was to provide sufficient sources of inorganic nitrogen andphosphorus for microbial metabolism. A liquid solution (1 liter) of microbial culture
14246 (1) 9 CONESTOGA-ROVERS & ASSOCIATES
AR300021

(prepared from in-house proprietary chlorobenzene degrading culture) was prepared ina nutrient medium for 72 hours. The resulting microbial populations in the culture were1.65 x 10s and 3.46 xlO4 colony forming units/milliliter (CFUs/mL) (colony formingunits per milliliter) for the total and specific microbial counts, respectively. The purposeof the microbial addition was to provide metabolically active microorganisms to the testsoil to reduce the lag time before initiation of active metabolism. A bulking agent in theform of vermiculite (1579 grams) was also added to the mixture at a rate ofapproximately 5 percent by weight. Vermiculite has a platelet type structure, highporosity, high void volume to surface area ratio, low density, a large range of particlesizes, and is insoluble in water. The purpose of the bulking agent was to increase thepermeability of the soil and to enhance airflow throughout the soil pile. The abovecomponents were mixed with soil pile soil (30 Kg). The amended soil was divided intotwo equal portions (approximately 16 Kg per pile) to represent Test Conditions 3 and 4,and each portion was placed in a treatment tank.
For Test Condition 5, 15 Kg of homogenized soil from the soil pile was placed in atreatment tank and was not amended with bulking agents or nutrients. It acted as acontrol for Test Conditions 3 and 4.
An unamended sample from the homogenized soil pile soil (15 Kg) was placed in atreatment tank to represent Test Condition 6. This was intended as a control for TestConditions 2,3,4, and 5 and was not amended with bulking agents or nutrients.
The amendments used for each test condition are summarized in Table 5.2. Followingplacement of soil into each of the treatment tanks, two four-point composite sampleswere collected from each tank. These samples were initially analyzed for pH, moisturecontent, TOC, ammonia, nitrate, orthophosphate phosphorus, and microbialpopulations. These data were used as the baseline throughout the test period, and theresults are reported as time T = 0 months in Tables 5.3 through 5.8.
5.4 OPERATION OF TREATMENT TANKS
Test Conditions 1 and 2 were operated under continuous airflow conditions. Airflowwas adjusted to replace a void volume of air in the soil pile 10 times each day.
Test Condition 3 was operated under continuous airflow conditions. Airflow wasadjusted to replace a void volume of air in the soil pile 10 times each day for the firstmonth. The high airflow was necessary to reduce the concentrations of the COCs andreduce their toxicity to the microbial population. After one month the airflow was
14246(1) 10 CONESTOGA-ROVERS & ASSOCIATES
AR300022

adjusted to replace a void volume once per day (10 mL/min) and a microbial culture(750 mL, or 5 percent by weight) containing nutrients (30 grams urea and 9 gramspotassium phosphate) was sprayed onto the soil and mixed with the soil. The total andspecific microbial counts for the culture were 1.39 xlO7 and 1.64 xlO6 CPUs/mL,respectively.
Test Condition 4 was operated under continuous airflow conditions for one month.Airflow was adjusted to replace one void volume of air in the soil pile 10 times each day.After one month the airflow was terminated and a microbial culture (2250 mL)containing molasses (37.5 grams), urea (15 grams), and potassium phosphate (4.5 grams)was sprayed onto the soil and mixed with the soil. The culture additions produced aliquid content in the soil representing 70 percent of the water holding capacity. Thesystem was allowed to stand for three months without any airflow to allow anaerobicdegradation conditions to be maintained. After 3 months the airflow was introduced atthe rate of one void volume per day to initiate bioventing. This airflow was maintainedfor 5.5 months.
Test Condition 5 was operated under the same airflow conditions as Test Condition 3.No amendments were added.
Test Condition 6 was operated as a control with no airflow.
All the test conditions were monitored for a total of 9.5 months. The airflow andamendments for all test conditions are summarized in Table 5.2.
5.5 EXPERIMENTAL SAMPLING AND ANALYSIS
Monthly soil samples were collected from each treatment tank. Two four-pointcomposite samples were collected. One sample was analyzed between months 2.5 and9.5 for VOC and SVOC concentrations. The other sample from each composite wasanalyzed each month for pH, soil moisture, microbial populations, ammonia nitrogen,and orthophosphate phosphorus. These samples were analyzed by the CRA analyticallaboratory. The data are provided in Tables 5.3 through 5.8 (all soils data are presentedon a dry weight basis). The carbon traps from each test condition were analyzed forVOCs and SVOCs at the end of the test period by the Metachem analytical laboratory.The carbon trap data are presented in Table 5.9.
Temperature and airflow were recorded on a weekly basis for each of the testconditions. Air samples were analyzed for oxygen, carbon dioxide, and methane on a
14246 (1) 11 CONESTOGA-ROVERS & ASSOCIATES
AR300023

weekly basis for each test condition using a Land Tec Infrared Gas Analyzer ModelGA-90, Photoionization detector (PID) and Lower Explosive Limit (LEL) readings werealso taken. These data are presented in Tables 5.10 through 5.15. Air samples were alsocollected from the sampling ports (see Figure 5.1) in Tedlar bags and analyzed fordichlorobenzenes on a weekly basis for each test condition. These data are presented inTable 5.16. A sampling pump was used to extract air from Tank 6.
14246(1) 12 CONESTOGA-ROVERS & ASSOCIATES
AR300024

6.0 DISCUSSION OF RESULTS
Table 5.1 shows the results of the initial sample characterization, including generalparameters and COC results. Total chlorobenzene concentrations exceeded20,000 mg/Kg. Review of the general parameter data indicates that the soils hadsufficient moisture content, TOC, ammonia nitrogen, and orthophosphate phosphorusto support microbial degradation. The total microbial population was 1.6 x 10⁵ and4.7 xlO4 CPUs/grams for the soil pile and upland soils, respectively. Chlorobenzene-degrading specific microbial populations were 3.7xlO3 and 2.7xlO3 CPUs/grams,respectively, for the soil pile and upland soils. These counts suggested that both soilscontain healthy microbial populations that can potentially be stimulated. However, theconcentration of 1,4 DCB (20,000 mg/ Kg) in the soil pile soil was likely to causeinhibition of the growth of the microbial population. Therefore, high airflow aerationwas used to reduce the initial 1,4-DCB concentration and reduce potential microbialtoxicity. The chlorobenzene concentrations in the upland soils were lower and were notexpected to cause inhibition of the growth of the microbial population.
Moisture content in Test Condition 1 (the upland soil with high airflow) was reducedover the course of the test, but remained within acceptable range for biodegradation.Ammonia nitrogen and orthophosphate phosphorus were present in sufficientconcentration to support microbial growth, but the microbial population declined. Thedecline in microbial counts followed the decline pattern observed in VOC concentrationssuggesting that die decrease in microbial population may have been the result of thedecrease in the available carbon source. The high airflow was expected to produceabiotic loss by volatilization as the major mechanism for reduction of the COCs.1,4-DCB was reduced by greater than 99 percent over the course of the test (seeTable 6.1). The lack of decline in concentration of the higher chlorinated SVOCs such as1,2,4,5-tetrachlorobenzene and pentachlorobenzene support this mechanism.
Moisture content also declined as expected in Test Condition 2, the soil pile with highairflow, but it was not reduced sufficiently to impact microbial degradation. Nutrientlevels remained relatively stable. The microbial population declined but not to the sameextent as in Test Condition 1. 1,4-DCB was reduced by 86 percent, which left2878 mg/Kg of readily degradable substrate in the soil. Therefore, the lower decrease inmicrobial population was expected. The high airflow produced volatilization as themajor reduction pathway for COCs. Losses of the higher chlorinated benzenes werelow.
The Test Condition 3 moisture content increased at month 4 after the microbial cultureand nutrients were added and the airflow was reduced. The microbial population
U246<1) 13 CONESTOGA-ROVERS & ASSOCIATES
AR300025

increased at month 5, but did not rebound to its original levels. The reduction in airflowreduced the amount of 1,4-DCB removed to 82 percent, showing that abiotic removalhad been inhibited. The trichlorobenzene reductions increased, but the higherchlorinated benzene reduction did not, as expected. The reduced airflow and microbialinoculation increased aerobic degradation but not degradation of the SVOCs.
The Test Condition 4 moisture content followed the same trend as Test Condition 3.Nutrient levels increased after month 3 and so did the microbial population at month 5.The population remained high through the remainder of the test. 1,4-DCB reductionwas the same as in Test Condition 3 (82 percent) reflecting the effect of reduced abioticremoval. The reduction of all the SVOCs increased. The tetrachlorobenzene andpentachlorobenzene reductions increased dramatically demonstrating that anaerobicdegradation had become a significant contributor and that aerobic degradation was alsoenhanced.
Moisture content and microbial population were reduced over the test period in TestCondition 5, suggesting that low airflow alone was not enough to stimulate growth ofthe microbial population. The reduction in 1,4-DCB concentration (74 percent) was thelowest for any of the tests with airflow. This reduction showed that enhanced aerobicdegradation contributed to 1,4-DCB loss in Test Conditions 3 and 4. Trichlorobenzenelosses were similar to the other low airflow tests and, as expected, anaerobic degradationof the higher chlorinated benzenes was not enhanced.
Test Condition 6 was the control without airflow. Moisture content remained constantbut the aerobic microbial population was reduced, suggesting that high COCconcentrations may be a factor in slowing the growth of the microbial population. It islikely that the lack of sufficient air limited microbial growth. The loss of 1,4-DCB was47 percent, showing that abiotic loss was a major pathway for 1,4-DCB reduction. TheSVOCs were reduced to similar levels to those observed in Test Condition 5; therefore,low airflow was not necessary to produce the losses of SVOCs observed.
The carbon trap results give an indication of the COC losses by volatilization that couldbe the result of abiotic reduction. Test Condition 4 resulted in the least COCconcentrations in the carbon trap, reflecting the high microbial activity and confirmingthat biodegradation was the major pathway for COC removal.
The temperature for all test conditions was maintained between 21 and 23 degreeCentigrade (°C) for the duration of the test period. The flows were maintained at theappropriate rates for each test condition. Oxygen remained constant in all the testconditions at approximately 20 percent throughout the test period. It was not recorded
14246(1) 14 CONESTOGA-ROVERS & ASSOCIATES
AR300026

for Test Condition 4 during the anaerobic phase. Carbon dioxide, methane, and LELwere not detected in any test condition during the test period, except for carbon dioxidein Test Condition 4, which was detected above 2 percent after 30 weeks reflecting theenhanced microbial activities. FID readings were performed with a meter calibratedwith isobutylene therefore the amounts detected cannot be directly related to the likelylevels of chlorobenzenes in the air, but the measured concentrations can be used forcomparison purposes. FID readings in Test Condition 1 decreased from 600 to 250 partsper million (ppm) over the test period. They decreased in Test Condition 2 from greaterthan 2000 to 929 ppm over the test period. Test Conditions 3, 4, and 5 FID readingsdecreased from greater than 2000 to 380, 876, and 950 ppm, respectively. TestCondition 6 decreased from greater than 2000 to 1910 PPM. The results show that stableaerobic conditions were maintained in all the test conditions over the course of the test,except for Test Condition 4 during its anaerobic period. Volatile organic levels in theoutlet airflow dropped by more than 50 percent in all the active test conditions. TestConditions showed the greatest decrease. A small decrease was observed in thecontrol.
The concentrations of the dichlorobenzenes in the outlet airflow that contacted the soildecreased in all test conditions over the test period. Figures 6.1 through 6.3 representthe accumulated loss of the dichlorobenzenes over the test period. As expected, thelosses were higher over the first 4 to 5 months of the tests. Total DCB losses for the testperiod ranged from approximately 300 mg for the upland soils (Test Condition 1) toapproximately 2000 mg for some soil pile test conditions. However, the air quality datawas not sufficiently reliable to allow for mass balance calculations. Test Condition 5appeared to generate the highest levels of dichlorobenzenes, which is not consistent withthe soils analysis data.
14246(1) 15 CONESTOGA-ROVERS & ASSOCIATES
AR300027

7.0 DATA MANAGEMENT
7.1 DATA QUALITY OBTECTIVES
Data collected during the soil pile study was used for screening purposes only.Screening data provide analyte identification and quantification, although thequantification may be imprecise (USEPA1993). The Quality Assurance/Quality Control(QA/QC) elements, specified in USEPA 1993, were a part of the data collection processand are discussed in the data validation/usability report (presented as Appendix C).The data quality was assessed based on final sample results, laboratory blank results,laboratory duplicates, blank spike, and surrogate recoveries. Significant quality controlproblems were not observed during the review and sample results reported were judgedacceptable for their intended use.
7.2 DATA INTERPRETATION
The data obtained during the soil pile experiments were used to evaluate each testcondition described in Section 3.0. This section evaluates the data in terms of how theysatisfy each of the study objectives.
7.2.1 OBTECTIVE1
Objective 1 of the study was to evaluate the feasibility of using supplied air to enhancethe removal of chlorobenzenes by SVE and biodegradation.
Supplied air was used in Test Conditions 1 through 5 to promote SVE and aerobicdegradation of chlorobenzenes. When airflow alone was the treatment, a high airflow(Test Conditions 1 and 2) was more effective than low airflow (Test Condition 5) for theremoval of 1,4-DCB. The low airflow was equally effective at treating the higher
————chlorinated benzenes. Microbial populations were decreased over the course of the-test^for all three Test Conditions 1, 2, and 5. This may have been due to the reduction in thechlorobenzene concentration, reflecting the depletion of available carbon source. Thecarbon dioxide and methane evolution levels in the outlet airflow were too low (belowpercent levels) to be detected by the analytical equipment employed, suggesting thatvolatilization was the major pathway in the DCB removal under these test conditions.
14246 (1) 16 CONESTOGA-ROVERS & ASSOCIATES
AR300028

7.2.2 OBJECTIVE 2
Objective 2 of the study was to evaluate the reduction in COC concentrations due tobiological activity versus abiotic stripping.
The results of the analyses of the carbon traps, the FID readings, and DCB analyses onair emitted from the soil all showed that abiotic stripping occurred in all 5 active testconditions (see Tables 5.9 through 5.16). The concentrations of chlorobenzenes trappedon the carbon show that the dichlorobenzenes were the most likely to be lost bystripping, although the higher dichlorobenzenes were also lost but in smaller amounts.The difference between the COC mass removed in the vent stream and the total massremoved from the test soil was calculated and is shown in Table 7.1. This amount wasassumed to be the amount lost by abiotic processes. It was assumed that the remainderof the COC loss in each test condition was by biological degradation. Forty-threepercent of the total COCs were lost by stripping from Test Condition 1 as compared to15 percent from Test Condition 2. However, approximately the same amount of COCswas lost from both test conditions showing that airflow and not concentration was thelimiting factor for abiotic loss. For Test Condition 5, 14 percent of the COCs was lostsuggesting that low and high airflow did not have a large affect on abiotic loss. Theaddition of a bulking agent increased the loss to 19 percent, showing that improvedairflow increased abiotic loss. Test Condition 4 showed only a 4.7 percent loss; this testincluded a period without aeration; therefore, there was less time for stripping to occur.This period enhanced biological degradation, which may also account for the lowerpercentage of COCs found on the carbon. A detailed evaluation of the mechanisms ofabiotic losses is beyond the scope of the experimental goals and is not presented.
7.2.3 OBJECTIVES
Objective 3 of the study was to assess the ability of bulking agents and/or nutrients toenhance aerobic biological processes.
Test condition 3 was amended with a microbial culture, nutrients, and a bulking agent(vermiculite). A high airflow was used during the first month, after which time a lowairflow was used. Test Condition 5 was run under identical conditions except that itwas not amended. Comparison of the percent reduction of the COCs in the two testconditions showed that 1,4-DCB decreased by 82 percent and 74 percent in TestConditions 3 and 5, respectively. The SVOC concentrations decreased by very similaramounts, but Test Condition 5 decreases were slightly greater for several of the SVOCs.
14246{1) 17 CON ESTOGA-ROVERS & ASSOCIATESAR300029

These data indicate that the aerobic degradation of the VOCs may have been enhancedby the amendments whereas degradation of the SVOCs was not enhanced.
7.2.4 OBJECTIVE 4
Objective 4 of the study was to assess whether the soil pile can be converted to anaerobicconditions after the aeration phase and, if so, to determine the resulting biological effectson the COCs.
Test Condition 4 was allowed to stand without airflow during months 2 through 4 of thestudy. This dormant period was intended to encourage the establishment of anaerobicconditions, which are known to enhance the degradation of the higher chlorinatedbenzenes. Test Condition 4 was amended and can be compared to Test Condition 3 todetermine the biological effects resulting from the dormant phase. As expected, thepercent reduction of 1,4-DCB in both test conditions was approximately the same(82 percent). The reduction of trichlorobenzenes was slightly higher in Test Condition 4.However, the reduction in the higher chlorinated benzenes such as tetrachlorobenzenesand pentachlorobenzene was significantly improved. The reduction of1,2,3/4-tetrachlorobenzene, 1,2,4,5-tetrachlorobenzene, and pentachlorobenzeneincreased by 16, 22, and 30 percent, respectively, in Test Condition 4 compared to TestConditions. Therefore, the enhancement of anaerobic conditions significantlystimulated reductive dechlorination and did not adversely impact the subsequentaerobic degradation.
7.2.5 OBJECTIVES
Objective 5 of the study was to assess whether one or more of the experimentalconditions can meet the Site ROD criteria for Site cleanup (USEPA, Standard ChlorineROD 1995).
All six test conditions, including the control, showed some degree of COCs removal (seeTable 6.1). The removal rates and the main pathway of removal of individual COCsvaried depending on the test conditions. The USEPA ROD specified cleanup criteria foron-Site soils and sediments at the Site based on the findings of the human-health riskassessment (see Section 5.3.3, p.16 of the ROD). The cleanup criteria were based on therisk to a future worker and are 625 mg/Kg for total COCs with a ceiling concentration of450 mg/Kg for 1,4-DCB. Also, the on-Site soils must pass the TCLP analysis.
14246(1) 18 CONESTOGA-ROVERS & ASSOCIATES
AR300030

The data generated by this study were used to estimate the concentrations of total COCsand 1,4-DCB versus time using regression analysis. These data are presented onFigures 7.1 through 7.6. The regression curves were used to calculate removal rates forCOCs and 1,4-DCB, and to predict the time required for each of the test conditiontreatments to reach the cleanup criteria. The calculated treatment times and estimateddegradation rates for each test condition are shown in Table 7.2. These times have beencalculated to allow comparison of the different treatments. They should not be used topredict the actual field cleanup times because they were obtained under optimizedlaboratory conditions and actual field conditions will affect them. Also, it would benecessary for the soil to meet the TCLP criteria in order to fulfill all cleanup criteria. The"20 Rule" was used for the purposes of this analysis i.e., it was assumed that if theconcentration of 1,4-DCB in mg/Kg was below 20 times the TCLP criterion (7.5 mg/L),then it was likely that the sample would pass the TCLP test.
Test Condition 1, the upland soil, would meet either the USEPA ROD health basedcleanup criteria or the TCLP criteria after 11 months of treatment. The soil pile soiltreated by Test Condition 2 would meet the USEPA ROD health based cleanup criteriaafter 19 months. This treatment would take an additional 6 months (total 25 months) toreach the TCLP criteria. Test Conditions 3,4, and 5 would meet the USEPA criteria after21,25, and 27 months, respectively. In order to reach the TCLP criteria, these treatmentswould require 28, 33, and 35 months, respectively. The control (no amendments butmaintained under anaerobic conditions) would meet the USEPA criteria after 65 monthsand the TCLP criteria after 83 months. It is likely that the treatment duration under fieldconditions would be much longer than these estimations because of the aggressive soilprocessing (soil sieving and mixing) prior to use. Soils in their natural condition maynot be as responsive to aeration due to the lack of pathways for aeration in a moreconsolidated soil mass. The results of field pilot tests will be used to determine theduration of treatment for more consolidated soil.
14246 (1) 19 CONESTOGA-ROVERS & ASSOCIATES
AR300031

8.0 CONCLUSIONS
The following conclusions are made based on the results of the study:
i) the feasibility of using supplied air to promote aerobic biodegradation wasdemonstrated;
ii) both abiotic stripping and biological degradation occurred when air wassupplied;
iii) the addition of microbial inoculates, nutrients/ and bulking agents increased therate of aerobic degradation;
iv) the addition of molasses, inundating the soil, and removing the airflow for aperiod enhanced the reductive dechlorination of the higher chlorinatedbenzenes. Subsequent aerobic degradation was not adversely affected; and
v) the high airflow condition provided less biodegradation but the shortest time forthe soil pile soils to reach the USEPA ROD or TCLP cleanup criteria. Under theexperimental laboratory conditions, the treatment duration to meet TCLP criteriawas approximately 11 months for the Upland soil and up to 3 years for the soilpile soil, which could be compared to 7 years for untreated soil in the control test.
The rate-limiting component is 1,4-DCB and therefore, the treatments that reduce theamount of 1,4-DCB are the most effective. High airflow reduced the cleanup time byapproximately 1 year when compared to low airflow. An evaluation of the cost of highairflow versus low airflow relative to cleanup time will be considered through the fieldpilot test stage of this project. The addition of microbial cultures, nutrients, and bulkingagents is recommended for the low airflow test. The development of specific designinformation is beyond the scope of the experimental goals and is not presented.
14246(1) 20 CON ESTOGA- ROVERS & ASSOCIATES
AR300032
9.0 RECOMMENDATIONS AND SCHEDULE
Under optimized laboratory conditions, SVE, and sequential anaerobic/aerobicbiodegradation treatments were shown to be effective as potential remedial alternativesto reduce COC concentrations in the soil and meet cleanup criteria. Field pilot testsusing larger volumes of soil (e.g., 10 to 20 yd3) are therefore recommended.
Two treatment technologies would be tested using the soil pile soils:
i) sequential anaerobic/aerobic degradation (low airflow); and
ii) high airflow SVE.
A control study with no treatment would also be included in order to allow comparisonof the results of the pilot studies.
Sequential anaerobic/aerobic degradation was effective in reducing the concentrationsof all the chlorobenzenes. The chlorobenzenes were degraded biologically to non-toxicproducts. The time to reach the ROD criteria was longer for the laboratory test, buttimes for all treatments are likely to be longer under field conditions and the relativelysmall time improvement for SVE is likely to be lost. SVE requires the installation andoperation of energy intensive high flow aeration equipment and will generate a spentcarbon waste stream for disposal. Sequential anaerobic/aerobic degradation wouldreduce the equipment cost by reducing the airflow and carbon requirements.
The pilot tests would be performed in order to:
i) assess treatment effectiveness under field conditions;
ii) assess reliability of the process and potential problems during scale-up (e.g., airchanneling);
iii) assess treatment duration;iv) assess capital and operation costs;v) develop/identify appropriate methods for large-scale soil handling (screening,
mixing, irrigation/nutrient supplementation, etc.);
vi) determine the optimum design parameters;
vii) develop full-scale design; and
viii) assess the cost of the full scale treatment.
14246 (1) 21 CONESTOGA-ROVERS & ASSOCIATES
AR300033
A plan for the Field Pilot Treatability Test will be developed on the basis of the findingsof this report. The Field Pilot Test Work Plan will be prepared for USEPA's review byApril 30,2001, provided USEPA's comments to this report are provided bymid-April 2001.
14246 (1) 22 CONESTOGA-ROVERS & ASSOCIATES
AR300034

10.0 REFERENCES
. Dupont R.R. 1993. "Fundamentals of Bioventing Applied to Fuel ContaminatedSites." Environmental Progress, 12, p. 45.
• Harding Lawson Associates. 1998. "Supplement to Biodegradation TreatabilityStudy Work Plan (BTSWP) Phase I: Biotreatability Soil Pile Studies."
. Nishino S.F., J.C. Spain, and C.A. Pettigrew. 1994. "Biodegradation ofChlorobenzene by Indigenous Bacteria." Environmental Toxicology and Chemistry,13, p. 871.
. Ramanand K., M.T. Balba, and J. Duffy. 1993. "Reductive Dehalogenation ofChlorinated Benzenes and Toluenes under Methanogenic Conditions." Applied andEnvironmental Microbiology, 59, p. 3266.
• Thompson I.P., M.J. Bailey, E.M. Boyd, N. Maguire, A.A. Meharg, and RJ, Ellis.1999. "Concentration of 1,2-Dichlorobenzene on Soil Microbiology." EnvironmentalToxicology and Chemistry, 18, p. 1891.
USEPA, Solid Waste and Emergency Response. August 1999, "Bioventing forEnhanced Degradation of PAHs." USEPA 542-N-99-005. Tech Trends, Issue 34, p. 3.
. USEPA. Record of Decision, Standard Chlorine Delaware Site. March 9,1995.
USEPA, Office of Solid Waste and Emergency Response. September 1993. "DataQuality Objectives Process for Superfund." USEPA 540-R-93-071.
Weston. 1994. Remedial Investigation Report.
14246(1) 23 CONESTOGA-ROVERS & ASSOCIATES
AR300035

AR300036

CARBON TRAP20 POUNDS
ACTIVATED CARBON
TREATMENT No 2
TREATMENT No 3
TREATMENT Ho t
TREATMENT No. S
CARBON TRAP2 GAILON CAPACITY
CARBON TRAP2 GALLON CAPACrV
CARBON TRAP2 GALLON CAPACTTY
CARBOW TRAPGALLON CAPACITY
VACUUM PUMB
TO ATMOSPHERE
LEGEND
Fl FLOW INDICATOR
PI PRESSURE INDICATOR
SP GAS SAMPLING PORT
figure 5.1SCHEMATIC OF EXPERIMENTAL SET-UP
BENCH-SCALE BIODEGRADATION TREATABILITY STUDYMETACHEM PRODUCTS
Newcastle, Delaware
14246-00(001 )GN-NF001 WAR 26/2001
AR300037

figure 5.2EXPERIMENTAL SET-UP
BIODEGRADATION TREATABILITY STUDYMETACHEM PRODUCTS
Newcastle, Delaware14246-00(001)GN-NF002 MAR 26/2001 AR300038

160 T
140
120
100
sO
0)QCO)
"w
< Test Condition 1• Test Condition 2A Test Condition 3» Test Condition 4)K Test Condition 5
CRA 14246(1)
10 12figure 6.1
ACCUMULATED LOSS OF 1,2-DICHLOROBENZENEBIODEGRADATION TREATABILITY STUDY
BIOTREATABILITY SOIL PILE STUDIESMetachem Products, New Castle, Delaware
AR300039

100
Test Condition 1Test Condition 2Test Condition 3Test Condition 4Test Condition 5
6Months
CRA 14246(1)
10 12figure 6.2
ACCUMULATED LOSS OF 1,3-DICHLOROBENZENEBIODEGRADATION TREATABILITY STUDY
BIOTREATABILITY SOIL PILE STUDIESMetachem Products, New Castle, Delaware
AR300040

2500 i
2000
1500<DO
0)CCD)
1000
500
• Test Condition 1• Test Condition 2A • Test Condition 3• Test Condition 4)K Test Condition 5
6Months
CRA 14246(1)
10 12figure 6.3
ACCUMULATED LOSS OF 1,4-DICHLOROBENZENEBIODEGRADATION TREATABILITY STUDY
BIOTREATABILITY SOIL PILE STUDIESMetachem Products, New Castle, Delaware
AR300041

Con
cent
ratio
n (m
g/Kg
)
AR300042

Con
cent
ratio
n (m
g/Kg
)
AR300043

Con
cent
ratio
n (m
o/Kg
)
AR300044

Con
cent
ratio
n (m
g/Kg
)
AR300045

Con
cent
ratio
n (m
g/Kg
)
AR300046

Con
cent
ratio
n (m
g/Kg
)
§C7
1O O
O
O
ro m o o o
AR300047
Con
cent
ratio
n (m
g/Kg
)
AR300048

oo
Con
cent
ratio
n (m
g/Kg
)
o
m so
o
ro Ul 8 o
AR300049
Con
cent
ratio
n (m
g/Kg
}_L
-A
O
Ul
o S
CD
ro 01 o o o
AR300050

Con
cent
ratio
n (m
g/Kg
)
AR300051

Con
cent
ratio
n (m
g/Kg
)
AR300052

Con
cent
ratio
n (m
g/Kg
)
AR300053

AR300054

TABLES.!
INITIAL CHARACTERIZATIONBIODEGRADATION TREAT ABILITY STUDY
BIOTREATABIUTY SOIL PILE STUDIESMETACHEM PRODUCTS
NEW CASTLE, DELAWARE
Parameters
VOCs
BenzeneTolueneChlorobenzene1.2-Dichlorobenzene13-Dichlorobenzene1.4-Dichlorobenzene
SVOCs
1,2 -Trichlorobenzene1,2,4-Trichlorobenzenei;3,5-Trichlorobenzene1,23,4-Tetrachlorobenzene1,2,4,5-TetrachlorobenzenePentachlorobenzeneHexachlorobenzeneNitrobenzene
General Chemistry
PHMoisture ContentTotal Organic CarbonAmmonia NitrogenOrthophosphate PhosphorusWater Holding CapacityTotal Microbial PopulationSpecific Microbial Population
Sample ID:
Collection DateUnits
Soil Pile Soil Pile(Duplicate)
11AW
mg/Kgmg/Kgmg/Kgmg/Kgmg/Kgmg/Kg
ND50ND50ND50
66ND50
20000
mg/Kgmg/Kgmg/Kgmg/Kgmg/Kgmg/Kgmg/Kgmg/Kg
150470
ND8.316023350.90J
ND8.3
s.u.
mg/Kgmg/Kg
%CFUs/gmCFUs/gm
5.518.76.2172.67.852.31.8x10*4-OxlO3
160470
ND8.315023340.63J
ND8.3
5.5196.2160.5847.71.4x10*3-SxlO3
Upland Soil
11/1W9
ND25ND25ND25
67017440
120040000.67J55086210.25J
ND8.3
5.715.43.1109.57.340.74.4x10*S.lxIO3
Upland Soil(Duplicate)
130040000.67J47093200.20]
ND8.3
5.615.33.1110.87.344.44.9xl04
2.2X10³
Notes:CPUsJNDS.U.SVOCsVOCs
Colony Forming UnitsEstimatedNon-detect at associated valueStandard UnitsSemi-volatile organic compoundsVolatile organic compounds AR300055

Initial Amendments
TABLE 5.2
TEST CONDITION AMENDMENTSBIODEGRADATION TREATABILITY STUDY
BIOTREATABILITY SOIL PILE STUDIESMETACHEM PRODUCTS
NEW CASTLE, DELAWARE
TestCondition
1
2
3
4
5
6
Soil
(Kg)
15
15
15
15
15
15
Carbon
(Kg)
2.3
2.3
2.3
2.3
2.3
0
Month 1(mL/min)
100
100
100
100
100
0
Air FlowMonths 2-4(mL/min)
100
100
10
0
10
0
NutrientsMonths 5-9.5
(mL/min)
100
100
10
10
10
0
Urea(S)0
0
30
30
0
0
Phosphorus
(g)0
0
9
9
0
0
Vermiculite
(S)0
0
790
790
0
0
MicrobialCulture
(mL)
0
0
500
500
0
0
Molas
(g)0
0
0
0
0
0
Supplemental Amendments after 4 Months
3
4
30
30
9
9
0
0
750
2250
75
75
CRA 14246(1)
AR300056

TABLE 5.3 Page 1 of 2
ANALYTICAL RESULTS SUMMARY - TEST CONDITION 1BIODEGRADATION TREATABILITY STUDY
BIOTREATABILITY SOIL PILE STUDIESMETACHEM PRODUCTS
NEW CASTLE, DELAWARE
VOCs
Benzene mg/KgToluene mg/KgChlorobenzene mg/Kg1.2-Dichlorobenzene mg/Kg1.3-Dichlorobenzene mg/Kg1.4-Dichlorobenzene mg/Kg
SVOCs
1.23-Trichlorobenzene1.2.4-Trichlorobenzene1,3/5-Trichlorobenzenel,2A4-Tetraehlorobenzenel,2A5-TetrachlorobenzenePentachlorobenzeneHexachlorobenzeneNitrobenzene
General ChemistrypH S.U.Moisture Content %Ammonia Nitrogen mg/LOrthophosphate Phosphorus mg/LTotal Microbial Population CFUs/mLMix Specific Microbial Population CFUs/mL
ND25ND25ND25
67017440
mg/Kgmg/Kgmg/Kgmg/Kgmg/Kgmg/Kgmg/Kgmg/Kg
120040000.67J55086210.25J
ND8.3
5.614.74.12.84.2x10*
ISxlO3
ND 117ND117ND117
258ND117
269
ND 116ND116ND116
92]ND116ND116
ND6ND6ND6
83ND6ND6
ND11ND11ND 11
58ND11ND11
5.414.5
2.64.4x10*
S.lxlO3
5.514.6
0.058.3X103
1.6X10³
3581272
ND10220649.9
ND10ND10
4811065
ND102632610
ND 10ND 10
5.413.5
ZOxlO3
1.4X10³
5.112.7
13.94.3X103
5-OxlO2
AR300057

TABLE 5.3 Page 2 of 2
ANALYTICAL RESULTS SUMMARY - TEST CONDITION 1BIODEGRADATION TREAT ABILITY STUDY
BIOTREATABILITY SOIL PILE STUDIESMETACHEM PRODUCTS
NEW CASTLE, DELAWARE
VOCs
BenzeneTolueneChlorobenzene1.2-Dichlorobenzene1.3-Dichlorobenzene1.4-Dichlorobenzene
SVOCs
1,2 -Trichlorobenzene1,2,4-Trichlorobenzene133-Trichlorobenzene1,23,4-Tetrachlorobenzenel,2A5-TetrachlorobenzenePentachlorobenzeneHexachlorobenzeneNitrobenzene
General Chemistry
pHMoisture ContentAmmonia NitrogenOrthophosphate PhosphorusTotal Microbial PopulationMix Specific Microbial Population
mg/Kgmg/Kgmg/Kgmg/Kgmg/Kgmg/Kg
ND12ND12ND12
11ND12
7.6
ND11ND11ND11MD11ND11
19
ND5ND5ND5ND5ND5
74
ND46ND46ND46ND46ND46
53
ND46ND46ND 46ND46ND46
1.5
mg/Kgmg/Kgmg/Kgmg/Kgmg/Kgmg/Kgmg/Kgmg/Kg
296957
ND102656311
ND10ND10
333734
ND102648119
ND10ND10
4641189
ND103457115
ND10ND10
311842
ND8.31%729.3
ND10ND8.3
217490
ND8.31947211
ND10ND8.3
S.U.%
mg/Lmg/L
CFUs/mLCFUs/mL
5.213.2477.32.3X103
13x10*
5.212.8523.41.9x10*5-SxlO2
5.212.35114.31.9X103
7.0X10²
13.35.312.3476.02.5x107.5x10
Notes:Blank entries indicate data not available.CPUs Colony Forming Units.J Estimated.ND Non-detect at associated value.S.U. Standard units.SVOCs Semi-volatile organic compounds.VOCs Volatile organic compounds.
CRA 142« (1)
AR300058

TABLE 5.4 Page 1 of 2
ANALYTICAL RESULTS SUMMARY - TEST CONDITION 2BIODEGRADATION TREATABILTTY STUDY
BIOTREATABILITY SOIL PILE STUDIESMETACHEM PRODUCTS
NEW CASTLE, DELAWARE
Parameters
VOCsBenzeneTolueneChlorobenzene1.2-Dichlorobenzene1.3-Dichlorobenzene1.4-Dichlorobenzene
SVOCs1^3-Trichlorobenzene1 ,4-Trichlorobenzene1,3,5-Trichlorobenzene1,23,4-Tetrachlorobenzene1^4,5-TetrachlorobenzenePentachlorobenzeneHexachlorobenzeneNitrobenzene
General ChemistrypHMoisture ContentAmmonia NitrogenOrthophosphate PhosphorusTotal Microbial PopulationMix Specific Microbial Population
Time (months)Collection Date
Units
312/2Q/99
2.5
mg/Kgmg/Kgmg/Kgmg/Kgmg/Kgmg/Kg
mg/Kgmg/Kgmg/Kgmg/Kgmg/Kgmg/Kgmg/Kgmg/Kg
ND50ND50ND50
66ND50
20000
150470
ND8.316023350.90J
ND8.3
s.u.
mg/Lmg/L
CFUs/mLCFUs/mL
5.717.8
2.81.6X105
3.7X10³
ND120ND120ND 120ND120ND120
6960
ND119ND119ND 119ND 119ND119
3819
ND 122ND 122ND 122ND122ND 122
4645
5.617.5
2.91.7X105
S.lxlO3
5.617.4
2.51.2xl04
2.7X10³
57203
ND1093
ND1023
ND10ND10
61171
ND10947.521
ND10ND 10
5.516.2
S.SxlO3
2.9X10³
52
9.9
1.3x105.5x10
AR300059
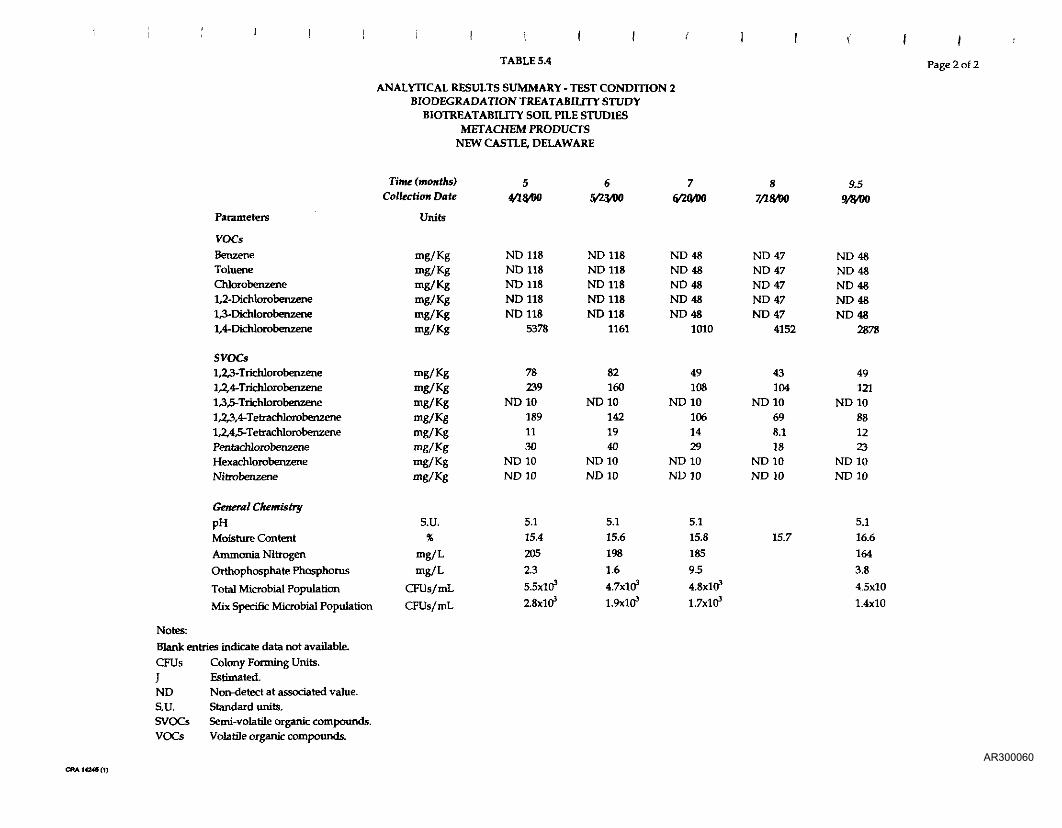
TABLE 5.4 Page 2 of 2
ANALYTICAL RESULTS SUMMARY - TEST CONDITION 2BIODEGRADATION TREATABIUTY STUDY
BIOTREATABILITY SOIL PILE STUDIESMETACHEM PRODUCTS
NEW CASTLE, DELAWARE
Parameters
VOCsBenzeneTolueneChlorobenzene1.2-Dichlorobenzene1.3-Dkhlorobenzene1.4-Dichlorobenzene
SVOCs1,2^-TrichlorobenzenelA4-Trichlorobenzene13,5-Trichlorobenzene1,2 ,4-Tetrachlorobenzene1,2,4,5-TetrachlorobenzenePentachlorobenzeneHexachlorobenzeneNitrobenzene
General ChemistrypHMoisture ContentAmmonia NitrogenOrthophosphate PhosphorusTotal Microbial PopulationMix Specific Microbial Population
Notes:Blank entries indicate data not available.CPUs Colony Forming Units.J Estimated.ND Non-detect at associated value.S.U. Standard units.SVOCs Semi-volatile organic compounds.VOCs Volatile organic compounds.
Time (months)Collection Date
Units
54A8/M
65 00
87/18/00
9.5W8/W
mg/Kgmg/Kgmg/Kgmg/Kgmg/Kgmg/Kg
mg/Kgmg/Kgmg/Kgmg/Kgmg/Kgmg/Kgmg/Kgmg/Kg
ND 118ND118ND118ND118ND118
5378
78239
ND101891130
ND10ND10
ND118ND118ND118ND118ND118
1161
82160
ND101421940
ND10ND10
ND48ND48ND48ND48ND48
1010
49108
ND101061429
ND 10ND10
ND47ND47ND47ND47ND47
4152
43104
ND10698.118
ND 10ND10
ND48ND48ND48ND48ND48
2878
49121
ND10881223
ND10ND10
S.U.%
mg/Lmg/L
CFUs/mLCFUs/mL
5.115.42052.3S.SxlO3
ZSxlO3
5.115.61981.64.7X103
1.9x10*
5.115.81859.54.8X103
1.7X1Q3
15.75.116.61643.84.5x101.4x10
CRA 14246(1)AR300060

TABLE 5.5 Page 1 of 2
ANALYTICAL RESULTS SUMMARY - TEST CONDITION 3BIODEGRADATION TREATABILITY STUDY
BIOTREATABILITY SOIL PILE STUDIESMETACHEM PRODUCTS
NEW CASTLE, DELAWARE
Parameters
Time (months)Collection Date
Units
12/2Q/992.5
V31/W4
3/2Q/00
VOCsBenzeneTolueneChlorobenzene1.2-Dichlorobenzene1.3-Dichlorobenzene1.4-Dichlorobenzene
mg/Kgmg/Kgmg/Kgmg/Kgmg/Kgmg/Kg
ND50ND50ND50
66ND50
20000
ND120ND120ND120ND 120ND120
3360
ND120ND120ND120ND120ND 120
2584
ND133ND133ND133ND133ND 133
4509
SVOCs1.23-Trichlorobenzene1.2.4-Trichlorobenzene1,3,5-Trichlorobenzene1^3,4-Tetrachlorobenzenel,2A5-TetrachlorobenzenePentachlorobenzeneHexachlorobenzeneNitrobenzene
mg/Kgmg/Kgmg/Kgmg/Kgmg/Kgmg/Kgmg/Kgmg/Kg
150470
ND8.316023350.90J
ND8.3
66228
ND101181336
ND10ND 10
34105
ND11682J19
ND11ND11
General ChemistrypHMoisture ContentAmmonia NitrogenOrthophosphate PhosphorusTotal Microbial PopulationMix Specific Microbial Population
S.U.%
mg/Lmg/L
CFUs/mLCFUs/mL
5.617.7
14.3LSxlO5
3.3X10³
5.517.3
7.17.0X105
2.4x10*
5.617.9
4.79-lxlO4
33X103
5.516.8
S.SxlO3
1.7X10³
5.524.6
7.81.2X103
6.5X10²
CIW 14246 (1)
AR300061

TABLE 5.5 Page 2 of 2
ANALYTICAL RESULTS SUMMARY - TEST CONDITION 3BIODEGRADATION TREAT ABILITY STUDY
BIOTREATABILITY SOIL PILE STUDIESMETACHEM PRODUCTS
NEW CASTLE, DELAWARE
Parameters
Time (months)Collection Date
Units
65/23/W
87/18/QQ
9.5
VOCsBenzeneTolueneChlorobenzene1.2-Dichlorobenzene1.3-Dichlorobenzene1.4-Dichlorobenzene
SVOCs1,2 -Trichlorobenzene1,2,4-Trichlorobenzene1,3,5-Trichlorobenzene1,2,3,4-Tetrachlorobenzene1,2,4,5-TetrachlorobenzenePentachlorobenzeneHexachlorobenzeneNitrobenzene
General ChemistrypHMoisture ContentAmmonia NitrogenOrthophosphate PhosphorusTotal Microbial PopulationMix Specific Microbial Population
Notes:Blank entries indicate data not available.CPUs Colony Forming Units.J Estimated.ND Non-detect at associated value.S.U. Standard unite.SVOCs Semi-volatile organic compounds.VOCs Volatile organic compounds.
mg/Kgmg/Kgmg/Kgmg/Kgmg/Kgmg/Kg
mg/Kgmg/Kgmg/Kgmg/Kgmg/Kgmg/Kgmg/Kgmg/Kg
ND141ND141ND141ND141ND141
6369
49148
ND12963J26
ND12ND12
ND 139ND139ND139ND139ND139
1664
4993
ND1282
ND1026
ND12ND12
ND55ND55ND55ND55ND55
1241
2869
ND11ND 11
4.618
ND11ND11
ND54ND 54ND 54ND54ND54
1182
52130
ND11921127
ND 11ND 11
ND54ND54ND54ND54ND54
3518
41%
ND11ND11
9.626
ND11ND11
S.U.%
mg/Lmg/L
CFUs/mLCFUs/mL
5.9292196118.183X103
2-lxlO3
5.927.9171521.08.4X103
ZSxlO3
5.827.5169836.18.5X103
2.6X10³
26.45.726.114939.44.5X103
1.6X10³
CRA 14340(1}
AR300062

TABLE 5.6 Page 1 of 2
ANALYTICAL RESULTS SUMMARY - TEST CONDITION 4BIODEGRADATION TREAT ABILITY STUDY
BIOTREATABIUTY SOIL PILE STUDIESMETACHEM PRODUCTS
NEW CASTLE, DELAWARE
Parameters
Time (months)Collection Date
Units
12/20-992
1/tl/W2.5
V3I/M
VOCsBenzeneTolueneChlorobenzene1.2-Dichlorobenzene13-D»chlorobenzene1.4-Dichlorobenzene
SVOCs1,23-TrichlorobenzenelA4-Trichlorobenzene1,3,5-TrichIorobenzene1,23,4-Tetrachlorobenzene1,24,5-TetrachlorobenzenePentachlorobenzeneHexachlorobenzeneNitrobenzene
mg/Kgmg/Kg
mg/Kgmg/Kg
ND50ND50ND50
66ND50
20000
mg/Kgmg/Kgmg/Kgmg/Kgmg/Kgmg/Kgmg/Kgmg/Kg
150470
ND8.316023350.90J
ND8.3
ND30ND30ND30ND30ND30
8980
ND121ND121ND121ND121ND121
3641
ND121ND121ND121ND121ND121
6000
ND100ND 100ND100ND100ND100
4950
90291
ND101582144
ND10ND10
114356
ND122002756
ND12ND12
General ChemistrypHMoisture ContentAmmonia NitrogenOrthophosphate PhosphorusAerobic Total Microbial PopulationAnaerobic Total Microbial PopulationAerobic Mix Specific Microbial PopulationAnaerobic Mix Specific Microbial Population
s,u.%
mg/Lmg/L
CFUs/mLCFUs/mLCFUs/mLCFUs/mL
5.617.1
14.41.6X105
3.4X10³
5.717.8
6.3S.gxlO5
3-OxlO4
5.617.6
5.68.8x10*
4.5X103
5.417.5
7.5X10³
3.2X10³
5.53X5
26.7XOxlO3
1.2X10³
9-OxlO2
S.SxlO2
C«AM2«(1)
AR300063

TABLE 5.6 Page 2 of 2
ANALYTICAL RESULTS SUMMARY - TEST CONDITION 4BIODEGRADATION TREAT ABILITY STUDY
BIOTREATABILITY SOIL FILE STUDIESMETACHEM PRODUCTS
NEW CASTLE, DELAWARE
Parameters
Time (months)Collection Date
Units
54/I8/DO
87/1S/OQ
9.5
VOCsBenzeneTolueneChlorobenzene1.2-Dichlorobenzene1.3-Dichlorobenzene1.4-Dichlorobenzene
mg/Kgmg/Kgmg/Kgmg/Kgmg/Kgmg/Kg
ND160ND160ND160ND160ND160
13738
ND61ND61ND61ND61ND61
4085
ND61ND61ND61ND61ND61
4993
ND58ND58ND58ND58ND58
4094
ND58ND58ND58NDS8ND58
3623
SVOCs1.23-Trichlorobenzene1.2.4-Trichlorobenzene1,3,5-Trichlorobenzene1,23,4-Tetrachlorobenzene1,2,4,5-TetrachlorobenzenePentachlorobenzeneHexachlorobenzeneNitrobenzene
General ChemistrypHMoisture ContentAmmonia NitrogenOrthophosphate PhosphorusAerobic Total MicrobiaJ PopulationAnaerobic Total Microbial PopulationAerobic Mix Specific Microbial PopulationAnaerobic Mix Specific Microbial Population
Notes:Blank entries indicate data not available.CPUs Colony Forming Units.J Estimated.ND Non-detect at associated value.S.U. Standard units.SVOCs Semi-volatile organic compounds.VOCs Volatile organic compounds.
mg/Kgmg/Kgmg/Kgmg/Kgmg/Kgmg/Kgmg/Kgmg/Kg
117319
ND132564J45
ND13ND13
68139
ND131351741
ND13ND13
3694
ND13ND13
5.518
ND13ND13
42113
ND12768.020
ND12ND12
3083
ND12574.315
ND12ND 12
S.U.%
mg/Lmg/L
CFUs/mLCFUs/mLCFUs/mLCFUs/mL
5.637.4147037.4
S.SxlO5
7.4X10³
6.4x10*3.1 xlO3
5.233.9123825.2
6.6X10⁵
7-lxlO3
5.6x10*3-lxlO3
5.232.9120647.8
6.9x10*
5.2x10*
31.65.2
31.011757X2
8.7X10⁵
5.7x10*
CRA 14240(1)
AR300064

TABLE 5.7 Page 1 of 2
Parameters
VOCsBenzeneTolueneChlorobenzene1.2-Dichlorobenzene1.3-Dichlorobenzene1.4-Dichlorobenzene
SVOCs1,2^3-Trichlorobenzene1,2,4-TrichlorobenzenelA5-Trichlorobenzenel,2A4-Tetrachlorobenzene1,2,4,5-TetrachlorobenzenePentacMorobenzeneHexachlorobenzeneNitrobenzene
General ChemistryPHMoisture ContentAmmonia NitrogenOrthophosphate PhosphorusTotal Microbial PopulationMix Specific Microbial Population
ANALYTICAL RESULTS SUMMARY - TEST CONDITION 5BIODEGRADATION TREATABILITY STUDY
BIOTREATABILITY SOIL PILE STUDIESMETACHEM PRODUCTS
NEW CASTLE, DELAWARE
Time (months)Collection Date
Units
0
mg/Kgmg/Kgmg/Kgmg/Kgmg/Kgmg/Kg
mg/Kgmg/Kgmg/Kgmg/Kgmg/Kgmg/Kgmg/Kgmg/Kg
ND50ND 50ND 50
66ND50
20000
150470
ND8.316023350.90]
ND8.3
1 2.5
S.U.%
mg/Lmg/L
CFUs/mLCFUs/mL
5.617.4
2.11.4X105
ZSxlO3
5.617.5
2.7l.lxlO5
3.3X10³
5.617.8
0.68.7X103
1.4X10³
5.517.6
2.1 xlO3
1.4X10³
43/20/00
ND122ND122ND122ND122ND122
11422
ND121ND121ND121ND121ND121
7646
ND121ND121ND121ND 121ND121
10182
89303
ND101211628
ND 10ND10
46133
ND1075
ND416
ND10ND10
5.017.5
3.91.6X103
7.5x10²
CRA 14246 ft)
AR300065

TABLE 5.7 Page 2 of 2
Parameters
VOCsBenzeneTolueneChlorobenzene1.2-Dichlorobenzene13-Dichlorobenzene1.4-Dichlorobenzene
SVOCs1.2.3-Trichlorobenzene1.2.4-Trichlorobenzene1,3/5-Trichlorobenzene1,2,3,4-Tetrachlorobenzene1,2,4,5-TetrachlorobenzenePentachlorobenzeneHexachlorobenzeneNitrobenzene
General ChemistryPHMoisture ContentAmmonia NitrogenOrthophosphate PhosphorusTotal Microbial PopulationMix Specific Microbial Population
Notes:Blank entries indicate data not available.CPUs Colony Forming Units.J Estimated.ND Non-detect at associated value.S.U. Standard units.SVOCs Semi-volatile organic compounds.VOCs Volatile organic compounds.
ANALYTICAL RESULTS SUMMARY - TEST CONDITION 5BIODEGRADATION TREATABILITY STUDY
BIOTREATABILITY SOIL PILE STUDIESMETACHEM PRODUCTS
NEW CASTLE, DELAWARE
65/23/00
ND237ND237ND237ND237ND237
4982
57107
ND101161432
ND10ND10
5.115.72623.42.4X103
9.0X10²
Time (months)Collection Date
Units
mg/Kgmg/Kgmg/Kgmg/Kgmg/Kgmg/Kg
mg/Kgmg/Kgmg/Kgmg/Kgmg/Kgmg/Kgmg/Kgmg/Kg
S.U.%
mg/Lmg/L
CFUs/mLCFUs/mL
54/18/00
ND120ND120ND120ND120ND120
6467
50192
ND10105
ND623
ND10ND10
5.016.52342.82.5XI03
1.4X10³
ND95ND95ND95ND95ND95
794
4396
ND10951226
ND10ND10
5.115.62263.82.2X103
7-OxlO2
87/18/00
ND47ND47ND47ND47ND47
210
3778
ND10749.219
ND10ND10
14.4
9.5
ND47ND47ND47ND47ND47
5101
3375
ND10811023
ND10ND10
5.015.72014.5
1.9X10³
6-OxlO2
CRA 14240 (1)
AR300066

TABLE 5.8 Page 1 of 2
Parameters
VOCsBenzeneTolueneChlorobenzene1.2-Dichlorobenzene1.3-Dichlorobenzene1.4-Dichlorobenzene
SVOCs1,23-Trichlorobenzene1,2 -Trichlorobenzene1 AS-Trichlorobenzene1,2,3,4-Tetrachlorobenzene1,2,4,5-TetrachlorobenzenePentachlorobenzeneHexachlorobenzeneNitrobenzene
General ChemistryPHMoisture ContentAmmonia NitrogenOrthophosphate Phosphorus
Total Microbial PopulationMix Specific Microbial Population
ANALYTICAL RESULTS SUMMARY - TEST CONDITION 6BIODEGRADATION TREATABILITY STUDY
BIOTREATABILITY SOIL PILE STUDIESMETACHEM PRODUCTS
NEW CASTLE, DELAWARE
Time (months)Collection Date
Units
0
mg/Kgmg/Kgmg/Kgmg/Kgmg/Kgmg/Kg
mg/Kgmg/Kgmg/Kgmg/Kgmg/Kgmg/Kgmg/Kgmg/Kg
ND50ND50ND50
66ND50
20000
150470
ND8.316023350.90J
ND8.3
21/18/00
251/31/00
S.U.%
mg/Lmg/L
CFUs/mLCFUs/mL
5.517.7
5.21.7X105
3.2X10³
5.517.5
2.81.4xl05
3.1 xlO3
5.518.1
0.87.1 XlO3
1.4X10³
32/1&QO
5.317.7
6.5X10²
6.0X10²
ND122ND122ND122
57JND122
14616
ND 122ND122ND122ND122ND 122
11543
ND 121ND121ND121ND121ND121
13285
89316
ND101121329
ND10ND 10
53169
ND 10704J17
ND10ND10
5.117.2
17.8
7.5X10²
4.5X10²
CRA 14240(1)
AR300067
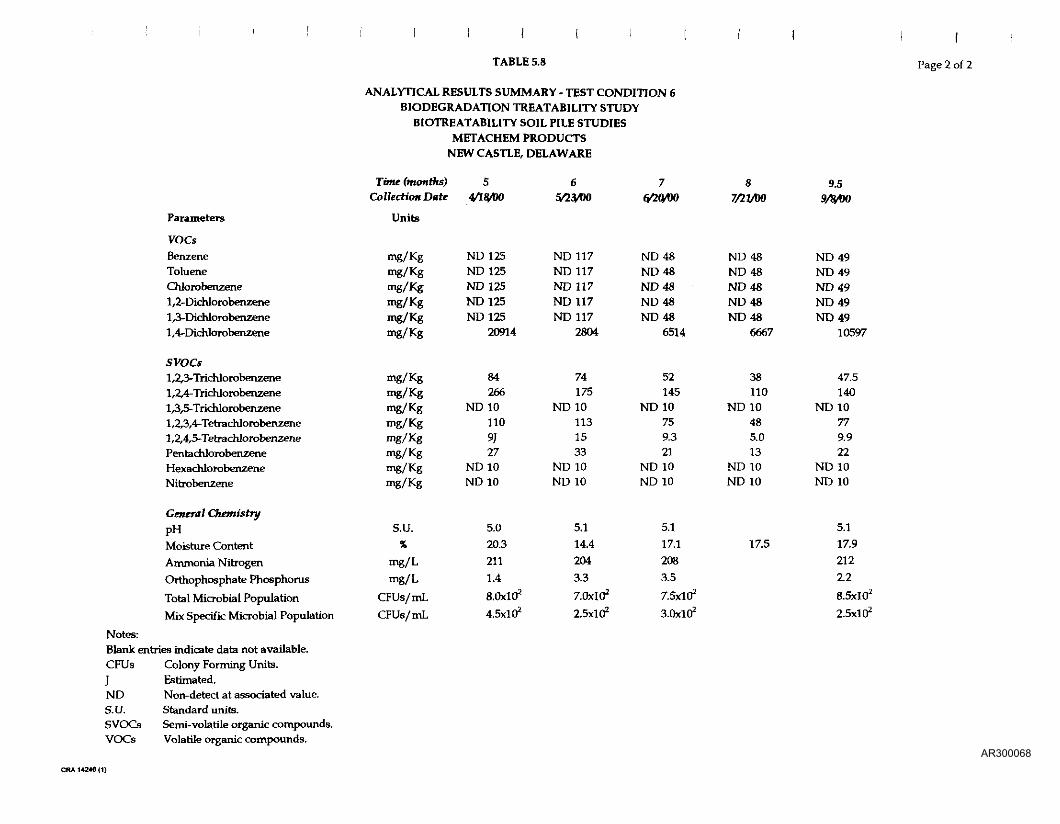
TABLE 5.8 Page 2 of 2
Parameters
VOCsBenzeneTolueneChlorobenzene1.2-Dichlorobenzene1.3-DichIorobenzene1.4-Dichlorobenzene
SVOCsI,2f3-Trichlorobenzene1,2/4-TrichlorobenzenelA5-Trichlorobenzene1,2,3,4-Tetrachlorobenzene1,2,4,5-TetrachlorobenzenePentachlorobenzeneHexachlorobenzeneNitrobenzene
General ChemistryPHMoisture ContentAmmonia NitrogenOrthophosphate PhosphorusTotal Microbial PopulationMix Specific Microbial Population
Notes:Blank entries indicate data not available.CPUs Colony Forming Units.J Estimated.ND Non-detect at associated value.S.U. Standard units.SVOCs Semi-volatile organic compounds.VOCs Volatile organic compounds.
ANALYTICAL RESULTS SUMMARY - TEST CONDITION 6BIODEGRADATION TREATABILITY STUDY
BIOTREATABIHTY SOIL PILE STUDIESMETACHEM PRODUCTS
NEWCASTLE, DELAWARE
Time (months)Collection Date
Units
65/2VW
S.U.%
mg/Lmg/L
CFUs/mLCFUs/mL
5.020.32111.4S.OxlO2
4.5x10*
5.114.42043.37-OxlO2
2.5X10²
5.117,12083.57.5X102
3-OxlO2
17.5
9.5
mg/Kgmg/Kgmg/Kgmg/Kgmg/Kgmg/Kg
mg/Kgmg/Kgmg/Kgmg/Kgmg/Kgmg/Kgmg/Kgmg/Kg
ND125ND125ND125ND125ND125
20914
84266
ND101109J27
ND10ND 10
ND117ND117ND117ND117ND117
2804
74175
ND101131533
ND10ND10
ND48ND48ND48ND48ND48
6514
52145
ND10759.321
ND 10ND10
ND48ND48ND48ND48ND48
6667
38110
ND10485.013
ND10ND 10
ND49ND49ND49ND49ND49
10597
47.5140
ND10779.922
ND10ND10
5.117.92122.28-SxlO2
2-SxlO2
CRA U2« (1)
AR300068

TABLE 5.9
ANALYTICAL RESULTS - CARBON TRAPSBIODEGRADATION TREATABILITY STUDY
BIOTREATABILITY SOIL PILE STUDIESMETACHEM PRODUCTS
NEW CASTLE, DELAWARE
Parameters
VOCsBenzeneChlorobenzene1.2-Dichlorobenzene1.3-Dichlorobenzene1.4-Dichlorobenzene
SVOCs1.23-Trichlorobenzene1.2.4-Trichlorobenzene1,2,3,4-Tetrachlorobenzene1,2,4,5-Tetrachlorobenzene
Test ConditionCollection Date
Units
09/06/002
09/06/003
09/06/004
09/06/005
09/06/00
mg/Kgmg/Kgmg/Kgmg/Kgmg/Kg
mg/Kgmg/Kgmg/Kgmg/Kg
ND4.6ND4.6
24501452100
22001250033
ND9.1
ND4.01026013518000
1478002618
ND4.07.638016023000
215118013
ND7.8
ND3.8ND3.8
105635650
35185
ND7.5ND 7.5
ND4.1ND4.1
1076515000
155550
ND8.3ND8.3
Notes:NDSVOCsVOCs
Non-detect at associated value.Semi-volatile organic compounds.Volatile organic compounds.
CRA 14246(1)
AR300069

TABLE 5.10
WEEKLY AIR MONITORING DATA - TEST CONDITION 1BIODEGRADATION TREATABIUTY STUDY
BIOTREATABILITY SOIL PILE STUDIESMETACHEM PRODUCTS
NEW CASTLE, DELAWARE
Page 1 of 4
Parameter
Vacuum PressureFlow
TemperatureCH402
LELPID
Sample Date
Units
inches Watercc/min
°C%%%%
ppm
T = lDay
11/19/99
1840220
18.20.1
0605
T = 15 weeks
11/29/99
1850210
17.60.2
0617
T = 23 weeks
12/6/99
1850210
20.40.2
0544
T = 4 weeks
12/17/99
28512101800
261
T = 5 weeks
12/25/99
2850210180
0242
T = 6 weeks
1/1/00
20
50220
17.90
0219
T = 7 weeks
1/7/00
11150230180
0373
T = 7.5 weeks
1/11/00
10.550230210
0380
CfiA 1*246(1)
AR300070

TABLE 5.10 Page 2 of 4
WEEKLY AIR MONITORING DATA - TEST CONDITION 1BIODEGRADATION TREATABILITY STUDY
BIOTREATABILITY SOIL PILE STUDIESMETACHEM PRODUCTS
NEW CASTLE, DELAWARE
T = 8 weeks T = 83 weeks T = 9 weeks T = 10 weeks T = 11 weeks T= 12 weeks T = 13 weeks T = 14 weeks
Sample Date 1/14/00 1/18/00 1/21/00 1/28/00 2/4/00 2/11/00 2/18/00 2/25/00
Parameter Units
Vacuum Pressure inches WaterFlow cc/minTemperature °CCH4 %02 %
C02 %
LEL %PID ppm
125023020.10
0390
105123020.10
0381
65121020.40.1
0387.2
64922020.90
0379.3
750230
20.10
0157
105022019.90
0200
650220200
0202
105123019.900301
CRA 14246(1)
AR300071

TABLE 5.10 Page 3 of 4
WEEKLY AIR MONITORING DATA - TEST CONDITION 1BIODEGRADATION TREATABILITY STUDY
BIOTREATABILTTY SOIL PILE STUDIESMETACHEM PRODUCTS
NEW CASTLE, DELAWARE
T = 15 weeks T = 16 weeks T = 17 weeks T = 18 weeks T = 19 weeks T = 21 weeks T = 23 weeks T = 24 weeks
SampleDate 3/3/00 3/10/00 3/17/00 3/24/00 3/31/00 4/14/00 4/28/00 5/5/00
Parameter Units
Vacuum Pressure inches WaterFlow cc/minTemperature °CCH4 %02 %
LHL %FID ppm
750230
20.60
02%
650220210
0303
850220
20.40
0300
751230
20.30
0305
649230
20.50
0300
1250230
20.60
0310
1050220
20.20
0251
1550230
20.300299
AR300072

TABLE 5.10
WEEKLY AIR MONITORING DATA - TEST CONDITION 1BIODEGRADATION TREAT ABILITY STUDY
BIOTREATABILITY SOIL PILE STUDIESMETACHEM PRODUCTS
NEW CASTLE, DELAWARE
Page 4 of 4
Parameter
Vacuum PressureFlowTemperatureCH402
CO2
LELPID
Sample Date
Units
inches Watercc/min
°C%%%
%ppm
T = 25 weeks
5/12/00
2050230
20.20
0309
T = 26 weeks
5/19/00
2050210
20.20
0286
T = 29 weeks
6/9/00
21
52
200
20.20
0300
T = 30 weeks
6/16/00
2150220
20.10
0254
T = 35 weeks
7/18/00
22
50
210
20.20
0260
T = 42 weeks
9/6/00
2250210
20.10
0250
Notes:cc/min Cubic centimeters per minuteCH4 MethaneCOj Carbon Dioxide
LEL Lower Explosive LimitC*2 OxygenPID Photoionization Detectorppm Parts per million
CRA 14246(1)
AR300073

TABLE 5.11
WEEKLY AIR MONITORING DATA - TEST CONDITION 2BIODEGRADATION TREAT ABILITY STUDY
BIOTREAT ABILITY SOIL PILE STUDIESMETACHEM PRODUCTS
NEW CASTLE, DELAWARE
Page 1 of 4
Parameter
Vacuum Pressure
Flow
TemperatureCH4
02
COj
LEL
PID
Sample Date
Units
inches Water
cc/min"C
T = 1 Day T - 1.5 weeks T = 25 weeks T = 4 weeks T = 5 weeks T = 6 weeks T = 7 weeks T = 73 weeks
11/19/99 11/29/99 12/6/99 12/17/99 12/25/99 1/1/00 1/7/00 1/11/00
ppm
18
41
21
0
18.1
0
0
>2000
18
50
220
17.9
0
0
>2000
18
51
210
20.4
0
0
1514
26
50
210
18
0
0
1213
26
50
210
18
0
0
1160
18
50
230
17.8
0
0
1702
10.5
150
230
18
0
0
1611
10.5
50
22
0
19.2
0
0
1952
CAA 1*348(1)
AR300074

TABLE 5.11 Page 2 of 4
WEEKLY AIR MONITORING DATA - TEST CONDITION 2BIODEGRADATION TREATABILTTY STUDY
BIOTREATABILITY SOIL PILE STUDIESMETACHEM PRODUCTS
NEW CASTLE, DELAWARE
Parameter
Vacuum PressureFlowTemperatureCH4
COj
LELPID
T » 8 weeks
Sample Date 1/14/00
Units
inches Watercc/min
°C
T * 83 weeks
1/18/00
T - 9 weeks
1/21/00
T «10 weeks
1/28/00
T = 11 weeks
2/4/00
T-12 weeks
2/11/00
T »13 weeks
2/18/00
T -14 weeks
2/25/00
ppm
12
51
230
20.8
0
0
>2000
8
49
230
20.2
0
0
>2000
6
50
21
0
20.6
0
0
1853
6
50
22
0
20.9
0
0
1709
10
50
230
20.1
0
0
908
10
50
220
20
0
0
1001
6
51
220
20
0
0
1111
10
10
230
20
0
0
1200
CRA 14246(1)
AR300075

TABLE 5.11 Page 3 of 4
WEEKLY AIR MONITORING DATA - TEST CONDITION 2BIODEGRADATION TREAT ABILITY STUDY
BIOTREATABILITY SOIL FILE STUDIESMETACHEM PRODUCTS
NEW CASTLE, DELAWARE
Parameter
Vacuum Pressure
Flow
TemperatureCH*
T » 15 weeks
Sample Date 3/3/00
Units
inches Watercc/min
°C
LEL
PID
T = 16 weeks
3/10/00
T = 17 weeks
3/17/00
T = 18 weeks
3/24/00
T = 19 weeks
3/31/00
T = 21 weeks
4/14/00
T-23 weeks
4/28/00
T = 24 weeks
5/5/00
ppm
7
10
23
0
20.7
0
0
1300
7
9
22
0
20.8
0
0
1211
8
10
22
0
20.4
0
0
1272
8
10
23
0
20.5
0
0
1250
7
10
23
0
20.5
0
0
1309
12
9
23
0
20.6
0
0
1350
12
10
22
0
20.1
0
0
633
15
10
23
0
20.2
0
0
752
CRA 142M (1)
AR300076

TABLE 5.11 Page 4 of 4
WEEKLY AIR MONITORING DATA - TEST CONDITION 2BIODEGRADATION TREATABIUTY STUDY
BIOTREAT ABILITY SOIL PILE STUDIESMETACHEM PRODUCTS
NEW CASTLE, DELAWARE
Parameter
Vacuum PressureFlowTemperatureCH4
02
CO;
LEL
PID
T - 25 weeks
Sample Date 5/12/00
Units
inches Watercc/min
°C
T = 26 weeks
5/19/00
T = 29 weeks
6/9/00
T - 30 weeks
6/16/00
T = 35 weeks
7/18/00
T - 42 weeks
9/6/00
ppm
20
10
230
20.2
0
0
741
20
10
22
0
20.2
0
0
777
22
9
200
20.4
0
0
790
21
10
200
20.2
0
0
940
22
10
210
20.2
0
0
922
22
10
21
0
20.1
0
0
929
Notes:
cc/minChL.
LELC>2
PIDppm
Cubic centimeters per minuteMethane
Carbon Dioxide
Lower Explosive LimitOxygen
Photoionization DetectorParts per million
AR300077

TABLE 5.12
WEEKLY AIR MONITORING DATA - TEST CONDITION 3BIODEGRADATION TREATABIUTY STUDY
BIOTREATABILITY SOIL PILE STUDIESMETACHEM PRODUCTS
NEW CASTLE, DELAWARE
Page 1 of 4
Parameter
Vacuum Pressure
Flow
TemperatureCH,
02
CQj
LEL
PID
Sample Date
Units
inches Watercc/min
°C
T = 1 Day T = 13 weeks T =• 23 weeks T = 4 weeks T = 5 weeks T = 6 weeks T = 7 weeks T =• 7.5 weeks
11/19/99 11/29/99 12/6/99 12/17/99 12/25/99 1/1/00 1/7/00 1/11/00
ppm
18
40
22
0
18
0
0
>2000
18
50
21
0
18
0
0
>2000
18
50
210
20.4
0
0
1502
28
50
21
0
18
0
0
1480
28
51
210
18
0
0
990
20
50
230
17.8
0
0
1071
10.5
150
230
18
0
0
999
10.5
50
23
0
18.2
0
0
1007
CRA 14246 (1)
AR300078

TABLE 5.12 Page 2 of 4
WEEKLY AIR MONITORING DATA - TEST CONDITION 3BIODEGRADATION TREATABILITY STUDY
BIOTREATABILITY SOIL PILE STUDIESMETACHEM PRODUCTS
NEW CASTLE, DELAWARE
Parameter
Vacuum PressureFlowTemperatureCH«
02
C02
LEL
PID
Sample Date
Units
inches Watercc/min
°C
= 8 weeks
1/14/00
T = 85 weeks
1/18/00
T = 9 weeks
1/21/00
T * 10 weeks
1/28/00
T = 11 weeks
2/4/00
T = 12 weeks
2/11/00
T = 13 weeks
2/18/00
T = 14 weeks
2/25/00
ppm
12
51
230
20.8
0
0
1890
8
50
210
20.6
0
0
1770
6
49
210
20.6
0
0
1411
6
50
220
20.9
0
0
1294
10
50
230
20.4
0
0
808
9.5
50
220
20.1
0
0
665
9.5
51
220
19.9
0
0
702
7
10
230
21
0
0
700
C«A 14246 (1J
AR300079

TABLE 5.12 Page 3 of 4
WEEKLY AIR MONITORING DATA - TEST CONDITION 3BIODEGRADATION TREAT ABILITY STUDY
BIOTREATABILITY SOIL PILE STUDIESMETACHEM PRODUCTS
NEW CASTLE, DELAWARE
Parameter
Vacuum Pressure
Flow
TemperatureCH4
CO2
LEL
PID
T -15 weeks
Sample Date 3/3/00
Units
inches Water
cc/min°C
T - 16 weeks
3/10/00
T « 17 weeks
3/17/00
T = 18 weeks
3/24/00
T - 19 weeks
3/31/00
T = 21 weeks
4/14/00
T - 23 weeks
4/28/00
T = 24 weeks
5/5/00
ppm
7
10
23
0
20.6
0
0
677
7
10
22
0
20.7
0
0
649
8
9
22
0
20.4
0
0
667
8
10
230
20.4
0
0
680
7
10
23
0
20.6
0
0
679
11
10
230
20.5
0
0
669
11
10
230
20.2
0
0
1384
20
9
230
20.2
0
0
807
AR300080

TABLE 5.12 Page 4 of 4
WEEKLY AIR MONITORING DATA - TEST CONDITION 3BIODEGRADATION TREATABIUTY STUDY
BIOTREATABIUTY SOIL PILE STUDIESMETACHEM PRODUCTS
NEW CASTLE, DELAWARE
Parameter
Vacuum Pressure
Flow
TemperatureCH4Oj
CO,
LEL
PID
T = 25 weeks
Sample Date 5/12/00
Units
inches Water
cc/min
°C
T - 26 weeks
5/19/00
T = 29 weeks
6/9/00
T = 30 weeks
6/16/00
T = 35 weeks
7/18/00
T = 42 weeks
9/6/00
ppm
20
10
230
20.2
0
0
873
20
10
210
20.2
0
0
800
22
10
200
20.1
0
0
566
22
10
200
20.2
0
0
375
22
10
210
20.2
0
0
340
22
10
210
20.1
0
0
380
Notes:
cc/ min Cubic centimeters per minute
CH( MethaneCO2 Carbon Dioxide
LEL Lower Explosive LimitO2 Oxygen
PID Photoionization Detectorppm Parts per million
CRA 14J« <1
AR300081

TABLE 5.13
WEEKLY AIR MONITORING DATA - TEST CONDITION 4BIODEGRADATION TREAT ABILITY STUDY
BIOTREATABILFTY SOIL PILE STUDIESMETACHEM PRODUCTS
NEW CASTLE, DELAWARE
Page 1 of 4
Parameter
Vacuum Pressure
Flow
TemperatureCH*02
COj
LEL
PID
Sample Date
Units
inches Watercc/min
°C%%%%
ppm
T - 1 Day
11/19/99
18
40
22
0
18
0
0
>2000
T = 1.5 weeks
11/29/99
18
50
21
0
18
0
0
>2000
T = 23 weeks
12/6/99
18
50
21
0
20.5
0
0
1520
T = 4 weeks
12/17/99
27
51
210
18.1
0
0
1305
T ™ 5 weeks
12/25/99
27
50
210
18
0
0
1024
T = 6 weeks
1/1/00
20
50
23
0
17.8
0
0
1261
T- 7 weeks
1/7/00
9.5
150
230
17.9
0
0
1876
T = 7.5 weeks
1/11/00
9.5
51
230
200
0
1835
CRA 14246(1)
AR300082

TABLE 5.13 Page 2 of 4
WEEKLY AIR MONITORING DATA - TEST CONDITION 4BIODEGRADATION TREATABIUTY STUDY
BIOTREATABILITY SOIL PILE STUDIESMETACHEM PRODUCTS
NEW CASTLE, DELAWARE
Parameter
Vacuum PressureFlow
TemperatureCH4
COj
LEL
PID
T = 8 weeks
Sample Date 1/14/00
Units
inches Watercc/min
°C
T- 83 weeks
1/18/00
• = 9 weeks
1/21/00
T = 10 weeks
1/28/00
T -11 weeks
2/4/00
T * 12 weeks
2/11/00
T -13 weeks
2/18/00
T = 14 weeks
2/25/00
ppm
12
50
210
20.9
0
0
>2000
8
49
210
20.7
0
0
1801
6
50
210
20.7
0
0
1600
6
50
22
0
20.5
0
0
1222
9
51
230
18.7
0
0
905
9
50
220
20.1
0
0
999
9
50
220
20
0
0
925
NA
NA
23NA
NA
NA
NA
NA
CRA 14246(1}
AR300083

TABLE 5.13 Page 3 of 4
WEEKLY AIR MONITORING DATA - TEST CONDITION 4BIODEGRADATION TREATABHJTY STUDY
BIOTREATABILTTY SOIL PILE STUDIESMETACHEM PRODUCTS
NEW CASTLE, DELAWARE
T -15 weeks T -16 weeks T »17 weeks T = 18 weeks T = 19 weeks T = 21 weeks T = 23 weeks T = 24 weeks
Sample Date 3/3/00 3/10/00 3/17/00 3/24/00 3/31/00 4/14/00 4/28/00 5/5/00
Parameter Units
Vacuum Pressure inches WaterFlow cc/min
Temperature °CCH4 %
O2 %
CO; %
LEL %
PID ppm
NA
NA
NA
NA
NA
NA
NA
NA
NA
NA
22NA
NA
NA
NA
NA
NA
NA
NA
NA
NA
NA
NA
NA
NA
NA
22
NA
NA
NA
NA
NA
NA
NA
NANA
NA
NA
NA
NA
NA
NA
NANA
NA
NA
NA
NA
NA
9
220
20.1
0
0
1264
16
10
230
20.2
0
0
1201
AR300084

TABLE 5.13
WEEKLY AIR MONITORING DATA - TEST CONDITION 4BIODEGRADATION TREATABILTTY STUDY
BIOTREATABIUTY SOIL PILE STUDIESMETACHEM PRODUCTS
NEW CASTLE, DELAWARE
I
Page 4 of 4
Parameter
T - 25 weeks T = 26 weeks T = 29 weeks T = 30 weeks T » 35 weeks T = 42 weeks
SampteDate 5/12/00 5/19/00 6/9/00 6/16/00 7/18/00 9/6/00
Units
Notes:
cc/minCH4CO;
LELOz
PID
ppm
Vacuum Pressure inches Water
Flow cc/minTemperature °CCH4 %
Oj %
CO2 %
LEL %
PID ppm
Cubic centimeters per minuteMethaneCarbon Dioxide
Lower Explosive Limit
Oxygen
Photoionization DetectorParts per million
1610230
20.3
0
0
1194
16
9
210
20.2
0
0
1111
17
10
200
20.2
0
0
809
22
10
200
18.4
2.8
0
799
22
9
210
19
2.2
0
882
22
10
21
0
20.2
2
0
876
CRA1424* (t)
AR300085

TABLE 5.14 Page 1 of 4
WEEKLY AIR MONITORING DATA - TEST CONDITION 5BIODEGRADATION TREATABILITY STUDY
BIOTREATABILTTY SOIL PILE STUDIESMETACHEM PRODUCTS
NEW CASTLE, DELAWARE
Parameter
Vacuum PressureFlow
TemperatureCH4
Oj
COj
LEL
PID
Sample Date
Units
inches Water
cc/rnin°C
T -1 Day T -1.5 weeks T = 25 weeks T - 4 weeks T = 5 weeks T = 6 weeks T - 7 weeks T - 7.5 weeks
11/19/99 11/29/99 12/6/99 12/17/99 12/25/99 1/1/00 1/7/00 1/11/00
ppm
18
41
210
18
0
0
>2000
18
50
21
0
18
0
0
>2000
18
50
210
20.6
0
0
1474
27
51
210
18.2
0
0
1329
27
50
210
18
0
0
1499
20
50
230
17.8
0
0
1029
9.5
150
230
17.9
0
0
956
10
49
230
20
0
0
1257
AR300086

TABLE 5.14 Page 2 of 4
WEEKLY AIR MONITORING DATA - TEST CONDITION 5BIODEGRADATION TREATABIUTY STUDY
BIOTREATABILITY SOIL PILE STUDIESMETACHEM PRODUCTS
NEW CASTLE, DELAWARE
Parameter
Vacuum PressureFlowTemperatureCH4
CO,
LEL
PID
T = 8 weeks
Sample Date 1/14/00
Units
inches Water
cc/min
T - 8.5 weeks
1/18/00
T = 9 weeks
1/21/00
T = 10 weeks
1/28/00
T -11 weeks
2/4/00
T = 12 weeks
2/11/00
T = 13 weeks
2/18/00
T = 14 weeks
2/25/00
ppm
12
50
230
20.8
0
0
>2000
8
51
200
20.5
0
0
1338
6
51
20
0
20.6
0
0
1171
6
50
220
20.8
0
0
990
10
50
23
0
19
0
0
965
9.5
50
220
20
0
0
1001
9
50
220
20.2
0
0
1009
8
51
230
20.1
0
0
1212
AR300087

TABLE 5.14 Page 3 of 4
WEEKLY AIR MONITORING DATA - TEST CONDITION 5BIODEGRADATION TREATABILTTY STUDY
BIOTREATABILITY SOIL PILE STUDIESMETACHEM PRODUCTS
NEW CASTLE, DELAWARE
Parameter
Vacuum PressureFlow
TemperatureCH,02
COj
LEL
FID
T = 15 weeks
Sample Date 3/3/00
Units
inches Watercc/min
°C
T - 16 weeks
3/10/00
T * 17 weeks
3/17/00
T » 18 weeks
3/24/00
T - 19 weeks
3/31/00
T = 21 weeks
4/14/00
T - 23 weeks
4/28/00
T = 24 weeks
5/5/00
ppm
6
50230
20.7
0
0
991
7
50
220
20.7
0
0
997
6
50
220
20.5
0
0
985
6
50
230
20.6
0
0
1001
6
51
230
20.4
0
0
996
11
50
230
20.5
0
0
1000
13
50
230
20.5
0
0
1532
16
50
230
20.4
0
0
1233
CRA142« (1)
AR300088

TABLE 5.14 Page 4 of 4
WEEKLY AIR MONITORING DATA - TEST CONDITION 5BIODEGRADATION TREATABIUTY STUDY
BIOTREATABILITY SOIL PILE STUDIESMETACHEM PRODUCTS
NEW CASTLE, DELAWARE
Parameter
Vacuum PressureFlowTemperatureCH402
CO,
LEL
PID
Sample Date
Units
inches Watercc/min
°C
T = 25 weeks
5/12/00
T = 26 weeks
5/19/00
T = 29 weeks
6/9/00
= 30 weeks
6/16/00
T = 35 weeks
7/18/00
T = 42 weeks
9/6/00
ppm
16
50
23
0
20.2
0
0
1301
16
50
210
20.2
0
0
1350
18
51
200
20.3
0
0
1205
22
50
200
20.3
0
0
921
22
50
21
0
20.2
0
0
910
21
50
21
0
20.1
0
0
950
Notes:
cc/minCH4CO2
LEL03
PIDppm
Cubic centimeters per minute
MethaneCarbon Dioxide
Lower Explosive LimitOxygen
Photoionizau'on DetectorParts per million
AR300089

TABLE 5.15
WEEKLY AIR MONITORING DATA - TEST CONDITION 6BIODEGRADATION TREATABILITY STUDY
BIOTREATABILTTY SOIL PILE STUDIESMETACHEM PRODUCTS
NEW CASTLE, DELAWARE
Page 1 of 4
Parameter
Vacuum PressureFlown)
TemperatureCM*OjCC4
LEL
PID
Sample Date
Units
inches Watercc/min
°C
%
%
%
%
ppm
11/19/99
NA
NA
21
0
20.5
0
0
>2000
11/29/99
NA
NA
210
20.4
0
0
>2000
12/6/99
NA
NA
21
0
20.6
0
0
1440
12/17/99
NA
NA
21
0
18.1
0
0
1392
12/25/99
NA
NA
210
18
0
0
1936
1/1/00
NA
NA
230
17.8
0
0
1879
1/7/00
NA
NA
230
17.8
0
0
1942
1/11/C
NA
NA
23
0
19.1
0
0
1959
AR300090

TABLE 5.15
WEEKLY AIR MONITORING DATA - TEST CONDITION 6BIODEGRADATION TREAT ABILITY STUDY
BIOTREAT ABILITY SOIL PILE STUDIESMETACHEM PRODUCTS
NEW CASTLE, DELAWARE
Page 2 of 4
Parameter
Vacuum PressureFlow01
TemperatureCH,
Oi
CO!
LEL
PID
T = 8 weeks
Sample Date 1/14/00
Units
inches Watercc/min
°C
= 8.5 weeks T-9 weeks T» 10 weeks T = 11 weeks T = 12 weeks T- 13 weeks T = 14 weeks
1/18/00 1/21/00 1/28/00 2/4/00 2/11/00 2/18/00 2/25/00
ppm
NANA
23
0
20.8
0
0
>2000
NA
NA
200
20.5
0
0
1974
NA
NA
190
20.7
0
0
1762
NA
NA
220
20.6
0
0
1633
NA
NA
230
20.1
0
0
1524
NA
NA
220
20.1
0
0
1777
NA
NA
220
20.2
0
0
1805
NA
NA
230
20.1
0
0
1911
CFA142««<t>
AR300091

TABLE 5.15 Page 3 of 4
WEEKLY AIR MONITORING DATA - TEST CONDITION 6BIODEGRADATION TREAT ABILITY STUDY
BIOTREATABIUTY SOIL PILE STUDIESMETACHEM PRODUCTS
NEW CASTLE, DELAWARE
Parameter
Vacuum PressureFlow(1)
TemperatureCH4
O:COj
LEL
PID
T -15 weeks
Sample Date 3/3/00
Unite
inches Water
cc/min°C
T = 16 weeks
3/10/00
T- 17 weeks
3/17/00
T = 18 weeks
3/24/00
T = 19 weeks
3/31/00
T = 21 weeks
4/14/00
T- 23 weeks
4/28/00
T = 24 weeks
5/5/00
ppm
NA
NA
230
20.8
0
0
1881
NA
NA
200
20.7
0
0
18.3
NA
NA
220
20.5
0
0
1800
NA
NA
230
20.6
0
0
1872
NA
NA
230
20.5
0
0
1866
NA
NA
230
20.5
0
0
1880
NA
NA
220
20.2
0
0
1488
NA
NA
230
20.2
0
0
1562
CRA14248 (1)
AR300092

TABLE 5.15
WEEKLY AIR MONITORING DATA - TEST CONDITION 6BIODEGRADATION TREATABILITY STUDY
BIOTREATABILITY SOIL PILE STUDIESMETACHEM PRODUCTS
NEW CASTLE, DELAWARE
Page 4 of 4
Parameter
T = 25weeks T = 26weeks T = 29weeks T = 30weeks T = 35weeks T = 42weeks
Sample Date 5/12/00 5/19/00 6/9/00 6/16/00 7/18/00 9/6/00
Units
Vacuum PressureFlow™
TemperatureCH*0,CO,
LELPID
inches Water
cc/min°C%%%
%ppm
NA
NA
230
20.2
0
0
1588
NA
NA
210
20.2
0
0
1536
NA
NA
20
0
20.1
0
0
1377
NA
NA
200
20.2
0
0
1010
NA
NA
210
20.2
0
0
1172
NA
NA
210
20.2
0
0
1910
Notes:a> There was no flow passing through
the tank for the duration of this study,
cc/min Cubic centimeters per minuteCH< MethaneCO2 Carbon DioxideLEL Lower Explosive Limit
O2 Oxygen
PID Photoionization Detectorppm Parts per million
CRA 14248(1)
AR300093

TABLE 5.16 Page 1 of 2
Panwieter UnitsTest Condition 1
Collection Date
1.2-DCB itgfL of air1.3-DCB f&L ofatT1.4-DCB ptfL of air
Test Condition 2Collection Date:
1,2-DCB pyfL of air14-DCB wyt of air1,4-DCB itgfLofmtT
Tat Condition 3Collection Date:
1,2-DCB f$4. of airU-DCB «#t o/*fr1,4-DCB Mp>L of air
Tat Condition 4Collection Date:
1,2-DCBI4-DCB1,4-DCB
TestCondition 5CotttctioH Date
1.2-DCB tyfL o/wfr1.3-DCB «ffl of air1.4-DCB fff'L of air
Test Condition 6Collection Date
1.2-DCB pgfL of air1.3-DCB Hgt o/«i>1.4-DCB Hffl of nfr
WEEKLY AIR MONITORING DATA - DICHLOROBENZENESBIODEGRADATION TREAT ABILITY STUDY
BIOTREATABILITY SOIL PILE STUDIESMETACHEM PRODUCTS
NEW CASTLE, DELAWARE
ll/IS/99 12/17/39 12/25& 01/OlfiO 0107/00 01/14*0 01/2UW 01/28/00 02/tt/M 02/1*00 02/2WO 03/OMH
1W*99
000
1X4949
1.71.411
11AV99
2.72.55.4
1W»W
2.32.29.1
27
1817
11/2*99
1.51.69.7
11/2499
5.83.83.8
IV2&99
4.93.14.2
11/28/99
106.886
5.50.753.0
1V17/99
213.549
1V17/99
215.7140
1M7/99
269.0260
12/17/99
3113
380
12/17/99
5119601
121.76.3
12A&99
244.072
12/25/99
215.1130
12/25/99
207.0220
12/25/99
148.0160
12/25/99
2014
392
63137.2
M/flWW
162.746
oym/w266.1160
Ol/Vl/W
308.9250
n/n/w206.9220
ovm/w4112
471
5.61222
oi/o7/m122.554
01/07/00
7.82.258
OV07/QQ
164.8200
0W7/QO
B35.293
m/07/W
181.154
7.4
1.432
01/14-DO
7.01.667
OW+tW
112.5160
01/1*W
1815
270
W/7VTO
2315
399
9.91146
01/21/tW
163.0190
OI/71/W
144.2190
01/21/W
175.3260
01/21/90
2335450
m/o^w3015
450
2.512
21
OV2MM
7.02.8150
01/2&W
125.398
01/2*00
123.9160
OV24DO
113.8160
01/24W
3019
563
8.61.131
02yt>*00
142.4170
02/0*00
2.10.564.0
02/O*00
1.90.5426
02/0*00
7.2Z2130
01/0*00
176.7315
1.6015
02/11/00
5.42^110
024 VOO
8.44.982
02/UAQ
123.6150
0241/00
2212390
02/11/00
3224658
6.53.635
02AWO
7.71.7100
02/18/00
8.12.8110
02A8/00
4^2.0110
02/1WO
5.92.0120
02/1&W
2911542
4.90.8025
02/25^0
7.41.4120
02/2&W
6.94.9100
02^&OO
6.34.0120
02/25/00
2510
529
3.40.6923
oyoyw7.41.5170
oiovoo5.22.890
flJWO
5.4X5130
03^00
248.6561
CHA 1424A (1)
AR300094

TABLE 5.16 Page 2 of 2
Parameter UnitsTest Condition I
Collection Date:
1.2-DCB H#l of air1.3-DCB pgfL of air1.4-DCB »j»t of air
Test Condition 2Collection Date
1,2-DCB14-DCB1,4-DCB
Cott-rtion Drtte
1,2-DCB14-DCB fiffl of air1,4-DCB pgfL of air
Test Condition 4Collection Date:
1.2-DCB13-DCB1.4-DCB
Test Condition 5Collection Date:
1.2-DCB f&L of air1.3-DCB i&L of air1.4-DCB t&L of air
Test Condition 6Collection Date:
1.2-DCB1.3-DCB pg/Lofair1.4-DCB iig/L of air
WEEKLY AIR MONITORING DATA - DICHLOROBENZENESBIODEGRADATION TREATABIUTY STUDY
BIOTREATABILITY SOIL PILE STUDIESMETACHEM PRODUCTS
NEW CASTLE, DELAWARE
CHOW OV17/W
2.0 2.60 0.5214 21
WW «**»
5.7 4.11.1 1.0100 71
WU» WAO55 4.41.3 1.181 67
oyiiHw ayi7AKt53 4.61.6 13110 92
034440 OV17/DO
27 2311 9.4683 563
03/lVto
3.10.5015
OV24«
4.60.7866
OV24W
431.060
0*241)0
3.71.174
OK4*146.1396
OJ3VW
1.50
0.75
ww3.9
0.8559
MAWW
290.7140
0«M»
3.50.8953
<**»»
124.6289
OWOflO
18012
ww»25
0.6535
04^0
3.00.7688
WW»
1.90,7258
OV24DO
2.60.86120
WW*
5312224
OV24W
1.90.709.0
«**«>
180.7932
0****,
3.00.691.0
<***»
100.671.1
05D&W
160.530.91
05«*W
5.616181
osi&m14
0.8210
OMMW
2.103429
*****
4.40.%1.8
o*w»1.6
0.800.82
<*<*»
3.00.660.90
OSDS-W
120547.1
OM»W
10012
06/tftW
1J(018
a*^3.0
0.630.71
OVI4W
0.820.7438
oyiyw11
0.770.71
oww.5.4033Z7
07/IMW
1.00
73
07/I&W
1.81.1
0.64
•m«5.51.412
07/1*W
3.61.31.1
07/1STO
110.9913
07/ISW
9^0.6943
«Mtt>t»4.74.8
0.93
0*1
1.26^0
«m«
03.50
*»**>
00.76
0
m&ro0
1.90
«^00
1.9
ia«M»01120
12/tn/oo3316
0.72
I2/TO/W
0671.8
Notts:Blank entries indicate data not available.1.2-DCB 1,2-Dichlorobenzene13-DC8 13-Dkhkirobenzene1.4-DCB 1,4-Dkhkirobenzcne
CRA 14246 (1)
AR300095

TABLE 6.1
PERCENT REDUCTION IN COC CONCENTRATIONSBIODEGRADATION TREAT ABILITY STUDY
BIOTREATABILITY SOIL PILE STUDIESMETACHEM PRODUCTS
NEW CASTLE, DELAWARE
Parameters
VOCs
BenzeneTolueneChlorobenzene1.2-Dichlorobenzene13-Oichlorobenzene1.4-Dichlorobenzene
Test Condition
Units
NDNDND100ND>99
NDNDND100ND86
NDNDND100ND82
NDNDND100ND82
NDNDND100ND74
NDNDND100ND47
SVOCs
1.2.3-Trichlorobenzene1.2.4-Trichlorobenzene1,3/5-Trichlorobenzene1,2,3,4-Tetrachlorobenzene1,2,4,5-TetrachlorobenzenePentachlorobenzeneHexachlorobenzeneNitrobenzene
8388
ND592348NDND
6874
ND444840NDND
7480
ND485826
NDND
8082
ND648156
NDND
7984
ND485735
NDND
6970
ND515737NDND
Notes:NDSVOCsVOCs
Non-detect.Semi-volatile organic compounds.Volatile organic compounds.
CRA 14246 (1)AR300096

TABLE 7.1
REDUCTION IN COCs AFTER 9.5 MONTHS TREATMENTBIODEGRADATION TREATABIUTY STUDY
BIOTREATABILITY SOIL PILE STUDIESMETACHEM PRODUCTS
NEW CASTLE, DELAWARE
Test Condition
Total COCs Concentration inUntreated SoilsFinal COCs Concentration inTreated SoilsAmount of COCs LostAmount of COCs on CarbonAmount of DCB on CarbonAmount of DCB detected in AirPercent of COC Loss on Carbon
Units
ing/Kg 104760 313560 313560 313560 313560 313560
mg/Kgmg/Kgmg/Kgmg/KgHg/L%
147758998538856469544343
47550266010387901839581815
55350258210499102354095419
5718025638012076581817444.7
798302337303175415172225514
163395150165
----
Notes:COCs Compounds of ConcernDCB Dichlorobenzene
CRA 14246 (1)
AR300097

TABLE 73.
CALCULATED TREATMENT TIMES AND DEGRADATION RATESBIODEGRADATION TREATABIUTY STUDY
BIOTREATABILTTY SOIL PILE STUDIESMETACHEM PRODUCTS
NEW CASTLE, DELAWARE
1,4-DichlorobenzeneTime to Reach Qean up CriteriaDegradation RatesTime to Reach "20 Rule" TCLP Criteria™
Criteria Test Condition 1 Test Condition 2 Test Condition 3 Test Condition 4 Test Condition 5 Test Condition 6(ppm)
450(1) y = 346.34e-°6065" y = 148606"°1855l( y = 14570e-°16M* y = 15541e-°1438" y = ITM**13"* y = 20660e^05M*< 450 ppm initial 19 months 21 months 25 months 27 months 65 months
NA 187 mg/Kg/month 194 mg/Kg/month 137 mg/Kg/month 126 mg/Kg/month 36 mg/Kg/month150 NA 25 months 28 months 33 months 35 months 83 months
Total ChlorobenzenesTime to Reach Clean up CriteriaDegradation Rates
625n) y = 5244.3e-£U8S8x y = 15631e I7Wl1 y = ISZWe*183*1 y = 19092e-°-15Wx y = 18049eaW65» y = 21384e-a°607*11 months 18 months 20 months 22 months 25 months 58 months
232 mg/Kg/month 221 mg/Kg/month 217 mg/Kg/month 150 mg/Kg/month 147 mg/Kg/month 45 mg/Kg/month
Notes:(1)(2)
NA
dean up criteria established by USEPA ROD based on human health risk assessmentTCLP Criteria for 1,4-DCB = 7.5 mg/L."20 Rule" Criteria - 20x7.5=150mg/L=150 ppm.Not applicable
ppm Parts per millionTCLP Toxicity Characteristic Leaching Procedure
CRA 14246(1)
AR300098

AR300099

AR300100

APPENDIX A
MODIFICATIONS TO EXPERIMENTAL DESIGN
14246 (1)
AR300101

BENCH-SCALE BIOVENTING TREATABIUTY STUDYMODmCATIONS TO EXPERIMENTAL DESIGN
ORIGINAL DESIGN MODIFIED DESIGN RATIONALETest cells constructed of pressure treatedwood
Stainless steel containers used for test cells Avoid possible airflow channeling
Ten percent wood chips used as a bulkingagent
Five percent vermiculhe used as bulkingagent
Eliminate potential inconsistencies inanalytical data associated with organicmatter hi wood
Animal manure used for nutrientamendment
Inorganic fertilizer (dipotassium phosphateand urea) used for nitrogen and phosphorusamendment
Greater uniformity and control of nutrientamendments and reduced potential forinconsistencies in analytical dataassociated with organic matter______
Aerobic samples to be aerated at a rate of144 soil pore volumes per day
Aerobic samples to be aerated at a rate of10 soil pore volumes per day for firstmonth and one pore volume per daythereafter10
Reduce water loss and more closelysimulate full-scale operation
Four treatments [aerobic bioventing ofupland soils, aerobic bioventing of soil pilematerial, aerobic bioventing of soil pilematerial amended with bulking agents andnutrients, pulsed (aerobic/anaerobic)treatment of soil pile material] and onecontrol
Five treatments [soil vapor extraction ofupland soils, soil vapor extraction of soilpile-material*21, aerobic bioventing of soilpile material, aerobic bioventing of soilpile material amended with bulking agentsand nutrients, pulsed (aerobic/anaerobic)treatment of soil pile material01] and onecontrol
Evaluate potential for enhanced treatmentthrough reduction of high concentrationsof organic contaminants by soil vaporextraction in conjunction with bilogicladegradation
NOTES:1. A low microbial count was observed in the pre-test sample analysis which may be attributable to chlorinated benzene toxichy.
Initially aerating at the rate often pore volumes per day is intended to vapor extract some of the chlorinated benzenes and reduceor eliminate any associated toxicity.
2. Soil vapor treatments will be aerated at a constant rate often pore volumes throughout the test program.3. A low concentration (0.01%) of food grade molasses may be added to accelerate the development of anaerobic conditions. AR300102

AR300103

APPENDIX B
CHAIN OF CUSTODY
14246 (1)
AR300104
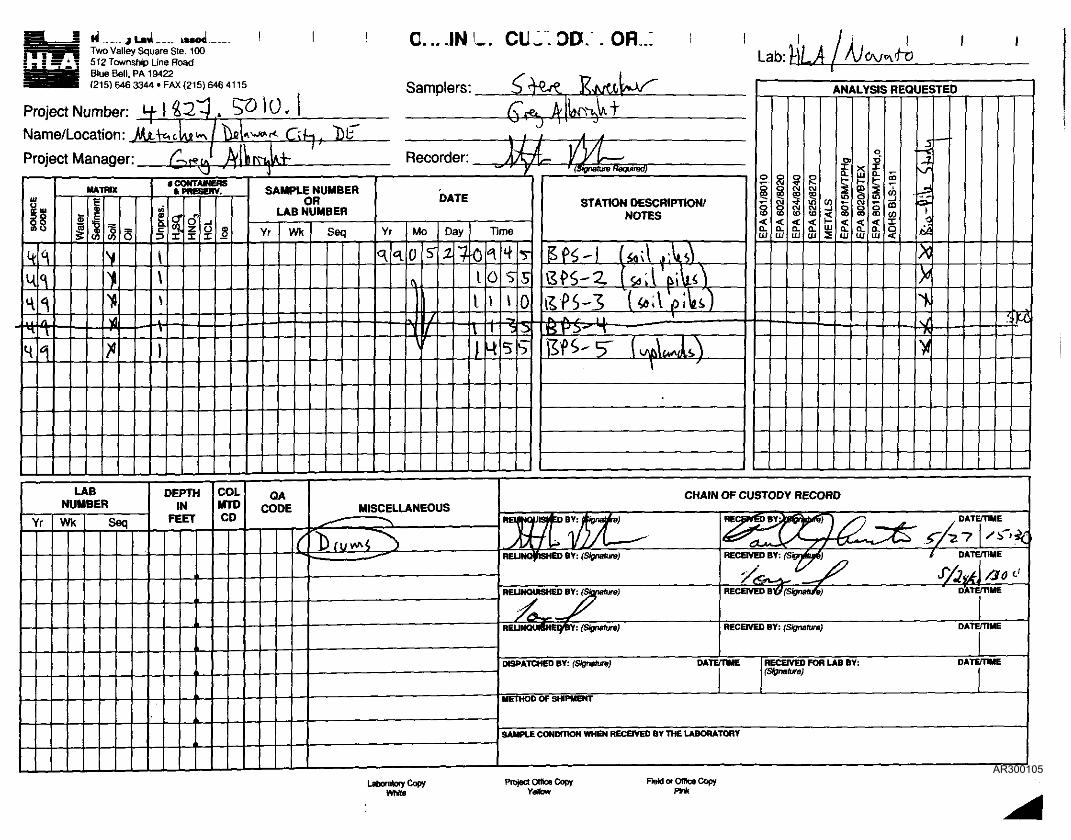
1 A m ••? Two Valley Square Ste. 100I a 5 g^ 512 Township Line Road—————s~~ Blue Bell. PA 19422
C....INL. CU_ OD. . OR...
aHttriBiib (215)646
Project Number:Name/Location:Project Manager
SOUR
CECO
DE
Hu^H
H
^^..»
^
3344 • FAX (215) 646 4115
M-ltotJ. 5010.1AU.W'Aj7K/ UB
^.J /yl^w^rt QJ_, t *])b
)rrt,^V.T-u \J 0MATRIX
tt11sv^
^
V
v-/•^
5
LABNUMBER
Yr Wk Seq
* CONTAINERS&PRE8ERV.
ui
i\\\
I
c?0)
<
zX
c
DEPTHIN
FEET
8
COLMTDCD
SAMPLE NUMBEROR
LAB NUMBER
Yr Wk
QACODE
^
Seq
Samplers£^ AllftTnVt
k / / A i
Recorder:-Jfe . l/i/U*•*• ' y • fS«pna(urB ftoqutod)
DATE
Yr
<\ <\
Mo
0
,
I^1I
^
S"
'
Day
^T-Time
0
I
t
t
1
"I
0
n
MISCELLANEOUS
i\ / ^^\jv (vj ^S J
*t Tssv 0_j 5
59
STATION DESCRIPTION/NOTES
&f$-) (5fl\\ j\sV
SfS-Z l^;l piU^&fS-3 (ttAplVO
_ fv IV , 11 , — * _____________ —— .
rs r 3" M
°t '
ANALYSIS REQUESTED
EPA
601
/801
0EP
A 6
02/8
020
EPA
624/
8240 S
OJ
OJtoa.UJ M
ETAL
S
£to
§Q.UJ EP
A 8
020/
BTE
X
q
XQ-
inoCO
a.UJ A
DH
SBLS
-181
«-iJ.
f~~*e£
*\J
*^1
^ ff\
V• Mi
CHAIN OF CUSTODY RECORDT?7ti/57^REUmftSHED BY: (Signature)
RELINQUISHED BY: (Signature)
^X ^^
REUNOUBHEp Y: (Signature)
[HSPATOeD BY: fSignafuwJ DATE
METHOD OF SHIPMENT
RECEIVED BY^ftgrfeP^r) /O - y DATE /TIME
RECEIVED BY: (Signftut) / DATE/TIMEy £/ ,^/ /s/ ^* ;
RECEIVED BV($l9nati/e) DATE
RECEIVED BY: (Signature) DATE
fTIME RECBVEO FOR LAB BY: DATE(Signature)
/TIME
/TIME
SAMPLE CONDmOH WHEN RECEIVED BY THE LABORATORY
Laboratory CopyWhite
Project Offics CopyYellow
FteMorOfficsCopyPink
AR300105

AR300106

APPENDIX C
DATA VALIDATION/USABILITY REPORT
14246 (1)
AR300107

2055 Niagara Falls Blvd., Suite #3Niagara Falls, New York 14304
" V ® Telephone: (716)297-6150 Fax: (716)297-2265& ASSOCIATES www.CRAworld.com
_ _ _ _ _ _ M E M O R A N D U M
TO: AlanWeston REF. NO.: 14246
FROM: Deborah Andrasko/js/l^ DATE: March 13,2001
RE: Metachem Data Validation/Usability Report
INTRODUCTION
Soil samples were collected from November 1999 through November 2000 and analyzed in support of theMetachem treatability study. Samples were analyzed for Site-Specific Parameter List (SSPL) volatileorganic compounds (VOCs) and SSPL semi-volatile organic compounds (SVOCs) using modified UnitedStates Environmental Protection Agency (USEPA) Methods 8021 and 8121, respectively.
The data quality was assessed based on final sample results, laboratory blank results, laboratory duplicates,and blank spike, and surrogate recoveries.
QUALITY ASSURANCE/QUALITY CONTROL (OA/OQ ASSESSMENT
Initial calibration consisted of a five-point calibration curve in most instances. Some of the VOCs werequantitated using the response of a single level standard or the averaged response of the initial and endingsingle level standards. Generally, all calibration indicated acceptable instrument sensitivity.
Continuing calibration standards were analyzed for all SVOCs and VOCs with the exception of the VOCsingle point calibrations. Some of the analytes did not meet method criteria due to decreased or increasedresponse, indicating possible bias of the associated sample results, but in all instances sufficient sensitivitywas achieved.
Method blanks were prepared and/ or analyzed with each batch of samples. Target analytes were notdetected above the reporting limit in the method blanks.
Blank spikes were prepared and analyzed with each batch of SVOC samples and all recoveries wereacceptable.
Surrogates were added to all VOC and SVOC samples prior to extraction and/ or analysis. SVOC samplesurrogate recoveries could not be assessed due to dilutions necessitated by the sample concentrations oftarget analytes. SVOC analytical efficiency was judged to be acceptable based on good surrogate recoveriesfor the blanks and blank spikes. All VOC recoveries were acceptable indicating good laboratory accuracy.
Laboratory duplicates were prepared and analyzed for most of the SVOC analytical batches and resultswere comparable, indicating acceptable laboratory precision.
ISO 9001ENantEERiNt atnai
AR300108

CRA MEMORANDUM Pa9e 2
CONCLUSION
Significant quality control problems were not observed during the review and sample results reported werejudged acceptable for their intended use.
AR300109