Embed Size (px)
Citation preview
Biochimica et Biophysica Acta 1847 (2015) 458–467
Contents lists available at ScienceDirect
Biochimica et Biophysica Acta
j ourna l homepage: www.e lsev ie r .com/ locate /bbab io
PSI–LHCI of Chlamydomonas reinhardtii: Increasing the absorption crosssection without losing efficiency
Clotilde Le Quiniou, Lijin Tian, Bartlomiej Drop, Emilie Wientjes, Ivo H.M. van Stokkum,Bart van Oort, Roberta Croce ⁎Department of Physics and Astronomy, Faculty of Sciences, VU University Amsterdam, Institute for Lasers, Life and Biophotonics Amsterdam, LaserLaB Amsterdam,De Boelelaan 1081, 1081 HV Amsterdam, The Netherlands
Abbreviations: PSI, Photosystem I; LHCI, Lhca, light-hacenter; CS, charge separation; C.r., Chlamydomonas reincarotenoids; A.t., Arabidopsis thaliana; EET, excitation enmetasulfate; RT, room temperature; CD, circular-dichroiAssociated Spectra; EAS, Evolution Associated Spectra; SAS⁎ Corresponding author at: Department of Physics and
VU University Amsterdam, De Boelelaan 1081, 1081 HVTel.: +31 205986310.
E-mail address: [email protected] (R. Croce).
http://dx.doi.org/10.1016/j.bbabio.2015.02.0010005-2728/© 2015 The Authors. Published by Elsevier B.V
a b s t r a c t
a r t i c l e i n f oArticle history:Received 2 December 2014Received in revised form 28 January 2015Accepted 2 February 2015Available online 10 February 2015
Keywords:Photosystem ILight-harvesting complex IChlamydomonas reinhardtiiRed formsTime-resolved fluorescenceTrapping efficiency
Photosystem I (PSI) is an essential component of photosynthetic membranes. Despite the high sequence andstructural homologies, its absorption properties differ substantially in algae, plants and cyanobacteria. In particu-lar it is characterized by the presence of low-energy chlorophylls (red forms), the number and the energy ofwhich vary in different organisms. The PSI–LHCI (PSI–light harvesting complex I) complex of the green algaChlamydomonas reinhardtii (C.r.) is significantly larger than that of plants, containing five additional light-harvesting complexes (together binding ≈ 65 chlorophylls), and contains red forms with higher energy thanplants. To understand how these differences influence excitation energy transfer and trapping in the system,we studied two PSI–LHCI C.r. particles, differing in antenna size and red-form content, using time-resolvedfluorescence and compared them to plant PSI–LHCI. The excited state kinetics in C.r. shows the same averagelifetime (50 ps) as in plants suggesting that the effect of antenna enlargement is compensated by higher energyred forms. The system equilibrates very fast, indicating that all Lhcas are well-connected, despite their longdistance to the core. The differences between C.r. PSI–LHCI with and without Lhca2 and Lhca9 show that theseLhcas bind red forms, although not the red-most. The red-most forms are in (or functionally close to) otherLhcas and slow down the trapping, but hardly affect the quantum efficiency, which remains as high as 97%even in a complex that contains 235 chlorophylls.
© 2015 The Authors. Published by Elsevier B.V. This is an open access article under the CC BY-NC-ND license(http://creativecommons.org/licenses/by-nc-nd/4.0/).
1. Introduction
Photosynthesis provides energy for nearly all life on Earth. In thefirststep of photosynthesis, light is harvested by photosystem (PS) I and II,which are multi-protein complexes embedded in the thylakoid mem-brane. Their light-harvesting system is composed of a large number ofpigments coordinated by proteins. In both PSs the excitation energy isefficiently transferred to the reaction center (RC) where charge separa-tion (CS) occurs [1]. In eukaryotic organisms, as the unicellular greenalga Chlamydomonas reinhardtii (C.r.), PSI can be divided in two mainparts: the core and the peripheral antennas. The core complex is com-posed of 14 protein subunits (PsaA-PsaL, PsaN and PsaO), togetherbinding ≈ 100 chlorophylls (Chls) and ≈ 20 carotenoids (Cars) [2].
rvesting complex I; RC, reactionhardtii; Chl, chlorophylls; Car,ergy transfer; PMS, phenazinesm; TR, time range; DAS, Decay, Species Associated SpectraAstronomy, Faculty of Sciences,Amsterdam, The Netherlands.
. This is an open access article under
The core coordinates only Chls a, a few of which constitute the RC. Theperipheral antenna, called the light‐harvesting complex I (LHCI) orLhcas, is composed of different Lhca gene products that in addition toChls a and Car, coordinate Chls b ([3,4]). In the following we will referto the PSI supercomplex, composed of the core and peripheral antennas,as PSI–LHCI.
The PSI core complex is very similar among oxygenic photosyntheticorganisms [5]. Highly conserved structures of PSI core have beenobserved for cyanobacteria ([2,6]) and higher plants ([7,8]). Theprimary structure of the core proteins of C.r. shows high homologywith that of plants and cyanobacteria ([9,10]), suggesting a conservedstructure. At variance with the core, the peripheral antenna of higherplants and of C.r. shows major differences in the number of genes([11–13]) and in the biochemical/spectroscopic properties of the com-plexes [14]. PSI–LHCI of C.r. contains nine Lhca proteins (Lhca1–9),located on one side of the core, forming two parallel concentric halfrings [15], by contrast to higher plants PSI–LHCI that is formed of onehalf ring made of only four Lhca proteins ([16,7]).
Another major difference between PSI–LHCI of C.r., higher plant andcyanobacteria is the content of red forms. These red forms are Chls withred-shifted absorption and emission, a large Stokes shift and a largebandwidth compared to bulk Chls (e.g. [17–20]). The red forms
the CC BY-NC-ND license (http://creativecommons.org/licenses/by-nc-nd/4.0/).
Table 1Estimation of the number of Chls and Cars in different PSI–LHCI supercomplexes(see Materials and methods).
Cyanobacteriacore PSI [2]
A.t. PSI–LHCI C.r. SmallPSI–LHCI
C.r. FullPSI–LHCI
Number ofLhcas
4 7 9
Chls a + Chls b 170 209 235Chls a / Chls b 9.7 ± 0.4
[25]4.8 ± 0.2 [15] 4.4 ± 0.1[15]
Chls a 100 154 173 191Chls b 0 16 36 44Carotenoids 22 35 46 52
459C. Le Quiniou et al. / Biochimica et Biophysica Acta 1847 (2015) 458–467
dominate the low temperature fluorescence emission and areresponsible for the 712–717 nm emission in C.r. cells and isolatedC.r. PSI–LHCI ([21–24,15]). This maximum is at higher energy thanthat of Arabidopsis thaliana (A.t.) PSI–LHCI (maximum at 735 nm,[25]) and of most cyanobacteria PSI trimers (e.g. 760 nm inArthrospira platensis, previously called Spirulina platensis, [26,27]).Red forms can be associated with the core and/or with the peripheralantenna of PSI–LHCI. Interestingly, despite the high structuralhomology of PSI core complexes, the red forms present in the coreof different organisms can substantially differ in energy [27]. Inplants the red-most forms are associated with Lhca3 and Lhca4([28,29]), while the core emits at 720 nm [30]. In C.r. red forms areproposed to be associated with both core and peripheral antennas([23,31,24,32–35]). More recently, an in vitro study of C.r. Lhcashas shown that Lhca2, Lhca4 and Lhca9 display the most red-shifted emission [14]. An oligomer of Lhcas, lacking Lhca2, Lhca3and Lhca9, isolated from a PSI core-minus mutant, has an emissionmaximum at 708 nm at 77 K [33], supporting the attribution of thered-most forms to Lhca2 and Lhca9. Nevertheless, the loss of Lhca2and Lhca9 did not lead to a blue shift of the emission maximum ofPSI–LHCI [15], indicating that those complexes are not the (only)responsible for the red-most emission.
Excitation energy transfer (EET) from the red forms to the RC needsto be thermally activated [36] and in higher plants and cyanobacteria,the red forms slow down the trapping kinetics ([27,37]). The averagedecay time is 23 ps for the PSI core of higher plants (e.g. [38,37]) andranges from 23 ps to ≈ 37 ps in different cyanobacteria species withincreasing red forms content (e.g. [27]). In A.t. PSI–LHCI the “blue”Lhca complexes (Lhca1 and Lhca2) transfer excitation energy to thecore four times faster than the “red” Lhca (Lhca3 and Lhca4) [37].
Several time-resolved measurements have been performed onisolated PSI–LHCI of C.r. ([39,35,40,41]) but they have led to differentresults. This is probably due to differences in the protein compositionof the preparations because C.r. PSI–LHCI easily loses part of the Lhcas[15]. Furthermore, in these measurements, phenazine methosulfate(PMS) was used to maintain the PSI RC in its open state, whereas PMSwas recently shown to quench chlorophyll emission [42]. Since it wasalso demonstrated that the trapping kinetics of PSI in open and closedstates differ for less than 4% [42], all the measurements reported hereare performed in the absence of PMS or other reducing agents. In thiswork we measure the fluorescence decay kinetics of two biochemicallyand structurally well characterized C.r. PSI–LHCI complexes obtained inhomogeneous preparations [15]. These two PSI particles have differentantenna composition containing either nine Lhcas (named the “FullPSI–LHCI” in the following) or seven Lhcas (named the “Small PSI–LHCI”in the following) lacking two red-form containing antennas Lhca2 andLhca9. Comparing these particles allows us to study how red formsand antenna size influence EET and trapping kinetics of C.r. PSI–LHCI.
2. Materials and methods
2.1. Sample preparation
PSI–LHCI particles from C.r. were prepared as in Drop et al. (2011)[15]. Small PSI–LHCI was prepared by solubilizing Full PSI–LHCI (finalchlorophyll concentration of 0.2 mg/ml) with 0.5% n-Dodecyl-β-D-maltoside (β-DM) and 0.2% Zwittergent 3–16 (CalbioChem), andcentrifuged overnight (41,000 rpm, 17 h at 4 °C). After centrifugation,two fractions were collected: the upper one was Small PSI–LHCIobtained after solubilization and the lower one was Full PSI–LHCI (stillnot solubilized). Determination of the Chl a, Chl b and Car content inthe C.r. PSI–LHCI particles (Table 1) requires several estimations.We es-timate the total number of Chls in C.r.by adding the total number of Chlsfound in higher plants PSI–LHCI (170, [7]) with the total number of Chlsin the additional Lhcas found in C.r. PSI–LHCI particles [15]. For that, weassume the total number of Chls per Lhca to be 13, between the 10–12
estimated in purified Lhca ([43,44]) and the 14–17 found in the crystalstructure [8]. The Chl a/b ratio of the PSI–LHCI reported in [15] was ob-tained by fitting the absorption spectra of 80% acetone pigment extractswith the spectra of the individual pigments [45]. From the total numberof Chls and the Chl a/b ratio, we estimate the Chl a and Chl b content.The number of Cars per Lhca is calculated from the Chl/Car ratio of thePSI–LHCI of higher plant (4.8 (±0.1), [25]) assuming 100 Chls and 22Cars per core, as in cyanobacteria [2]. It follows that in higher plants,the peripheral antenna contains 13.4 Car, corresponding to 3.4 (±0.2)Cars per Lhca. We assume the number of Cars per Lhca to be the samein Lhcas of C.r. From the Chls and Car content, we can estimate the frac-tion of excitation in the core and the peripheral antennas (see AppendixA and Table A.1).
2.2. Steady state measurements
Absorption spectra were measured on a Varian Cary 4000UV–Visspectrophotometer and fluorescence spectra on a Fluorolog spectroflu-orimeter (Jobin Yvon Horiba). All spectra were measured at room tem-perature (RT) and at 77K (by using a liquidN2Horiba FL-1013 LNdewarwith a home build cuvette holder) in a plastic cuvette 10 mm × 3 mm.To avoid self-absorption, samples were diluted to an OD of 0.07 at theQy maximum (1 cm path length) in a buffer containing 10 mM Tricine(pH 7.8) and 0.03% n-Dodecyl-α-D-maltoside (α-DM). Circular-dichroism (CD) spectra were measured at 10°C on a Chirascan-Plus CDSpectrometer (Applied Photophysics, Surrey). All presented spectraare scaled to the Chl content: the absorption spectra were integratedbetween 630 nm and 750 nm and scaled according to the oscillatorstrength of the particle, by using the estimated number of Chls in theparticle (Table 1) and the ratio of 0.7 for the oscillator strength ofChl b and Chl a in the Qy region. The CD spectra were scaled to theintegrated area under the absorption between 630 nm and 750 nm(which were scaled to the particles' oscillator strengths as describedabove).
2.3. Time-resolved measurements
The picosecond-time-resolved fluorescence measurement wereperformed with a Streak Camera setup as described previously ([27,46]) adapted with a Coherent Vitesse Duo containing an integrated10 W Verdi CW laser (output wavelength 532 nm) both seeding theVitesse ultra fast oscillator (output wavelength 800 nm, averagepower ≈ 100 mW, pulse width ≈ 100 fs, repetition rate 80 MHz) andpumping the regenerative amplifier Coherent RegA 9000 (outputwave-length 800 nm, average power≈ 1W, pulse width 180–200 fs, tunablerepetition rate between 10 kHz and 300 kHz). The output of the RegAfed the optical parametric amplifier Coherent OPA 9400 (output wave-length from 470 nm to 770 nm, average power up to a few mW). Thefrequency-doubled light (400 nm) in the OPA could also be used as anoutput. The repetition rate was set to 250 kHz and the OPA set togenerate either the 400 nm or the 475 nm excitation wavelength. Thelight intensity was modulated with neutral density filters, and residual
460 C. Le Quiniou et al. / Biochimica et Biophysica Acta 1847 (2015) 458–467
800 nm light andwhite light from theOPAwere removedwith an inter-ference filter. The excitation polarization was set vertical with a Berekpolarization compensator (New Focus, model 5540). The light wasfocused in the sample with a 15 cm focal length lens resulting in aspot diameter of 50 μm in the sample. Fluorescence emission wascollected at right angle by two identical achromatic lenses (B. HalleUV-Achromat f = 100 mm) to collimate the light and then focus it onthe input slit (100 μm) of a spectrograph (Chromex 250IS, 50 grooves/mm ruling, blaze wavelength 600 nm, spectral resolution of 2 nm).Scattered excitation light was removed with an optical long-pass filter.A polarizing filter (Spindler & Hoyer, Type 10 K) was placed in betweenthe two achromatic lenses to collect light polarized at magic angle(54.7°) with respect to the excitation polarization. After the spectro-graph, the light was focused on the input slit (40 μm) and then on thephoto-cathode of the streak camera Hamamatsu C5680 mounted withthe M5675 Synchroscan unit (triggered by the Vitesse oscillator) andthe Digital CCD Camera Hamamatsu Orca R2 (read out speed8.5 frame/s). Spectral calibration was done with an Argon lamp (OrielInstruments Argon lamp model 6030) and spectrotemporal sensitivity(shading) correction [46] with a homogeneous white light source(Xenon lamp, Osram HLX 64642 24 V 150 W GER i 028).
Fluorescence was detected from 590 nm to 860 nm and 0 to 155 ps(time range 1, TR1, temporal response: 4–5 ps) and 0 to 1500 ps (TR4,temporal response: 18 ps). Each dataset consisted of a sequence ofimages: 10 images of 5 min at TR1 and 15 images of 1 min at TR4.Image sequences were corrected for background, shading and jitter(temporal drift between images within an image sequence) and finallyaveraged in HPD-TA 8.4.0 (Hamamatsu). These corrected datasets werebinned to 2 nm, and zoomed between 640 nm and 800 nm in Glotaran1.3 [47].
Samples were in 10 mM Tricine (pH 7.8), 0.03% α-DM, 0.5 Msucrose, and measured in a 10 mm × 10 mm quartz cuvette at room
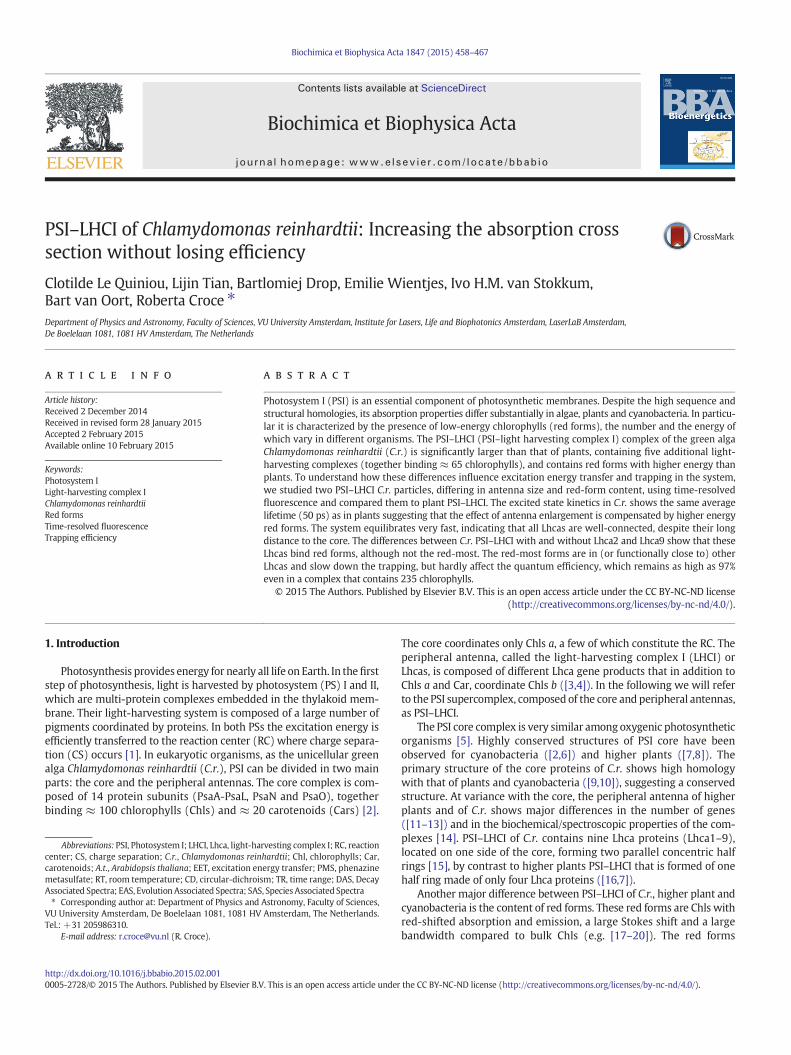
Fig. 1. Steady state absorption and emission spectra. (a) RT absorption spectra of Full PSI–LHCI (their difference spectrum (green, enlarged by 3). The difference spectrum overlaps well with thQymaximumof thedifference spectrum); (b) fluorescence emission (upon 475nmexcitation)pink respectively), normalized to themaximum; (c) CD at 10 °C of Full PSI–LHCI (black) and Smexcitation in the peripheral antenna relative to the entire complex. The absorption of Lhcas is obscaled to the Chl content, see Appendix A-Method 1).
temperature (RT). OD at the Qy maximum was 0.98 (Full PSI–LHCI)and 0.86 (Small PSI–LHCI). To avoid self-absorption, the laser beamwas focused in the sample close to the cuvette wall and emission wascollected at right angle close to the entry point of the laser beam intothe cuvette. To avoid singlet-singlet annihilation by multiple simulta-neous excitation of PSI–LHCI complex, the pulse energy was reducedto 0.6 nJ. To avoid singlet-triplet annihilation, the sample was stirredwith a magnet bar. A power study confirms the absence of annihilation(results not shown).
2.4. Data analysis of time-resolved measurements
The streak camera datasets were analyzed globally with asequential model in order to extract a minimum number of expo-nential components n (with increasing lifetimes τn) that can satis-factorily describe the data (no structure in the residuals). The twodatasets from the same experimental condition (corresponding tothe two TRs) were fitted simultaneously with the same kineticscheme and spectra. The fit yields Evolution Associated Spectra(EAS) characterizing the spectral evolution (e.g. the third EASrises with the second lifetime and decays with the third lifetime).Decay Associated Spectra (DAS) corresponding to a loss or again of emission at specific lifetimes, were calculated from theEAS ([48,49,46]). The raw decay measured at one detectionwavelength (λ) can be written as a sum of exponential decays(convoluted by the IRF) weighted by their DAS ([48,49,46]):Decay(λ, t) = ∑n[DASn(λ). (IRF ⊗ exp(− t/τn))]. The IRF wasmodeled as the sum of two Gaussians, with full-widths at half max-imum (FWHM) of 4–5 ps (94.5% relative integrated area) and 21 ps(5.5%) for TR1 and 18 ps (92.6%) and 288 ps (8.4%) for TR4.
The average decay time τav CS (Eq. (1)) characterizes the time untilCS occurs (for open RCs) and is calculated by considering only the
black) and Small PSI–LHCI (red, scaled to their Chl content, seeMaterials andmethods) ande sum of the absorption spectra of reconstituted Lhca2 and Lhca9 (blue, normalized to theof Full PSI–LHCI and Small PSI–LHCI at RT (black and red respectively) and at 77 K (blue andall PSI–LHCI (red) (scaled to the Chl content, seeMaterials andmethods); (d) Percentage oftained after subtracting the absorption of the core from that of the PSI–LHCI particles (both

Fig. 2. Time resolved fluorescence results. (a) Streak camera image of Full PSI–LHCI upon475 nm excitation for the short time range. Colors represent the fluorescence emissionintensity from zero (orange) to high fluorescence (red); (b) fluorescence decay kinetics(integration from 640 nm to 800 nm) upon 475 nm and 400 nm for Full PSI–LHCI (blackand red, respectively) and Small PSI–LHCI (blue and pink, respectively). The decays arenormalized to their maximum.
461C. Le Quiniou et al. / Biochimica et Biophysica Acta 1847 (2015) 458–467
components attributed to the PSI–LHCI kinetics (excluding componentsattributed to e.g. disconnected species).
τav CS ¼Xn
τn:Anð Þ=XnAn 1
In Eq. (1), An is the area under the DAS of the n-th component(i.e. its total amplitude). This approach excludes all componentsassociated with energy transfer in the average decay time calcula-tion, since their positive and negative contributions will cancel(assuming no superradiant or dark states). In cases where transfercomponents yielded An b 0 this was attributed to noise, and An wasset to zero.
The data were further analyzed by a target fit ([48–50]) of all eightstreak camera datasets simultaneously with the model described inScheme 1. The model consists of two compartments for Small PSI–LHCIand three for Full PSI–LHCI. The additional compartment in Full PSI–LHCI (green box in Scheme 1) represents the difference between thetwo PSI particles and can be structurally associated with the two anten-nas Lhca2 and Lhca9. Species Associated Spectra (SAS), characterizingthe emission properties of each species, were estimated by means ofa non-negative least-squares variable projection algorithm [51].Equilibria could be estimated under the assumption of equal oscillatorstrength of all species (equal area under the SAS, [52]). All rate constantswere estimated (uncertainties ranging from 0.8% to 3%) as well asthe free-energy difference between the different compartments(uncertainties ranging from 0.2% and 1.3%). Some kinetics faster thanthe time-resolutionwere visible around t0 (Fig. 2). Theseweremodeledas precursors of the other compartments (see Appendix B.1 for moredetails). Additionally the model contained two functionally discon-nected species with small population (between 1.0% and 6.8%) andns-lifetimes. The full kinetic scheme is presented in Appendix B.1.
3. Results
3.1. Steady state characterization
The steady state absorption and fluorescence emission spectra ofFull and Small PSI–LHCI are presented in Fig. 1 a and b. The absorptionmaximum in the Qy region at room temperature (RT) is at 679.5 nmfor both complexes, as previously observed [15]. The estimated numberof Chls in the PSI–LHCI particles (Table 1) was used to scale the absorp-tion spectra to their Chl content (see Materials and methods). Theabsorption difference spectrum between the two PSI–LHCI particles(Fig. 1a, green) matches the average absorption of reconstituted Lhca2and Lhca9 (Fig. 1a, blue), indicating that the presence/absence of thesetwo complexes is the main difference between the two preparations.
The maxima of the fluorescence emission spectra at RT and 77 K forboth particles were 687 nm and 714.5 nm respectively (Fig. 1b) inagreement with previous results [15].
To check whether the dissociation of Lhca2 and 9 affects the overallorganization of PSI–LHCI, circular dichroism (CD) spectra were mea-sured (Fig. 1c). The high similarity between the CD spectra of the twoparticles indicates that the loss of the two Lhca subunits does not havelarge secondary effects on the supercomplex organization.
3.2. Time-resolved fluorescence and global sequential analysis
To get insights into the processes of excitation energy transfer andtrapping in large systems, it is useful to compare the decay kineticsupon selective excitation of the core and the peripheral antennas ([53,54]). The difference in absorption between the core and the peripheralantennas is emphasized at 400 nm and 475 nm (Fig. 1d): The largestabsorption from the peripheral antenna is visible at 475 nm (≈80%,see Table A.1) whereas the core and the peripheral antennas havealmost the same absorption at 400 nm. Therefore these two
wavelengths were used for excitation when measuring time-resolvedfluorescence kinetics with a streak camera setup.
Four parallel experiments were performed: Small and Full PSI–LHCIupon 400 nm and 475 nm excitation. Each sample/excitation combina-tion was measured at two time windows (short time range, 0–155 ps,and long time range, 0–1500 ps), yielding eight streak camera datasets.A typical dataset is presented in Fig. 2a.
When comparing the fluorescence decay integrated over all wave-lengths (Fig. 2b) two preliminary observations can be made, whichare in line with the expectations: (i) Full PSI–LHCI has a slower overalldecay than Small PSI–LHCI at both excitation wavelengths, in agree-ment with the difference in antenna size and (ii) for both particles theoverall decay upon 400 nm excitation is faster than upon 475 nm, inagreement with a preferential excitation of the peripheral antenna at475 nm.
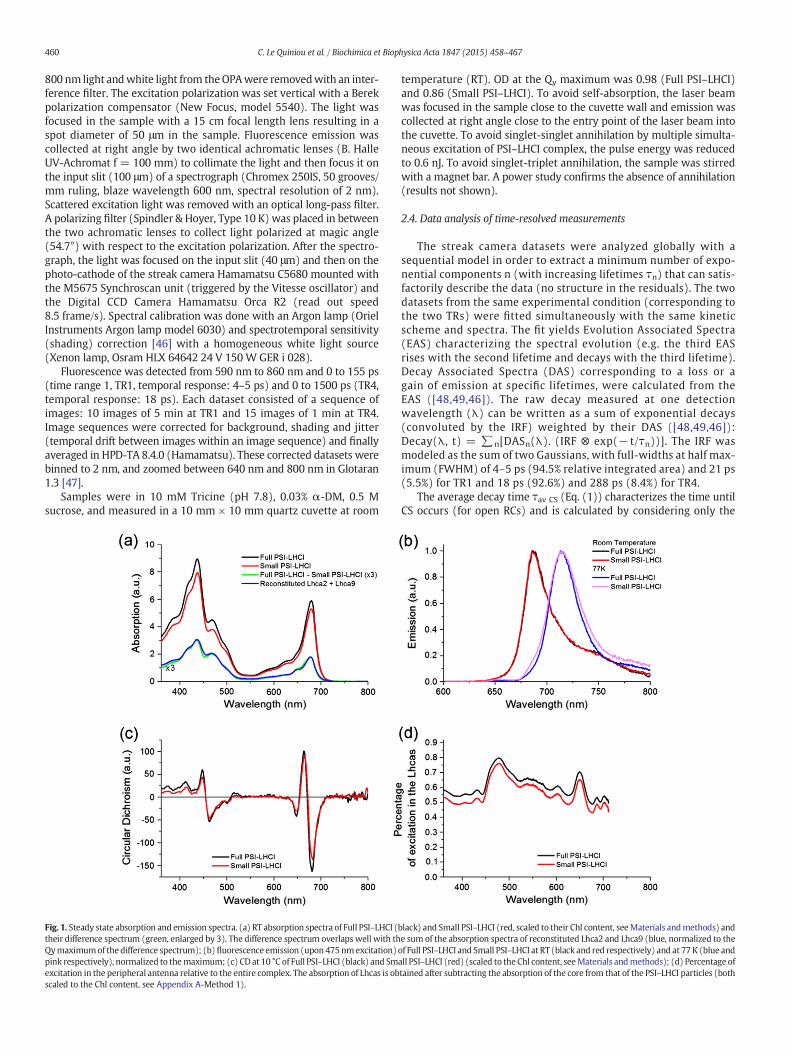
The sequential analysis showed that at least four exponentiallydecaying components are required to describe the data. The DecayAssociated Spectra (DAS) of Full PSI–LHCI measured upon 400 nmexcitation are presented in Fig. 3b (dash lines). The fastest component(1.0 ps) represents excitation energy transfer from blue Chls (amixture
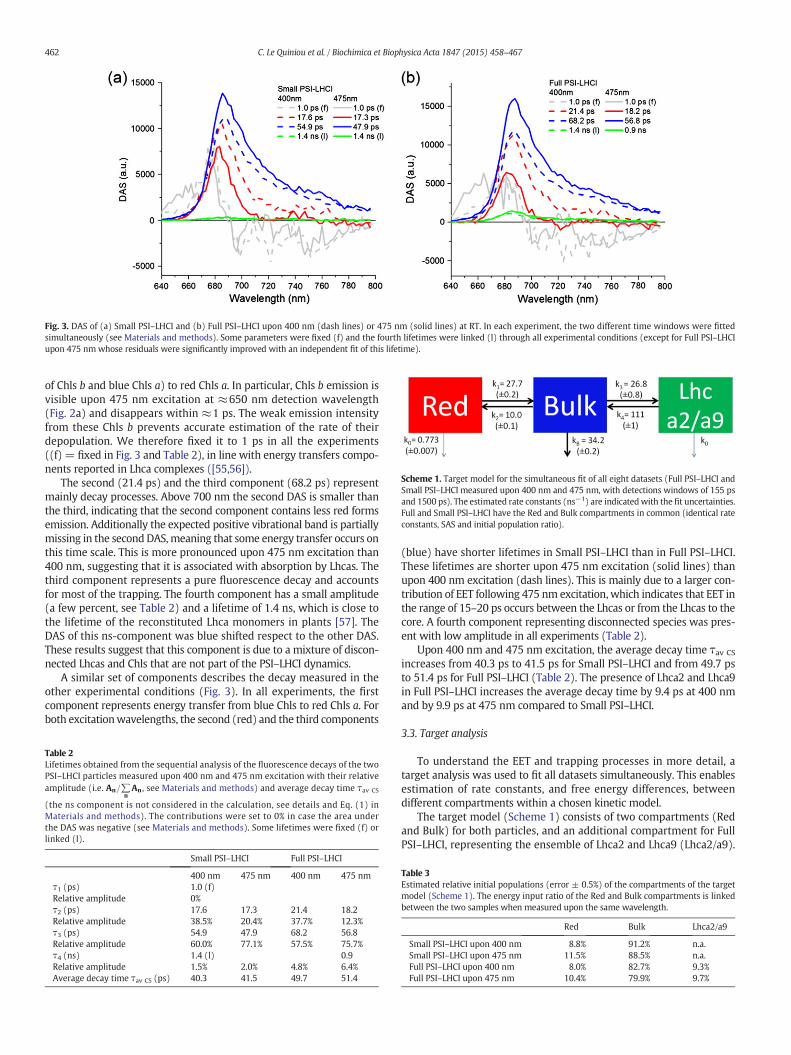
Fig. 3. DAS of (a) Small PSI–LHCI and (b) Full PSI–LHCI upon 400 nm (dash lines) or 475 nm (solid lines) at RT. In each experiment, the two different time windows were fittedsimultaneously (see Materials and methods). Some parameters were fixed (f) and the fourth lifetimes were linked (l) through all experimental conditions (except for Full PSI–LHCIupon 475 nmwhose residuals were significantly improved with an independent fit of this lifetime).
Scheme 1. Target model for the simultaneous fit of all eight datasets (Full PSI–LHCI andSmall PSI–LHCI measured upon 400 nm and 475 nm, with detections windows of 155 psand 1500 ps). The estimated rate constants (ns−1) are indicatedwith the fit uncertainties.Full and Small PSI–LHCI have the Red and Bulk compartments in common (identical rateconstants, SAS and initial population ratio).
462 C. Le Quiniou et al. / Biochimica et Biophysica Acta 1847 (2015) 458–467
of Chls b and blue Chls a) to red Chls a. In particular, Chls b emission isvisible upon 475 nm excitation at ≈650 nm detection wavelength(Fig. 2a) and disappears within ≈1 ps. The weak emission intensityfrom these Chls b prevents accurate estimation of the rate of theirdepopulation. We therefore fixed it to 1 ps in all the experiments((f) = fixed in Fig. 3 and Table 2), in line with energy transfers compo-nents reported in Lhca complexes ([55,56]).
The second (21.4 ps) and the third component (68.2 ps) representmainly decay processes. Above 700 nm the second DAS is smaller thanthe third, indicating that the second component contains less red formsemission. Additionally the expected positive vibrational band is partiallymissing in the second DAS,meaning that some energy transfer occurs onthis time scale. This is more pronounced upon 475 nm excitation than400 nm, suggesting that it is associated with absorption by Lhcas. Thethird component represents a pure fluorescence decay and accountsfor most of the trapping. The fourth component has a small amplitude(a few percent, see Table 2) and a lifetime of 1.4 ns, which is close tothe lifetime of the reconstituted Lhca monomers in plants [57]. TheDAS of this ns-component was blue shifted respect to the other DAS.These results suggest that this component is due to a mixture of discon-nected Lhcas and Chls that are not part of the PSI–LHCI dynamics.
A similar set of components describes the decay measured in theother experimental conditions (Fig. 3). In all experiments, the firstcomponent represents energy transfer from blue Chls to red Chls a. Forboth excitationwavelengths, the second (red) and the third components
Table 2Lifetimes obtained from the sequential analysis of the fluorescence decays of the twoPSI–LHCI particles measured upon 400 nm and 475 nm excitation with their relativeamplitude (i.e. An=∑
nAn , see Materials and methods) and average decay time τav CS
(the ns component is not considered in the calculation, see details and Eq. (1) inMaterials and methods). The contributions were set to 0% in case the area underthe DAS was negative (see Materials and methods). Some lifetimes were fixed (f) orlinked (l).
Small PSI–LHCI Full PSI–LHCI
400 nm 475 nm 400 nm 475 nmτ1 (ps) 1.0 (f)Relative amplitude 0%τ2 (ps) 17.6 17.3 21.4 18.2Relative amplitude 38.5% 20.4% 37.7% 12.3%τ3 (ps) 54.9 47.9 68.2 56.8Relative amplitude 60.0% 77.1% 57.5% 75.7%τ4 (ns) 1.4 (l) 0.9Relative amplitude 1.5% 2.0% 4.8% 6.4%Average decay time τav CS (ps) 40.3 41.5 49.7 51.4
(blue) have shorter lifetimes in Small PSI–LHCI than in Full PSI–LHCI.These lifetimes are shorter upon 475 nm excitation (solid lines) thanupon 400 nm excitation (dash lines). This is mainly due to a larger con-tribution of EET following 475 nm excitation, which indicates that EET inthe range of 15–20 ps occurs between the Lhcas or from the Lhcas to thecore. A fourth component representing disconnected species was pres-ent with low amplitude in all experiments (Table 2).
Upon 400 nm and 475 nm excitation, the average decay time τav CS
increases from 40.3 ps to 41.5 ps for Small PSI–LHCI and from 49.7 psto 51.4 ps for Full PSI–LHCI (Table 2). The presence of Lhca2 and Lhca9in Full PSI–LHCI increases the average decay time by 9.4 ps at 400 nmand by 9.9 ps at 475 nm compared to Small PSI–LHCI.
3.3. Target analysis
To understand the EET and trapping processes in more detail, atarget analysis was used to fit all datasets simultaneously. This enablesestimation of rate constants, and free energy differences, betweendifferent compartments within a chosen kinetic model.
The target model (Scheme 1) consists of two compartments (Redand Bulk) for both particles, and an additional compartment for FullPSI–LHCI, representing the ensemble of Lhca2 and Lhca9 (Lhca2/a9).
Table 3Estimated relative initial populations (error ± 0.5%) of the compartments of the targetmodel (Scheme 1). The energy input ratio of the Red and Bulk compartments is linkedbetween the two samples when measured upon the same wavelength.
Red Bulk Lhca2/a9
Small PSI–LHCI upon 400 nm 8.8% 91.2% n.a.Small PSI–LHCI upon 475 nm 11.5% 88.5% n.a.Full PSI–LHCI upon 400 nm 8.0% 82.7% 9.3%Full PSI–LHCI upon 475 nm 10.4% 79.9% 9.7%
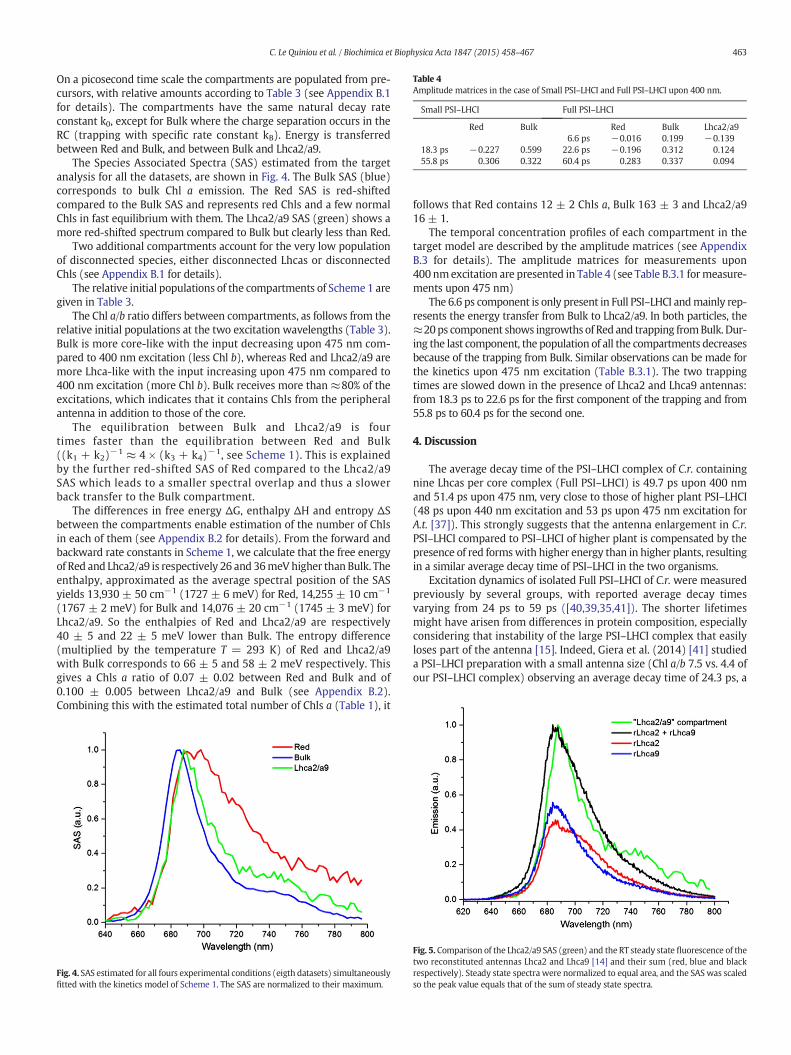
Table 4Amplitude matrices in the case of Small PSI–LHCI and Full PSI–LHCI upon 400 nm.
Small PSI–LHCI Full PSI–LHCI
Red Bulk Red Bulk Lhca2/a96.6 ps −0.016 0.199 −0.139
18.3 ps −0.227 0.599 22.6 ps −0.196 0.312 0.12455.8 ps 0.306 0.322 60.4 ps 0.283 0.337 0.094
463C. Le Quiniou et al. / Biochimica et Biophysica Acta 1847 (2015) 458–467
On a picosecond time scale the compartments are populated from pre-cursors, with relative amounts according to Table 3 (see Appendix B.1for details). The compartments have the same natural decay rateconstant k0, except for Bulk where the charge separation occurs in theRC (trapping with specific rate constant kB). Energy is transferredbetween Red and Bulk, and between Bulk and Lhca2/a9.
The Species Associated Spectra (SAS) estimated from the targetanalysis for all the datasets, are shown in Fig. 4. The Bulk SAS (blue)corresponds to bulk Chl a emission. The Red SAS is red-shiftedcompared to the Bulk SAS and represents red Chls and a few normalChls in fast equilibrium with them. The Lhca2/a9 SAS (green) shows amore red-shifted spectrum compared to Bulk but clearly less than Red.
Two additional compartments account for the very low populationof disconnected species, either disconnected Lhcas or disconnectedChls (see Appendix B.1 for details).
The relative initial populations of the compartments of Scheme 1 aregiven in Table 3.
The Chl a/b ratio differs between compartments, as follows from therelative initial populations at the two excitation wavelengths (Table 3).Bulk is more core-like with the input decreasing upon 475 nm com-pared to 400 nm excitation (less Chl b), whereas Red and Lhca2/a9 aremore Lhca-like with the input increasing upon 475 nm compared to400 nm excitation (more Chl b). Bulk receives more than ≈80% of theexcitations, which indicates that it contains Chls from the peripheralantenna in addition to those of the core.
The equilibration between Bulk and Lhca2/a9 is fourtimes faster than the equilibration between Red and Bulk((k1 + k2)−1 ≈ 4 × (k3 + k4)−1, see Scheme 1). This is explainedby the further red-shifted SAS of Red compared to the Lhca2/a9SAS which leads to a smaller spectral overlap and thus a slowerback transfer to the Bulk compartment.
The differences in free energy ΔG, enthalpy ΔH and entropy ΔSbetween the compartments enable estimation of the number of Chlsin each of them (see Appendix B.2 for details). From the forward andbackward rate constants in Scheme 1, we calculate that the free energyof Red and Lhca2/a9 is respectively 26 and 36meVhigher than Bulk. Theenthalpy, approximated as the average spectral position of the SASyields 13,930 ± 50 cm−1 (1727 ± 6 meV) for Red, 14,255 ± 10 cm−1
(1767 ± 2 meV) for Bulk and 14,076 ± 20 cm−1 (1745 ± 3 meV) forLhca2/a9. So the enthalpies of Red and Lhca2/a9 are respectively40 ± 5 and 22 ± 5 meV lower than Bulk. The entropy difference(multiplied by the temperature T = 293 K) of Red and Lhca2/a9with Bulk corresponds to 66 ± 5 and 58 ± 2 meV respectively. Thisgives a Chls a ratio of 0.07 ± 0.02 between Red and Bulk and of0.100 ± 0.005 between Lhca2/a9 and Bulk (see Appendix B.2).Combining this with the estimated total number of Chls a (Table 1), it
Fig. 4. SAS estimated for all fours experimental conditions (eigth datasets) simultaneouslyfitted with the kinetics model of Scheme 1. The SAS are normalized to their maximum.
follows that Red contains 12 ± 2 Chls a, Bulk 163 ± 3 and Lhca2/a916 ± 1.
The temporal concentration profiles of each compartment in thetarget model are described by the amplitude matrices (see AppendixB.3 for details). The amplitude matrices for measurements upon400 nmexcitation are presented in Table 4 (see Table B.3.1 formeasure-ments upon 475 nm)
The 6.6 ps component is only present in Full PSI–LHCI andmainly rep-resents the energy transfer from Bulk to Lhca2/a9. In both particles, the≈20ps component shows ingrowths of Red and trapping fromBulk. Dur-ing the last component, the population of all the compartments decreasesbecause of the trapping from Bulk. Similar observations can be made forthe kinetics upon 475 nm excitation (Table B.3.1). The two trappingtimes are slowed down in the presence of Lhca2 and Lhca9 antennas:from 18.3 ps to 22.6 ps for the first component of the trapping and from55.8 ps to 60.4 ps for the second one.
4. Discussion
The average decay time of the PSI–LHCI complex of C.r. containingnine Lhcas per core complex (Full PSI–LHCI) is 49.7 ps upon 400 nmand 51.4 ps upon 475 nm, very close to those of higher plant PSI–LHCI(48 ps upon 440 nm excitation and 53 ps upon 475 nm excitation forA.t. [37]). This strongly suggests that the antenna enlargement in C.r.PSI–LHCI compared to PSI–LHCI of higher plant is compensated by thepresence of red formswith higher energy than in higher plants, resultingin a similar average decay time of PSI–LHCI in the two organisms.
Excitation dynamics of isolated Full PSI–LHCI of C.r. were measuredpreviously by several groups, with reported average decay timesvarying from 24 ps to 59 ps ([40,39,35,41]). The shorter lifetimesmight have arisen from differences in protein composition, especiallyconsidering that instability of the large PSI–LHCI complex that easilyloses part of the antenna [15]. Indeed, Giera et al. (2014) [41] studieda PSI–LHCI preparation with a small antenna size (Chl a/b 7.5 vs. 4.4 ofour PSI–LHCI complex) observing an average decay time of 24.3 ps, a
Fig. 5. Comparison of the Lhca2/a9 SAS (green) and the RT steady state fluorescence of thetwo reconstituted antennas Lhca2 and Lhca9 [14] and their sum (red, blue and blackrespectively). Steady state spectra were normalized to equal area, and the SAS was scaledso the peak value equals that of the sum of steady state spectra.
464 C. Le Quiniou et al. / Biochimica et Biophysica Acta 1847 (2015) 458–467
value close to that of the core complex [37]. The longer lifetimes in ([39,35]) are probably due to some photosystem II impurity present in thepreparations as indicated by the authors [58]. These impurities areabsent in our preparation [15] thanks to the presence of a His tag onPsaA [59] which facilitates the purification.
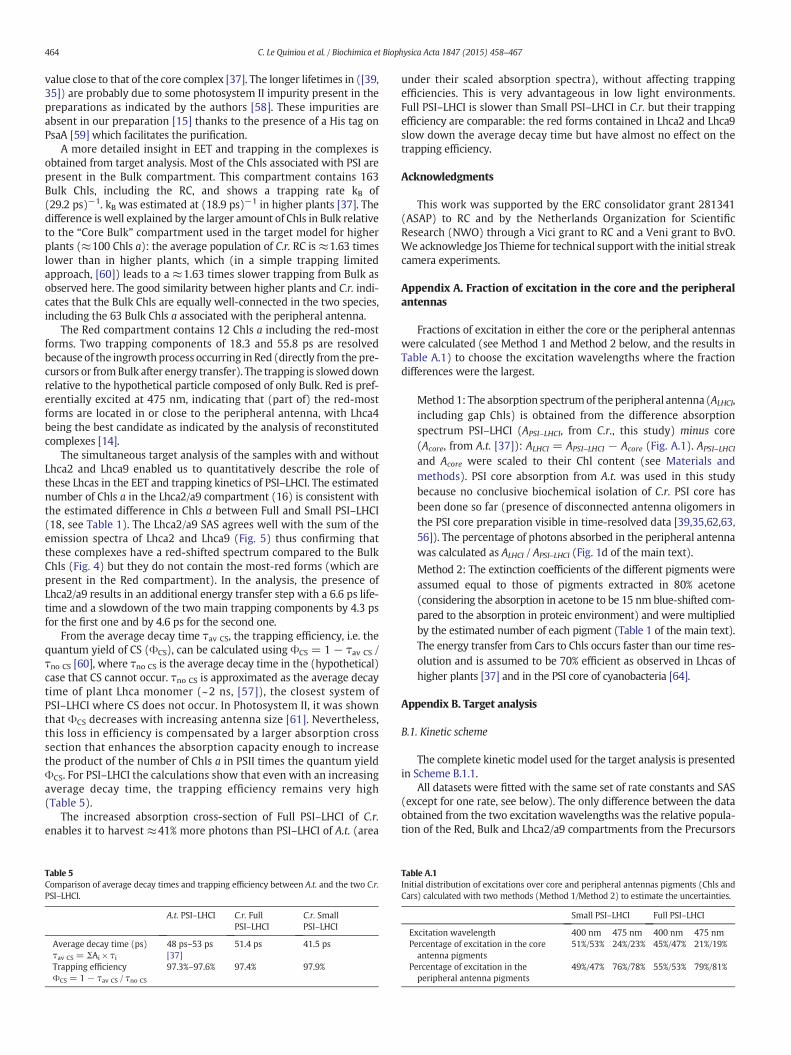
A more detailed insight in EET and trapping in the complexes isobtained from target analysis. Most of the Chls associated with PSI arepresent in the Bulk compartment. This compartment contains 163Bulk Chls, including the RC, and shows a trapping rate kB of(29.2 ps)−1. kB was estimated at (18.9 ps)−1 in higher plants [37]. Thedifference is well explained by the larger amount of Chls in Bulk relativeto the “Core Bulk” compartment used in the target model for higherplants (≈100 Chls a): the average population of C.r. RC is ≈1.63 timeslower than in higher plants, which (in a simple trapping limitedapproach, [60]) leads to a ≈1.63 times slower trapping from Bulk asobserved here. The good similarity between higher plants and C.r. indi-cates that the Bulk Chls are equally well-connected in the two species,including the 63 Bulk Chls a associated with the peripheral antenna.
The Red compartment contains 12 Chls a including the red-mostforms. Two trapping components of 18.3 and 55.8 ps are resolvedbecause of the ingrowthprocess occurring in Red (directly from the pre-cursors or fromBulk after energy transfer). The trapping is slowed downrelative to the hypothetical particle composed of only Bulk. Red is pref-erentially excited at 475 nm, indicating that (part of) the red-mostforms are located in or close to the peripheral antenna, with Lhca4being the best candidate as indicated by the analysis of reconstitutedcomplexes [14].
The simultaneous target analysis of the samples with and withoutLhca2 and Lhca9 enabled us to quantitatively describe the role ofthese Lhcas in the EET and trapping kinetics of PSI–LHCI. The estimatednumber of Chls a in the Lhca2/a9 compartment (16) is consistent withthe estimated difference in Chls a between Full and Small PSI–LHCI(18, see Table 1). The Lhca2/a9 SAS agrees well with the sum of theemission spectra of Lhca2 and Lhca9 (Fig. 5) thus confirming thatthese complexes have a red-shifted spectrum compared to the BulkChls (Fig. 4) but they do not contain the most-red forms (which arepresent in the Red compartment). In the analysis, the presence ofLhca2/a9 results in an additional energy transfer step with a 6.6 ps life-time and a slowdown of the two main trapping components by 4.3 psfor the first one and by 4.6 ps for the second one.
From the average decay time τav CS, the trapping efficiency, i.e. thequantum yield of CS (ΦCS), can be calculated using ΦCS = 1 − τav CS /τno CS [60], where τno CS is the average decay time in the (hypothetical)case that CS cannot occur. τno CS is approximated as the average decaytime of plant Lhca monomer (~2 ns, [57]), the closest system ofPSI–LHCI where CS does not occur. In Photosystem II, it was shownthat ΦCS decreases with increasing antenna size [61]. Nevertheless,this loss in efficiency is compensated by a larger absorption crosssection that enhances the absorption capacity enough to increasethe product of the number of Chls a in PSII times the quantum yieldΦCS. For PSI–LHCI the calculations show that even with an increasingaverage decay time, the trapping efficiency remains very high(Table 5).
The increased absorption cross-section of Full PSI–LHCI of C.r.enables it to harvest ≈41% more photons than PSI–LHCI of A.t. (area
Table 5Comparison of average decay times and trapping efficiency between A.t. and the two C.r.PSI–LHCI.
A.t. PSI–LHCI C.r. FullPSI–LHCI
C.r. SmallPSI–LHCI
Average decay time (ps)τav CS = ΣAi × τi
48 ps–53 ps[37]
51.4 ps 41.5 ps
Trapping efficiencyΦCS = 1 − τav CS / τno CS
97.3%–97.6% 97.4% 97.9%
under their scaled absorption spectra), without affecting trappingefficiencies. This is very advantageous in low light environments.Full PSI–LHCI is slower than Small PSI–LHCI in C.r. but their trappingefficiency are comparable: the red forms contained in Lhca2 and Lhca9slow down the average decay time but have almost no effect on thetrapping efficiency.
Acknowledgments
This work was supported by the ERC consolidator grant 281341(ASAP) to RC and by the Netherlands Organization for ScientificResearch (NWO) through a Vici grant to RC and a Veni grant to BvO.We acknowledge Jos Thieme for technical supportwith the initial streakcamera experiments.
Appendix A. Fraction of excitation in the core and the peripheralantennas
Fractions of excitation in either the core or the peripheral antennaswere calculated (see Method 1 and Method 2 below, and the results inTable A.1) to choose the excitation wavelengths where the fractiondifferences were the largest.
Method 1: The absorption spectrumof the peripheral antenna (ALHCI,including gap Chls) is obtained from the difference absorptionspectrum PSI–LHCI (APSI–LHCI, from C.r., this study) minus core(Acore, from A.t. [37]): ALHCI = APSI–LHCI − Acore (Fig. A.1). APSI–LHCI
and Acore were scaled to their Chl content (see Materials andmethods). PSI core absorption from A.t. was used in this studybecause no conclusive biochemical isolation of C.r. PSI core hasbeen done so far (presence of disconnected antenna oligomers inthe PSI core preparation visible in time-resolved data [39,35,62,63,56]). The percentage of photons absorbed in the peripheral antennawas calculated as ALHCI / APSI–LHCI (Fig. 1d of the main text).
Method 2: The extinction coefficients of the different pigments wereassumed equal to those of pigments extracted in 80% acetone(considering the absorption in acetone to be 15 nm blue-shifted com-pared to the absorption in proteic environment) and were multipliedby the estimated number of each pigment (Table 1 of the main text).The energy transfer from Cars to Chls occurs faster than our time res-olution and is assumed to be 70% efficient as observed in Lhcas ofhigher plants [37] and in the PSI core of cyanobacteria [64].
Appendix B. Target analysis
B.1. Kinetic scheme
The complete kinetic model used for the target analysis is presentedin Scheme B.1.1.
All datasets were fitted with the same set of rate constants and SAS(except for one rate, see below). The only difference between the dataobtained from the two excitation wavelengths was the relative popula-tion of the Red, Bulk and Lhca2/a9 compartments from the Precursors
Table A.1Initial distribution of excitations over core and peripheral antennas pigments (Chls andCars) calculated with two methods (Method 1/Method 2) to estimate the uncertainties.
Small PSI–LHCI Full PSI–LHCI
Excitation wavelength 400 nm 475 nm 400 nm 475 nmPercentage of excitation in the coreantenna pigments
51%/53% 24%/23% 45%/47% 21%/19%
Percentage of excitation in theperipheral antenna pigments
49%/47% 76%/78% 55%/53% 79%/81%
SchemeB.1.1.Complete kineticmodel including precursors and compartments associatedwith the disconnected species. Rates are indicated in ns−1, with fit uncertainties.
Scheme B.2.1. Free energy ΔG, enthalpy ΔH differences between the compartments andbulk.
465C. Le Quiniou et al. / Biochimica et Biophysica Acta 1847 (2015) 458–467
compartment (Table 3 of the main text). The precursor compartmentcontains emission from pigments that transfer energy among them-selves faster than the time resolution of our instrument (≈2 ps). Itsspectrum contains Chl a and Chl b (especially visible after 475 nmexcitation). It rapidly (1–1.3 ps) depopulates into Red, Bulk andLhca2/a9.
The simultaneous target analysis of all datasets enabled the differen-tiation of the disconnected species into two compartments. The discon-nected species are either disconnected Lhcas (named “Disc. Lhcas”)whose rate constant kDL is (1.29 ns)−1, or disconnected Chls (named“Disc. Chls.”) whose rate constant kDC is (3.8 ns)−1. The Disc. LhcasSAS (cyan in Fig. B.1.1) is indeed Lhca-like as indicated by its higherred emission compared to the Bulk SAS (blue). The Disc. Chls SAS(dark green in Fig. B.1.1) has the typical blue-shifted spectrum of freeChls with the expected emission maximum around 675 nm.
The decay rates of Disc. Lhcas were linked for all experimentalconditions except for Full PSI–LHCI upon 475 nm whose lifetime wasfitted independently to improve significantly the residuals at longtime scale. The other fit parameters were not affecting by “unlinking”this decay rate. This difference in decay rates for Disc. Lhcas betweenthe two excitation wavelengths may suggest subpopulations of Lhcaspresent in the membrane. Further quenched Lhcas could be preferen-tially excited upon 475 nm.
Fig. A.1. RT absorption spectra of the core complex from A.t. (black) and the peripheralantenna (calculated as in Method 1 below) of C.r. in Full PSI–LHCI (red) and Small PSI–LHCI (blue), scaled to their Chl content.
B.2. The differences in free energy ΔG, enthalpy ΔH and entropy ΔS
The free energy difference ΔG between the compartments and Bulkare presented in Scheme B.2.1. From the forward and backward rateconstants, ΔG is calculated as ΔGij = Gj − Gi = − kBT. ln(ki → j/kj → i). The enthalpy H corresponds to the energy level of the Chlscontained in one compartment and is approximated in this study asthe average spectral position of the SAS.ΔH between the compartmentsand Bulk is represented with dashed lines in Scheme B.2.1.
The entropy difference, calculated from the two previous energydifferences with TΔS = ΔH − ΔG, represents the thermal activationthat enables up-hill EET from the red forms. The ratio of the number
of Chls a between compartments is obtained withNi
Nj¼ exp −ΔSi j
kB
� �,
assuming all excitations on Chl a and none on Chl b. Knowing thetotal number of Chls, we can estimate the number of Chls in eachcompartment (see main text).
B.3. Amplitude matrices at 475 nm
In amplitude matrices, each compartment populates (negativeamplitudes) and depopulates (positive amplitudes) at indicated
Fig. B.1.1. SAS of the disconnected species compared to Bulk (normalized to theirmaximum).
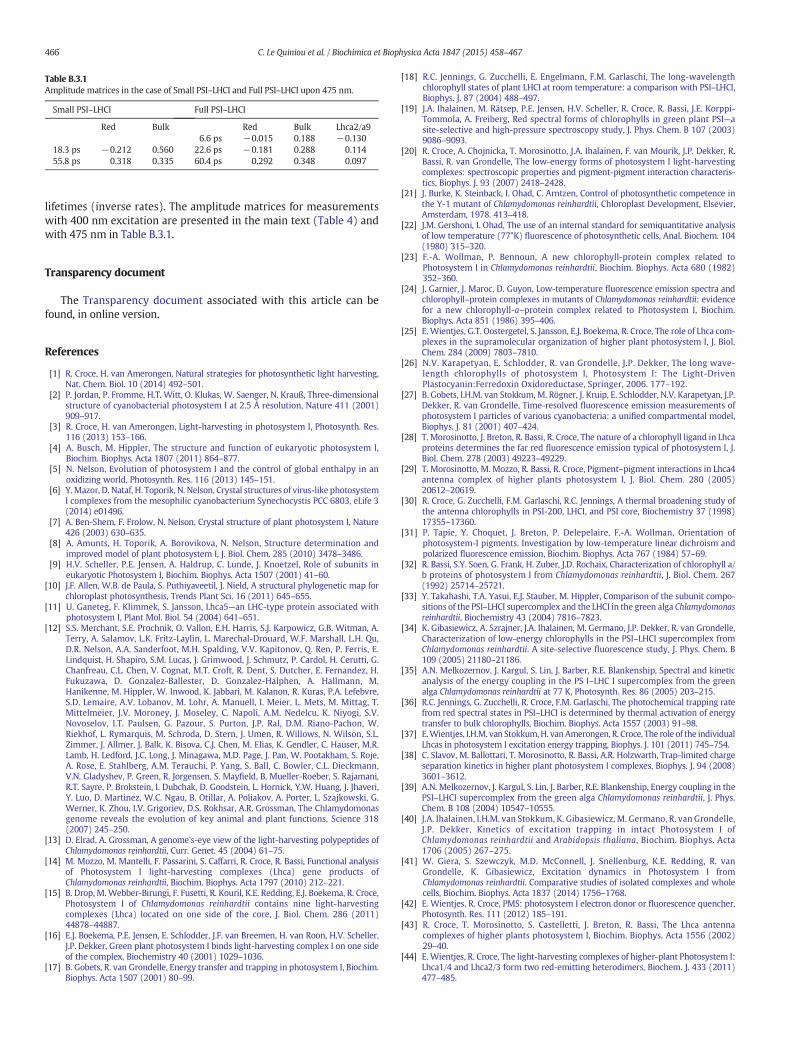
Table B.3.1Amplitude matrices in the case of Small PSI–LHCI and Full PSI–LHCI upon 475 nm.
Small PSI–LHCI Full PSI–LHCI
Red Bulk Red Bulk Lhca2/a96.6 ps −0.015 0.188 −0.130
18.3 ps −0.212 0.560 22.6 ps −0.181 0.288 0.11455.8 ps 0.318 0.335 60.4 ps 0.292 0.348 0.097
466 C. Le Quiniou et al. / Biochimica et Biophysica Acta 1847 (2015) 458–467
lifetimes (inverse rates). The amplitude matrices for measurementswith 400 nm excitation are presented in the main text (Table 4) andwith 475 nm in Table B.3.1.
Transparency document
The Transparency document associated with this article can befound, in online version.
References
[1] R. Croce, H. van Amerongen, Natural strategies for photosynthetic light harvesting,Nat. Chem. Biol. 10 (2014) 492–501.
[2] P. Jordan, P. Fromme, H.T. Witt, O. Klukas, W. Saenger, N. Krauß, Three-dimensionalstructure of cyanobacterial photosystem I at 2.5 Å resolution, Nature 411 (2001)909–917.
[3] R. Croce, H. van Amerongen, Light-harvesting in photosystem I, Photosynth. Res.116 (2013) 153–166.
[4] A. Busch, M. Hippler, The structure and function of eukaryotic photosystem I,Biochim. Biophys. Acta 1807 (2011) 864–877.
[5] N. Nelson, Evolution of photosystem I and the control of global enthalpy in anoxidizing world, Photosynth. Res. 116 (2013) 145–151.
[6] Y.Mazor, D. Nataf, H. Toporik, N. Nelson, Crystal structures of virus-like photosystemI complexes from the mesophilic cyanobacterium Synechocystis PCC 6803, eLife 3(2014) e01496.
[7] A. Ben-Shem, F. Frolow, N. Nelson, Crystal structure of plant photosystem I, Nature426 (2003) 630–635.
[8] A. Amunts, H. Toporik, A. Borovikova, N. Nelson, Structure determination andimproved model of plant photosystem I, J. Biol. Chem. 285 (2010) 3478–3486.
[9] H.V. Scheller, P.E. Jensen, A. Haldrup, C. Lunde, J. Knoetzel, Role of subunits ineukaryotic Photosystem I, Biochim. Biophys. Acta 1507 (2001) 41–60.
[10] J.F. Allen, W.B. de Paula, S. Puthiyaveetil, J. Nield, A structural phylogenetic map forchloroplast photosynthesis, Trends Plant Sci. 16 (2011) 645–655.
[11] U. Ganeteg, F. Klimmek, S. Jansson, Lhca5—an LHC-type protein associated withphotosystem I, Plant Mol. Biol. 54 (2004) 641–651.
[12] S.S. Merchant, S.E. Prochnik, O. Vallon, E.H. Harris, S.J. Karpowicz, G.B. Witman, A.Terry, A. Salamov, L.K. Fritz-Laylin, L. Marechal-Drouard, W.F. Marshall, L.H. Qu,D.R. Nelson, A.A. Sanderfoot, M.H. Spalding, V.V. Kapitonov, Q. Ren, P. Ferris, E.Lindquist, H. Shapiro, S.M. Lucas, J. Grimwood, J. Schmutz, P. Cardol, H. Cerutti, G.Chanfreau, C.L. Chen, V. Cognat, M.T. Croft, R. Dent, S. Dutcher, E. Fernandez, H.Fukuzawa, D. Gonzalez-Ballester, D. Gonzalez-Halphen, A. Hallmann, M.Hanikenne, M. Hippler, W. Inwood, K. Jabbari, M. Kalanon, R. Kuras, P.A. Lefebvre,S.D. Lemaire, A.V. Lobanov, M. Lohr, A. Manuell, I. Meier, L. Mets, M. Mittag, T.Mittelmeier, J.V. Moroney, J. Moseley, C. Napoli, A.M. Nedelcu, K. Niyogi, S.V.Novoselov, I.T. Paulsen, G. Pazour, S. Purton, J.P. Ral, D.M. Riano-Pachon, W.Riekhof, L. Rymarquis, M. Schroda, D. Stern, J. Umen, R. Willows, N. Wilson, S.L.Zimmer, J. Allmer, J. Balk, K. Bisova, C.J. Chen, M. Elias, K. Gendler, C. Hauser, M.R.Lamb, H. Ledford, J.C. Long, J. Minagawa, M.D. Page, J. Pan, W. Pootakham, S. Roje,A. Rose, E. Stahlberg, A.M. Terauchi, P. Yang, S. Ball, C. Bowler, C.L. Dieckmann,V.N. Gladyshev, P. Green, R. Jorgensen, S. Mayfield, B. Mueller-Roeber, S. Rajamani,R.T. Sayre, P. Brokstein, I. Dubchak, D. Goodstein, L. Hornick, Y.W. Huang, J. Jhaveri,Y. Luo, D. Martinez, W.C. Ngau, B. Otillar, A. Poliakov, A. Porter, L. Szajkowski, G.Werner, K. Zhou, I.V. Grigoriev, D.S. Rokhsar, A.R. Grossman, The Chlamydomonasgenome reveals the evolution of key animal and plant functions, Science 318(2007) 245–250.
[13] D. Elrad, A. Grossman, A genome's-eye view of the light-harvesting polypeptides ofChlamydomonas reinhardtii, Curr. Genet. 45 (2004) 61–75.
[14] M. Mozzo, M. Mantelli, F. Passarini, S. Caffarri, R. Croce, R. Bassi, Functional analysisof Photosystem I light-harvesting complexes (Lhca) gene products ofChlamydomonas reinhardtii, Biochim. Biophys. Acta 1797 (2010) 212–221.
[15] B. Drop, M.Webber-Birungi, F. Fusetti, R. Kouril, K.E. Redding, E.J. Boekema, R. Croce,Photosystem I of Chlamydomonas reinhardtii contains nine light-harvestingcomplexes (Lhca) located on one side of the core, J. Biol. Chem. 286 (2011)44878–44887.
[16] E.J. Boekema, P.E. Jensen, E. Schlodder, J.F. van Breemen, H. van Roon, H.V. Scheller,J.P. Dekker, Green plant photosystem I binds light-harvesting complex I on one sideof the complex, Biochemistry 40 (2001) 1029–1036.
[17] B. Gobets, R. van Grondelle, Energy transfer and trapping in photosystem I, Biochim.Biophys. Acta 1507 (2001) 80–99.
[18] R.C. Jennings, G. Zucchelli, E. Engelmann, F.M. Garlaschi, The long-wavelengthchlorophyll states of plant LHCI at room temperature: a comparison with PSI–LHCI,Biophys. J. 87 (2004) 488–497.
[19] J.A. Ihalainen, M. Rätsep, P.E. Jensen, H.V. Scheller, R. Croce, R. Bassi, J.E. Korppi-Tommola, A. Freiberg, Red spectral forms of chlorophylls in green plant PSI—asite-selective and high-pressure spectroscopy study, J. Phys. Chem. B 107 (2003)9086–9093.
[20] R. Croce, A. Chojnicka, T. Morosinotto, J.A. Ihalainen, F. van Mourik, J.P. Dekker, R.Bassi, R. van Grondelle, The low-energy forms of photosystem I light-harvestingcomplexes: spectroscopic properties and pigment-pigment interaction characteris-tics, Biophys. J. 93 (2007) 2418–2428.
[21] J. Burke, K. Steinback, I. Ohad, C. Arntzen, Control of photosynthetic competence inthe Y-1 mutant of Chlamydomonas reinhardtii, Chloroplast Development, Elsevier,Amsterdam, 1978. 413–418.
[22] J.M. Gershoni, I. Ohad, The use of an internal standard for semiquantitative analysisof low temperature (77°K) fluorescence of photosynthetic cells, Anal. Biochem. 104(1980) 315–320.
[23] F.-A. Wollman, P. Bennoun, A new chlorophyll-protein complex related toPhotosystem I in Chlamydomonas reinhardtii, Biochim. Biophys. Acta 680 (1982)352–360.
[24] J. Garnier, J. Maroc, D. Guyon, Low-temperature fluorescence emission spectra andchlorophyll–protein complexes in mutants of Chlamydomonas reinhardtii: evidencefor a new chlorophyll-a–protein complex related to Photosystem I, Biochim.Biophys. Acta 851 (1986) 395–406.
[25] E. Wientjes, G.T. Oostergetel, S. Jansson, E.J. Boekema, R. Croce, The role of Lhca com-plexes in the supramolecular organization of higher plant photosystem I, J. Biol.Chem. 284 (2009) 7803–7810.
[26] N.V. Karapetyan, E. Schlodder, R. van Grondelle, J.P. Dekker, The long wave-length chlorophylls of photosystem I, Photosystem I: The Light-DrivenPlastocyanin:Ferredoxin Oxidoreductase, Springer, 2006. 177–192.
[27] B. Gobets, I.H.M. van Stokkum, M. Rögner, J. Kruip, E. Schlodder, N.V. Karapetyan, J.P.Dekker, R. van Grondelle, Time-resolved fluorescence emission measurements ofphotosystem I particles of various cyanobacteria: a unified compartmental model,Biophys. J. 81 (2001) 407–424.
[28] T. Morosinotto, J. Breton, R. Bassi, R. Croce, The nature of a chlorophyll ligand in Lhcaproteins determines the far red fluorescence emission typical of photosystem I, J.Biol. Chem. 278 (2003) 49223–49229.
[29] T. Morosinotto, M. Mozzo, R. Bassi, R. Croce, Pigment–pigment interactions in Lhca4antenna complex of higher plants photosystem I, J. Biol. Chem. 280 (2005)20612–20619.
[30] R. Croce, G. Zucchelli, F.M. Garlaschi, R.C. Jennings, A thermal broadening study ofthe antenna chlorophylls in PSI-200, LHCI, and PSI core, Biochemistry 37 (1998)17355–17360.
[31] P. Tapie, Y. Choquet, J. Breton, P. Delepelaire, F.-A. Wollman, Orientation ofphotosystem-I pigments. Investigation by low-temperature linear dichroism andpolarized fluorescence emission, Biochim. Biophys. Acta 767 (1984) 57–69.
[32] R. Bassi, S.Y. Soen, G. Frank, H. Zuber, J.D. Rochaix, Characterization of chlorophyll a/b proteins of photosystem I from Chlamydomonas reinhardtii, J. Biol. Chem. 267(1992) 25714–25721.
[33] Y. Takahashi, T.A. Yasui, E.J. Stauber, M. Hippler, Comparison of the subunit compo-sitions of the PSI–LHCI supercomplex and the LHCI in the green alga Chlamydomonasreinhardtii, Biochemistry 43 (2004) 7816–7823.
[34] K. Gibasiewicz, A. Szrajner, J.A. Ihalainen, M. Germano, J.P. Dekker, R. van Grondelle,Characterization of low-energy chlorophylls in the PSI–LHCI supercomplex fromChlamydomonas reinhardtii. A site-selective fluorescence study, J. Phys. Chem. B109 (2005) 21180–21186.
[35] A.N. Melkozernov, J. Kargul, S. Lin, J. Barber, R.E. Blankenship, Spectral and kineticanalysis of the energy coupling in the PS I–LHC I supercomplex from the greenalga Chlamydomonas reinhardtii at 77 K, Photosynth. Res. 86 (2005) 203–215.
[36] R.C. Jennings, G. Zucchelli, R. Croce, F.M. Garlaschi, The photochemical trapping ratefrom red spectral states in PSI–LHCI is determined by thermal activation of energytransfer to bulk chlorophylls, Biochim. Biophys. Acta 1557 (2003) 91–98.
[37] E.Wientjes, I.H.M. van Stokkum,H. vanAmerongen, R. Croce, The role of the individualLhcas in photosystem I excitation energy trapping, Biophys. J. 101 (2011) 745–754.
[38] C. Slavov, M. Ballottari, T. Morosinotto, R. Bassi, A.R. Holzwarth, Trap-limited chargeseparation kinetics in higher plant photosystem I complexes, Biophys. J. 94 (2008)3601–3612.
[39] A.N. Melkozernov, J. Kargul, S. Lin, J. Barber, R.E. Blankenship, Energy coupling in thePSI–LHCI supercomplex from the green alga Chlamydomonas reinhardtii, J. Phys.Chem. B 108 (2004) 10547–10555.
[40] J.A. Ihalainen, I.H.M. van Stokkum, K. Gibasiewicz, M. Germano, R. van Grondelle,J.P. Dekker, Kinetics of excitation trapping in intact Photosystem I ofChlamydomonas reinhardtii and Arabidopsis thaliana, Biochim. Biophys. Acta1706 (2005) 267–275.
[41] W. Giera, S. Szewczyk, M.D. McConnell, J. Snellenburg, K.E. Redding, R. vanGrondelle, K. Gibasiewicz, Excitation dynamics in Photosystem I fromChlamydomonas reinhardtii. Comparative studies of isolated complexes and wholecells, Biochim. Biophys. Acta 1837 (2014) 1756–1768.
[42] E. Wientjes, R. Croce, PMS: photosystem I electron donor or fluorescence quencher,Photosynth. Res. 111 (2012) 185–191.
[43] R. Croce, T. Morosinotto, S. Castelletti, J. Breton, R. Bassi, The Lhca antennacomplexes of higher plants photosystem I, Biochim. Biophys. Acta 1556 (2002)29–40.
[44] E. Wientjes, R. Croce, The light-harvesting complexes of higher-plant Photosystem I:Lhca1/4 and Lhca2/3 form two red-emitting heterodimers, Biochem. J. 433 (2011)477–485.
467C. Le Quiniou et al. / Biochimica et Biophysica Acta 1847 (2015) 458–467
[45] R. Croce, G. Canino, F. Ros, R. Bassi, Chromophore organization in the higher-plantphotosystem II antenna protein CP26, Biochemistry 41 (2002) 7334–7343.
[46] I.H.M. van Stokkum, B. van Oort, F. van Mourik, B. Gobets, H. van Amerongen, (Sub)-picosecond spectral evolution of fluorescence studied with a synchroscan streak-camera system and target analysis, Biophysical Techniques in Photosynthesis,Springer, 2008. 223–240.
[47] J.J. Snellenburg, S. Laptenok, R. Seger, K.M. Mullen, I.H.M. van Stokkum, Glotaran: aJava-based graphical user interface for the R package TIMP, J. Stat. Softw. 49 (2012).
[48] I.H.M. van Stokkum, D.S. Larsen, R. van Grondelle, Global and target analysis of time-resolved spectra, Biochim. Biophys. Acta 1657 (2004) 82–104.
[49] I.H.M. van Stokkum, D.S. Larsen, R. van Grondelle, Erratum to “Global and targetanalysis of time-resolved spectra” [Biochimica et Biophysica Acta 1658/2–3(2004) 82–104], Biochim. Biophys. Acta 1658 (2004) 262.
[50] A.R. Holzwarth, Data analysis of time-resolved measurements, BiophysicalTechniques in Photosynthesis, Springer, 1996. 75–92.
[51] K.M. Mullen, I.H.M. van Stokkum, The variable projection algorithm in time-resolvedspectroscopy, microscopy and mass spectrometry applications, Numer. Algorithms51 (2009) 319–340.
[52] J.J. Snellenburg, J.P. Dekker, R. van Grondelle, I.H.M. van Stokkum, Functional com-partmental modeling of the photosystems in the thylakoid membrane at 77 K, J.Phys. Chem. B 117 (2013) 11363–11371.
[53] B. van Oort, A. Amunts, J.W. Borst, A. van Hoek, N. Nelson, H. van Amerongen, R.Croce, Picosecond fluorescence of intact and dissolved PSI–LHCI crystals, Biophys.J. 95 (2008) 5851–5861.
[54] K. Broess, G. Trinkunas, A. van Hoek, R. Croce, H. van Amerongen, Determination of theexcitationmigration time in Photosystem II consequences for themembrane organiza-tion and charge separation parameters, Biochim. Biophys. Acta 1777 (2008) 404–409.
[55] K. Gibasiewicz, R. Croce, T. Morosinotto, J.A. Ihalainen, I.H.M. van Stokkum, J.P.Dekker, R. Bassi, R. van Grondelle, Excitation energy transfer pathways in Lhca4,Biophys. J. 88 (2005) 1959–1969.
[56] A.R. Holzwarth, M.G. Muller, J. Niklas, W. Lubitz, Ultrafast transient absorptionstudies on photosystem I reaction centers from Chlamydomonas reinhardtii. 2:mutations near the P700 reaction center chlorophylls provide new insight intothe nature of the primary electron donor, Biophys. J. 90 (2006) 552–565.
[57] F. Passarini, E. Wientjes, H. van Amerongen, R. Croce, Photosystem I light-harvesting complex Lhca4 adopts multiple conformations: red forms andexcited-state quenching are mutually exclusive, Biochim. Biophys. Acta 1797(2010) 501–508.
[58] J. Kargul, J. Nield, J. Barber, Three-dimensional reconstruction of a light-harvestingcomplex I-photosystem I (LHCI-PSI) supercomplex from the green algaChlamydomonas reinhardtii. Insights into light harvesting for PSI, J. Biol. Chem. 278(2003) 16135–16141.
[59] G. Gulis, K.V. Narasimhulu, L.N. Fox, K.E. Redding, Purification of His6-tagged photo-system I from Chlamydomonas reinhardtii, Photosynth. Res. 96 (2008) 51–60.
[60] H. van Amerongen, L. Valkunas, R. van Grondelle, Photosynthetic excitons, WorldSci. (2000) 401–478.
[61] E. Wientjes, H. van Amerongen, R. Croce, Quantum yield of charge separation inphotosystem II: functional effect of changes in the antenna size upon light acclima-tion, J. Phys. Chem. B 117 (2013) 11200–11208.
[62] M.G. Muller, J. Niklas, W. Lubitz, A.R. Holzwarth, Ultrafast transient absorptionstudies on Photosystem I reaction centers from Chlamydomonas reinhardtii. 1. Anew interpretation of the energy trapping and early electron transfer steps inPhotosystem I, Biophys. J. 85 (2003) 3899–3922.
[63] A.R. Holzwarth, M.G. Muller, J. Niklas, W. Lubitz, Charge recombination fluorescencein photosystem I reaction centers from Chlamydomonas reinhardtii, J. Phys. Chem. B109 (2005) 5903–5911.
[64] F.L. de Weerd, J.T. Kennis, J.P. Dekker, R. van Grondelle, β-carotene to chlorophyllsinglet energy transfer in the photosystem I core of Synechococcus elongatusproceeds via the β-carotene S2 and S1 states, J. Phys. Chem. B 107 (2003)5995–6002.