Embed Size (px)
Citation preview

Biochimica et Biophysica Acta 1842 (2014) 402–413
Contents lists available at ScienceDirect
Biochimica et Biophysica Acta
j ourna l homepage: www.e lsev ie r .com/ locate /bbad is
Review
New methodologies for studying lipid synthesis and turnover:Looking backwards to enable moving forwards☆
Stephen F. Previs ⁎, David G. McLaren, Sheng-Ping Wang, Steven J. Stout, Haihong Zhou, Kithsiri Herath,Vinit Shah, Paul L. Miller, Larissa Wilsie, Jose Castro-Perez, Douglas G. Johns,Michele A. Cleary, Thomas P. RoddyMolecular Biomarkers, Merck, 2015 Galloping Hill Road, Kenilworth, NJ 07033, USA
☆ This article is part of a Special Issue entitled: Modulatand Disease.⁎ Corresponding author. Tel.: +1 908 740 3364.
E-mail address: [email protected] (S.F. Pre
0925-4439/$ – see front matter © 2013 Elsevier B.V. Alhttp://dx.doi.org/10.1016/j.bbadis.2013.05.019
a b s t r a c t
a r t i c l e i n f oArticle history:Received 12 February 2013Received in revised form 11 May 2013Accepted 13 May 2013Available online 22 May 2013
Keywords:Stable isotopesMass spectrometryKinetic biomarkerDyslipidemiaCardiovascular disease
Our ability to understand the pathogenesis of problems surrounding lipid accretion requires attention towardsquantifying lipid kinetics. In addition, studies of metabolic flux should also help unravel mechanisms that leadto imbalances in inter-organ lipid trafficking which contribute to dyslipidemia and/or peripheral lipid accumu-lation (e.g. hepatic fat deposits). This review aims to outline the development and use of novel methods forstudying lipid kinetics in vivo. Although our focus is directed towards some of the approaches that are currentlyreported in the literature, we include a discussion of the older literature in order to put “new”methods in betterperspective and inform readers of valuable historical research. Presumably, future advances in understandinglipid dynamics will benefit from a careful consideration of the past efforts, where possible we have tried to iden-tify seminal papers or those that provide clear data to emphasize essential points. This article is part of a SpecialIssue entitled: Modulation of Adipose Tissue in Health and Disease.
© 2013 Elsevier B.V. All rights reserved.
1. Introduction
Adipose tissue is broadly divided into two major categories, whiteadipose provides insulation, cushions vital organs and acts as an endo-crine organ whereas brown adipose tissue is generally thought to con-tribute to thermogenesis. As small molecules, lipids are an excellentfuel source, in addition, they play a critical role in subcellular signal trans-duction. The accumulation of lipids (or adipose tissue) during growth iscomparable to the accumulation of lean bodymass, for example, a 3.5 kgnewborn babywill accumulate ~12 kg of fat vs ~12 kg of (dry) leanmassas they transition to a healthy 75 kg adult, reminding us that “getting fat”is part of being normal (obviously, toomuch of a good thing is bad). Notethat a majority of weight gain is simply water mass, a relatively smallamount of fat-free lean mass reflects true nitrogen accretion whereasfat mass has very little hydration making the accumulation of lipid andmuscle comparable.
The aim of this review is to outline methods that are available forquantifying lipid flux, although attention will be directed towards newadvances we intend to highlight selected examples from the older liter-ature since this may help to identify gaps for future investigations. Theperspective used in discussing these methods is based on our experi-ence studying the biochemical basis of triglyceride accumulation in
ion of Adipose Tissue in Health
vis).
l rights reserved.
adipose tissue and the role of adipose dysfunction in the pathogenesisof dyslipidemia and cardiometabolic disorders, comparable methodscan be used for both purposes.
Although numerous investigators have studied de novo lipogenesis[3,38,65,155], most experiments do not allow conclusions regardingnet lipid balance. We had suspected that in order to develop a compre-hensive understanding of lipid accumulation, investigators should con-sider a tool(s) that yields an estimate of triglyceride synthesis anddegradation including the contribution of de novo lipogenesis to thetriglyceride-bound fatty acids [20]. Perhaps the most straightforwardapproach for examining lipid deposition is to determine the change inpool size over time (which equals the synthesis minus the degradation)while quantifying the rate of lipid synthesis via a tracermethod, one cansolve the equation to estimate the degradation rate [11,12,20].
In our experience, the use of 2H-labeled water offers a number ofadvantages as compared to other tracers. In addition to the fact thatlabeled water rapidly and evenly distributes throughout body fluids,it is incorporated into multiple end-products which enables compre-hensive studies of metabolic flux while requiring a minimum of re-sources (Fig. 1). Typical tracer protocols require catheterized subjects,while this is somewhat trivial to setup in a clinical setting the routinecatheterization of animal models is labor intensive. Although there areno formal rules regarding how long animals should recover followinga surgical manipulation, investigators often allow several days prior toinitiating a tracer study in rodents [6]. To expand on this example, as-sume that one aims to test a hypothesis in a study requiring ~24 ani-mals, how long would it take one FTE to conduct the study and collect
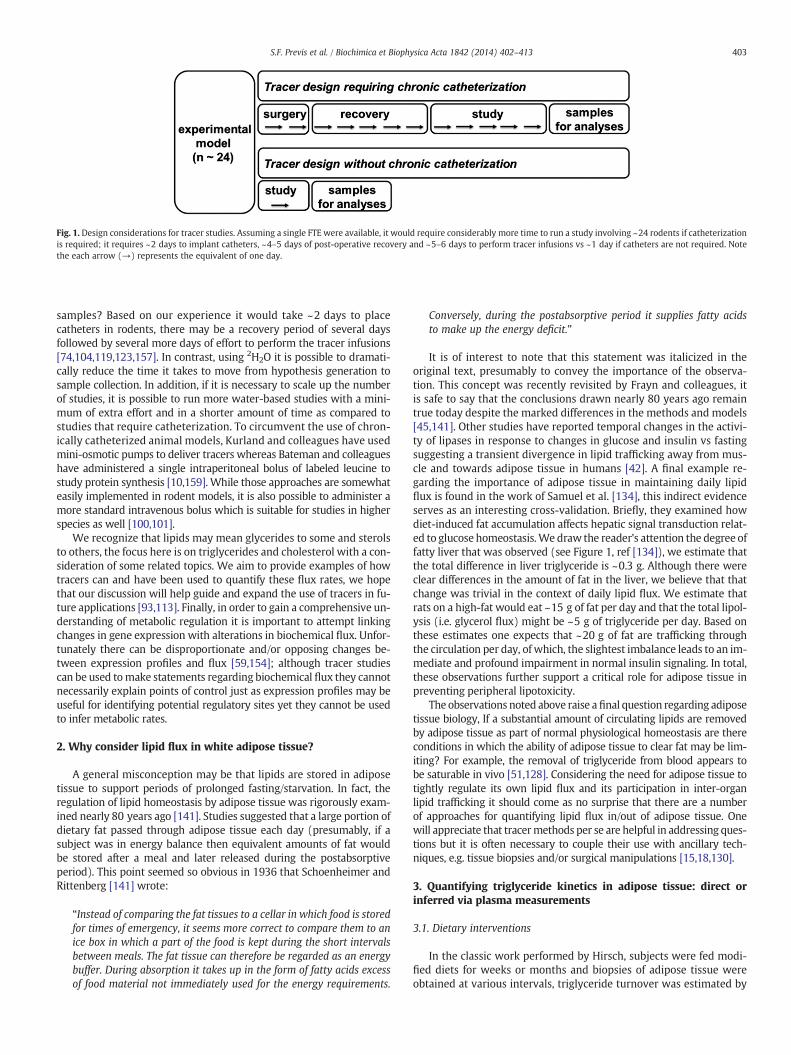
Fig. 1. Design considerations for tracer studies. Assuming a single FTE were available, it would require considerably more time to run a study involving ~24 rodents if catheterizationis required; it requires ~2 days to implant catheters, ~4–5 days of post-operative recovery and ~5–6 days to perform tracer infusions vs ~1 day if catheters are not required. Notethe each arrow (→) represents the equivalent of one day.
403S.F. Previs et al. / Biochimica et Biophysica Acta 1842 (2014) 402–413
samples? Based on our experience it would take ~2 days to placecatheters in rodents, there may be a recovery period of several daysfollowed by several more days of effort to perform the tracer infusions[74,104,119,123,157]. In contrast, using 2H2O it is possible to dramati-cally reduce the time it takes to move from hypothesis generation tosample collection. In addition, if it is necessary to scale up the numberof studies, it is possible to run more water-based studies with a mini-mum of extra effort and in a shorter amount of time as compared tostudies that require catheterization. To circumvent the use of chron-ically catheterized animal models, Kurland and colleagues have usedmini-osmotic pumps to deliver tracers whereas Bateman and colleagueshave administered a single intraperitoneal bolus of labeled leucine tostudy protein synthesis [10,159]. While those approaches are somewhateasily implemented in rodent models, it is also possible to administer amore standard intravenous bolus which is suitable for studies in higherspecies as well [100,101].
We recognize that lipids may mean glycerides to some and sterolsto others, the focus here is on triglycerides and cholesterol with a con-sideration of some related topics. We aim to provide examples of howtracers can and have been used to quantify these flux rates, we hopethat our discussion will help guide and expand the use of tracers in fu-ture applications [93,113]. Finally, in order to gain a comprehensive un-derstanding of metabolic regulation it is important to attempt linkingchanges in gene expression with alterations in biochemical flux. Unfor-tunately there can be disproportionate and/or opposing changes be-tween expression profiles and flux [59,154]; although tracer studiescan be used tomake statements regarding biochemical flux they cannotnecessarily explain points of control just as expression profiles may beuseful for identifying potential regulatory sites yet they cannot be usedto infer metabolic rates.
2. Why consider lipid flux in white adipose tissue?
A general misconception may be that lipids are stored in adiposetissue to support periods of prolonged fasting/starvation. In fact, theregulation of lipid homeostasis by adipose tissue was rigorously exam-ined nearly 80 years ago [141]. Studies suggested that a large portion ofdietary fat passed through adipose tissue each day (presumably, if asubject was in energy balance then equivalent amounts of fat wouldbe stored after a meal and later released during the postabsorptiveperiod). This point seemed so obvious in 1936 that Schoenheimer andRittenberg [141] wrote:
“Instead of comparing the fat tissues to a cellar in which food is storedfor times of emergency, it seems more correct to compare them to anice box in which a part of the food is kept during the short intervalsbetween meals. The fat tissue can therefore be regarded as an energybuffer. During absorption it takes up in the form of fatty acids excessof food material not immediately used for the energy requirements.
Conversely, during the postabsorptive period it supplies fatty acidsto make up the energy deficit.”
It is of interest to note that this statement was italicized in theoriginal text, presumably to convey the importance of the observa-tion. This concept was recently revisited by Frayn and colleagues, itis safe to say that the conclusions drawn nearly 80 years ago remaintrue today despite the marked differences in the methods and models[45,141]. Other studies have reported temporal changes in the activi-ty of lipases in response to changes in glucose and insulin vs fastingsuggesting a transient divergence in lipid trafficking away from mus-cle and towards adipose tissue in humans [42]. A final example re-garding the importance of adipose tissue in maintaining daily lipidflux is found in the work of Samuel et al. [134], this indirect evidenceserves as an interesting cross-validation. Briefly, they examined howdiet-induced fat accumulation affects hepatic signal transduction relat-ed to glucose homeostasis.We draw the reader's attention the degree offatty liver that was observed (see Figure 1, ref [134]), we estimate thatthe total difference in liver triglyceride is ~0.3 g. Although there wereclear differences in the amount of fat in the liver, we believe that thatchange was trivial in the context of daily lipid flux. We estimate thatrats on a high-fat would eat ~15 g of fat per day and that the total lipol-ysis (i.e. glycerol flux) might be ~5 g of triglyceride per day. Based onthese estimates one expects that ~20 g of fat are trafficking throughthe circulation per day, of which, the slightest imbalance leads to an im-mediate and profound impairment in normal insulin signaling. In total,these observations further support a critical role for adipose tissue inpreventing peripheral lipotoxicity.
The observations noted above raise afinal question regarding adiposetissue biology, If a substantial amount of circulating lipids are removedby adipose tissue as part of normal physiological homeostasis are thereconditions in which the ability of adipose tissue to clear fat may be lim-iting? For example, the removal of triglyceride from blood appears tobe saturable in vivo [51,128]. Considering the need for adipose tissue totightly regulate its own lipid flux and its participation in inter-organlipid trafficking it should come as no surprise that there are a numberof approaches for quantifying lipid flux in/out of adipose tissue. Onewill appreciate that tracermethods per se are helpful in addressing ques-tions but it is often necessary to couple their use with ancillary tech-niques, e.g. tissue biopsies and/or surgical manipulations [15,18,130].
3. Quantifying triglyceride kinetics in adipose tissue: direct orinferred via plasma measurements
3.1. Dietary interventions
In the classic work performed by Hirsch, subjects were fed modi-fied diets for weeks or months and biopsies of adipose tissue wereobtained at various intervals, triglyceride turnover was estimated by

404 S.F. Previs et al. / Biochimica et Biophysica Acta 1842 (2014) 402–413
comparing the rate at which the triglyceride composition of adiposetissue remodeled and began to reflect the fatty acid composition ofthe diet [57]. While intriguing, one obvious consideration with thisapproach is that feeding a highly modified diet may not be practicaland/or may alter the process(es) being studied. It should be notedthat this type of design was also utilized nearly 80 years ago in an el-egant series of experiments by Kohl [76–78] who fed elaidin to ratsand then measured its accumulation and removal from various sites.Both Kohl and Hirsh concluded that once deposited in the adipose tis-sue, fatty acids generally have a long half-life.
Is it possible to accept the seemingly opposite conclusions reachedby Kohl and Hirsh vs Schoenheimer and Rittenberg and Frayn, i.e. lipidsin adipose have a long half-life vs substantial amounts of circulatinglipids pass through adipose tissue daily?We think “yes” if one considershow the kinetics are described. For example, the early tracer data sup-port the hypothesis that lipids have a long half-life, the fractional turn-over of fatty acids in white adipose tissue is quite slow, e.g. a fewpercent of the total pool is renewed each day. We believe that any mis-understandings in the meaning of these apparently different conclu-sions come from a consideration of the problem, the flux of fatty acidsequals the fractional turnover times the pool size. When we considerhow much white adipose tissue is found in normal healthy subjectsone recognizes that the absolute amount of lipid which is movingin/out of white adipose tissue in a day approaches that which is typ-ically consumed. Stated another way, since the pool of triglyceride inadipose tissue is relatively large in comparison with dietary intake,stored triglyceride can have a slow turnover (or long half-life) and there-in lead to the perception that it is somewhat “inert” yet it is playing a cen-tral role in maintaining daily balance and inter-organ lipid trafficking.
A variant on using dietary interventions involves feeding isotopical-ly labeled lipids (e.g. triglyceride tracers) [15,18,130] which is advanta-geous since dietarymodifications are not needed. Also, this allows acutestudies lasting a few hours or days. Bragdon and Gordon used this ap-proach to contrast the fate of lipid disposal from triglyceride presentin chylomicrons vs albumin-bound free fatty acids in rats [18]. Theydemonstrated that the nature of the circulating fat (i.e. triglyceride vsfree fatty acids) and the nutritional state (i.e. carbohydrate-fed vs fasted)affected the tissue-specific distribution. Havel and Goldfien extendedthose studies in normal and hepatectomized dogs and observed that byremoving the liver there was a minor impact on circulating fatty acidsbut a nearly complete inhibition of triglyceride production; they con-cluded that liver plays a minor role in clearing lipids but a central rolein converting plasma fatty acids into plasma triglycerides [54]. Thework by Havel and Goldfien further emphasizes the importance of cou-pling tracer methods with surgical techniques in order to understandwhole-body integrative physiology.
The use of dietary modifications and/or the administration of la-beled lipids suffer from a common assumption. Namely, when usinga labeled triglyceride or fatty acid to study triglyceride turnover it isimportant to recognize that positional specificity of a given lipase mayinfluence the result. Since enzymes may prefer certain substrates[40,47,48,107,108], the chemical structure of the lipid tracer can influ-ence the apparent kinetics, i.e. the tracer may not follow the tracee[15,130]. We previously observed an apparent disconnection betweenthe incorporation of labeled glycerol vs labeled palmitate in epididymalfat pads in growing mice, that discrepancy was resolved when we de-termined that, in fact, the fatty acid composition of the fat pads hadchanged over time [20]. For example, based on the incorporation of la-beled glycerol we concluded that ~4.4 μmol triglyceride accumulatedper day in animals fed a standard rodent diet. We then assumed that~4 to 5 μmol of palmitate should accumulate (i.e. 3 fatty acids per glycer-ol, of which, palmitate represents ~30 to 40%). However, we measuredthe incorporation of labeled palmitate and concluded that slightly lessthan ~1 μmol accumulated. Direct measurements of the fatty acid com-position of adipose tissue then confirmed the tracer data as we found asubstantial remodeling had occurred over the course of our study [20].
3.2. Measurements involving arterio-venous balance, microdialysis andmicroperfusion
In contrast to methods which rely on tissue biopsies it is possibleto examine organ-specific uptake and/or production by measuringarterio-venous balances [41,46,149]. Frayn and co-workers have clever-ly used this approach to demonstrate a rapid switching of lipase activityin healthy humans during the fasted to fed transition which appears tobe altered in obese subjects [33,118]. Such input–output analyses havebeen used in ex vivo settings aswell; themass-balance concept demon-strated that triglyceride uptake by isolated-perfused fat pads is satura-ble [128].
For obvious reasons arterio-venous balance measurements can bedifficult to make, especially when studying multiple organs or whenlong term studies are of interest. Although the concepts of the methodare relatively easy to understand, i.e. onemeasures the input and outputacross an organ, the assumptionsmay be less obvious. For example, ap-parent differences in lipid flux between subjects could reflect true dif-ferences and/or artifacts related to tissue heterogeneity or perfusion.Namely, one assumes that the relative tissue composition is the samein different subjects and the degree of tissue perfusion is comparable,i.e. any shunting of blood flow should be equal in all conditions.
Microdialysis and microperfusion techniques allow investiga-tors a different type of insight regarding tissue-specific metabolism[5,136,148,151]. One advantage afforded in such studies is the ability toimplant multiple probes in the same subject and therein simultaneouslystudy the effect of several perturbations. For example, an investigator canimplant three probes in the abdominal fat of humans, the first can beused to deliver vehicle, the second can deliver an activator of lipolysisand the third an inhibitor of lipolysis. The use of microperfusion, as com-pared to microdialysis, is advantageous in that there are fewer limits interms of what analytes can be recovered.
All of themethods noted above are useful for probing global aspectson net lipid flux, however, mass-balance approaches do not addressquestions regarding specific pathways. For example, if one did not ob-serve a difference in glycerol concentration across an adipose depot itis probably incorrect to conclude that there is neglible triglyceride turn-over. The use of a glycerol tracer in this scenario could be highly reveal-ing, i.e. finding no difference in concentration but a dilution in thelabeling of glycerolwould lead one to conclude that therewas consider-able glycerol uptake with a comparable production [32].
3.3. Glycerol and fatty acid flux
All of the methods noted above have a common limitation, namely,unless every adipose depot is studied one will inevitably make infer-ences regarding data obtained from one depot to another. The use ofglycerol and/or fatty acid tracers allows one to quantify whole-bodylipid flux [158]. Before engaging in a detailed discussion it is importantto note that whole-body studies are limited since one cannot immedi-ately ascribe the source of any difference between subjects.
It is generally assumed that (i) the release of free glycerol reflects therate of triglyceride degradation (i.e. since very little glycerokinase isfound in adipose tissue glycerol cannot be reincorporated) and (ii) theproduction of fatty acids can underestimate lipolysis since fatty acidsmay be reesterified directly in adipose tissue [158]. The logic of quantify-ing glycerol flux (assuming a metabolic steady-state) is straightforward,one can infuse a glycerol tracer and then measure its dilution in plasma[16,97,158]. Since the infusion rate is known and the dilution in plasmais measured one can calculate the production using the equation:
productionrate ¼ infusionrate� enrichmentinfusate=enrichmentplasma
� �–1
h i
where the units for “infusion rate” (e.g. μmol × kg−1 × min−1) deter-mine the units for “production rate” [158]. The caveats surrounding

Fig. 2. Overview of lipid flux pathways. Triglyceride synthesis requires a source ofglycerol-3-phosphate and fatty acids, the relative contributions of glycolysis, glycerokinaseand glyceroneogenesis is expected to varywith tissue-type and nutritional/hormonal status;likewise, fatty acids are derived from variable sources including stored lipids, diet and/or denovo synthesis (not shown) (Panel A). Plasma cholesterol is derived from three sources andis disposed of primarily via two pathways, conversion to bile acids and direct elimination(Panel B). Note that this review does not consider the conversion of cholesterol to othersteroids.
405S.F. Previs et al. / Biochimica et Biophysica Acta 1842 (2014) 402–413
this logic may be obvious and include the assumption that all of the en-dogenous glycerol mixes with the infused tracer. In addition, the loss oftracer from the plasma is via true utilization and not an isotopic ex-change. For example, perfused rat liver will remove [2H5]glycerol andrelease other mass isotopomers of glycerol (i.e. [2H4], [2H3], etc.)[121]; if this were to occur in vivo, and if unaccounted for, one wouldoverestimate the true rate of glycerol production, i.e. if some of the de-crease in the abundance of [2H5]glycerol were to be caused by conver-sion of the infused tracer to another form of labeled glycerol. Thereare other reports which discuss the impact of isotope exchange vs netproduction [79,83], although those examples surround carbohydratemetabolism the concepts have immediate implications here.
The mode under which tracers are infused and samples are col-lected will impact conclusions regarding glycerol kinetics. Beylotand colleagues infused postabsorptive and starved rats with [2-13C]glycerol, in some studies the tracer was infused-sampled using thearterial-venous mode whereas in other tracer was infused-sampledvia the venous-arterial mode [117]. Regardless of the nutritional state,the rate of glycerol turnover was approximately double in the arterial-venous vs the venous-arterial mode. Since most investigators will pre-sumably choose one mode of tracer infusion-sampling for a given setof studies the effect on the outcome may be minimized neverthelessthis may be critical when comparing data across different studies [61].There are several helpful discussions regarding the importance ofinfusion-sample modes which review why such striking differences influx may be observed [70,109].
A subsequent assumption surrounding measurements of glycerolflux is that glycerol production reflects lipase activity of adipose tis-sue. However, what lipase are we talking about? Namely, the hydro-lysis of intracellular triglycerides (e.g. hormone sensitive lipase) willrelease glycerol just as the hydrolysis of extracellular triglycerides(e.g. lipoprotein lipase). Perhaps differentiating the contribution ofintra- and extracellular lipolysis in hyperinsulinemic obese patientscould explain how to best approach apparent alterations in lipolyticflux observed in obesity [56,57].
We designed studies to quantify the source of glycerol in humans,[14C]glycerol was used to estimate total glycerol flux and 2H2O wasused to dissect the contribution of intra- vs extra-cellular lipolysis[60]. The data suggested that ~20% of total glycerol production wasnot from lipolysis of adipose tissue triglyceride, presumably therewas substantial hydrolysis of circulating VLDL triglyceride. Thoseobservations are similar to data obtained by Frayn et al. [46]; usingarterio-venous balancemeasurements they demonstrated that extracel-lular lipolysis contributes ~20 to 50% to total lipolysis in healthy subjects.Mittendofer et al. considered this problemusing a different approach andcame to a similar conclusion, i.e. the systemic appearance of fatty acidsdoes not entirely reflect lipolytic flux in adipose tissue [105]. Briefly,they simultaneously compared the production of multiple fatty acidsagainst the fatty acid composition of abdominal and gluteal adiposetissue. Their data suggest that fatty acids are released into the circulationfrom a tissue source which contains palmitate and stearate in higherconcentrations and oleate in lower concentrations than certain adiposetissue depots. Although the site of the unknown lipid depot was not spe-cifically determined, the discrepancies between the fatty acid appear-ance profile and the distribution of fatty acids in adipose tissuetriglyceride were observed during hormone-mediated changes in fattyacid flux therein suggesting that factorswhich regulate triglyceride turn-over in adipose tissue do not necessarily regulate this other depot(s).
4. Quantifying triglyceride production: direct incorporationmethods
While the use of the word “triglyceride” is convenient, readers rec-ognize the heterogeneity of this biochemical class. To simplify matterswe will initially focus our attention on a higher level overview (Fig. 2).Briefly, triglycerides are made from glycerol-3-phosphate and fattyacids. Analogous to the fact that fatty acids can be derived frommultiple
sources (e.g. diet or de novo synthesis), glycerol-3-phosphate can bemade from glycerol, glucose and “glyceroneogenic” carbon sources(e.g. pyruvate, lactate, alanine). We hope to contrast the use of fatty acidand glycerol tracers against the use of labeled water (both 2H and 18O)as tracers for studying triglyceride production.
4.1. Fatty acid tracers
There are numerous examples in which labeled fatty acids havebeen used to estimate triglyceride production [1]. In contrast to the useof labeled glycerol, one can follow the incorporation of labeled fattyacids into cholesterol esters, advanced LC–MS methods greatly facilitatethese analyses [100,101,125]. Furthermore, it is possible to simultaneous-ly administer labeled fatty acids orally and intravenously and therein es-timate the fate of endogenous vs exogenous lipids [39], depending on thetypeof labeled fatty acid that is administered it is also possible to estimatelipid oxidation [95].
Wolfe and colleagues recently examined triglyceride synthesis inmuscle, the reported observations have immediate implications onmeasures of triglyceride synthesis in liver and adipose tissue [21,161].Again, the central problem when following the incorporation of a la-beled precursor into a product concerns the dilution of the tracer [21].Namely, the labeling of the product reflects howmuch tracer is admin-istered, the turnover of the fatty acid pool or entry of cold fatty acidsalong the pathway and the rate of triglyceride production.
Various approaches can be used to administer other labeled pre-cursors (e.g. 13C-glucose, 13C-acetate or 2H-water), for example, onecan then follow the incorporation of the endogenously synthesized(isotopically labeled) fatty acids into triglycerides and/or other complexlipids. It is possible to estimate the contribution of de novo lipogenesisvia the steady-state labeling of palmitate and triglyceride turnover viathe time required to reach a steady-state labeling [2,20,30,38,39,87].
A final approach to using “fatty acid tracers” is to measure the dis-posal of a known amount of Intralipid [133]. Although not necessarilya tracer-method per se, this approach has merit in some instancessince one can examine questions regarding the effect of different lipidloads on kinetics, since Intralipid has a somewhat distinct lipid profile
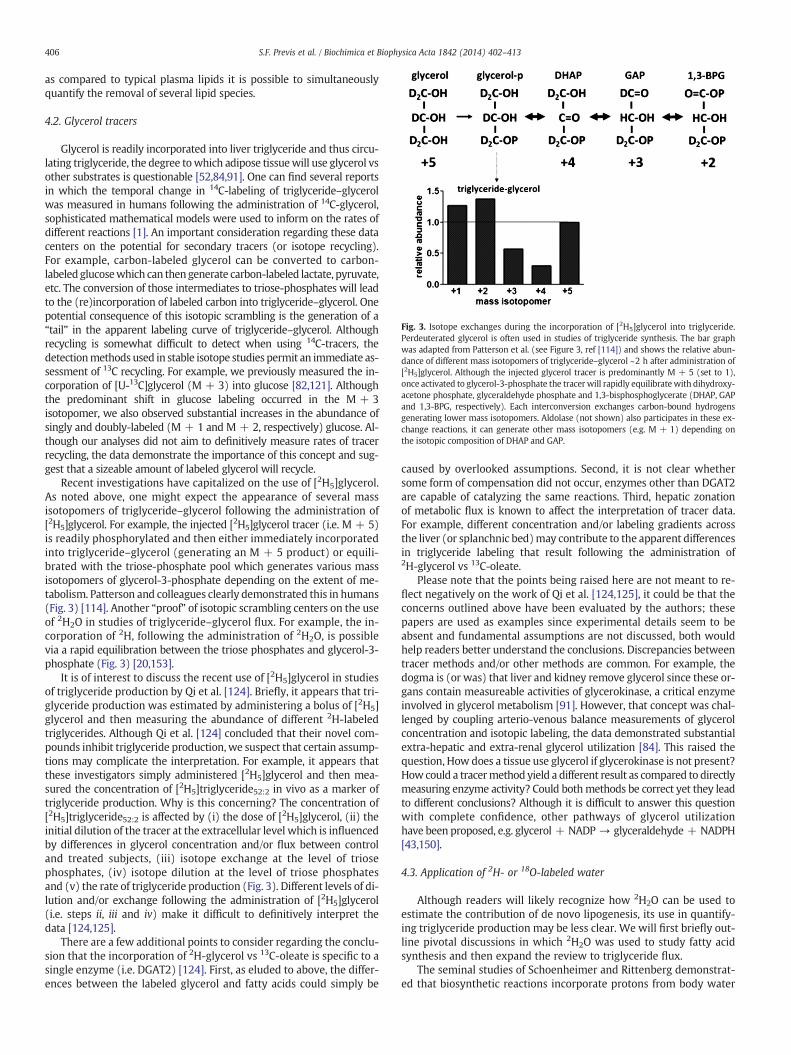
Fig. 3. Isotope exchanges during the incorporation of [2H5]glycerol into triglyceride.Perdeuterated glycerol is often used in studies of triglyceride synthesis. The bar graphwas adapted from Patterson et al. (see Figure 3, ref [114]) and shows the relative abun-dance of different mass isotopomers of triglyceride–glycerol ~2 h after administration of[2H5]glycerol. Although the injected glycerol tracer is predominantly M + 5 (set to 1),once activated to glycerol-3-phosphate the tracer will rapidly equilibratewith dihydroxy-acetone phosphate, glyceraldehyde phosphate and 1,3-bisphosphoglycerate (DHAP, GAPand 1,3-BPG, respectively). Each interconversion exchanges carbon-bound hydrogensgenerating lower mass isotopomers. Aldolase (not shown) also participates in these ex-change reactions, it can generate other mass isotopomers (e.g. M + 1) depending onthe isotopic composition of DHAP and GAP.
406 S.F. Previs et al. / Biochimica et Biophysica Acta 1842 (2014) 402–413
as compared to typical plasma lipids it is possible to simultaneouslyquantify the removal of several lipid species.
4.2. Glycerol tracers
Glycerol is readily incorporated into liver triglyceride and thus circu-lating triglyceride, the degree towhich adipose tissuewill use glycerol vsother substrates is questionable [52,84,91]. One can find several reportsin which the temporal change in 14C-labeling of triglyceride–glycerolwas measured in humans following the administration of 14C-glycerol,sophisticated mathematical models were used to inform on the rates ofdifferent reactions [1]. An important consideration regarding these datacenters on the potential for secondary tracers (or isotope recycling).For example, carbon-labeled glycerol can be converted to carbon-labeled glucosewhich can thengenerate carbon-labeled lactate, pyruvate,etc. The conversion of those intermediates to triose-phosphates will leadto the (re)incorporation of labeled carbon into triglyceride–glycerol. Onepotential consequence of this isotopic scrambling is the generation of a“tail” in the apparent labeling curve of triglyceride–glycerol. Althoughrecycling is somewhat difficult to detect when using 14C-tracers, thedetectionmethods used in stable isotope studies permit an immediate as-sessment of 13C recycling. For example, we previously measured the in-corporation of [U-13C]glycerol (M + 3) into glucose [82,121]. Althoughthe predominant shift in glucose labeling occurred in the M + 3isotopomer, we also observed substantial increases in the abundance ofsingly and doubly-labeled (M + 1 and M + 2, respectively) glucose. Al-though our analyses did not aim to definitively measure rates of tracerrecycling, the data demonstrate the importance of this concept and sug-gest that a sizeable amount of labeled glycerol will recycle.
Recent investigations have capitalized on the use of [2H5]glycerol.As noted above, one might expect the appearance of several massisotopomers of triglyceride–glycerol following the administration of[2H5]glycerol. For example, the injected [2H5]glycerol tracer (i.e. M + 5)is readily phosphorylated and then either immediately incorporatedinto triglyceride–glycerol (generating an M + 5 product) or equili-brated with the triose-phosphate pool which generates various massisotopomers of glycerol-3-phosphate depending on the extent of me-tabolism. Patterson and colleagues clearly demonstrated this in humans(Fig. 3) [114]. Another “proof” of isotopic scrambling centers on the useof 2H2O in studies of triglyceride–glycerol flux. For example, the in-corporation of 2H, following the administration of 2H2O, is possiblevia a rapid equilibration between the triose phosphates and glycerol-3-phosphate (Fig. 3) [20,153].
It is of interest to discuss the recent use of [2H5]glycerol in studiesof triglyceride production by Qi et al. [124]. Briefly, it appears that tri-glyceride production was estimated by administering a bolus of [2H5]glycerol and then measuring the abundance of different 2H-labeledtriglycerides. Although Qi et al. [124] concluded that their novel com-pounds inhibit triglyceride production,we suspect that certain assump-tions may complicate the interpretation. For example, it appears thatthese investigators simply administered [2H5]glycerol and then mea-sured the concentration of [2H5]triglyceride52:2 in vivo as a marker oftriglyceride production. Why is this concerning? The concentration of[2H5]triglyceride52:2 is affected by (i) the dose of [2H5]glycerol, (ii) theinitial dilution of the tracer at the extracellular level which is influencedby differences in glycerol concentration and/or flux between controland treated subjects, (iii) isotope exchange at the level of triosephosphates, (iv) isotope dilution at the level of triose phosphatesand (v) the rate of triglyceride production (Fig. 3). Different levels of di-lution and/or exchange following the administration of [2H5]glycerol(i.e. steps ii, iii and iv) make it difficult to definitively interpret thedata [124,125].
There are a few additional points to consider regarding the conclu-sion that the incorporation of 2H-glycerol vs 13C-oleate is specific to asingle enzyme (i.e. DGAT2) [124]. First, as eluded to above, the differ-ences between the labeled glycerol and fatty acids could simply be
caused by overlooked assumptions. Second, it is not clear whethersome form of compensation did not occur, enzymes other than DGAT2are capable of catalyzing the same reactions. Third, hepatic zonationof metabolic flux is known to affect the interpretation of tracer data.For example, different concentration and/or labeling gradients acrossthe liver (or splanchnic bed)may contribute to the apparent differencesin triglyceride labeling that result following the administration of2H-glycerol vs 13C-oleate.
Please note that the points being raised here are not meant to re-flect negatively on the work of Qi et al. [124,125], it could be that theconcerns outlined above have been evaluated by the authors; thesepapers are used as examples since experimental details seem to beabsent and fundamental assumptions are not discussed, both wouldhelp readers better understand the conclusions. Discrepancies betweentracer methods and/or other methods are common. For example, thedogma is (or was) that liver and kidney remove glycerol since these or-gans contain measureable activities of glycerokinase, a critical enzymeinvolved in glycerol metabolism [91]. However, that concept was chal-lenged by coupling arterio-venous balance measurements of glycerolconcentration and isotopic labeling, the data demonstrated substantialextra-hepatic and extra-renal glycerol utilization [84]. This raised thequestion, How does a tissue use glycerol if glycerokinase is not present?Howcould a tracermethod yield a different result as compared to directlymeasuring enzyme activity? Could bothmethods be correct yet they leadto different conclusions? Although it is difficult to answer this questionwith complete confidence, other pathways of glycerol utilizationhave been proposed, e.g. glycerol + NADP → glyceraldehyde + NADPH[43,150].
4.3. Application of 2H- or 18O-labeled water
Although readers will likely recognize how 2H2O can be used toestimate the contribution of de novo lipogenesis, its use in quantify-ing triglyceride production may be less clear. We will first briefly out-line pivotal discussions in which 2H2O was used to study fatty acidsynthesis and then expand the review to triglyceride flux.
The seminal studies of Schoenheimer and Rittenberg demonstrat-ed that biosynthetic reactions incorporate protons from body water
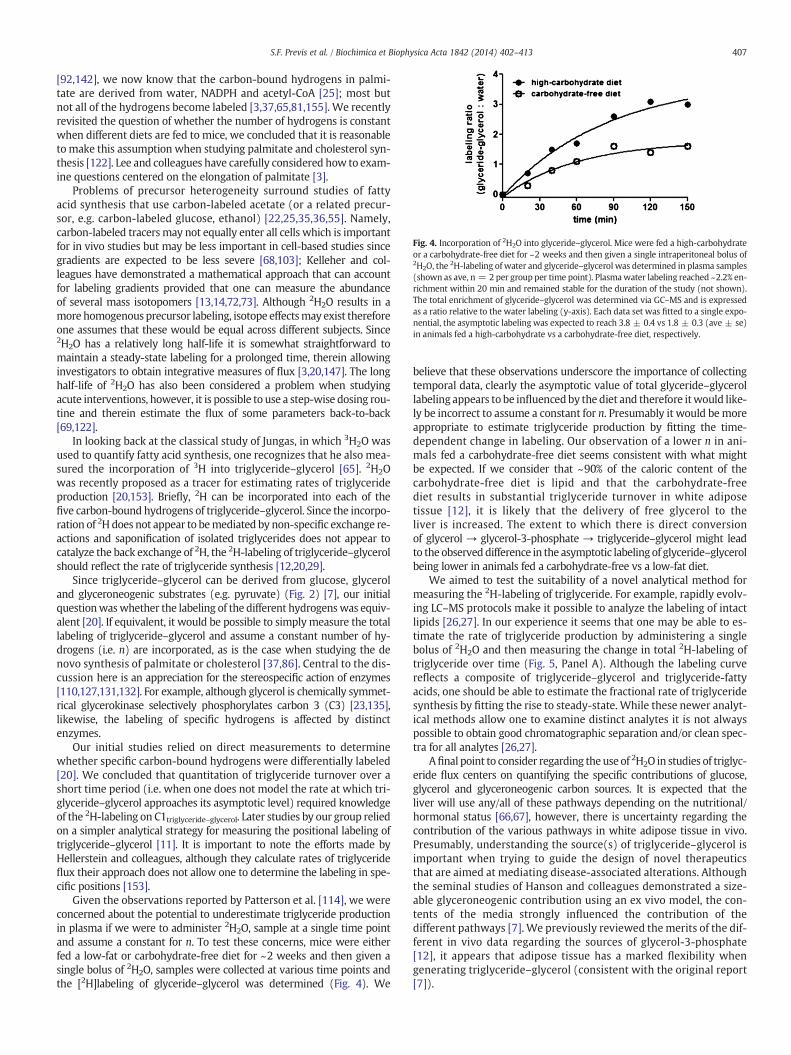
Fig. 4. Incorporation of 2H2O into glyceride–glycerol. Mice were fed a high-carbohydrateor a carbohydrate-free diet for ~2 weeks and then given a single intraperitoneal bolus of2H2O, the 2H-labeling of water and glyceride–glycerol was determined in plasma samples(shown as ave, n = 2 per group per time point). Plasmawater labeling reached ~2.2% en-richment within 20 min and remained stable for the duration of the study (not shown).The total enrichment of glyceride–glycerol was determined via GC–MS and is expressedas a ratio relative to the water labeling (y-axis). Each data set was fitted to a single expo-nential, the asymptotic labeling was expected to reach 3.8 ± 0.4 vs 1.8 ± 0.3 (ave ± se)in animals fed a high-carbohydrate vs a carbohydrate-free diet, respectively.
407S.F. Previs et al. / Biochimica et Biophysica Acta 1842 (2014) 402–413
[92,142], we now know that the carbon-bound hydrogens in palmi-tate are derived from water, NADPH and acetyl-CoA [25]; most butnot all of the hydrogens become labeled [3,37,65,81,155]. We recentlyrevisited the question of whether the number of hydrogens is constantwhen different diets are fed to mice, we concluded that it is reasonableto make this assumption when studying palmitate and cholesterol syn-thesis [122]. Lee and colleagues have carefully considered how to exam-ine questions centered on the elongation of palmitate [3].
Problems of precursor heterogeneity surround studies of fattyacid synthesis that use carbon-labeled acetate (or a related precur-sor, e.g. carbon-labeled glucose, ethanol) [22,25,35,36,55]. Namely,carbon-labeled tracersmay not equally enter all cells which is importantfor in vivo studies but may be less important in cell-based studies sincegradients are expected to be less severe [68,103]; Kelleher and col-leagues have demonstrated a mathematical approach that can accountfor labeling gradients provided that one can measure the abundanceof several mass isotopomers [13,14,72,73]. Although 2H2O results in amore homogenous precursor labeling, isotope effectsmay exist thereforeone assumes that these would be equal across different subjects. Since2H2O has a relatively long half-life it is somewhat straightforward tomaintain a steady-state labeling for a prolonged time, therein allowinginvestigators to obtain integrative measures of flux [3,20,147]. The longhalf-life of 2H2O has also been considered a problem when studyingacute interventions, however, it is possible to use a step-wise dosing rou-tine and therein estimate the flux of some parameters back-to-back[69,122].
In looking back at the classical study of Jungas, in which 3H2O wasused to quantify fatty acid synthesis, one recognizes that he also mea-sured the incorporation of 3H into triglyceride–glycerol [65]. 2H2Owas recently proposed as a tracer for estimating rates of triglycerideproduction [20,153]. Briefly, 2H can be incorporated into each of thefive carbon-bound hydrogens of triglyceride–glycerol. Since the incorpo-ration of 2H does not appear to bemediated by non-specific exchange re-actions and saponification of isolated triglycerides does not appear tocatalyze the back exchange of 2H, the 2H-labeling of triglyceride–glycerolshould reflect the rate of triglyceride synthesis [12,20,29].
Since triglyceride–glycerol can be derived from glucose, glyceroland glyceroneogenic substrates (e.g. pyruvate) (Fig. 2) [7], our initialquestionwaswhether the labeling of the different hydrogenswas equiv-alent [20]. If equivalent, it would be possible to simply measure the totallabeling of triglyceride–glycerol and assume a constant number of hy-drogens (i.e. n) are incorporated, as is the case when studying the denovo synthesis of palmitate or cholesterol [37,86]. Central to the dis-cussion here is an appreciation for the stereospecific action of enzymes[110,127,131,132]. For example, although glycerol is chemically symmet-rical glycerokinase selectively phosphorylates carbon 3 (C3) [23,135],likewise, the labeling of specific hydrogens is affected by distinctenzymes.
Our initial studies relied on direct measurements to determinewhether specific carbon-bound hydrogens were differentially labeled[20]. We concluded that quantitation of triglyceride turnover over ashort time period (i.e. when one does not model the rate at which tri-glyceride–glycerol approaches its asymptotic level) required knowledgeof the 2H-labeling on C1triglyceride–glycerol. Later studies by our group reliedon a simpler analytical strategy for measuring the positional labeling oftriglyceride–glycerol [11]. It is important to note the efforts made byHellerstein and colleagues, although they calculate rates of triglycerideflux their approach does not allow one to determine the labeling in spe-cific positions [153].
Given the observations reported by Patterson et al. [114], we wereconcerned about the potential to underestimate triglyceride productionin plasma if we were to administer 2H2O, sample at a single time pointand assume a constant for n. To test these concerns, mice were eitherfed a low-fat or carbohydrate-free diet for ~2 weeks and then given asingle bolus of 2H2O, samples were collected at various time points andthe [2H]labeling of glyceride–glycerol was determined (Fig. 4). We
believe that these observations underscore the importance of collectingtemporal data, clearly the asymptotic value of total glyceride–glycerollabeling appears to be influencedby the diet and therefore itwould like-ly be incorrect to assume a constant for n. Presumably it would bemoreappropriate to estimate triglyceride production by fitting the time-dependent change in labeling. Our observation of a lower n in ani-mals fed a carbohydrate-free diet seems consistent with what mightbe expected. If we consider that ~90% of the caloric content of thecarbohydrate-free diet is lipid and that the carbohydrate-freediet results in substantial triglyceride turnover in white adiposetissue [12], it is likely that the delivery of free glycerol to theliver is increased. The extent to which there is direct conversionof glycerol → glycerol-3-phosphate → triglyceride–glycerol might leadto the observeddifference in the asymptotic labeling of glyceride–glycerolbeing lower in animals fed a carbohydrate-free vs a low-fat diet.
We aimed to test the suitability of a novel analytical method formeasuring the 2H-labeling of triglyceride. For example, rapidly evolv-ing LC–MS protocols make it possible to analyze the labeling of intactlipids [26,27]. In our experience it seems that one may be able to es-timate the rate of triglyceride production by administering a singlebolus of 2H2O and then measuring the change in total 2H-labeling oftriglyceride over time (Fig. 5, Panel A). Although the labeling curvereflects a composite of triglyceride–glycerol and triglyceride-fattyacids, one should be able to estimate the fractional rate of triglyceridesynthesis by fitting the rise to steady-state. While these newer analyt-ical methods allow one to examine distinct analytes it is not alwayspossible to obtain good chromatographic separation and/or clean spec-tra for all analytes [26,27].
Afinal point to consider regarding the use of 2H2O in studies of triglyc-eride flux centers on quantifying the specific contributions of glucose,glycerol and glyceroneogenic carbon sources. It is expected that theliver will use any/all of these pathways depending on the nutritional/hormonal status [66,67], however, there is uncertainty regarding thecontribution of the various pathways in white adipose tissue in vivo.Presumably, understanding the source(s) of triglyceride–glycerol isimportant when trying to guide the design of novel therapeuticsthat are aimed at mediating disease-associated alterations. Althoughthe seminal studies of Hanson and colleagues demonstrated a size-able glyceroneogenic contribution using an ex vivo model, the con-tents of the media strongly influenced the contribution of thedifferent pathways [7]. We previously reviewed the merits of the dif-ferent in vivo data regarding the sources of glycerol-3-phosphate[12], it appears that adipose tissue has a marked flexibility whengenerating triglyceride–glycerol (consistent with the original report[7]).

Fig. 5. Incorporation of 2H- or 18O-labeled water into specific triglycerides. Mice were fed a standard diet and then given a single intraperitoneal bolus of either 2H- or 18O-labeledwater. The labeling of plasma water and specific triglycerides was determined (data shown as ave ± se, n = 3 per group per time point). The labeling of plasma water wasmaintained at ~2.5% for the duration of the study and there was substantial incorporation of 2H or 18O from water into the respective triglycerides. Note that in the case where2H-labeled water was administered, plasma was saponified and the 2H-labeling of total palmitate was also measured, the sizeable difference between the labeling of palmitateand the intact triglycerides suggests that the majority of the increase in triglyceride labeling reflects the incorporation of 2H-glycerol. Regardless of the water tracer, the productlabeling reaches several times that of the precursor labeling; this is expected since multiple copies of the precursor are incorporated. Note that triglyceride labeling was determinedusing LC-Q-TOF analyses on the intact lipid [27].
408 S.F. Previs et al. / Biochimica et Biophysica Acta 1842 (2014) 402–413
One can find a few published reports regarding the use of 18O-waterin studies of lipid synthesis [80,106,137,138]. In short, since the hydroly-sis of complex lipids (e.g. triglyceride and phospholipids) in the presenceof 18O-water will lead to the generation of 18O-labeled fatty acids itshould be possible to estimate lipid synthesis by measuring the(re)incorporation of those fatty acids into various end-products. Al-though the previous work relied on rather cumbersome methods forisolating lipids, and caution had to be exercised in regard to samplepreparation prior to GC–MS analyses, the data were of value [137].We were intrigued by the potential of using 18O-water in studies oflipid flux. Briefly, we recently revisited the use of 18O-water for studiesof protein flux and thought that the ability to couple measurements oflipid flux would be of interest in certain scenarios [162]. Rodents weregiven a single bolus of 18O-water and samples were collected at varioustime points, lipids were extracted from plasma and subjected to LC–MSanalyses, the temporal incorporation of 18O-water was determined inselect analytes (Fig. 5, Panel B). We found that the asymptotic labelingof triglyceride52:2 and triglyceride52:3 was several times greater thanthat of body water which is consistent with the notion of an amplifica-tion between the precursor:product labeling ratio of which the finalvalue reflects the number of labeled sites [22]. Despite the marked dif-ferences in the pathways which incorporate 2H vs 18O from bodywater, we observed comparable fractional synthetic rates of the specifictriglycerides, i.e. ~2.28 vs ~2.10 pools per hour, respectively (Fig. 5).
Our pilot studies were followed by a study in which we adminis-tered 18O-water to mice under various conditions, i.e. control, follow-ing intravenous injection of Intralipid or the administration of aninhibitor of microsomal transfer protein [162]. Samples were collectedat ~90 min post-tracer administration and relative rates of lipid andapoB flux were estimated. It appears that at lower rates of triglycerideflux there is a fairly direct relationship with apoB flux, this couplingseems to be lost as the rate of triglyceride flux increases (Fig. 6). Al-though it is beyond the scope of this review to comment on the inter-pretation of these data, our observation is consistent with an earlierstudy in humans which relied on the use of separate tracers [102]; theability to use labeled water allows for a simpler study protocol whichmay be uniquely suited for animal models (Fig. 1).
5. Ancillary measures when studying lipid kinetics: estimatingbody composition and total energy expenditure
Studies aimed at understanding lipid flux may consider estimatesof body composition and/or energy expenditure. We recognize thatvarious methods can be used to quantify these endpoints and we do
not consider the merits of one vs another, our point here is to explainhow isotopically labeled water can be used to make those measure-ments [4,158].
5.1. Body composition
The principle of using isotopically labeledwater to estimate fatmassis relatively straightforward. Briefly, a known quantity of either 2H- or18O-labeled water is administered as a bolus injection. After allowingfor isotope equilibration, a blood sample is collected and the 2H- or18O-enrichment of bodywater ismeasured, total bodywater is calculat-ed from the dilution of the tracer. Once total body water is determined,fat mass can be estimated by assuming that (i) the body is composed oftwo basic compartments (i.e. fat-free mass and fat mass) and (ii) thereis a constant relationship between total body water and fat-free drymass [98]. Obviously, water-based estimates of body composition donot permit the assessment of tissue-specific fat accumulation, imagingmethods and/or direct tissue biopsieswould beneeded to address ques-tions regarding the localization of fat.
5.2. Total energy expenditure
Total energy expenditure (i.e. basal metabolic rate, thermic effectof food and physical activity) can be determined by administering abolus of “doubly-labeled” water [89,90]. The difference between theelimination of 18O and 2H from body water equals the fractional rateof CO2 production, a series of calculations are then performed to esti-mate energy expenditure [158], the “doubly-labeled”watermethod as-sumes that 2H is primarily lost as water and that 18O is primarily lost aswater and CO2.
Lifson and McClintock's pioneering work demonstrated strongagreement between measurements of CO2 production made using“doubly-labeled”water and indirect calorimetry [89,90], various groupshave since expanded the use of “doubly-labeled” [50,62,139,140]. It isimportant to note thatmeasurements of tracer dilution do not immedi-ately yield an estimate of total energy expenditure. The measurementsallowone to calculate the fractional rates of 2H and 18O turnover in bodywater, a number of equations are then used to calculate the rate of CO2
production and energy expenditure. It may be difficult to completelyverify the application of different eqs. in every experimental setting sosome caution should be exercised when interpreting the data [158].We adapted the “doubly-labeled” water method in order to simulta-neously estimate CO2 production and lipid and protein flux [11]. Theaim of those experiments had been to couple concepts of mass-balance

409S.F. Previs et al. / Biochimica et Biophysica Acta 1842 (2014) 402–413
and tracer kinetics, i.e. to link changes in whole-body energy balance tochanges in pathway flux that affect adipose vs muscle mass.
6. Cholesterol flux and related processes
The synthesis of cholesterol and related products (e.g. cholesterolesters and bile acids) has received considerable attention. Rates of denovo cholesterol synthesis have been estimated using either carbon-labeled acetate or “heavy”water, however, concerns have been expressedregarding the use of carbon-labeled substrates [25,36].We aim to providea simple example of how 2H-labeledwater can be used to somewhat eas-ily study the coordinated regulation of pathways surrounding cholesterolhomeostasis. Again, the central point to be made here concerns the logicof the methods and not necessarily the biology.
Total cholesterol flux can be estimated by administering a single bolusof labeled cholesterol and then measuring its dilution over time, OstlundandMatthews demonstrated that stable isotope tracers arewell suited forthis purpose [111,112]. The ability to differentiate the source(s) of choles-terol requires additional tracers. For example, cholesterol absorption canbe studied using dual tracer methods whereas 2H-labeled water can beused to estimate de novo synthesis [17,38,63,64,152,163]. A major path-way for affecting cholesterol elimination is its conversion to bile acids;Stellaard and colleagues have rigorously examinedhow to approach stud-ies of bile acid kinetics [8,9,143–146]. Briefly, althoughbile acids are phys-ically separated into plasma, bile and intestinal pools, the rate of mixingbetween these sites is expected to be much greater than the throughput(Fig. 7). Consequently, since bile acids behave as a single well-mixedpool their kinetics can be studied by administering a bile acid tracer(s)and then determining the initial labeling and the rate of dilution, i.e. thepool size and fractional turnover, respectively.
Important goals inmanaging dyslipidemia are lowering plasma cho-lesterol and/or removing cholesterol from peripheral sites (e.g. plaque),apoA1 kineticsmay be amarker of the latter. Although one can envisionthe design of multi-tracer studies to dissect the pathways surroundingcholesterol homeostasis we provide an example of how 2H2O could beused to examine several connections (Fig. 7). Briefly, two groups ofmice were fed a standard low-fat, low-cholesterol diet, one group wastreated as controls whereas the other group was given cholestyramine(~3% by weight mixed with the food). All animals were given a bolusof 2H2O afterwhich the 2H-labeling of water, cholesterol, cholic acidand apoA1 were measured at various time intervals. Since a bolus ofwaterwas administeredwe expected a slight decrease in the 2H-labelingof body water, however, since the dilution is virtually identical betweenthe two groups it is somewhat straightforward to examine the effect of
0 2 4 6 8 100
500
1000
1500
2000
2500
triglyceride52:2 relative flux
apo
B r
elat
ive
flu
x
Fig. 6. Coupling measurements of triglyceride and apoB relative flux rates. Mice werestudied under conditions that were expected to perturb lipoprotein flux, i.e. controlor Intralipid challenge or inhibition of microsomal triglyceride transfer protein (triangles,squares and circles, respectively). The incorporation of 2H- or 18O-labeled water (openand closed symbols, respectively) was used to simultaneously estimate the relative fluxof apoB and triglyceride52:2, plasma was collected 90 min after the water tracers weregiven. Lipids and apoB were analyzed as described [27,162].
cholestyramine on this network. Consistentwithwhat onemight expect,treatment with cholestyramine induced an increase in cholesterol syn-thesis, promoted the conversion of newly made cholesterol to cholicacid and increased cholic acid turnover, a somewhat novel finding isthe apparent lack of an effect on the fractional rate of apoA1 production(Fig. 7). Again, as mentioned before, the point of this example is to dem-onstrate the relative ease with which interrelated metabolic flux ratescan be studied using a single tracer method, a complete mechanistic un-derstanding of the biochemistry is beyond the scope of this report.
7. Measuring isotopic labeling by mass spectrometry: is there abest approach?
We suspect that it would be easy to either discourage or offendmany readers by choosing a single instrument so we will try to bal-ance our understanding of the pros and cons regarding the use of var-ious mass spectrometry systems. Note that although other analyticalplatforms can be used to measure the isotopic abundance of differentanalytes (e.g. NMR), mass spectrometry-based analyses are perhapsthe most widely used.
In our experience, a standard GC–MS platform is sufficient for run-ning many of the analyses discussed herein. In addition to the factthat virtually all GC–MS instruments have small footprints as com-pared to LC–MS instruments, GC–MS are relatively inexpensive topurchase, easy to maintain and they generally have robust perfor-mance records. Numerous methods have been reported for analyzingsmall molecules via GC–MS therefore it is possible to easily get started[16,49,53,115,158]. Some investigators have demonstrated the abilityto adapt small molecule analyses for LC–MS configurations [99,129],presumably the utility of LC–MS for lipid analyses centers on methodsfor lipidomic-type analyses [27,31]. A central question in terms ofusing LC–MS protocols for tracer studies centers on what type of massanalyzer is better. In our experience, the use of a Q-TOF configurationhas proven to be very powerful [26,27,156]. It seems that one can obtainhighly reproducible measurements of isotope labeling ratios over alarge dynamic range using a non-biased approach. For example,Q-TOF instruments yield highly reproducible measurements of isotopicratios. QQQ instruments offer comparable reproducibility, however,they usually require pre-determined MRM settings and are thereforemore limited to targeted analyses. We have had mixed success using“trap”-based instruments, in our experience the analyses yield reliableinformation regarding exact mass data but the measurements are typi-cally limited by a lack of precision and/or accuracy when quantifyingisotopic ratios, this was most obvious when trying to measure isotoperatios over a wide dynamic range. Recent efforts by our colleagueshave demonstrated a novel approach that should now enable routineand reliable measurements of isotopic labeling using “trap”-basedmass spectrometers. Briefly, Kasumov and colleagues proposed to ac-quire data at various resolution settings from which they can constructa calibration curve to account for any systematic bias in the apparentisotopic labeling [58]. A final point to consider here in terms of couplingtracer methods with mass spectrometry-based analyses centers on theemerging use of imaging mass spectrometry to study spatial and tem-poral flux [75,85].
Our discussion to this point has avoided the topic of how to obtainlipids for any analyses [31]. In general, unless some level of purification isused one must interpret the data with caution. In our experience, whiteadipose tissue contains an overwhelming amount of triglyceride as com-pared to other glyceride species so that it may be possible to simply as-sume that any glycerol released after saponification is from triglyceride[20].When studyingplasma-derived lipids, investigators typically use ul-tracentrifugation to separate lipoprotein fractions before subjecting thesamples for further preparation and mass spectrometry-based analyses[88,114]. We recently capitalized on the use of a gel-based separationtechnique which seems reasonable for studies of lipid flux [101].

Fig. 7. Simultaneous assessment of multiple indicators of cholesterol homeostasis. Mice were fed a standard low-cholesterol diet ± cholestyramine for 5 days and then given a singleintraperitoneal bolus of 2H2O. The 2H-labeling of water, total cholesterol, cholic acid and apoA1 were determined using plasma samples were collected over 48 h (data are shown asave ± se, n = 3 per time point per group). Cholestyramine-feeding did not influence the 2H-labeling of body water but there was a sizeable increase in the contribution of newlymade cholesterol and conversion to cholic acid, in contrast, therewas no apparent effect on the fractional rate of apoA1 synthesis. The 2H-labeling ofwater and cholesterolwas determinedby GC–MS [59] whereas LC–MS was used to determine the 2H-labeling of cholic acid and apoA1 [162].
410 S.F. Previs et al. / Biochimica et Biophysica Acta 1842 (2014) 402–413
8. Mathematical modeling
Central to metabolic flux studies is an alignment between thephysiological and the mathematical models. We previously reviewedseveral concepts regarding compartmentation of triglycerides in adi-pose tissue, presumably that discussion has implications in regard tolipid flux in other locations [20]. Our efforts towards studying lipid ac-cretion relied on a straightforward logic, by measuring the change inthe pool size over time and the rate of synthesis via 2H2O we couldcalculate the rate of degradation [11,12,20]. Obviously, in a metabolicsteady-state the production is equal to the degradation. Berman,Grundy and Howard published a highly useful collection of reports re-garding early efforts aimed at modeling plasma lipoprotein kinetics[1]. Other valuable resources, in regard to general concepts, are the pa-pers by Foster et al. [44] and Ramakrishnan [126]. One important areathat has perhaps seen little attention surrounds reproducibility and/orpropagation of error [11,122,160]; Magkos, Patterson and Mittendorfercarefully considered thismatter using a range of tracers surrounding lipo-protein kinetics [94] whereas Matthews et al. [96] rigorously examinedthis for studies of leucine flux.
9. Summary
It should be clear that there are a number of methods for studyinglipid kinetics. Obviously, the questions will drive the utilization of themethod(s) and/or influence the development of new tools. We hopeto have outlined several of the approaches that can be consideredwhen examining the biochemical basis of lipid flux, presumably themethods discussed herein can be used to address questions surroundingthe pathogenesis and management of obesity, (diabetic) dyslipidemia,cardiovascular disease and/or lipotrophic disorders.
Although our attention was mainly focused on questions relatedto the dynamics of circulating lipids as well as white adipose tissuehomeostasis, the logic outlined here should allow investigators toapply the methods in novel areas (e.g. neuroscience or cancer) and/orshed light on gaps in the field. In particular, we believe that attention
to data processingmethodswill be of great value in the future. For exam-ple, there are numerous examples in the literature which demonstratethe power of lipidomics [31]. Aswe recently observed, it is possible to ex-tract information regarding kinetics by coupling stable isotope tracermethods with LC–MS/MS analyses [26,27]. In our experience, the hard-ware outperforms the ability of the software to readily extract the label-ing data.
Lastly, we have found that 2H2O can be used to measure most of themajor reactions that affect triglyceride accumulation (i.e. the rates oftriglyceride synthesis and breakdown, the contribution of de novo lipo-genesis to the pool of triglyceride-bound fatty acids and the rate of re-modeling of adipose tissue triglycerides). As well, 2H2O can be used tostudy coupled processes (e.g. lipid and protein flux), including a dissec-tion of carbohydrate flux and DNA synthesis [19,24,28,38,120,147,162].We expect that advances in instrumentation will continue to improvethe limits of detection and reduce the tracer requirements. This willhave obvious advantages in terms of cost and presumably affect safetyconcerns. Aside from occasional/transient nausea and vertigo, we havenot observed any overt signs of toxicity when administering 2H2O. Wegenerally enrich body water to ~2.5% in rodents, side effects and toxicityhave been demonstrated at higher doses [34,71,116]. Studies performedin non-human primates typically use doses of 2H2O that are closer towhat is reported in humans (e.g. ~0.5% enrichment), as in human sub-jects, the required dose of tracer is given in small volumes over an ex-tended time period without any apparent adverse reactions [56,122].
Acknowledgements
S.F. Previs is grateful to his long standing collaborator Dr. Vernon E.Anderson for helpful discussions regarding stereochemistry of enzymereaction mechanisms and Dr. Irwin A. Rose for several discussions re-garding his classic work on triose phosphate isomerase, aldolase andgeneral proton exchange reactions. We apologize to the many authorswho are not cited, our aimwas to find exampleswhich demonstrate crit-ical points regarding technical advances and/or to facilitate a discussion

411S.F. Previs et al. / Biochimica et Biophysica Acta 1842 (2014) 402–413
of (often unstated) assumptions and potential limitations of differentapproaches.
References
[1] Lipoprotein Kinetics and Modeling, Academic Press, New York, 1982.[2] A. Aarsland, R.R. Wolfe, Hepatic secretion of VLDL fatty acids during stimulated
lipogenesis in men, J. Lipid Res. 39 (1998) 1280–1286.[3] H.O. Ajie, M.J. Connor, W.N. Lee, S. Bassilian, E.A. Bergner, L.O. Byerley, In vivo
study of the biosynthesis of long-chain fatty acids using deuterated water, Am.J. Physiol. 269 (1995) E247–E252.
[4] J. Annegers, Total body water in rats and in mice, Proc. Soc. Exp. Biol. Med. 87(1954) 454–456.
[5] P. Arner, Techniques for the measurement of white adipose tissue metabolism: apractical guide, Int. J. Obes. Relat. Metab. Disord. 19 (1995) 435–442.
[6] J.E. Ayala, V.T. Samuel, G.J. Morton, S. Obici, C.M. Croniger, G.I. Shulman, D.H.Wasserman, O.P. McGuinness, Standard operating procedures for describingand performing metabolic tests of glucose homeostasis in mice, Dis. Model. Mech.3 (2010) 525–534.
[7] F.J. Ballard, R.W. Hanson, G.A. Leveille, Phosphoenolpyruvate carboxykinase andthe synthesis of glyceride–glycerol from pyruvate in adipose tissue, J. Biol. Chem.242 (1967) 2746–2750.
[8] R.H. Bandsma, F. Kuipers, R.J. Vonk, R. Boverhof, P.J. Sauer, G.T. Nagel, H. Elzinga,R.A. Neese, M.K. Hellerstein, F. Stellaard, The contribution of newly synthesizedcholesterol to bile salt synthesis in rats quantified by mass isotopomer distribu-tion analysis, Biochim. Biophys. Acta 1483 (2000) 343–351.
[9] R.H. Bandsma, F. Stellaard, R.J. Vonk, G.T. Nagel, R.A. Neese, M.K. Hellerstein, F.Kuipers, Contribution of newly synthesized cholesterol to rat plasma and biledetermined by mass isotopomer distribution analysis: bile–salt flux promotessecretion of newly synthesized cholesterol into bile, Biochem. J. 329 (Pt 3)(1998) 699–703.
[10] J.M. Basak, J. Kim, Y. Pyatkivskyy, K.R. Wildsmith, H. Jiang, M. Parsadanian, B.W.Patterson, R.J. Bateman, D.M. Holtzman, Measurement of apolipoprotein E andamyloid beta clearance rates in themouse brain using bolus stable isotope labeling,Mol. Neurodegener. 7 (2012) 14.
[11] I.R. Bederman, D.A. Dufner, J.C. Alexander, S.F. Previs, Novel application of the “doublylabeled”water method: measuring CO2 production and the tissue-specific dynamicsof lipid and protein in vivo, Am. J. Physiol. Endocrinol. Metab. 290 (2006)E1048–E1056.
[12] I.R. Bederman, S. Foy, V. Chandramouli, J.C. Alexander, S.F. Previs, Triglyceride syn-thesis in epididymal adipose tissue contribution of glucose and non-glucose carbonsources, J. Biol. Chem. 284 (2009) 6101–6108.
[13] I.R. Bederman, T. Kasumov, A.E. Reszko, F. David,H. Brunengraber, J.K. Kelleher, In vitromodeling of fatty acid synthesis under conditions simulating the zonation of lipogenic[13C]acetyl-CoA enrichment in the liver, J. Biol. Chem. 279 (2004) 43217–43226.
[14] I.R. Bederman, A.E. Reszko, T. Kasumov, F. David, D.H. Wasserman, J.K. Kelleher,H. Brunengraber, Zonation of labeling of lipogenic acetyl-CoA across the liver:implications for studies of lipogenesis by mass isotopomer analysis, J. Biol.Chem. 279 (2004) 43207–43216.
[15] D.H. Bessesen, S.H. Vensor, M.R. Jackman, Trafficking of dietary oleic, linolenic,and stearic acids in fasted or fed lean rats, Am. J. Physiol. Endocrinol. Metab. 278(2000) E1124–E1132.
[16] M. Beylot, C.Martin, B. Beaufrere, J.P. Riou, R.Mornex, Determination of steady stateand nonsteady-state glycerol kinetics in humans using deuterium-labeled tracer,J. Lipid Res. 28 (1987) 414–422.
[17] M.S. Bosner, R.E. Ostlund Jr., O. Osofisan, J. Grosklos, C. Fritschle, L.G. Lange, Assess-ment of percent cholesterol absorption in humans with stable isotopes, J. Lipid Res.34 (1993) 1047–1053.
[18] J.H. Bragdon, R.S. Gordon Jr., Tissue distribution of C14 after the intravenous in-jection of labeled chylomicrons and unesterified fatty acids in the rat, J. Clin. In-vest. 37 (1958) 574–578.
[19] J.D. Browning, S.C. Burgess, Use of 2H2O for estimating rates of gluconeogenesis:determination and correction of error due to transaldolase exchange, Am. J. Physiol.Endocrinol. Metab. 303 (2012) E1304–E1312.
[20] D.Z. Brunengraber, B.J. Mccabe, T. Kasumov, J.C. Alexander, V. Chandramouli, S.F.Previs, Influence of diet on the modeling of adipose tissue triglycerides duringgrowth, Am. J. Physiol. Endocrinol. Metab. 285 (2003) E917–E925.
[21] H. Brunengraber, What is the proper precursor-to-product labeling relationshipfor calculating the fractional synthetic rate of muscle triglyceride? J. Lipid Res.53 (2012) 1–3.
[22] H. Brunengraber, J.K. Kelleher, C. DesRosiers, Applications of mass isotopomeranalysis to nutrition research, Annu. Rev. Nutr. 17 (1997) 559–596.
[23] C. Bublitz, E.P. Kennedy, A note of the asymmetrical metabolism of glycerol, J. Biol.Chem. 211 (1954) 963–967.
[24] R. Busch, Y.K. Kim, R.A. Neese, V. Schade-Serin, M. Collins, M. Awada, J.L.Gardner, C. Beysen, M.E. Marino, L.M. Misell, M.K. Hellerstein, Measurement ofprotein turnover rates by heavy water labeling of nonessential amino acids,Biochim. Biophys. Acta 1760 (2006) 730–744.
[25] J.P. Casazza, R.L. Veech, Quantitation of the rate of fatty acid synthesis, Lab. Res.Methods Biol. Med. 10 (1984) 231–240.
[26] J. Castro-Perez, S.F. Previs, D.G. McLaren, V. Shah, K. Herath, G. Bhat, D.G. Johns, S.P.Wang, L. Mitnaul, K. Jensen, R. Vreeken, T. Hankemeier, T.P. Roddy, B.K. Hubbard, InvivoD2O labeling to quantify static and dynamic changes in cholesterol and choles-terol esters by high resolution LC/MS, J. Lipid Res. 52 (2011) 159–169.
[27] J.M. Castro-Perez, T.P. Roddy, V. Shah, D.G. McLaren, S.P. Wang, K. Jensen, R.J.Vreeken, T. Hankemeier, D.G. Johns, S.F. Previs, B.K. Hubbard, Identifying static andkinetic lipid phenotypes by high resolution UPLC–MS: unraveling diet-inducedchanges in lipid homeostasis by coupling metabolomics and fluxomics, J. ProteomeRes. 10 (2011) 4281–4290.
[28] V. Chandramouli, K. Ekberg, W.C. Schumann, S.C. Kalhan, J. Wahren, B.R. Landau,Quantifying gluconeogenesis during fasting, Am. J. Physiol. 273 (1997) E1209–E1215.
[29] J.L. Chen, E. Peacock, W. Samady, S.M. Turner, R.A. Neese, M.K. Hellerstein, E.J.Murphy, Physiologic and pharmacologic factors influencing glyceroneogeniccontribution to triacylglyceride glycerol measured by mass isotopomer distribu-tion analysis, J. Biol. Chem. 280 (2005) 25396–25402.
[30] D.L. Chinkes, A. Aarsland, J. Rosenblatt, R.R.Wolfe, Comparison ofmass isotopomerdilution methods used to compute VLDL production in vivo, Am. J. Physiol. 271(1996) E373–E383.
[31] W.W. Christie, X. Han, Lipid Analysis: Isolation, Separation, Identification andLipidomic Analysis, The Oily Press, 2010.
[32] S.W. Coppack, D.L. Chinkes, J.M.Miles, B.W. Patterson, S. Klein, Amulticompartmentalmodel of in vivo adipose tissue glycerol kinetics and capillary permeability in lean andobese humans, Diabetes 54 (2005) 1934–1941.
[33] S.W. Coppack, R.D. Evans, R.M. Fisher, K.N. Frayn, G.F. Gibbons, S.M. Humphreys,M.L. Kirk, J.L. Potts, T.D. Hockaday, Adipose tissue metabolism in obesity: lipaseaction in vivo before and after a mixed meal, Metabolism 41 (1992) 264–272.
[34] D.M. Czajka, A.J. Finkel, C.S. Fischer, J.J. Katz, Physiological effects of deuteriumon dogs, Am. J. Physiol. 201 (1961) 357–362.
[35] J.M. Dietschy, J.D. McGarry, Limitations of acetate as a substrate for measuringcholesterol synthesis in liver, J. Biol. Chem. 249 (1974) 52–58.
[36] J.M. Dietschy, D.K. Spady, Measurement of rates of cholesterol synthesis usingtritiated water, J. Lipid Res. 25 (1984) 1469–1476.
[37] F. Diraison, C. Pachiaudi, M. Beylot, In vivo measurement of plasma cholesteroland fatty acid synthesis with deuterated water: determination of the averagenumber of deuterium atoms incorporated, Metabolism 45 (1996) 817–821.
[38] F. Diraison, C. Pachiaudi,M. Beylot,Measuring lipogenesis and cholesterol synthesisin humans with deuterated water: use of simple gas chromatographic/mass spec-trometric techniques, J. Mass Spectrom. 32 (1997) 81–86.
[39] K.L. Donnelly, C.I. Smith, S.J. Schwarzenberg, J. Jessurun, M.D. Boldt, E.J. Parks,Sources of fatty acids stored in liver and secreted via lipoproteins in patientswith nonalcoholic fatty liver disease, J. Clin. Invest. 115 (2005) 1343–1351.
[40] T.O. Eichmann, M. Kumari, J.T. Haas, R.V. Farese Jr., R. Zimmermann, A. Lass, R.Zechner, Studies on the substrate and stereo/regioselectivity of adipose triglyceridelipase, hormone-sensitive lipase, and diacylglycerol-O-acyltransferases, J. Biol.Chem. 287 (2012) 41446–41457.
[41] K. Evans, M.L. Clark, K.N. Frayn, Effects of an oral and intravenous fat load on adi-pose tissue and forearm lipid metabolism, Am. J. Physiol. 276 (1999) E241–E248.
[42] R.V. Farese Jr., T.J. Yost, R.H. Eckel, Tissue-specific regulation of lipoprotein lipase ac-tivity by insulin/glucose in normal-weight humans,Metabolism 40 (1991) 214–216.
[43] T.G. Flynn, J.A. Cromlish, Glycerol dehydrogenase from rabbit muscle, MethodsEnzymol. 89 (Pt D) (1982) 237–242.
[44] D.M. Foster, P.H. Barrett, G. Toffolo,W.F. Beltz, C. Cobelli, Estimating the fractional syn-thetic rate of plasma apolipoproteins and lipids from stable isotope data, J. Lipid Res.34 (1993) 2193–2205.
[45] K.N. Frayn, Adipose tissue as a buffer for daily lipid flux, Diabetologia 45 (2002)1201–1210.
[46] K.N. Frayn, S.W. Coppack, B.A. Fielding, S.M. Humphreys, Coordinated regulationof hormone-sensitive lipase and lipoprotein lipase in human adipose tissue invivo: implications for the control of fat storage and fat mobilization, Adv. EnzymeRegul. 35 (1995) 163–178.
[47] G. Fredrikson, P. Belfrage, Positional specificity of hormone-sensitive lipase fromrat adipose tissue, J. Biol. Chem. 258 (1983) 14253–14256.
[48] G. Fredrikson, H. Tornqvist, P. Belfrage, Hormone-sensitive lipase andmonoacylglycerol lipase are both required for complete degradation of adipocytetriacylglycerol, Biochim. Biophys. Acta 876 (1986) 288–293.
[49] C.D. Gilker, G.R. Pesola, D.E. Matthews, A mass spectrometric method for mea-suring glycerol levels and enrichments in plasma using 13C and 2H stable isoto-pic tracers, Anal. Biochem. 205 (1992) 172–178.
[50] M.I. Goran, E.T. Poehlman, E. Danforth Jr., Experimental reliability of the doublylabeled water technique, Am. J. Physiol. 266 (1994) E510–E515.
[51] S.M. Grundy, H.Y. Mok, L. Zech, D. Steinberg, M. Berman, Transport of very lowdensity lipoprotein triglycerides in varying degrees of obesity and hypertriglyc-eridemia, J. Clin. Invest. 63 (1979) 1274–1283.
[52] H.P. Guan, Y. Li, M.V. Jensen, C.B. Newgard, C.M. Steppan, M.A. Lazar, A futilemetabolic cycle activated in adipocytes by antidiabetic agents, Nat. Med. 8 (2002)1122–1128.
[53] Z. Guo, S. Nielsen, B. Burguera, M.D. Jensen, Free fatty acid turnover measuredusing ultralow doses of [U–13C]palmitate, J. Lipid Res. 38 (1997) 1888–1895.
[54] R.J. Havel, A. Goldfien, The role of the liver and of extrahepatic tissues in thetransport and metabolism of fatty acids and triglycerides in the dog, J. LipidRes. 2 (1961) 389–395.
[55] M.K. Hellerstein, R.A. Neese, Mass isotopomer distribution analysis at eightyears: theoretical, analytic, and experimental considerations, Am. J. Physiol. 276(1999) E1146–E1170.
[56] K. Herath, G. Bhat, P.L. Miller, S.P. Wang, A. Kulick, G. Andrews-Kelly, C. Johnson,R.J. Rohm, M.E. Lassman, S.F. Previs, D.G. Johns, B.K. Hubbard, T.P. Roddy, Equil-ibration of (2)H labeling between body water and free amino acids: enablingstudies of proteome synthesis, Anal. Biochem. 415 (2011) 197–199.
[57] J. Hirsch, Fatty acid patterns in human adipose tissue, in: A.E. Renold, G.F. Cahill(Eds.), Adipose Tissue, Waverly Press, Baltimore, 1965, pp. 181–190.

412 S.F. Previs et al. / Biochimica et Biophysica Acta 1842 (2014) 402–413
[58] S. Ilchenko, S.F. Previs, N. Rachdaoui, B. Willard, A.J. McCullough, T. Kasumov, Animproved measurement of isotopic ratios by high resolution mass spectrometry,J. Am. Soc. Mass Spectrom. 24 (2013) 309–312.
[59] K.K. Jensen, S.F. Previs, L. Zhu, K. Herath, S.P. Wang, G. Bhat, G. Hu, P.L. Miller,D.G. McLaren, M.K. Shin, T.F. Vogt, L. Wang, K.K. Wong, T.P. Roddy, D.G. Johns,B.K. Hubbard, Demonstration of diet-induced decoupling of fatty acid and cho-lesterol synthesis by combining gene expression array and 2H2O quantification,Am. J. Physiol. Endocrinol. Metab. 302 (2012) E209–E217.
[60] M.D. Jensen, V. Chandramouli, W.C. Schumann, K. Ekberg, S.F. Previs, S. Gupta,B.R. Landau, Sources of blood glycerol during fasting, Am. J. Physiol. Endocrinol.Metab. 281 (2001) E998–E1004.
[61] M.D. Jensen, P.J. Rogers, M.G. Ellman, J.M. Miles, Choice of infusion-samplingmode for tracer studies of free fatty acid metabolism, Am. J. Physiol. 254(1988) E562–E565.
[62] R.K. Johnson, P. Driscoll, M.I. Goran, Comparison ofmultiple-pass 24-hour recall es-timates of energy intake with total energy expenditure determined by the doublylabeled water method in young children, J. Am. Diet. Assoc. 96 (1996) 1140–1144.
[63] P.J. Jones, L.M. Ausman, D.H. Croll, J.Y. Feng, E.A. Schaefer, A.H. Lichtenstein, Valida-tion of deuterium incorporation against sterol balance for measurement of humancholesterol biosynthesis, J. Lipid Res. 39 (1998) 1111–1117.
[64] P.J. Jones, D.A. Schoeller, Evidence for diurnal periodicity in human cholesterolsynthesis, J. Lipid Res. 31 (1990) 667–673.
[65] R.L. Jungas, Fatty acid synthesis in adipose tissue incubated in tritiated water,Biochemistry 7 (1968) 3708–3717.
[66] S.C. Kalhan, E. Bugianesi, A.J. McCullough, R.W. Hanson, D.E. Kelley, Estimates ofhepatic glyceroneogenesis in type 2 diabetes mellitus in humans, Metabolism 57(2008) 305–312.
[67] S.C. Kalhan, S. Mahajan, E. Burkett, L. Reshef, R.W. Hanson, Glyceroneogenesisand the source of glycerol for hepatic triacylglycerol synthesis in humans, J. Biol.Chem. 276 (2001) 12928–12931.
[68] J.J. Kamphorst, J. Fan,W. Lu, E.White, J.D. Rabinowitz, Liquid chromatography-highresolution mass spectrometry analysis of fatty acid metabolism, Anal. Chem. 83(2011) 9114–9122.
[69] J. Katanik, B.J. Mccabe, D.Z. Brunengraber, V. Chandramouli, F.J. Nishiyama, V.E.Anderson, S.F. Previs, Measuring gluconeogenesis using a low dose of (H2O)-H-2:advantage of isotope fractionation during gas chromatography, Am. J. Physiol.Endocrinol. Metab. 284 (2003) E1043–E1048.
[70] J. Katz, On the determination of turnover in vivo with tracers, Am. J. Physiol. 263(1992) E417–E424.
[71] J.J. Katz, H.L. Crespi, D.M. Czajka, A.J. Finkel, Course of deuteriation and somephysiological effects of deuterium in mice, Am. J. Physiol. 203 (1962) 907–913.
[72] J.K. Kelleher, A.T. Kharroubi, T.A. Aldaghlas, I.B. Shambat, K.A. Kennedy, A.L.Holleran, T.M. Masterson, Isotopomer spectral analysis of cholesterol synthesis:applications in human hepatoma cells, Am. J. Physiol. 266 (1994) E384–E395.
[73] J.K. Kelleher, T.M. Masterson, Model equations for condensation biosynthesisusing stable isotopes and radioisotopes, Am. J. Physiol. 262 (1992) E118–E125.
[74] J.K. Kim, M.D. Michael, S.F. Previs, O.D. Peroni, F. Mauvais-Jarvis, S. Neschen, B.B.Kahn, C.R. Kahn, G.I. Shulman, Redistribution of substrates to adipose tissue pro-motes obesity in mice with selective insulin resistance in muscle, J. Clin. Invest.105 (2000) 1791–1797.
[75] A.M. Kleinfeld, J.P. Kampf, C. Lechene, Transport of 13C-oleate in adipocytesmeasuredusing multi imaging mass spectrometry, J. Am. Soc. Mass Spectrom. 15 (2004)1572–1580.
[76] M.F.F. Kohl, A balance sheet of fat absorption. I. The storage of elaidic acid by therat over a one day period, J. Biol. Chem. 126 (1938) 709–719.
[77] M.F.F. Kohl, A balance sheet of fat absorption. II. The storage of elaidic acid by therat over periods of several days, J. Biol. Chem. 126 (1938) 721–729.
[78] M.F.F. Kohl, A balance sheet of fat absorption. III. The disappearance of elaidicacid from the tissues of the rat, J. Biol. Chem. 126 (1938) 731–736.
[79] H.A. Krebs, R. Hems, M.J. Weidemann, R.N. Speake, The fate of isotopic carbonin kidney cortex synthesizing glucose from lactate, Biochem. J. 101 (1966)242–249.
[80] T. Kuwae, P.C. Schmid, H.H. Schmid, Assessment of phospholipid deacylation–reacylation cycles by a stable isotope technique, Biochem. Biophys. Res. Commun.142 (1987) 86–91.
[81] M.R. Lakshmanan, R.L. Veech, Measurement of rate of rat-liver sterol synthesisin vivo using tritiated-water, J. Biol. Chem. 252 (1977) 4667–4673.
[82] B.R. Landau, C.A. Fernandez, S.F. Previs, K. Ekberg, V. Chandramouli, J. Wahren,S.C. Kalhan, H. Brunengraber, A limitation in the use of mass isotopomer distribu-tions to measure gluconeogenesis in fasting humans, Am. J. Physiol. Endocrinol.Metab. 32 (1995) E18–E26.
[83] B.R. Landau, J. Wahren, Nonproductive exchanges: the use of isotopes goneastray, Metabolism 41 (1992) 457–459.
[84] B.R. Landau, J. Wahren, S.F. Previs, K. Ekberg, V. Chandramouli, H. Brunengraber,Glycerol production and utilization in humans: sites and quantitation, Am. J. Physiol.Endocrinol. Metab. 34 (1996) E1110–E1117.
[85] C. Lechene, F. Hillion, G. McMahon, D. Benson, A.M. Kleinfeld, J.P. Kampf, D.Distel, Y. Luyten, J. Bonventre, D. Hentschel, K.M. Park, S. Ito, M. Schwartz, G.Benichou, G. Slodzian, High-resolution quantitative imaging of mammalianand bacterial cells using stable isotope mass spectrometry, J. Biol. 5 (2006) 20.
[86] W.N. Lee, S. Bassilian, H.O. Ajie, D.A. Schoeller, J. Edmond, E.A. Bergner, L.O.Byerley, In vivo measurement of fatty acids and cholesterol synthesis usingD2O and mass isotopomer analysis, Am. J. Physiol. 266 (1994) E699–E708.
[87] C.A. Leitch, P.J. Jones, Measurement of triglyceride synthesis in humans usingdeuterium oxide and isotope ratio mass spectrometry, Biol. Mass Spectrom. 20(1991) 392–396.
[88] A.H. Lichtenstein, J.S. Cohn, D.L. Hachey, J.S. Millar, J.M. Ordovas, E.J. Schaefer,Comparison of deuterated leucine, valine, and lysine in the measurement ofhuman apolipoprotein A-I and B-100 kinetics, J. Lipid Res. 31 (1990) 1693–1701.
[89] N. Lifson, Theory of use of the turnover rates of body water for measuring energyand material balance, J. Theor. Biol. 12 (1966) 46–74.
[90] N. Lifson, G.B. Gordon, R. McClintock, Measurement of total carbon dioxide pro-duction by means of D2O18. 1955, Obes. Res. 5 (1997) 78–84.
[91] E.C. Lin, Glycerol utilization and its regulation in mammals, Annu. Rev. Biochem.46 (1977) 765–795.
[92] I.M. London, D. Rittenberg, Deuterium studies in normal man. I. The rate of syn-thesis of serum cholesterol. II. Measurement of total body water and water ab-sorption, J. Biol. Chem. 184 (1950) 687–691.
[93] F. Magkos, B. Mittendorfer, Stable isotope-labeled tracers for the investigation offatty acid and triglyceride metabolism in humans in vivo, Clin. Lipidol. 4 (2009)215–230.
[94] F. Magkos, B.W. Patterson, B. Mittendorfer, Reproducibility of stable isotope-labeledtracer measures of VLDL-triglyceride and VLDL-apolipoprotein B-100 kinetics,J. Lipid Res. 48 (2007) 1204–1211.
[95] A. Mahsut, S.P. Wang, D.G. McLaren, G. Bhat, K. Herath, P.L. Miller, B.K. Hubbard,D.G. Johns, S.F. Previs, T.P. Roddy, Headspace analyses of (2)H labeling of acetone:enabling studies of fatty acid oxidation in vivo, Anal. Biochem. 408 (2011)351–353.
[96] D.E. Matthews, K.J. Motil, D.K. Rohrbaugh, J.F. Burke, V.R. Young, D.M. Bier, Mea-surement of leucine metabolism in man from a primed, continuous infusion ofL-[1–3C]leucine, Am. J. Physiol. 238 (1980) E473–E479.
[97] D.E. Matthews, G.R. Pesola, V. Kvetan, Glycerol metabolism in humans: valida-tion of 2H- and 13C-labelled tracers, Acta Diabetol. 28 (1991) 179–184.
[98] B.J. Mccabe, I.R. Bederman, C.M. Croniger, C.A. Millward, C.J. Norment, S.F. Previs,Reproducibility of gas chromatography–mass spectrometry measurements of H-2labeling of water: application for measuring body composition in mice, Anal.Biochem. 350 (2006) 171–176.
[99] T.S. McIntosh, H.M. Davis, D.E. Matthews, A liquid chromatography-mass spec-trometry method to measure stable isotopic tracer enrichments of glycerol andglucose in human serum, Anal. Biochem. 300 (2002) 163–169.
[100] D.G. McLaren, T. He, S.P. Wang, V. Mendoza, R. Rosa, K. Gagen, G. Bhat, K. Herath,P.L. Miller, S. Stribling, A. Taggart, J. Imbriglio, J. Liu, D. Chen, S. Pinto, J.M.Balkovec, R.J. Devita, D.J. Marsh, J.M. Castro-Perez, A. Strack, D.G. Johns, S.F.Previs, B.K. Hubbard, T.P. Roddy, The use of stable-isotopically labeled oleicacid to interrogate lipid assembly in vivo: assessing pharmacological effects inpreclinical species, J. Lipid Res. 52 (2011) 1150–1161.
[101] D.G. McLaren, S.P. Wang, S.J. Stout, D. Xie, P.L. Miller, V. Mendoza, R. Rosa, J.Castro-Perez, S.F. Previs, D.G. Johns, T.P. Roddy, Tracking fatty acid kinetics indistinct lipoprotein fractions in vivo: a novel high-throughput approach forstudying dyslipidemia in rodent models, J. Lipid Res. 54 (2013) 276–281.
[102] J. Melish, N.A. Le, H. Ginsberg, D. Steinberg,W.V. Brown, Dissociation of apoproteinB and triglyceride production in very-low-density lipoproteins, Am. J. Physiol. 239(1980) E354–E362.
[103] C.M. Metallo, P.A. Gameiro, E.L. Bell, K.R. Mattaini, J. Yang, K. Hiller, C.M. Jewell,Z.R. Johnson, D.J. Irvine, L. Guarente, J.K. Kelleher, M.G. Vander Heiden, O.Iliopoulos, G. Stephanopoulos, Reductive glutamine metabolism by IDH1mediateslipogenesis under hypoxia, Nature 481 (2012) 380–384.
[104] M.D. Michael, R.N. Kulkarni, C. Postic, S.F. Previs, G.I. Shulman, M.A. Magnuson,C.R. Kahn, Loss of insulin signaling in hepatocytes leads to severe insulin resis-tance and progressive hepatic dysfunction, Mol. Cell 6 (2000) 87–97.
[105] B. Mittendorfer, O. Liem, B.W. Patterson, J.M. Miles, S. Klein, What does the mea-surement of whole-body fatty acid rate of appearance in plasma by using a fattyacid tracer really mean? Diabetes 52 (2003) 1641–1648.
[106] J.M. Muderhwa, P.C. Schmid, H.L. Brockman, Regulation of fatty acid 18O ex-change catalyzed by pancreatic carboxylester lipase. 1. Mechanism and kineticproperties, Biochemistry 31 (1992) 141–148.
[107] P. Nilsson-Ehle, P. Belfrage, B. Borgstrom, Purified human lipoprotein lipase: po-sitional specificity, Biochim. Biophys. Acta 248 (1971) 114–120.
[108] P. Nilsson-Ehle, T. Egelrud, P. Belfrage, T. Olivecrona, B. Borgstrom, Positionalspecificity of purifiedmilk lipoprotein lipase, J. Biol. Chem. 248 (1973) 6734–6737.
[109] K.H. Norwich, Sites of infusion and sampling for measurement of rates of pro-duction in steady state, Am. J. Physiol. 263 (1992) E817–E822.
[110] A.G. Ogston, Interpretation of experiments on metabolic processes, using isoto-pic tracer elements, Nature 162 (1948) 963.
[111] R.E. Ostlund Jr., A minimal model for human whole body cholesterol metabo-lism, Am. J. Physiol. 265 (1993) E513–E520.
[112] R.E. Ostlund Jr., D.E. Matthews, [13C]cholesterol as a tracer for studies of choles-terol metabolism in humans, J. Lipid Res. 34 (1993) 1825–1831.
[113] E.J. Parks, M.K. Hellerstein, Thematic review series: patient-oriented research.Recent advances in liver triacylglycerol and fatty acid metabolism using stableisotope labeling techniques, J. Lipid Res. 47 (2006) 1651–1660.
[114] B.W. Patterson, B. Mittendorfer, N. Elias, R. Satyanarayana, S. Klein, Use of stableisotopically labeled tracers to measure very low density lipoprotein–triglycerideturnover, J. Lipid Res. 43 (2002) 223–233.
[115] B.W. Patterson, R.R. Wolfe, Concentration dependence of methyl palmitate iso-tope ratios by electron impact ionization gas chromatography/mass spectrome-try, Biol. Mass Spectrom. 22 (1993) 481–486.
[116] S.K. Peng, K.J. Ho, C.B. Taylor, Biologic effects of prolonged exposure to deuteriumoxide. A behavioral,metabolic, andmorphologic study, Arch. Pathol. 94 (1972) 81–89.
[117] O. Peroni, V. Large, M. Odeon, M. Beylot, Measuring glycerol turnover, gluconeo-genesis from glycerol, and total gluconeogenesis with [2–13C] glycerol: role ofthe infusion-sampling mode, Metabolism 45 (1996) 897–901.

413S.F. Previs et al. / Biochimica et Biophysica Acta 1842 (2014) 402–413
[118] J.L. Potts, S.W. Coppack, R.M. Fisher, S.M. Humphreys, G.F. Gibbons, K.N. Frayn,Impaired postprandial clearance of triacylglycerol-rich lipoproteins in adiposetissue in obese subjects, Am. J. Physiol. 268 (1995) E588–E594.
[119] S.F. Previs, G.W. Cline, G.I. Shulman, A critical evaluation of mass isotopomer dis-tribution analysis of gluconeogenesis in vivo, Am. J. Physiol. Endocrinol. Metab.277 (1999) E154–E160.
[120] S.F. Previs, R. Fatica, V. Chandramouli, J.C. Alexander, H. Brunengraber, B.R.Landau, Quantifying rates of protein synthesis in humans by use of (H2O)-H-2:application to patients with end-stage renal disease, Am. J. Physiol. Endocrinol.Metab. 286 (2004) E665–E672.
[121] S.F. Previs, C.A. Fernandez, D.W. Yang, M.V. Soloviev, F. David, H. Brunengraber,Limitations of the mass isotopomer distribution analysis of glucose to studygluconeogenesis — substrate cycling between glycerol and triose phosphatesin liver, J. Biol. Chem. 270 (1995) 19806–19815.
[122] S.F. Previs, A. Mahsut, A. Kulick, K. Dunn, G. Andrews-Kelly, C. Johnson, G. Bhat, K.Herath, P.L. Miller, S.P. Wang, K. Azer, J. Xu, D.G. Johns, B.K. Hubbard, T.P. Roddy,Quantifying cholesterol synthesis in vivo using (2)H(2)O: enabling back-to-backstudies in the same subject, J. Lipid Res. 52 (2011) 1420–1428.
[123] S.F. Previs, D.J. Withers, J.M. Ren, M.F. White, G.I. Shulman, Contrasting effects ofIRS-1 versus IRS-2 gene disruption on carbohydrate and lipid metabolism invivo, J. Biol. Chem. 275 (2000) 38990–38994.
[124] J. Qi, W. Lang, J.G. Geisler, P. Wang, I. Petrounia, S. Mai, C. Smith, H. Askari, G.T.Struble, R. Williams, S. Bhanot, B.P. Monia, S. Bayoumy, E. Grant, G.W. Caldwell,M.J. Todd, Y. Liang, M.D. Gaul, K.T. Demarest, M.A. Connelly, The use of stableisotope-labeled glycerol and oleic acid to differentiate the hepatic functions ofDGAT1 and -2, J. Lipid Res. 53 (2012) 1106–1116.
[125] J. Qi, W. Lang, E. Giardino, G.W. Caldwell, C. Smith, L.K. Minor, A.L. Darrow, G.Willemsens, K. Dewaepenaert, P. Roevens, J.T. Linders, Y. Liang, M.A. Connelly,High-content assays for evaluating cellular and hepatic diacylglycerol acyltransferaseactivity, J. Lipid Res. 51 (2010) 3559–3567.
[126] R. Ramakrishnan, Studying apolipoprotein turnover with stable isotope tracers:correct analysis is by modeling enrichments, J. Lipid Res. 47 (2006) 2738–2753.
[127] S.V. Rieder, I.A. Rose, The mechanism of the triosephosphate isomerase reaction,J. Biol. Chem. 234 (1959) 1007–1010.
[128] M. Rodbell, R.O. Scow, Metabolism of chylomicrons and triglyceride emulsionsby perfused rat adipose tissue, Am. J. Physiol. 208 (1965) 106–114.
[129] E. Rogatsky, D. Stein, Novel, highly robust method of carbohydrate pre-purificationby two-dimensional liquid chromatography prior to liquid chromatography/massspectrometry or gas chromatography/mass spectrometry, J. Chromatogr. A 1073(2005) 11–16.
[130] S.A. Romanski, R.M. Nelson, M.D. Jensen, Meal fatty acid uptake in human adi-pose tissue: technical and experimental design issues, Am. J. Physiol. Endocrinol.Metab. 279 (2000) E447–E454.
[131] I.A. Rose, E.L. O'Connell, A.H. Mehler, Mechanism of the aldolase reaction, J. Biol.Chem. 240 (1965) 1758–1765.
[132] I.A. Rose, S.V. Rieder, Studies on the mechanism on the aldolase reaction; isotopeexchange reactions of muscle and yeast aldolase, J. Biol. Chem. 231 (1958) 315–329.
[133] S. Rossner, J. Boberg, L.A. Carlson, U. Freyschuss, B.W. Lassers, Comparison be-tween fractional turnover rate of endogenous plasma triglycerides and of intralipid(intravenous fat tolerance test) in man, Eur. J. Clin. Invest. 4 (1974) 109–114.
[134] V.T. Samuel, Z.X. Liu, X. Qu, B.D. Elder, S. Bilz, D. Befroy, A.J. Romanelli, G.I.Shulman, Mechanism of hepatic insulin resistance in non-alcoholic fatty liverdisease, J. Biol. Chem. 279 (2004) 32345–32353.
[135] P. Schambye, H.G. Wood, G. Popjak, Biological asymmetry of glycerol and forma-tion of asymmetrically labeled glucose, J. Biol. Chem. 206 (1954) 875–882.
[136] L. Schaupp, M. Ellmerer, G.A. Brunner, A. Wutte, G. Sendlhofer, Z. Trajanoski, F.Skrabal, T.R. Pieber, P. Wach, Direct access to interstitial fluid in adipose tissue inhumans by use of open-flowmicroperfusion, Am. J. Physiol. 276 (1999) E401–E408.
[137] P.C. Schmid, S.B. Johnson, H.H. Schmid, Determination of ester carbonyl 18O/16Oratios in phospholipids by gas chromatography–mass spectrometry, Chem. Phys.Lipids 46 (1988) 165–170.
[138] P.C. Schmid, S.B. Johnson, H.H. Schmid, Remodeling of rat hepatocyte phospho-lipids by selective acyl turnover, J. Biol. Chem. 266 (1991) 13690–13697.
[139] D.A. Schoeller, Energy expenditure from doubly labeled water: some fundamen-tal considerations in humans, Am. J. Clin. Nutr. 38 (1983) 999–1005.
[140] D.A. Schoeller, Recent advances from application of doubly labeled water tomeasurement of human energy expenditure, J. Nutr. 129 (1999) 1765–1768.
[141] R. Schoenheimer, D. Rittenberg, Deuterium as an indicator in the study of inter-mediary metabolism. IV. Synthesis and destruction of fatty acids in the organ-ism, J. Biol. Chem. 114 (1936) 381–396.
[142] R. Schoenheimer, D. Rittenberg, The application of isotopes to the study of inter-mediary metabolism, Science 87 (1938) 221–226.
[143] F. Stellaard, V.W. Bloks, H.G. Burgerhof, R.A. Scheltema, E.J. Murphy, H.A. Romijn,G.H. Smelt, G. Brufau, F. Kuipers, Two time-point assessment of bile acid kineticsin humans using stable isotopes, Isotopes Environ. Health Stud. 46 (2010)325–336.
[144] F. Stellaard, G. Brufau, R. Boverhof, E.Z. Jonkers, T. Boer, F. Kuipers, Developmentsin bile acid kinetic measurements using (13)C and (2)H: 10(5) times improvedsensitivity during the last 40 years, Isotopes Environ. Health Stud. 45 (2009)275–288.
[145] F. Stellaard, M. Sackmann, F. Berr, G. Paumgartner, Simultaneous determinationof pool sizes and fractional turnover rates, of deoxycholic acid, cholic acid andchenodeoxycholic acid in man by isotope dilution with 2H and 13C labels andserum sampling, Biomed. Environ. Mass Spectrom. 14 (1987) 609–611.
[146] F. Stellaard, M. Sackmann, T. Sauerbruch, G. Paumgartner, Simultaneous determina-tion of cholic acid and chenodeoxycholic acid pool sizes and fractional turnover ratesin human serum using 13C-labeled bile acids, J. Lipid Res. 25 (1984) 1313–1319.
[147] A. Strawford, F. Antelo, M. Christiansen, M.K. Hellerstein, Adipose tissue triglyc-eride turnover, de novo lipogenesis, and cell proliferation in humans measuredwith 2H2O, Am. J. Physiol. Endocrinol. Metab. 286 (2004) E577–E588.
[148] L.K. Summers, P. Arner, V. Ilic, M.L. Clark, S.M. Humphreys, K.N. Frayn, Adiposetissue metabolism in the postprandial period: microdialysis and arteriovenoustechniques compared, Am. J. Physiol. 274 (1998) E651–E655.
[149] L.K. Summers, S.C. Barnes, B.A. Fielding, C. Beysen, V. Ilic, S.M. Humphreys, K.N.Frayn, Uptake of individual fatty acids into adipose tissue in relation to theirpresence in the diet, Am. J. Clin. Nutr. 71 (2000) 1470–1477.
[150] C.J. Toews, Evidence for themetabolism of glycerol by skeletalmuscle and the pres-ence of a muscle nicotinamide–adenine dinucleotide phosphate-dependent glyc-erol dehydrogenase, Biochem. J. 98 (1966) 27C–29C.
[151] Z. Trajanoski, G.A. Brunner, L. Schaupp, M. Ellmerer, P. Wach, T.R. Pieber, P.Kotanko, F. Skrabal, Open-flow microperfusion of subcutaneous adipose tissuefor on-line continuous ex vivo measurement of glucose concentration, DiabetesCare 20 (1997) 1114–1121.
[152] S.D. Turley, M.W. Herndon, J.M. Dietschy, Reevaluation and application of thedual-isotope plasma ratio method for the measurement of intestinal cholesterolabsorption in the hamster, J. Lipid Res. 35 (1994) 328–339.
[153] S.M. Turner, E.J. Murphy, R.A. Neese, F. Antelo, T. Thomas, A. Agarwal, C. Go, M.K.Hellerstein, Measurement of TG synthesis and turnover in vivo by 2H2O incorpora-tion into the glycerol moiety and application of MIDA, Am. J. Physiol. Endocrinol.Metab. 285 (2003) E790–E803.
[154] S.M. Turner, S. Roy, H.S. Sul, R.A. Neese, E.J. Murphy, W. Samandi, D.J. Roohk, M.K.Hellerstein, Dissociation between adipose tissue fluxes and lipogenic gene expres-sion in ob/ob mice, Am. J. Physiol. Endocrinol. Metab. 292 (2007) E1101–E1109.
[155] M. Wadke, H. Brunengraber, J.M. Lowenstein, J.J. Dolhun, G.P. Arsenault, Fattyacid synthesis by liver perfused with deuterated and tritiated water, Biochemistry12 (1973) 2619–2624.
[156] B. Wang, G. Sun, D.R. Anderson, M. Jia, S. Previs, V.E. Anderson, Isotopologue dis-tributions of peptide product ions by tandem mass spectrometry: quantitationof low levels of deuterium incorporation, Anal. Biochem. 367 (2007) 40–48.
[157] D.J. Withers, J.S. Gutierrez, H. Towery, D.J. Burks, J.M. Ren, S. Previs, Y.T. Zhang, D.Bernal, S. Pons, G.I. Shulman, S. Bonner-Weir, M.F. White, Disruption of IRS-2causes type 2 diabetes in mice, Nature 391 (1998) 900–904.
[158] R.R. Wolfe, D.L. Chinkes, Isotope Tracers in Metabolic Research: Principles andPractice of Kinetic Analyses, Wiley-Liss, Hoboken, NJ, 2005.
[159] J. Xu, G. Xiao, C. Trujillo, V. Chang, L. Blanco, S.B. Joseph, S. Bassilian, M.F. Saad, P.Tontonoz, W.N. Lee, I.J. Kurland, Peroxisome proliferator-activated receptoralpha (PPARalpha) influences substrate utilization for hepatic glucose produc-tion, J. Biol. Chem. 277 (2002) 50237–50244.
[160] L. Yu, A.K. Sinha, S.F. Previs, Effect of sampling interval on the use of “doubly labeled”water for measuring CO2 production, Anal. Biochem. 337 (2005) 343–346.
[161] X.J. Zhang, N.A. Rodriguez, L. Wang, D. Tuvdendorj, Z. Wu, A. Tan, D.N. Herndon,R.R. Wolfe, Measurement of precursor enrichment for calculating intramusculartriglyceride fractional synthetic rate, J. Lipid Res. 53 (2012) 119–125.
[162] H. Zhou, W. Li, S.P. Wang, V. Mendoza, R. Rosa, J. Hubert, K. Herath, T.McLaughlin, R.J. Rohm, M.E. Lassman, K.K. Wong, D.G. Johns, S.F. Previs, B.K.Hubbard, T.P. Roddy, Quantifying apoprotein synthesis in rodents: couplingLC–MS/MS analyses with the administration of labeled water, J. Lipid Res. 53(2012) 1223–1231.
[163] D.B. Zilversmit, L.B. Hughes, Validation of a dual-isotope plasma ratio method formeasurement of cholesterol absorption in rats, J. Lipid Res. 15 (1974) 465–473.


![Biochimica et Biophysica Acta - immed.org considerations/09.07.2017 updates/Membrane... · G.L. Nicolson, M.E. Ash / Biochimica et Biophysica Acta 1859 (2017) 1704–1724 1705 [8]](https://img.pdfslide.us/doc/110x75/5c684f1e09d3f2f5638b5509/biochimica-et-biophysica-acta-immed-considerations09072017-updatesmembrane.jpg)