Embed Size (px)
Citation preview


Editor in Chief, Chemistry: Adam JaworskiMarketing Manager: Erin GardnerProject Editor: Jennifer HartEditorial Assistant: Fran FalkMarketing Assistant: Nicola HoustonManaging Editor, Chemistry and Geosciences: Gina M.
CheselkaProject Manager, Production: Shari ToronSenior Manufacturing and Operations Manager: Nick SklitsisOperations Specialist: Maura ZaldivarArt Director: Jayne ConteCover Designer: Suzanne BehnkeSenior Technical Art Specialist: Connie Long
Art Editor: Ronda WhitsonPhoto Research Manager: Elaine SoaresPhoto Researcher: Dian LoftonText Permissions Editor: Beth WollarSenior Media Producer: Angela BernhardtMedia Producer: Lauren LaynSenior Media Production Supervisor: Liz WinerMedia Production Coordinator: Shannon KongFull-Service/Composition: PreMediaGlobalFull-Service Project Management: Greg
Johnson/PreMediaGlobalCopy Editor: Kami BevingtonCover photo credit: The Protein Data Bank archive
© 2012, 2006 Pearson Education, Inc.Pearson Prentice HallPearson Education, Inc.Upper Saddle River, New Jersey 07458
All rights reserved. No part of this book may be reproduced, in any form or by any means, without permission in writing from the publisher.
Printed in the United States of America10 9 8 7 6 5 4 3 2 1
Pearson Prentice Hall™ is a trademark of Pearson Education, Inc.
ISBN-10: 0-13-604302-XISBN-13: 978-0-13-604302-7
Library of Congress Cataloging-in-Publication Data
Boyer, Rodney F.Biochemistry laboratory : modern theory and techniques / Rodney Boyer. — 2nd ed.
p. cm.Includes index.ISBN-13: 978-0-13-604302-7ISBN-10: 0-13-604302-X
1. Biochemistry–Laboratory manuals. I. Title.QD415.5.B69 2012572.078—dc22
2010036761
Disclaimer: The laboratory methods described in this book have been exhaustively tested for safety and all attempts havebeen made to select the least hazardous chemicals and procedures possible. However, the author and publisher cannot beheld liable for any injury or damage that may occur during the performance of the procedures. It is assumed that before anyexperiment is initiated, a Material Safety Data Sheet (MSDS) for each chemical used will have been studied by the instructorand students to ensure its safe handling and disposal.
Front cover: The molecular structure is that of the hexameric form of the human hormone insulin, grouped around two zincions. The protein hexamer is thought to be the form in which insulin is stored in the beta cells of the pancreas and secretedinto the blood. The structure ID is 1AI0 in the Protein Data Bank.

S e c o n d E d i t i o n
BIOCHEMISTRY LABORATORY:MODERN THEORYAND TECHNIQUES
Rodney BoyerHope College
Prentice HallBoston Columbus Indianapolis New York San Francisco Upper Saddle River
Amsterdam Cape Town Dubai London Madrid Milan Munich Paris Montréal TorontoDelhi Mexico City São Paulo Sydney Hong Kong Seoul Singapore Taipei Tokyo

To my wife, Christel
TABLE OF CONTENTS
Preface xiii
Acknowledgments xvii
About the Author xix
Chapter 1 INTRODUCTION TO THE BIOCHEMISTRYLABORATORY 1A. Safety in the Laboratory 2
Safety First 2
Material Safety Data Sheets 2
Safe Practices in the Biochemistry Laboratory 3
B. Keeping Records and Communicating Experimental Results 6
The Laboratory Notebook 6
Details of the Experimental Write-Up 7
Communicating Results from Biochemistry Research 9
C. Using Biochemical Reagents and Solutions 14
Water Purity 14
Cleaning Laboratory Glassware 15
Solutions: Concentrations and Calculations 15
Preparing and Storing Solutions 17
D. Quantitative Transfer of Liquids 18
Pipets and Pipetting 18
Automatic Pipetting Devices 21
E. Statistical Analysis of Experimental Data 23
Defining Statistical Analysis 23
The Mean, Sample Deviation, and Standard Deviation 24
Spreadsheet Statistics 28
Statistical Analysis in Practice 28Study Problems 30 • Further Reading 32
Chapter 2 USING THE COMPUTER AND INTERNET FORRESEARCH IN BIOCHEMISTRY 35A. What Is Research and How Is It Done in Biochemistry? 35
What Is Research? 35
The Scientific Method 36
B. Using Computers in Biochemistry 38
v

Accessing the Internet 39
The World Wide Web 40
C. Web Sites Useful in Biochemistry 40
Directories, Library Resources, Databases, and Tools 40
Viewing Structures of Biomolecules 43
Searching the Biochemical Literature 44
Literature Searches on the Web 45
Sequence Homology in Proteins 47
Virtual Biochemistry Laboratories 47Study Problems 48 • Further Reading 49 •Computer Glossary 50
Chapter 3 GENERAL LABORATORY PROCEDURES 53A. pH, Buffers, Electrodes, and Biosensors 53
Measurement of pH 54
Using the pH Electrode 54
Biochemical Buffers 56
Selection of a Biochemical Buffer 57
Buffer Dilutions 63
The Oxygen Electrode 64
Biosensors 66
B. Measurement of Protein Solutions 67
The Biuret and Lowry Assays 67
The Bradford Assay 69
The BCA Assay 70
The Spectrophotometric Assay 70
C. Measurement of Nucleic Acid Solutions 71
The Spectrophotometric Assay 71
Other Assays for Nucleic Acids 72
D. Techniques for Sample Preparation 73
Dialysis 73
Ultrafiltration 74
Lyophilization and Centrifugal Vacuum Concentration 77
E. Radioisotopes in Biochemistry 80
Origin and Properties of Radioactivity 80
Detection and Measurement of Radioactivity 85
Radioisotopes and Safety 90Study Problems 91 • Further Reading 92
vi Table of Contents

Chapter 4 CENTRIFUGATION TECHNIQUES IN BIOCHEMISTRY 95A. Basic Principles of Centrifugation 96
B. Instrumentation for Centrifugation 99
Low-Speed Centrifuges 99
High-Speed Centrifuges 101
Ultracentrifuges 105
C. Applications for Centrifugation 106
Preparative Techniques 106
Analytical Measurements 108
Care of Centrifuges and Rotors 112Study Problems 113 • Further Reading 114
Chapter 5 PURIFICATION AND ANALYSIS OF BIOMOLECULESBY CHROMATOGRAPHY 115A. Introduction to Chromatography 116
Partition versus Adsorption Chromatography 117
B. Planar Chromatography (Paper and Thin-LayerChromatography) 118
Preparation of the Sorbent 118
Solvent Development 119
Detection and Measurement of Components 120
Applications of Planar Chromatography 121
Advanced Planar Chromatography 121
C. Column Chromatography 122
Operation of a Chromatographic Column 123
Packing the Column 124
Loading the Column 125
Eluting the Column 125
Collecting the Eluent 126
Detection of Eluting Components 126
D. Ion-Exchange Chromatography 126
Ion-Exchange Resins 127
Selection of the Ion Exchanger 128
Choice of Buffer 130
Preparation of the Ion Exchanger 130
Using the Ion-Exchange Resin 130
Storage of Resins 131
Table of Contents vii

E. Gel-Exclusion Chromatography 132
Theory of Gel Filtration 132
Physical Characterization of Gel Chromatography 133
Chemical Properties of Gels 133
Selecting a Gel 135
Gel Preparation and Storage 136
Operation of a Gel Column 136
Applications of Gel-Exclusion Chromatography 138
F. High-Performance Liquid Chromatography (HPLC) 140
Instrumentation 142
Stationary Phases in HPLC 144
Chiral Chromatography 148
The Mobile Phase 150
Sample Preparation and Selection of HPLC OperatingConditions 150
FPLC—A Modification of HPLC 150
Perfusion Chromatography 151
G. Affinity Chromatography and Immunoadsorption 152
Chromatographic Media 153
The Immobilized Ligand 154
Attachment of Ligand to Matrix 154
Immunoadsorption 156
Experimental Procedure for Affinity Chromatography 157
H. Membrane-Based Chromatography 159Study Problems 161 • Further Reading 163
Chapter 6 CHARACTERIZATION OF PROTEINS AND NUCLEICACIDS BY ELECTROPHORESIS 165A. The Theory of Electrophoresis 166
Introduction 166
Theory and Practice 166
B. Methods of Electrophoresis 167
Polyacrylamide Gel Electrophoresis (PAGE) 167
Discontinuous Gel Electrophoresis 172
Sodium Dodecyl Sulfate-Polyacrylamide Gel Electrophoresis(SDS-PAGE) 174
Nucleic Acid Sequencing Gels 176
viii Table of Contents

Agarose Gel Electrophoresis 177
Pulsed Field Gel Electrophoresis (PFGE) 180
Isoelectric Focusing of Proteins 182
Two-Dimensional Electrophoresis (2-DE) of Proteins 184
Capillary Electrophoresis (CE) 185
Immunoelectrophoresis (IE) 186
C. Practical Aspects of Electrophoresis 188
Instrumentation 188
Reagents 189
Staining and Detecting Electrophoresis Bands 189
Protein and Nucleic Acid Blotting 192
The Western Blot 194
Analysis of Electrophoresis Results 197Study Problems 198 • Further Reading 199
Chapter 7 SPECTROSCOPIC ANALYSIS OF BIOMOLECULES 201A. Ultraviolet-Visible Absorption Spectrometry 202
Wavelength and Energy 202
Light Absorption 204
Electronic Transitions in Biomolecules 205
The Absorption Spectrum 207
The Beer-Lambert Law 207
Instrumentation 209
Applications of UV-VIS Spectroscopy 212
B. Fluorescence Spectrometry 220
Principles 220
Quantum Yield 221
Instrumentation 222
Applications of Fluorescence Spectroscopy 223
Difficulties in Fluorescence Measurements 224
C. Nuclear Magnetic Resonance Spectroscopy 225
NMR Theory 226
NMR in Biochemistry 226
NMR and Protein Structures 227
D. Mass Spectrometry 230
Ionization and Analysis of Proteins 230
MS Applications in Biochemistry 232
Table of Contents ix
E. X-Ray Crystallography 233
Methodology of X-ray Crystallography 233Study Problems 234 • Further Reading 235
Chapter 8 BIOMOLECULAR INTERACTIONS: LIGAND BINDINGAND ENZYME REACTIONS 239A. Ligand-Macromolecule Interactions (Molecular
Recognition) 239
Properties of Noncovalent Binding Interactions 240
Quantitative Characterization of Ligand Binding 242
Scatchard’s Equation 244
Cooperative Binding of Ligands 245
Experimental Measurement of Ligand-Binding Interactions 245
The Bradford Protein Assay as an Example of Ligand Binding 247
Computer Software for Analysis of LM Binding 249
B. Biological Catalysis (Enzymes) 250
Classes of Enzymes 250
Kinetic Properties of Enzymes 252
Significance of Kinetic Constants 254
Inhibition of Enzyme Activity 255
Units of Enzyme Activity 256
Specific Activity 258
Design of an Enzyme Assay 258
Kinetic versus Fixed-time Assay 259
Applications of an Enzyme Assay 260
Computer Software for Analysis of Enzyme Kinetic Data 262
Study Problems 262 • Further Reading 264
Chapter 9 MOLECULAR BIOLOGY I: STRUCTURES AND ANALYSIS OF NUCLEIC ACIDS 267A. Introduction to the Nucleic Acids 268
Chemical Components of DNA and RNA 268
DNA Structure and Function 270
RNA Structure and Function 272
B. Laboratory Methods for Investigation of DNA and RNA 275
Isolation of Chromosomal DNA 275
Isolation of Plasmid DNA 277
x Table of Contents

Characterization of DNA 279
Ethidium Bromide Binding and Fluorescence 280
Agarose Gel Electrophoresis 282
Sequencing DNA Molecules 282
Isolation and Characterization of RNA 284Study Problems 285 • Further Reading 286
Chapter 10 MOLECULAR BIOLOGY II: RECOMBINANT DNA,MOLECULAR CLONING, AND ENZYMOLOGY 289A. Recombinant DNA Biotechnology 290
Molecular Cloning 290
Steps for Preparing Recombinant DNA 292
Cloning Vectors 294
B. Important Enzymes in Molecular Biology and Biotechnology 297
The Restriction Endonucleases 297
Applications of Restriction Enzymes 298
Practical Aspects of Restriction Enzyme Use 299
The Polymerase Chain Reaction 301
C. Nucleic Acid Blotting 304Study Problems 304 • Further Reading 305
Chapter 11 PROTEIN PRODUCTION, PURIFICATION, AND CHARACTERIZATION 307A. Procedures for the Purification of Proteins 308
Composition of Proteins 308
Amount of Protein versus the Purity of Protein versusExpense 308
Basic Steps in Protein Purification 309
Preparation of the Crude Extract 311
Stabilization of Proteins in a Crude Extract 312
Separation of Proteins Based on Solubility Differences 315
Selective Techniques in Protein Purification 316
B. Production of Proteins by Expression of Foreign Genes 317
Gene Expression in Prokaryotic Organisms 317
Gene Expression in Eukaryotic Cells 320
C. Protein Characterization 322
D. Determination of Primary Structure 323
Table of Contents xi

Amino Acid Composition 323
Sequencing DNA Instead of the Protein 328Study Problems 328 • Further Reading 328
Appendix I List of Software Programs and Web Sites Useful for Each Chapter 331
Appendix II Properties of Common Acids and Bases 334
Appendix III Properties of Common Buffer Compounds 335
Appendix IV pKa Values and pHI Values of Amino Acids 337
Appendix V Molecular Weight of Some Common Proteins 338
Appendix VI Common Abbreviations Used in This Text 339
Appendix VII Units of Measurement 342
Appendix VIII Table of the Elements 344
Appendix IX Answers to Odd-Numbered Study Problems 348
Index 353
xii Table of Contents

PREFACE
TO THE STUDENT AND INSTRUCTOR
A biochemistry laboratory course, now offered at most colleges and universitiesin the world, is an essential component in the training of students for careers inbiochemistry, molecular biology, chemistry, and related molecular life sciencessuch as cell biology, neurosciences, and genetics. Both the American Society forBiochemistry and Molecular Biology (ASBMB) and the American ChemicalSociety (ACS) highly recommend that biochemistry majors complete such acourse. Biochemistry lab courses provide students the knowledge and skillsneeded for future research participation at the undergraduate and graduatelevel, and for jobs in the biotechnological and pharmaceutical industry.
The purpose of this book is to serve as a resource to enhance student learn-ing of theories, techniques, and methodologies practiced in the biochemistryteaching and research lab. The extensive availability of laboratory experimentspublished in journals and the desire of instructors to design their own projectsand teaching styles have lessened the need for laboratory manuals. Lab instruc-tors are especially eager to introduce new student-centered education methodssuch as problem-based learning (PBL), research-based learning, ProcessOriented Guided Inquiry Learning (POGIL), and other “active-learning” stylesinto their labs. However, because published experiments and homemade labmanuals usually contain only procedures, there is an increased need for a com-panion text like this one to explain the theories and principles that underpinlaboratory activities.
WHAT’S NEW IN THIS EDITION?
Student learning will be enhanced by the following additions and changes:
• New, cutting-edge topics introduced include membrane-based chromatog-raphy (Chapter 5), less toxic electrophoresis dyes (Chapter 6), nanodropspectrophotometric analysis (Chapter 7), and using gene synthesis in pro-tein expression (Chapter 11).
• An entirely rewritten section on using computers and the Internet inbiochemistry (Chapter 2).
• New content on how to conduct research in biochemistry and relatedmolecular life sciences (Chapter 2).
• An increase in the number of end-of-chapter study problems and a neworganization of answers in Appendix IX.
• Chapter openers that begin with a content listing of topics and pagenumbers, which make it easier for students to find specific topics.
• An increase in the number of study exercises within chapters so studentscan readily check their knowledge on a topic before they move on to a newtopic.
xiii

• Completely updated references including books, journal articles, and espe-cially Web sites at the end of each chapter.
• Updates to all three appendices located on the book’s Companion Website.
ORGANIZATION AND PEDAGOGICAL FEATURES OF THE BOOK
The book begins with an introduction to skills and concepts that students mustmaster including safety issues, communicating lab results, preparation of solu-tions, pipetting, statistics, buffers and pH, measurement of protein and nucleicacid solutions, radioisotopes, use of the computer and the Internet, and othergeneral laboratory procedures and principles. The historical development ofgeneral techniques is explored and followed by discussion of current applica-tions (Chapters 1–3).
Chapters 4–11 provide an introduction to the core techniques and instru-mentation that may be applied to the study of all biomolecules and biologicalprocesses: centrifugation, chromatography, electrophoresis, spectroscopy, lig-and-protein binding, methods in molecular biology, protein purification, andInternet databases. An important premise in this section is that the expansion ofour knowledge in biochemistry and related molecular life sciences is dependentupon the continued development of powerful analytical techniques, especiallyinstrumentation and computers.
The book has a Companion Website that is composed of three appendices.The first appendix is an introduction to teaching the biochemistry lab. Topics cov-ered include a discussion of different teaching methods and the concepts and skillsthat should be part of a biochemistry laboratory course. The second appendix is alisting of proven experiments and projects that have been published in biochem-istry education journals. The list gives instructors the opportunity to select labora-tory exercises that are compatible with their backgrounds and expertise and withavailable instrumentation and facilities. Special efforts were made to include proj-ects integrating traditional topics in biochemistry with the modern topics ofgenomics and proteomics. The current list has approximately 250 experimentalprojects and will be updated on a periodic basis. The third appendix is a listing ofuseful Web sites for each chapter, which will be updated as necessary.
The concepts and techniques incorporated in this book have been selectedby reviewing undergraduate laboratory curricula recommended by ASBMB, theBiochemical Society (United Kingdom), and the ACS. In addition, the author’sopinion, seasoned by 30 years of teaching and research, was an important, butperhaps biased, resource.
The book has been written with a special focus on student learning in theteaching and research laboratory. Several features are present that will assist stu-dents in mastering laboratory concepts and skills, as follows:
Use of Computers and the InternetThe computer is now being applied to all aspects of the collection, analysis, andmanagement of biochemical data; hence, computer use is integrated thoroughlyinto all sections of the book. Chapter 2 introduces students to the computer and toWeb sites that maintain directories, lab protocols, and databases for biochemistry
xiv Preface

and molecular biology. All chapters have a special section on computer applica-tions and often tables listing Web sites pertinent to topics in the chapter. In addi-tion, Appendix I contains a complete and updated list of Web sites and softwareassociated with topics in each chapter.
End-of-Chapter Study ProblemsSeveral study problems are provided for student practice at the end of eachchapter. Questions deal with both theoretical and procedural aspects of the chap-ter, and often ask students to analyze actual laboratory data. Answers to all odd-numbered questions are provided in Appendix IX.
Study Exercises Within ChaptersSeveral study exercises have been incorporated into the text of each chapter.These exercises give students the opportunity to review a topic and check theirknowledge before they move on to the next section.
Further Reading and StudyEach chapter ends with an abundant list of literature references including Websites that provide either a more detailed theoretical background or an expandedexplanation of procedures and techniques.
Preface xv

This page intentionally left blank

ACKNOWLEDGMENTS
Writing and publishing this textbook required the assistance of many talentedand dedicated individuals. My thanks go to Dan Kaveney, Publisher, for hisencouragement to initiate the second edition. Special thanks go to Jennifer Hart,Project Editor, for her meticulous management style and continuous support inorder to keep the writing on schedule. Any challenges that she met were solvedwith skill and patience. Other individuals who assisted at various stages wereGina Cheselka, Managing Editor; Shari Toron, Project Manager; Erin Gardner,Marketing Manager; Lauren Layn, Associate Media Producer; and Fran Falk,Editorial Assistant.
The preparation of Biochemistry Laboratory: Modern Theory and Techniques,second edition, was dependent on the many reviewers who, with busy researchand teaching schedules, still found time to critique drafts of the manuscript. Theknowledgeable scientists and committed educators who served as reviewers ofthe manuscript include:
John Brabson, Mills CollegeKathleen Cornely, Providence CollegeTim Elgren, Hamilton CollegeElizabeth Roberts-Kirchhoff, University of Detroit, MercyGlenn Sauer, Fairfield UniversityRobert Seiser, Roosevelt UniversityAmy Beth Waddell, Southwest Tennessee Community CollegeJames Zubricky, University of Toledo
Reviewers of the First Edition
Donald Becker, University of NebraskaJeannie Collins, University of Southern IndianaTim M. Dwyer, Towson UniversityDavid P. Goldenberg, University of UtahFrank R. Gorga, Bridgewater State CollegeMark E. Hemric, Oklahoma Baptist UniversityScott Lefler, Arizona State University EastMary E. Peek, Georgia Institute of TechnologyMargaret Rice, California Polytechnic UniversityVeronique Vouille, Smith College
I also wish to thank my wife, Christel, who patiently tolerated the lifestylechanges associated with writing a book. In addition, she completed many of thenecessary chores including searching the literature, proofreading, and photo-copying. My current desk and lamp companion is Mohrchen, a beautiful black,
xvii

golden-eyed, domestic shorthair cat who adopted us during our latest visit to thelocal humane society.
I encourage all users of this book to send comments that will assist in thepreparation of future editions.
Rodney [email protected]
xviii Acknowledgments

ABOUT THE AUTHOR
Rod Boyer served on the faculty at Hope College, Holland, Michigan, where hetaught, researched, and wrote biochemistry for 26 years. He earned his B.A. inchemistry and mathematics at Westmar College (Iowa) and his Ph.D. in physicalorganic chemistry at Colorado State University. After three years as an NIHPostdoctoral Fellow with M. J. Coon (cytochromes P-450) in the Department ofBiological Chemistry at the University of Michigan Medical School, he joined thechemistry faculty at Hope. There he directed the work of more than 75 under-graduate students in research supported by the NIH, NSF, Dreyfus Foundation,Howard Hughes Medical Institute, and the Petroleum Research Fund (ACS).With his students, he published numerous journal articles in the areas of ferritiniron storage and biochemical education. He spent a sabbatical year as anAmerican Cancer Society Scholar in the lab of Nobel laureate Tom Cech at theUniversity of Colorado, Boulder. Rod is also the author of Modern ExperimentalBiochemistry (third edition, 2000, Benjamin-Cummings) and Concepts inBiochemistry (third edition, 2006, John Wiley & Sons) and serves as an AssociateEditor for the journal Biochemistry and Molecular Biology Education (BAMBED). Heis a member of the American Society for Biochemistry and Molecular Biology(ASBMB) and a former member of its Education and Professional DevelopmentCommittee that recently designed the undergraduate biochemistry degree rec-ommended by the ASBMB. Rod now resides in Bozeman, Montana, where hecontinues to write and consult in biochemical education.
xix

This page intentionally left blank

1 INTRODUCTION TO THEBIOCHEMISTRY LABORATORY
1
Welcome to the biochemistry laboratory! You are reading this book for one of thefollowing reasons: (1) you are enrolled in a formal biochemistry lab course at a col-lege or university and you will use the book as a guide to procedures; or (2) you
have started a research project in biochemistry and desire an understanding of the theories andtechniques you will use in the lab; or (3) you have started a job in a biochemistry lab and wishto review theory and techniques. Whether you are a novice or experienced in biochemistry, Ibelieve you will find the subject matter and lab work to be exciting and dynamic. Most of theexperimental techniques and skills that you have acquired and mastered in other laboratorycourses will be of great value in your work. However, you will be introduced to many newconcepts, procedures, and instruments that you have not used in chemistry or biology labs.Your success in biochemistry lab activities will depend on your mastery of these specializedtechniques, use of equipment, and understanding of chemical/ biochemical principles.
For many students, the primary reason to enroll in a formal biochemistry lab course isto learn how to do research in the discipline. Most students have observed graduate andundergraduate students participating in research activities at their institutions, but observers
A. Safety in the Laboratory 2B. Keeping Records and Communicating Experimental Results 6C. Using Biochemical Reagents and Solutions 14D. Quantitative Transfer of Liquids 18E. Statistical Analysis of Experimental Data 23
Study Problems 30Further Reading 32
C H A P T E R

2 Chapter 1 • Introduction to the Biochemistry Laboratory
may not be entirely familiar with the step-by-step process. The questions “What isresearch?” and “How is it done in biochemistry?” will be answered in Chapter 2,Section A, p. 35. For now, we will define research simply as “hunting for the truth.”
As you proceed through this text, you will no doubt compare your activi-ties with previous laboratory experiences. In organic lab, you ran reactions,isolated and purified several hundred milligrams or a few grams of solid orliquid products, and characterized the materials by infrared spectroscopy,gas chromatography, nuclear magnetic resonance spectroscopy, mass spec-trometry, and other techniques. In biochemistry lab, you will work withmilligram or even microgram quantities, and in most cases the biomoleculeswill be extracted from biological sources and dissolved in solution, so youwill never really “see” the materials under study. But you will observe thedynamic chemical and biological changes brought about by biomolecules.The procedures and instruments introduced in the lab will be your “eyes”and will monitor the occurrence of biochemical events.
This chapter is an introduction to procedures that are of utmost importancefor the safe and successful completion of a biochemical project. It is recommendedthat you become familiar with the following sections before you begin labora-tory work.
A. SAFETY IN THE LABORATORY
Safety First
The concern for laboratory safety can never be overemphasized. Most studentswho are involved in biochemistry laboratory activities have progressed throughseveral years of college lab work without even a minor accident. This record is,indeed, something to be proud of; however, it should not lead to overconfidence.You must always be aware that chemicals used in the laboratory are potentiallytoxic, irritating, and flammable. However, such chemicals are a hazard onlywhen they are mishandled or improperly disposed of. It is my experience as alab instructor for 30 years that accidents happen least often to those who come toeach lab session mentally prepared and with a complete understanding of theexperimental procedures to be followed. Because dangerous situations candevelop unexpectedly, though, you must be familiar with general safety prac-tices, facilities, and emergency actions. When we work in the lab, we must alsohave a special concern for the safety of lab mates. Carelessness on the part of oneperson can often cause injury to others.
Material Safety Data Sheets
The procedures in this book are designed and described with an emphasis onsafety. However, no amount of planning or pretesting of procedures substitutesfor awareness and common sense on the part of the student. All chemicals usedin the procedures outlined here must be handled with care and respect. The useof chemicals in all U.S. workplaces, including academic research and teachinglabs, is regulated by the Federal Hazard Communication Standard, a document

Chapter 1 • Introduction to the Biochemistry Laboratory 3
written by the Occupational Safety and Health Administration (OSHA).1
Specifically, the OSHA standard requires all workplaces where chemicals areused to do the following: (1) develop a written hazard communication program;(2) maintain files of Material Safety Data Sheets (MSDS) on all chemicals usedin that workplace (an MSDS is a detailed description of the properties of a chem-ical substance, the potential health hazards, and the safety precautions that mustbe taken when handling it); (3) label all chemicals with information regardinghazardous properties and procedures for handling; and (4) train employees in theproper use of these chemicals. Several states have passed “right-to-know” legisla-tion that amends and expands the federal OSHA standard. If you have an interestin or concern about any chemical used in the laboratory, the MSDS may be ob-tained from your instructor or laboratory director or from the Internet (www.sigma-aldrich.com, for example). The actual form of an MSDS for a chemical mayvary, but certain specific information must be present. Figure 1.1 is a partial copyof the MSDS for glacial acetic acid, a reagent often used in biochemical research.All chemical reagent bottles in a workplace, lab, or stockroom must be labeled toidentify potential hazardous materials and to specify personal protection neces-sary for handling. One standard hazard communication system used for thispurpose is the Hazardous Materials Identification System (HMIS® III Wall Chartcontaining an HMIS® III Label in the lower left-hand corner is shown in Figure 1.2).The health, flammability, physical hazard, and personal protection codes for thechemical reagent are summarized on the bottle label for quick identification.
Safe Practices in the Biochemistry Laboratory
It is easy to overlook some of the potential hazards of working in a biochem-istry laboratory. Students often have the impression that they are working lesswith chemicals and more with natural biomolecules; therefore, there is lessneed for caution. However, this is not true; many reagents used are flammableand toxic. In addition, materials such as fragile glass (disposable pipets),sharp objects (needles, razor blades, etc.), and potentially infectious biologicalmaterials (blood, bacteria, viruses) must be used and disposed of with cau-tion. The extensive use of electrical equipment, including hot plates, stirringmotors, and high-voltage power supplies for electrophoresis, presents specialhazards.
Proper disposal of all waste chemicals, sharp objects, and infectious agentsis essential not only to maintain safe laboratory working conditions, but also toprotect the general public and your local environment. Some of the liquid chem-ical reagents and reaction mixtures from experiments are relatively safe andmay be disposed of in the laboratory drainage system without causing environ-mental damage. However, special procedures must be followed for the use anddisposal of most reagents and materials. Often this means that your instructorwill provide detailed information on proper use procedures. In some cases, proper
1 Federal Register, Vol. 48, Nov. 25, 1983, p. 53280; Vol. 50, Nov. 27, 1985, p. 48758.

4 Chapter 1 • Introduction to the Biochemistry Laboratory
Section 2—Composition/Information on IngredientSubstance Name CAS # SARA 313
64–19–7 NoC2H4O2
Section 7—Handling and StorageHandling
Storage
Section 9—Physical/Chemical PropertiesAppearance Color Form
Colorless Clear liquid
Molecular Weight: 60.05 AMU
Property Value At Temperature or Pressure
760 mmHg
20C
Acetic acid (ACGIH:OSHA), Acetic acid, glacial, Acide ace-tique (French), Acido acetico (Italian), Azijnzuur (Dutch),Essigsaeure (German), Ethanoic acid, Ethylic acid, Glacialacetic acid, Kyselina octova (Czech), Methanecarboxylicacid, Octowy kwas (Polish), Vinegar acid
Signs and Symptoms of ExposureMaterial is extremely destructive to tissue of the mucous membranes and upperrespiratory tract, eyes, and skin. Inhalation may result in spasm, inflammationand edema of the larynx and bronchi, chemical pneumonitis, and pulmonary edema.Symptoms of exposure may include burning sensation, coughing, wheezing, laryngi-tis, shortness of breath, headache, nausea, and vomiting. Ingestion or inhalationof concentrated acetic acid causes damage to tissues of the respiratory and di-gestive tracts. Symptoms include: hematemesis, bloody diarrhea, edema and/or per-foration of the esophagus and pylorus, hematuria, anuria, uremia, albuminuria,hemolysis, convulsions, bronchitis, pulmonary edema, pneumonia, cardiovascularcollapse, shock, and death. Direct contact or exposure to high concentrations ofvapor with skin or eyes can cause: erythema, blisters, tissue destruction withslow healing, skin blackening, hyperkeratosis, fissures, corneal erosion, opaci-fication, iritis, conjunctivitis, and possible blindness. To the best of ourknowledge, the chemical, physical, and toxicological properties have not beenthoroughly investigated.
N/A117–118C4CN/A11.4 mmHg2.07 g/fN/A1.06 g/cm3
pHBP/BP RangeMP/MP RangeFreezing PointVapor PressureVapor DensitySaturated Vapor Conc.SG/Density
Target Organ(s) or System(s)Teeth. Kidneys.
Section 11—Toxicological InformationRoute of Exposure
Skin ContactCauses burns.Skin AbsorptionHarmful if absorbed through skin.Eye ContactCauses burns.InhalationMay be harmful if inhaled.IngestionMay be harmful if swallowed.
Section 4—First Aid MeasuresOral ExposureIf swallowed, wash out mouth with water provided person is conscious. Call a physician immediately.Inhalation ExposureIf inhaled, remove to fresh air. If not breathing give artificial respiration. Ifbreathing is difficult, give oxygen.Dermal ExposureIn case of skin contact, flush with copious amounts of water for at least 15 min-utes. Remove contaminated clothing and shoes. Call a physician.Eye ExposureIn case of contact with eyes, flush with copious amounts of water for at least 15 minutes. Assure adequate flushing by separating the eyelids with fingers. Call a physician.
ACETIC ACIDFormulaSynonyms
SuitableKeep tightly closed. Store in a cool dry place.
User ExposureDo not breathe vapor. Do not get in eyes, on skin, on clothing. Avoid prolongedor repeated exposure.
FIGURE 1.1Partial MSDS forglacial acetic acid. MSDSinformation issubject to change.For the mostcurrent version,contact Sigma-Aldrich. Courtesyof Sigma-AldrichCorp., St. Louis,MO; www.sigma-aldrich.com.

Chapter 1 • Introduction to the Biochemistry Laboratory 5
FIGURE 1.2 HMIS® III Wall Chart containing an HMIS® III label (lower left-hand corner) for glacial acetic aciddisplaying the hazard indices for the chemical. HMIS® III is a registered trademark of the National Paint & CoatingsAssociation, Inc. (NPCA). It is used with permission and may not be further reproduced. NPCA has granted anexclusive license to produce and distribute HMIS® III materials to J. J. Keller & Associates, Inc. Those wishing to utilizethe HMIS® III system should contact J. J. Keller at 1-800-327-6868 or www.jjkeller.com.
disposal will require the collection of waste materials from each laboratory worker,and the institution will be responsible for removal. For each procedure describedin this book, appropriate handling of all reagents, materials, and equipment willbe recommended.
It is essential that all students be aware of the potential hazards of workingin a biochemistry laboratory. A set of rules is an appropriate way to communicatethe importance of practicing safe science. The general rules outlined in Figure 1.3serve as guidelines. Your institution and instructor may have their own list ofrules or may want to add guidelines for specific activities. Rules of laboratorysafety and chemical handling are not designed to impede productivity, norshould they instill a fear of chemicals or of laboratory procedures. Rather, theirpurpose is to create a healthy awareness of potential laboratory hazards, toimprove the efficiency of each student worker, and to protect the general publicand the environment from waste contamination. The list of references at the endof this chapter includes books, journal articles, manuals, and Web sites describ-ing proper and detailed safety procedures.

B. KEEPING RECORDS AND COMMUNICATING EXPERIMENTAL RESULTS
The Laboratory Notebook
The biochemistry laboratory experience is not finished when you complete theexperimental procedure and leave the laboratory. All scientists, including stu-dents, have the obligation to prepare and present written and oral reports on theresults of their experimental work. Because these reports may be read and heardby many other professional scientists, they must be completed in a clear, concise,orderly, and accurate manner. Reports are most easily prepared outside of the labusing notes taken in a laboratory notebook while the experiment is in progress.These notes usually include procedural details, preparation of all reagents andsolutions, setup of equipment, collection of data, and your thought processesand observations during the experiment. Experiments are often complex andmove rather quickly, and it would be impossible to write down your data and
6 Chapter 1 • Introduction to the Biochemistry Laboratory
Some form of eye protection is required at all times. Safety glasses with wide side
shields or goggles are recommended, but normal eyeglasses with safety lenses may
be permitted under some circumstances. Your instructor will inform you of the type of
eye protection required. A statement regarding the wearing of contact lenses in the
laboratory has been made by the American Chemical Society.1 In general, contact
lenses may be acceptable for wear in the laboratory, but the student must, of course,
also wear safety glasses with side shields or goggles like all other students. Students
who wear contacts must report to their lab instructor to determine the local rules for
the lab.
Wear appropriate clothes—comfortable, well-fitting, older clothes that cover most of
your skin. Sandals or bare feet are never allowed.
Never work alone in the laboratory.
Be familiar with the properties of all chemicals used in the laboratory. This includes their
flammability, reactivity, toxicity, and proper disposal. This information may be obtained
from your instructor, from the HMIS® III label, and from the MSDS. Always wear
disposable gloves when using potentially dangerous chemicals or infectious agents.
Be familiar with your local rules for the safe handling and disposal of all non-chemical
hazards. These include broken glass, “sharps” (needles, syringes, etc.), and
biohazards (blood, bacteria, etc.).
Be especially careful with electrical equipment like stirrers, hot plates, and power
supplies (electrophoresis, etc.). Always unplug before handling and avoid contact with
water.
If open flames like those of Bunsen burners are necessary, make sure there are no
flammable solvents in the area.
Eating, drinking, and smoking in the laboratory are strictly prohibited at all times.
Unauthorized experiments are not allowed.
Mouth suction should never be used to fill pipets or to start siphons.
Become familiar with the location and use of standard safety features in your
laboratory. All laboratories should be equipped with fire extinguishers, eyewashes,
safety showers, fume hoods, chemical-spill kits, fire blankets, first-aid supplies, and
containers for chemical disposal. Receptacles should also be available for disposal of
dangerous materials like glass, biohazards, and sharps. Any questions regarding the
use of these features should be addressed to your instructor, teaching assistant, or lab
director.
Report all chemical spills, presence of biohazards, accidents, and injuries (even minor)
to your instructor.
1.
2.
3.
4.
5.
6.
7.
8.
9.
10.
11.
12.
1American Chemical Society, Washington, DC; Committee on Chemical Safety, 1998.
FIGURE 1.3Guidelines forsafety in thebiochemistrylaboratory.

Chapter 1 • Introduction to the Biochemistry Laboratory 7
observations after you have completed the experiments and left the lab. It is alsonot a good practice to record results on scraps of paper or on paper towels thatmay easily become lost or destroyed. The lab notebook will also come in handy ifyou need to troubleshoot or repeat an experiment because of inconsistent results.
Your instructor may have his or her own rules for preparation of the labnotebook, but here are some useful guidelines:
• The notebook should be hardbound with quadrille-ruled (gridded) pages;writing should be done with pen. This provides a permanent, durablerecord and the potential for construction of tables, graphs, charts, etc.Number each page of the book.
• Save the first few pages of the book for construction of a table of contents.Keep this up-to-date by entering the name of each experiment and pagenumber.
• Use the right-hand pages only for writing your experimental notes. Theleft-hand pages may be used as scratch paper for your own personal notes,reminders, or calculations not appropriate for the main entry.
• Each entry for an experiment or project must begin with a title and date.The general outline required by many instructors for the written material isshown in Figure 1.4 and described below. Note that Parts I–IIc are labeledPrelab and should be completed before you begin the actual procedures inthe lab.
Details of the Experimental Write-Up (see Figure 1.4)
Below is an outline that may be used as a guideline to write a complete report onan experiment.
Prelab
Introduction(a) Objective or purpose(b) TheoryExperimental(a) Table of materials and reagents(b) List of equipment(c) Flowchart(d) Record of procedureData and Calculations(a) Record of all raw data including printouts(b) Method of calculation with statistical analysis(c) Present final data in tables, graphs, or figures when appropriate.Results and Discussion(a) Conclusions(b) Compare results with known values(c) Discuss the significance of the data(d) Was the original objective achieved?(e) Literature references
I.
II.
III.
IV.
FIGURE 1.4General outline for experimentalwrite-up in yournotebook.

8 Chapter 1 • Introduction to the Biochemistry Laboratory
Introduction
This section begins with a three- or four-sentence statement of the objective orpurpose of the experiment. When preparing this statement, ask yourself, “Whatare the goals of this experiment?” This statement is followed by a brief discus-sion of the theory behind the experiment. If a new technique or instrumentalmethod is introduced, give a brief description of the method. Include chemicaland biochemical reactions and structures of reagents when appropriate.
Experimental
Begin this section with a list of all reagents and materials used in the experiment.The sources of all chemicals and the concentrations of solutions should be listed.Instrumentation is listed with reference to company name and model number.A flowchart to describe the stepwise procedure for the experiment should beincluded after the list of equipment.
The write-up to this point is to be completed as a Prelab assignment. Theexperimental procedure followed is then recorded in your notebook as you pro-ceed through the activities. The details should be sufficient so that a fellowstudent could use your notebook to repeat the experiment. You should includeobservations, such as color change or gas evolution, made during the experi-ment. If you obtain a computer printout of numbers, a spectrum from a spec-trophotometer, or a photograph, these records must be saved with the notebook.
Data and Calculations
All raw data from the experiment are to be recorded directly in your notebook,not on separate sheets of paper that can easily become lost. Calculations involv-ing the data must be included for at least one series of measurements. All datanumbers should be analyzed by appropriate statistical methods using computerprograms as described in Chapter 1, Section E, p. 23.
For many experiments, the clearest presentation of data is in tabular orgraphical form. A graph may be prepared directly on the gridded pages of yournotebook, or by computer software.
Results and Discussion
This important section of your write-up answers the questions “Did you achieveyour proposed goals and objectives?” and “What is the significance of the data?”Any conclusion that you make must be supported by experimental results. It isoften possible to compare your data with known values and results from theliterature. If problems were encountered in the experiments, these should be out-lined with possible remedies for future experiments.
All library references (books, journal articles, and Web sites) that were usedto complete the experiment should be listed at the end of the write-up. It is espe-cially important to report references used for laboratory procedures. The stan-dard format to follow for a reference listing is shown at the end of this chapter inthe Further Reading section.
Everyone has his or her own writing style. Because there is always room forimprovement, it is imperative that you continually try to enhance your writing

Chapter 1 • Introduction to the Biochemistry Laboratory 9
skills. When your instructor reviews your notebook, he or she should includehelpful writing tips. References at the end of this chapter provide further instruc-tions in scientific writing. Your instructor may accept, as a final report, the exper-imental write-up as described above and in Figure 1.4. However, he or she mayrequest that you present your experimental results in one of the more formalwritten or oral modes described next.
Several electronic lab notebook (ELN) software packages are availablecommercially. For example, CERF by Resentris is an ELN designed for biology.The use of ELN’s is still somewhat controversial, so you should ask your instruc-tor if they are allowed in your lab. The primary purpose for maintaining a labnotebook, especially in academic and industrial/pharmaceutical labs, is to havea permanent and complete record for scientific and legal reasons. Lab notebooksare legal documents that are essential in patent lawsuits in order to prove authen-ticity and ownership of a discovery. Thus, it must be proven that the ELN is accu-rate, confidential, and maintained by authorized scientists, something that maybe difficult with some current computer systems.
Communicating Results from Biochemistry Research
A scientific project is not complete until its discoveries have been communicatedto colleagues around the world. The three most important methods or tools forcommunication are: the scientific paper, the oral presentation, and the poster.Although there are many differences in how to prepare for these three commonmethods of introducing new biochemical information, they all have one thing incommon—the sharing of experimental results and conclusions. The distinctrules and traditions of each of the methods will be described and compared here.
The Scientific Paper
A paper published in a biochemical journal is a formal way to report researchresults to colleagues in the international biochemical community. Before writingsuch a document, one must first determine the journal to which the article will besubmitted. There are hundreds of journals that accept manuscripts in the field ofbiochemistry (see Figure 1.5). Some have very high rank, prestige, and statusbased on the significance of research results published, reputation of authors,numbers of citations, whether or not manuscripts are peer-reviewed, and num-bers of readers. Most journals are peer-reviewed, which indicate that beforea manuscript is published, it is studied by members of the journal’s editorialboard to assure that the manuscript is scientifically significant, that it appearsto be accurate, and that it is useful and of value to readers of the journal. Somejournals accept manuscripts in all areas of biochemistry, but the manuscriptsundergo rigorous peer-review by scientists with a certain specialty in the field.Other reputable journals are more specialized and accept peer-reviewed articlesonly in certain areas of biochemistry. Perhaps the best advice is to submit themanuscript to the most prestigious journal that has a large audience interestedin his or her specialized topic. Publishing a paper in a reputable, peer-reviewedjournal offers historic permanence for one’s work, status, and exposure as ascientist; however, because the lag time between acceptance and publication of

10 Chapter 1 • Introduction to the Biochemistry Laboratory
Accounts of Chemical Research
Analytical Biochemistry
Annual Review of Biochemistry
Archives of Biochemistry and Biophysics
Biochemical and Biophysical Research Communications
Biochemical and Molecular Medicine
Biochemical Journal
Biochemistry
Biochemistry and Molecular Biology Education
Biochimica et Biophysica Acta: General Subjects; Molecular and Cell Biology;
Protein Structure and Molecular Enzymology
BioEssays
Bioorganic Chemistry
Biophysical Journal
Canadian Journal of Biochemistry
Cell
ChemBioChem
Chemistry and Biology
Current Opinion in Structural Biology
DNA Research Online
Electrophoresis
European Journal of Biochemistry
FASEB Journal
Glycobiology
Glycoconjugate Journal
Journal of Biochemistry
Journal of Biological Chemistry
Journal of Cell Biology
Journal of Cell Biology Education
Journal of Chemical Education
Journal of Lipid Research
Journal of Molecular Biology
Journal of Neurochemistry
Journal of Plant Physiology
Macromolecules
Methods: A Companion to Methods in Enzymology
Molecular and Cellular Biochemistry
Molecular and Cellular Proteomics
Nature
Nature Reviews Molecular Cell Biology
Nature Structural Biology
Nucleic Acid Research
Phytochemistry
Proceedings of the National Academy of Sciences USA
Prostaglandins, Leukotrienes and Essential Fatty Acids
Protein Science
Proteomics
RNA
Science
Scientific American
Trends in Biochemical Sciences
FIGURE 1.5Some journals that publishresearch articles inbiochemistry.Web sites for thejournals may befound using asearch engine.

Chapter 1 • Introduction to the Biochemistry Laboratory 11
a manuscript can sometimes stretch up to one year, the data reported can becomeoutdated or insignificant.
Most research journals are now available in electronic form and accessiblethrough college/university or corporate libraries. The subscription costs are usu-ally borne by the academic institutions or corporations and available to students,faculty, and research staff.
Your instructor may require that you write up the results from an experimentin the form of a journal article, so it is important to understand the conventionsused in preparing a manuscript for publication. Most biochemical journal articleshave the same basic organization: Title, Abstract, Introduction, ExperimentalMethods, Results, Discussion, and References. The specific requirements for eachof these sections vary among the many journals, so it is important to review severalarticles in different journals to get a flavor of what is expected. All scientific jour-nals publish “Instructions to Authors,” which are available on their Web site.Although your instructor will most likely expect you to follow the requirements ofa specific journal, it is instructive to study articles in the following high-rankingjournals that publish biochemistry topics: The Journal of Biological Chemistry(published by the American Society for Biochemistry and Molecular Biology),Biochemistry (published by the American Chemical Society), Science, and Nature.Use a search engine such as Google, Yahoo, etc. to find Web sites for other journals.
The Oral Presentation
The purpose and mechanics of an oral presentation are quite different frompreparing and publishing a paper. You may write a paper over a period of days,weeks, and even months, and the published work is available as a permanentrecord for readers to study and reference anytime in the future. In an oral presen-tation, you have a fleeting moment to present data and attempt to convince youraudience of the importance of your work. One advantage of the oral presentation,however, is that it provides an opportunity for more direct contact with youraudience than does a paper; thus the opportunity exists for immediate questionsand feedback.
Presentations usually range from 15 to 60 minutes. Shorter presentationscover a much smaller unit of a research project, whereas 60-minute talks (oftencalled seminars) can give a broader exposure to the research area.
Scientific presentations involve mixed media—oral and visual. The impor-tant verbal points are reinforced with the use of a visual aid such as a figure,graph, or other element. Scientific presenters today most often use PowerPoint,computer software that projects electronic slides onto a screen, although over-head transparencies are also acceptable and efficient. Whatever the type of visualaid, the slides must be carefully constructed with special concern for the totalnumber of slides and the amount of information on each. Some presenters usethe approximate ratio of one-to-two slides per minute of presentation.
The organization of a talk is similar to that of a paper—Introduction,Experimental Methods, Results, Discussion, Conclusions, Questions/Comments.If your instructor expects you to present a talk, he or she will provide specificinformation regarding length of time, range of topic, type of visual aids, multi-media, etc.

12 Chapter 1 • Introduction to the Biochemistry Laboratory
The Scientific Poster
The scientific poster is a communication method that may be considered a hybrid,as it combines elements of the oral presentation (verbal expression and visualaids) with elements of a paper (printed text and figures). The poster has becomethe primary medium by which new scientific information is exchanged at allprofessional conferences, including local, regional, national, and internationalmeetings. At meetings, posters that consist of text and figures arranged in panelson a thin piece of cardboard (average ) are set up in designated areas dur-ing specified times (usually for a day or two), and there is often an official timewhen the presenter is to be in attendance. The poster, however, may be availableto readers for long periods of time in the absence of the presenter. Some of thespecific characteristics that describe a poster include (Figure 1.6):
3¿ * 5¿
FIGURE 1.6Template for aposter inbiochemistry.Courtesy ofProfessor ColinPurrington,Department ofBiology, SwarthmoreCollege, www.swarthmore.edu/NatSci/cpurrin1/posteradvice.htm.

Chapter 1 • Introduction to the Biochemistry Laboratory 13
• usually composed of small units of a research project and most often basedon preliminary results and conclusions.
• contains many of the same organizational elements as a paper or talk—Title/Authors, Abstract, Introduction, Methods, Results, Discussion,Conclusions, References—but in a much briefer form.
• often enhanced with a brief, oral summary given by the presenter. Only themain points such as the purpose, results, conclusions, and future experimentsfor the project should be included in this concise summary. As a presenter, dur-ing your official time at the poster you will be visited by individuals or smallgroups who will spend an average of about 10–12 minutes at your poster.
• must be completely self-explanatory, as you will not always be present toanswer a reader’s questions.
• the environment is usually interactive and informal, allowing for one-on-onecontact with other researchers.
FIGURE 1.6Continued.

14 Chapter 1 • Introduction to the Biochemistry Laboratory
• poster sessions at scientific meetings are very democratic and inclusive, asthe presenters and audience may consist of all levels of scientists—tenuredresearch professors including Nobel Prize winners, as well as undergradu-ate research students.
Your instructor may request that you prepare a poster for local display atyour institution or for presentation at a regional or national meeting. Specificdetails will not be given here, as all organizations sponsoring poster sessions atmeetings publish their own rules and regulations (regarding poster size, font sizes,etc.) for preparing posters. Many colleges and universities now schedule localmeetings where students may obtain experience preparing and presenting postersabout their research results. Attend one of these local meetings or walk around thehalls of your chemistry and biology departments looking for posters made by re-search students at your institution. These may serve as very good models for yourown creation. You may also find useful information about the specific details ofposter construction by searching the Internet. Some helpful Web sites with postertemplates are listed in the Further Reading section at the end of this chapter.
C. USING BIOCHEMICAL REAGENTS AND SOLUTIONS
Water Purity
Water is the most common and widely-used substance in the biochemistry labora-tory. Applications of water usage include: (1) solvent for preparing most buffer andreagent solutions; (2) column chromatography; (3) high-performance liquid chro-matography; (4) tissue culture; and (5) washing glassware. Both the quality andquantity of water required must be considered for each lab application. Ordinarytap water is relatively abundant, but its quality is very low. It contains a variety ofimpurities including particulate matter (sand, silt, etc.); dissolved organics, inorgan-ics, and gases; and microorganisms (bacteria, viruses, protozoa, and algae). Inaddition, the natural degradation of microorganisms leads to the presence of by-products called pyrogens. Tap water should never be used for the preparation ofreagent solutions or for any sensitive procedures. For most laboratory procedures, itis recommended that some form of purified water be used. The purity of water isusually measured in terms of resistivity (the ability of a liquid to restrict the flow ofan electric current). Units for resistivity are Megohms � cm with a rela-tive scale of to (the highest theoretical purity).
There are five basic water purification technologies—distillation, ion-exchange, activated carbon adsorption, reverse osmosis, and membrane filtration.Most academic and industrial research laboratories are equipped with “in-house”purified water, which typically is produced by a combination of the above purify-ing processes and piped throughout all the labs in a building. The water qualitynecessary will depend on the solutions to be prepared and on the biochemicalprocedures to be investigated. For most procedures carried out in the biochem-istry lab, water purified by ion-exchange, reverse osmosis, or distillation isusually acceptable. Of these three processes, distillation is the slowest, least energy-efficient, least pure (best is ), and most high-maintenance—especiallyin areas with hard water (needs regular de-scaling). Distilled water must also bestored to prevent contamination by microbes. For special procedures such as
1.0 MÆ.cm
18.2 MÆ.cm1.0 MÆ.cm(MÆ.cm)

Chapter 1 • Introduction to the Biochemistry Laboratory 15
buffer standardization, liquid chromatography, and tissue culture, ultra-purewater, which is usually bottled and available commercially, should be used. Waterthat is purified only by ion-exchange will be low in metal-ion concentration, butmay contain certain organics that are washed from the ion-exchange resin. Thesecontaminants will increase the UV-absorbance properties of water. If sensitiveUV-spectroscopic measurements are to be made, distilled water (especially glass-distilled) is better than de-ionized. If large volumes of high-purity water arerequired reverse osmosis should be the choice.
Cleaning Laboratory Glassware
The results of your experimental work will depend, to a great extent, on the clean-liness of your equipment, especially glassware used for preparing and transferringsolutions. There are at least two important reasons for this: (1) many of the chemi-cals and biochemicals will be used in milligram, microgram, or even nanogramamounts. Any contamination, whether on the inner walls of a beaker, in a pipet, orin a glass cuvette, could be a significant percentage of the total experimentalsample; (2) many biochemicals and biochemical processes are sensitive to one ormore of the following common contaminants: metal ions, detergents, and organicresidues. In fact, the objective of many experiments is to investigate the effect of ametal ion, organic molecule, or other chemical agent on a biochemical process.Contaminated glassware will virtually ensure failure in these activities.
The preferred method for cleaning glassware is to begin with hot tap water.Rinse the glassware at least 10 times with this; then rinse 4–6 times with distilledor de-ionized water. Occasionally it is necessary to use a detergent for cleaning.Use a dilute detergent solution (0.5% in water) followed by 5–10 water rinseswith distilled or de-ionized water.
Dry equipment is required for most processes carried out in the biochem-istry laboratory. When you needed dry glassware in the organic laboratory, youprobably rinsed the glassware with acetone, which rapidly evaporated, leaving adry surface. Unfortunately, this technique coats the surface with an organicresidue consisting of nonvolatile contaminants found in the acetone. Because thisresidue could interfere with your experiments, it is best to refrain from acetonewashing. Glassware and plasticware should be rinsed well with purified waterand dried in an oven designated for glassware, not one used for drying chemicals.
Never clean cuvettes or any optically polished glassware with ethanolicKOH or other strong base, as this will cause etching. All glass cuvettes should becleaned carefully with hot tap water or 0.5% detergent solution, in a sonicatorbath or in a cuvette washer, followed by thorough rinsing with purified water.
Solutions: Concentrations and Calculations
The concentrations for solutions used in the biochemistry laboratory may beexpressed in several different units. The most common units are:
• Molarity (M): concentration based on the number of moles of solute perliter of solution. A 1 M solution of the amino acid alanine contains 1 mole, or 89.1 g, of alanine in a solution volume of 1 liter. Inbiochemistry, it is more common to use concentration ranges that are
(MW = 89.1)
(18.2 MÆ.cm),

16 Chapter 1 • Introduction to the Biochemistry Laboratory
millimolar micromolar or nanomo-lar A 1 mM solution of alanine contains 0.089 g, or 89 mg
of alanine in a solution volume of 1 liter. How many grams ofalanine are present in 100 mL of the 1 mM alanine solution? (Ans: 0.0089 g).How many milligrams of alanine are present in 100 mL? (Ans: 8.9 mg).
• Percent by weight (% wt/wt): concentration based on the number of gramsof solute per 100 g of solution. A 5% wt/wt solution of alanine contains 5 gof alanine in 100 g of solution. How many grams of alanine are present in10 g of this solution? (Ans: 0.5 g).
(89.1 * 0.001),(nM, 1 * 10-9M).
(mM, 1 * 10-6M),(mM, 1 * 10-3M),
STUDY EXERCISE 1.1 Preparation of Molar Solutions
a. Many solutions you use will be based on molarity. For practice, assume you require 1liter of solution that is 0.1 M (100 mM) glucose:
To prepare a 0.1 M glucose solution, weigh 18.02 g of glucose and transfer to a 1-liter volumetric flask. Add about 700–800 mL of purified water and swirl to dis-solve. Then add water so that the bottom of the meniscus is at the etched line on theflask. Stopper and mix well. The flask must be labeled with solution contents (0.1 Mglucose), date prepared, and name of preparer.
b. Assume that you need only 250 mL of 0.10 M glucose. Explain how you would pre-pare the solution. Emphasize any changes from Part (a).
0.1 mole of glucose = 18.02 g
1 mole of glucose = 180.2 g
MW of glucose = 180.2
STUDY EXERCISE 1.2 Concentration Unit Conversions
It is often necessary in your biochemistry lab work to convert one concentration unit toanother. For example, you may need to know the concentration of the 0.1 M glucosesolution (Study Exercise 1.1) in concentration terms of mg/mL. Here are some basiccalculations for practice.
a. Convert the concentration units of 0.1 M glucose to the units of mg of glucose in 1mL (mg/mL).According to the procedure described in Study Exercise 1.1(a), the 1000-mL solution ofglucose contains 18.02 g of glucose, or is 18.02 g/1000 mL. This is equivalent to 1.80g/100 mL or 0.018 g/mL. Therefore, the 0.1 M glucose solution concentration is equiv-alent to about 18 mg/mL.
b. Convert the concentration units of 1 M alanine to the units of g/100 mL.c. Convert the concentration units of 1 M alanine to the units of % wt/vol.d. Calculate the concentration of a 0.1 M glucose solution to the units of % wt/vol.e. Calculate the molar concentration of an ethanol solution that was prepared by
adding 10 mL of 100% ethanol to a 100-mL volumetric flask followed by addingwater to the line. The density of ethanol is 0.789.
Chapter 1 • Introduction to the Biochemistry Laboratory 17
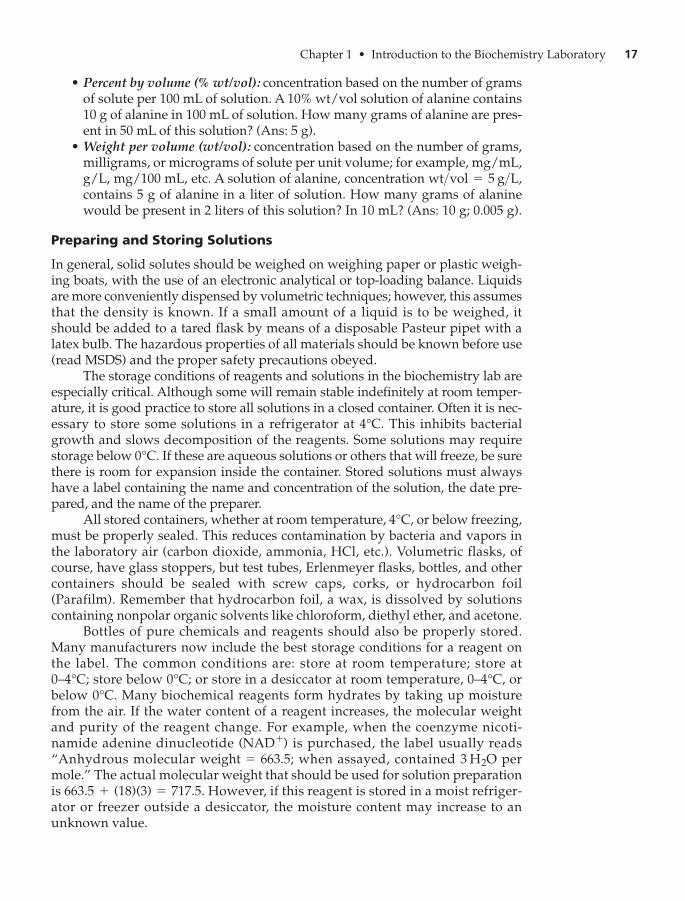
• Percent by volume (% wt/vol): concentration based on the number of gramsof solute per 100 mL of solution. A 10% wt/vol solution of alanine contains10 g of alanine in 100 mL of solution. How many grams of alanine are pres-ent in 50 mL of this solution? (Ans: 5 g).
• Weight per volume (wt/vol): concentration based on the number of grams,milligrams, or micrograms of solute per unit volume; for example, mg/mL,g/L, mg/100 mL, etc. A solution of alanine, concentration contains 5 g of alanine in a liter of solution. How many grams of alaninewould be present in 2 liters of this solution? In 10 mL? (Ans: 10 g; 0.005 g).
Preparing and Storing Solutions
In general, solid solutes should be weighed on weighing paper or plastic weigh-ing boats, with the use of an electronic analytical or top-loading balance. Liquidsare more conveniently dispensed by volumetric techniques; however, this assumesthat the density is known. If a small amount of a liquid is to be weighed, itshould be added to a tared flask by means of a disposable Pasteur pipet with alatex bulb. The hazardous properties of all materials should be known before use(read MSDS) and the proper safety precautions obeyed.
The storage conditions of reagents and solutions in the biochemistry lab areespecially critical. Although some will remain stable indefinitely at room temper-ature, it is good practice to store all solutions in a closed container. Often it is nec-essary to store some solutions in a refrigerator at This inhibits bacterialgrowth and slows decomposition of the reagents. Some solutions may requirestorage below If these are aqueous solutions or others that will freeze, be surethere is room for expansion inside the container. Stored solutions must alwayshave a label containing the name and concentration of the solution, the date pre-pared, and the name of the preparer.
All stored containers, whether at room temperature, or below freezing,must be properly sealed. This reduces contamination by bacteria and vapors inthe laboratory air (carbon dioxide, ammonia, HCl, etc.). Volumetric flasks, ofcourse, have glass stoppers, but test tubes, Erlenmeyer flasks, bottles, and othercontainers should be sealed with screw caps, corks, or hydrocarbon foil(Parafilm). Remember that hydrocarbon foil, a wax, is dissolved by solutionscontaining nonpolar organic solvents like chloroform, diethyl ether, and acetone.
Bottles of pure chemicals and reagents should also be properly stored.Many manufacturers now include the best storage conditions for a reagent onthe label. The common conditions are: store at room temperature; store at
store below or store in a desiccator at room temperature, orbelow Many biochemical reagents form hydrates by taking up moisturefrom the air. If the water content of a reagent increases, the molecular weightand purity of the reagent change. For example, when the coenzyme nicoti-namide adenine dinucleotide is purchased, the label usually reads“Anhydrous molecular when assayed, contained permole.” The actual molecular weight that should be used for solution preparationis However, if this reagent is stored in a moist refriger-ator or freezer outside a desiccator, the moisture content may increase to anunknown value.
663.5 + (18)(3) = 717.5.
3 H2Oweight = 663.5;(NAD+)
0°C.0–4°C,0°C;0–4°C;
4°C,
0°C.
4°C.
wt>vol = 5 g>L,

18 Chapter 1 • Introduction to the Biochemistry Laboratory
D. QUANTITATIVE TRANSFER OF LIQUIDS
Practical biochemistry is highly reliant on analytical methods. Many analyticaltechniques must be mastered, but few are as important as the quantitative trans-fer of solutions. Some type of pipet will almost always be used in liquid transfer.Because students may not be familiar with the many types of pipets and theproper techniques in pipetting, this instruction is included here.
Pipets and Pipetting
Pipet Fillers
Figure 1.7 illustrates the various types of pipets and fillers. The use of any pipetrequires some means of drawing reagent into the pipet. Liquids should never bedrawn into a pipet by mouth suction on the end of the pipet! Small latex bulbsare available for use with disposable pipets (see Figure 1.7A). For volumetric andgraduated pipets, two types of bulbs are available. One type (see Figure 1.7B)features a special conical fitting that accommodates common sizes of pipets. Touse these, first place the pipet tip below the surface of the liquid. Squeeze thebulb with the left hand (if you are a right-handed pipettor) and then hold it tightlyto the end of the pipet. Slowly release the pressure on the bulb to allow liquid torise to 2 or 3 cm above the top graduated mark. Then, remove the bulb and
A
B
C
D
E
F
G
H
FIGURE 1.7Examples of pipetsand pipet fillers.Courtesy ofSargent-Welch,VWR International;www.vwr.comA Latex bulb, B Pipet filler, C Mechanicalpipet filler, D Pipettor pump, E Pasteur pipet, F Volumetric pipet,G Mohr pipet, H Serological pipet.

Chapter 1 • Introduction to the Biochemistry Laboratory 19
quickly grasp the pipet with your index finger over the top end of the pipet. Thelevel of solution in the pipet will fall slightly, but should not fall below the topgraduated mark. If it does fall too low, use the bulb to refill.
Safety Pipet Fillers
Mechanical pipet fillers (made of silicone and sometimes called safety pipetfillers, propipets, or pi-fillers) are more convenient than latex bulbs. As shown inFigure 1.7C,D, these fillers are equipped with a system of hand-operated valvesand can be used for the complete transfer of a liquid. The use of a safety pipetfiller is outlined in Figure 1.8. Never allow any solvent or solution to enter thepipet bulb! To avoid this, two things must be kept in mind:
1. Always maintain careful control while using valve S to fill the pipet.2. Never use valve S unless the pipet tip is below the surface of the liquid. If
the tip moves above the surface of the liquid, air will be sucked into thepipet and solution will be flushed into the bulb.
Disposable Pasteur Pipets
Often it is necessary to perform a semi-quantitative transfer of a small volume(1–10 mL) of liquid from one vessel to another. Because pouring is not efficient, aPasteur pipet with a small latex bulb may be used (see Figure 1.7A, E). Pasteurpipets are available in two lengths (15 and 23 cm) and hold about 2 mL of solu-tion. These are especially convenient for the transfer of nongraduated amountsto and from test tubes. Typical recovery while using a Pasteur pipet is 90 to 95%.If dilution is not a problem, rinsing the original vessel with a solvent willincrease the transfer yield. Used disposable pipets should be discarded in specialcontainers for broken glass.
Calibrated Pipets
Although most quantitative transfers are now done with automatic pipettingdevices, which are described later in the chapter, instructions will be given forthe use of all types of pipets. If a quantitative transfer of a specific and accuratevolume of liquid is required, some form of calibrated pipet must be used.
• Volumetric pipets (see Figure 1.7F) are used for the delivery of liquidsrequired in whole-milliliter amounts (1, 2, 5, 10, 15, 20, 25, 50, and 100 mL).To use these pipets, draw liquid with a latex bulb or mechanical pipet fillerto a level 2–3 cm above the fill line. Release liquid from the pipet until thebottom of the meniscus is directly on the fill line. Touch the tip of the pipetto the inside of the glass wall of the container from which it was filled.Transfer the pipet to the inside of the second container and release the liq-uid. Hold the pipet vertically, allow the solution to drain until the flowstops, and then wait an additional 5–10 seconds. Touch the tip of the pipetto the inside of the container to release the last drop from the outside of thetip. Remove the pipet from the container. Some liquid may still remain inthe tip. Most volumetric pipets are calibrated as “TD” (to deliver), which

20 Chapter 1 • Introduction to the Biochemistry Laboratory
means the intended volume is transferred without final blow-out; that is, thepipet delivers the correct volume.
Fractional volumes of liquid are transferred with graduated pipets, whichare available in two types:
• Mohr pipets (see Figure 1.7G) are available in long- or short-tip styles.Long-tip pipets are especially attractive for transfer to and from vessels
1. Using thumb and forefinger,
press on valve A and squeeze bulb with other fingers to
produce a vacuum for aspiration.
Release valve A, leaving bulb compressed.
2. Insert pipet into liquid. Press on
valve S. Suction draws liquid to desired
level.
3. Press on valve E to expel liquid.
4. To deliver the last drop, maintain
pressure on valve E, cover E inlet
with middle finger, and squeeze the small bulb.
FIGURE 1.8How to use a safetypipet filler.Courtesy ofSargent-Welch,VWR International.

Chapter 1 • Introduction to the Biochemistry Laboratory 21
with small openings. Virtually all Mohr pipets are TD, and they are availablein many sizes (0.1 to 10 mL). The marked subdivisions are usually 0.01 or0.1 mL, and the markings end a few centimeters from the tip. Selection ofthe proper size is especially important. For instance, do not try to transfer0.2 mL with a 5- or 10-mL pipet. Use the smallest pipet that is practical. Theuse of a Mohr pipet is similar to that of a volumetric pipet. Draw the liquidinto the pipet with a pipet filler to a level about 2 cm above the 0 mark.Lower the liquid level to the 0 mark. Remove the last drop from the tip bytouching it to the inside of the glass container. Transfer the pipet to thereceiving container and release the desired amount of solution. The solu-tion should not be allowed to move below the last graduated mark on thepipet. Touch off the last drop.
• Serological pipets (see Figure 1.7H) are similar to Mohr pipets, except thatthey are graduated downward to the very tip and are designed for blow-out. Their use is identical to that of a Mohr pipet except that the last bit ofsolution remaining in the tip must be forced out into the receiving containerwith a rubber bulb. This final blow-out should be done after 15–20 secondsof draining.
Cleaning and Drying Pipets
Special procedures are required for cleaning glass pipets. Immediately after use,every pipet should be placed, tip up, in a vertical cylinder containing warm tapwater or a dilute detergent solution (less than 0.5%). The pipet must be completelycovered with solution. This ensures that any reagent remaining in the pipet isforced out through the tip. If reagent solutions are allowed to dry inside a pipet,the tips can easily become clogged and are very difficult to open. After severalpipets have accumulated in the water or detergent solution, the pipets should betransferred to a pipet rinser. Pipet rinsers continually cycle fresh water throughthe pipets. Immediately after detergent wash, tap water may be used to rinse thepipets, but distilled water should be used for the final rinse. Pipets may then bedried in an oven.
Automatic Pipetting Devices
For most quantitative transfers, including many repeated small-volume trans-fers, a mechanical microliter pipettor (i.e., Eppendorf type, Pipetman) is ideal.This allows accurate, precise, and rapid dispensing of fixed volumes from 1 to10,000 (0.001 to 10 mL). The pipet’s push-button system can be operated withone hand, and it is fitted with detachable polypropylene tips (see Figure 1.9). Theadvantage of polypropylene tips is that the amount of reagent film remaining inthe pipet after delivery is much less than for glass tips. Mechanical pipettors areavailable in many different sizes. Newer models offer continuous volume adjust-ment, so a single model can be used for delivery of specific volumes within a cer-tain range. Multichannel pipettors are available, which fill several containers orwells at once (see Figure 1.10).
mL

22 Chapter 1 • Introduction to the Biochemistry Laboratory
Pipetman P–200 Operating Pipetman
FIGURE 1.9 How to use an adjustable pipetting device. Set the desired volume with thedigital micrometer or plunger button. Attach a new disposable tip to the shaft of the pipet.Press tip on firmly with a slight twisting motion. Depress the plunger to the first positive stop,immerse the disposable tip into the sample liquid to a depth of 2–4 mm, and allow thepushbutton to return slowly to the up position and wait 1–2 seconds. To dispense sample,place the tip end against the side wall of the receiving vessel and depress the plunger slowlyto the first stop. Wait 2–3 seconds, and then depress the plunger to the second stop to achievefinal blow-out. Withdraw the device from the vessel carefully with the tip sliding along theinside wall of the vessel. Allow the plunger to return to the up position. Discard the tip bydepressing the tip ejector button. Photos courtesy of Rainin Instrument Company, Inc.,Woburn, MA. Pipetman is a registered trademark of Gilson Medical Electronics. Exclusivelicense to Rainin Instrument Company, Inc., www.rainin.com.
To use the pipettor, choose the proper size and place a polypropylenepipet tip firmly onto the cone, as shown in Figure 1.9. Tips for pipets are avail-able in several sizes, for 1–20, 20–250, 200–1000, 1000–5000, and capacities. Details of the operation of an adjustable pipet are shown inFigure 1.9.
For rapid and accurate transfer of volumes greater than 5 mL, automaticrepetitive dispensers are commercially available. These are particularly usefulfor the transfer of corrosive materials. The dispensers, which are availablein several sizes, are simple to use. The volume of liquid to be dispensed ismechanically set; the syringe plunger is lifted for filling and pressed down-ward for dispensing. Hold the receiving container under the spout whiledepressing the plunger. Touch off the last drop on the inside wall of the receiv-ing container.
10,000-mL

Chapter 1 • Introduction to the Biochemistry Laboratory 23
FIGURE 1.10 Amultichannelpipettor. Photocourtesy of RaininInstrument, LLC.,Oakland, CA. Pipet-Lite is a registeredtrademark ofRainin InstrumentCompany. www.rainin.com.
E. STATISTICAL ANALYSIS OF EXPERIMENTAL DATA
The purpose of most biochemistry laboratory exercises is to observe and meas-ure characteristics of a biomolecule or a biological process. The characteristic isoften quantitative—a single number or a group of numbers. These measuredquantities may be the molecular weight of a protein, the pH of a buffer solution,the absorbance of a colored solution, the rate of an enzyme-catalyzed reaction,the concentration of a protein in solution, or the radioactivity associated with amolecule. If you measure a quantitative characteristic many times under identi-cal conditions, a slightly different result will most likely be obtained each time.
For example, if a radioactive sample is counted twice under identical exper-imental and instrumental conditions, the second measurement immediately fol-lowing the first, the probability is very low that the numbers of counts will beidentical. If the absorbance of a solution is determined several times at a specificwavelength, the value of each measurement will surely vary from the others. Ifan assay for cholesterol is performed several times on a blood serum samplefrom the same individual, the values will probably be close, but not all will bethe same (see Study Problem 1.13). Which measurements, if any, are correct?Before this question can be answered, you must understand the source and treat-ment of numerical variations in experimental measurements.
Defining Statistical Analysis
An error in an experimental measurement is defined as a deviation of anobserved value from the true value. There are two types of errors, determinateand indeterminate. Determinate errors are those that can be controlled by the

24 Chapter 1 • Introduction to the Biochemistry Laboratory
experimenter and are associated with malfunctioning equipment, improperlydesigned experiments, and variations in experimental conditions. These aresometimes called human errors because they can be corrected or at least partiallyalleviated by careful design and performance of the experiment. Indeterminateerrors are those that are random and cannot be controlled by the experimenter.Specific examples of indeterminate errors are variations in radioactivecounting and small differences in the successive measurements of glucose in aserum sample.
Two statistical terms involving error analysis that are often used and mis-used are accuracy and precision. Precision refers to the extent of agreementamong repeated measurements of an experimental value. Accuracy is defined asthe difference between the experimental value and the true value for the quantity.Because the true value is seldom known, accuracy is better defined as the differ-ence between the experimental value and the accepted true value. Several exper-imental measurements may be precise (that is, in close agreement with eachother) without being accurate.
If an infinite number of identical, quantitative measurements could bemade on a biosystem, this series of numerical values would constitute astatistical population. The average of all of these numbers would be the truevalue of the measurement. It is obviously not possible to achieve this in practice.The alternative is to obtain a relatively small sample of data, which is a subset ofthe infinite population data. The significance and precision of these data are thendetermined by statistical analysis.
Most quantitative biological measurements can be made in duplicate,triplicate, or even quadruplicate, but it would be impractical and probably awaste of time and materials to make numerous determinations of the samemeasurement. Rather, when you perform an experimental measurement in thelaboratory, you will collect a small sample of data from the population of infi-nite values for that measurement. To illustrate, imagine that an infinite numberof experimental measurements of the pH of a buffer solution are made, and theresults are written on slips of paper and placed in a container. It is not feasibleto calculate an average value of the pH from all of these numbers, but it ispossible to draw five slips of paper, record these numbers, and calculate anaverage pH. By doing this, you have collected a sample of data. By proper sta-tistical manipulation of this small sample, it is possible to determine whether itis representative of the total population and the amount of confidence youshould have in these numbers.
The Mean, Sample Deviation, and Standard Deviation
Radioactive decay with emission of particles is a random process. It is impossi-ble to predict with certainty when a radioactive event will occur. Therefore, a seriesof measurements made on a radioactive sample will result in a series of differ-ent count rates, but they will be centered around an average or mean value ofcounts per minute. Table 1.1 contains such a series of count rates obtained witha scintillation counter on a single radioactive sample. A similar table couldbe prepared for other biochemical measurements, including the rate of an

Chapter 1 • Introduction to the Biochemistry Laboratory 25
TABLE 1.1 The Observed Counts and Sample Deviation from a TypicalRadioactive Sample
Counts per Minute Sample Deviation xi - x
1243 +21
1250 +28
1201 -21
1226 +4
1220 -2
1195 -27
1206 -16
1239 +17
1220 -2
1219 -3
Mean = 1222
enzyme-catalyzed reaction or the protein concentration of a solution as deter-mined by the Bradford method. The arithmetic average, or mean, of the num-bers is calculated by totaling all the experimental values observed for a sample(the counting rates, the velocity of the reaction, or protein concentration) and di-viding the total by the number of times the measurement was made. The meanis defined by Equation 1.1.
>> (Eq. 1.1)
where
average or meanvalue for an individual measurementtotal number of experimental determinations
of all the values
The mean counting rate for the data in Table 1.1 is 1222. If the same radioactivesample were again counted for a series of ten observations, that series of countswould most likely be different from those listed in the table, and a different meanwould be obtained. If we were able to make an infinite number of counts on theradioactive sample, then a true mean could be calculated. The true mean wouldbe the actual amount of radioactivity in the sample. Although it would be desir-able, it is not possible experimentally to measure the true mean. Therefore, it isnecessary to use the average of the counts as an approximation of the true mean
a = sumn = thexi = thex = arithmetic
x =an
xi
n

26 Chapter 1 • Introduction to the Biochemistry Laboratory
Fre
quency o
f
occurr
ence o
f a m
easure
ment
68.3%
95.5%
–2s +2s–s +sx–
FIGURE 1.11 Thenormal distributioncurve.
and to use statistical analysis to evaluate the precision of the measurements (thatis, to assess the agreement among the repeated measurements).
Because it is not usually practical to observe and record a measurementmany times as in Table 1.1, what is needed is a way to determine the reliability ofan observed measurement. This may be stated in the form of a question. Howclose is the result to the true value? One approach to this analysis is to calculatethe sample deviation, which is defined as the difference between the value foran observation and the mean value, (Equation 1.2). The sample deviations arealso listed for each count in Table 1.1.
>> (Eq. 1.2)
A more useful statistical term for error analysis is standard deviation, ameasure of the spread of the observed values. Standard deviation, s, for a sampleof data consisting of n observations may be estimated by Equation 1.3.
>> (Eq. 1.3)
It is a useful indicator of the probable error of a measurement. Standarddeviation is often transformed to standard deviation of the mean or standarderror. This is defined by Equation 1.4, where n is the number ofmeasurements.
>> (Eq. 1.4)
It should be clear from this equation that as the number of experimentalobservations becomes larger, becomes smaller, or the precision of a measure-ment is improved.
Standard deviation may also be illustrated in graphical form (see Figure1.11). The shape of the curve in Figure 1.11 is closely approximated by theGaussian distribution or normal distribution curve. This mathematical
sm
sm =s
1n
s = Ba (xi - x)2
n - 1
Sample deviation = xi - x
x

Chapter 1 • Introduction to the Biochemistry Laboratory 27
treatment is based on the fact that a plot of relative frequency of a given eventyields a dispersion of values centered about the mean, The value of ismeasured at the maximum height of the curve. The normal distributioncurve shown in Figure 1.11 defines the spread or dispersion of the data. Theprobability that an observation will fall under the curve is unity, or 100%. Byusing an equation derived by Gauss, it can be calculated that for a single set ofsample data, 68.3% of the observed values will occur within the interval 95.5% of the observed values within and 99.7% of the observed valueswithin Stated in other terms, there is a 68.3% chance that a singleobservation will be in the interval
For many experiments, a single measurement is made, so a mean value, is not known. In these cases, error is expressed in terms of s, but is defined as thepercentage proportional error, in Equation 1.5.
>> (Eq. 1.5)
The parameter k is a proportional constant between and the standard devia-tion. The percent proportional error may be defined within several probabilityranges. Standard error refers to a confidence level of 68.3%; that is, there is a68.3% chance that a single measurement will not exceed the For standarderror, Ninety-five hundredths error means there is a 95% chancethat a single measurement will not exceed the The constant k thenbecomes 1.45.
The previous discussion of standard deviation and related statisticalanalysis placed emphasis on estimating the reliability or precision of experi-mentally observed values. However, standard deviation does not give specif-ic information about how close an experimental mean is to the true mean.Statistical analysis may be used to estimate, within a given probability, arange within which the true value might fall. The range or confidence inter-val is defined by the experimental mean and the standard deviation. Thissimple statistical operation provides the means to determine quantitativelyhow close the experimentally determined mean is to the true mean.Confidence limits ( and ) are created for the sample mean as shown inEquations 1.6 and 1.7.
>> (Eq. 1.6)
>> (Eq. 1.7)
where
statistical parameter that defines a distribution between a samplemean and a true mean
The parameter t is calculated by integrating the distribution between percentconfidence limits. Values of t are tabulated for various confidence limits (Table1.2). Each column in the table refers to a desired confidence level (0.05 for 95%,0.02 for 98%, and 0.01 for 99% confidence). The table also includes the termdegrees of freedom, which is represented by the number of experimentaln - 1,
t = a
L2 = x - (t)(sm)L1 = x + (t)(sm)
L2L1
%Ex.k = 0.6745.
%Ex.
Ex
%Ex =100k1n
%Ex,
x,x ; s.
x ; 3s.x ; 2s,
x ; s,
xx.
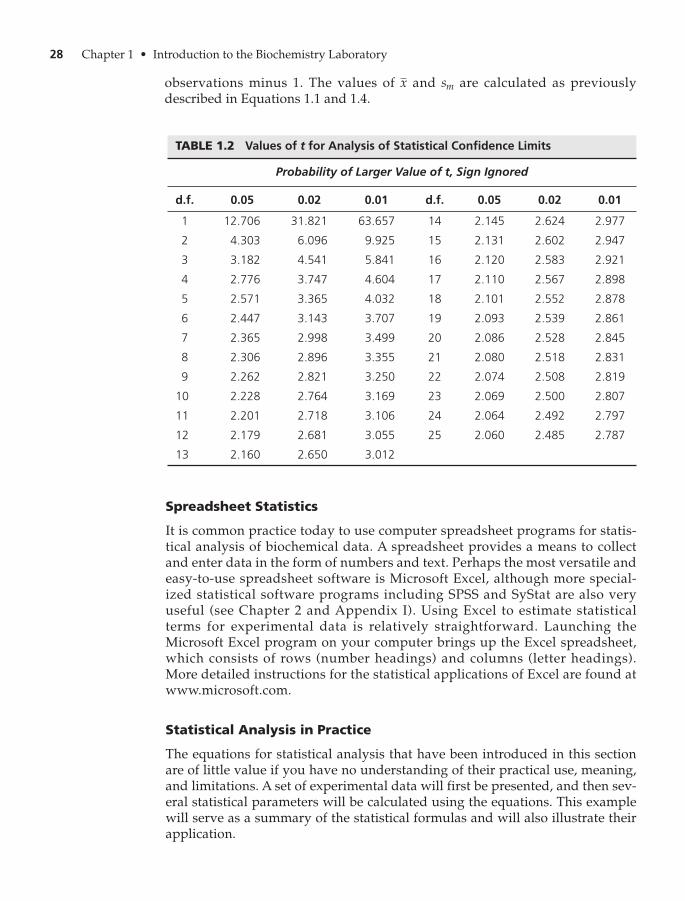
Spreadsheet Statistics
It is common practice today to use computer spreadsheet programs for statis-tical analysis of biochemical data. A spreadsheet provides a means to collectand enter data in the form of numbers and text. Perhaps the most versatile andeasy-to-use spreadsheet software is Microsoft Excel, although more special-ized statistical software programs including SPSS and SyStat are also veryuseful (see Chapter 2 and Appendix I). Using Excel to estimate statisticalterms for experimental data is relatively straightforward. Launching theMicrosoft Excel program on your computer brings up the Excel spreadsheet,which consists of rows (number headings) and columns (letter headings).More detailed instructions for the statistical applications of Excel are found atwww.microsoft.com.
Statistical Analysis in Practice
The equations for statistical analysis that have been introduced in this sectionare of little value if you have no understanding of their practical use, meaning,and limitations. A set of experimental data will first be presented, and then sev-eral statistical parameters will be calculated using the equations. This examplewill serve as a summary of the statistical formulas and will also illustrate theirapplication.
28 Chapter 1 • Introduction to the Biochemistry Laboratory
TABLE 1.2 Values of t for Analysis of Statistical Confidence Limits
Probability of Larger Value of t, Sign Ignored
d.f. 0.05 0.02 0.01 d.f. 0.05 0.02 0.01
1 12.706 31.821 63.657 14 2.145 2.624 2.977
2 4.303 6.096 9.925 15 2.131 2.602 2.947
3 3.182 4.541 5.841 16 2.120 2.583 2.921
4 2.776 3.747 4.604 17 2.110 2.567 2.898
5 2.571 3.365 4.032 18 2.101 2.552 2.878
6 2.447 3.143 3.707 19 2.093 2.539 2.861
7 2.365 2.998 3.499 20 2.086 2.528 2.845
8 2.306 2.896 3.355 21 2.080 2.518 2.831
9 2.262 2.821 3.250 22 2.074 2.508 2.819
10 2.228 2.764 3.169 23 2.069 2.500 2.807
11 2.201 2.718 3.106 24 2.064 2.492 2.797
12 2.179 2.681 3.055 25 2.060 2.485 2.787
13 2.160 2.650 3.012
observations minus 1. The values of and are calculated as previouslydescribed in Equations 1.1 and 1.4.
smx

Chapter 1 • Introduction to the Biochemistry Laboratory 29
STUDY EXERCISE 1.3 Statistical Analysis of Data
Ten identical protein samples were analyzed by the Bradford method for proteinanalysis. The following values for protein concentration were obtained.
Sample mean
Sample deviation
Sample deviation = xi - x
x = ax
n=
10.0210
= 1.00 mg>mL
Observation Number Protein Concentration (mg/mL), x
1 1.02
2 0.98
3 0.99
4 1.01
5 1.03
6 0.97
7 1.00
8 0.98
9 1.03
10 1.01
Observation xi - x
1 +0.02
2 -0.02
3 -0.01
4 +0.01
5 +0.03
6 -0.03
7 0.00
8 -0.02
9 +0.03
10 +0.01
Calculation of the sample deviation for each measurement gives an indication of theprecision of the determinations.
(Continued)

30 Chapter 1 • Introduction to the Biochemistry Laboratory
Study Problems
1. What personal protection items must be worn when handling glacial acetic acid?2. Define each of the following terms.
Standard deviation
The mean can now be expressed as (for this specific example, mg/mL). The probability of a single measurement falling within these limits is 68.3%.For 95.5% confidence the limits would be mg/mL.
Standard error of the mean
This statistical parameter can be used to gauge the precision of the experimental data.
Confidence limitsThe desired confidence limits will be set at the 95% confidence level. Therefore, we willchoose a value for t from Table 1.2 in the column labeled and
We can be 95% confident that the true mean falls between 0.99 and 1.01 mg/mL.
L2 = 0.99
L1 = 1.01
L1 = 1.00 + (2.262)(0.006)
x = 1.00
t0.05 = 2.262
sm = 0.006
L2 = x - (t0.05)(sm)
L1 = x + (t0.05)(sm)
n - 1 = 9.t0.05
sm = 0.006
sm =0.02110
sm =s
1n
1.00 ; 0.04(2s),
1.00 ; 0.02x ; s
s = 0.02
s = Ba(xi - x)2
n - 1
(e) Purified water(f) Error(g) Standard deviation(h) Molarity
(a) OSHA(b) MSDS(c) Flowchart(d) Pasteur pipet
3. Draw a schematic picture of your biochemistry lab and mark locations of the follow-ing safety features: eyewashes, first-aid kit, shower, fire extinguisher, chemical-spillkits, and direction to nearest exit.

Chapter 1 • Introduction to the Biochemistry Laboratory 31
4. Describe how you would prepare a 1-liter aqueous solution of each of the followingreagents:(a) 1 M glycine(b) 0.5 M glucose(c) 10 mM ethanol(d) 100 nM hemoglobin
5. Why is de-ionized (ion-exchange) water not suitable as a solvent for use in UVabsorbance measurements?
6. Describe how you would prepare just 10 mL of each of the solutions in Problem 4.7. If you mix 1 mL of the 1 M glycine solution in Problem 4a with 9 mL of water, what is
the final concentration of this diluted solution in mM?8. Convert each of the concentrations below to mM and
(a) 10 mg of glucose per 100 mL(b) 100 mL of a solution 2% in alanine
9. You have just prepared a solution by weighing 20 g of sucrose, transferring it to a 1-liter volumetric flask, and adding water to the line. Calculate the concentration ofthe sucrose solution in terms of mM, mg/mL, and % (wt/vol).
10. The concentrations of cholesterol, glucose, and urea in blood from a fasting individualare listed below in units of mg/100 mL (sometimes called mg%). These are standardconcentration units used in the clinical chemistry lab. Convert the concentrationsto mM.(a) cholesterol—200 mg%(b) glucose—75 mg%(c) urea—20 mg%
11. The following optical rotation readings were taken by a polarimeter on a solution ofan unknown carbohydrate. Use Excel or other statistical software to estimate statisti-cal terms.(a) Calculate the sample mean.(b) Calculate the standard deviation.
mM
(degrees)aobs
+3.24 +3.20 +3.17 +3.25
+3.15 +3.21 +3.23
+3.30 +3.19 +3.20
(c) Calculate the 95% confidence levels for the measurement.12. Describe how you would prepare 100 mL of a single solution containing all of the
following reagents at the designated concentrations.(a) 0.1 M NaCl(b) 0.05 M glucose(c) 5% wt/vol alanine(d) 1 mg/mL urea
13. How would you prepare 1 liter of a 1 M ethanol solution in water? You do not have ananalytical balance available, only a 1-liter volumetric flask and a 100-mL graduatedcylinder. The density of ethanol is 0.789 g/mL.
14. A technician at a clinical laboratory received a blood serum sample for cholesterol analy-sis. In order to check the reliability of the procedure, the technician repeated the assayfive times and obtained the results below. Use a spreadsheet statistical analysis to esti-mate the mean, standard deviation, variance, and standard error of the mean for the data.Total cholesterol in blood serum sample in mg/100 mL (mg%): 157, 154, 155, 152, 155.
32 Chapter 1 • Introduction to the Biochemistry Laboratory
Further Reading
PIPETTING
en.wikipedia.org/wiki/pipettePipets.
http://www.biology.lsu.edu/introbio/tutorial/Pipets/1208.pipet.htmlPipets and pipetting.
http://www.gilson.comInformation on automatic pipets, procedures for use, and hints.
http://www.rainin.comInstruction manuals for operation of the Pipetman.
www.newton.dep.anl.gov/askasci/chem03/chem03588.htmProper pipet usage.
http://www.umd.umich.edu/casl/natsci/slc/slconline/MICRPIP/index.htmlPipets and pipetting.
PREPARATION OF SOLUTIONS
M. Caspers and E. Roberts-Kirchhoff, Biochem. Mol. Biol. Educ. 31, 303–307 (2003). “AnUndergraduate Biochemistry Laboratory Course with an Emphasis on ResearchExperience.”
S. Kegley and J. Andrews, The Chemistry of Water (1997), University Science Books(Sausalito, CA). A discussion of water purity and analysis.
J. Risley, J. Chem. Educ. 68, 1054–1055 (1991). “Preparing Solutions in the Biochemistry Lab.”
www.labwater.comWater purification.
http://www.thermo.com/com/cda/landingpage/0,10255,626,00.htmlWater purification from Thermo Scientific.
SAFETY
R. Alaimo, Handbook of Chemical Health and Safety, 1st ed. (2001), Oxford UniversityPress (Cary, NC).
American Chemical Society, Safety in Academic Chemical Laboratories, Volume I:Accident Prevention for College and University Students; Volume II: AccidentPrevention for Faculty and Administrators, 7th ed. (2003), ACS (Washington, DC).
M. Armour, Hazardous Laboratory Chemicals Disposal Guide, 3rd ed. (2003), CRC Press(Boca Raton, FL).
K. Barker, Editor, At the Bench: A Laboratory Navigator (2005), Cold Spring HarborLaboratory Press (Cold Spring Harbor, NY).
National Research Council, Prudent Practices in the Laboratory: Handling and Disposalof Chemicals (1995), National Academy Press (Washington, DC).
P. Patnaik, A Comprehensive Guide to the Hazardous Properties of Chemical Properties,3rd ed. (2007), John Wiley & Sons (Hoboken, NJ).
www.sigma-aldrich.comMSDS documents for all biochemical products sold.
http://www.osha.govReview of functions and regulatory procedures of OSHA.

Chapter 1 • Introduction to the Biochemistry Laboratory 33
www.jjkeller.comSupplier of HMIS labels and information.
http://sitemaker.umich.edu/chemistry.ion/files/safety_rules_complete.docSafety in the biochemistry lab.
http://www.jce.divched.org/JCEWWW/Features/CERSChemical Education Resource Shelf, Safety and Waste Disposal in the list of textbooks and
software for use in chemistry/biochemistry courses.
STATISTICAL ANALYSIS OF DATA
R. Boyer, Modern Experimental Biochemistry, 3rd ed. (2000), Benjamin-Cummings(San Francisco), pp. 18–25.
P. Meier and R. Zund, Statistical Methods in Analytical Chemistry, 2nd ed. (2000), JohnWiley & Sons (New York).
C. S. Tsai, An Introduction to Computational Biochemistry (2002), John Wiley & Sons(New York), pp. 11–40.
M. Whitlock and D. Schluter, The Analysis of Biological Data, 1st ed. (2009), Roberts andCompany (Greenwood Village, CO).
http://www.graphpad.com/prism/Prism.htmSoftware for statistics and curve fitting.
http://www.statistics.comClick on free Web-based software for data analysis.
www.sciencesoftware.com/product.php?productid=131Statistics and curve fitting.
http://www.ruf.rice.edu/~bioslabs/tools/stats/stats.htmlStatistics in the lab.
WRITING LABORATORY REPORTS AND COMMUNICATING SCIENCE
K. Barker, Editor, At the Bench: A Laboratory Navigator (2005), Cold Spring HarborLaboratory Press (Cold Spring Harbor, NY). Covers lab orientation, keeping a note-book, and lab procedures.
H. Beall and J. Trimbur, A Short Guide to Writing about Chemistry, 2nd ed. (2001),Benjamin-Cummings (San Francisco).
R. Boyer, Biochem. Mol. Biol. Educ. 31, 102–105 (2003). “Concepts and Skills in theBiochemistry/Molecular Biology Lab.”
M. Cargill and P. O’Connor, Writing Scientific Research Articles: Strategy and Steps(2009), Wiley-Blackwell.
A. Coghill and L. Garson, The ACS Style Guide: A Manual for Authors and Editors, 3rd ed.(2006). Oxford University Press (Cary, NC).
R. Day and B. Gastel, How to Write and Publish a Scientific Paper, 6th ed. (2006),Greenwood Publishing Group (Westport, CT).
H. Ebel, C. Bliefert, and W. Russey, The Art of Scientific Writing: From Student Reports toProfessional Publications in Chemistry and Related Fields, 3rd ed. (2004), JohnWiley & Sons (New York).
P. Frey, Biochem. Mol. Biol. Educ. 31, 237–241 (2003). “Guidelines for Writing ResearchPapers.”
M. Katz, From Research to Manuscript: A Guide to Scientific Writing, 2nd ed. (2009),Springer (New York).

34 Chapter 1 • Introduction to the Biochemistry Laboratory
J. Kovac and D. Sherwood, Writing Across the Chemistry Curriculum: An Instructor’sHandbook (2001), Prentice-Hall (Upper Saddle River, NJ).
J. Matthews and R. Matthews, Successful Scientific Writing: A Step-by-Step Guide forthe Biological and Medical Sciences, 3rd ed. (2007), Cambridge University Press(New York).
T. O’Connor and G. Holmquist, Biochem. Mol. Biol. Educ. 37, 344–348 (2009). “Algorithmfor Writing a Scientific Manuscript.”
A. Penrose and S. Katz, Writing in the Sciences: Exploring Conventions of ScientificDiscourse, 2nd ed. (2004), Benjamin-Cummings (San Francisco).
L. Tomaska, ASBMB Today, pp. 20–21, May 2007, “Teaching Undergraduates to WriteScientific Papers.”
I. Valiela, Doing Science: Design, Analysis, and Communication of Scientific Research(2001), Oxford University Press (New York).
http://blog.makezine.com/science_room/general/maintaining_a_laboratory_notebook
Maintaining a lab notebook.
http://www.swarthmore.edu/NatSci/cpurrin1/notebookadvice.htmAdvice on keeping a lab notebook.
http://rescentris.com/?gclid=CNWE2M3qhZ4CFRhfagodfQ4SpQCERF electronic lab notebook.
http://www.ce.umn.edu/~smith/supplements/poster/guide.htmPreparing professional scientific posters.
http://www.swarthmore.edu/NatSci/cpurrin1/posteradvice.htmAdvice and template for designing scientific posters.
http://www.ruf.rice.edu/~bioslabs/tools/report/reportform.htmlWriting a research paper.
http://www.thomsonscientific.com/cgi-bin/jrnlst/jlresults.cgi?PC=BBList of biochemistry and biophysics journals.
http://www.biomedcentral.com/browse/journalsList of biochemistry, molecular biology, and medical journals.
http://www.lib.iastate.edu/collections/eresourc/biochem.htmlList of electronic journals of interest to biochemists and molecular biologists.
http://helios.hampshire.edu/~apmNS/design/RESOURCES/HOW_READ.htmlHow to read a scientific paper.
Additional Web sites for this chapter are available on the book's Companion Website,which can be found at http://www.chemplace.com.

2USING THE COMPUTER AND INTERNET FOR RESEARCH IN BIOCHEMISTRY
35
A. WHAT IS RESEARCH AND HOW IS IT DONE IN BIOCHEMISTRY?
What Is Research?
Virtually all scientists are engaged in investigative activities that are broadly called research.We begin this discussion on research by defining the term and continuing with details of thesteps that are usually followed in the process.
According to the Merriam-Webster Collegiate Dictionary, research is:
1. to search or investigate exhaustively2. the collecting of information about a particular subject3. studious inquiry or examination
A more realistic and functional definition comes from librarians:
“Research is a process of investigation. An examination of a subject from differentpoints of view. It’s not just a trip to the library to pick up a stack of materials, or
A. What Is Research and How Is It Done in Biochemistry? 35B. Using Computers in Biochemistry 38C. Web Sites Useful in Biochemistry 40
Study Problems 48Further Reading 49Computer Glossary 50
C H A P T E R

36 Chapter 2 • Using the Computer and Internet for Research in Biochemistry
picking the first five hits from a computer search. Research is a huntfor the truth. It is getting to know a subject by reading up on it, reflect-ing, playing with the ideas, choosing the areas that interest you andfollowing up on them. Research is the way you educate yourself.”1
The ultimate goal of all research is to seek the truth; however, the approach thatis used can vary from discipline to discipline. For biochemists and othermolecular life scientists, research is usually focused on elucidating the laws ofnature or, in other words, addressing questions about natural phenomena. Theapproach taken in biochemistry research is application of the historic “scientificmethod” of discovery.
The Scientific Method
The stepwise process for a scientific research project follows the general schemeshown in Figure 2.1. One of the early originators of this organized body oftechniques is thought to be Ibn al-Haythan (965–1039 A.D.; Latinized name,Alhazen), a physicist studying optics and living in Basra, Iraq. Many modifica-tions of the process have been made over the centuries, but the key scientificpremise has remained—data must be collected by experiment and observation.
Each of the steps in Figure 2.1 actually consists of several activities:
1. Select the topic. The topic for study is often one of strong interest to thescientist and one with which he or she may already have some familiarity.It is sometimes helpful to phrase the problem to solve as a question towhich we do not yet know the answer. Some examples of research topics inbiochemistry might be: (a) what is the detailed molecular mechanism for aparticular enzyme?, (b) what is the base sequence of a particular gene?,(c) what is the function of a protein that has just been isolated?, (d) how cana new method for analysis of fatty acids in blood serum be designed?, and(e) how does a particular drug act?
2. Collect current information and resources about the topic. This stepalways begins by reading the primary literature in the field of study.(Primary literature refers to articles in research journals in which scientistsdescribe their experiments, report data, and discuss important results.)When you do extensive background research, you start to become anexpert in the field. The computer is often heavily used in this step. Refer toPart C (p. 40) in this chapter to learn how to use the Internet in your studyof the biochemical literature. Background reading of the literature may alsobe done by consulting research journals in a library; however, journals arevery expensive, so libraries may not have all journals available.
3. Propose hypotheses that may answer questions about your topic. Thedictionary defines hypothesis as “a tentative assumption made in order todraw out and test its logical or empirical consequences.” A hypothesis is animportant and useful tool in research that helps lead you to answers to yourquestions. Proposing a hypothesis is guessing, but it is an “educated guess,”
1 http://www.usg.edu/galileo/skills/unit01/infoage01_03.phtml

Chapter 2 • Using the Computer and Internet for Research in Biochemistry 37
Select topicStep 1
Step 3
Step 5
Step 2
Step 4
Step 6
Step 7
Collect info
and resources
Repeat cyclePropose hypotheses
Test with
experiments
Interpret results
and make conclusions
Analyze data
Publish results
Hypothesis is
not proven
Hypothesis is
proven
FIGURE 2.1 Thesteps followed in a scientific researchproject. Thepathway is basedon the premises of the historicscientific method.
as your reading of the literature will have enhanced your knowledge.Perhaps the most important reason for having hypotheses is that they tellyou what experimental directions to take next on your project. (A hypothesiscannot be proven by experimental data, only supported. This will bediscussed in more detail later.)
4. Design and perform experiments; collect data. For hypotheses to be testedproperly, it is essential that you design experiments that provide resultsthat are informative. Experimental results must be observable, empirical,and measurable. The best experiments result from knowing your subjectwell and from asking good questions about what you need to find outabout your research problem. It should be obvious that experiments mustbe completed with accuracy and care and that safe lab techniques are used.Experiments should be repeated several times, with the same resultsobtained each time before they can be accepted as valid.

38 Chapter 2 • Using the Computer and Internet for Research in Biochemistry
5. Analyze data. Data from experiments may be quantitative or qualitative.Both types can be analyzed by using a computer to prepare figures, tables,and graphs. If your results are primarily numerical, then it will be neces-sary to carry out calculations followed by proper statistical analysis usingExcel and other software (see Chapter 1, Section E, p. 23).
6. Interpret results and draw conclusions. Are your experimental resultsand interpretations consistent with at least one of your hypotheses? If so,then that hypothesis can be supported by the results. It could be a likelyanswer to your initial question. A hypothesis cannot be proven, only sup-ported. Any hypothesis that is not consistent with experimental resultsmust be rejected. If all hypotheses are inconsistent with results, then newhypotheses must be proposed and tested. This is shown in Figure 2.1 as abranch from Step 6 to Step 3. This is called an iteration, or repeatingprocess. Research is a constantly ongoing, evolving process. It is always ina state of flux, but scientists hope that each step they take moves themcloser to an answer to their original question.
7. Publish results in a scientific journal. This step makes your work avail-able so it may be studied by scientists around the world. Scientists thenhave the opportunity to repeat your experiments, to check their validity,and to design new experiments to test the hypothesis. Making sure thatyour experiments are reproducible, especially by scientists in other labs, isan important element of the scientific method.
One problem that can sometimes occur with the scientific method is a lackof objectivity. Scientists can become biased, adopt a favorite hypothesis, anddesign only experiments supporting that hypothesis. A balanced and objectiveapproach is a necessity in scientific research. In addition to objectivity, anothercriterion that scientists must adhere to is ethical behavior. Unethical practices,such as have been observed in the form of scientific misconduct (plagiarism,falsifying data, etc.), are a danger to scientific progress. (See the Wikipedia Website for examples of ethics in research and scientific misconduct.) The currentlycontroversial so-called “climategate” issue is one that some scientists say lacksobjectivity and is marred by unnecessary secrecy and a failure to fully share data.The last Web site at the end of this chapter contains an article criticizing thescientific process used in studying changes in the world’s climate.
B. USING COMPUTERS IN BIOCHEMISTRY
The modern computer has revolutionized the way we live. Not surprisingly, thecomputer has also changed the way we do scientific research. The computer hasbecome an essential tool for the investigation of all aspects of biomolecules—their structure, function, reactions, and information. The need for computers inbiochemistry and the related molecular life sciences is growing because of twofactors: (1) the fields are becoming increasingly quantitative, so there is a require-ment for complex and accurate calculations—the computer with its accessto Internet software and application programs is ideal for this work; and(2) because of the ease of determining protein and nucleic acid sequences andstructures, there has been a proliferation of biological information that needs to

Chapter 2 • Using the Computer and Internet for Research in Biochemistry 39
be organized, stored, and made readily available to researchers. Initially, com-puters in biochemistry were used in the routine tasks of word processing, graph-ing, and statistical analysis of research data. But when connected to the Internet,the computer’s use is greatly expanded to include some of the following func-tions: (1) searching the biochemical literature for pertinent books and journalarticles, (2) using software for analyzing experimental data, (3) accessing bio-logical databases that provide nucleic acid and protein sequences and structures,(4) seeking research methodology, procedures, and protocols for lab work, andmany more uses.
This application of computer technology to the analysis, management, andmanipulation of biochemical data is sometimes considered a part of the broadfield of computational biochemistry. An important subfield of computationalbiochemistry that we will use extensively in this text is bioinformatics, definedas the application of computer technology to the storage and use of biologicaldata, especially protein and nucleic acid sequence and structure.
Your first encounter with a computer in the laboratory was probably whileyou were using an instrument that had a computer to control its operation, to col-lect data, and to analyze data. All major pieces of scientific equipment, includingUV-VIS spectrophotometers, high-performance liquid chromatographs, gas chro-matographs, nuclear magnetic resonance spectrometers, mass spectrometers, andDNA sequencers, are now computer controlled. But your use of the computer willnot end when you leave the lab, as you will use it to prepare laboratory reportsincluding graphical and statistical analysis of your experimental data.
The primary purpose of this chapter is to learn how to solve problems in bio-chemistry using computer and software technology. Here we will outline generalInternet resources that may be used in later chapters. Each chapter of this text willalso describe more specific Internet resources that can be applied to the topics inthat chapter. It is important for your education and career that you become knowl-edgeable and skilled in the use of the computer and Internet. Many specializedand some new terms are introduced in this chapter. Most of the words in bold inSections B and C on computers are defined in a glossary at the end of the chapter.
Accessing the Internet
It is probably a correct assumption that those reading this book either have theirown computer system or have access to computers where they study or work.Therefore, details for setting up and using a computer will not be provided here.Questions regarding computer use may be addressed to your instructor, supervi-sor, or local computer services office. If you are a student at an academic institu-tion or a worker in a biotech-related lab, you will most likely be provided accessto the Internet either through Ethernet or by a wireless system. Ethernet is awidely-used, wired networking system appropriate for local area networks(LAN). (Low-cost adaptors, called wireless bridges, are available to make anywired Ethernet-equipped device a part of a wireless network.) Some recom-mendations for specific hardware and software will be given in this book, butone must be aware that new products and important upgrades are continuallybeing developed. Many of the software programs described here are freeware,software available without charge.

40 Chapter 2 • Using the Computer and Internet for Research in Biochemistry
For word processing (writing lab reports, etc.), the most popular programis Microsoft Word. Software specialized for scientific and technical writing isavailable, but probably not necessary at this level. Current software programs forstatistical analysis, graphing, and spreadsheets with graphing capability includeExcel, Sigmaplot, SPSS, and SyStat (see Chapter 1, Section E, p. 23).
In order to access the Internet, you will need a Web browser, which is an inter-face program that reads hypertext and displays Web pages on your computer. Asur-vey of computer users in 2010 found the most popular Web browsers to be Firefox(Mozilla), Chrome (Google), Internet Explorer (Microsoft), and Safari (Apple).
The World Wide Web
A heavily used and rapidly growing component of the Internet is the WorldWide Web (WWW, also called “the Web”). This facility, which was launched in1992, permits the transfer of data as pages in multimedia form consisting of text,graphs, figures, audio, and video. Each Web site, which has its own address(called a Uniform Resource Locator, URL), is composed of Web pages. Thepages are linked together by hypertext pointers so that data stored on computers(servers) in different locations may be retrieved via the network by your com-puter. Web documents are written in a special coded language called HypertextMarkup Language (HTML). Typing the URL into the browser dialogue box willbring you to the home page or starting point for the Web site. One important fea-ture you may note is that some text on the page is emphasized with underlining,in a different color, or perhaps highlighted in some other way. If you click themouse on this text (called hyperlinks), your computer will connect to anotherrelated Web page that provides information on the hyperlink. This featuregreatly enhances the use of the Web because related Web sites are connected orlinked together and may be quickly accessed by a click of the mouse rather thanby typing in a different URL.
C. WEB SITES USEFUL IN BIOCHEMISTRY
Directories, Library Resources, Databases, and Tools
Because of the complexity and the enormous number of Web sites available, onecan easily become overwhelmed. Therefore, three tables, Tables 2.1–2.3, are pre-sented that list Web sites selected for study because they are thought to be espe-cially instructive for beginning students in biochemistry and other molecular lifesciences. Each site in the tables has a short descriptive note that defines its con-tents. Table 2.1 consists of Web addresses that contain directories, catalogs, andlibrary resources. Another way to describe Table 2.1 is to say “these addresses areWeb sites that help you find other Web sites.” This is a good place to start if youwant to become familiar with the many resources available. Table 2.2 lists Websites that have databases and tools that are more specialized in their function.Table 2.3 lists databases that allow searches using the name of a biochemical orclass of biochemicals. These Web sites are especially valuable when seekinginformation and properties of biomolecules, including nomenclature, physicalproperties, structural data, reaction characteristics, spectroscopic information,and even chromatographic data.

Chapter 2 • Using the Computer and Internet for Research in Biochemistry 41
TABLE 2.1 Web Directories and Library Resources
Name Description URL
Scirus For scientific information http://www.scirus.com/srsapp
Intute Finding the best Websites for biochemistry
http://www.intute.ac.uk/biologicalsciences
BioChemWeb The virtual library ofbiochemistry, molecularbiology, and cell biology
http://www.biochemweb.org
Protocol-Online Your lab’s reference book http://www.protocol-online.org
University of New MexicoCenter for AdvancedResearch Computing
Best biotech sites in theworld
http://www.hpc.unm.edu/~aroberts/main/top5%25.htm
University of Sussex Chemistry and Bio-chemistry Library Guide
http://guides.lib.sussex.ac.uk/chemistry
Iowa State University Biochemistry LibraryGuide
http://www.lib.iastate.edu/collections/eresourc/biochem.html
Penn. State University Biochemistry LibraryGuide
http://www.libraries.psu.edu/psul/researchguides/agbiohealth/bmb.html
Alverno College Library Resources http://depts.alverno.edu/library/science.html
TABLE 2.2 Biochemical Databases and Tools
Name Description URL
Protein Data Bank (PDB) Protein structures determinedby X-ray and NMR
http://www.rcsb.org/pdb
European BioinformaticsInstitute (EBI)
DNA sequences http://www.ebi.ac.uk
National Center for Biotech-nology Information (NCBI)
Variety of databases andresources
http://www.nlm.nih.gov
Swiss-Protein Protein sequences and analysis http://www.expasy.ch/tools
The Institute for GenomicResearch
Collection of genomicdatabases
http://www.ebi.ac.uk/genomes/index.html
REBASE—The RestrictionEnzyme Database
Restriction enzyme directoryand action
http://rebase.neb.com
NCBI Molecules to Go Structures of biomolecules http://molbio.info.nih.gov/cgi-bin/pdb
PyMol Molecular Viewer Structures of biomolecules http://pymol.org
Entrez browser of NCBI Database searching includingPubMed literature
http://www.ncbi.nlm.nih.gov/Entrez
Protein Information Resource (PIR)
Database searching for proteins
http://pir.georgetown.edu
Munich Information Center forProtein Sequences (MIPS)
Protein sequences http://www.helmholtz-muenchen.de/en/mips
(continues)

42 Chapter 2 • Using the Computer and Internet for Research in Biochemistry
TABLE 2.3 Databases of Biochemical Compounds
Name Description URL
International Union of Biochemistryand Molecular Biology (IUBMB)
Nomenclature http://www.chem.qmul.ac.uk/iubmb
IUBMB Enzyme List Catalog of enzymes http://www.chem.qmul.ac.uk/iubmb/enzyme
ChemBioFinder Structures and properties http://www.chembiofinder.com
Worthington Enzyme Manual Properties of enzymes http://www.worthington-biochem.com/index/manual.html
Enzyme Database of ExPASy Enzyme names andnumbers
http://www.expasy.ch/enzyme
BRENDA A comprehensive enzymeinformation system
http://www.brenda-enzymes.info
Name Description URL
Journal of Chemical EducationResource Shelf
List of all current biochemistry texts
http://www.jce.divched.org/JCEWWW/Features/CERS
Chimera Molecular ModelingSystem (UCSF)
Advanced molecular modeling
http://www.cgl.ucsf.edu/chimera
BiomoleculesAlive (ASBMB) Instructional material http://www.biomoleculesalive.org
ChemDraw Chemical structure drawingprogram
http://www.cambridgesoft.com
MEDLINE (PubMed) U.S. National Library of Medicine
http://www.nlm.nih.gov
An annoying aspect of using Web sites is that they can disappear from theInternet. In fact, this may happen to some of the sites in this book. This process,sometimes called “Web rot,” can happen when a link becomes broken or irrele-vant over time. If the reason for a Web site disappearance is due to a newaddress, you will usually be directed to the new site.
Many of the current Web sites you will need for your work and study arelisted in the tables here; however, what about new Web sites that have beenestablished since publication of this book? Millions of new sites are created everyyear. To access these new sites, you need the help of a search engine, a searchabledirectory that organizes Web pages by subject classification. The most widelyused search engines are Google (http://www.google.com) and Yahoo (http://www.yahoo.com). Use of a search engine requires the input of a keyword orterms for searching. As you surf the Web, you may find sites you wish to saveand review at a later date. Different Web browsers use different terms to definethis saving process. Some use favorites and some use bookmarks.
TABLE 2.2 Continued

Chapter 2 • Using the Computer and Internet for Research in Biochemistry 43
STUDY EXERCISE 2.2 Using Protocol-Online
Study the home page for Protocol-Online. What are the subtopics available under themain heading of “Biochemistry”?
Solution:On the home page, click on “Biochemistry.” Here you will find hyperlinks to threesubtopics: amino acids and proteins, enzyme analysis, and lipids.
STUDY EXERCISE 2.3 IUBMB Enzyme Web Site
Use the IUBMB enzyme site to find the E.C. (Enzyme Commission) number for theenzyme cellulase.
Solution:Cellulase catalyzes the hydrolysis of the glycosidic bonds between glucose in the sub-strate cellulose. The E.C. number is 3.2.1.4.
STUDY EXERCISE 2.1 Using Directory Web Sites
List five of the “Best Biotech Web Sites in the World” found on the Web site from TheUniversity of New Mexico Center for Advanced Research Computing.
Solution:4Biotech, Access Excellence, AgBiotechNet, biochemist.com, BiochemNet
Viewing Structures of Biomolecules
Determining the structure of biomolecules has now become a relatively routineactivity in research labs. Thousands of structures experimentally determined byX-ray crystallography, NMR, and electron microscopy are now available onselected Web sites. The structures include those of proteins, nucleic acids, andnucleic acid/protein complexes. Some of the most accessible and useful sites forviewing structures include:
• Protein Data Bank (http://www.rcsb.org)• Molecules to Go (http://molbio.info.nih.gov/cgi-bin/pdb)• PyMol Molecular Viewer (http://pymol.org)
The Protein Data Bank and Molecules to Go sites are freeware, but PyMol isa user-sponsored system and requires a subscription. Academic institutionsmay purchase a site license for an individual, lab and classroom, or completedepartment.
44 Chapter 2 • Using the Computer and Internet for Research in Biochemistry
STUDY EXERCISE 2.4 Protein Data Bank
Use the Protein Data Bank Web site to find a structure for the enzyme cellulase. Whatkinds of secondary structures do you see in the cellulase molecule? What organismwas the source of the cellulase you looked at?
Solution:As of July 20, 2010, there were structures of 177 different cellulases on the PDB site. Onthe same date, there was a total of 66,633 structures of biomolecules on the PDB site.Each cellulase at the site will have different percentages of -helices and sheets.Describe the structure you looked at.
ba
Searching the Biochemical Literature
An introduction to scientific journals and publishing a research article in a journalwas given in Chapter 1 (see Section B, p. 6). Figure 1.5 provides an extensive list ofjournals that publish research articles in biochemistry. Generating research ideasand maintaining a research lab require an extensive knowledge of thebiochemical literature (see Step 2, Figure 2.1). Much of this literature is now acces-sible on the Internet, but occasionally it may be necessary to use reference books inthe library. The biochemical literature is massive and expanding rapidly. It isalmost a full-time job just to maintain a current awareness of a specialized researcharea. There are few disciplinary boundaries in the study of biochemistry. The bio-chemical literature overlaps into the biological sciences, the physical sciences, thebasic medical sciences, and information technology. The intent of the followingdiscussion is to bring order to the many sources of information including text-books, reference books, research journals, and Internet Web sites that are available.
Textbooks
The student’s first exposure to biochemistry is usually a formal class accom-panied by the reading of a general textbook of biochemistry. By providing anin-depth survey of biochemistry, textbooks allow students to build a strongfoundation of important principles and concepts. By the time most books are inprint, the information is one to two years old, but textbooks should still be con-sidered the starting point for mastery of the fundamentals of biochemistry. Manytextbooks are now available on-line and thus can be occasionally updated bytheir authors, or a Web site may be established for addition of new material.
Reference Books
For more specialized and detailed biochemical information that is not offered bytextbooks, reference books must be used. Reference works range from general
To obtain a structure, access the Web site home page and type the name ofthe biomolecule desired into the dialogue box. Instructions for further analysis ofthe structure are given on all sites.

Chapter 2 • Using the Computer and Internet for Research in Biochemistry 45
surveys to specialized series. The best works are multivolume sets that continuepublication of volumes on a periodic basis. Each volume usually covers a spe-cialized area with articles written by recognized authorities in the field. It shouldbe noted that reference articles of interest to biochemists are often found in pub-lications that are not strictly biochemical. The best known and most widely usedreview publication is Annual Review of Biochemistry. Each volume in this series,which was introduced in 1932, contains several detailed and extensive articleswritten by experts in the field. For shorter reviews emphasizing current topics,Trends in the Biochemical Sciences (TIBS) is widely read. The active researcher has acontinuing need for new methods and techniques. Several publications special-ize in providing details of research methods, and many research methods arenow available on the Web.
Research Journals
The core of the biochemical literature consists of peer-reviewed research journals(primary literature). It is essential for a practicing biochemist to maintain aknowledge of biochemical advances in his or her field of research and relatedareas. Scores of research journals are published with the intent of keeping scien-tists up to date. Some research journals have achieved an especially excellentreputation, and articles therein are considered to be of the highest quality.A recent ranking of the biochemical journals, based on the number of citationsreceived, produced the following order for the top six: Journal of BiologicalChemistry, Biochimica et Biophysica Acta, Biochemistry, Proceedings of the NationalAcademy of Sciences of the United States of America, Biochemical Journal, andBiochemical and Biophysical Research Communications. The core journals used by anindividual depend on the area of specialty and are best determined from experi-ence (see Figure 1.5, p. 10).
With the expansion of scientific information has come the need for efficientstorage and use of research journals. Most publishers now provide journals on-line,and libraries pay the subscription cost for the journals they want. Students, fac-ulty, and researchers can then obtain articles free of charge. If your institutiondoes not subscribe to a journal you need, it is possible to read article titles andabstracts on journal Web sites at no cost. If the complete text for an article isneeded, usually there is a charge. The URLs for journals may be obtained by usinga search engine.
Literature Searches on the Web
As you study and work in biochemistry, you will often need to complete athorough literature search on some specialized area or topic. It is not practical tosurvey the hundreds of books, journals, and reports that may contain informationrelated to the topic. Two publications that provide brief summaries of publishedarticles, reviews, and patents are Chemical Abstracts and Biological Abstracts. If youare not familiar with the use of these abstracts, ask your instructor or referencelibrarian for assistance. Both of these abstracts are available on-line.
Research articles of interest to biochemists may appear in many types ofresearch journals. Research libraries do not have the funds necessary to subscribe

46 Chapter 2 • Using the Computer and Internet for Research in Biochemistry
to every journal, nor do scientists have the time to survey every current journalcopy for articles of interest. The computer revolution has reached into thechemical and biochemical literature, and most college and university librariesnow subscribe to computer bibliographic search services. One such service isSTN International, the scientific and technical information network. This on-linesystem allows direct access to some of the world’s largest scientific databases.The STN databases of most value to life scientists include BIOSIS Previews/RN(produced by Bio Sciences Information Service; covers original research reports,reviews, and U.S. patents in biology and biomedicine) and CA (produced byChemical Abstracts service, covers research reports in all areas of chemistryincluding biochemistry). These networks provide on-line service, and their data-bases can be accessed from personal computers in the office, laboratory, orlibrary. Subscription costs are usually paid by the library.
Excellent Web sites for searching the biochemical literature using yourpersonal computer are available as freeware. The most widely used site is:
• PubMed from the National Center for Biotechnology Information (http://www.pubmed.gov)
PubMed is a service of the NIH National Library of Medicine. In addition tothe direct URL listed above, it may be accessed through the NCBI site (http://www.ncbi.nlm.nih.gov), National Library of Medicine site (http://www.nlm.nih.gov) or many other database Web sites. To begin a search, enter search termsin the dialogue box at the top of the home page. Search terms may be topics,author name, or journal name. Results are reported in a table, beginning with themost recent articles, with article titles, author(s), and journal reference.
STUDY EXERCISE 2.5 Searching the Biochemical Literature on PubMed
To illustrate the use of this search service, point your Web browser to the appropriateURL above for the PubMed home page. Many features on display are available, butthe most basic is the search capability. For bibliographic searching, you may enter in thedialogue box a search term, author name, or journal name. For example, type in “humanalpha-lactalbumin,” a calcium-binding protein found in milk. Clicking on “Search” willthen provide more than 1100 citations (or articles). The lists are composed of article title,author(s), and reference in reverse chronological order. By clicking on the highlightedtitle (in hypertext), you can retrieve the abstract of the article. Another useful and time-saving feature is the hypertext (see “Related Articles”). Clicking on this will provide a listof papers related to the specific citation. The 1100 papers or so that you obtained in youroriginal search are too many to screen; you may change the search parameters to reducethe number. For example, in the citation listing you see some interesting articles describ-ing that complexes formed between human -lactalbumin and oleic acid have beenreported to display apoptotic activity against tumor cells. You can narrow down the cita-tion list by searching the topic “complexes between human alpha-lactalbumin and oleicacid.” This yields about 12 results, a reasonable number of abstracts to read. Practiceusing PubMed with some terms you find interesting.
a

Chapter 2 • Using the Computer and Internet for Research in Biochemistry 47
Sequence Homology in Proteins
Another activity that is valuable in biochemical research is to seek proteins thathave different functions, but similar sequences (sequence homology). Theseinvestigations can be done at a couple of Web sites:
• Protein Data Bank (http://www.rcsb.org)• National Center for Biotechnology Information (http://www.ncbi.nlm.nih.
gov)
Both Web sites compare biomolecules to seek to find regions of sequencesimilarity.
STUDY EXERCISE 2.6 Using Databases
The application of the primary databases and structural analytical tools will be intro-duced using a protein, -lactalbumin from human milk. We will search databases tofind and view its primary and secondary structure and also determine if there are otherproteins with a similar amino acid sequence and structure. After completion of theseexercises, you will be able to apply these computer tools to proteins of your own choice.Point your Web browser to the Protein Data Bank (PDB) and the Research Collaboratoryfor Structural Bioinformatics (http://www.rcsb.org). Become acquainted with the PDBby viewing the home page and perhaps clicking on some hyperlinks. Type “humanalpha-lactalbumin” in the dialogue box at the top of the page and click on “Search.”Your query will find at least 14 structure hits. An appropriate structure to work with isnumber 1B90: human -lactalbumin, low temperature form. Click on the highlightedtitle for a structure and more information about the protein. On the top tool bar, click on“Sequence.” The protein has one polypeptide chain and 123 amino acid residues. Thesequence is given using one-letter abbreviations for amino acids. The sequence alsoshows locations of -helices (41%) and beta sheets (9%). For a comparison of thisprotein with others in the database, click on ”Sequence Similarity.” The resulting tableprovides the number of proteins with % sequence similarity ranging from 100% downto 30%. For example, there are three proteins that have 90% sequence homology and577 proteins that have 40% sequence homology. Click on the 40% column to see a list ofthe proteins, most of which are lysozymes. It is interesting to note that the proteins
-lactalbumin and lysozyme have similar primary, secondary, and tertiary structures,but quite different biochemical activities. The two proteins may have been derived froma common ancestral gene. You could also have used the BLAST tool at the NCBI site forthe same analysis of sequence.
a
a
a
a
Virtual Biochemistry Laboratories
For some colleges and universities around the world, offering a “real” biochemistrylaboratory course for students is not a possibility. Some of the reasons for thisinclude a lack of expensive scientific instruments, equipment, and reagents; ascarcity of appropriate lab space; a lack of staff expertise; and an inability to fitscheduled lab time into a tight curriculum. Alternative activities for students arenow available in the form of “virtual biochemistry labs” on the Web (Table 2.4).Although simulated labs should never be considered as a replacement or substitute

48 Chapter 2 • Using the Computer and Internet for Research in Biochemistry
Study Problems
1. Use PubMed or an enzyme Web site to answer the following questions about theenzyme tyrosinase.(a) What are sources of the enzyme besides mushroom?(b) What metal ion is present in the native enzyme?(c) Find two references for the study of the inhibition of tyrosinase. What inhibitor
molecules have been investigated?(d) Find another substrate for the enzyme besides L-DOPA.(e) Search for the three-dimensional structure of the enzyme.
2. Use PubMed bibliographic searches to find two recent research articlesauthored by Thomas R. Cech, who won the Nobel Prize in Chemistry for thediscovery of catalytic RNA (ribozymes). Write brief summaries of the articles.
3. The technique of immobilized metal-ion affinity chromatography (IMAC) is widelyused to purify proteins. Find two proteins that have recently been purified by thisprocedure.
4. The Western blot procedure is now used to test human serum for the presence of anti-bodies to the AIDS virus. Find two publications that describe procedures for thisassay.
5. Use the REBASE site to determine the specificity of the restriction enzyme HindIII.6. Use the techniques in Study Exercise 2.6 to find the amino acid sequence of the protein
recombinant goat -lactalbumin. What is the percent of -helices and -sheetsecondary structure?
7. What is the biological function of -lactalbumin?a
baa
TABLE 2.4 Virtual Biochemistry Labs
Name Description URL
St. Olaf College Virtual Lab Manual http://www.stolaf.edu/people/muth/Labmanual.html
Carnegie Mellon University Biology labs http://telstar.ote.cmu.edu/biology/lab/index.html
Lund University Labs in bioanalytical chemistry
http://www.drylabs.com
Changbioscience Virtual labs for biologists http://www.changbioscience.com/virtualab.html
HHMI Interactive Virtual labs in biology http://www.hhmi.org/biointeractive
for the real thing, especially for student majors in biochemistry, molecular biology,other biological sciences, and chemistry, they may be suitable for some studentswho will never work in a lab or manipulate lab data. In addition, viewing experi-ments and procedures in virtual labs may actually offer benefits to students whowill perform similar experiments in the lab. The virtual lab may be considered a“prelab,” where students will become acquainted with equipment, techniques, andprocedures and can more efficiently conduct real experiments in the lab. This expe-rience is especially important when students are dealing with expensive equipmentand reagents. The virtual labs may also be considered a safety feature—studentscan receive training regarding the use of dangerous reagents and procedures.

Chapter 2 • Using the Computer and Internet for Research in Biochemistry 49
8. Study the nucleotide sequence for the human -lactalbumin gene. Hint: Begin at theNCBI home page and enter Entrez. Click on “Nucleotides” and do a search for theprotein. Review the GenBank report for a position of introns and exons. Obtain aFASTA report, download the files, and complete a BLAST search for relatedsequences.
9. The December 2009 issue of The Scientist magazine listed the ten most exciting biotechtools to be introduced in 2009. One of the top ten is “protein expression using synthe-sized genes.” Write a paragraph of about 100 words that describes the new laboratorytechnique. Use computer bibliographic searches to learn about this new technology.
10. Use the BLAST tool to compare the amino acid sequences for human -lactalbuminand lysozyme. Repeat the process with the use of BLAST to compare the nucleotidesequences for the genes coding for -lactalbumin and lysozyme.a
a
a
Further Reading
A. Baxevanis and B. Ouellette (Editors), Bioinformatics: A Practical Guide to theAnalysis of Genes and Proteins, 3rd ed. (2004), Wiley Interscience.
J. Boyle, Biochem. Mol. Biol. Educ. 32, 236–238 (2004). “Bioinformatics in UndergraduateEducation.”
S. Cooper, Biochem. Mol. Biol. Educ. 29, 167–168 (2001). “Integrating Bioinformatics intoUndergraduate Courses.”
L. Furge et al., Biochem. Mol. Biol. Educ. 37, 26–36 (2009). “Vertical and HorizontalIntegration of Bioinformatics Education.”
J. Gu and P. Bourne (Editors), Structural Bioinformatics (Methods of BiochemicalAnalysis), 2nd ed. (2009), Wiley-Blackwell.
C. Hodgman, A. French, and D. Westhead, Instant Notes in Bioinformatics, 2nd ed.(2009), Taylor & Francis.
H. Höltje, et al., Molecular Modeling: Basic Principles and Applications, 3rd ed. (2008),John Wiley & Sons.
R. Kaspar, Biochem. Mol. Biol. Educ. 30, 36–39 (2002). “Integrating InternetAssignments into a Biochemistry/Molecular Biology Laboratory Course.”
L. Kirkup, Data Analysis with Excel (2002), Cambridge University Press (Cambridge,U.K.).
A. Lesk, Introduction to Bioinformatics, 3rd ed. (2008), Oxford University Press (NewYork).
J. Pevsner, Bioinformatics and Functional Genomics, 2nd ed. (2009), Wiley-Blackwell.J. Ramsden, Bioinformatics: An Introduction, 2nd ed. (2009), Springer-Verlag (New York).S. Rovner, Chem. Eng. News, July 27, 2009, pp. 54–57, “Digital Textbooks.”I. Schomburg et al., Trends Biochem. Sci. 27, 54–56 (2002). “BRENDA: A Resource for
Enzyme Data and Metabolic Information.”D. Sheehan, Physical Biochemistry: Principles and Applications, 2nd ed. (2009),
Wiley-Blackwell (Hoboken, NJ). Bioinformatics—Chapter 9, pp. 305–346.C. St. Clair and J. Visick, Exploring Bioinformatics: A Project-Based Approach (2009),
Jones & Bartlett.C. Tsai, Computational Biochemistry (2002), Wiley-Liss (New York).L. Wang, Chem. Eng. News, September 7, 2009, pp. 97–99, “Learning Chemistry Online.”D. Weisman, Biochem. Mol. Biol. Educ. 38, 4–9 (2010). “Incorporating a Collaborative
Web-based Virtual Laboratory in an Undergraduate Bioinformatics Course.”X. Zhang, Biochem. Mol. Biol. Educ. 37, 16–23 (2009), “Using Arabidopsis Genetic
Sequences to Teach Bioinformatics.”

50 Chapter 2 • Using the Computer and Internet for Research in Biochemistry
M. Zvelebil and J. Baum, Understanding Bioinformatics (2007), Garland Science.
http://www.jce.divched.org/JCEWWW/Features/CERSThe Journal of Chemical Education, Chemical Education Resource Shelf. For a complete
list of current general biochemistry texts and lab manuals, scroll down to“Biochemistry.”
http://www.biointeractive.orgVirtual biology labs sponsored by Howard Hughes Medical Institute.
http://www.vts.intute.ac.uk/Helping you find the best Web sites for study and research.
http://www.usg.edu/galileo/skills/unit01/infoage01_03.phtmlWhat is research? The Online Library Learning Center of the University System of
Georgia.
http://ugresearch.adm.ohio-state.edu/research.htmlWhat is undergraduate research? From The Ohio State University Undergraduate
Research Office.
http://en.wikipedia.org/wiki/ResearchResearch defined; from Wikipedia.
http://www.sciencebuddies.org/mentoring/project_scientific_method.shtmlSteps of the scientific method.
http://en.wikipedia.org/wiki/Scientific_methodThe scientific method defined.
http://en.wikipedia.org/wiki/Scientific_misconductEthics and scientific misconduct.
http://helios.hampshire.edu/~apmNS/design/RESOURCES/HOW_READ.htmlHow to read a scientific paper.
http://www.changbioscience.com/virtualab.htmlBioinformatics tools and resources for biomedical scientists and students.
http://www.ft.com/cms/s0/8aefbf52-d9e1-11de-b2d5-00144feabdc0.htmlComment on the “Climategate” issue.
Additional Web sites for this chapter are available on the book’s Companion Website,which can be found at http://www.chemplace.com.
Computer Glossary
bioinformatics the use of computer technology to solve biological problems.biological databases computer sites that organize, store, and disseminate files that con-tain information consisting of literature references, nucleic acid sequences, proteinsequences, and protein structures.bookmark a function to save a Web site address for later use (Netscape Navigator).computational biochemistry the application of computer technology to the analysis,management, and manipulation of biochemical data.Ethernet a family of frame-based computer networking technologies for local area net-works.favorites the Internet Explorer form of a bookmark.freeware software that is provided free of charge by its developer.

Chapter 2 • Using the Computer and Internet for Research in Biochemistry 51
home page the beginning page for access to a Web site.HTML HyperText Markup Language; a special, coded language that is used to writeWeb pages.hyperlink link or connection between related Web pages.hypertext a language that connects similar documents on the Web.Internet the worldwide matrix that allows all computers and networks to communicatewith each other.multimedia several forms of media including text, graphics, video, and audio.search engine a searchable directory that organizes Web pages by subject classification.server a computer that acts as the storage site for retrievable data.URL uniform resource locator; a standard address form that identifies the location of adocument on the Internet.Web site a collection of documents (Web pages) on a server.WWW World Wide Web (“the Web”); a component of the Internet that uses a hypertext-based language to provide resources.

This page intentionally left blank

3 GENERAL LABORATORYPROCEDURES
53
A ll biochemistry experimental activities, whether in the teaching or research laboratoryor in an industrial biotech lab, are replete with techniques that must be carried out onan almost daily basis. This chapter outlines the theoretical and practical aspects of
some of these general and routine procedures, including preparation of buffers, use of buffers,pH measurements, dialysis, membrane filtration, lyophilization, quantitative methods forprotein and nucleic acid measurement, centrifugal vacuum concentration, and measurementof radioactive samples.
A. pH, BUFFERS, ELECTRODES, AND BIOSENSORS
Most biological processes in the cell take place in a water-based environment. Water is anamphoteric substance; that is, it may serve as a proton donor (acid) or a proton acceptor(base). Equation 3.1 shows the ionic equilibrium of water.
>> (Eq. 3.1)H2O Δ H + + OH-
A. pH, Buffers, Electrodes, and Biosensors 53B. Measurement of Protein Solutions 67C. Measurement of Nucleic Acid Solutions 71D. Techniques for Sample Preparation 73E. Radioisotopes in Biochemistry 80
Study Problems 91Further Reading 92
C H A P T E R

54 Chapter 3 • General Laboratory Procedures
In pure water, in other words, the pH or is 7.[The pH scale runs from 0 (very acidic) to 14 (very basic)]. Acidic and basic mole-cules, when dissolved in water in a biological cell or test tube, react with eitherhydrogen ions or hydroxide ions to shift the equilibrium of Equation 3.1 and resultin a pH change of the solution.
Biochemical processes occurring in cells and tissues depend on strict regula-tion of the hydrogen ion concentration. Natural acids and bases are often generatedin cells by normal biological processes and they must be neutralized by buffers.Biological pH is maintained at a constant value by naturally-occurring buffersystems such as phosphate. When biological processes are studied in vitro, artificialmedia must be prepared that mimic the cell’s natural environment. Because ofthe dependence of biochemical reactions on pH, the accurate determination ofhydrogen ion concentration has always been of major interest. Today, we considerthe measurement and control of pH to be a simple and rather mundane activity.However, an inaccurate pH measurement or a poor choice of buffer can lead to fail-ure in the biochemistry laboratory. You should become familiar with several aspectsof pH measurement, electrodes, and buffers. A table of commonly used acids andbases is shown in Appendix II.
Measurement of pH
A pH measurement is usually taken by immersing a glass or plastic combinationelectrode into a solution and reading the pH directly from a meter. At one time,pH measurements required two electrodes, a pH-dependent glass electrode sen-sitive to ions and a pH-independent calomel reference electrode. The poten-tial difference that develops between the two electrodes is measured as a voltage,as defined by Equation 3.2.
>> (Eq. 3.2)
where
A pH meter is standardized with buffer solutions of known pH before a meas-urement of an unknown solution is taken. It should be noted from Equation 3.2 thatthe voltage depends on temperature. Hence, pH meters must have some means fortemperature correction. Older instruments usually have a knob labeled “tempera-ture control,” which is adjusted by the user to the temperature of the measured so-lution. Newer pH meters automatically display a temperature-corrected pH value.
Using the pH Electrode
Most pH measurements today are obtained using a single combination electrode(Figure 3.1). Both the reference and the pH-dependent electrode are contained in
F = the Faraday constantT = the absolute temperatureR = the gas constant
Econstant = potential of reference electrodeV = voltage of the completed circuit
V = Econstant +2.303RTF
pH
H+
- log 3H+43H+4 = 3OH-4 = 10-7M;

Chapter 3 • General Laboratory Procedures 55
a single glass or plastic tube. Although these are more expensive than dualelectrodes, they are much more convenient to use, especially for smaller volumesof solution. Using a pH meter with a combination electrode is relatively easy, butcertain guidelines must be followed. A pH meter not in use is left in a “standby”position. Before use, check the level of saturated KCl in the electrode. If it is low,check with your instructor for the filling procedure. Turn the temperature control,if available, to the temperature of the standard calibration buffers and the test solu-tions. Be sure the function dial is set to pH. Lift the electrode out of the storagesolution, rinse it with distilled water from a wash bottle, and gently clean and drythe electrode with a tissue. Immerse the electrode in a standard buffer. Commonstandard buffers are pH 4, 7, and 10 with an accuracy of unit. Thestandard buffer should have a pH within two pH units of the expected pH of thetest solution. The bulb of the electrode must be completely covered with solution.Turn the pH meter to “on” or “read” and adjust the meter with the “calibrationdial” (sometimes called “intercept”) until the proper pH of the standard buffer isindicated on the dial. Turn the pH meter to the standby position. Remove the elec-trode and again rinse with distilled water and carefully blot dry with tissue.Immerse the electrode in a standard buffer of different pH and turn the pH meterto “read.” The dial should read within unit of the known value. If it doesnot, adjust to the proper pH and again check the first standard pH buffer. Clean theelectrode and immerse it in the test solution. Record the pH of the test solution.
As with all delicate equipment, the pH meter and electrode must receiveproper care and maintenance. All electrodes should be kept clean and stored in so-lutions suggested by manufacturers. Glass electrodes are fragile and expensive, so
;0.05 pH
;0.02 pH
1. Sensing membrane glass:
Performs actual measurement.
2. Reference junction: Acts as a
liquid-path electrical conductor.
3. Internal reference: Supplies a
constant equilibrium voltage.
4. pH internal element: Supplies a
voltage based on the pH value of
the sample.
5.
Plastic
body
Glass
body
4
3
2
1
5
5
4
3
2
1
Reference fill hole: Used to
replace the reference electrolyte
solution.
Electrodes are housed in either
plastic or an all-glass body configu-
ration. They can be either single
cells or, as shown in the diagram,
combined into one body for ease of
use. Regardless of the configura-
tion, there are several features com-
mon to all electrodes.
FIGURE 3.1 Thecombination pHelectrode.Courtesy of HannaInstruments; www.hannainst.com.

they must be handled with care. If pH measurements of protein solutions are oftentaken, a protein film may develop on the electrode; it can be removed by soakingin 5% pepsin in 0.1 M HCl for 2 hours and rinsing well with water. The pH instru-ment should always be set on “standby” when the electrode is not in a solution.
Measurements of pH are always susceptible to experimental errors. Somecommon problems are:
1. The Sodium Error Many glass combination electrodes are sensitive toas well as The sodium error can become quite significant at
high pH values, where may decrease the measured pH by0.4 to 0.5 unit. Several things may be done to reduce the sodium error.Some commercial suppliers of electrodes provide a standard curve forsodium error correction. Newer electrodes that are virtually imper-meable are now commercially available. If neither a standard curve nor asodium-insensitive electrode is available, potassium salts may be substi-tuted for sodium salts.
2. Concentration Effects The pH of a solution varies with the concentrationof buffer ions or other salts in the solution. This is because the pH of a solu-tion depends on the activity of an ionic species, not on the concentration.Activity, you may recall, is a thermodynamic term used to define species ina nonideal solution. At infinite dilution, the activity of a species is equiva-lent to its concentration. At finite dilutions, however, the activity of a soluteand its concentration are not equal.
It is common practice in biochemical laboratories to prepare concen-trated “stock” solutions and buffers. These are then diluted to the properconcentration when needed. Because of the concentration effects describedabove, it is important to adjust the pH of these solutions after dilution.
3. Temperature Effects The pH of a buffer solution is influenced by tempera-ture. This effect is due to a temperature-dependent change of the dissociationconstant of ions in solution. The pH of the commonly used buffer Trisis greatly affected by temperature changes, with a of Thismeans that a pH 7.0 Tris buffer made up at would have a pH of 5.95 at
The best way to avoid this problem is to prepare the buffer solution atthe temperature at which it will be used and to standardize the electrodewith buffers at the same temperature as the solution you wish to measure.
Biochemical Buffers
Buffer ions are used to maintain solutions at constant pH values. The selection ofa buffer for use in the investigation of a biochemical process is of critical impor-tance. Before the characteristics of a buffer system are discussed, we will reviewsome concepts in acid-base chemistry.
Weak acids and bases do not completely dissociate in solution, but exist asequilibrium mixtures (Equation 3.3).
>> (Eq. 3.3)
HA represents a weak acid and represents its conjugate base; repre-sents the rate constant for dissociation of the acid and the rate constant fork2
k1A-
HA Δk1
k2H+ + A-
37°C.4°C
-0.031.¢pKa>C°1pKa2
Na+
0.1MNa+H+.Na+
56 Chapter 3 • General Laboratory Procedures

Chapter 3 • General Laboratory Procedures 57
association of the conjugate base and hydrogen ion. The equilibrium constant,for the weak acid HA is defined by Equation 3.4.
>> (Eq. 3.4)
which can be rearranged to define (Equation 3.5).
>> (Eq. 3.5)
The is often reported as pH, which is In a similar fashion,is represented by Equation 3.5 can be converted to the form
by substituting pH and
>> (Eq. 3.6)
Equation 3.6 is the familiar Henderson-Hasselbalch equation, which defines therelationship between pH and the ratio of acid and conjugate base concentrations.The salt of the acid is also referred to as the proton acceptor (A) and the acid(HA) as the proton donor (D). The Henderson-Hasselbalch equation is of greatvalue in buffer chemistry because it can be used to calculate the pH of a solution ifthe molar ratio of buffer ions and the of HA are known. Also, themolar ratio of HA to that is necessary to prepare a buffer solution at a specific pHcan be calculated if the is known.
A solution containing both HA and has the capacity to resist changes inpH; i.e., it acts as a buffer. If acid were added to the buffer solution, itwould be neutralized by in solution:
>> (Eq. 3.7)
Base added to the buffer solution would be neutralized by reaction with HA:
>> (Eq. 3.8)
The most effective buffering system contains equal concentrations of the acid, HA,and its conjugate base, According to the Henderson-Hasselbalch equation (3.6),when is equal to [HA], pH equals Therefore, the of a weak acid-basesystem represents the center of the buffering region. The effective range of a buffersystem is generally two pH units, centered at the value (Equation 3.9).
>> (Eq. 3.9)
Selection of a Biochemical Buffer
Virtually all biochemical investigations must be carried out in buffered aqueoussolutions. The natural environment of biomolecules and cellular organelles is understrict pH control. When these components are extracted from cells, they are moststable if maintained in their normal pH range, usually 6 to 8. An artificial buffersystem is found to be the best substitute for the natural cell milieu. It should also berecognized that many biochemical processes (especially some enzyme processes)produce or consume hydrogen ions. The buffer system neutralizes these solutionsand maintains a constant chemical environment.
Effective pH range for a buffer = pKa ; 1
pKa
pKapKa.3A-4 A-.
OH- + HA ¡ A- + H2O
1OH-2H+ + A- ¡ HA
A-1H+2A
-pKa
A-pKa13A-4>3HA42
1A-2
pH = pKa + log3A-43HA4
pKa:- logpKa.- log Ka
- log 3H+4.3H+43H+4 =
Ka3HA43A-4
3H+4Ka =
k1k2
=3H+43A-43HA4
Ka,

Although most biochemical solutions require buffer systems effective in thepH range 6 to 8, there is occasionally a need for buffering over the pH range 2 to 12.Obviously, no single acid–conjugate base pair will be effective over this entirerange, but several buffer systems are available that may be used in discrete pHranges. Figure 3.2 compares the effective buffering ranges of common biologicalbuffers. It should be noted that some buffers (phosphate, succinate, and citrate)have more than one value, so they may be used in different pH regions. Manybuffer systems are effective in the usual biological pH range (6 to 8); however, theremay be major problems in their use. Several characteristics of a buffer must beconsidered before a final selection is made. The molecular weights and pK valuesof several common buffer compounds are listed in Appendix III. Following is adiscussion of the advantages and disadvantages of the commonly used buffers.
Phosphate Buffers
The phosphates are among the widely used buffers. These solutions have a highbuffering capacity and are very useful in the pH range 6.5 to 7.5. Because phos-phate is a natural constituent of cells and biological fluids, its presence affords amore “natural” environment than many buffers. Sodium or potassium phos-phate solutions of all concentrations are commonly prepared with the use of theHenderson-Hasselbalch equation. The major disadvantages of phosphate solu-tions are: (1) precipitation or binding of common biological cations ( and
), (2) inhibition of some biological processes, including some enzymes,and (3) limited useful pH range.Mg2+
Ca2+
pKa
58 Chapter 3 • General Laboratory Procedures
Phosphate Phosphate Phosphate
0 1 2 3 4 5 6 7 8 9 10 11 12
pH
Citrate Citrate
Succinate
Acetate
Formate
Borate
Tris
Imidazole
MES CAPS
HEPES
Histidine Glycine
Bis-Tris
Bicine
FIGURE 3.2Effective bufferingranges of severalcommon buffers.See Table 3.1 forabbreviations.

Chapter 3 • General Laboratory Procedures 59
STUDY EXERCISE 3.1 Henderson-Hasselbalch Equation
Here we will describe the calculation method for preparation of a sodium phosphatebuffer of 0.05 M total phosphate concentration, pH of 7.0, and a total, final volume of 1liter. The Henderson-Hasselbalch equation (Equation 3.6) will be used to calculate theconjugate acid and conjugate base concentrations. At pH 7.0, the two forms of phos-phate present are:
We now use the Henderson-Hasselbalch equation with and (fromAppendix III) to calculate the molar ratio:
This gives only one equation, but two unknowns, the concentrations of A and D; there-fore, we need another quantitative relationship between [A] and [D]. We know that thetotal phosphate concentration is 0.05 M, so:
Using these two equations for A and D, we determine that we need 0.031 mole ofD and 0.019 mole of A. The appropriate phosphate reagent forms available commer-cially are:
monobasic sodium phosphate monohydrate, mole.
dibasic sodium phosphate heptahydrate, mole.
Converting the number of moles of each reagent to grams:
To prepare the solution, dissolve the appropriate amount of each reagent in about975 mL of purified water in a 1-liter beaker. Check the pH of the solution and adjust to7.0 by careful, dropwise addition (with stirring) of dilute NaOH or dilute phosphoricacid. Transfer the solution to a 1-liter volumetric flask, add water to the mark, mix well,and do a final check of the pH.
grams of A = 0.019 * 268 = 5.09 g
grams of D = 0.031 * 138 = 4.28 g
0.0191MW = 2682;Na2HPO4•7H2OA � acceptor:
1MW = 1382; 0.031NaH2PO4•H2OD � donor:
3A4 + 3D4 = 0.05
13A4 + 3D42
3A4>3D4 = 0.62
pK = 7.21pH = 7.0
HO
O
OH
O–Na+P
Proton donor (D)
HO
O
O–Na+
O–Na+ H++P
Proton acceptor (A)
Zwitterionic Buffers (Good’s Buffers)
In the mid-1960s, N. E. Good and his colleagues recognized the need for aset of buffers specifically designed for biochemical studies (Good andIzawa, 1972). He and others noted major disadvantages of the established
60 Chapter 3 • General Laboratory Procedures
STUDY EXERCISE 3.2 Buffer Made by Titration
We will illustrate the preparation of a Tris buffer using the titration method. (In StudyExercise 3.1, we used the calculation method to prepare the phosphate buffer.) BecauseTris is commercially available in highly purified crystals, Tris Base the ap-propriate amount may be weighed, dissolved in water, and titrated to the desired pH withan acid, usually HCl. For 1 liter of 0.1 M Tris-HCl buffer, pH 7.0, dissolve 12.11 g (0.1 mole)of Tris Base in about 975 mL of purified water in a 1-liter beaker. Adjust the pH (originallyabout 10) to 7.0 by careful, dropwise addition of concentrated hydrochloric acid. Thisshould be done in a 1-liter beaker with gentle stirring. Transfer the solution to a 1-liter vol-umetric flask, add water to the mark, mix well, and make a final check of the pH.
As you can see by comparing the two procedures, the titration method for bufferpreparation is faster and much more convenient than the calculation method. Is itpossible to prepare the phosphate buffer in Study Exercise 3.1 by using the titrationmethod? If so, describe the reagent(s) needed and the procedure you would use.
1MW = 121.12,
buffer systems. Good outlined several characteristics essential in a biologicalbuffer system:
1. between 6 and 8.2. Highly soluble in aqueous systems.3. Exclusion or minimal transport by biological membranes.4. Minimal salt effects.5. Minimal effects on dissociation due to ionic composition, concentration,
and temperature.6. Buffer–metal ion complexes nonexistent or soluble and well defined.7. Chemically stable.8. Insignificant light absorption in the ultraviolet and visible regions.9. Readily available in purified form.
Good investigated a large number of synthetic zwitterionic buffers and foundmany of them to meet these criteria. Table 3.1 lists several of these buffers and theirproperties. Good’s buffers are widely used, but their main disadvantage is high cost.Some zwitterionic buffers, such as Tris, HEPES, and PIPES, have been shown toproduce radicals under a variety of experimental conditions, so they should beavoided if biological redox processes or radical-based reactions are being studied.Radicals are not produced from MES or MOPS buffers.
The use of the synthetic zwitterionic buffer Tris [Tris(hydroxymethyl)-aminomethane] is now probably greater than that of phosphate. It is useful in thepH range 7.5 to 8.5. Tris is available in a basic form as highly purified crystals,which makes buffer preparation especially convenient. Although Tris is a primaryamine, it causes minimal interference with biochemical processes and does notprecipitate calcium ions. However, Tris has several disadvantages, including:(1) pH dependence on concentration, since the pH decreases 0.1 pH unit foreach 10-fold dilution; (2) interference with some pH electrodes; and (3) a large
compared to most other buffers. Most of these drawbacks can be mini-mized by: (1) adjusting the pH after dilution to the appropriate concentration,(2) purchasing electrodes that are compatible with Tris, and (3) preparing thebuffer at the temperature at which it will be used.
¢pKa>C°
pKa

TABLE 3.1 Structures and Properties of Several Synthetic Zwitterionic Buffers
Buffer Name AbbreviationStructure (All structures
shown in salt form) pKa 120°C2Useful
pHRange ≤pKa/C°
Concentrationof a Saturated
Solution1M, 0°C2
N-2-Acetamido-2-amino-ethanesulfonicacid
ACESH2NCOCH2N
+H2CH2CH2SO-
36.9 6.4–7.4 -0.020 0.22
N-2-Acetamidoiminodiaceticacid
ADA CH2COO–
CH2COO–
H2NCOCH
2NH
+6.6 6.2–7.2 -0.011 —
N,N-Bis(2-hydroxyethyl)-2-aminoethanesulfonicacid
BES 1HOCH2CH222N+HCH2CH2SO-
37.15 6.6–7.6 -0.016 3.2
N,N-Bis(2-hydroxyethyl)-glycine
Bicine 1HOCH2CH222N+HCH2COO- 8.35 7.5–9.0 -0.018 1.1
3-(Cyclohexylamino)-propanesulfonic acid
CAPSNHCH
2CH
2CH
2SO
3–
10.4 10.0–11.0 -0.009 0.85
Cyclohexylaminoethane-sulfonic acid
CHESNHCH
2CH
2SO
3–
9.5 9.0–10.0 -0.009 0.85
Glycylglycine Gly-GlyH3N
+CH2CONHCH2COO- 8.4 7.5–9.5 -0.028 1.1
N-2-Hydroxyethyl-piperazine- -2-ethanesulfonic acid
N¿HEPES
HO(CH2)2N NCH
2CH
2SO
3–
7.55 7.0–8.0 -0.014 2.25
2-(N-Morpholino)ethane-sulfonic acid
MESO NHCH
2CH
2SO
3–
+ 6.15 5.8–6.5 -0.011 0.65
(continued)
61

TABLE 3.1 Structures and Properties of Several Synthetic Zwitterionic Buffers
Buffer Name AbbreviationStructure (All structures shown
in salt form) pKa 120°C2Useful
pHRange ≤pKa/C°
Concentrationof a Saturated
Solution1M, 0°C2
3-(N-Morpholino)-propanesulfonic acid
MOPSO NHCH
2CH
2CH
2SO
3–
+ 7.20 6.5–7.9 — —
Piperazine- -bis-2-ethanesulfonic acid
N,N¿ PIPES–O
2SCH
2CH
2N NHCH
2CH
2SO
3–
+ 6.8 6.4–7.2 -0.0085 —
N-Tris(hydroxymethyl)-methyl-2-aminoethane-sulfonic acid
TES 1HOCH223N+HCH2CH2SO-3 7.5 7.0–8.0 -0.020 2.6
N-Tris(hydroxymethyl)-methylglycine
Tricine 1HOCH223CN+H2CH2CH2COO- 8.15 7.5–8.5 -0.021 0.8
Tris(hydroxymethyl)-aminomethane
Tris 1HOCH223CN+H3 8.3 7.5–9.0 -0.031 2.4
62
(continued )

Chapter 3 • General Laboratory Procedures 63
Carboxylic Acid Buffers
The most widely used buffers in this category are acetate, formate, citrate, andsuccinate. This group is useful in the pH range 3 to 6, a region that offers fewother buffer choices. All of these acids are natural metabolites, so they may inter-fere with the biological processes under investigation. Also, citrate and succinatemay interfere by binding metal ions ( etc.). Formatebuffers are especially useful because they are volatile and can be removed byevaporation under reduced pressure.
Borate Buffers
Buffers of boric acid are useful in the pH range 8.5 to 10. Borate has the major dis-advantage of complex formation with many metabolites, especially carbohydrates.
Amino Acid Buffers
The most commonly used amino acid buffers are glycine (pH 2 to 3 and 9.5 to10.5), histidine (pH 5.5 to 6.5), glycine amide (pH 7.8 to 8.8), and glycylglycine(pH 8 to 9). These provide a more “natural” environment similar to cellularcomponents and extracts; however, they may interfere with some biologicalprocesses, as do the carboxylic acid and phosphate buffers.
Buffer Dilutions
In biochemistry lab activities, buffers of many different concentrations and volumesare required. It is usually not practical, economical, or convenient to prepare allneeded buffers from scratch. However, it is possible to have available a few con-centrated stock buffer solutions that may be diluted to produce a new buffer solu-tion of desired concentration and amount.
Dilutions are usually defined in the following way: A dilution of 1 mL to10 mL (also 1:10; or 1 to 10) means that you take 1 mL of stock solution and addwater to a final total volume of 10 mL. It is important to note that the amount ofthe buffer components taken from the stock solution is equal to the amount ofbuffer components in the diluted solution. However, the concentration of thebuffer components has been changed. If the stock solution above had a bufferconcentration of 0.5 M, then the 1:10 diluted solution has a buffer concentrationof 0.05 M.
Two kinds of dilutions, linear and serial, are used most often in biochemistry.
• Linear dilutions Table 3.2 shows the results of a linear dilution processin which a stock solution of 1 M is used to produce samples of differentconcentrations. Note that there is a linear (progressive) decrease in theconcentration of the diluted samples, but the final volumes remain thesame (10 mL). The volume of stock solution to use in each case is calculatedfrom the following relationship:
volume 1stock2 =volume 1diluted2 * concentration 1diluted2
concentration 1stock2
Fe3+ , Ca2+ , Zn2+ , Mg2+ ,

64 Chapter 3 • General Laboratory Procedures
Sample calculation for the first diluted solution in Table 3.2:
• Serial dilutions Here dilution starts with a stock buffer solution and theneach diluted solution produced is used to prepare the next, etc. For example:
2.0 mL of Solution I is diluted to a final volume of 100 mL (Solution II)2.0 mL of Solution II is diluted to a final volume of 100 mL (Solution III)2.0 mL of Solution III is diluted to a final volume of 100 mL (Solution IV)
If Solution I has a buffer concentration of 10 M and water is used for dilu-tion in each case, what is the buffer concentration of Solution II?
The equation above for linear dilution may also be used here:
For Solution II: concentration 1diluted2 =2.0 mL * 10M
100 mL= 0.2M
volume 1stock2 =10 mL * 0.80M
1.0M= 8.0 mL
TABLE 3.2 Example of a Linear Dilution Process
Stock (M) Final dilution (M) Stock (mL) Water (mL)* Final volume (mL)
1.0 0.80 8.0 2.0 10
1.0 0.60 6.0 4.0 10
1.0 0.40 4.0 6.0 10
1.0 0.20 2.0 8.0 10
1.0 0.00 0.0 10.0 10
*Because all solutions are not additive, this number is the approximate amount of water needed to bring thefinal volume to 10 mL. It may be necessary to add a few drops of water to bring the final volume to 10 mL.
STUDY EXERCISE 3.3 Serial Dilutions
What are the concentrations of Solutions III and IV made from the above serial dilution?
The Oxygen Electrode
Second in popularity only to the pH electrode is the oxygen electrode. This de-vice is a polarographic electrode system that can be used to measure oxygen con-centration in a liquid sample or to monitor oxygen uptake or evolution by achemical or biological system.
The basic electrode was developed by L. C. Clark, Jr. in 1953. The popularClark-type oxygen electrode with biological oxygen monitor is shown in Figure 3.3.The electrode system, which consists of a platinum cathode and silver anodes,is molded into an epoxy block and surrounded by a Lucite holder. A thin Teflonmembrane is stretched over the electrode end of the probe and held in place with anO-ring. The membrane separates the electrode elements, which are bathed in an

Chapter 3 • General Laboratory Procedures 65
electrolyte solution (saturated KCl), from the test solution in the sample chamber.The membrane is permeable to oxygen and other gases, which then come intocontact with the surface of the platinum cathode. If a suitable polarizing voltage(about 0.8 volt) is applied across the cell, oxygen is reduced at the cathode.
The reaction occurring at the anode is
The overall electrochemical process is
The current flowing through the electrode system is, therefore, directly pro-portional to the amount of oxygen passing through the membrane. According to thelaws of diffusion, the rate of oxygen flowing through the membrane depends onthe concentration of dissolved oxygen in the sample. Therefore, the magnitude ofthe current flow in the electrode is directly related to the concentration of dissolvedoxygen. The function of the electrode can also be explained in terms of oxygen pres-sure. The oxygen concentration at the cathode (inside the membrane) is virtuallyzero because oxygen is rapidly reduced. Oxygen pressure in the sample chamber(outside the membrane) will force oxygen to diffuse through the membrane at a ratethat is directly proportional to the pressure (or concentration) of oxygen in the testsolution. The current generated by the electrode system is electronically amplifiedand transmitted to a meter, which usually reads in units of % oxygen saturation.
Many biochemical processes consume or evolve oxygen. The oxygen elec-trode is especially useful for monitoring such changes in the concentrationof dissolved oxygen. If oxygen is consumed, for example, by a suspension of
4Ag° + O2 + 4Cl- + 2H2O ¡ 4AgCl + 4OH-
4Ag° + 4Cl- ¡ 4AgCl + 4e-
Total O2 + 4e- + 2H2O ¡ 4OH-3H2O24 + 2e- ¡ 2OH-O2 + 2e- + 2H2O ¡ 3H2O24 + 2OH-
FIGURE 3.3Biological oxygenmonitor, YSIModel 5300A.Courtesy of YSILife Sciences;www.ysi.com.

66 Chapter 3 • General Laboratory Procedures
mitochondria or by an oxygenase enzyme system, the rate of oxygen diffusionthrough the probe membrane will decrease, leading to less current flow. A linearrelationship exists between the electrode current and the amount of oxygen con-sumed by the biological system.
The use of an oxygen electrode is not free of experimental and proceduralproblems. Probably the most significant source of trouble is the Teflon mem-brane. A torn, damaged, or dirty membrane is easily recognized by recordernoise or electronic “spiking.” Temperature control of the sample chamber andelectrode is essential because the rate of oxygen diffusion through the membraneis temperature dependent. The sample chamber is equipped with a bath assem-bly for temperature regulation and magnetic stirrer in order to maintain a con-stant oxygen concentration throughout the solution. Air bubbles in the samplechamber lead to considerable error in measurements and must be removed.
Biosensors
Electrodes or electrode-like devices are currently being developed for thespecific measurement of physiologically important molecules such as urea, car-bohydrates, enzymes, antibodies, and metabolic products. This type of device,now referred to as a biosensor, is an analytical tool or system consisting ofan immobilized biological material (such as an enzyme, antibody, whole cell,organelle, or combinations thereof) in intimate contact with a suitable trans-ducer device that will convert the biochemical signal into a quantifiable electricsignal. The important components of a biosensor as shown in Figure 3.4 are:(1) a reaction center consisting of a membrane or gel containing the biochemi-cal system to be studied, (2) a transducer, (3) an amplifier, and (4) a computersystem for data acquisition and processing. When biomolecules in the reactioncenter interact, a physicochemical change occurs. This change in the molecularsystem, which may be a modification of concentration, absorbance, mass,conductance, or redox state, is converted into an electrical signal by the trans-ducer. The signal is then amplified and displayed on a computer screen. Eachbiosensor is specifically designed for a particular type of molecule or biological
Reaction center
Transducer
Amplifier
Signal
Computer for
data processing
Keyboard
A B
FIGURE 3.4Components of abiosensor systemfor determining theidentity andconcentration ofbiomolecule A. A isstoichiometricallyconverted to B by aspecific enzyme inthe reaction center.The concentrationof B is measured bythe sensor.

Chapter 3 • General Laboratory Procedures 67
interaction; therefore, details of construction and function vary. Some specificexamples of biosensors include:
1. Electrodes based on enzyme activity. These are selective and sensitive devicesthat may be used to measure substrate concentrations. A biosensor based onglucose oxidase is used to measure the concentration of glucose by detectingthe production of
2. Optical biosensors that respond to the absorption of light from a laser. Theoptical response is transmitted to a computer by a fiber-optic system.
B. MEASUREMENT OF PROTEIN SOLUTIONS
Biochemical research often requires the quantitative measurement of proteinconcentrations in solutions. Several techniques for such measurement have beendeveloped; however, most have limitations because either they are not sensitiveenough or they are based on reactions with specific amino acids in the protein.Since the amino acid content varies from protein to protein, no single assay willbe suitable for all proteins. In this section, we discuss five assays: three older,classical methods that are occasionally used today and two other methods thatare widely used. In four of the methods, chemical reagents are added to proteinsolutions to develop a color whose intensity is measured in a spectrophotometer.A “standard protein” of known concentration is also treated with the samereagents and a calibration curve is constructed. The other assay relies on a directspectrophotometric measurement. None of the methods is perfect because eachis dependent on the amino acid content of the protein. However, each will pro-vide a satisfactory result if the proper experimental conditions are used and/or asuitable standard protein is chosen. Other important factors in method selectioninclude the sensitivity and accuracy desired, the presence of interfering sub-stances, and the time available for the assay. The various methods are comparedin Table 3.3.
The Biuret and Lowry Assays
When substances containing two or more peptide bonds react with the biuretreagent, alkaline copper sulfate, a purple complex is formed. The colored prod-uct is the result of coordination of peptide nitrogen atoms with Theamount of product formed depends on the concentration of protein.
In practice, a calibration curve must be prepared by using a standardprotein solution. The very best protein to use as a standard is a purified prepa-ration of the protein to be assayed. Since this is rarely available, the experi-menter must choose another protein as a relative standard. A relative standardmust be selected that provides a similar color yield. An aqueous solution ofbovine serum albumin (BSA) is a commonly used standard. Various knownamounts of this solution are treated with the biuret reagent, and the color isallowed to develop. Measurements of absorbance at 540 nm are madeagainst a blank containing biuret reagent and buffer or water. The dataA540
1A5402
Cu2+ .
Glucose + O2 Δ gluconic acid + H2O2
H2O2.

68 Chapter 3 • General Laboratory Procedures
TABLE 3.3 Methods for Protein Measurement
Method Sensitivity Time Principle Interferences Comments
Biuret Low 1–20 mg Moderate20–30 min
Peptide bonds alkalinepurple complex
Cu2+ :+ Zwitterionic
buffers, someamino acids
Similar color with allproteins. Destructiveto protein samples.
Lowry High ~5 mg Slow40–60 min
(1) Biuret reaction (2) Reduction ofphosphomolybdate-phosphotungstateby Tyr and Trp
Ammoniumsulfate, glycine,zwitterionicbuffers,mercaptans
Time-consuming.Intensity of colorvaries with proteins.Critical timing ofprocedure.Destructive to proteinsamples.
Bradford High ~1 mg Rapid 15min
of Coomassiedye shifts from 465nm to 595 nmwhen protein-bound
lmax Strongly basicbuffers;detergents TritonX-100, SDS
Stable color thatvaries with proteins.Reagentscommerciallyavailable. Destructiveto protein samples.Discoloration ofglassware.
BCA High 1 mg Slow 60min
(1) Biuret reaction(2) Copper complexwith BCA;lmax = 562 nm
EDTA, DTT,ammoniumsulfate
Compatible withdetergents. Reagentscommerciallyavailable. Destructiveto protein samples.
Spectro-photometric1A2802
Moderate50 - 1000 mg
Rapid5–10 min
Absorption of 280-nm light byaromatic residues
Purines,pyrimidines,nucleic acids
Useful formonitoring columneluents. Nucleic acidabsorption can becorrected.Nondestructive toprotein samples.Varies with proteins.
are plotted versus protein concentration (mg/mL) or amount of protein (mg).Unknown protein samples are treated with biuret reagent and the ismeasured after color development. The protein concentration is determinedfrom the standard curve. The biuret assay has several advantages, includingspeed, similar color development with different proteins, and few interferingsubstances. Its primary disadvantage is its lack of sensitivity.
The Lowry protein assay is one of the more sensitive assays and has beenwidely used. The Lowry procedure can detect protein levels as low as Theprinciple behind color development is identical to that of the biuret assay exceptthat a second reagent (Folin-Ciocalteu) is added to increase the amount of color de-velopment. Two reactions account for the intense blue color that develops: (1) thecoordination of peptide bonds with alkaline copper (biuret reaction), and (2) thereduction of the Folin-Ciocalteu reagent (phosphomolybdate-phosphotungstate)
5 mg.
A540

Chapter 3 • General Laboratory Procedures 69
by tyrosine and tryptophan residues in the protein. The procedure is similar to thatof the biuret assay. A standard curve is prepared with bovine serum albumin orother pure protein, and the concentration of unknown protein solutions is deter-mined from the graph.
The obvious advantage of the Lowry assay is its sensitivity, which is up to100 times greater than that of the biuret assay; however, more time is required forthe Lowry assay. Since proteins have varying contents of tyrosine and trypto-phan, the amount of color development changes with different proteins, includ-ing the bovine serum albumin standard. Because of this, the Lowry protein assayshould be used only for measuring changes in protein concentration, not ab-solute values of protein concentration.
The Bradford Assay
The many limitations of the biuret and Lowry assays have encouraged researchersto seek better methods for quantitation of protein solutions. The Bradford assay,based on protein binding of a dye, provides numerous advantages over othermethods. The binding of Coomassie Brilliant Blue dye (Figure 3.5) to protein inacidic solution causes a shift in wavelengh of maximum absorption of thedye from 465 nm to 595 nm. The absorption at 595 nm is directly related to the con-centration of protein. The dye reagent interacts primarily with positively-charged(basic) amino acid residues (arginyl, lysyl, and histidyl) in proteins. In addition,there are probably weaker interactions between the dye molecules and hydropho-bic, aromatic amino acid residues (tyrosinyl, phenylalanyl, and tryptophanyl).Proteins that have more than an average number of these interacting residuesshow higher sensitivity and thus higher absorbance values at 595 nm.
In practice, a calibration curve is prepared by plotting of standard proteinversus absorbance at 595 nm, which is then used to estimate the amount of proteinin unknown samples (Figure 3.6). Recommended standard proteins include bovinegamma globulin (IgG), lysozyme, and ovalbumin because they have closer to theaverage or typical number of amino acid residues that bind the dye (see above).Although BSA is often recommended in the literature, it is not a good choice for astandard for the Bradford assay, as it has a high content of reacting amino acidresidues. The 595 nm absorbance of BSA is about 2.1 times that of IgG (Figure 3.6).
The assay requires only a single reagent, an acidic solution of CoomassieBrilliant Blue G-250. After addition of dye solution to a protein sample, color
mg
1lmax2
FIGURE 3.5Coomassie BrilliantBlue G-250 dye isused to measureproteinconcentration inthe Bradford assay.
CH2CH
3
CCH3CH
2O NH
CH3
CH3
NCH2
CH2CH
3
NCH2
+
SO3Na
SO3-
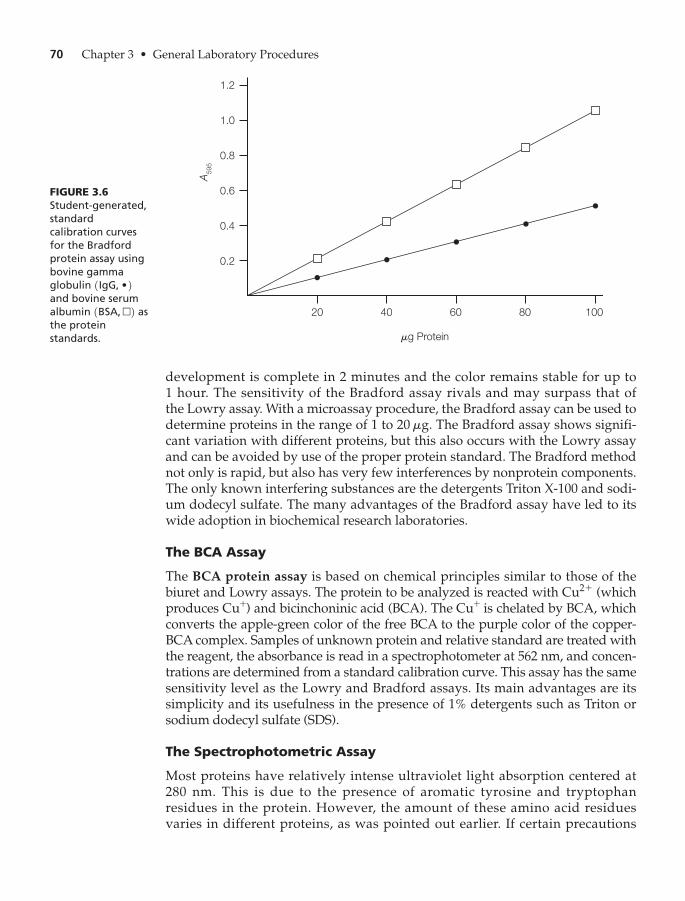
70 Chapter 3 • General Laboratory Procedures
development is complete in 2 minutes and the color remains stable for up to1 hour. The sensitivity of the Bradford assay rivals and may surpass that ofthe Lowry assay. With a microassay procedure, the Bradford assay can be used todetermine proteins in the range of 1 to The Bradford assay shows signifi-cant variation with different proteins, but this also occurs with the Lowry assayand can be avoided by use of the proper protein standard. The Bradford methodnot only is rapid, but also has very few interferences by nonprotein components.The only known interfering substances are the detergents Triton X-100 and sodi-um dodecyl sulfate. The many advantages of the Bradford assay have led to itswide adoption in biochemical research laboratories.
The BCA Assay
The BCA protein assay is based on chemical principles similar to those of thebiuret and Lowry assays. The protein to be analyzed is reacted with (whichproduces ) and bicinchoninic acid (BCA). The is chelated by BCA, whichconverts the apple-green color of the free BCA to the purple color of the copper-BCA complex. Samples of unknown protein and relative standard are treated withthe reagent, the absorbance is read in a spectrophotometer at 562 nm, and concen-trations are determined from a standard calibration curve. This assay has the samesensitivity level as the Lowry and Bradford assays. Its main advantages are itssimplicity and its usefulness in the presence of 1% detergents such as Triton orsodium dodecyl sulfate (SDS).
The Spectrophotometric Assay
Most proteins have relatively intense ultraviolet light absorption centered at280 nm. This is due to the presence of aromatic tyrosine and tryptophanresidues in the protein. However, the amount of these amino acid residuesvaries in different proteins, as was pointed out earlier. If certain precautions
Cu+Cu+Cu2+
20 mg.
20
1.2
1.0
0.8
0.6
0.4
0.2
40 60 80 100
A5
95
μg Protein
FIGURE 3.6Student-generated,standardcalibration curvesfor the Bradfordprotein assay usingbovine gammaglobulinand bovine serumalbumin asthe proteinstandards.
1BSA, n21IgG, •2

Chapter 3 • General Laboratory Procedures 71
are taken, the value of a protein solution is proportional to the proteinconcentration. In practice, the procedure is simple and rapid. A protein solu-tion is transferred to a quartz cuvette and the is read against a referencecuvette containing the protein solvent only (buffer, water, etc.). For the averageprotein, a concentration of 1 mg/mL will yield an absorbance at 280 nm ofabout 1. If the extinction coefficient is known for the protein, its exact concen-tration may be calculated from the absorbance at 280 nm.
Cellular extracts contain many other compounds that absorb in the vicin-ity of 280 nm. Nucleic acids, which can be common contaminants in a proteinextract, absorb strongly at 280 nm Early researchers developeda method to correct for this interference by nucleic acids. Mixtures of pureprotein and pure nucleic acid were prepared, and the ratio wasexperimentally determined. The following empirical equation may be usedfor protein solutions containing up to 20% nucleic acids.
Although the spectrophotometric assay of proteins is fast, relatively sensi-tive, and requires only a small sample size, it is still only an estimate of proteinconcentration unless its extinction coefficient is known. It has certain advantagesover the colorimetric assays in that most buffers and ammonium sulfate donot interfere and the procedure is nondestructive to protein samples. Thespectrophotometric assay is particularly suited to the rapid and continuousmeasurement of protein elution from a chromatography column, where onlyprotein concentration changes are required.
C. MEASUREMENT OF NUCLEIC ACID SOLUTIONS
The Spectrophotometric Assay
Solutions of nucleic acids strongly absorb ultraviolet light with a of 260 nm.The intense absorption is due primarily to the presence of aromatic rings in thepurine and pyrimidine bases. The concentration of nucleic acid in a solution canbe calculated if one knows the value of of the solution. A solution of double-stranded DNA at a concentration of in a 1-cm quartz cuvette will givean reading of about 1.0. A solution of single-stranded DNA or RNA that hasan of 1.0 in a cuvette with a 1-cm path length has a concentration of about
The spectrophotometric assay for nucleic acids is simple, rapid, nonde-structive, and very sensitive; however, it should be noted that it measures bothDNA and RNA. The minimum concentration of nucleic acid that can be accu-rately determined is
Measuring the ultraviolet absorption of DNA and RNA solutions can alsoprovide a useful structural probe and an indication of purity. DNA structuralchanges such as helix unwinding may be detected by measuring absorbancechanges of DNA solutions at 260 nm. The ratio of is often used as arelative measure of the purity of nucleic acid solutions. Pure DNA with little orno protein present has an absorbance ratio of about 1.8. Pure RNA has a ratio of
A260>A280
2.5–5.0 mg>mL.
40 mmg>mL.A260
A260
50 mmg>mLA260
lmax
Protein concentration 1mg>mL2 = 1.55A280 - 0.76A260
A280>A260
1lmax = 2602.
A280
A280

72 Chapter 3 • General Laboratory Procedures
about 2. Absorbance ratios less then these numbers indicate contamination ofthe solution by protein material.
Other Assays for Nucleic Acids
The spectrophotometric assay for nucleic acids, DNA and RNA, is simple andrapid, but it does not have a sufficient level of sensitivity for many applications.Other assays for DNA and RNA depend on the enhanced fluorescence of dyeswhen bound to nucleic acids. Features of fluorescence assays are compared tothe spectrophotometric assay in Table 3.4.
The fluorescence dye bisbenzimidazole, when bound to DNA, emits lightat 458 nm that is about five times greater in intensity than the emission by free,unbound dye. The increase in fluorescence is linear with increasing amounts ofDNA in the concentration range of to One special advan-tage of this assay is that it can be used to quantify DNA in cell suspensions andcrude homogenates. It does not respond to RNA or other biomolecules in the ex-tracts. The assay is fast and requires only a fluorimeter, an instrument found inmost laboratories.
5 mg>mL.0.01 mg>mL
TABLE 3.4 Measurement of Nucleic Acid Solutions
Method Sensitivity Time Principle Interferences Comments
Spectro-photometric1A2602
High 2.5 mg Rapid5–10 min
Absorption of260 nm light byaromatic bases
Proteins Protein absorption maybe corrected. indicates purity.Nondestructive. Measuresboth DNA and RNA.
A280>A260
Bisbenzimidazole Very high10 ng
Rapid5–10 min
Enhancementof fluorescenceof dye whenbound to DNA
None known Not reliable withplasmids or small DNA.Does not measure RNA.May be used with crudeextracts. Nondestructive.
EtBr-Agarose Very high1–10 ng
Moderate30–45 min
Fluorescence ofbound EtBr
None known Measures DNA and RNA.
STUDY EXERCISE 3.4 Nucleic Acid Concentrations
Two solutions, one of double-stranded DNA and one of single-stranded RNA, weretransferred to 1-cm quartz cuvettes and the absorbance (A) at 260 nm of each of the so-lutions was found to be 0.15. What are the concentrations of the DNA and RNA solu-tions? Hint: Recall that a standard solution of double-stranded DNA at a concentrationof in a 1-cm quartz cuvette will yield an reading of about 1.0. A solutionof single-stranded DNA or RNA that has an of 1.0 in a cuvette with a 1-cm pathlength has a concentration of about 40 mg >mL.
A260
A26050 mg >mL

Chapter 3 • General Laboratory Procedures 73
Another simple and relatively inexpensive fluorescence method usesethidium bromide–agarose plates. The fluorescence emission of ethidium bro-mide (EtBr) at 590 nm is enhanced about 25-fold when the dye interacts withDNA. DNA samples for measurement are spotted onto 1% agarose containing(EtBr) in a Petri dish or spot plates. The samples are exposed to UV light andphotographed, and the light intensity is compared to standard samples ofDNA. This method is sensitive (in the 1–10 ng range), but it detects both DNAand RNA.
D. TECHNIQUES FOR SAMPLE PREPARATION
Dialysis
One of the oldest procedures applied to the purification and characterization ofbiomolecules is dialysis, an operation used to separate dissolved molecules on thebasis of their molecular size. The technique involves sealing an aqueous solutioncontaining both macromolecules and small molecules in a porous membrane.The sealed membrane is placed in a large container of low-ionic-strength buffer.The membrane pores are too small to allow diffusion of macromolecules of molec-ular weight greater than about 10,000. Smaller molecules diffuse freely throughthe openings (Figure 3.7). The passage of smaller molecules continues until theirconcentrations inside the dialysis tubing and outside in the large volume of bufferare equal. Thus, the concentration of small molecules inside the membrane isreduced. Equilibrium is volume dependent and is reached after 4 to 6 hours.Of course, if the outside solution (dialysate) is replaced with fresh buffer after equi-librium is reached, the concentration of small molecules inside the membrane willbe further reduced by continued dialysis.
Dialysis membranes are available in a variety of materials and sizes. Themost common materials are collodion, cellophane, and cellulose. Recent
Membrane
Inside Outside
FIGURE 3.7Diffusion of smallermolecules throughdialysis membranepores.
74 Chapter 3 • General Laboratory Procedures
modifications in membrane construction make a range of pore sizes available.Spectrum Laboratories offers Spectra/Por membrane tubing with completemolecular weight cutoffs ranging from 100 to 300,000.
Dialysis is most commonly used to remove salts and other small moleculesfrom solutions of macromolecules. During the separation and purification ofbiomolecules, small molecules are added to selectively precipitate or dissolvethe desired molecule. For example, proteins are often precipitated by addition oforganic solvents or salts such as ammonium or sodium sulfate. Since the presenceof organics or salts usually interferes with further purification and characterizationof the molecule, they must be removed. Dialysis is a simple, inexpensive, and effec-tive method for removing all small molecules, ionic or nonionic.
Dialysis is also useful for removing small ions and molecules that areweakly bound to biomolecules. Protein cofactors such as NAD, FAD, and metalions can often be dissociated by dialysis. The removal of metal ions is facilitatedby the addition of a chelating agent (EDTA) to the dialysate.
Dialysis of small-volume samples (less than 3 mL) is often tedious, incon-venient, and inefficient. Commercial vials for dialysis are now available for sam-ple sizes from 0.05 to 3.0 mL, with molecular weight cutoffs ranging from 3500 to14,000 daltons. For example, GeBAflex tubes, offered by Gene Bio-Applications,may be used for dialysis (the removal of small molecules like urea, detergents,and ethidium bromide), buffer exchange, sample concentration, and electroelu-tion of protein and nucleic acid samples (see Chapter 6).
Ultrafiltration
Although dialysis is still used occasionally as a purification tool, it has beenlargely replaced by ultrafiltration and gel filtration (see Chapter 5, Section E, p. 132). The major disadvantage of dialysis that is overcome by the newer meth-ods is that it may take several days of dialysis to attain a suitable separation. Theother methods require 1 to 2 hours or less.
Ultrafiltration involves the separation of molecular species on the basis ofsize, shape, and/or charge. The solution to be separated is forced through amembrane by an external force. Membranes may be chosen for optimum flowrate, molecular specificity, and molecular weight cutoff. Two applications ofmembrane filtration are obvious: (1) desalting buffers or other solutions, and(2) clarification of turbid solutions by removal of micron- or submicron-sizedparticles. Other applications are discussed below.
Ultrafiltration membranes have molecular weight cutoffs in the range of100 to 1,000,000. They are usually composed of two layers: (1) a thin (0.1–0.5 ),surface, semipermeable membrane made from a variety of materials includingcellulose acetate, nylon, and polyvinylidene, and (2) a thicker, inert, supportbase (Figure 3.8). These filters function by retaining particles on the surfaces, notwithin the base matrix.
Membrane filters of these materials can be manufactured with a predeter-mined and accurately controlled pore size. Filters are available with a mean poresize ranging from 0.025 to These filters require suction, pressure, or cen-trifugal force for liquid flow. A typical flow rate for the commonly used membrane is at 10 psi.57 mL min-1 cm-2
0.45–mm15 mm.
mm

Chapter 3 • General Laboratory Procedures 75
Ultrafiltration devices are available for macroseparations (up to 50 L) or formicroseparations (milli- to microliters). For solutions larger than a few milli-liters, gas-pressurized cells or suction-filter devices are used. For concentrationand purification of samples in the milli- to microliter range, disposable filters areavailable. These devices, often called microconcentrators, offer the usersimplicity, time saving, and high recovery. The sample is placed in a reservoirabove the membrane and centrifuged. The time and centrifugal force requireddepend on the membrane, with spin times varying from 30 minutes to 2 hoursand forces from to Figure 3.9 outlines the use of a centrifugemicrofilter.
The principles behind ultrafiltration are sometimes misunderstood. Thenomenclature implies that separations are the result of physical trapping of theparticles and molecules by the filter. With polycarbonate and fiberglass filters,separations are made primarily on the basis of physical size. Other filters (cellu-lose nitrate, polyvinylidene fluoride, and to a lesser extent cellulose acetate) trapparticles that cannot pass through the pores, but also retain macromolecules byadsorption. In particular, these materials have protein- and nucleic acid-bindingproperties. Each type of membrane displays a different affinity for variousmolecules. For protein, the relative binding affinity is polyvinylidene fluoride cellulose nitrate cellulose acetate. We can expect to see many applications of the“affinity membranes” in the future as the various membrane surface chemistriesare altered and made more specific. Some applications are described in thefollowing pages.
Clarification of Solutions
Because of low solubility and denaturation, solutions of biomolecules or cellularextracts are often turbid. This is a particular disadvantage if spectrophotometricanalysis is desired. The transmittance of turbid solutions can be greatly increasedby passage through a membrane filter system.
77
7500 * g.1000 * g
FIGURE 3.8Electronmicrograph of anultrafiltrationmembrane showingthe two layers.Particles greaterthan indiameter areretained on thesurface or withinpores. Courtesy ofthe MilliporeCorporation; www.millipore.com.
0.1 mm

76 Chapter 3 • General Laboratory Procedures
This simple technique may also be applied to the sterilization of nonau-toclavable materials such as protein and nucleic acid solutions or heat-labilereagents. Bacterial contamination can be removed from these solutions bypassing them through filter systems that have been sterilized by autoclaving.
1. Pipet up to 2 ml of sample into the top reservoir.
2. Cover with the cone-shaped cap and spin in a centrifuge
with a fixed-angle rotor.
3. Detach and invert top half.
4. Centrifuge 1 to 2 minutes to spin the concentrate into the
cone-shaped cap.
5. Concentrate is now completely accessible for further
analysis. Both concentrate and filtrate can be stored in collection cups.
FIGURE 3.9 Useof a centrifugemicrofilter.Courtesy of theMilliporeCorporation; www.millipore.com.

Chapter 3 • General Laboratory Procedures 77
Collection of Precipitates for Analysis
The collection of small amounts of very fine precipitates is the basis for manychemical and biochemical analytical procedures. Membrane filtration is an idealmethod for sample collection. This is of great advantage in the collection ofradioactive precipitates. Cellulose nitrate and fiberglass filters are often used tocollect radioactive samples because they can be analyzed by direct suspension inan appropriate scintillation cocktail.
Harvesting of Bacterial Cells from Fermentation Broths
The collection of bacterial cells from nutrient broths is typically done by batchcentrifugation. This time-consuming operation can be replaced by membranefiltration. Filtration is faster than centrifugation, and it allows extensive cellwashing.
Concentration of Biomolecule Solutions
Protein or nucleic acid solutions obtained from extraction or various purifica-tion steps are often too dilute for further investigation. Since they cannot be con-centrated by high-temperature evaporation of solvent, gentler methods havebeen developed. One of the most effective is the use of ultrafiltration pressurecells, as shown in Figure 3.10. A membrane filter is placed in the bottom and thesolution is poured into the cell. High pressure, exerted by compressed nitrogen(air could cause oxidation and denaturation of biomolecules), forces the flow ofsmall molecules, including solvent, through the filter. Membranes are availablein a number of sizes, allowing a large variety of molecular weight cutoffs. Largermolecules that cannot pass through the pores are concentrated in the samplechamber. This method of concentration is rapid and gentle and can be performedat cold temperatures to ensure minimal inactivation of the molecules. One majordisadvantage is clogging of the pores, which reduces the flow rate through thefilter; this is lessened by constant but gentle stirring of the solution.
Lyophilization and Centrifugal Vacuum Concentration
Although ultrafiltration is being used more and more for the concentration ofbiological solutions, the older technique of lyophilization (freeze-drying) is stillused. There are some situations (storing or transporting biological materials) inwhich lyophilization is preferred. Lyophilization is a drying technique that usesthe process of sublimation to change a solvent (water) in the frozen state directlyto the vapor state under vacuum. The product after lyophilization is a fluffymatrix that may be reconstituted by the addition of liquid. This is one of themost effective methods for drying or concentrating heat-sensitive materials. Inpractice, a biological solution to be concentrated is “shell-frozen” on the walls of around-bottom or freeze-drying flask. Freezing of the solution is accomplishedby placing the flask (half full with sample) in a dry ice–acetone bath and slowlyrotating it as it is held at a angle. The aqueous solution freezes in layers on thewall of the flask. This provides a large surface area for evaporation of water. Theflask is then connected to the lyophilizer, which consists of a refrigeration unitand a vacuum pump (see Figure 3.11). The combined unit maintains the sample
45°

78 Chapter 3 • General Laboratory Procedures
at for stability of the biological materials and applies a vacuum of approx-imately 5 to 25 mm Hg on the sample. Ice formed from the aqueous solution sub-limes and is pumped from the sample vial. In fact, all materials that are volatileunder these conditions ( 5 to 25 mm Hg) will be removed, and nonvolatilematerials (proteins, buffer salts, nucleic acids, etc.) will be concentrated intoa light, sometimes fluffy precipitate. Most freeze-dried biological materials arestable for long periods of time and some remain viable for many years.
As with any laboratory method, there are precautions for and limita-tions of lyophilization that must be understood. Only aqueous solutions shouldbe lyophilized. Organic solvents lower the melting point of aqueous solutionsand increase the chances that the sample will melt and become denatured dur-ing freeze-drying. There is also the possibility that organic vapors will passthrough the cold trap into the vacuum pump, where they may cause damage.
A new and increasingly popular technique for sample concentration anddrying is centrifugal vacuum concentration. The method may be used to dry awide variety of biological samples. The process starts with a sample dissolved in asolvent (water or organic). The solvent is evaporated under vacuum in a centrifuge,thus producing a pellet in the bottom of the container. The most widely used
-40°C,
-40°C
Pressure
inlet
Pressure
relief valve
Transparent body
Stirring bar
Beaker
design
O-ring
Membrane
Membrane
support
Filtrate
outlet
FIGURE 3.10Schematic of anultrafiltration cell.Courtesy ofMillipore/AmiconCorporation; www.millipore.com.

Chapter 3 • General Laboratory Procedures 79
instrument is the SpeedVac, available through Savant (Figure 3.12). This method isbetter than freeze-drying because it is faster, it does not require a prefreezing step, itprovides 100% sample recovery, and it may be used with solvents other than water.The SpeedVac is usually used for relatively small volumes—1–2-mL samples.
FIGURE 3.11 A labtechnician preparesa sample forlyophilization(freeze-drying) withthe LabconcoFreeZone benchtopfreeze dryer, Model# 7740020. ©LabconcoCorporation. Photoused withpermission fromLabconcoCorporation. www.labconco.com.
FIGURE 3.12 TheSpeedVaccentrifugal vacuumconcentrator.Image provided byThermo FisherScientific Inc., allrights reserved.www.thermofisher.com.

80 Chapter 3 • General Laboratory Procedures
E. RADIOISOTOPES IN BIOCHEMISTRY
The use of radioactive isotopes in experimental biochemistry has providedus with a wealth of information about biological processes. In the earlierdays of biochemistry, radioisotopes were primarily used to elucidate metabolicpathways. In modern biochemistry, few experimental techniques offer such adiverse range of applications as that provided by radioactive isotopes. The meas-urement of radioactivity is a tool that has the potential for use in all areas ofexperimental biochemistry, including enzyme assays, biochemical pathwaysof synthesis and degradation, analysis of biomolecules, measurement of antibod-ies, binding and transport studies, clinical biochemistry, and many others.Radioisotope applications have two major advantages over other analytical meth-ods: (1) sensitive instrumentation allows the detection of minute quantities ofradioactive material (some radioactive substances can be measured in thepicomole, range), and (2) radioisotope techniques offer the ability to differ-entiate physically between substances that are chemically indistinguishable. Themajor disadvantages of radioisotope use are, of course, the safety andenvironmental concerns that must be considered when working with radioactivematerials. These concerns have greatly slowed the development of new proce-dures using radioisotopes, as some countries and U.S. states require that all whowork with radioactive materials, including students, must have completed anintensive training course. Because of the potential hazards and problems associatedwith using and disposing of radioactive waste materials, radioisotopes aregenerally not used in undergraduate biochemistry teaching labs. They are usedin research, in industrial biotechnology applications, and in medicine only whenthere are no other techniques that can be applied to the problem. They are thenhandled only by experienced personnel.
The difficult problems and safety issues that arise with radioisotope usehave encouraged scientists to search for alternate techniques. The last two Website references in the Radioisotopes section at the end of the chapter describe thesearch for “green biochemistry” techniques that avoid the use of radioisotopes.One reference describes the design of protein kinase assays that avoid the use ofphosphorus-32. Another describes the synthesis of probes for radioisotope-freephotoaffinity labels for proteins.
Origin and Properties of Radioactivity
Introduction
Radioactivity results from the spontaneous nuclear disintegration of unstableisotopes. The hydrogen nucleus, consisting of a proton, is represented as Two additional forms of the hydrogen nucleus contain one and two neutrons;they are represented as and These isotopes of hydrogen are commonlycalled deuterium and tritium, respectively. All isotopes of hydrogen have anidentical number of protons (constant charge, ), but they differ in the num-ber of neutrons. Only tritium is radioactive.
The stability of a nucleus depends on the ratio of neutrons to protons.Some nuclei are unstable and undergo spontaneous nuclear disintegration
+1
13H.1
2H
11H.
10-12,

Chapter 3 • General Laboratory Procedures 81
accompanied by emission of particles. Unstable isotopes of this type are calledradioisotopes. Three main types of radiation are emitted during nucleardecay: particles, particles, and rays. The particle, a helium nucleus, isemitted only by elements with a mass number greater than 140. These ele-ments are seldom used in biochemical research.
Most of the commonly used radioisotopes in biochemistry are emitters.The particles exist in two forms ( positrons, and electrons) and are emit-ted from a given radioisotope with a continuous range of energies. However, anaverage energy (called the mean energy) of particles from an element can be de-termined. The mean energy is a characteristic of that isotope and can be used toidentify one emitter in the presence of a second (see Figure 3.13). Equations3.10 and 3.11 illustrate the disintegration of two emitters. Here representsthe antineutrino and the neutrino.
>> (Eq. 3.10)
>> (Eq. 3.11)
A few radioisotopes of biochemical significance are emitters. Emission ofa ray (a photon of electromagnetic radiation) is often a secondary process oc-curring after the initial decay by emission. The disintegration of the isotope is an example of this multistep process.
>> (Eq. 3.12)
Each radioisotope emits rays of a distinct energy, which can be measured foridentification of the isotope.
g
13153 I ¡ b- + 131
54 Xe ¡ 13154 Xe + g
131Ib
g
g
6530Zn ¡ 65
29Cu + b+ + ve
3215P ¡ 32
16S + b- + ve
veveb
b
b
b-,b+,b
b
agba
Channel 2Channel 1
Emean = 0.0055
Emean = 0.05
Emax = 0.156Emax = 0.018
14C3H
0.02 0.04 0.06 0.08 0.10 0.12 0.14 0.16
Energy, E (MeV)
Num
ber
of
β p
art
icle
s w
ith e
nerg
y, E
FIGURE 3.13Energy spectra forthe emitters and Thedashed linesindicate the upperand lower limits fordiscriminationcounting.
14C.
3Hb

82 Chapter 3 • General Laboratory Procedures
The spontaneous disintegration of a nucleus is a first-order kinetic process.That is, the rate of radioactive decay of N atoms ( the change of N withtime, t) is proportional to the number of radioactive atoms present (Equation 3.13).
>> (Eq. 3.13)
The proportionality constant, is called the disintegration or decay constant.Equation 3.13 can be transformed to a more useful equation by integration with-in the limits of and t. The result is shown in Equation 3.14.
>> (Eq. 3.14)
where
the number of radioactive atoms present at the number of radioactive atoms present at time
Equation 3.14 can be expressed in the natural logarithmic form as in Equation 3.15.
>> (Eq. 3.15)
Combining Equations 3.14 and 3.15 leads to a relationship that defines thehalf-life. Half-life, is a term used to describe the time necessary for one-halfof the radioactive atoms initially present in a sample to decay. At the end of thefirst half-life, N in Equation 3.15 becomes and the result is shown inEquations 3.16 and 3.17.
>>
(Eq. 3.16)
>> (Eq. 3.17)
Equations 3.15 and 3.17 allow calculation of the ratio at any time during anexperiment. This calculation is especially critical when radioisotopes with shorthalf-lives are used.
Isotopes in Biochemistry
The properties of several radioisotopes that are important in biochemicalresearch are listed in Table 3.5. Note that many of the isotopes are emitters;however, a few are emitters.
The half-life, defined in the previous section and listed for each isotope inTable 3.5, is an important property to consider when one is designing experimentsusing radioisotopes. Using an isotope with a short half-life (for example, with ) is difficult because the radioactivity lost during the course ofthe experiment is significant. Quantitative measurements made before and afterthe experiment must be corrected for this loss of activity. Radioactive phosphorus,
t1>2 = 15 hrs
24Na
g
b
N>N0
t1>2 =0.693l
ln 12 = -lt1>2
ln12N0
N0= -lt1>2
12N0,
t1>2,
lnNN0
= -lt
= tN =t = 0N0 =
N = N0e-lt
t = 0
l,
-dNdt
= lN
-dN>dt,
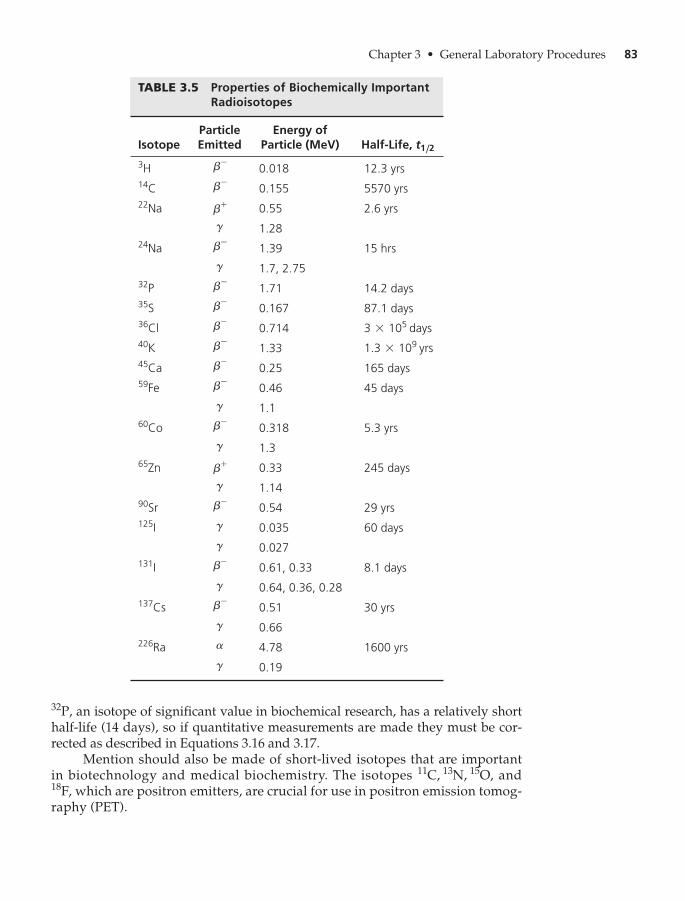
Chapter 3 • General Laboratory Procedures 83
an isotope of significant value in biochemical research, has a relatively shorthalf-life (14 days), so if quantitative measurements are made they must be cor-rected as described in Equations 3.16 and 3.17.
Mention should also be made of short-lived isotopes that are importantin biotechnology and medical biochemistry. The isotopes and
which are positron emitters, are crucial for use in positron emission tomog-raphy (PET).
18F,
11C, 13N, 15O,
32P,
TABLE 3.5 Properties of Biochemically ImportantRadioisotopes
IsotopeParticleEmitted
Energy of Particle (MeV) Half-Life, t1/2
3H b-0.018 12.3 yrs
14C b-0.155 5570 yrs
22Na b+ 0.55 2.6 yrsg 1.28
24Na b-1.39 15 hrs
g 1.7, 2.7532P b-
1.71 14.2 days35S b-
0.167 87.1 days36Cl b-
0.714 3 * 105 days40K b-
1.33 1.3 * 109 yrs45Ca b-
0.25 165 days59Fe b-
0.46 45 daysg 1.1
60Co b-0.318 5.3 yrs
g 1.365Zn b+ 0.33 245 days
g 1.1490Sr b-
0.54 29 yrs125I g 0.035 60 days
g 0.027131I b-
0.61, 0.33 8.1 daysg 0.64, 0.36, 0.28
137Cs b-0.51 30 yrs
g 0.66226Ra a 4.78 1600 yrs
g 0.19

84 Chapter 3 • General Laboratory Procedures
Units of Radioactivity
The basic unit of radioactivity is the curie, Ci, named in honor of Marie andPierre Curie. One curie is the amount of radioactive material that emits parti-cles at a rate of disintegrations per second (dps), or (dpm). Amounts that large are seldom used in experimentation, so subdivi-sions are convenient. The millicurie (mCi, ) and microcurie
are standard units for radioactive measurements (seeTable 3.6). The radioactivity unit of the meter-kilogram-seconds (MKS) systemis the becquerel (Bq). A becquerel, named in honor of Antoine Becquerel, whostudied uranium radiation, represents one disintegration per second. Thetwo systems of measurement are related by the equation becquerels. Since the becquerel is such a small unit, radioactive units aresometimes reported in MBq (mega, ) or TBq (tera, ). Both unit systemsare in common use today, and radioisotopes received through commercialsources are labeled in curies and becquerels.
The number of disintegrations emitted by a radioactive sample depends onthe purity of the sample (number of radioactive atoms present) and the decayconstant, Therefore, radioactive decay is also expressed in terms of specificactivity, the disintegration rate per unit mass of radioactive atoms. Typical unitsfor specific activity are mCi/mmole and
Although radioactivity is defined in terms of nuclear disintegrations perunit of time, rarely does one measure this absolute number in the laboratory.Instruments that detect and count emitted particles respond to only a smallfraction of the particles. Data from a radiation counter are in counts perminute (cpm), which can be converted to actual disintegrations per minute ifthe counting efficiency of the instrument is known. The percent efficiency ofan instrument is determined by counting a standard compound of knownradioactivity and using the ratio of detected activity (observed cpm) to actualactivity (disintegrations per minute). Equation 3.18 illustrates the calculationusing a standard of
>>
(Eq. 3.18)=observed cpm
2.2 * 106 dpm* 100
% efficiency =observed cpm of standard
dpm of 1mCi of standard* 100
1 mCi.
mCi>mmole.
l.
1012106
1 curie = 3.70 * 1010
1mCi, 2.2 * 106 min-12 2.2 * 109 min-1
2.2 * 1012 min-13.7 * 1010
TABLE 3.6 Units of Radioactivity
Unit’s Name Multiplication Factor (relative to curie) Activity (dps)
Curie (Ci) 1.0 3.70 * 1010
Millicurie (mCi) 10-3 3.70 * 107
Microcurie ( )mCi 10-6 3.70 * 104
Nanocurie (nCi) 10-9 3.70 * 10
Becquerel (Bq) 2.7 * 10-11 1.0
Mega becquerel (MBq) 2.7 * 10-5 1.0 * 106

Chapter 3 • General Laboratory Procedures 85
Detection and Measurement of Radioactivity
Since most of the radioisotopes used in biochemical research are emitters, onlymethods that detect and measure particles will be emphasized.
Liquid Scintillation Counting
Samples for liquid scintillation counting consist of three components: (1) theradioactive material; (2) a solvent, usually aromatic, in which the radioactivesubstance is dissolved or suspended; and (3) one or more organic fluorescentsubstances. Components 2 and 3 make up the liquid scintillation system orcocktail. particles emitted from the radioactive sample interact with the scintil-lation system, producing small flashes of light, or scintillations. The light flashesare detected by a photomultiplier tube (PMT). Electronic pulses from the PMTare amplified and registered by a counting device called a scaler. A schematicdiagram of a typical scintillation counter is shown in Figure 3.14.
b
b
b
Printer and
computer
Scaler
Channel 1
Scaler
Pulse height
analyzer
Channel 2
Pulse height
analyzer
Coincidence gate
Pulse summation
SampleFreezer
PMT PMT
FIGURE 3.14Diagram of atypical scintillationcounter, showingcoincidencecircuitry.

86 Chapter 3 • General Laboratory Procedures
The scintillation process, in detail, begins with the collision of emitted particles with solvent molecules, S (Equation 3.19).
>> (Eq. 3.19)
Contact between the energetic particles and S in the ground state results intransfer of energy and conversion of an S molecule into an excited state, Aromatic solvents are most often used because their electrons are easily promotedto an excited state orbital (see discussion of fluorescence, Chapter 7, p. 220). The
particle after one collision still has sufficient energy to excite several more solventmolecules. The excited solvent molecules normally return to the ground state byemission of a photon, Photons from the typical aromatic solventare of short wavelength and are not efficiently detected by photocells. A convenientway to resolve this technical problem is to add one or more fluorescent substances(fluors) to the scintillation mixture. Excited solvent molecules interact with aprimary fluor, as shown in Equation 3.20.
>> (Eq. 3.20)
Energy is transferred from to resulting in ground state S molecules and ex-cited molecules, molecules are fluorescent and emit light of a longerwavelength than (Equation 3.21).
>> (Eq. 3.21)
If the light emitted during the decay of is still of a wavelength too short for ef-ficient measurement by a PMT, a secondary fluor, that accepts energy from
may be added to the scintillation system. Equations 3.22 and 3.23 outline thecontinued energy transfer process and fluorescence of
>> (Eq. 3.22)
>> (Eq. 3.23)
The light, from is of longer wavelength than from and is moreefficiently detected by a PMT. Two widely used primary and secondary fluorsare 2,5-diphenyloxazole (PPO) with an emission maximum of 380 nm and1,4-bis-2-(5-phenyloxazolyl)benzene (POPOP) with an emission maximum of420 nm. A more efficient but more expensive fluor is 2-( -t-butylphenyl)-5-( -biphenyl)-1,3,4-oxadiazole (Butyl-PBD).
The most basic elements in a liquid scintillation counter are the PMT, a pulseamplifier, and a counter, called a scaler. This simple assembly may be used forcounting; however, there are many problems and disadvantages with this setup.Many of the difficulties can be alleviated by more sophisticated instrumental fea-tures. Some of the problems and practical solutions are outlined below.
Thermal Noise in Photomultiplier Tubes
The energies of the particles from most emitters are very low. This, ofcourse, leads to low-energy photons emitted from the fluors and relativelylow-energy electrical pulses in the PMT. In addition, photomultiplier tubesproduce thermal background noise with 25 to 30% of the energy associated
bb
4–4¿
F*1hv1F*2hv2,
F*2 ¡ F2 + hv2
F*1 + F2 ¡ F1 + F*2
F*2.F*1
F2,F*1
F*1 ¡ F1 + hv1
S*F*1 # F*1F1
F1,S*
S* + F1 ¡ S + F*1
F1,
S* ¡ S + hv.
b
S*.b
b + S: S* + b 1less energetic2b

Chapter 3 • General Laboratory Procedures 87
with the fluorescence-emitted photons. This difficulty cannot be completelyeliminated, but its effects can be lessened by placing the samples and the PMTin a freezer at to in order to decrease thermal noise.
A second way to help resolve the thermal noise problem is to use two photo-multiplier tubes for detection of scintillations. Each flash of light that is detected bythe photomultiplier tubes is fed into a coincidence circuit. A coincidence circuitcounts only the flashes that arrive simultaneously at the two photodetectors.Electrical pulses that are the result of simultaneous random emission (thermal noise)in the individual tubes are very unlikely. A schematic diagram of a typical scintilla-tion counter with coincidence circuitry is shown in Figure 3.14.
Counting More Than One Isotope in a Sample
The basic liquid scintillation counter with coincidence circuitry can be used onlyto count samples containing one type of isotope. Many experiments in bio-chemistry require the counting of just one isotope; however, more valuableexperiments can be performed if two radioisotopes can be simultaneously count-ed in a single sample (double-labeling experiments). The basic scintillationcounter just described has no means of discriminating between electrical pulsesof different energies.
The size of the current generated in a photocell is nearly proportional to theenergy of the particle initiating the pulse. Recall that particles from differentisotopes have characteristic energy spectra with an average energy (see Figure 3.13).Modern scintillation counters are equipped with pulse height analyzers that meas-ure the size of the electrical pulse and count only the pulses within preselectedenergy limits set by discriminators. The circuitry required for pulse height analysisand energy discrimination of particles is shown in Figure 3.14. Discriminators areelectronic “windows” that can be adjusted to count particles within certain ener-gy or voltage ranges called channels. The channels are set to a lower limit and anupper limit, and all voltages within those limits are counted. Figure 3.13 illustratesthe function of discriminators for the counting of and in a single sample.Discriminator channel 1 is adjusted to accept typical particles emitted from and channel 2 is adjusted to receive particles of the energy characteristic of
Quenching
Any chemical agent or experimental condition that reduces the efficiency of thescintillation and detection process leads to a reduced level of counting, orquenching. Quenching may be caused by a decrease in the amount of fluores-cence from the primary and secondary scintillators (fluors) or a decrease in lightactivating the PMT. There are four common origins of quenching.
Color quenching is a problem if chemical substances that absorb pho-tons from the secondary fluors are present in the scintillation mixture. Sincethe secondary fluors emit light in the visible region between 410 and 420 nm,colored substances may absorb the emitted light before it is detected by thephotocells. Radioactive samples may be treated to remove colored impuritiesbefore mixing with the scintillation solvent.
Chemical quenching occurs when chemical substances in the scintillation so-lution interact with excited solvent and fluor molecules and decrease the efficiency
14C.b
3Hb
14C3H
b
b
bb
-8°C-5

88 Chapter 3 • General Laboratory Procedures
of the scintillation process. To avoid this type of quenching, the sample can be puri-fied or the fluors can be increased in concentration. Modern scintillation countershave computer programs to correct for color and chemical quenching.
Point quenching occurs if the radioactive sample is not completely dis-solved in the solvent. The emitted particles may be absorbed before they havea chance to interact with solvent molecules. The addition of solubilizing agentssuch as Cab-O-Sil or Thixin decreases point quenching by converting the liquidscintillator to a gel.
Dilution quenching results when a large volume of liquid radioactive sampleis added to the scintillation solution. In most cases, this type of quenching cannot beeliminated, but it can be corrected by one of the techniques discussed below.
Since quenching can occur during all experimental counting of radioiso-topes, it is important to be able to determine the extent of the reduced countingefficiency. Two methods for quench correction are in common use.
In the internal standard ratio method, the sample, X, under study is firstcounted; then a known amount of a standard radioactive solution is added to thesample, and it is counted again. The absolute activity of the original sample, is represented by Equation 3.24.
>> (Eq. 3.24)
where
The absolute value of is determined from Equation 3.25.
>> (Eq. 3.25)
where
Equation 3.24 can then be modified to Equation 3.26.
>> (Eq. 3.26)
The internal standard ratio method for quench correction is tedious, time-consuming, and destroys the sample, so it is not an ideal method. Scintillationcounters are equipped with a standard radiation source inside the instrument,but outside the scintillation solution. The radiation source, usually a gammaemitter, is mechanically moved into a position next to the vial containing thesample, and the combined system of standard and sample is counted. Gammarays from the standard excite solvent molecules in the sample, and the scin-tillation process occurs as previously described. However, the instrument isadjusted to register only scintillations due to particle collisions with solventg
AX =AsCX
CT - CX
CT = total radioactive counts from sample and standard
CT = CX + Cs
Cs
Cs = radioactive counts from standardAs = activity of the standardCX = radioactive counts from sampleAX = activity of the sample, X
AX = AsCX
Cs
AX,
b
Chapter 3 • General Laboratory Procedures 89
molecules. This method for quench correction, called the external standardmethod, is fast and precise.
Scintillation Cocktails and Sample Preparation
Many of the quenching problems discussed earlier can be lessened if an experi-ment is carefully planned. Many sample preparation methods and scintillationliquids are available for use. Only a few of the more common techniques will bementioned here. Most liquid or solid radioactive samples can be counted bymixing them with a scintillation cocktail, a mixture of solvent and fluor(s). Theradioactive sample and scintillation solution are placed in a glass, polyethylene,polypropylene, polyester, or polycarbonate vial for counting. Traditional count-ing vials include a 20-mL-standard vial, a 6-mL miniature vial, a 1-mL Eppendorftube, or a - microfuge tube. If glass is used, the solution must contain a lowpotassium content because naturally occurring is a emitter. Two majortypes of solvent systems are available: (1) those that are immiscible with water, inwhich only organic samples may be used, and (2) those that dissolve aqueoussamples. During the early years of liquid scintillation counting, the most commonsolvents used were toluene and xylene for organic samples and dioxane for aque-ous samples. These solvents provided high counting efficiency. However, on thedownside, they were flammable (flash points between 4 and ), highly toxic,and presented major disposal costs and problems. In addition, they penetratedplastic counting vials, releasing vapors and liquids into the laboratory. A newenvironmental awareness has prompted the development of biosafe liquid scintil-lation cocktails. The use of highly alkylated aromatic solvents has produced cock-tails that are fully biodegradable (converted to and ), have higher flashpoints (above ), and offer high counting efficiency. The newer solvents maybe disposed of after use by incineration, which greatly reduces costs compared toroad transport to a disposal site. Occupational risks are also lessened because thesolutions are defined by the Environmental Protection Agency as nontoxic.
Solid radioactive samples or those that are insoluble in either type of sol-vent may be quantified by collection onto small pieces of a solid support (filterpaper or cellulose membrane) and added directly to the cocktail for counting.The efficiency of counting these samples depends on the support, but is usuallyless than that of counting a homogeneous sample.
Applications of Radioisotopes
The applications of radioisotopes in biochemical measurements are too numer-ous to outline here. Excellent reference books and Web sites, some of which arelisted at the end of this chapter, provide experimental procedures for radio-isotope utilization. The technique of autoradiography, however, should bementioned here. This procedure allows the detection and localization of aradioactive substance (molecule or atom) in a tissue, cell, or cell organelle.Briefly, the technique involves placing a radioactive material directly onto orclose to a photographic emulsion. Radioisotopes in the material emit radiationthat impinges on the photographic plate, activating silver halide crystals in theemulsion. Upon development of the plate, a pattern or image is displayed thatyields information about the location and amount of radioactive material in the
120°CH2OCO2
25°C
b40KmL200

90 Chapter 3 • General Laboratory Procedures
d(T)8
ATP
0.16 0.32 2.5 5 10 200.63 1.25
Units of kinase
FIGURE 3.15 Autoradiograph showing the transfer of from - -labeled ATP to the end of a polynucleotide, catalyzed by polynucleotide kinase. Reagents were incubatedfor 30 min and electrophoresed on a 20% polyacrylamide, 7 M urea gel and autoradiographed.Note that as more units of kinase are added, more -labeled polynucleotide is made. The darkregions indicate the presence of . Source: Copyright © New England Biolabs. Reprintedwith permission.
32P
32P
1dT28,5¿32Pg32P
sample. A densitometer may be used to scan the autoradiograph and quantifythe amount of radioactivity in each region. One of the most common usesof autoradiography in biochemistry and molecular biology is in the detec-tion and quantification of -labeled nucleic acids on polyacrylamide oragarose gels after electrophoresis (Figure 3.15). Autoradiography has also beenuseful in concentration and localization studies of biomolecules in cells andcell organelles.
Statistical Analysis of Radioactivity Measurements
Radioactive decay is a random process. It is impossible to predict when a radioac-tive event will occur. Therefore, counting measurements provide only average ratesof decay. However, counting measurements may be treated by Gaussian distribu-tion analysis to determine an average counting rate, standard deviation, percentconfidence level, and other statistical parameters. An introduction to statisticalanalysis of radioactivity counting data and other experimental measurements isgiven in Chapter 1, Section E, p. 23.
Radioisotopes and Safety
Safety should be of major concern in performing any chemistry experiment,but when radioisotopes are involved, special precautions must be taken.Many chemistry and biochemistry departments have specially equippedlaboratories for radioisotope work. Alternatively, your instructor should setaside a specific area of your laboratory for using radioactive materials. In ei-ther situation, specific guidelines should be mandated and enforced by allinstitutions.
32P

Chapter 3 • General Laboratory Procedures 91
Study Problems
1. You need to prepare a buffer for biochemistry lab. The required solution is 0.5 Msodium phosphate, pH 7.0. Use the Henderson-Hasselbalch equation to calculate thenumber of moles and grams of monobasic sodium phosphate and dibasicsodium phosphate necessary to make 1 liter of the solution.
2. Design a “shortcut” method for preparing the phosphate buffer in Study Problem 1.Hint: You need only a solution of NaOH, and a pH meter.
3. Describe how you would prepare a 0.1 M glycine buffer of pH 10.0. You have avail-able isoelectric glycine and sodium glycinate.
4. Describe how you would prepare a 0.20 M Tris-HCl buffer of pH 8.0. The only Trisreagent you have available is Tris base. What other reagent do you need, and howwould you use it to prepare the solution?
5. Below is a table prepared by a biochemistry student to construct a standard curve forprotein analysis. The Bradford assay was used with IgG (0.1 mg/mL) as standard pro-tein. Complete the table by filling in the weight of IgG in each tube and the approximate
that will be obtained for each tube. Assume the procedure was conducted correctly.A595
NaH2PO4,
1Na2HPO421NaH2PO42
6. Assume that you use the standard curve produced in Study Problem 5 to measure theconcentration of an unknown protein. The for 1.0 mL of the unknown was 0.52.Prepare a standard curve from the data in Problem 5 and estimate the concentration ofunknown protein in the sample in
7. A solution of purified DNA gave in the spectrophotometric assay an of 0.35 whenmeasured in a 1-cm quartz cuvette. What is the concentration of the DNA in
8. An RNA sample that you isolated has an absorbance reading at 260 nm of 0.25. What isthe concentration of RNA in the sample? Assume the measurement was taken in a 1-cmquartz cuvette.
9. You have just completed an experiment to isolate DNA from E. coli. Absorbance meas-urements on the DNA sample were taken at 260 nm and 280 nm. The 260/280 ratio was1.6. Is the DNA sample pure? If not, what could be the impurity?
10. Compare the techniques of lyophilization and centrifugal vacuum concentration. Giveadvantages and disadvantages of each.
11. What amino acid residues are detected when the spectrophotometric assay is used toquantify proteins? Are those amino acids present in the same quantity in all proteins?Explain how this may affect measurement of proteins by this method.
12. What biomolecules would interfere with the measurement of nucleic acids using thespectrophotometric assay?
13. The concentration of a purified DNA solution is Predict the value of ab-sorbance of the solution at 260 and 280 nm.
14. In Section B of this chapter, you read that the Bradford assay has a higher sensitivityto some proteins than other proteins and hence gives higher absorbance readings at
35 mg>mL.1A2602
mg>mL?A260
mg>mL.
A595
Tube No.
Reagents 1 2 3 4 5 6
(mL)H2O 1.0 0.9 0.8 0.6 0.2 —
IgG volume (mL) — 0.1 0.2 0.4 0.8 1.0
IgG weight 1mg2 0
Bradford reagent (mL) 5.0 :A595 0.00 0.05

92 Chapter 3 • General Laboratory Procedures
595 nm. For example, the absorbance readings for bovine serum albumin are morethan twice those for bovine gamma globulin (Figure 3.6). Explain why higherabsorbance readings are obtained for some proteins. HINT: Use the bioinformaticsWeb sites given in Chapter 2.
15. In the Bradford assay of a protein, what is the most ideal protein to use as a standard?16. Prepare a linear dilution table similar to Table 3.2. Assume that the stock solution is 2.0 M
and you require 20-mL diluted samples of final concentrations: 1.66 M, 1.33 M, 1.0 M,0.66 M, 0.33 M, and 0.00 M.
17. Select a buffer system that can be used at each of the following pH values.(a) pH 3.5(b) pH 6.0(c) pH 9.5
18. Describe how you would prepare 1 liter of the following buffer: 0.025 M Tris-chloride,pH 8.0, containing 0.05 M glucose and 0.01 M EDTA (MW EDTA disodium salt, dihy-drate ).
19. Calculate the decay constant for 20. Calculate the half-life of an isotope from the following experimental measurements. At
time the activity is 300 disintegrations per minute. After 1 hour, the activity is 200disintegrations per minute.
21. The following serial dilution is carried out in the lab:1.0 mL of Solution A is diluted to a final volume of 10 mL (Solution B).1.0 mL of Solution B is diluted to a final volume of 10 mL (Solution C).1.0 mL of Solution C is diluted to a final volume of 10 mL (Solution D).
Assume that Solution A has a concentration of 2.0 M. Calculate the concentrations ofSolutions B, C, and D.
22. You need to prepare a buffer solution at each of the following concentrations:
Describe how you would use a single stock solution of the buffer (5.0 M) to prepare10 mL of each diluted buffer solution.
23. How long will it take a sample of that contains 65,000 disintegrations per minuteto decay to 1500 disintegrations per minute?
24. List five radioisotopes that may be measured using a liquid scintillation counter.
32P
1M, 0.1M, 0.01M, and 0.001M
= 0,
32P.l,= 372.2
Further Reading
GENERAL REFERENCES
S. Sawhney and R. Singh (Editors), Introductory Practical Biochemistry, (2005), AlphaScience International (Oxford, U. K.).
D. Sheehan, Physical Biochemistry: Principles and Applications, 2nd ed. (2009), Wiley-Blackwell (Hoboken, NJ).
J. Walker, Editor, The Protein Protocols Handbook, 2nd ed. (2002), Humana Press(Totowa, NJ).
K. Wilson and J. Walker, Editors, Principles and Techniques of Practical Biochemistry,5th ed. (2000), Cambridge University Press (Cambridge, U.K.).
MEASUREMENT OF PROTEINS AND NUCLEIC ACIDS
M. Bradford, Anal. Biochem. 72, 248–254 (1976). “A Rapid and Sensitive Method for theQuantitation of Microgram Quantities of Protein Utilizing the Principles of Ligand-Dye Binding.”

Chapter 3 • General Laboratory Procedures 93
P. Smith et al., Anal. Biochem. 150, 76–85 (1985). “Measurement of Protein UsingBicinchoninic Acid.”
J. Walker, Editor, The Protein Protocols Handbook, 2nd ed. (2002), Humana Press, Inc.(Totowa, NJ), pp. 3–21.
http://www.ruf.rice.edu/~bioslabs/methods/protein/abs280.htmlMeasurement of protein solutions using absorbance at 280 nm.
http://www.ruf.rice.edu/~bioslabs/methods/protein/protcurve.htmlUse of colorimeteric assays for proteins.
http://www.ruf.rice.edu/~bioslabs/methods/protein/bradford.htmlThe Bradford assay.
http://www.bio-rad.com/cmc_upload/Literature/55685/4110065A.pdfThe Bradford assay.
http://bioinformatics.biomed.drexel.edu/CfIB_Resources_files/Week2/RNA%20Spectrophotometry.doc
Analysis of nucleic acids.
http://www.turnerbiosystems.com/doc/appnotes/PDF/DNA_RNA_080409.pdfNucleic acid and protein quantitation methods.
http://www.protocol-online.org/prot/General_Laboratory_Techniques/Quantitation/index.html
Quantitation of proteins and nucleic acids.
http://everything2.com/title/Hoechst+dyeBis-benzimidazole dye for DNA.
pH, BUFFERS, ELECTRODES, AND BIOSENSORS
K. Barker, At the Bench: A Laboratory Navigator, 2nd ed. (2005), Cold Spring HarborLaboratory Press (Cold Spring Harbor, NY).
S. Borman, Chem. Eng. News, (2006), “A Boost for Biosensors,” August 7, pp. 48–49.R. Boyer, Concepts in Biochemistry, 3rd ed. (2006), John Wiley & Sons (Hoboken, NJ),
pp. 36–62.R. Curtright et al., Biochem. Mol. Biol. Educ. 32, 71–77 (2004). “Facilitating Student
Understanding of Buffering by an Integration of Mathematics and ChemicalConcepts.”
R. Garrett and C. Grisham, Biochemistry, 4th ed. (2010), Brooks/Cole (Belmont, CA).N. Good and S. Izawa, in Methods in Enzymology, Vol. XXIV, A. San Pietro, Editor (1972),
Academic Press (New York), pp. 53–68. “Hydrogen Ion Buffers for PhotosynthesisResearch.”
D. E. Gueffroy, Editor, Buffers—A Guide for the Preparation and Use of Buffers inBiological Systems (1993), Calbiochem-Novabiochem Corp., P.O. Box 12087, La Jolla,CA 92039–2087.
D. Nelson and M. Cox, Lehninger Principles of Biochemistry, 5th ed. (2009), Freeman(New York).
J. Risley, J. Chem. Educ. 68, 1054 (1991). “Preparing Solutions in the Biochemistry Lab.”D. Voet and J. Voet, Biochemistry, 3rd ed. (2005) John Wiley & Sons (Hoboken, NJ).D. Voet, J. Voet, and C. Pratt, Fundamentals of Biochemistry, 3rd ed. (2008), John Wiley &
Sons (Hoboken, NJ).K. Wilson and J. Walker, Editors, Principles and Techniques of Practical Biochemistry,
5th ed. (2000), Cambridge University Press (Cambridge, U.K.), pp. 37–42.
http://www.hannainst.comComplete information on the selection, use, and care of pH meters and electrodes.

http://www.ysi.comInformation on the biological oxygen monitor (oxygen electrode).
http://www.ornl.gov/sci/biosensorsVirtual poster session on biosensors in biomedicine, sponsored by the Oak Ridge National
Lab.
http://en.wikipedia.org/wiki/BiosensorIntroduction to biosensors.
http://en.wikipedia.org/wiki/Buffer_solutionBuffers.
http://www.ysilifesciences.com/index.php?page=ysi-5300a-biological-oxygen-monitorFigure 3.3 Model 5300A oxygen monitor.
RADIOISOTOPES
G. Choppin, J. Liljenzin, and J. Rydberg, Radiochemistry and Nuclear Chemistry, 3rd ed.(2002), Butterworth-Heinemann (Burlington, MA).
K. Leiser, Nuclear and Radiochemistry: Fundamentals and Applications, 2nd ed. (2002),John Wiley & Sons (New York).
R. Slater, Editor, Radioisotopes in Biology, 2nd ed. (2002), Oxford University Press (Oxford).K. Wilson and J. Walker, Editors, Principles and Techniques of Practical Biochemistry,
5th ed. (2000), Cambridge University Press (Cambridge, U.K.), pp. 687–728.
http://beckman.comClick on LS 6500 liquid scintillation counters.
http://en.wikipedia.org/wiki/Scintillation_counterScintillation counters.
http://www.ncbi.nlm.nih.gov/pmc/articles/PMC2721227Protein kinase assays avoiding radioisotope use.
http://www.sciencedirect.com/science?_ob=ArticleURL&_udi=B6TF9-4FDMYBX-7&_user=10&_rdoc=1&_fmt=&_orig=search&_sort=d&_docanchor=&view=c&_acct=C000050221&_version=1&_urlVersion=0&_userid=10&md5=de3dc23002975c4d48063d0dfdcd6d30
Design of radioactive-free photoaffinity labels for proteins.
TECHNIQUES FOR SAMPLE PREPARATION
http://www.millipore.com/lab_filtration/clf/capabilityMembranes and ultrafiltration.
http://www.thermo.com/com/cda/product/detail/0,1055,23574,00.htmlorhttp://www.thermo.com/eThermo/CMA/PDFs/Various/File_10350.pdfSavant SpeedVac concentrators.
http://www.labconco.comFreeze dryers.
http://www.labconco.com/_Scripts/editc25.asp?catid=345Freeze dryers.
http://www.spectrapor.comDialysis membranes.
Additional Web sites for this chapter are available on the book’s Companion Website,which can be found at http://www.chemplace.com.
94 Chapter 3 • General Laboratory Procedures

4 CENTRIFUGATION TECHNIQUESIN BIOCHEMISTRY
95
Acentrifuge of some kind is found in every biochemistry laboratory. Centrifuges havemany applications, but they are used primarily for the preparation of biologicalsamples and for the analysis of the physical properties of biomolecules, organelles,
and cells. Centrifugation is carried out by spinning a biological sample at a high rate ofspeed, thus subjecting it to an intense force (artificial gravitational field). Most centrifugetechniques fit into one of two categories—preparative centrifugation or analytical cen-trifugation. A preparative procedure is one that can be applied to the separation or purifi-cation of biological samples (cells, organelles, macromolecules, etc.) by sedimentation.Analytical procedures are used to measure physical characteristics of biological samples.For example, the purity, size, shape, and density of macromolecules may be defined bycentrifugation.
In this chapter, we will first explore the principles and theory underlying centrifugationtechniques in order to provide a fundamental background. We will then turn to a discussionof the application of these techniques to the isolation and characterization of biological mole-cules and cellular components.
A. Basic Principles of Centrifugation 96B. Instrumentation for Centrifugation 99C. Applications of Centrifugation 106
Study Problems 113Further Reading 114
C H A P T E R

96 Chapter 4 • Centrifugation Techniques in Biochemistry
A. BASIC PRINCIPLES OF CENTRIFUGATION
A particle—whether it is a floating solid, a precipitate, a macromolecule, or a cellorganelle—is subjected to a centrifugal force when it is rotated at a high rate ofspeed. The centrifugal force, F, is defined by Equation 4.1.
>> (Eq. 4.1)
where
The force on a sedimenting particle increases with the velocity of the rota-tion and the distance of the particle from the axis of rotation. A more commonmeasurement of F, in terms of the earth’s gravitational force, g, is relative cen-trifugal force, RCF, defined by Equation 4.2.
>> (Eq. 4.2)
This equation relates RCF to revolutions per minute of the sample. Equation 4.2dictates that the RCF on a sample will vary with r, the distance of the sedimentingparticles from the axis of rotation (see Figure 4.1). It is convenient to determineRCF by use of the nomogram in Figure 4.2. It should be clear from Figures 4.1and 4.2 that, since RCF varies with r, it is important to define r for an experimen-tal run. Often an average RCF is determined using a value for r midway betweenthe top and bottom of the sample container. The RCF value is reported as “anumber times gravity, g.”
RCF = (1.119 * 10-5)(rpm)2(r)
r = distance of the migrating particles from the central axis of rotationv = angular velocity of rotation in rad>secm = effective mass of the sedimenting particleF = intensity of the centrifugal force
F = mv2r
Axis of
rotation
34º
rmin(3.2 cm)
rav(7.0 cm)
rmax(10.8 cm)
FIGURE 4.1 Adiagram illustratingthe variation of RCFwith r, the distanceof the sedimentingparticles from theaxis of rotation.Courtesy ofBeckman Coulter;www.beckman.com.

Chapter 4 • Centrifugation Techniques in Biochemistry 97
301,000,000
90,000
80,000
70,000
60,000
50,000
40,000
30,000
20,000
10,000
9,000 900
1,000
2,000
3,000
4,000
5,000
6,000
7,000
8,000
9,000
500,000
400,000
300,000
200,000
100,000
50,000
20,000
10,000
5,000 50
100
200
500
1,000
2,000
3,000
4,000
5,000
10,000
1,000
25
20
18
16
14
12
10
9
8
7
6
5
4
3
2
1
Radius
(cm) Gravity
units
rpm
10
FIGURE 4.2 A nomogram for estimating RCF. To use, place a straight edgeconnecting the instrumental revolutions (right column) with the distance from thecenter of rotation (left column). The RCF is read where the straight edge crosses themiddle column. Courtesy of Beckman Coulter; www.beckman.com.

98 Chapter 4 • Centrifugation Techniques in Biochemistry
Although this introduction outlines the basic principles of centrifugation, itdoes not take into account other factors that influence the rate of particle sedi-mentation. Centrifuged particles migrate at a rate that depends on their mass,shape, and density, as well as the density of the medium. The centrifugal forcefelt by a particle is defined by Equation 4.1. The term m is the effective mass ofthe particle, that is, the actual mass, minus a correction factor for the weightof water displaced (buoyancy factor) (Equation 4.3).
>> (Eq. 4.3)
where
Equations 4.1 and 4.3 may be combined to describe the centrifugal force on a par-ticle (Equation 4.4).
>> (Eq. 4.4)
As particles sediment under the influence of the centrifugal field, theirmovement is countered by a resistance force, the frictional force. The frictionalforce is defined by Equation 4.5.
>> (Eq. 4.5)
where
The frictional coefficient, f, depends on the size and shape of the particle, as wellas the viscosity of the solvent. The frictional force increases with the velocity ofthe particle until a constant velocity is reached. At this point, the two forces arebalanced (Equation 4.6).
>> (Eq. 4.6)m0(1 - vr)v2r = fv = fadrdtb
v = velocity of the sedimenting particle (sedimentation velocity)f = frictional coefficient
Frictional force = fv
F = m0(1 - vr)v2r
r = density of the solvent or mediumparticle is placed in a large excess of solvent
v = partial specific volume, the volume change occurring when am0 = actual mass of the particlem = effective mass of the sedimenting particle
m = m0 - m0 vr
m0,
STUDY EXERCISE 4.1 Relative Centrifugal Force
To illustrate the use of the nomogram in Figure 4.2, consider a centrifuge tube with anaverage r of 7 cm (see Figure 4.1) being rotated at 20,000 rpm. Use the nomogram todetermine the relative centrifugal force (RCF) in gravity (g) units.
Solution: Follow the instructions in the caption for Figure 4.2 to estimate the RCF tobe about 32,000 * g.

Chapter 4 • Centrifugation Techniques in Biochemistry 99
The rate of sedimentation, sometimes called sedimentation velocity, v, isdefined by Equation 4.7.
>> (Eq. 4.7)
It is cumbersome and sometimes impractical to express sedimentationvelocity in terms of and f, since these factors are difficult to measure. A newterm, sedimentation coefficient, s (the ratio of sedimentation velocity to cen-trifugal force) is introduced by rearranging Equation 4.7 to Equation 4.8.
>> (Eq. 4.8)
The term s is most often defined under standard conditions, and water asthe medium, and denoted by The s value is a physical characteristic used toclassify biological macromolecules and cell organelles. Sedimentation coeffi-cients are in the range of to second. For numerical con-venience, sedimentation coefficients are expressed in Svedberg units, S, where
second. Human hemoglobin has an s value of sec-ond or 4.5 S. The value of S for several biomolecules, bacterial cells, and cellorganelles is shown in Figure 4.3. Note in the figure that there appears to be adirect relationship between the S value and the molecular weight or particle size.This, however, is not always true, as in the case of nonspherical molecules.
4.5 * 10-131 S = 1 * 10-13
10,000 * 10-131 * 10-13
s20, w.20°C
s =v
v2r=m0(1 - vr)
f
r, v,
v =drdt
=m0(1 - vr)v2r
f
STUDY EXERCISE 4.2 Sedimentation Coefficient
The goal of many centrifugation experiments is the measurement of s. This value is im-portant because it can be used to calculate the size (molecular weight, kilobase pairs,etc.) of a molecule or cell organelle. The units of s are not obvious from Equation 4.8.Dimensional analysis shows the following: in cm/sec, in radians/sec, r in cm, ingrams, in in and f in g/sec. Determine the units for s. (Ans. = second)g>cm3,cm3>g, rv
m0vv
B. INSTRUMENTATION FOR CENTRIFUGATION
The basic centrifuge consists of two components, an electric motor with drive shaftto spin the sample and a rotor to hold tubes or other containers of the sample. Awide variety of centrifuges is available, ranging from a low-speed centrifuge usedfor routine pelleting of relatively heavy particles to sophisticated instruments thatinclude accessories for making analytical measurements during centrifugation.Here we will describe three types, the low-speed or clinical centrifuge; the high-speed centrifuge, including the “microfuge”; and the ultracentrifuge. Major char-acteristics and applications of each type are compared in Table 4.1.
Low-Speed Centrifuges
Most laboratories have a standard low-speed centrifuge used for routine sedi-mentation of relatively heavy particles. The common centrifuge has a maxi-mum speed in the range of 4000 to 5000 rpm, with RCF averaging 3000 * g.
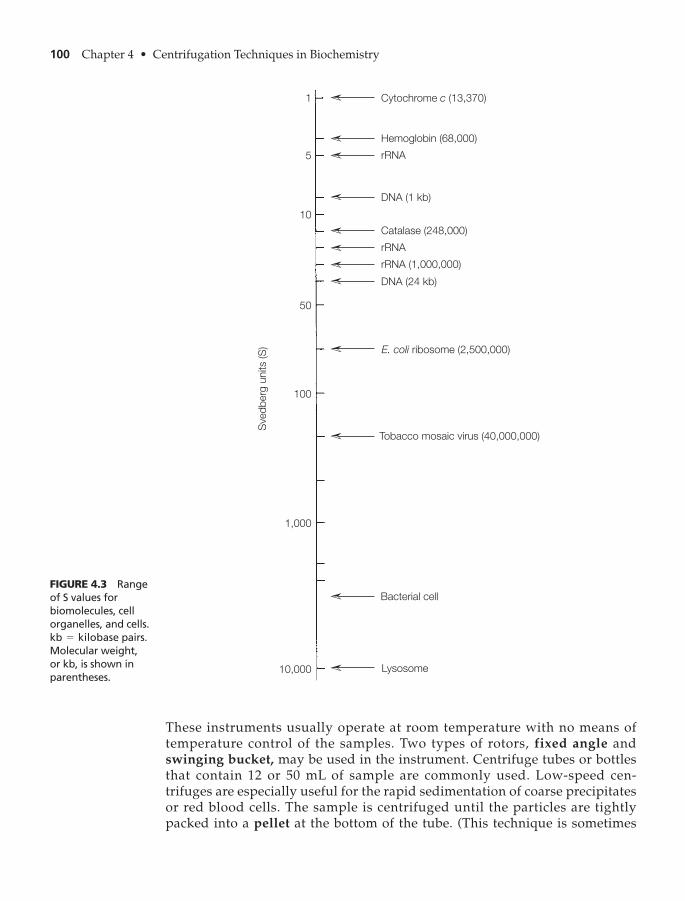
100 Chapter 4 • Centrifugation Techniques in Biochemistry
Lysosome
Bacterial cell
Tobacco mosaic virus (40,000,000)
E. coli ribosome (2,500,000)
DNA (24 kb)
DNA (1 kb)
rRNA (1,000,000)
rRNA
rRNA
Catalase (248,000)
Hemoglobin (68,000)
Cytochrome c (13,370)1
5
10
50
100
1,000
10,000
Sved
berg
units (S
)
FIGURE 4.3 Rangeof S values forbiomolecules, cellorganelles, and cells.
pairs.Molecular weight,or kb, is shown inparentheses.
kb = kilobase
These instruments usually operate at room temperature with no means oftemperature control of the samples. Two types of rotors, fixed angle andswinging bucket, may be used in the instrument. Centrifuge tubes or bottlesthat contain 12 or 50 mL of sample are commonly used. Low-speed cen-trifuges are especially useful for the rapid sedimentation of coarse precipitatesor red blood cells. The sample is centrifuged until the particles are tightlypacked into a pellet at the bottom of the tube. (This technique is sometimes

Chapter 4 • Centrifugation Techniques in Biochemistry 101
TABLE 4.1 Types of Centrifuges and Applications
Characteristic
Type of Centrifuge
Low SpeedMicrofuge
(Medium Speed) High Speed Ultracentrifuge
Range of speed (rpm) 1–6000 1000–15,000 1000–25,000 20–150,000
Maximum RCF (g) 6000 12,000 50,000 1,500,000
Refrigeration Some Some Yes Yes
Applications
Pelleting of cells Yes Yes Yes Yes
Pelleting of nuclei Yes Yes Yes Yes
Pelleting of organelles No No Yes Yes
Pelleting of ribosomes No No No Yes
Pelleting of macromolecules No No No Yes
Analytical techniques No No No Yes
FIGURE 4.4 A labtechnician loadssamples into aSorvall RC-6 PlusSuperspeedcentrifuge, a typicalhigh-speedcentrifuge. Imageprovided byThermo FisherScientific Inc., allrights reserved.www.thermofisher.com.
called pelleting.) The upper liquid portion, the supernatant, is then separatedby decantation.
High-Speed Centrifuges
For more sophisticated biochemical applications, higher speeds and temperaturecontrol of the rotor chamber are essential. A typical high-speed centrifuge isshown in Figure 4.4. The operator of this instrument can carefully control speedand temperature, which is especially important for carrying out reproducible

102 Chapter 4 • Centrifugation Techniques in Biochemistry
FIGURE 4.5Rotors for a high-speed centrifuge. A Fixed-angle;B Swinging-bucket;C Vertical.Courtesy ofBeckman Coulter.
Centrifugal force
A
B
C D
FIGURE 4.6Operation of afixed-angle rotor. A Loading ofsample. B Sampleat start ofcentrifugation.C Bands form asmolecules sediment.D Rotor at restshowing separationof two components.
centrifugations of temperature-sensitive biological samples. Rotor chambers inmost instruments are maintained at or near
Three types of rotors are available for high-speed centrifugation: the fixed-angle, the swinging-bucket, and the vertical rotor (Figure 4.5A–C). Fixed-anglerotors are especially useful for differential pelleting of particles (Figure 4.6A). Inswinging-bucket rotors (Figure 4.5B), the sample tubes move to a position per-pendicular to the axis of rotation during centrifugation, as shown in Figure 4.7.These are used most often for density gradient centrifugation (see below). In thevertical rotor (Figure 4.5C), the sample tubes remain in an upright position(Figure 4.8). These rotors are used often for gradient centrifugation. Prior to the
4°C.

Chapter 4 • Centrifugation Techniques in Biochemistry 103
B
A
C D
Centrifugal force
FIGURE 4.7Operation of aswinging-bucketrotor. A Loading ofsample. B Sampleat start ofcentrifugation.C Sample duringcentrifugationseparates into twocomponents. DRotor at rest.
Centrifugal force
A
B
C D E F
FIGURE 4.8Operation of avertical rotor. A Loading ofsample.B Beginning ofcentrifugation.C, D Duringcentrifugation.E Decelerationof sample. F Rotorat rest.

104 Chapter 4 • Centrifugation Techniques in Biochemistry
FIGURE 4.9 Avariable-speed,general-purposemicrocentrifuge—Eppendorf®
Centrifuge Model5702. Courtesy ofMetrohm, Inc.http://www.metrohmusa.com/home.
early 1990s, rotors were constructed from metals such as aluminum and titanium.Although metal rotors have great strength, they do have several disadvantages:they are very heavy to handle, they are not corrosion-resistant, and they becomefatigued with use. Rotors are now available that are fabricated from carbon-fibercomposite materials. They have several advantages over heavy metal rotors.These new rotors are 60% lighter than comparable aluminum and titanium rotors.Because of the lighter weight, acceleration and deceleration times are reduced;thus, centrifuge run times are shorter. This also results in lower service andmaintenance costs. Instruments are equipped with a brake to slow the rotorrapidly after centrifugation.
Widely used in the category of medium-speed centrifuges is the microfuge(Table 4.1 and Figure 4.9). These instruments, which are designed for the bench-top, are used for rapid pelleting of small samples. Fixed-angle rotors are able tohold up to eighteen 1.5- or 0.5-mL tubes. The maximum speed of most commer-cial microfuges is between 12,000 and 15,000 rpm, which delivers a force of
Some instruments can accelerate to full speed in 6 secondsand decelerate within 18 seconds. Most instruments have a variable speed con-trol and a momentary pulse button for minispins.
The preparation of biological samples almost always requires the use of ahigh-speed centrifuge. Specific examples will be described later, but high-speedcentrifuges may be used to sediment: (1) cell debris after cell homogenization,(2) ammonium sulfate precipitates of proteins, (3) microorganisms, and (4) cellularorganelles such as chloroplasts, mitochondria, and nuclei.
11,000-12,000 * g.

Chapter 4 • Centrifugation Techniques in Biochemistry 105
Ultracentrifuges
The most sophisticated of the centrifuges are the ultracentrifuges. Because of thehigh speeds attainable (see Table 4.1), intense heat is generated in the rotor. Thespin chamber must thus be refrigerated and placed under a high vacuum to re-duce friction. The sample in a cell or tube is placed in a rotor, which is then drivenby an electric motor. Although it is rare, metal rotors sometimes break into frag-ments when placed under high stress. The rotor chamber on all ultracentrifugesis covered with a protective steel armor plate. The drive shaft of the ultracen-trifuge is constructed of a flexible material to accommodate any “wobble” of therotor due to imbalance of the samples. It is still important to counterbalance sam-ples as carefully as possible before inserting them in the rotor.
The previously discussed centrifuges—the low, medium, and high speed—are of value only for preparative work, that is, for the isolation and separation ofprecipitates and biological samples. Ultracentrifuges can be used both forpreparative work and for analytical measurements. Thus, two types of ultracen-trifuges are available: preparative models, primarily used for separation andpurification of samples for further analysis, and analytical models, which aredesigned for performing physical measurements on the sample during sedimen-tation. Two of the most versatile models are Beckman Optima MAX and TLXmicroprocessor-controlled tabletop ultracentrifuges (Figure 4.10). With a typicalfixed-angle rotor, which holds six 0.2- to 2.2-mL samples, the instruments cangenerate 150,000 rpm and an RCF of up to 1,500,000
Analytical ultracentrifuges have the same basic design as preparative mod-els, except that they are equipped with optical systems to monitor directly thesedimentation of the sample during centrifugation. The first commercial instru-ment of this type was the Beckman Model E, introduced in 1947.
* g.
A
FIGURE 4.10A Outside and B inside of theBeckman OptimaTLX ultracentrifuge.Courtesy ofBeckman Coulter.Beckman Coulterand the stylizedlogo are registeredtrademarks ofBeckman Coulter,Inc. Optima is atrademark ofBeckman Coulter,Inc.

106 Chapter 4 • Centrifugation Techniques in Biochemistry
B
Handle
Door
Drive hub
Speed sensor
O-ring
3⁄4-in. Armor ring
1⁄ 2-in. Secondary
barrier
Optima™ TLX Ultracentrifuge
FIGURE 4.10Continued
For analysis, a sample of nucleic acid or protein (0.1 to 1.0 mL) is sealed ina special analytical cell and rotated. Light is directed through the sample parallelto the axis of rotation, and measurements of absorbance by sample molecules aremade. (The Beckman instrument can scan the sample over the wavelength range190 to 800 nm.) If sample molecules have no significant absorption bands inthe wavelength range, then optical systems that measure changes in the refrac-tive index may be used. Optical systems aided by computers are capable of relat-ing absorbance changes or index of refraction changes to the rate of movement ofparticles in the sample. The optical system actually detects and measures thefront edge or moving boundary of the sedimenting molecules. These measure-ments can lead to an analysis of concentration distributions within the centrifugecell. Applications of these measurements will be discussed in the next section.
C. APPLICATIONS OF CENTRIFUGATION
Preparative Techniques
Centrifuges in undergraduate biochemistry laboratories are used most often forpreparative-scale separation procedures. This technique is quite straightfor-ward, consisting of placing the sample in a tube or similar container, inserting

Chapter 4 • Centrifugation Techniques in Biochemistry 107
Cell
homogenate
Nuclei,
cell debris
Microsomes CytosolMitochondria
peroxisomes
lysosomes
600 × g20,000
× g
100,000
× g
FIGURE 4.11Fractionalcentrifugation of a cell homogenate.See text for details.
the tube in the rotor, and spinning the sample for a fixed period. (Filled cen-trifuge tubes or bottles must be weighed and balanced before centrifugation.Tubes across from each other in the rotor should have approximately the sameweight.) The sample is removed and the two phases, pellet and supernatant(which should be readily apparent in the tube), may be separated by careful de-cantation. Further characterization or analysis is usually carried out on the indi-vidual phases. This technique, called velocity sedimentation centrifugation,separates particles ranging in size from coarse precipitates to cellular or-ganelles. Relatively heavy precipitates are sedimented in low-speed centrifuges,whereas lighter organelles such as ribosomes require the high centrifugal forcesof an ultracentrifuge.
Much of our current understanding of cell structure and function dependson separation of subcellular components by centrifugation. The specific methodof separation, called fractional centrifugation, consists of successive centrifuga-tions at increasing rotor speeds. Figure 4.11 illustrates the fractional centrifuga-tion of a cell homogenate, leading to the separation and isolation of the commoncell organelles. For most biochemical applications, the rotor chamber must bekept at low temperatures to maintain the native structure and function of eachcellular organelle and its component biomolecules. A high-speed centrifugeequipped with a fixed-angle rotor is most appropriate for the first two centrifu-gations at and After each centrifuge run, the supernatant ispoured into another centrifuge tube, which is then rotated at the next higherspeed. The final centrifugation at to sediment microsomes and ribo-somes must be done in an ultracentrifuge. The supernatant, thecytosol, is the soluble portion of the cell and consists of soluble proteins andsmaller molecules.
100,000 * g100,000 * g
20,000 * g.600 * g
STUDY EXERCISE 4.3 Fractional Centrifugation
The enzymes required for the metabolic process of glycolysis are located in the cyto-plasm of the cell. Describe how you could use centrifugation to prepare a cell extractcontaining these enzymes separated from cell organelles.

108 Chapter 4 • Centrifugation Techniques in Biochemistry
Analytical Measurements
A variety of analytical measurements can be made on biological samples duringand after a centrifuge run. Most often, the measurements are taken to determinemolecular weight, density, and purity of biological samples. All analytical tech-niques require the use of an ultracentrifuge and can be classified as differentialor density gradient.
Differential Centrifugation
Differential methods involve sedimentation of particles in a medium of homo-geneous density. Although the technique is similar to preparative differentialcentrifugation as previously discussed, the goal is to measure the sedimenta-tion coefficient of a particle. The underlying principles of this technique areillustrated in Figure 4.12A. During centrifugation, a moving boundary is gen-erated between pure solvent and sedimenting particles. An analytical ultracen-trifuge is capable of detecting and measuring the rate of movement of theboundary. Hence, the sedimentation velocity, can be experimentally deter-mined. By using Equation 4.8, the sedimentation coefficient, s, can be calculated.The value of s for a sedimenting particle is related to the molecular weight ofthat particle by the Svedberg equation. The Svedberg equation is derived fromEquation 4.8 by recognizing that the frictional force, f, may be defined byEquation 4.9.
>> (Eq. 4.9)
where
Thus, Equation 4.8 may be transformed into Equation 4.10.
>> (Eq. 4.10)
Since molecular weight, MW, is equal to Equation 4.10 is converted toEquation 4.11, the Svedberg equation. In this book, two terms are used to definethe molecular masses of biomolecules:
Molecular weight (MW): defined as the ratio of the particle mass to 1/12ththe mass of a C-12 atom. MW has no units because it is a ratio.Molecular mass: defined as the mass of one molecule, or the molar massdivided by Avogadro’s number. Molecular masses are expressed in theunits of daltons (D, 1/12th the mass of a C-12 atom) or kilodaltons (kD).
m0N,
RTs = m0ND (1 - vr)
s =m0 (1 - vr)RT>ND
N = Avogadro’s numberD = the diffusion coefficient of the solute in units of cm2>secT = the absolute temperatureR = the gas constant, 8.3 * 107 g cm2>sec>deg>mole
f =RTND
v,

Chapter 4 • Centrifugation Techniques in Biochemistry 109
Centrifugation time
Forc
e fi
eld
Forc
e fi
eld
Forc
e fi
eld
Sample zone
Density
gradient
1. Centrifuge
tube filled
with density
gradient
solution
1. Uniform
mixture of
sample and
gradient
2. Under centrifugal
force, gradient
redistributes
and sample
particles band
at their
isopycnic positions
2. Sample
applied
to top of
gradient
3. Under centrifugal
force, particles
move at different
rates depending
upon their mass
C
B
A
1 2 3 4
FIGURE 4.12 Acomparison ofdifferential anddensity gradientmeasurements.A Differentialcentrifugation in a medium ofunchanging density.B Zonalcentrifugation in a prepared densitygradient.C Isopycniccentrifugation; thedensity gradientforms duringcentrifugation.
>> (Eq. 4.11)
This equation provides an accurate calculation of molecular weight and is applica-ble to macromolecules such as proteins and nucleic acids. However, its usefulness
MW =RTs
D(1 - vr)

110 Chapter 4 • Centrifugation Techniques in Biochemistry
is limited because diffusion coefficients are difficult to measure and are not readilyavailable in the literature.
An alternative method sometimes used to determine molecular weights ofmacromolecules is sedimentation equilibrium. In the previous example, usingthe Svedberg equation, the sample is rotated at a rate sufficient to sediment theparticles. Here, the sample is rotated at a lower rate, and the particles sedimentuntil they reach an equilibrium position at the point where the centrifugal forceis equal to the frictional component opposing their movement (see Equation 4.6).The molecular weight is then calculated using Equation 4.12.
>> (Eq. 4.12)
where
change in particle concentration as a function of distance from the rotation center, as measured in the ultracentrifuge
and MW, and r have the definitions previously given. This techniqueis time consuming, as the system may require 1 to 2 days to reach equilibrium.Also, the use of Equation 4.12 is complicated by the difficulty of making concen-tration measurements in the ultracentrifuge.
Differential ultracentrifugation methods may also be used in analysis of thepurity of macromolecular samples. If a single sharp moving boundary is observedin a rotating centrifuge cell, it indicates that the sample has one component andtherefore is pure. In an impure sample, each component would be expected toform a separate moving boundary upon sedimentation.
Density-Gradient Centrifugation
In differential procedures, the sample is uniformly distributed in a cell beforecentrifugation, and the initial concentration of the sample is the same through-out the length of the centrifuge cell. Although useful analytical measurementscan be made with this technique, it has disadvantages when applied to impuresamples or samples with more than one component. Large particles that sedi-ment faster pass through a medium consisting of solvent and particles of smallersize. Therefore, clear-cut separations of macromolecules are seldom obtained.This can be avoided if the sample is centrifuged in a fluid medium that graduallyincreases in density from top to bottom. This technique, called density gradientcentrifugation, permits the separation of multi-component mixtures of macro-molecules and the measurement of sedimentation coefficients. Two methods areused, zonal centrifugation, in which the sample is centrifuged in a preformedgradient, and isopycnic centrifugation, in which a self-generating gradientforms during centrifugation.
Zonal Centrifugation
Figure 4.12B outlines the procedure for zonal centrifugation of a mixture ofmacromolecules. A density gradient is prepared in a tube prior to centrifugation.This is accomplished with the use of an automatic gradient mixer. Solutions of
R, T, v, r, v,
dcdr
=
MW =RT
(1 - vr)v2 a 1rcb adcdrb

Chapter 4 • Centrifugation Techniques in Biochemistry 111
low-molecular-weight solutes such as sucrose or glycerol are allowed to flowinto the centrifuge cell. The sample under study is layered on top of the gradientand placed in a swinging-bucket rotor. Sedimentation in an ultracentrifuge resultsin movement of the sample particles at a rate dependent on their individuals values. As shown in Figure 4.12B, the various types of particles sediment aszones and remain separated from the other components. The centrifuge run is ter-minated before any particles reach the bottom of the gradient. The various zonesin the centrifuge tubes are then isolated by collecting fractions from the bottomof the tube and analyzing them for the presence of macromolecules. The zones ofseparated macromolecules are relatively stable in the gradient because it slowsdiffusion and convection. The gradient conditions can be varied by using differ-ent ranges of sucrose concentration. Sucrose concentrations up to 60% can beused, with a density limit of The zonal method can be applied to theseparation and isolation of macromolecules (preparative ultracentrifuge) and tothe determination of s (analytical ultracentrifuge).
Isopycnic Centrifugation
In the isopycnic technique, the density gradient is formed during the centrifuga-tion. Figure 4.12C outlines the mechanism of isopycnic centrifugation. The sam-ple under study is dissolved in a solution of a dense salt such as cesium chlorideor cesium sulfate. The cesium salts may be used to establish gradients to anupper density limit of The solution of biological sample and cesiumsalt is uniformly distributed in a centrifuge tube and rotated in an ultracen-trifuge. Under the influence of the centrifugal force, the cesium salt redistributesto form a continuously increasing density gradient from the top to the bottom.The macromolecules of the biological sample seek an area in the tube where thedensity is equal to their respective densities. That is, the macromolecules moveto a region where the sum of the forces (centrifugal and frictional) is zero(Equation 4.6). The macromolecules either sediment or float to this region ofequal density. Stable zones or bands of the individual components are formedin the gradient (see Figure 4.12C). These bands can be isolated as previouslydescribed. Cesium salt gradients are especially valuable for separation ofnucleic acids.
Density gradients are widely used in separating and purifying biologicalsamples. In addition to this preparative application, measurements of s can bemade. Gradient techniques used to isolate and purify subcellular componentssuch as microsomes, ribosomes, lysosomes, mitochondria, peroxisomes, chloro-plasts, and others. After isolation, they may be biochemically characterized as totheir protein, lipid, nucleic acid, and enzyme contents.
Nucleic acids, in particular, have been extensively studied by density gra-dient techniques. Both RNA and DNA are routinely classified according to theirs values. The different structural forms of DNA discussed in Chapter 9 can bedetermined by density gradient centrifugation.
A summary of centrifugation techniques and applications described in thischapter is provided in Table 4.2. Space does not allow for an exhaustive review ofcentrifuge applications. Interested students should consult the references at theend of the chapter for recent developments.
1.8 g>cm3.
1.28 g>cm3.

Care of Centrifuges and Rotors
Centrifuge equipment represents a sizable investment for a laboratory, so propermaintenance is essential. In addition, poorly maintained equipment is especiallydangerous. Since many kinds of instruments are now available, specific instruc-tions will not be given here, but general guidelines are outlined below.
1. Carefully read the operating manual or receive proper instructions beforeyou use any centrifuge.
2. Check the rotor chamber for cleanliness and for damage. Clean with soapand warm water, rinse with distilled water, and dry.
3. Select the proper operating conditions on the instrument. If refrigeration isnecessary, set the temperature to the appropriate level and allow 1 to 2 hoursfor temperature equilibration.
4. Select the proper rotor. Many sizes and types are available. Follow guide-lines already stated in this chapter or consult your instructor.
5. Be sure the rotor is clean and undamaged. Observe any nicks, scratches, orother damage that may cause imbalance. If dirty, the rotor should be cleanedwith warm water and a mild, nonbasic detergent. A soft brush can be usedinside the cavities. Rinse well with distilled water and dry. Scratches shouldnot be made on the surface coating, as corrosion may result.
6. Filled centrifuge tubes or bottles should be weighed carefully and balancedbefore centrifugation.
7. Rotor manufacturers provide a maximum allowable speed limit for eachrotor. Do not exceed that limit.
112 Chapter 4 • Centrifugation Techniques in Biochemistry
TABLE 4.2 A Summary of Centrifuge Techniques and Applications
Centrifuge Techniques Applications
PreparativeVelocity sedimentationcentrifugation (pelleting)
Separation and isolation of particles in a solution. May be applied toprecipitates, cell organelles, cells, or biomolecules.
Fractional centrifugation Isolation of particles, based on size, by successive centrifugation at increasingrotor speeds. May be used to separate cell organelles (Figure 4.11).
AnalyticalDifferential centrifugation Sedimentation of particles in a medium of homogeneous density.
Used to measure the sedimentation coefficient, s, and MW of a particle(Figure 4.12A).
Sedimentation equilibriumcentrifugation
Used to determine MW of a macromolecule or other particle.
Density gradient centrifugation
Zonal Gradient is present in the tube before centrifugation and sample is layered on top. Used to isolate purified molecules and determine s.
Isopycnic Gradient is formed during centrifugation. Used to isolate purified moleculesand determine s.

Chapter 4 • Centrifugation Techniques in Biochemistry 113
8. Keep an accurate record of centrifuge and rotor use. Just as your automobileneeds service after a certain number of miles, the centrifuge should be serv-iced after certain intervals of use. Centrifuge maintenance is usually deter-mined by hours of use and total revolutions of the rotor. It is also essential tomaintain a record of the use for each rotor. Metal rotors weaken with use,and the maximum allowable speed limit decreases. Rotor manufacturersusually provide guidelines for decreasing the allowable speed for a rotor(derating a rotor).
9. If an unusual noise or vibration develops during centrifugation, immedi-ately turn the centrifuge off.
10. Carefully clean the rotor chamber and rotor after each centrifugation.
Study Problems
1. Which of the following factors will have an effect on the sedimentation rate of a particleduring centrifugation?(a) Mass of the sedimenting particle(b) Angular velocity of rotation(c) Atmospheric pressure(d) Density of the solvent
2. You wish to centrifuge a biological sample so that it experiences an RCF of At what rpm must you set the centrifuge assuming an average r value of 4?
3. Cytochrome c has an s value of second and hemoglobin an s value of aboutsecond. Which protein has the larger molecular weight?
4. An enzyme has a sedimentation coefficient of 3.5 S. When a substrate molecule is boundinto the active site of the enzyme, the sedimentation coefficient decreases to 3.0 S.Explain this change.
5. A protein with a molecular weight of 100,000 shows a single boundary when cen-trifuged in aqueous buffer. If the protein is centrifuged in a medium of the same bufferplus 6 M urea, two boundaries are observed, one corresponding to a molecular weightof 10,000, the other to a molecular weight of 30,000. The area of the slower peak is two-thirds that of the faster. Describe the subunit structure of the protein.
6. Describe how you would design a centrifuge experiment to isolate sediments contain-ing cell nuclei.
7. Explain the following observation. The density of DNA in 7 M CsCl containingis less than the density of the same DNA in pure 7 M CsCl.
8. Assume that you have centrifuged in a density gradient a sample of DNA that con-tained both closed, circular DNA and supercoiled DNA. Would you expect to see twobands in the sedimentation pattern? Explain.
9. Assume that a centrifuge is operating at 43,000 rpm. What is the relative centrifugalforce at a distance from the central axis of 6 cm?
10. You are spinning a sample at 20,000 rpm in a centrifuge. Use Equation 4.2 to calculatethe RCF at three locations in the tube, and (seeFigure 4.1). Compare and explain the differences in the RCF values at the three locations.
11. Could you use a low-speed centrifuge to sediment mitochondria? Explain.12. The sedimentation coefficient (S, in Svedberg units) for an unknown protein you are
studying is between 1 and 2. If you isolate the protein from a cell homogenate by car-rying out fractional centrifugation (Figure 4.11), in what fraction do you expect to findthe unknown protein?
r = 10.8 cmr = 3.2 cm, r = 7.0 cm,
0.15MMgCl2
4.5 * 10-131 * 10-13
100,000 * g.

114 Chapter 4 • Centrifugation Techniques in Biochemistry
Further Reading
J. Berg, J. Tymoczko, and L. Stryer, Biochemistry, 6th ed. (2007), W. H. Freeman (New York).Centrifugation in biochemistry.
D. Cantor and P. Schimmel, Biophysical Chemistry, Part II (1980), W. H. Freeman (SanFrancisco), pp. 591–641. Excellent, but advanced, treatment of theory and applica-tions of analytical centrifugation.
R. Garrett and C. Grisham, Biochemistry, 4th ed. (2010), Cengage Learning (Belmont, CA).Techniques of centrifugation.
J. Graham and D. Rickwood, Biological Centrifugation (2001), Springer Verlag (New York).Applications of centrifugation in biology.
E. Holme and H. Peck, Analytical Biochemistry, 3rd ed. (1998), Addison-WesleyLongman (Essex, U.K.), pp. 153–163. Principles of centrifugation.
N. Price, R. Dwek, and M. Wormald, Principles and Problems in Physical Chemistry forBiochemists, 3rd ed. (2002), Oxford University Press (Oxford).
S. Sawhney and R. Singh (Editors), Introductory Practical Biochemistry, (2005), AlphaScience International (Oxford, U. K.).
D. Sheehan, Physical Biochemistry: Principles and Applications, 2nd ed. (2009),Wiley-Blackwell (Hoboken, NJ), pp. 266–278. Centrifugation.
I. Tinoco, K. Sauer, J. Wang, and J. Puglisi, Physical Chemistry: Principles andApplications in Biological Sciences, 4th ed. (2002), Prentice Hall (Upper SaddleRiver, NJ). Chapter 6 covers centrifugation and sedimentation.
D. Voet and J. Voet, Biochemistry, 3rd ed. (2005), John Wiley & Sons (Hoboken, NJ).Centrifugation in protein purification.
D. Voet, J. Voet, and C. Pratt, Fundamentals of Biochemistry, 3rd ed. (2008), John Wiley &Sons (Hoboken, NJ). Ultracentrifugation of proteins and nucleic acids.
K. Wilson and J. Walker, Editors, Principles and Techniques of Practical Biochemistry,5th ed. (2000), Cambridge University Press (Cambridge), pp. 263–311. “Techniquesin Centrifugation.”
http://www.beckman.comClick on “Centrifuges” and follow links to “Applications,” “Literature,” “Rotor
Calculations,” etc.
http://www.metrohmusa.comEppendorf centrifuges.
http://www.thermo.com/com/cda/landingpage/0,,128,00.htmlThermo Fisher Scientific Sorvall centrifuges.
http://www.piramoon.comNew carbon-fiber rotors by Fiberlite Centrifuge, Inc.
Additional Web sites for this chapter are available on the book’s Companion Website,which can be found at http://www.chemplace.com.

5PURIFICATION AND ANALYSIS OF BIOMOLECULES BY CHROMATOGRAPHY
115
The primary goal of biochemical research is to understand the molecular nature of lifeprocesses. The molecular details of a biological process cannot be fully elucidated untilthe interacting molecules have been isolated and characterized. Therefore, our under-
standing of the mechanisms of life processes has increased at about the same pace as thedevelopment of techniques for the separation and characterization of biomolecules.
Chromatography, the most important technique for isolating and purifying biomole-cules, was developed by Mikhail Tswett, an Italian-born, Russian botanist. In 1902, Tswettbegan his studies on the isolation and characterization of the colorful pigments in plantchloroplasts. He prepared separating columns by packing fine powders like sucrose and chalk(calcium carbonate) into long glass tubes. He then poured petroleum ether-derived plantextracts through the columns. As he continued eluting the columns with solvent, he noted theformation of yellow and green zones. Tswett had invented “chromatography,” which he
A. Introduction to Chromatography 116B. Planar Chromatography (Paper and TLC) 118C. Column Chromatography 122D. Ion-Exchange Chromatography 126E. Gel-Exclusion Chromatography 132F. High-Performance Liquid Chromatography (HPLC) 140G. Affinity Chromatography and Immunoadsorption 152H. Membrane-Based Chromatography 159
Study Problems 161Further Reading 163
C H A P T E R

116 Chapter 5 • Purification and Analysis of Biomolecules by Chromatography
defined in his 1906 publication as “a method in which the components of a mix-ture are separated on an adsorbent in a flowing solvent.” In addition to introduc-ing a new technique, Tswett also showed by these experiments that chlorophyllexists in different forms. From such humble beginnings, chromatography has de-veloped into the ultimate tool for not only the isolation and purification, but alsofor the characterization, of biomolecules. Chromatography, which has now beenexpanded into multiple forms, continues to be the most effective technique forseparating and purifying all types of biomolecules. In addition, it is widely usedas an analytical tool to measure biophysical and other quantitative properties ofmolecules.
A. INTRODUCTION TO CHROMATOGRAPHY
All types of chromatography are based on a very simple concept: The sampleto be examined is allowed to interact with two physically distinct entities—amobile phase and a stationary phase (see Figure 5.1). The sample most oftencontains a mixture of several components to be separated. The moleculestargeted for analysis are called analytes. The mobile phase, which may be aliquid or gas, moves the sample components through a region containing thesolid or liquid stationary phase, which is called the sorbent. Because it variesfrom one chromatographic method to another, the stationary phase will not bedescribed in detail at this time. However, it may be considered as havingthe ability to “bind” some types of analytes. The molecular components in thesample distribute themselves between the mobile phase and sorbent and thushave the opportunity to interact intimately with the stationary phase. If someof the sample molecules (analytes) are preferentially bound by the sorbent,they spend more time in the sorbent and are retarded in their movementthrough the chromatographic system. Molecules that show weak affinity forthe sorbent spend more time with the mobile phase and are more easilyremoved or eluted from the system. The many interactions that occur betweenanalytes and the stationary phase sorbent bring about a separation of
A,B,C = Analyte molecules
= Stationary phase (sorbent)
Mobile phase
B
B
B
C
C
C
A
A
A
FIGURE 5.1 Arepresentation ofthe principles ofchromatography.
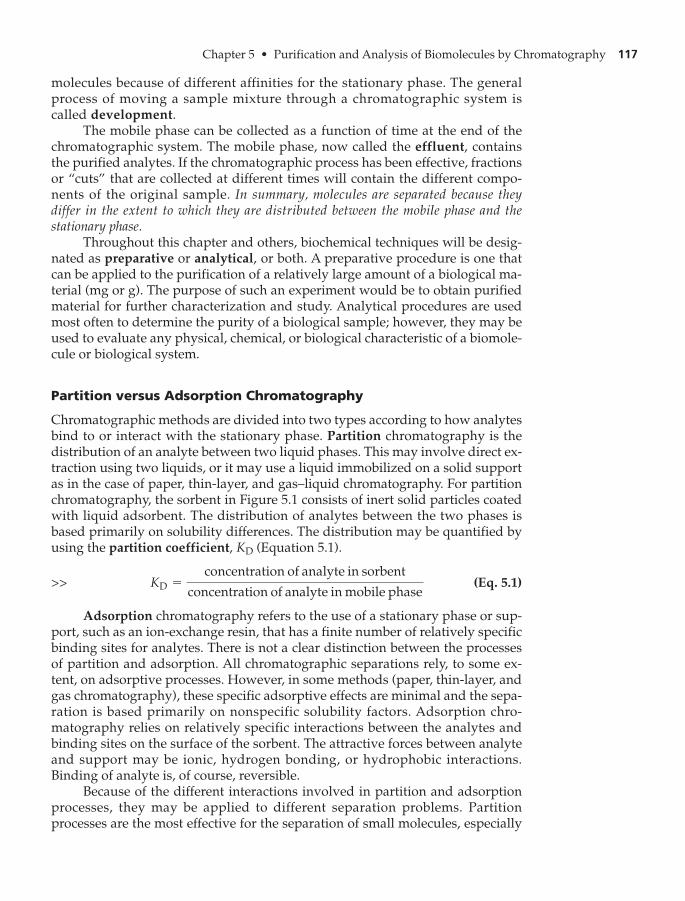
Chapter 5 • Purification and Analysis of Biomolecules by Chromatography 117
molecules because of different affinities for the stationary phase. The generalprocess of moving a sample mixture through a chromatographic system iscalled development.
The mobile phase can be collected as a function of time at the end of thechromatographic system. The mobile phase, now called the effluent, containsthe purified analytes. If the chromatographic process has been effective, fractionsor “cuts” that are collected at different times will contain the different compo-nents of the original sample. In summary, molecules are separated because theydiffer in the extent to which they are distributed between the mobile phase and thestationary phase.
Throughout this chapter and others, biochemical techniques will be desig-nated as preparative or analytical, or both. A preparative procedure is one thatcan be applied to the purification of a relatively large amount of a biological ma-terial (mg or g). The purpose of such an experiment would be to obtain purifiedmaterial for further characterization and study. Analytical procedures are usedmost often to determine the purity of a biological sample; however, they may beused to evaluate any physical, chemical, or biological characteristic of a biomole-cule or biological system.
Partition versus Adsorption Chromatography
Chromatographic methods are divided into two types according to how analytesbind to or interact with the stationary phase. Partition chromatography is thedistribution of an analyte between two liquid phases. This may involve direct ex-traction using two liquids, or it may use a liquid immobilized on a solid supportas in the case of paper, thin-layer, and gas–liquid chromatography. For partitionchromatography, the sorbent in Figure 5.1 consists of inert solid particles coatedwith liquid adsorbent. The distribution of analytes between the two phases isbased primarily on solubility differences. The distribution may be quantified byusing the partition coefficient, (Equation 5.1).
>> (Eq. 5.1)
Adsorption chromatography refers to the use of a stationary phase or sup-port, such as an ion-exchange resin, that has a finite number of relatively specificbinding sites for analytes. There is not a clear distinction between the processesof partition and adsorption. All chromatographic separations rely, to some ex-tent, on adsorptive processes. However, in some methods (paper, thin-layer, andgas chromatography), these specific adsorptive effects are minimal and the sepa-ration is based primarily on nonspecific solubility factors. Adsorption chro-matography relies on relatively specific interactions between the analytes andbinding sites on the surface of the sorbent. The attractive forces between analyteand support may be ionic, hydrogen bonding, or hydrophobic interactions.Binding of analyte is, of course, reversible.
Because of the different interactions involved in partition and adsorptionprocesses, they may be applied to different separation problems. Partitionprocesses are the most effective for the separation of small molecules, especially
KD =concentration of analyte in sorbent
concentration of analyte in mobile phase
KD

118 Chapter 5 • Purification and Analysis of Biomolecules by Chromatography
those in homologous series. Partition chromatography has been widely used forthe separation and identification of amino acids, carbohydrates, and fatty acids.Adsorption techniques, represented by ion-exchange chromatography, are mosteffective when applied to the separation of macromolecules including proteinsand nucleic acids.
In the rest of the chapter, various chromatographic methods will be dis-cussed. You should recognize that no single chromatographic technique reliessolely on adsorption or partition effects. Therefore, little emphasis will be placedon classification of the techniques; instead, theoretical and practical aspects willbe discussed.
B. PLANAR CHROMATOGRAPHY (PAPER AND THIN-LAYER CHROMATOGRAPHY)
Because of the similarities in the theory and practice of these two procedures,they will be considered together. Both are examples of partition chromatogra-phy. In paper chromatography, the cellulose support is extensively hydrated,so distribution of the analyte occurs between the immobilized water (sorbent)and the mobile developing solvent. The initial stationary liquid phase in thin-layer chromatography (TLC) is the solvent used to prepare the thin layer ofadsorbent. However, as developing solvent molecules move through thesorbent, polar solvent molecules may bind to the immobilized support andbecome the sorbent.
Preparation of the Sorbent
The support medium may be a sheet of cellulose or a glass or plastic plate cov-ered with a thin coating of silica gel, alumina, or cellulose. Large sheets of cellu-lose chromatography paper are available in different porosities. These may becut to the appropriate size and used without further treatment. The paper shouldnever be handled with bare fingers. Although thin-layer plates can easily be pre-pared, it is much more convenient to purchase ready-made plates. These areavailable in a variety of sizes, materials, and thicknesses of stationary support.They are relatively inexpensive and have a more uniform support thickness thanhandmade plates.
Figure 5.2 outlines the application procedure. The sample to be analyzed isusually dissolved in a volatile solvent. A very small drop of solution is spottedonto the plate with a disposable microcapillary pipet and allowed to dry; thenthe spotting process is repeated by superimposing more drops on the originalspot. The exact amount of sample applied is critical. There must be enough sam-ple so the developed spots can be detected, but overloading will lead to “tailing”and lack of resolution. Finding the proper sample size is a matter of trial anderror. It is usually recommended that two or three spots of different concentra-tions be applied for each sample tested. Spots should be applied along a veryfaint line drawn with a pencil and ruler. TLC plates should not be heavilyscratched or marked. Identifying marks may be made on the top of the chro-matogram, where solvent does not reach.

Chapter 5 • Purification and Analysis of Biomolecules by Chromatography 119
D C
A B
TLC
plate
Origin
Detection
Solvent development
Solvent
front
Solvent
C
B
w
x
y
For B, Rf = w
y
For C, Rf = x
y
FIGURE 5.2 The procedure of paper and thin-layer chromatography. A Application of thesample. B Setting plate in solvent chamber. C Movement of solvent by capillary action. D Detection of separated components and calculation of Rf.
Solvent Development
A wide selection of solvent systems is available in the biochemical literature. If anew solvent system must be developed, a preliminary analysis must be done onthe sample with a series of solvents. Solvents can be rapidly screened by develop-ing several small chromatograms in small sealed bottles containingthe solvents. For the actual analysis, the sample should be run on a larger platewith appropriate standards in a development chamber (Figure 5.3). The chambermust be airtight and saturated with solvent vapors. Filter paper on two sides ofthe chamber, as shown in Figure 5.3, enhances vaporization of the solvent.
Paper chromatograms may be developed in either of two types ofarrangements—ascending or descending solvent flow. Descending solventflow leads to faster development because of assistance by gravity, and it canoffer better resolution for compounds with small values because the solventcan be allowed to run off the paper. values cannot be determined underthese conditions, but it is useful for qualitative separations.
Rf
Rf
12 * 6 cm2

120 Chapter 5 • Purification and Analysis of Biomolecules by Chromatography
Cover
Filter paper
Plate
Solvent
FIGURE 5.3 Atypical chamberfor paper and thin-layerchromatography.
Two-dimensional chromatography is used for especially difficult separa-tions. The chromatogram is developed in one direction by a solvent system, airdried, turned and developed in a second solvent system.
Detection and Measurement of Components
Unless the components in the sample are colored, their location on a chro-matogram will not be obvious after solvent development. Several methods canbe used to locate the spots, including fluorescence, radioactivity, and treatmentwith chemicals that develop colors. Substances that are highly conjugated maybe detected by fluorescence under a UV lamp. Chromatograms may be treatedwith different types of reagents to develop a color. Universal reagents produce acolored spot with any organic compound. When a solvent-developed plate issprayed with concentrated and heated at for a few minutes, allorganic substances appear as black spots. A more convenient universal reagent is
The solvent-developed chromatogram is placed in an enclosed chambercontaining a few crystals of The vapor reacts with most organic substanceson the plate to produce brown spots. The spots are more intense withunsaturated compounds.
Specific reagents react with a particular class of compound. For example,rhodamine B is often used for visualization of lipids, ninhydrin for amino acids,and aniline phthalate for carbohydrates.
The position of each component of a mixture is quantified by calculatingthe distance traveled by the component relative to the distance traveled by thesolvent. This is called relative mobility and symbolized by In Figure 5.2D,the values for components B and C are calculated. The for a substance is aconstant for a certain set of experimental conditions. However, it varies with
RfRfRf.
I2I2.I2.
100°CH2SO4
90°,

Chapter 5 • Purification and Analysis of Biomolecules by Chromatography 121
solvent, type of stationary support (paper, alumina, silica gel), temperature,humidity, and other environmental factors. values are always reported alongwith solvent and temperature.
Applications of Planar Chromatography
Thin-layer chromatography is now more widely used than paper chromatography.In addition to its greater resolving power, TLC is faster and plates are available withseveral sorbents (cellulose, alumina, silica gel).
Partition chromatography as described in this section may be applied to twomajor types of problems: (1) identification of unknown samples, and (2) isolation ofthe components of a mixture. The first application is, by far, the more widely used.Paper chromatography and TLC require only a minute sample size, the analysis isfast and inexpensive, and detection is straightforward. Unknown samples areapplied to a plate along with appropriate standards, and the chromatogram isdeveloped as a single experiment. In this way, any changes in experimental condi-tions (temperature, humidity, etc.) affect standards and unknowns to the sameextent. It is then possible to compare the values directly.
Purified substances can be isolated from developed chromatograms; how-ever, only tiny amounts are present. In paper chromatography, the spot may becut out with scissors and the piece of paper extracted with an appropriate sol-vent. Isolation of a substance from a TLC plate is accomplished by scraping thesolid support from the region of the spot with a knife edge or razor blade and ex-tracting the sorbent with a solvent. “Preparative” thin-layer plates with a thickcoating of sorbent (up to 2 mm) are especially useful because they have highersample capacity.
Rf
Rf
STUDY EXERCISE 5.1 Planar Chromatography
A mixture containing five amino acids (Ala, Asp, Gly, Phe, Pro) was analyzed usingtwo methods of planar chromatography, paper and cellulose-coated thin layer. The sol-vent system was n-propanol/water (70/30 v/v). Predict the order of the mobility ofthe amino acids (low to high ) on the chromatograms.
Solution: In cellulose planar chromatography, the amino acids interact with twophases, the sorbent (extensively hydrated cellulose, which is very polar) and the mobilephase (n-propanol/water, which is less polar than the sorbent). The more polar theamino acid, the stronger it will interact with the hydrated cellulose, thus the slower itwill move with solvent during development (lower ). The order may be predicted bylooking at the polarity of each amino acid side chain and arranging the amino acids inorder of decreasing polarity. The correct order of migration (low to high ) is: Asp, Gly,Ala, Pro, Phe.
Rf
Rf
RfRf
Advanced Planar Chromatography
The applications of planar chromatography listed above require only minimalequipment and supplies that are relatively inexpensive. It is likely that every un-dergraduate student majoring in biochemistry or molecular biology has

122 Chapter 5 • Purification and Analysis of Biomolecules by Chromatography
completed such an experiment in a science lab. If more complex, sophisticatedchromatographic analyses are needed, such as in an academic or biotechresearch laboratory, then advanced equipment and specialized techniques mustbe used. Most new advances in planar chromatography have focused on TLC, aspaper chromatography is very limited in its applications and flexibility. Themajor characteristics in TLC that have been improved include standardizedmethodology, instrumentation, and more effective stationary phases. Thesechanges now make possible the advent of high-performance TLC (HPTLC).
One of the biggest problems with TLC analysis is that experimental condi-tions are difficult to duplicate. Separation of the components of a mixture isdependent on environmental conditions such as temperature, humidity, andextent of solvent saturation in the chamber. These conditions can be controlledby running the chromatography experiment in a specialized, commerciallyavailable enclosure called a plate development chamber. This leads to muchmore reproducible and standardized results.
Improvements are also being made in the development of new stationaryphases. The most widely used stationary phase in TLC is silica, which separatesmolecules on the basis of polarity. (The more polar the component, the stronger itinteracts with the very polar silica; hence, it migrates more slowly than a nonpo-lar component.) As silica separates primarily by polarity, this limits the types ofmolecules that can be separated. There is now strong interest in the developmentof reverse stationary phases such as C-18 functionalized silica to separate nonpo-lar molecules. Another limitation of silica is that it can be used only to separatebiomolecules less than 2000-3000 in molecular weight. New and more porousstationary phases are being developed using photopolymerization techniques.These new stationary phases are able to separate protein mixtures containinginsulin cytochrome lysozyme and myoglobin
C. COLUMN CHROMATOGRAPHY
Adsorption chromatography in biochemical applications usually consists of asolid stationary phase and a liquid mobile phase. The most useful technique iscolumn chromatography, in which the stationary phase is confined to a glass orplastic tube and the mobile phase (a solvent or buffer) is allowed to flow throughthe solid adsorbent. A small amount of the sample to be analyzed is layered ontop of the column. The sample mixture enters the column of adsorbing materialand the molecules present are distributed between the mobile phase and the sta-tionary phase. The various components in the sample have different affinities forthe two phases and move through the column at different rates. Collection of theliquid phase emerging from the column yields separate fractions containing theindividual components in the sample.
Specific terminology is used to describe various aspects of column chro-matography. When the actual adsorbing material is made into a column, it is saidto be poured or packed. Application of the sample to the top of the column isloading the column. Movement of solvent through the loaded column is calleddeveloping or eluting the column. The bed volume is the total volume of solvent
1MW = 16,9002. 1MW = 14,6002,c 1MW = 13,0002,1MW = 57002,

Chapter 5 • Purification and Analysis of Biomolecules by Chromatography 123
TABLE 5.1 Adsorbents Useful in Biochemical Applications
Adsorbing Materials Uses
Alumina Small organics, lipids
Silica gel Amino acids, lipids, carbohydrates
Fluorisil (magnesium silicate) Neutral lipids
Calcium phosphate (hydroxyapatite) Proteins, polynucleotides, nucleic acids
Cellulose Proteins
TABLE 5.2 Mesh Sizes of Adsorbents and Typical Applications
Mesh Sizes Applications
20–50 Crude preparative work, very high flow rate
50–100 Preparative applications, high flow rate
100–200 Analytical separations, medium flow rate
200–400 High-resolution analytical separations, low flow rate
and adsorbing material taken up by the column. The volume taken up by the liq-uid phase in the column is the void volume. The elution volume is the amount ofsolvent required to remove a particular analyte from the column. This is analo-gous to values in planar chromatography.
In adsorption chromatography, solute molecules take part in specific interac-tions with the stationary phase. Herein lies the great versatility of adsorptionchromatography. Many varieties of adsorbing materials are available, so a specificsorbent can be chosen that will effectively separate a mixture. There is still anelement of trial and error in the selection of an effective stationary phase. However,experiences of many investigators are recorded in the literature and are of greathelp in choosing the proper system. Table 5.1 lists the most common stationaryphases employed in adsorption column chromatography.
Adsorbing materials come in various forms and sizes. The most suitableforms are dry powders or a slurry form of the material in an aqueous buffer ororganic solvent. Alumina, silica gel, and fluorisil do not normally need special pre-treatment. The size of particles in an adsorbing material is defined by mesh size.This refers to a standard sieve through which the particles can pass. A 100-meshsieve has 100 small openings per square inch. Adsorbing material with high meshsize (400 and greater) is extremely fine and is most useful for very high resolutionchromatography. Table 5.2 lists standard mesh sizes and their most appropriateapplications. For most biochemical applications, 100 to 200 mesh size is suitable.
Operation of a Chromatographic Column
A typical column setup is shown in Figure 5.4. The heart of the system is, ofcourse, the column of adsorbent. In general, the longer the column, the better theresolution of components. However, a compromise must be made because flow
Rf

124 Chapter 5 • Purification and Analysis of Biomolecules by Chromatography
rate decreases with increasing column length. The actual size of a columndepends on the nature of the adsorbing material and the amount of chemicalsample to be separated. For preparative purposes, column heights of 20 to 50 cmare usually sufficient to achieve acceptable resolution. Column inside diametersmay vary from 0.5 to 5 cm.
Packing the Column
Once the adsorbing material and column size have been selected, the column ispoured. If the tube does not have a fritted disc in the bottom, a small piece ofglass wool or cotton should be used to support the column. Most columns arepacked by pouring a slurry of the sorbent into the tube and allowing it to settleby gravity into a tight bed. The slurry is prepared with the solvent or buffer thatwill be used as the initial developing solvent. Pouring of the slurry must be con-tinuous to avoid formation of sorbent layers. Excess solvent is eluted from the
Fraction
collector
UV monitor
Column
Buffer
reservoir
Laptop computer
Optics
module/monitor
ControllerCables
Tubing
FIGURE 5.4 Setupfor the operation ofa chromatographycolumn.

Chapter 5 • Purification and Analysis of Biomolecules by Chromatography 125
bottom of the column while the sorbent is settling. The column must never rundry. Additional slurry is added until the column bed reaches the desired height.The top of the settled adsorbent is then covered with a small circle of filter paperor glass wool to protect the surface while the column is loaded with sample orthe eluting solvent is changed.
Sometimes it is necessary to pack a column under pressure (5 to 10 psi). Thisleads to a tightly packed bed that yields more reproducible results, especiallywith gradient elution (see the following subsections).
Loading the Column
The sample to be analyzed by chromatography should be applied to the topof the column in a concentrated form. If the sample is solid, it is dissolved ina minimum amount of solvent; if already in solution, it may be concentratedby ultrafiltration as described in Chapter 3, p. 74. After the sample is loadedonto the column with a graduated or disposable pipet, it is allowed to perco-late into the adsorbent. A few milliliters of solvent are then carefully added towash the sample into the column material. The column is then filled witheluting solvent.
Eluting the Column
The chromatography column is developed by continuous flow of a solvent.Maintaining the appropriate flow rate is important for effective separation. If theflow rate is set too high, there is not sufficient time for complete equilibration of theanalytes with the two phases. Too low a flow rate allows diffusion of analytes, whichleads to poor resolution and broad elution peaks. It is difficult to give guidelines forthe proper flow rate of a column, but, in general, a column should be adjusted to arate slightly less than “free flow.” Sometimes it is necessary to find the proper flowrate by trial and error. One problem encountered during column development is achanging flow rate. As the solvent height above the column bed is reduced, there isless of a “pressure head” on the column, so the flow rate decreases. This can beavoided by storing the developing solvent in a large reservoir and allowing it toenter the column at the same rate as it is emerging from the column (see Figure 5.4).
Adsorption columns are eluted in one of three ways. All components maybe eluted by a single solvent or buffer. This is referred to as continual elution. Incontrast, stepwise elution refers to an incremental change of solvent to aid de-velopment. The column is first eluted with a volume of one solvent and thenwith a second solvent. This may continue with as many solvents or solvent mix-tures as desired. In general, the first solvent should be the least polar of any usedin the analysis, and each additional solvent should be of greater polarity or ionicstrength. Finally, adsorption columns may be developed by gradient elutionbrought about by a gradual change in solvent composition. The composition ofthe eluting solvent can be changed by the continuous mixing of two different sol-vents to gradually change the ratio of the two solvents. Alternatively, the concen-tration of a component in the solvent can be gradually increased. This is mostoften done by addition of a salt (KCl, NaCl, etc.). Devices are commercially avail-able to prepare predetermined, reproducible gradients.

126 Chapter 5 • Purification and Analysis of Biomolecules by Chromatography
Collecting the Eluent
The separated components emerging from the column in the eluent are usuallycollected as discrete fractions. This may be done manually by collecting specifiedvolumes of eluent in Erlenmeyer flasks or test tubes. Alternatively, if manyfractions are to be collected, a mechanical fraction collector is convenient andeven essential. An automatic fraction collector (see Figure 5.4) directs the eluentinto a single tube until a predetermined volume has been collected or until a pre-selected time period has elapsed; then the collector advances another tube forcollection. Specified volumes are collected by a drop counter activated by a pho-tocell, or a timer can be set to collect a fraction over a specific period.
Detection of Eluting Components
The completion of a chromatographic experiment calls for a means to detect thepresence of analytes in the collected fractions. The detection method used willdepend on the nature of the analytes. Smaller molecules such as lipids, aminoacids, and carbohydrates can be detected by spotting fractions on a thin-layerplate or a piece of filter paper and treating them with a chemical reagent that pro-duces a color. The same reagents that are used to visualize spots on a thin-layer orpaper chromatogram are useful for this. Proteins and nucleic acids are conve-niently detected by spectroscopic absorption measurements at 280 and 260 nm,respectively. Enzymes can be detected by measurements of catalytic activity asso-ciated with each fraction. Research-grade chromatographic systems are equippedwith detectors that continuously monitor some physical property of the eluentand display the separation results on a computer screen (see Figure 5.4). Thenewest advance in detectors is the diode array (see Chapter 7, pp. 210–211). Mostoften the eluent is directed through a flow cell where absorbance or fluorescencecharacteristics can be measured. The detector is connected to a recorder or com-puter for a permanent record of spectroscopic changes. When the location of thevarious analytes is determined, adjacent fractions containing identical compo-nents are pooled and stored for later use.
D. ION-EXCHANGE CHROMATOGRAPHY
Ion-exchange chromatography is a form of adsorption chromatography in whichionic analytes display reversible electrostatic interactions with a charged station-ary phase. The chromatographic setup is identical to that described in the lastsection and Figure 5.4. The column is packed with a stationary phase consistingof a synthetic resin that is tagged with ionic functional groups. The steps in-volved in ion-exchange chromatography are outlined in Figure 5.5. In stage 1,the insoluble resin material (positively charged) in the column is surrounded bybuffer counterions. Loading of the column in stage 2 brings analytes of differentcharge into the ion-exchange medium. Solutes entering the column may be neg-atively charged, positively charged, or neutral under the experimental condi-tions. Analytes that have a charge opposite to that of the resin bind tightly butreversibly to the stationary phase (stage 3). The strength of binding depends onthe size of the charge and the charge density (amount of charge per unit volumeof molecule) of the analyte. The greater the charge or the charge density, the

Chapter 5 • Purification and Analysis of Biomolecules by Chromatography 127
stronger the interaction. Neutral analytes or those with a charge identical tothat of the resin show little or no affinity for the stationary phase and move withthe eluting buffer. The bound analytes can be released by eluting the columnwith a buffer of increased ionic strength or pH (stage 4). An increase in bufferionic strength releases bound analytes by displacement. Increasing the buffer pHdecreases the strength of the interaction by reducing the charge on the analyte oron the resin (stage 5).
The following sections will focus on the properties of ion-exchange resins,selection of experimental conditions, and applications of ion-exchangechromatography.
Ion-Exchange Resins
Ion exchangers are made up of two parts—an insoluble, three-dimensionalmatrix and chemically bonded charged groups within and on the surface of thematrix. The resins are prepared from a variety of materials, including poly-styrene, acrylic resins, polysaccharides (dextrans), agarose, and celluloses. Anion exchanger is classified as cationic or anionic depending on whether it ex-changes cations or anions. A resin that has negatively charged functionalgroups exchanges positive ions and is a cation exchanger. Each type ofexchanger is also classified as strong or weak according to the ionizingstrength of the functional group. An exchanger with a quaternary amino groupis, therefore, a strongly basic anion exchanger, whereas primary or secondaryaromatic or aliphatic amino groups would lead to a weakly basic anionexchanger. A strongly acidic cation exchanger contains the sulfonic acidgroup. Table 5.3 lists the common ion exchangers according to each of theseclassifications.
The ability of an ion exchanger to adsorb counterions is defined quanti-tatively by capacity. The total capacity of an ion exchanger is the quantity ofcharged and potentially charged groups per unit weight of dry exchanger. It isusually expressed as milliequivalents of ionizable groups per milligram of dryweight, and it can be experimentally determined by titration. The capacity ofan ion exchanger is a function of the porosity of the resin. The resin matrixcontains covalent cross-linking that creates a “molecular sieve.” Ionized func-tional groups within the matrix are not readily accessible to large moleculesthat cannot fit into the pores. Only surface charges would be available to these
1¢2
1 2 3 4 5
FIGURE 5.5 Illustration of the principles of ion-exchange chromatography. See text for explanation.

128 Chapter 5 • Purification and Analysis of Biomolecules by Chromatography
molecules for exchange. The purely synthetic resins (polystyrene and acrylic)have cross-linking ranging from 2 to 16%, with 8% being the best for generalpurposes.
With so many different experimental options and resin properties to consider,it is difficult to select the proper conditions for a particular separation. The next sec-tion will outline the choices and offer guidelines for proper experimental design.
Selection of the Ion Exchanger
Before a proper choice of ion exchanger can be made, the nature of the moleculesto be separated must be considered. For relatively small, stable molecules (aminoacids, lipids, nucleotides, carbohydrates, pigments, etc.) the synthetic resinsbased on polystyrene are most effective. They have relatively high capacity forsmall molecules because the extensive cross-linking still allows access to the inte-rior of the resin beads. For separations of peptides, proteins, nucleic acids, poly-saccharides, and other large biomolecules, one must consider the use of fibrouscellulosic ion exchangers and low-percent cross-linked dextran or acrylic ex-changers. The immobilized functional groups in these resins are readily availablefor exchange even to larger molecules.
The choice of ion exchanger has now been narrowed considerably. The nextdecision is whether to use a cationic or anionic exchanger. If the analyte has onlyone type of charged group, the choice is simple. A molecule that has a positive
TABLE 5.3 Ion-Exchange Resins
Name Functional Group Matrix Class
Anion Exchangers
AG 1 Tetramethylammonium Polystyrene Strong
AG 3 Tertiary amine Polystyrene Weak
DEAE-Sephacel Diethylaminoethyl Sephacel Weak
PEI-cellulose Polyethyleneimine Cellulose Weak
DEAE-Sephadex Diethylaminoethyl Dextran Weak
QAE-Sephadex Diethyl-(2-hydroxyl-propyl)-aminoethyl Dextran Strong
DEAE-Sepharose Diethylaminoethyl Agarose Weak
Cation Exchangers
AG 50 Sulfonic acid Polystyrene Strong
Bio-Rex 70 Carboxylic acid Acrylic Weak
CM-Sephacel Carboxymethyl Sephacel Weak
P-Cellulose Phosphate Cellulose Intermediate
CM-Sephadex Carboxymethyl Dextran Weak
SP-Sephadex Sulfopropyl Dextran Strong
CM-Sepharose Carboxymethyl Agarose Weak
SP-Sepharose Sulfonic acid Agarose Strong

Chapter 5 • Purification and Analysis of Biomolecules by Chromatography 129
Binds to anion exchanger
Isoelectric
point (pHI)
Binds to cation exchanger
pH range
of stability
Net
charg
e o
n p
rote
in
+
–
2 4 6 8 10 12
FIGURE 5.6 Theeffect of pH on thenet charge of aprotein.
charge will bind to a cationic exchanger and vice versa. However, many biomol-ecules have more than one type of ionizing group and may have both negativelyand positively charged groups (they are amphoteric). The net charge on suchmolecules depends on pH. At the isoelectric point, the substance has no netcharge and would not bind to any type of ion exchanger.
In principle, amphoteric molecules should bind to both anionic andcationic exchangers. However, when one is dealing with large biomolecules, thepH range of stability must also be evaluated. The range of stability refers tothe pH range in which the biomolecule is not denatured. Figure 5.6 shows howthe net charge of a hypothetical protein changes as a function of pH. Below theisoelectric point the molecule has a net positive charge and would bebound to a cation exchanger. Above the isoelectric point, the net charge is nega-tive, and the protein would bind to an anion exchanger. Superimposed on thisgraph is the pH range of stability for the hypothetical protein. Because it is stablein the range of pH 7.0–10.0, the ion exchanger of choice is an anionic exchanger. Inmost cases, the isoelectric point of the protein is not known. The type of ionexchanger must be chosen by trial and error as follows. Small samples of the pro-tein mixture in buffer are equilibrated for 10 to 15 minutes in separate test tubes,one with each type of ion exchanger. The tubes are then centrifuged or let standto sediment the ion exchanger. Check each supernatant for the presence of thedesired analyte ( for nucleic acids, for proteins, catalytic activity for en-zymes, etc.). If a supernatant has a relatively low level of added protein, that ionexchanger would be suitable for use. This simple test can also be extended to
A280A260
1pHI2,

130 Chapter 5 • Purification and Analysis of Biomolecules by Chromatography
find conditions for elution of the desired macromolecule from the ion exchanger.The ion exchanger charged with the macromolecule is treated with buffers ofincreasing ionic strength or changing pH. The supernatant after each treatment isanalyzed as before for release of the macromolecule.
Choice of Buffer
This decision includes not just the buffer substance, but also the pH and the ionicstrength. Buffer ions will, of course, interact with ion-exchange resins. Bufferions with a charge opposite to that on the ion exchanger compete with analytefor binding sites and greatly reduce the capacity of the column. Cationic buffersshould be used with anionic exchangers; anionic buffers should be used withcationic exchangers.
The pH chosen for the buffer depends first of all on the range of stability ofthe macromolecule to be separated (see Figure 5.6). Second, the buffer pH shouldbe chosen so that the desired macromolecule will bind to the ion exchanger. Inaddition, the ionic strength should be relatively low to avoid “damping” of theinteraction between analyte and ion exchanger. Buffer concentrations in therange 0.05 to 0.1 M are recommended.
Preparation of the Ion Exchanger
The commercial suppliers of ion exchangers provide detailed instructions for thepreparation of the adsorbents. Failure to pretreat ion exchangers will greatlyreduce the capacity and resolution of a column. Most new ion-exchange resinsare commercially available in slurry form and are ready to use with a minimumnumber of pretreatment steps.
Sometimes pretreatment steps do not remove the small particles that arepresent in most ion-exchange materials. If left in suspension, these particles,called fines, result in decreased resolution and low column flow rates. The finesare removed from an exchanger by suspending the swollen adsorbent in a largevolume of water in a graduated cylinder and allowing at least 90% of theexchanger to settle. The cloudy supernatant containing the fines is decanted.This process is repeated until the supernatant is completely clear. The number ofwashings necessary to remove most fines is variable, but for a typical ionexchanger 8 to 10 times is probably sufficient.
Using the Ion-Exchange Resin
Ion exchangers are most commonly used in a column form. The column methoddiscussed earlier in this chapter can be directly applied to ion-exchangechromatography.
An alternative method of ion exchange is batch separation. This involvesmixing and stirring equilibrated exchanger directly with the analyte mixture tobe separated. After an equilibration time of approximately 1 hour, the slurry isfiltered and washed with buffer. The ion exchanger can be chosen so that the de-sired analyte is adsorbed onto the exchanger or remains unbound in solution. Ifthe latter is the case, the desired material is in the filtrate. If the desired analyte isbound to the exchanger, it can be removed by suspending the exchanger in a

Chapter 5 • Purification and Analysis of Biomolecules by Chromatography 131
buffer of greater ionic strength or different pH. Batch processes have some ad-vantages over column methods. They are rapid, and the problems of packing,channeling, and dry columns are avoided.
Another development in ion-exchange column chromatography allows theseparation of proteins according to their isoelectric points. This technique,chromatofocusing, involves the formation of a pH gradient on an ion-exchangecolumn. If a buffer of a specified pH is passed through an ion-exchange columnthat was equilibrated at a second pH, a pH gradient is formed on the column.Proteins bound to the ion exchanger are eluted in the order of their isoelectricpoints. In addition, protein band concentration (focusing) takes place duringelution. Chromatofocusing is similar to isoelectric focusing, introduced inChapter 6, in which a column pH gradient is produced by an electric current.
Storage of Resins
Most ion exchangers in the dry form are stable for many years. Aqueous slurried ionexchangers are still useful after several months. One major storage problem with awet exchanger is microbial growth. This is especially true for the cellulose and dex-tran exchangers. If it is necessary to store pretreated exchangers, an antimicrobialagent must be added to the slurry. Sodium azide (0.02%) is suitable for cationexchangers, and phenylmercuric salts (0.001%) are effective for anion exchangers.Since these preservative reagents are toxic, they must be used with caution.
STUDY EXERCISE 5.2 Cation-Exchange Chromatography
A mixture of amino acids (Lys, Ala, Asp) is subjected to cation exchange chromatographyat pH 3.0. Predict the order of elution of the three amino acids and explain your answer.Hint: Draw the structures of the three amino acids as they would exist at pH 3. Study thestructures and determine how each would interact with the negatively charged ion-exchange resin. Determine the relative strength of binding for each amino acid.
STUDY EXERCISE 5.3 Anion-Exchange Chromatography
A mixture of three proteins was subjected to ion-exchange chromatography using CM-cellulose as the stationary phase. Predict the order of elution of the proteins, assumingthat the mixture was applied at low ionic strength and eluted with buffers of increasingionic strength. The proteins in the mixture are listed below with isoelectric pH
Pepsinogen, 1.0
Cytochrome c, 10.6
Myoglobin, 6.8
Hint: The column separates proteins on the basis of net charge. The more negativelycharged a protein, the more weakly it will bind to an anion exchange resin like CM-cellulose, and the faster it will elute. At any pH, the protein pepsinogen willhave the most negative net charge of any of the three proteins.
1pHI2.

132 Chapter 5 • Purification and Analysis of Biomolecules by Chromatography
E. GEL-EXCLUSION CHROMATOGRAPHY
The chromatographic methods discussed up to this point allow the separation ofmolecules according to polarity and charge. The method of gel-exclusion chro-matography (also called gel filtration, molecular-sieve chromatography, or gel-permeation chromatography) exploits the physical property of molecular size toachieve separation. The molecules of nature range in molecular weight from lessthan 100 to as large as several million. It should be obvious that a technique capa-ble of separating molecules of molecular weight 10,000 from those of 100,000would be very popular among research biochemists. Gel-filtration chromatogra-phy has been of major importance in the purification of thousands of proteins,nucleic acids, enzymes, polysaccharides, and other biomolecules. In addition,the technique may be applied to molecular weight determination and quantita-tive analysis of molecular interactions. In this section, the theory and practice ofgel filtration will be introduced and applied to several biochemical problems.
Theory of Gel Filtration
The operation of a gel filtration column is illustrated in Figure 5.7. The station-ary phase consists of inert particles that contain small pores of a controlledsize. Microscopic examination of a particle reveals an interior resembling asponge. A solution containing analytes of various molecular sizes is allowed topass through the column under the influence of continuous solvent flow.Analytes larger than the pores cannot enter the interior of the gel beads, so theyare limited to the space between the beads. The volume of the column accessi-ble to very large molecules is, therefore, greatly reduced. As a result, they arenot slowed in their progress through the column and elute rapidly in a singlezone. Small molecules capable of diffusing in and out of the beads have a muchlarger volume available to them. Therefore, they are delayed in their journeythrough the column bed. Molecules of intermediate size migrate through the
STUDY EXERCISE 5.4 Ion-Exchange Chromatography
What kind of ion-exchange resin would be most effective for purifying RNA mole-cules, an anion exchanger or cation exchanger?
A B C
FIGURE 5.7 Separation of molecules by gel filtration. A Application of sample containinglarge and small molecules. B Large molecules cannot enter gel matrix, so they move rapidlythrough the column. C Elution of the large molecules first and then smaller molecules.

Chapter 5 • Purification and Analysis of Biomolecules by Chromatography 133
column at a rate somewhere between those for large and small molecules.Therefore, the order of elution of the various analytes is directly related to theirmolecular dimensions.
Physical Characterization of Gel Chromatography
Several physical properties must be introduced to define the performance of agel and solute behavior. Some important properties are:
1. Exclusion Limit This is defined as the molecular mass of the smallestmolecule that cannot diffuse into the inner volume of the gel matrix. Allmolecules above this limit elute rapidly in a single zone. The exclusionlimit of a typical gel, Sephadex G-50, is 30,000 daltons. All analytes havinga molecular size greater than this value would pass directly through thecolumn bed without entering the gel pores.
2. Fractionation Range Sephadex G-50 has a fractionation range of 1500 to30,000 daltons. Analytes within this range would be separated in a some-what linear fashion.
3. Water Regain and Bed Volume Gel chromatography media are often sup-plied in dehydrated form and must be swollen in a solvent, usually water,before use. The weight of water taken up by 1 g of dry gel is known as thewater regain. For G-50, this value is g. This value does notinclude the water surrounding the gel particles, so it cannot be used as anestimate of the final volume of a packed gel column. Most commercialsuppliers of gel materials provide, in addition to water regain, a bed vol-ume value. This is the final volume taken up by 1 g of dry gel whenswollen in water. For G-50, bed volume is 9 to 11 mL/g dry gel.
4. Gel Particle Shape and Size Ideally, gel particles should be spherical to pro-vide a uniform bed with a high density of pores. Particle size is defined eitherby mesh size or bead diameter Both the degree of resolution afforded bya column and the flow rate depend on particle size. Larger particle sizes (50 to100 mesh, 100 to 300 ) offer high flow rates but poor chromatographicseparation. The opposite is true for very small particle sizes (“superfine,”400 mesh, 10 to ). The most useful particle size, which represents a compro-mise between resolution and flow rate, is 100 to 200 mesh (50 to 150 ).
5. Void Volume This is the total space surrounding the gel particles in apacked column. This value is determined by measuring the volume ofsolvent required to elute a solute that is completely excluded from the gelmatrix. Most columns can be calibrated for void volume with a dye, bluedextran, which has an average molecular mass of 2,000,000 daltons.
6. Elution Volume This is the volume of eluting buffer necessary to removea particular analyte from a packed column.
Chemical Properties of Gels
Four basic types of gels are available: dextran, polyacrylamide, agarose, andcombined polyacrylamide-dextran. The first gels to be developed were thosebased on a natural polysaccharide, dextran. These are supplied by Pharmaciaunder the trade name Sephadex. Table 5.4 gives the physical properties of the
mmmm
mm
1mm2.
5.0 ; 0.3

134 Chapter 5 • Purification and Analysis of Biomolecules by Chromatography
TABLE 5.4 Properties of Gel-Filtration Media
NameFractionation Range for
Proteins (daltons)Water Regain (mL/g dry gel)
Bed Volume (mL/g dry gel)
Dextran (Sephadex)1
G-10 0–700 1.0 ; 0.1 2–3
G-15 0–1500 1.5 ; 0.2 2.5–3.5
G-25 1000–5000 2.5 ; 0.2 4–6
G-50 1500–30,000 5.0 ; 0.3 9–11
G-75 3000–80,000 7.5 ; 0.5 12–15
G-100 4000–150,000 10 ; 1.0 15–20
G-150 5000–300,000 15 ; 1.5 20–30
G-200 5000–600,000 20 ; 2.0 30–40
Polyacrylamide (Bio-Gels)2
P-2 100–1800 1.5 3.0
P-4 800–4000 2.4 4.8
P-6 1000–6000 3.7 7.4
P-10 1500–20,000 4.5 9.0
P-30 2500–40,000 5.7 11.4
P-60 3000–60,000 7.2 14.4
P-100 5000–100,000 7.5 15.0
P-150 15,000–150,000 9.2 18.4
P-200 30,000–200,000 14.7 29.4
P-300 60,000–400,000 18.0 36.0
Dextran-polyacrylamide (Sephacryl)1
S-100 HR 1000–100,000 — —
S-200 HR 5000–250,000 — —
S-300 HR 10,000–1,500,000 — —
S-400 HR 20,000–8,000,000 — —
Agarose
Sepharose1 6B 10,000–4,000,000 — —
Sepharose 4B 60,000–20,000,000 — —
Sepharose 2B 70,000–40,000,000 — —
Superose1 12 HR 1000–300,000 — —
Superose 6 HR 5000–5,000,000 — —
Bio-Gel2 A-0.5 10,000–500,000 — —
Bio-Gel A-1.5 10,000–1,500,000 — —
Bio-Gel A-5 10,000–5,000,000 — —
Bio-Gel A-15 40,000–15,000,000 — —
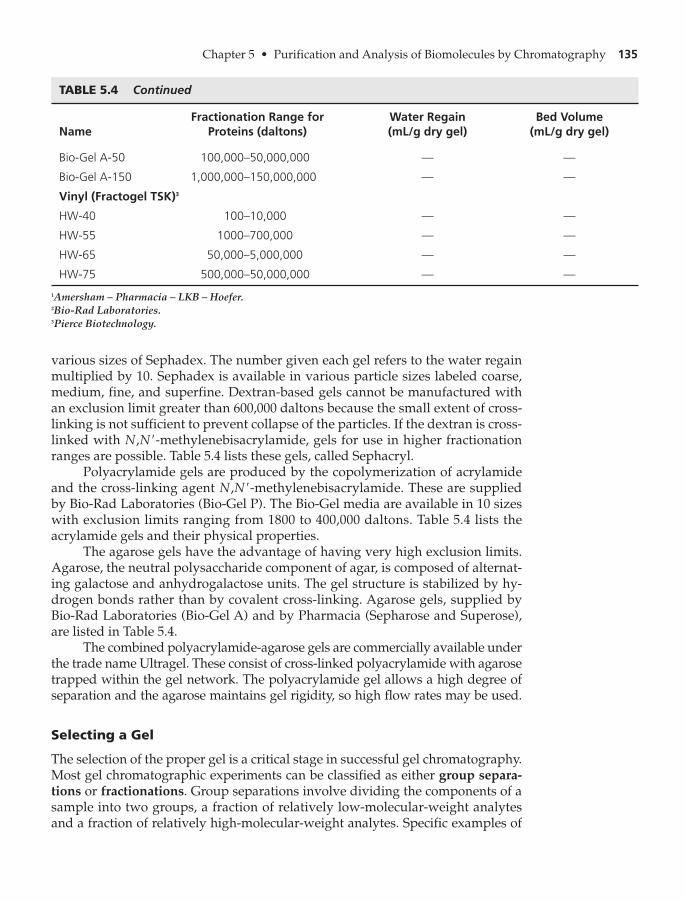
Chapter 5 • Purification and Analysis of Biomolecules by Chromatography 135
various sizes of Sephadex. The number given each gel refers to the water regainmultiplied by 10. Sephadex is available in various particle sizes labeled coarse,medium, fine, and superfine. Dextran-based gels cannot be manufactured withan exclusion limit greater than 600,000 daltons because the small extent of cross-linking is not sufficient to prevent collapse of the particles. If the dextran is cross-linked with -methylenebisacrylamide, gels for use in higher fractionationranges are possible. Table 5.4 lists these gels, called Sephacryl.
Polyacrylamide gels are produced by the copolymerization of acrylamideand the cross-linking agent -methylenebisacrylamide. These are suppliedby Bio-Rad Laboratories (Bio-Gel P). The Bio-Gel media are available in 10 sizeswith exclusion limits ranging from 1800 to 400,000 daltons. Table 5.4 lists theacrylamide gels and their physical properties.
The agarose gels have the advantage of having very high exclusion limits.Agarose, the neutral polysaccharide component of agar, is composed of alternat-ing galactose and anhydrogalactose units. The gel structure is stabilized by hy-drogen bonds rather than by covalent cross-linking. Agarose gels, supplied byBio-Rad Laboratories (Bio-Gel A) and by Pharmacia (Sepharose and Superose),are listed in Table 5.4.
The combined polyacrylamide-agarose gels are commercially available underthe trade name Ultragel. These consist of cross-linked polyacrylamide with agarosetrapped within the gel network. The polyacrylamide gel allows a high degree ofseparation and the agarose maintains gel rigidity, so high flow rates may be used.
Selecting a Gel
The selection of the proper gel is a critical stage in successful gel chromatography.Most gel chromatographic experiments can be classified as either group separa-tions or fractionations. Group separations involve dividing the components of asample into two groups, a fraction of relatively low-molecular-weight analytesand a fraction of relatively high-molecular-weight analytes. Specific examples of
N,N¿
N,N¿
TABLE 5.4 Properties of Gel-Filtration Media
NameFractionation Range for
Proteins (daltons)Water Regain (mL/g dry gel)
Bed Volume (mL/g dry gel)
Bio-Gel A-50 100,000–50,000,000 — —
Bio-Gel A-150 1,000,000–150,000,000 — —
Vinyl (Fractogel TSK)3
HW-40 100–10,000 — —
HW-55 1000–700,000 — —
HW-65 50,000–5,000,000 — —
HW-75 500,000–50,000,000 — —
1Amersham – Pharmacia – LKB – Hoefer.2Bio-Rad Laboratories.3Pierce Biotechnology.
Continued

136 Chapter 5 • Purification and Analysis of Biomolecules by Chromatography
this are desalting a protein solution or removing small contaminating moleculesfrom protein or nucleic acid extracts. For group separations, a gel should bechosen that allows complete exclusion of the high-molecular-weight molecules inthe void volume. Sephadex G-25, Bio-Gel P-6, and Sephacryl S-100HR are recom-mended for most group separations. The particle size recommended is 100 to200 mesh or 50 to 150 diameter.
Gel fractionation involves separation of groups of molecules of similarmolecular weights in a multicomponent mixture. In this case, the gel should bechosen so that the fractionation range includes the molecular weights of the ana-lytes. If the mixture contains macromolecules up to 120,000 in molecular weight,then Bio-Gel P-150, Sephacryl S-200HR, or Sephadex G-150 would be most ap-propriate. If P-100, G-100, or Sephacryl S-100HR were used, some of the higher-molecular-weight proteins in the sample would elute in the void volume. On theother hand, if P-200, P-300, or G-200 were used, there would be a decrease inboth resolution and flow rate. If the molecular weight range of the mixture is un-known, empirical selection is necessary. The recommended gel grade for mostfractionations is 100–200 or 200–400 mesh (20–80 or 10–40 ). The finestgrade that allows a suitable flow rate should be selected. For very critical separa-tions, superfine grades offer the best resolution, but with very low flow rates.
Gel Preparation and Storage
The dextran and acrylamide gel products are sometimes supplied in dehydratedform and must be allowed to swell in water before use. The swelling time requireddiffers for each gel, but the extremes are 3 to 4 hours at for highly cross-linkedgels and up to 72 hours at for P-300 or G-200. The swelling time can be short-ened if a boiling-water bath is used. Agarose gels and combined polyacrylamide-agarose gels are supplied in a hydrated state, so there is no need for swelling.
Before a gel slurry is packed into the column, it should be defined anddeaerated. Defining is necessary to remove very fine particles, which would re-duce flow rates. To define, pour the gel slurry into a graduated cylinder and addwater equivalent to two times the gel volume. Invert the cylinder several timesand allow the gel to settle. After 90 to 95% of the gel has settled, decant the super-natant, add water, and repeat the settling process. Two or three defining opera-tions are usually sufficient to remove most small particles.
Deaerating (removing dissolved gases) should be done on the gel slurryand all eluting buffers. Gel particles that have not been deaerated tend to floatand form bubbles in the column bed. Dissolved gases are removed by placingthe gel slurry in a side-arm vacuum flask and applying a vacuum from a wateraspirator. The degassing process is complete when no more small air bubbles arereleased from the gel (usually 1 to 2 hours).
Antimicrobial agents must be added to stored, hydrated gels. One of thebest agents is sodium azide (0.02%).
Operation of a Gel Column
The procedure for gel-column chromatography is very similar to the generaldescription given earlier. The same precautions must be considered in packing, load-ing, and eluting the column. A brief outline of important considerations follows.
20°C20°C
mmmm
mm
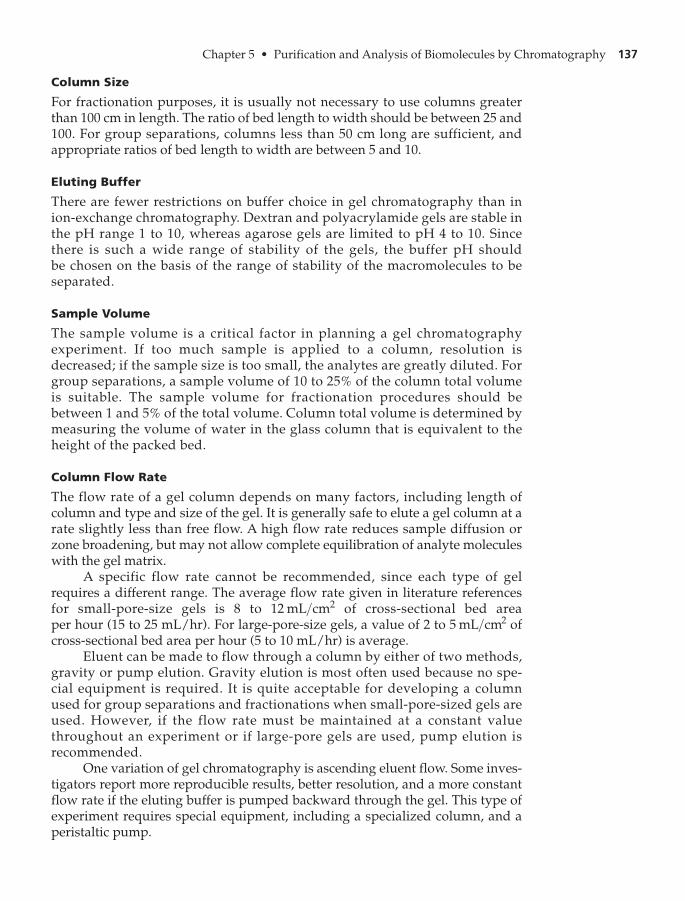
Chapter 5 • Purification and Analysis of Biomolecules by Chromatography 137
Column Size
For fractionation purposes, it is usually not necessary to use columns greaterthan 100 cm in length. The ratio of bed length to width should be between 25 and100. For group separations, columns less than 50 cm long are sufficient, andappropriate ratios of bed length to width are between 5 and 10.
Eluting Buffer
There are fewer restrictions on buffer choice in gel chromatography than inion-exchange chromatography. Dextran and polyacrylamide gels are stable inthe pH range 1 to 10, whereas agarose gels are limited to pH 4 to 10. Sincethere is such a wide range of stability of the gels, the buffer pH shouldbe chosen on the basis of the range of stability of the macromolecules to beseparated.
Sample Volume
The sample volume is a critical factor in planning a gel chromatographyexperiment. If too much sample is applied to a column, resolution isdecreased; if the sample size is too small, the analytes are greatly diluted. Forgroup separations, a sample volume of 10 to 25% of the column total volumeis suitable. The sample volume for fractionation procedures should bebetween 1 and 5% of the total volume. Column total volume is determined bymeasuring the volume of water in the glass column that is equivalent to theheight of the packed bed.
Column Flow Rate
The flow rate of a gel column depends on many factors, including length ofcolumn and type and size of the gel. It is generally safe to elute a gel column at arate slightly less than free flow. A high flow rate reduces sample diffusion orzone broadening, but may not allow complete equilibration of analyte moleculeswith the gel matrix.
A specific flow rate cannot be recommended, since each type of gelrequires a different range. The average flow rate given in literature referencesfor small-pore-size gels is 8 to of cross-sectional bed areaper hour (15 to 25 mL/hr). For large-pore-size gels, a value of 2 to ofcross-sectional bed area per hour (5 to 10 mL/hr) is average.
Eluent can be made to flow through a column by either of two methods,gravity or pump elution. Gravity elution is most often used because no spe-cial equipment is required. It is quite acceptable for developing a columnused for group separations and fractionations when small-pore-sized gels areused. However, if the flow rate must be maintained at a constant valuethroughout an experiment or if large-pore gels are used, pump elution isrecommended.
One variation of gel chromatography is ascending eluent flow. Some inves-tigators report more reproducible results, better resolution, and a more constantflow rate if the eluting buffer is pumped backward through the gel. This type ofexperiment requires special equipment, including a specialized column, and aperistaltic pump.
5 mL>cm212 mL>cm2

138 Chapter 5 • Purification and Analysis of Biomolecules by Chromatography
Applications of Gel-Exclusion Chromatography
Several experimental applications of gel chromatography have already beenmentioned, but more detail will be given here.
Desalting
Inorganic salts, organic solvents, and other small molecules are used extensivelyfor the purification of macromolecules. Gel chromatography provides an inex-pensive, simple, and rapid method for removal of these small molecules. One es-pecially attractive method for desalting very small samples (0.1 mL or less) ofproteins or nucleic acid solutions is to use spin columns. These are prepackedcolumns of polyacrylamide exclusion gels. Spin columns are used in a similarfashion to microfiltration centrifuge tubes (Chapter 3, p. 75). The sample isplaced on top of the gel column and spun in a centrifuge. Large molecules areeluted from the column and collected in a reservoir. The small molecules to beremoved remain in the gel.
Purification of Biomolecules
This is probably the most popular use of gel chromatography. Because of a gel’sability to fractionate molecules on the basis of size, gel filtration complements otherpurification techniques that separate molecules on the basis of polarity and charge.
Estimation of Molecular Weight
The elution volume for a particular analyte is proportional to its molecular size.This indicates that it is possible to estimate the molecular weight of a moleculeon the basis of its elution characteristics on a gel column. An elution curve forseveral standard proteins separated on Sephadex G-100 is shown in Figure 5.8.This curve, a plot of protein concentration vs. volume collected, is represen-tative of data obtained from a gel filtration experiment. The elution volume, for each protein can be estimated as shown in the figure. A plot of log molecular
Ve,A280
A B C
DE
Volume collected
Pro
tein
concentr
ation
Ve
A2
80FIGURE 5.8
Elution curve for amixture of severalproteins using gel-filtrationchromatography.A hemoglobin;B egg albumin;C chymotrypsino-
gen;D myoglobin;E cytochrome c.=
=
===
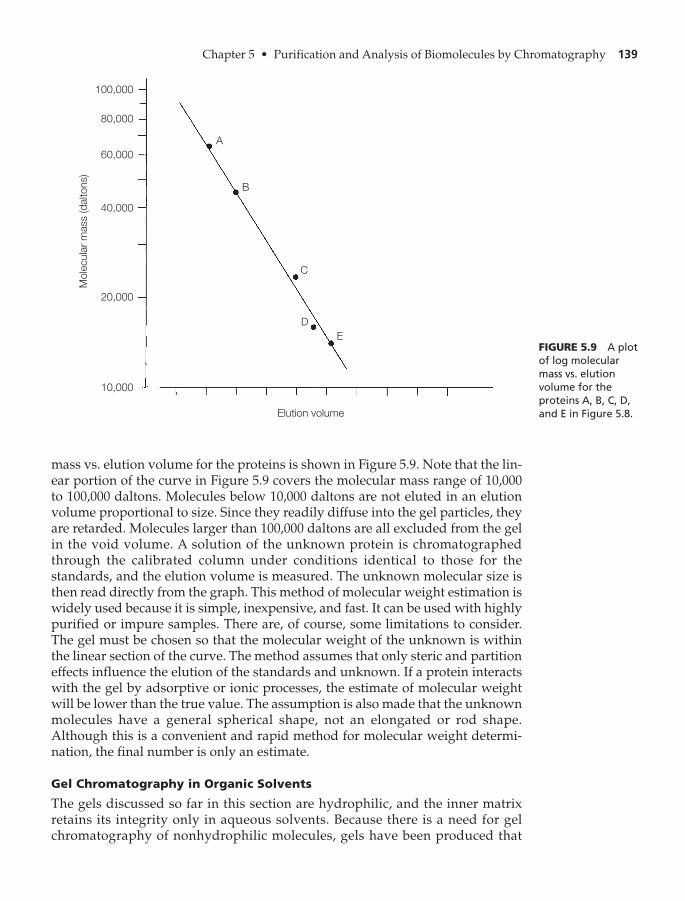
Chapter 5 • Purification and Analysis of Biomolecules by Chromatography 139
mass vs. elution volume for the proteins is shown in Figure 5.9. Note that the lin-ear portion of the curve in Figure 5.9 covers the molecular mass range of 10,000to 100,000 daltons. Molecules below 10,000 daltons are not eluted in an elutionvolume proportional to size. Since they readily diffuse into the gel particles, theyare retarded. Molecules larger than 100,000 daltons are all excluded from the gelin the void volume. A solution of the unknown protein is chromatographedthrough the calibrated column under conditions identical to those for thestandards, and the elution volume is measured. The unknown molecular size isthen read directly from the graph. This method of molecular weight estimation iswidely used because it is simple, inexpensive, and fast. It can be used with highlypurified or impure samples. There are, of course, some limitations to consider.The gel must be chosen so that the molecular weight of the unknown is withinthe linear section of the curve. The method assumes that only steric and partitioneffects influence the elution of the standards and unknown. If a protein interactswith the gel by adsorptive or ionic processes, the estimate of molecular weightwill be lower than the true value. The assumption is also made that the unknownmolecules have a general spherical shape, not an elongated or rod shape.Although this is a convenient and rapid method for molecular weight determi-nation, the final number is only an estimate.
Gel Chromatography in Organic Solvents
The gels discussed so far in this section are hydrophilic, and the inner matrixretains its integrity only in aqueous solvents. Because there is a need for gelchromatography of nonhydrophilic molecules, gels have been produced that
100,000
80,000
60,000
40,000
20,000
10,000
Mole
cula
r m
ass (d
alto
ns)
Elution volume
A
B
C
D
EFIGURE 5.9 A plotof log molecularmass vs. elutionvolume for theproteins A, B, C, D,and E in Figure 5.8.

140 Chapter 5 • Purification and Analysis of Biomolecules by Chromatography
can be used with organic solvents. The trade names of some of these productsare Sepharose CL and Sephadex LH, Bio Beads S, and Styragel. Organicsolvents that are of value in gel chromatography are ethanol, acetone,dimethylsulfoxide, dimethylformamide, tetrahydrofuran, chlorinated hydro-carbons, and acetonitrile.
STUDY EXERCISE 5.5 Gel-Exclusion Chromatography
Your first experiment in biochemistry lab is to analyze a mixture with the use of gel fil-tration. You are instructed to run a Sephadex G-50 column on the mixture containingthe components listed below. All three components are colored, so you are able to ob-serve the separation. The components are dissolved in water, and the column is elutedwith water.
Blue dextran, a blue dye
Cytochrome c, a red protein
Flavin adenine dinucleotide, a yellow coenzyme
Predict the results of your experiment.
Solution: According to Table 5.4, the fractionation range for G-50 is 1500–30,000. TheBlue dextran is above the fractionation range, so it will elute very rapidly in the voidvolume. The FAD is below the fractionation range, so it will take its time and elutemuch later than Blue dextran and cyt c. The red-colored cyt c, within the fractionationrange, will elute somewhere between the Blue dextran and FAD.
(FAD, MW = 830)
(MW = 12,400)
(MW = about 2,000,000)
STUDY EXERCISE 5.6 Separation of Proteins
Your biochemistry lab instructor gives you a mixture of three proteins and asks you toseparate the proteins on a Sephadex G-100 gel. The three proteins are serum albumin,myoglobin, and chymotrypsinogen. The column is eluted with 0.1 M Tris buffer, pH7.0. Predict the order of elution of the proteins from the Sephadex column. UseAppendix V to find the molecular weights of the proteins.
F. HIGH-PERFORMANCE LIQUID CHROMATOGRAPHY (HPLC)
The previous discussions on the theory and practice of the various chromato-graphic methods should convince you of the tremendous influence chromatog-raphy has had on our biochemical understanding. It is tempting to makecomparisons about the relative importance of the methods, but doing so wouldbe unfair because each serves a specific purpose. There will, for example, alwaysbe a need for fast, inexpensive, and qualitative analyses as afforded by planar

Chapter 5 • Purification and Analysis of Biomolecules by Chromatography 141
chromatography. Traditional column chromatography will probably always bepreferred in large-scale protein purification.
However, during the past three decades, an analytical method has beendeveloped that now surpasses the traditional liquid chromatographic techniquesin importance for analytical separations. This technique, high-performance liq-uid chromatography (HPLC), is ideally suited for the separation and identifica-tion of amino acids, carbohydrates, lipids, nucleic acids, proteins, pigments,steroids, pharmaceuticals, and many other biologically active molecules.
The future promise of HPLC is indicated by its classification as “modernliquid chromatography” when compared to other forms of column-liquidchromatography, now referred to as “classical” or “traditional.” Compared to theclassical forms of liquid chromatography (paper, TLC, column), HPLC hasseveral advantages:
1. Resolution and speed of analysis far exceed the classical methods.2. HPLC columns can be reused without repacking or regeneration.3. Reproducibility is greatly improved because the parameters affecting the
efficiency of the separation can be closely controlled.4. Instrument operation and data analysis are easily automated.5. HPLC is adaptable to very small sample sizes or large-scale, preparative
procedures.
The advantages of HPLC are the result of two major advances: (1) the devel-opment of stationary supports with very small particle sizes and large surfaceareas, and (2) the improvement of elution rates by applying high pressure to thesolvent flow.
The great versatility of HPLC is evidenced by the fact that all chromato-graphic modes, including partition, adsorption, ion exchange, chromatofocus-ing, and gel exclusion, are possible. In a sense, HPLC can be considered asautomated liquid chromatography. The theory of each of these chromatographicmodes has been discussed and needs no modification for application to HPLC.However, there are unique theoretical and practical characteristics of HPLC thatshould be introduced.
The retention time of an analyte in HPLC is defined as the timenecessary for maximum elution of the particular analyte. This is analogous toretention time measurements in GC. Retention volume of an analyte is thesolvent volume required to elute the analyte and is defined by Equation 5.2,where F is the flow rate of the solvent.
>> (Eq. 5.2)
In all forms of chromatography, a measure of column efficiency isresolution, R. Resolution indicates how well analytes are separated; it is definedby Equation 5.3, where and are the retention times of two analytes and wand are the base peak widths of the same two analytes.
>> (Eq. 5.3)R = 2tR - t¿Rw + w¿
w¿t¿RtR
VR = FtR
(VR)
(tR)
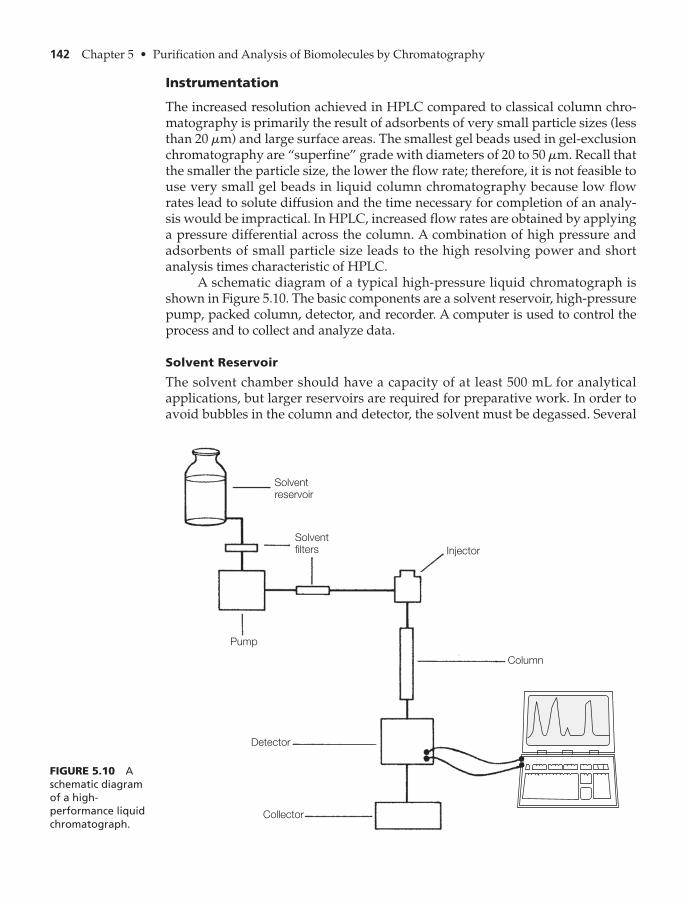
142 Chapter 5 • Purification and Analysis of Biomolecules by Chromatography
Instrumentation
The increased resolution achieved in HPLC compared to classical column chro-matography is primarily the result of adsorbents of very small particle sizes (lessthan 20 ) and large surface areas. The smallest gel beads used in gel-exclusionchromatography are “superfine” grade with diameters of 20 to 50 Recall thatthe smaller the particle size, the lower the flow rate; therefore, it is not feasible touse very small gel beads in liquid column chromatography because low flowrates lead to solute diffusion and the time necessary for completion of an analy-sis would be impractical. In HPLC, increased flow rates are obtained by applyinga pressure differential across the column. A combination of high pressure andadsorbents of small particle size leads to the high resolving power and shortanalysis times characteristic of HPLC.
A schematic diagram of a typical high-pressure liquid chromatograph isshown in Figure 5.10. The basic components are a solvent reservoir, high-pressurepump, packed column, detector, and recorder. A computer is used to control theprocess and to collect and analyze data.
Solvent Reservoir
The solvent chamber should have a capacity of at least 500 mL for analyticalapplications, but larger reservoirs are required for preparative work. In order toavoid bubbles in the column and detector, the solvent must be degassed. Several
mm.mm
Collector
Detector
Pump
Column
Injector
Solvent
filters
Solvent
reservoir
FIGURE 5.10 Aschematic diagramof a high-performance liquidchromatograph.

Chapter 5 • Purification and Analysis of Biomolecules by Chromatography 143
methods may be used to remove unwanted gases, including refluxing, filtrationthrough a vacuum filter, ultrasonic vibration, and purging with an inert gas. Thesolvent should also be filtered to remove particulate matter that would be drawninto the pump and column.
Pumping Systems
The purpose of the pump is to provide a constant, reproducible flow of solventthrough the column. Two types of pumps are available—constant pressure andconstant volume. Typical requirements for a pump are:
1. It must be capable of pressure outputs of at least 500 psi and preferably upto 5000 psi.
2. It should have a controlled, reproducible flow delivery of about 1 mL/minfor analytical applications and up to 100 mL/min for preparativeapplications.
3. It should yield pulse-free solvent flow.4. It should have a small holdup volume.
Although neither type of pump meets all these criteria, constant-volume pumpsmaintain a more accurate flow rate and allow for a more precise analysis.
Injection Port
A sample must be introduced onto the column in an efficient and reproduciblemanner. One of the most popular injectors is the syringe injector. The sample, ina microliter syringe, is injected through a neoprene/Teflon septum. This type ofinjection can be used at pressures up to 3000 psi.
Columns
HPLC columns are prepared from stainless steel or glass-Teflon tubing. Typicalcolumn inside diameters are 2.1, 3.2, or 4.5 mm for analytical separations and upto 30 mm for preparative applications. The length of the column can range from5 to 100 cm, but 10- to 20-cm columns are common.
Detector
Liquid chromatographs are equipped with a means to continuously monitor thecolumn effluent and recognize the presence of analyte. Only small sample sizesare used with most HPLC columns, so a detector must have high sensitivity. Thetype of detector that has the most universal application is the differential refrac-tometer. This device continuously monitors the refractive index difference be-tween the mobile phase (pure solvent) and the mobile phase containing sample(column effluent). The sensitivity of this detector is on the order of 0.1 which,compared to other detectors, is only moderately sensitive. The major advantageof the refractometer detector is its versatility; its main limitation is that there mustbe at least refractive index units between the mobile phase and sample.
The most widely used HPLC detectors are the photometric detectors.These detectors measure the extent of absorption of ultraviolet or visible radia-tion by a sample. Since few compounds are colored, visible detectors are oflimited value. Ultraviolet detectors are the most widely used in HPLC. The
10-7
mg,

144 Chapter 5 • Purification and Analysis of Biomolecules by Chromatography
typical UV detector functions by focusing radiation from a low-pressure mercurylamp on a flow cell that contains column effluent. The mercury lamp provides aprimary radiation at 254 nm. The use of filters or other lamps provides radiationat 220, 280, 313, 334, and 365 nm. Many compounds absorb strongly in this wave-length range, and sensitivities on the order of 1 ng are possible. Most biochemi-cals are detected, including proteins, nucleic acids, pigments, vitamins, somesteroids, and aromatic amino acids. Aliphatic amino acids, carbohydrates, lipids,and other biochemicals that do not absorb UV can be detected by chemicalderivatization with UV-absorbing functional groups. UV detectors have manypositive characteristics, including high sensitivity, small sample volumes,linearity over wide concentration ranges, nondestructiveness to sample, andsuitability for gradient elution.
A third type of detector that has only limited use is the fluorescence detector.This type of detector is extremely sensitive: its use is limited to samples containingtrace quantities of biological materials. Its response is not linear over a wide rangeof concentrations, but it may be up to 100 times more sensitive than the UV detector.
Collection of Eluent
All of the detectors described here are nondestructive to the samples, so columneffluent can be collected for further chemical and physical analysis.
Analysis of HPLC Data
Most HPLC instruments are on-line, with an integrator and a computer for datahandling. For quantitative analysis of HPLC data, operating parameters such asrate of solvent flow must be controlled. In modern instruments, the whole sys-tem (including the pump, injector, detector, and data system) is under the controlof a computer.
Figure 5.11 illustrates the separation by HPLC of several phenylhydantoinderivatives of amino acids.
Stationary Phases in HPLC
The adsorbents in HPLC are typically small-diameter, porous materials. Two typesof stationary phases are available. Porous layer beads (Figure 5.12A) have an inertsolid core with a thin porous outer shell of silica, alumina, or ion-exchange resin.The average diameter of the beads ranges from 20 to 45 They are especiallyuseful for analytical applications, but, because of their short pores, their capacitiesare too low for preparative applications.
Microporous particles are available in two sizes: 20 to 40 diameter withlonger pores and 5 to 10 with short pores (see Figure 5.12B). These are nowmore widely used than the porous layer beads because they offer greater resolu-tion and faster separations with lower pressures. The microporous beads are pre-pared from alumina, silica, ion-exchanger resins, and chemically bonded phases(see next section).
The HPLC can function in several chromatographic modes. Each type ofchromatography will be discussed in the following subsections, with informa-tion about stationary phases.
mmmm
mm.

Chapter 5 • Purification and Analysis of Biomolecules by Chromatography 145
Liquid-Solid (Adsorption) Chromatography
HPLC in the adsorption mode can be carried out with silica or alumina porous-layer-bead columns. Small glass beads are often used for the inert core. Some ofthe more widely used packings are Porasil (Waters Associates), BioSilA (Bio-RadLaboratories), LiChrosorb Si-100 Partisil, Vydac, ALOX 60D (several suppliers),and Supelcosil (Supelco).
m
1
2
34
56
7
8
910
11
12
1314
15
1617
18
19
2021
22
0 10 20
Minutes
Peak identification
1. Cys-A 12. Cys
2. Asn 13. Tyr
3. Gln 14. Pro
4. Ser 15. Val
5. Thr 16. Met
6. Asp 17. Ile
7. Gly 18. Phe
8. His 19. Leu
9. Glu 20. nor-Leu
10. Ala 21. Trp
11. Arg 22. Lys
Column:
Mobile phase: Flow: Temperature:Detection:
Microsorb Cyano, 5 μm,
4.6 mm ID × 25 cm L
15.5% THF and 17.1% acetonitrile
in 6 mM phosphate, pH 3.2
1 mL/min
35ºC
UV, 254 nm
FIGURE 5.11 The separation of several amino acid phenylhydantoins by HPLC. Courtesy of Rainin Instrument Co.,Woburn, MA; www.rainin.com.
Inert core
Porous
layer
Pore
Pore
B
AFIGURE 5.12Adsorbents used inHPLC. A Porouslayer with shortpores.B Microporousparticles withlonger pores.
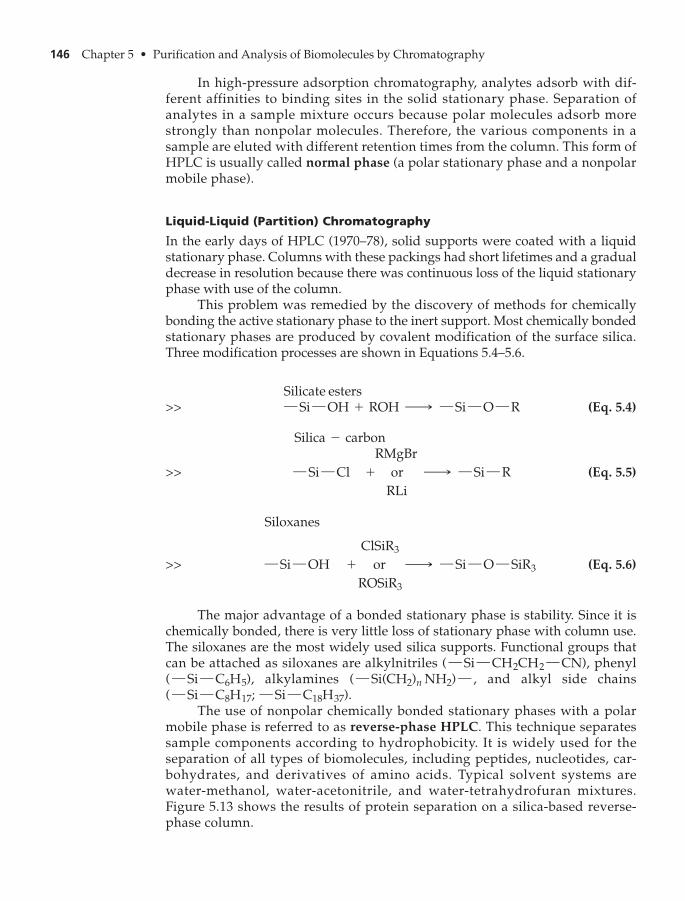
146 Chapter 5 • Purification and Analysis of Biomolecules by Chromatography
In high-pressure adsorption chromatography, analytes adsorb with dif-ferent affinities to binding sites in the solid stationary phase. Separation ofanalytes in a sample mixture occurs because polar molecules adsorb morestrongly than nonpolar molecules. Therefore, the various components in asample are eluted with different retention times from the column. This form ofHPLC is usually called normal phase (a polar stationary phase and a nonpolarmobile phase).
Liquid-Liquid (Partition) Chromatography
In the early days of HPLC (1970–78), solid supports were coated with a liquidstationary phase. Columns with these packings had short lifetimes and a gradualdecrease in resolution because there was continuous loss of the liquid stationaryphase with use of the column.
This problem was remedied by the discovery of methods for chemicallybonding the active stationary phase to the inert support. Most chemically bondedstationary phases are produced by covalent modification of the surface silica.Three modification processes are shown in Equations 5.4–5.6.
>> (Eq. 5.4)
>> (Eq. 5.5)
>> (Eq. 5.6)
The major advantage of a bonded stationary phase is stability. Since it ischemically bonded, there is very little loss of stationary phase with column use.The siloxanes are the most widely used silica supports. Functional groups thatcan be attached as siloxanes are alkylnitriles phenyl
alkylamines and alkyl side chains
The use of nonpolar chemically bonded stationary phases with a polarmobile phase is referred to as reverse-phase HPLC. This technique separatessample components according to hydrophobicity. It is widely used for theseparation of all types of biomolecules, including peptides, nucleotides, car-bohydrates, and derivatives of amino acids. Typical solvent systems arewater-methanol, water-acetonitrile, and water-tetrahydrofuran mixtures.Figure 5.13 shows the results of protein separation on a silica-based reverse-phase column.
(¬Si¬C8H17; ¬Si¬C18H37).(¬Si(CH2)nNH2)¬ ,(¬Si¬C6H5),
(¬Si¬CH2CH2 ¬CN),
ClSiR3
¬Si¬OH + or ¡ ¬Si¬O¬SiR3
ROSiR3
Siloxanes
RMgBr¬Si¬Cl + or ¡ ¬Si¬R
RLi
Silica - carbon
¬Si¬OH + ROH ¡ ¬Si¬O¬RSilicate esters

Chapter 5 • Purification and Analysis of Biomolecules by Chromatography 147
Ion-Exchange Chromatography
Ion-exchange HPLC uses column packings with charged functional groups.Structures of typical ion exchangers are shown in Figure 5.14. They are preparedby chemically bonding the ionic groups to the support via silicon atoms or byusing polystyrene-divinylbenzene resins. These stationary phases may be usedfor the separation of proteins, peptides, and other charged biomolecules.
Gel-Exclusion Chromatography
The combination of HPLC and gel-exclusion chromatography is used extensivelyfor the separation of large biomolecules, especially proteins and nucleic acids.
The exclusion gels discussed in Section E are not appropriate for HPLC usebecause they are soft and, except for small-pore beads (G-25 and less), collapseunder high-pressure conditions. Semirigid gels based on cross-linked styrene-divinylbenzene, polyacrylamide, and vinyl-acetate copolymer are available withvarious fractionation ranges useful for the separation of molecules up to10,000,000 daltons.
A280
Conductivity
Rib
onucle
ase
Cyto
chro
me c
Insulin
Lysozym
e
Myoglo
bin
Ovalb
um
in
BS
A
0 20Minutes
Conditionscolumn: Hi-Pore RP-304 column,
250 × 4.6 mm
Sample: Protein standard
Buffers: A. H2O, 0.1% B
B. 95% Acetonitrile,
5% H2O, 0.1% TFA
Gradient: 25% –100% B in 30 minutes
Flow rate: 1.5 mL/min
Temperature: Ambient
Detection: UV @ 280 nm; conductivity
FIGURE 5.13 Reverse-phase chromatography of a mixture of standard proteins. Separation courtesy of Bio-RadLaboratories, Hercules, CA; www.bio-rad.com.

148 Chapter 5 • Purification and Analysis of Biomolecules by Chromatography
Rigid packings for HPLC gel exclusion are prepared from porous glass orsilica. They have multiple advantages over the semirigid gels, including severalfractionation ranges, ease of packing, and compatibility with water and organicsolvents.
Chiral Chromatography
HPLC has been extremely effective in separating and analyzing a broad range ofbiological molecules, including amino acids, proteins, lipids, nucleic acids, andcarbohydrates, as described in the previous subsections. One class of biologicallyimportant compounds that has shown resistance to separation are the enan-tiomeric forms of biomolecules that exist because of the presence of a chiralcenter or stereocenter. For most molecules, a chiral center is a carbon atom that issurrounded by four different groups. Compounds that have a stereocenter existin two molecular forms (enantiomers) that have the same physical and chemicalproperties. They differ only in the way they interact with plane-polarized light—one enantiomer rotates the light to the left (L), and one enantiomer rotates lightto the right (D). We now know that enantiomers also differ in their biological ac-tions or physiological effects. This has become increasingly important in medicaltreatment because many drugs are chiral and the enantiomers differ in how theyinteract with receptors. One enantiomeric form of a drug may interact to causethe desired effect, and one may lead to no effect or even to toxicity. For example,the drug thalidomide was widely used in Europe during the late 1950s and early1960s as a sedative/tranquilizer, especially for pregnant women. The originaldrug form was the racemic mixture containing two thalidomide enantiomers.Thousands of women taking the drug later delivered malformed babies. We nowknow that only one enantiomer (D, R) causes the desired sedative effect. Theother enantiomer (L, S) is teratogenic.
Si(CH2)3N(CH
3)3
CH2
CH2
CH CH2
Si O
CH2
CH
CH CH2
CH2
CH
SO3
_
SO3
_
+
Anion exchanger
Cation exchanger
FIGURE 5.14 Ionexchangers used inHPLC.

Chapter 5 • Purification and Analysis of Biomolecules by Chromatography 149
It has become essential to develop techniques for the separation and analy-sis of enantiomers by chromatography. Some current drugs whose active ingre-dient is a single enantiomer include Lipitor (Atorvastatin), Zocor (Simvastatin),Nexium (Esomeprazole), Plavix (Clopidogrel), Advair (Fluticasone), and Zoloft(Sertraline).
A logical approach to the separation of enantiomers is to use a chiral station-ary phase, because it is known that chiral compounds are able to interact selec-tively, favoring one enantiomer over the other. Because of the different spatialarrangements around the stereocenters of the enantiomers, they interact differ-ently with a chiral surface. The most effective chiral stationary phases containproteins that are, of course, composed of amino acids, each of which has a stere-ocenter (except gly). Many protein sorbents have been tested, and the most suc-cessful results have come from alpha1-acid glycoproteins (AGP), human serumalbumin (HSA), and cellobiohydrolase (CBH). For example, the proteins AGPand HSA on HPLC columns have been used to separate the enantiomers of theanti-inflammatory drug ibuprofen (see Figure 5.15).
(CH3)2CHCH
2
CH3
CHCOOH
IBUPROFEN
Column:
CHIRAL-HSA
100 × 4.0 mm
Mobile phase:
5 mM octanoic
acid and 10%
2-propanol in
100 mM sod.ph.b.
pH 7.0
Detection:
UV 225 nm
Sample conc:
0.02 mg/ml
min min
ProductInformation;CHIRAL-HSA.
ProductInformation;CHIRAL-AGP.
Column:
CHIRAL-AGP
100 × 4.0 mm and
CHIRAL-AGP
guard column
10 × 3.0 nm
Mobile phase:
1 mM dimethyl-
octylamine in 10
mM sod.ph.b.
pH 7.0
Detection:
UV 225 nm
Sample conc:
0.02 mg.ml
150
125
100
75
50
25
−10
1.0
7.5
7.5
3
12.9
2
15.0
60.0
40.0
30.0
20.0
10.0
2.0
0.0
0
2.0
3.2
0
2.0
6
4.0
FIGURE 5.15 Separation of the enantiomers of the painkiller ibuprofen on two different chiral supports.sod.ph.b � sodium phosphate buffer. Courtesy of Chiral Technologies, Inc. www.chiraltech.com.

150 Chapter 5 • Purification and Analysis of Biomolecules by Chromatography
The Mobile Phase
Selection of a column packing that is appropriate for a given analysis does notensure a successful HPLC separation. A suitable solvent system must also bechosen. Several critical solvent properties will be considered here.
Purity Very-high-purity solvents with no particulate matter are required.Many laboratory workers do not purchase expensive prepurified solvents,but, rather, purify lesser grade solvents by microfiltration through aMillipore system or distillation in glass.Reactivity The mobile phase must not react with the analytical sample orcolumn packing. This does not present a major limitation since many rela-tively unreactive hydrocarbons, alkyl halides, and alcohols are suitable.Detector Compatibility A solvent must be carefully chosen to avoid inter-ference with the detector. Most UV detectors monitor the column effluent at254 nm. Any UV-absorbing solvent, such as benzene or olefins, would beunacceptable because of high background. Since refractometer detectorsmonitor the difference in refractive index between solvent and column efflu-ent, a greater difference leads to greater ability to detect the solute.
Sample Preparation and Selection of HPLC Operating Conditions
During the initial stages of biochemical sample preparation, the sample is oftenquite crude; it may contain hundreds of components in addition to the desiredbiomolecules. Most samples must be pretreated before optimum HPLC resultscan be expected. The following procedures may be needed in order to convert acrude sample into a clean one: desalting, removal of anions and cations, removalof metal ions, concentration of the desired macromolecules, removal of deter-gent, and particulate removal. Sample preparation techniques used to achievethese results are gel-exclusion chromatography, ion-exchange chromatography,microfiltration, and metal-affinity chromatography. These procedures may becompleted by commercially available prefilters or precolumns.
Each type of HPLC instrument has its own characteristics and operatingdirections. It is not feasible to describe those here. However, it is appropriate tooutline the general approach taken when an HPLC analysis is desired. Thefollowing items must be considered:
1. Chemical nature and proper preparation of the sample.2. Selection of type of chromatography (partition, adsorption, ion-exchange,
gel-exclusion).3. Choice of solvent system and mode of elution.4. Selection of column packing.5. Choice of equipment (type of detector).
FPLC—A Modification of HPLC
In 1982, Pharmacia introduced an innovative chromatographic method thatprovides a link between classical column chromatography and HPLC.This technique, called fast protein liquid chromatography (FPLC), uses

Chapter 5 • Purification and Analysis of Biomolecules by Chromatography 151
experimental conditions intermediate between those of column chromatogra-phy and HPLC. The typical FPLC system requires a pump that will deliversolvent to the column in the flow rate range 1–499 mL/hr with operating pres-sures of 0–40 bar. (HPLC pumps deliver solvent in a flow rate range of 0.010–10 mL/min with operating pressures of 1–400 bar. Classical chromatographycolumns are operated at atmospheric pressure.) Also required for FPLC are acontroller, detector, and fraction collector. Since lower pressures are used inFPLC than in HPLC, a wider range of column supports is possible.Chromatographic techniques incorporated in an FPLC system are gel filtration,ion exchange, affinity (see Section G, p. 152), hydrophobic interaction, reversedphase, and chromatofocusing.
Perfusion Chromatography
A separation method that improves resolution and decreases the time requiredfor analysis of biomolecules has recently been introduced. This method, calledperfusion chromatography, relies on a type of particle support called POROS,which may be used in low-pressure and high-pressure liquid chromatographyapplications. In conventional chromatographic separations, some biomoleculesin the sample move rapidly around and past the media particles while othermolecules diffuse slowly through the particles (Figure 5.16A). The result is lossof resolution because some biomolecules exit the column before others. To im-prove resolution, the researcher with conventional media found it necessary toreduce the flow rate to allow for diffusion processes, increasing the time requiredfor analysis. In other words, before the development of perfusion chromatogra-phy, the researcher had to choose between high speed–low resolution and lowspeed–high resolution. POROS particles have two types of pores—throughpores (6000–8000 Å in diameter), which provide channels through the particles,and connected diffusion pores (800–1500 Å in diameter), which line the throughpores and have very short diffusion path lengths (Figure 5.16B). This combination
A B
FIGURE 5.16 Transport of biomolecules through chromatographic media. A Conventionalsupport particles. B POROS particles for perfusion chromatography.

152 Chapter 5 • Purification and Analysis of Biomolecules by Chromatography
pore system increases the porosity and the effective surface area of the particlesand results in improved resolution and shorter analysis times (30 seconds to3 minutes for POROS versus 30 minutes to several hours for conventional media).
POROS media, made by copolymerization of styrene and divinylbenzene,have high mechanical strength and are resistant to many solvents and chemicals.The functional surface chemistry of the particles can be modified to provide sup-ports for many types of chromatography, including ion exchange, hydrophobicinteraction, immobilized metal affinity, reversed phase, group-selective affinity,and conventional bioaffinity. Perfusion chromatography has been applied withsuccess to the separation of peptides, proteins, and polynucleotides on bothpreparative and analytical scales.
In addition to high resolution and short analysis times, perfusionchromatography has the advantage of improved recovery of biological activitybecause active biomolecules spend less time on the column, where denaturingconditions may exist.
G. AFFINITY CHROMATOGRAPHY AND IMMUNOADSORPTION
The more conventional chromatographic procedures that we have studied up tothis point rely on rather nonspecific physicochemical interactions between a sor-bent and an analyte. The molecular characteristics of net charge, size, and polar-ity do not provide a basis for high selectivity in the separation and isolation ofbiomolecules. The desire for more specificity in chromatographic separations hasled to the development of affinity chromatography. This technique offers theultimate in specificity—separation on the basis of biological interactions. Thebiological function displayed by most macromolecules (antibodies, transportproteins, enzymes, nucleic acids, polysaccharides, receptor proteins, etc.) is aresult of recognition of and interaction with specific molecules called ligands.This is illustrated by Equation 5.7, where M represents a macromolecule and L asmaller molecule or ligand. The two molecules interact in a specific manner toform a complex, L : M
>> (Eq. 5.7)
In a biological system, the formation of the complex often triggers someresponse such as immunological action, control of a metabolic process, hormoneaction, catalytic breakdown of a substrate, or membrane transport. The biologi-cal response depends on proper molecular recognition and binding as shown inthe reaction. The most common example of Equation 5.7 is the interaction thatoccurs between an enzyme molecule, E, and a substrate, S, with reversible for-mation of an ES complex. The biological event resulting from this interaction isthe transformation of S to a metabolic product, P. Only the first step in Equation5.7, formation of the complex, is of concern in affinity chromatography (seeChapter 8, Section B, p. 250).
In practice, affinity chromatography requires the preparation of an insol-uble sorbent, to which appropriate ligand molecules (L) are covalently af-fixed. Thus, ligand molecules are immobilized on the stationary support. Theaffinity support is packed into a column through which a mixture containing
L + M Δ L : M ¡ biological response

Chapter 5 • Purification and Analysis of Biomolecules by Chromatography 153
the desired macromolecule, M, is allowed to percolate. There are many typesof molecules in the mixture, especially if it is a crude cell extract, but onlymacromolecules that recognize and bind to immobilized L are retarded intheir movement through the column. After the nonbinding molecules havewashed through the column, the desired macromolecules are eluted by gentledisruption of the L:M complex. Study Figure 5.17 for an illustration of affinitychromatography.
Affinity chromatography can be applied to the isolation and purification ofvirtually all biological macromolecules. It has been used to purify nucleic acids,enzymes, transport proteins, antibodies, hormone-receptor proteins, drug-bindingproteins, neurotransmitter proteins, and many others.
Successful application of affinity chromatography requires careful designof experimental conditions. The essential components, which are outlined in thefollowing subsections, are: (1) creation and preparation of a stationary matrixwith immobilized ligand, and (2) design of column development and elutingconditions.
Chromatographic Media
Selection of the matrix used to immobilize a ligand requires consideration ofseveral properties. The stationary supports used in gel-exclusion chromatog-raphy are found to be quite suitable for affinity chromatography because:(1) they are physically and chemically stable under most experimental condi-tions, (2) they are relatively free of nonspecific adsorption effects, (3) theyhave satisfactory flow characteristics, (4) they are available with very largepore sizes, and (5) they have reactive functional groups to which an appropri-ate ligand may be attached.
Four types of media possess most of these desirable characteristics: agarose,polyvinyl, polyacrylamide, and controlled-porosity glass (CPG) beads. Highlyporous agarose beads such as Sepharose 4B (Amersham-Pharmacia-LKB-Hoefer)and Bio-Gel A-150 (Bio-Rad Laboratories) have virtually all of these characteris-tics and are the most widely used matrices. Polyacrylamide gels such as Bio-GelP-300 (Bio-Rad) display many of the recommended features; however, theirporosity is not especially high.
B + A, C, D B : A + C, D
+ B B
1. Attach ligand B to gel:
2. Pack modified gel into column and adsorb sample containing a mixture
of components A, C, and D:
Gel Modified gel
B : A + Y B : Y + A
3. Dissociate complex with Y and elute A:
FIGURE 5.17Purification of amacromolecule,A, by affinitychromatography.Ligand B, which hasa specific affinityfor A, is immobilizedon the gel. Yrepresents aneluting agent thatcauses dissociationof A.

154 Chapter 5 • Purification and Analysis of Biomolecules by Chromatography
The Immobilized Ligand
The ligand, B, in Figure 5.17 can be selected only after the nature of the macromol-ecule to be isolated is known. When a hormone-receptor protein is to be purifiedby affinity chromatography, the hormone itself is an ideal candidate for theligand. For antibody isolation, an antigen or hapten may be used as the ligand. Ifan enzyme is to be purified, a substrate analog, inhibitor, cofactor, or effector maybe used as the immobilized ligand. The actual substrate molecule may be used asa ligand, but only if column conditions can be modified to avoid catalytic trans-formation of the bound substrate.
In addition to the foregoing requirements, the ligand must display a strong,specific, but reversible interaction with the desired macromolecule and it musthave a reactive functional group for attachment to the matrix. It should be recog-nized that several types of ligand may be used for affinity purification of a par-ticular macromolecule. Of course, some ligands will work better than others, andempirical binding studies can be performed to select an effective ligand.
Attachment of Ligand to Matrix
Several procedures have been developed for the covalent attachment of the lig-and to the matrix. All procedures for gel modification proceed in two separatechemical steps: (1) activation of the functional groups on the matrix, and (2) join-ing of the ligand to the functional group on the matrix. The attachment methodmust leave the ligand in a form and position capable of binding to the desiredmacromolecule.
A wide variety of activated gels is now commercially available. The mostwidely used are described as follows.
Cyanogen Bromide-Activated Agarose
This gel is especially versatile because all ligands containing primary aminogroups are easily attached to the agarose. It is available under the trade nameCNBr-activated Sepahrose 4B. Since the gel is extremely reactive, very gentle con-ditions may be used to couple the ligand. One disadvantage of CNBr activation isthat small ligands are coupled very closely to the matrix surface; macromolecules,because of steric repulsion, may not be able to interact fully with the ligand. Theprocedure for CNBr activation and ligand coupling is outlined in Figure 5.18A.
6-Aminohexanoic Acid (CH)-Agarose and 1,6-Diaminehexane (AH)-Agarose
These activated gels overcome the steric interference problems stated above bypositioning a six-carbon spacer arm between the ligand and the matrix. Ligandswith free primary amino groups can be covalently attached to CH-agarose,whereas ligands with free carboxyl groups can be coupled to AH-agarose. Theattachment of ligands to AH and CH gels is outlined in Figure 5.18B,C.
Carbonyldiimidazole (CDI)-Activated Supports
Reaction with CDI produces gels that contain uncharged N-alkylcarbamategroups (see Figure 5.18D). CDI-activated agarose, dextran, and polyvinyl acetateare sold by Pierce Biotechnology Co. under the trade name Reacti-Gel.

Chapter 5 • Purification and Analysis of Biomolecules by Chromatography 155
Epoxy-Activated Agarose
The structure of this gel is shown in Figure 5.18E. It provides for the attachmentof ligands containing hydroxyl, thiol, or amino groups. The hydroxyl groups ofmono-, oligo-, and polysaccharides can readily be attached to the gel.
Group-Specific Adsorbents
The affinity materials described up to this point are modified with a ligand hav-ing specificity for a particular macromolecule. Therefore, each time a biomoleculeis to be isolated by affinity chromatography, a new adsorbent must be designedand prepared. Ligands of this type are called substance specific. In contrast,group-specific adsorbents contain ligands that have affinity for a class of bio-chemically related substances. Table 5.5 shows several commercially availablegroup-specific adsorbents and their specificities. The principles behind binding ofnucleic acids and proteins to group-specific adsorbents depend on the actualaffinity adsorbent. In most cases, the immobilized ligand and macromolecule(protein or nucleic acid) interact through one or more of the following forces: hy-drogen bonding, hydrophobic interactions, and/or covalent interactions. Somegroup-specific adsorbents deserve special attention. Phenyl- and octyl-Sepharoseare gels used for hydrophobic interaction chromatography. These adsorbent ma-terials separate proteins on the basis of their hydrophobic character. Because mostproteins contain hydrophobic amino acid side chains, this method is widely used.Octyl-Sepharose is strongly hydrophobic; hence, it binds strongly to nonpolar
RNH2
gel
O
O
A CNBR-agarose
gel
OH
OH+ CNBr gel
OH
OC NH
C NHR
+ NH2
B AH-agarose
gel gelNH (CH2)6
NH2 + RCOOH NH (CH
2)6
NHC R
O
C CH-agarose
gel gelNH (CH2)5COOH + RNH
2NH (CH
2)5
C NHR
O
C C NHR
OO
D Carbonyldiimidazole-agarose
gel O NN
+ RNH2
gel O
+ ROH gel O CH2 CH CH
2gel O
O
E Epoxy-activated agarose
CH2
CH CH2
OH O R
FIGURE 5.18Attachment ofspecific ligands toactivated gels.
ligands.R =

156 Chapter 5 • Purification and Analysis of Biomolecules by Chromatography
proteins. Phenyl-Sepharose is more weakly hydrophobic; therefore, it is morelikely to reversibly bind strongly hydrophobic proteins.
The use of thiopropyl-Sepharose and boronic acid–agarose is an example ofcovalent chromatography, since relatively strong but reversible covalent bondsare formed between the affinity gel and specific macromolecules.
Metal affinity chromatography is a relatively new method that separatesproteins on the basis of metal binding.
The availability of a great variety of group-specific adsorbents inprepacked columns makes possible the combination of FPLC and affinity chro-matography for the separation and purification of proteins.
Immunoadsorption
One of the most effective modifications of affinity chromatography isimmunoaffinity, also called immunoadsorption. The unique high specificity ofantibodies for their antigens is exploited for the purification of antigens. Theinteraction between antigen and antibody is very selective and very strong, per-haps the most specific in affinity chromatography. In practice, the antibody isimmobilized on a column support. The antibody may be obtained by immunizinga rabbit, but you must have relatively large amounts of the purified proteinantigen. The better choice is to make monoclonal antibodies against the antigen.When a mixture containing several other proteins along with the protein antigen
TABLE 5.5 Group-Specific Adsorbents Useful in Biochemical Applications
Group-Specific Adsorbent Group Specificity
5’-AMP-agarose Enzymes that have cofactor, ATP-dependent kinasesNAD+
Benzamidine–Sepharose Serine proteases
Boronic acid–agarose Compounds with cis-diol groups, sugars: catecholamines, ribonucleotides,glycoproteins
Cibracron blue–agarose Enzymes with nucleotide cofactors (dehydrogenases, kinases, DNApolymerases); serum albumin
Concanavalin A–agarose Glycoproteins and glycolipids
Heparin–Sepharose Nucleic acid–binding proteins, restriction endonucleases, lipoproteins
Iminodiacetate–agarose Proteins with affinity for metal ions, serum proteins, interferons
Lentil lectin–Sepharose Detergent-soluble membrane proteins
Lysine–Sepharose Nucleic acids
Octyl-Sepharose Weakly hydrophobic proteins, membrane proteins
Phenyl-Sepharose Strongly hydrophobic proteins
Poly(A)-agarose Nucleic acids containing poly(U) sequences, mRNA-binding proteins
Poly(U)-agarose Nucleic acids containing poly(A) sequences, poly(U)-binding proteins
Protein A–agarose IgG-type antibodies
Thiopropyl-Sepharose containing proteins¬SH

Chapter 5 • Purification and Analysis of Biomolecules by Chromatography 157
is passed through the column, only antigen binds; the other proteins wash off thecolumn. Because antigen:antibody pairs form very strong complexes, it is notespecially difficult to get the protein antigen to bind to the column. There is oftendifficulty, though, in eluting the bound protein without denaturing it. Effectiveeluting agents for disrupting the complexes and eluting the antigen are dis-cussed in the next section.
Protein A-agarose in Table 5.5 is an example of immunoaffinity; however,this adsorbent does not recognize specific antibodies but, rather, the general fam-ily of immunoglobulin G antibodies.
Experimental Procedure for Affinity Chromatography
Although the procedure is different for each type of substance isolated, a generalexperimental plan is outlined here. Figure 5.19 provides a step-by-step plan inflowchart form. Many types of matrix-ligand systems are commercially availableand the costs are reasonable, so it is not always necessary to spend valuable lab-oratory time for affinity gel preparation. Even if a specific gel is not available,time can be saved by purchasing preactivated gels for direct attachment of thedesired ligand. Once the gel is prepared, the procedure is similar to that describedearlier. The major difference is the use of shorter columns. Most affinity gels havehigh capacities and column beds less than 10 cm in length may be used. Asecond difference is the mode of elution. Ligand-macromolecule complexesimmobilized on the column are held together by hydrogen bonding, ionicinteractions, and hydrophobic effects. Any agent that diminishes these forcescauses the release and elution of the macromolecule from the column. Theelution step in affinity chromatography is represented in Figure 5.17, Step 3,where a general eluting agent, Y, dissociates the desired macromolecule, A. Thecommon methods of elution are change of buffer pH, increase of buffer ionicstrength, affinity elution, and chaotropic agents. The choice of elution methoddepends on many factors, including the types of forces responsible for complexformation and the stability of the ligand matrix and isolated macromolecule.
Buffer pH or Ionic Strength
If ionic interactions are important for complex formation, a change in pH or ionicstrength weakens the interaction by altering the extent of ionization of ligandand macromolecule. In practice, either a decrease in pH or a gradual increase inionic strength (continual or stepwise gradient) is used.
Affinity Elution
In this method of elution, a selective substance added to the eluting buffer com-petes for binding to the ligand or for binding to the adsorbed macromolecule.
Chaotropic Agents
If gentle and selective elution methods do not release the bound macromolecule,as may be the case in immunoadsorption, then mild denaturing agents can beadded to the buffer. These substances deform protein and nucleic acid structureand decrease the stability of the complex formed on the affinity gel. The mostuseful agents are urea, guanidine and TheseCCl3COO- .# HCl, CNS - , ClO4
- ,
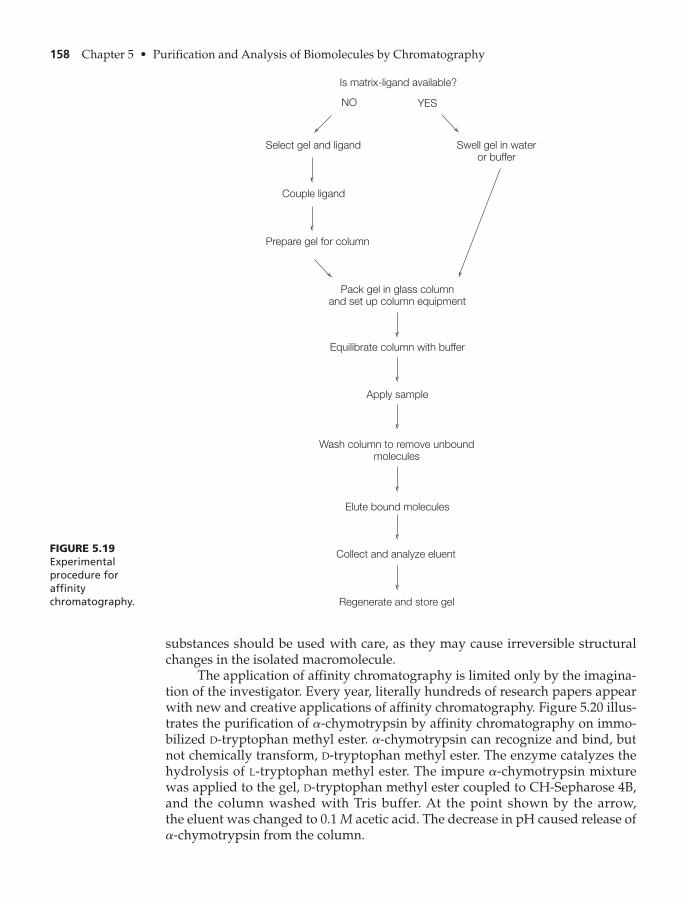
158 Chapter 5 • Purification and Analysis of Biomolecules by Chromatography
substances should be used with care, as they may cause irreversible structuralchanges in the isolated macromolecule.
The application of affinity chromatography is limited only by the imagina-tion of the investigator. Every year, literally hundreds of research papers appearwith new and creative applications of affinity chromatography. Figure 5.20 illus-trates the purification of -chymotrypsin by affinity chromatography on immo-bilized D-tryptophan methyl ester. -chymotrypsin can recognize and bind, butnot chemically transform, D-tryptophan methyl ester. The enzyme catalyzes thehydrolysis of L-tryptophan methyl ester. The impure -chymotrypsin mixturewas applied to the gel, D-tryptophan methyl ester coupled to CH-Sepharose 4B,and the column washed with Tris buffer. At the point shown by the arrow,the eluent was changed to 0.1 M acetic acid. The decrease in pH caused release of
-chymotrypsin from the column.a
a
a
a
Is matrix-ligand available?
NO
Select gel and ligand Swell gel in water
or buffer
YES
Equilibrate column with buffer
Couple ligand
Prepare gel for column
Pack gel in glass column
and set up column equipment
Apply sample
Regenerate and store gel
Collect and analyze eluent
Elute bound molecules
Wash column to remove unbound
molecules
FIGURE 5.19Experimentalprocedure foraffinitychromatography.

Chapter 5 • Purification and Analysis of Biomolecules by Chromatography 159
250 5 10 2015C
oncentr
ation
Elution volume (mL)
FIGURE 5.20 Purification of -chymotrypsin by affinity chromatography on immobilized D-tryptophan methyl ester. From Affinity Chromatography: Principles and Methods.Pharmacia (Uppsala, Sweden).
a
STUDY EXERCISE 5.7 Affinity Chromatography
You have discovered that leaves from the quaking aspen tree contain an enzyme thatcatalyzes the transfer of a phosphoryl group from ATP to various carbohydrates. Youwish to purify the enzyme, a kinase, by affinity chromatography. Select two stationaryphases from Table 5.5 that might be effective in this separation.
H. MEMBRANE-BASED CHROMATOGRAPHY
Most of the column chromatographic stationary supports discussed up to thispoint were based on particles, usually in the form of synthetic resin beads.Biotech labs and pharmaceutical companies involved in the manufacture ofprotein- and nucleic acid-based drugs require effective purification methods thatoffer large capacity and speed and are usually dependent on chromatography.There are several limitations to the use of bead-based stationary supports, and itis challenging to improve separating ability and speed especially in purifyinglarge biomolecules Separation of biomolecules depends ontheir binding to functional groups (ion exchange, affinity, etc.) that are oftenpresent inside the beads and thus not readily available for binding of largermolecules. Increasing the number of functional groups by increasing the heightof a column is not an option, as the resin beads are compressible and thus causea reduction in the flow rate.
Many of the limitations of conventional bead columns may be overcome bythe use of synthetic, microporous membranes as stationary supports. These mem-branes offer a three-dimensional structure with open pores, which are readilyavailable to larger biomolecules (Figure 5.21). Research on chromatography mem-branes shows that movement of molecules takes place by convection rather thandiffusion, which enhances the distribution of molecules throughout the support.Other advantages of membrane-based chromatography compared to conventionalbead columns include higher flow rates (up to 100 times faster), higher capacity(10 times greater), and the fact that the membranes can be packed into layers,which greatly improves the effectiveness of biomolecule separation.
17 200,000 daltons2.

160 Chapter 5 • Purification and Analysis of Biomolecules by Chromatography
Membranes are available for several chromatographic modes including ionexchange, affinity, hydrophobic interaction, and reverse phase. The ion-exchangemembranes have a polyethersulfone base modified with sulfonic acid groups(cation exchanger) or quaternary amines (anion exchanger). The membranes havebeen found to be effective in separating and purifying proteins, plasmid DNA,and other biomolecules. Membranes are available in disposable plastic cartridges(5 mL, 140 mL, or 5000 mL volumes), which can be linked to HPLC or FPLC sys-tems or used alone with a peristaltic pump or syringe (Figure 5.22). Membranecartridges are designed so they can be set up in flow systems, which allows forpurification of large sample sizes as used in industry (Figure 5.23).
FIGURE 5.21 Theinside of an ion-exchange chro-matographymembrane showingthe readily accessible pores.Photo courtesy ofPall Corporation,www.pall.com.
FIGURE 5.22Disposablemembranecartridges. Photocourtesy of PallCorporation, www.pall.com.
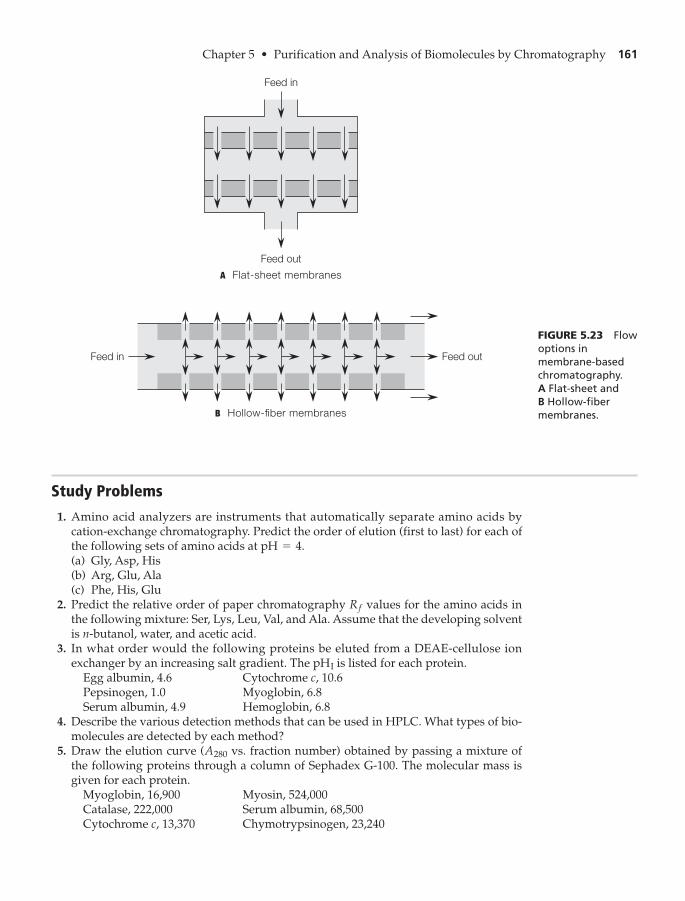
Chapter 5 • Purification and Analysis of Biomolecules by Chromatography 161
Study Problems
1. Amino acid analyzers are instruments that automatically separate amino acids bycation-exchange chromatography. Predict the order of elution (first to last) for each ofthe following sets of amino acids at (a) Gly, Asp, His(b) Arg, Glu, Ala(c) Phe, His, Glu
2. Predict the relative order of paper chromatography values for the amino acids inthe following mixture: Ser, Lys, Leu, Val, and Ala. Assume that the developing solventis n-butanol, water, and acetic acid.
3. In what order would the following proteins be eluted from a DEAE-cellulose ionexchanger by an increasing salt gradient. The is listed for each protein.
Egg albumin, 4.6 Cytochrome c, 10.6Pepsinogen, 1.0 Myoglobin, 6.8Serum albumin, 4.9 Hemoglobin, 6.8
4. Describe the various detection methods that can be used in HPLC. What types of bio-molecules are detected by each method?
5. Draw the elution curve ( vs. fraction number) obtained by passing a mixture ofthe following proteins through a column of Sephadex G-100. The molecular mass isgiven for each protein.
Myoglobin, 16,900 Myosin, 524,000Catalase, 222,000 Serum albumin, 68,500Cytochrome c, 13,370 Chymotrypsinogen, 23,240
A280
pHI
Rf
pH = 4.
FIGURE 5.23 Flowoptions inmembrane-basedchromatography. A Flat-sheet and B Hollow-fibermembranes.
A Flat-sheet membranes
Feed in
Feed out
B Hollow-fiber membranes
Feed in Feed out

162 Chapter 5 • Purification and Analysis of Biomolecules by Chromatography
6. Briefly describe how you would experimentally measure the exclusion limit for aSephadex gel whose bottle has lost its label.
7. Name three enzymes that you predict will bind to the affinity support, -AMP-agarose.8. Explain the elution order of amino acids in Figure 5.11.9. Describe how you would use affinity elution to remove the enzyme alcohol dehydro-
genase bound to a Cibracron blue–agarose column.10. You have read in your botany textbook that bean leaves contain an enzyme that cat-
alyzes the hydrolysis of the methyl esters of aromatic amino acids (for example, themethyl ester of phenylalanine). You wish to design a plan for isolating and purify-ing the enzyme. Assume that your last step of purification is to be affinity chro-matography. Describe an affinity sorbent that might be effective in purifying theprotein.
11. In affinity chromatography and immunoadsorption, analytes are usually tightlybound to the sorbent. Which of the following types of bonding are important in form-ing these complexes?
Hydrogen bondingCovalent bonds between carbon atomsIonic bondsHydrophobic interactionsVan der Waals forces
12. You have isolated an unknown protein and wish to estimate its molecular weightusing column gel filtration with several standard proteins. The gel material isSephacryl S-100. The following elution volumes were measured.
5¿
Protein MW Elution volume (mL)
Hemoglobin 64,500 10.1Egg albumin 45,000 14.5Chymotrypsinogen 23,200 25.0Myoglobin 16,900 28.2Cytochrome c 13,000 31.0Unknown ? 7.5
What is the approximate molecular weight of the unknown protein?Hint: Prepare a graph like in Figure 5.9.
13. Which gel filtration medium would be more effective in separating the six proteins inStudy Problem 12, Sephadex G-50 or G-100? Why?
14. Which column chromatographic method is better to separate the proteins below, ionexchange or gel filtration?
Hemoglobin MW = 64,500; isoelectric pH = 6.8Myoglobin MW = 17,000; isoelectric pH = 7.0
15. Use information from Chapter 2 to help you find the following:(a) a recent research article on the purification of egg white lysozyme by membrane-
based chromatography(b) the availability of spin columns for membrane-based chromatography(c) chiral chromatography using membranes

Chapter 5 • Purification and Analysis of Biomolecules by Chromatography 163
Further Reading
H. Aboul-Enein and I. Ali, Chiral Separations by Liquid Chromatography: Theory andApplications (2003), Marcel Dekker (New York).
J. Berg, J. Tymoczko, and L. Stryer, Biochemistry, 6th ed. (2007), Freeman (New York).Introduction to chromatography.
R. Boyer, Concepts in Biochemistry, 3rd ed. (2006), John Wiley & Sons (Hoboken, NJ),pp. 84–86. An introduction to chromatography.
J. Coligan, (Editor), Short Protocols in Protein Science (2003), John Wiley & Sons(Hoboken, NJ).
R. Curtright, R. Emry, and J. Markwell, J. Chem. Educ. 76, 249 (1999). “StudentUnderstanding of Chromatography: A Hands-On Approach.”
R. Garrett and C. Grisham, Biochemistry, 4th ed. (2010), Brooks/Cole (Belmont, CA). Anintroduction to chromatography.
R. Ghosh, J. Chromatogr. 952, 13–27 (2002), “Protein separation using membranechromatography.”
D. Gjerde, C. Hanna, and D. Hornby, DNA Chromatography (2002), John Wiley & Sons(New York).
F. Gorga, J. Chem. Educ. 77, 264 (2000). “A Problem-Solving Approach to Chromatographyin the Biochemistry Lab.”
E. Grushka and P. Brown, Advances in Chromatography (2003), Marcel Dekker (New York).M. Gupta, (Editor), Methods for Affinity-Based Separations for Enzymes and Proteins
(2002), Birkhauser (Cambridge, MA).D. Hage and J. Cazes (Editors), Handbook of Affinity Chromatography, 2nd ed. (2005),
Marcel Dekker (New York).R. Hatti-Kaul and B. Mattiasson, (Editors), Isolation and Purification of Proteins (2003),
Marcel Dekker (New York).J. Kemsley, Chem. Eng. News, May 18, 2009, pp. 11–18. “Modernizing TLC.”T. Kowalska and J. Sherma, Preparative Thin-Layer Chromatography, (2006), CRC Press,
Taylor & Francis Group (Boca Raton, FL).J. Miller, Chromatography: Concepts and Contrasts, 2nd ed. (2009), Wiley-Interscience.D. Nelson and M. Cox, Lehninger Principles of Biochemistry, 5th ed. (2009), Freeman
(New York). Introduction to chromatography.C. Poole, The Essence of Chromatography (2003), Elsevier (Amsterdam).M. Pugh and E. Schultz, Biochem. Mol. Biol. Educ. 30, 179–183 (2002). “Assessment of the
Purification of a Protein by Ion Exchange and Gel Permeation Chromatography.”D. Sheehan, Physical Biochemistry: Principles and Applications, 2nd ed. (2009), Wiley-
Blackwell (Hoboken, NJ).J. Sherma and B. Fried (Editors), Handbook of Thin-Layer Chromatography, 3rd ed.
(2003), Marcel Dekker (New York-Basel-Hong Kong).L. Snyder, J. Kirkland, J. Dolan, Introduction to Modern Liquid Chromatography, 3rd ed.
(2009), Wiley (Hoboken, NJ).A. Striegel, W. Yau, J. Kirkland, D. Bly, Modern Size-Exclusion Liquid Chromatography,
2nd ed. (2009), Wiley.M. Urh, D. Simpson, K. Zhao, Methods Enzymology, 463, 417–438 (2009). “Affinity
Chromatography: General Methods.”D. Voet and J. Voet, Biochemistry, 3rd ed. (2005), John Wiley & Sons (Hoboken, NJ). Use of
chromatography in protein purification.D. Voet, J. Voet, and C. Pratt, Fundamentals of Biochemistry, 3rd ed. (2008), John Wiley &
Sons (Hoboken NJ). Chromatography in protein purification.

164 Chapter 5 • Purification and Analysis of Biomolecules by Chromatography
J. Watson et al., Molecular Biology of the Gene, 5th ed. (2004), Benjamin/Cummings (SanFrancisco), Chapter 20 (Methods).
K. Williams, J. Chem. Educ. 79, 922 (2002). “Colored Bands: History of Chromatography.”K. Wilson and J. Walker, (Editors), Principles and Techniques of Practical Biochemistry,
5th ed. (2000), Cambridge University Press (Cambridge), pp. 619–687.Chromatographic techniques.
M. Zachariou (Editor), Affinity Chromatography: Methods and Protocols (2007),Humana Press.
http://aesop.rutgers.edu/~dbm/affinity.htmlAffinity and immunoadsorbent chromatography.
http://www.sigmaaldrich.com/life-science/proteomics/protein-chromatography/affinity-chromatography.html
Affinity chromatography.
http://www.bio.davidson.edu/Courses/genomics/method/Affinity.htmlMethods of affinity chromatography.
http://andromeda.rutgers.edu/~mendelso/biochem581/BiochemToolsLecture.pdfMethods of chromatography.
https://products.appliedbiosystems.com/ab/en/US/adirect/ab;jsessionid=y2fQLcRpjVn7gv5h1tmJ0yqWtPkF8WXpBKL1Qn1LxnsD8ZdpyfP1!1614902786?cmd=catNavigate2&catID=600500
Perfusion chromatography.
http://www.separationsnow.com/coi/cda/home.cda?chId=0Resources for chromatography.
http://www.chiraltech.comSupplier of chiral columns and chromatography materials.
http://www1.gelifesciences.com/aptrix/upp01077.nsf/content/na_homepageOn Home Page, select “Protein purification.”
http://www.encyclopedia.com/doc/1P3-190345261.htmlMembrane chromatography.
http://www.pall.com/biopharm_33053.aspMembrane chromatography starter kits.
http://www.wpi.edu/Pubs/ETD/Available/etd-050405-174109/unrestricted/cao.pdfA thesis on protein separation with ion-exchange membrane chromatography.
http://www.iptonline.com/articles/public/page50loresnonprint.pdfPurifying large biomolecules using membrane chromatography.
http://www.camag.comProducts for planar chromatography.
http://www.piercenet.com/Products/Browse.cfm?fldID=1A66B494-33B2-4358-804A-6FDB69A7FFAB
Ion-exchange spin columns.
Additional Web sites for this chapter are available on the book’s Companion Website,which can be found at http://www.chemplace.com.

6CHARACTERIZATION OFPROTEINS AND NUCLEIC ACIDSBY ELECTROPHORESIS
165
Electrophoresis is an analytical tool that allows biochemists to examine the differentialmovement of charged molecules in an electric field. A. Tiselius, a Swede who inventedthe technique in the 1930s, performed experiments in free solution that were severely
limited by the effects of diffusion and convection currents. Modern electrophoretic techniquesuse a polymerized gel-like matrix, which is more stable as a support medium. The sample tobe analyzed is applied to the medium as a spot or thin band; hence, the term zonal elec-trophoresis is often used. The migration of molecules is influenced by: (1) the size, shape,charge, and chemical composition of the molecules to be separated; (2) the rigid, mazelikematrix of the gel support; and (3) the applied electric field. Electrophoresis, which is a relativelyrapid, inexpensive, and convenient technique, is capable of analyzing and purifying manydifferent types of biomolecules, but is especially effective with proteins and nucleic acids. Thenewest version of the analytical technique, capillary electrophoresis (CE), provides extremelyhigh resolution and is useful for analysis of both large and small molecules. CE has beenfound to be especially useful in the analysis of pharmaceuticals.
Proteomics, the discipline that attempts systematic, large-scale studies on the structureand function of gene products in an organism or cell, is expanding rapidly because of theavailability of electrophoresis (especially two-dimensional techniques) to analyze proteinsand peptides.
A. Theory of Electrophoresis 166B. Methods of Electrophoresis 167C. Practical Aspects of Electrophoresis 188
Study Problems 198Further Reading 199
C H A P T E R

166 Chapter 6 • Characterization of Proteins and Nucleic Acids by Electrophoresis
Even though electrophoresis has been studied for more than 80 years, it hasbeen a challenge to provide an accurate, theoretical description of theelectrophoretic movement of molecules in a gel support. However, the lack oftheoretical understanding has not hampered growth in the use of the techniquein separating and characterizing a wide variety of biomolecules.
A. THEORY OF ELECTROPHORESIS
Introduction
The movement of a charged molecule in a medium subjected to an electric fieldis represented by Equation 6.1.
>> (Eq. 6.1)
where
the electric field in volts/cmthe net charge on the moleculefrictional coefficient, which depends on the mass and shape of the moleculethe velocity of the molecule
The charged particle moves at a velocity that depends directly on the electricfield (E) and charge (q), but inversely on a counteracting force generated by theviscous drag ( f ). The applied voltage represented by E in Equation 6.1 is usuallyheld constant during electrophoresis, although some experiments are run underconditions of constant current (where the voltage changes with resistance) or con-stant power (the product of voltage and current). Under constant-voltage condi-tions, Equation 6.1 shows that the movement of a charged molecule depends onlyon the ratio For molecules of similar conformation (for example, a collectionof linear DNA fragments or spherical proteins), f varies with size but not shape;therefore, the only remaining variables in Equation 6.1 are the charge (q) and massdependence of f, meaning that under such conditions molecules migrate in anelectric field at a rate proportional to their charge-to-mass ratio.
Theory and Practice
The movement of a charged particle in an electric field is often defined in termsof mobility, the velocity per unit of electric field (Equation 6.2).
>> (Eq. 6.2)
This equation can be modified using Equation 6.1.
>> (Eq. 6.3)m =Eq
Ef=q
f
m =vE
m,
q>f.
n =
f =q =E =
v =Eq
f

Chapter 6 • Characterization of Proteins and Nucleic Acids by Electrophoresis 167
In theory, if the net charge, q, on a molecule is known, it should be possible tomeasure f and obtain information about the hydrodynamic size and shape ofthat molecule by investigating its mobility in an electric field. Attempts todefine f by electrophoresis have not been successful, primarily becauseEquation 6.3 does not adequately describe the electrophoretic process.Important factors that are not accounted for in the equation are interaction ofmigrating molecules with the support medium and shielding of the moleculesby buffer ions. This means that electrophoresis is not useful for describing spe-cific details about the shape of a molecule. Instead, it has been applied to theanalysis of purity and size of macromolecules. Each molecule in a mixture isexpected to have a unique charge and size, and its mobility in an electric fieldwill therefore be unique. This expectation forms the basis for analysis and sepa-ration by all electrophoretic methods. The technique is especially useful for theanalysis of amino acids, peptides, proteins, nucleotides, nucleic acids, and othercharged molecules, including pharmaceuticals.
B. METHODS OF ELECTROPHORESIS
All modes of electrophoresis are based on the principles just outlined. The majordifference among the various methods is the type of support medium. Celluloseand cellulose acetate are used as a support medium for low-molecular-weightbiochemicals like amino acids and carbohydrates. Polyacrylamide and agarosegels are widely used as support media for larger molecules. In capillary elec-trophoresis, several different types of support media, including the natural,untreated surfaces inside a silica narrow bore capillary tube, are used.Geometries (vertical and horizontal), buffers, and electrophoretic conditions pro-vide many different experimental arrangements for the variety of methodsdescribed here.
Polyacrylamide Gel Electrophoresis (PAGE)
Gels formed by polymerization of acrylamide have several positive features inelectrophoresis: (1) high resolving power for small and moderately sized pro-teins and nucleic acids (up to approximately daltons), (2) acceptance ofrelatively large sample sizes, (3) minimal interactions of the migrating moleculeswith the matrix, and (4) physical stability of the matrix. Recall from the earlierdiscussion of gel filtration (Chapter 5, p. 132) that gels can be prepared withdifferent pore sizes by changing the concentration of cross-linking agents.Electrophoresis through polyacrylamide gels leads to enhanced resolution ofsample components because the separation is based on both molecular sievingand electrophoretic mobility. The order of molecular movement in gel filtrationand PAGE is very different, however. In gel filtration, large molecules migratethrough the matrix faster than small molecules. The opposite is the case for gelelectrophoresis, where there is no void volume in the matrix, but only a continu-ous network of pores throughout the gel. The electrophoresis gel is comparableto a single bead in gel filtration. Therefore, large molecules do not move easilythrough the medium, and the order of movement is small molecules followed bylarge molecules.
1 * 106

168 Chapter 6 • Characterization of Proteins and Nucleic Acids by Electrophoresis
Ammonium persulfate Riboflavin
R.
(Radicals)
CONH2
CONH2
CONH
CONH
CH2
CH2
CH CH2 n
( (
n( (
CH CH2
CH CH2
CH
CH2
CH2
CH CH2
CH CH2
CH CH2
CH
CH2
CH
CH2
CH
CH2
CH
CONH
CONH
CONH
CH2
CONH
CONH
CONH2
CONH2
CH2
TEMED (catalyst)
+
Polyacrylamide
AcrylamideN,N′-methylene-
bis-acrylamide
hν
FIGURE 6.1Chemical reactionsillustrating thecopolymerizationof acrylamide and
-methylene-bis-acrylamide. Seetext for details.
N,N¿
Preparation of Gels
Polyacrylamide gels are prepared by the free radical polymerization of acrylamideand the cross-linking agent -methylene-bis-acrylamide (Figure 6.1).Chemical polymerization is controlled by an initiator-catalyst system, ammoniumpersulfate– -tetramethylethylenediamine (TEMED). Photochemicalpolymerization may be initiated by riboflavin in the presence of ultraviolet (UV)radiation. A standard gel for protein separation is 7.5% polyacrylamide. It can beused over the molecular size range of 10,000 to 1,000,000 daltons; however, the bestresolution is obtained in the range of 30,000 to 300,000 daltons. The resolvingpower and molecular size range of a gel depend on the concentrations of acry-lamide and bis-acrylamide (see Table 6.1 for effective ranges of protein separation).Lower concentrations give gels with larger pores, allowing analysis of higher-molecular-weight biomolecules. In contrast, higher concentrations of acrylamidegive gels with smaller pores, allowing analysis of lower-molecular-weight biomol-ecules (see Table 6.2 for effective ranges of DNA separation).
Polyacrylamide gel electrophoresis has been done using either of twoinstrumental arrangements, column or slab. Column gels are rarely used today,but they do have historical significance as they are important forerunners of
N,N,N¿,N¿
N,N¿

Chapter 6 • Characterization of Proteins and Nucleic Acids by Electrophoresis 169
TABLE 6.1 Separation of Proteins by PAGE. The recommended concentrationsof acrylamide are given that will best separate proteins ofdifferent molecular weight ranges
(% w>v)
Protein Molecular Weight Range Recommended % Acrylamide 1(w>v)
<10,000 715%
10,000–80,000 10–15%
20,000–150,000 5–10%
7100,000 3–5%
1Ratio of acrylamide to bis-acrylamide, 37.5:1 (g:g).
TABLE 6.2 Effective Range of Separation of DNA by PAGE
Acrylamide1
(% w>v)Range of
Separation (bp)Bromophenol
Blue2XyleneCyanol2
3.5 1000–2000 100 450
5.0 80–500 65 250
8.0 60–400 50 150
12.0 40–200 20 75
20.0 5–100 10 50
1 Ratio of acrylamide to bis-acrylamide, 20:1.2 The numbers (in bp) represent the size of DNA fragment with the same mobility as the dye.
more modern slab gels. Figure 6.2 shows the typical arrangement for a columngel. Glass tubes are filled with a mixture of acrylamide,
-methylene-bis-acrylamide, buffer, and free radical initiator-catalyst.Polymerization occurs in 30 to 40 minutes. The gel column is inserted betweentwo separate buffer reservoirs. The upper reservoir usually contains the cathode and the lower the anode Gel electrophoresis is usually carried out at basicpH, where most biological polymers are anionic; hence, they move down towardthe anode. The sample to be analyzed is layered on top of the gel, and voltageis applied to the system. DNA and many proteins are colorless, so a reagentdye must be added to monitor the rate of electrophoresis. A “tracking dye” isapplied, which moves more rapidly through the gel than the sample compo-nents. When the dye band has moved to the opposite end of the column, thevoltage is turned off and the gel is removed from the column and stained with adye. Chambers for column gel electrophoresis, instruments that hold severalglass tubes, are commercially available or can be constructed from inexpensivematerials.
Slab Gel Electrophoresis
Slab gels are now much more widely used than column gels. A slab gel on whichseveral samples may be analyzed is more convenient to make and use than severalindividual column gels. Slab gels also offer the advantage that all samples are
(+).(-)
N,N¿(10 cm * 6 mm i.d.)

170 Chapter 6 • Characterization of Proteins and Nucleic Acids by Electrophoresis
analyzed in a matrix environment that is identical in composition compared toglass tubes, which may have slightly different compositions. A typical vertical slabgel apparatus is shown in Figure 6.3. The polyacrylamide slab is prepared betweentwo glass plates that are separated by spacers (Figure 6.4). The spacers allow a uni-form slab thickness of 0.5 to 2.0 mm, which is appropriate for analytical and somepreparative procedures. Slab gels are usually or but fornucleotide sequencing, slab gels as large as are often required.
A plastic “comb” inserted into the top of the slab gel during polymerizationforms indentations in the gel that serve as sample wells. Up to 20 sample wellsmay be formed. After polymerization, the comb is carefully removed and thewells are rinsed thoroughly with buffer to remove salts and any unpolymerizedacrylamide. The gel plate is clamped into place between two buffer reservoirs, asample is loaded into each well, and voltage is applied. For visualization, theslab is removed and stained with an appropriate dye, or in some cases, the gelmay be prestained with the dye before electrophoresis.
Perhaps the most difficult and inconvenient aspect of polyacrylamide gelelectrophoresis is the preparation of gels. The monomer, acrylamide, is a neuro-toxin and a carcinogenic agent; hence, special handling is required. Other neces-sary reagents including catalysts and initiators also require special handling andare unstable. In addition, it is difficult to make gels that have reproducible thick-nesses and compositions. Many researchers are now turning to the use of precastpolyacrylamide gels. Several manufacturers now offer gels precast in glass orplastic cassettes. Gels for all experimental operations are available, including
20 * 40 cm10 * 10 cm,8 * 10 cm
Gel tube
Lower buffer chamber
+
–
Upper buffer chamber
Sample
Cathode
Anode
Power
supply
FIGURE 6.2 Acolumn gel forpolyacrylamide gelelectrophoresis.
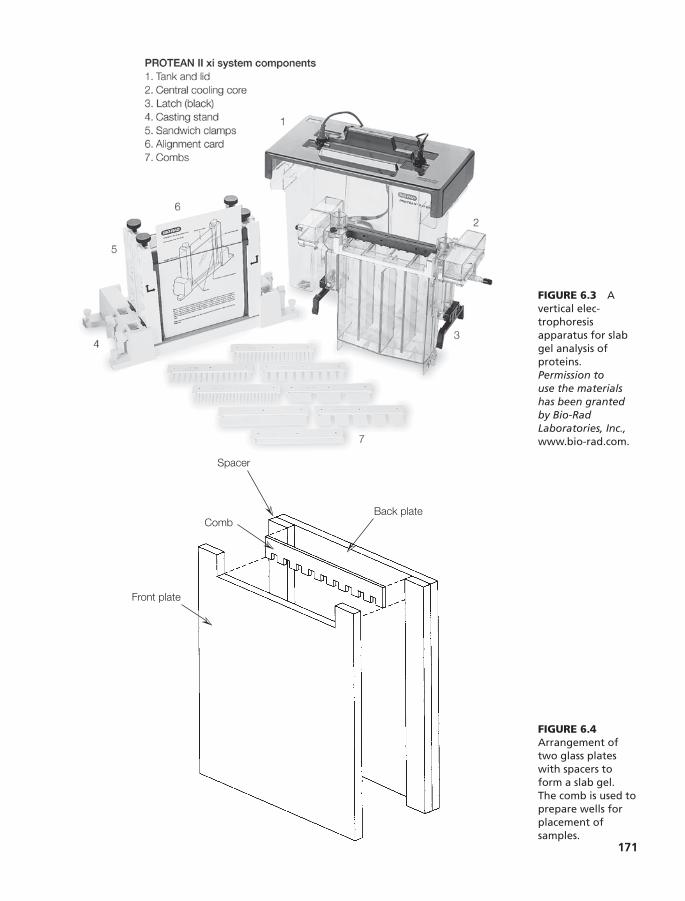
FIGURE 6.3 Avertical elec-trophoresisapparatus for slabgel analysis ofproteins.Permission to use the materials has been granted by Bio-RadLaboratories, Inc.,www.bio-rad.com.
Back plate
Spacer
Comb
Front plate
FIGURE 6.4Arrangement oftwo glass plateswith spacers toform a slab gel. The comb is used toprepare wells forplacement ofsamples.
171

172 Chapter 6 • Characterization of Proteins and Nucleic Acids by Electrophoresis
C
BA
Stacking gel
2–3% Acrylamide
pH 6.9
Resolving gel
7.5% Acrylamide
pH 8–9
Separated proteins
Glycine
Proteins
Chloride
FIGURE 6.5 Theprocess of disc gelelectrophoresis.A Beforeelectrophoresis.B Movement ofchloride, glycinate,and proteinthrough thestacking gel.C Separation ofprotein samples bythe resolving gel.
single percentage (between 3% and 27%) or gradient gel concentrations and avariety of sample well configurations and buffer chemistries. More details onprecast gels will be given in Section C, Practical Aspects of Electrophoresis.
Several modifications of PAGE have greatly increased its versatility andusefulness as an analytical tool.
Discontinuous Gel Electrophoresis
The experimental arrangement for “disc” gel electrophoresis is shown inFigure 6.5. Three significant characteristics of this method are that: (1) there aretwo gel layers, a lower or resolving gel and an upper or stacking gel; (2) the

Chapter 6 • Characterization of Proteins and Nucleic Acids by Electrophoresis 173
buffers used to prepare the two gel layers are of different ionic strengths andpH; and (3) the stacking gel has a lower acrylamide concentration, so its poresizes are larger. These three changes in the experimental conditions cause theformation of highly concentrated bands of sample in the stacking gel andgreater resolution of the sample components in the lower gel. Sample concen-tration in the upper gel occurs in the following manner. The sample is usuallydissolved in glycine-chloride buffer, pH 8 to 9, before loading on the gel.Glycine exists primarily in two forms at this pH, a zwitterion and an anion(Equation 6.4).
>> (Eq. 6.4)
The average charge on glycine anions at pH 8.5 is about When the volt-age is turned on, buffer ions (glycinate and chloride) and protein or nucleic acidsample move into the stacking gel, which has a pH of 6.9. Upon entry into theupper gel, the equilibrium of Equation 6.4 shifts toward the left, increasing theconcentration of glycine zwitterion, which has no net charge and hence no elec-trophoretic mobility. In order to maintain a constant current in the electrophore-sis system, a flow of anions must be maintained. Since most proteins and nucleicacid samples are still anionic at pH 6.9, they replace glycinate as mobile ions.Therefore, the relative ion mobilities in the stacking gel are chloride protein ornucleic acid sample glycinate. The sample will tend to accumulate and form athin, concentrated band sandwiched between the chloride and glycinate as theymove through the upper gel. Since the acrylamide concentration in the stackinggel is low (2% to 3%), there is little impediment to the mobility of the large samplemolecules.
Now, when the ionic front reaches the lower gel with pH 8 to 9 buffer, theglycinate concentration increases and anionic glycine and chloride carry mostof the current. The protein or nucleic acid sample molecules, now in a narrowband, encounter both an increase in pH and a decrease in pore size. Theincrease in pH would, of course, tend to increase electrophoretic mobility, butthe smaller pores decrease mobility. The relative rate of movement of anionsin the lower gel is chloride glycinate protein or nucleic acid sample. Theseparation of sample components in the resolving gel occurs as described inan earlier section on gel electrophoresis. Each component has a uniquecharge/mass ratio and a discrete size and shape, which directly influence itsmobility. Disc gel electrophoresis yields excellent resolution and is the methodof choice for analysis of proteins and nucleic acid fragments. Protein or nucleicacid bands containing as little as 1 or can be detected by staining the gelsafter electrophoresis.
2 mg
77
77
-0.2.
H3N+
CH2COO - ÷ H2NCH2COO - + H +
STUDY EXERCISE 6.1 PAGE
You are using the technique of nondenaturing PAGE to separate a mixture of two pro-teins, bovine serum albumin and bovine hemoglobin. Assume that you are using a bufferof pH 8.0 and a gel of 7.5% acrylamide, and that silver staining was used for detection.Show the results of your experiment by drawing a gel with dark bands for each protein.

174 Chapter 6 • Characterization of Proteins and Nucleic Acids by Electrophoresis
Sodium Dodecyl Sulfate–Polyacrylamide Gel Electrophoresis (SDS-PAGE)
If protein samples are treated so that they have a uniform charge, electrophoreticmobility then depends primarily on size (see Equation 6.3). The molecularweights of proteins may be estimated if they are subjected to electrophoresis inthe presence of a detergent, sodium dodecyl sulfate (SDS), and a disulfide bondreducing agent, mercaptoethanol. This method is often called denaturingelectrophoresis.
The electrophoretic techniques previously discussed are called nondena-turing or “native” PAGE and are used when an investigator requires that theprotein analyzed still retains its biological activity. This would be the case whenthe protein is an enzyme or antibody, or contains a receptor binding site. Theseparation of proteins under these conditions in which they maintain their nativeconformation is influenced by both charge and size.
When protein molecules are treated with SDS, the detergent disrupts thesecondary, tertiary, and quaternary structure to produce linear polypeptidechains coated with negatively charged SDS molecules. The presence of mer-captoethanol assists in protein denaturation by reducing all disulfide bonds.The detergent binds to hydrophobic regions of the denatured protein chain ina constant ratio of about 1.4 g of SDS per gram of protein. The bound deter-gent molecules carrying negative charges mask the native charge of theprotein. In essence, polypeptide chains of a constant charge/mass ratio anduniform shape are produced. The electrophoretic mobility of the SDS-proteincomplexes is influenced primarily by molecular size: the larger molecules areretarded by the molecular sieving effect of the gel, and the smaller moleculeshave greater mobility. Empirical measurements have shown a linear relation-ship between the log molecular weight and the electrophoretic mobility(Figure 6.6).
In practice, a protein of unknown molecular weight and subunit structureis treated with 1% SDS and 0.1 M mercaptoethanol in electrophoresis buffer. Astandard mixture of proteins with known molecular weights must also be sub-jected to electrophoresis under the same conditions. Two broad sets of standardsare commercially available, one for low-molecular-weight proteins (molecularweight range 14,000 to 100,000) and one for high-molecular-weight proteins(45,000 to 200,000). Figure 6.7 shows a stained gel after electrophoresis of a stan-dard protein mixture. (For details on stains and staining, see Section C.) Afterelectrophoresis and dye staining, mobilities are measured and molecularweights determined graphically.
SDS-PAGE is valuable for estimating the molecular weight of protein sub-units. This modification of gel electrophoresis finds its greatest use in character-izing the sizes and different types of subunits in oligomeric proteins. SDS-PAGE
Protein pHI MW
Bovine serum albumin 4.9 65,000
Bovine hemoglobin 6.8 65,000
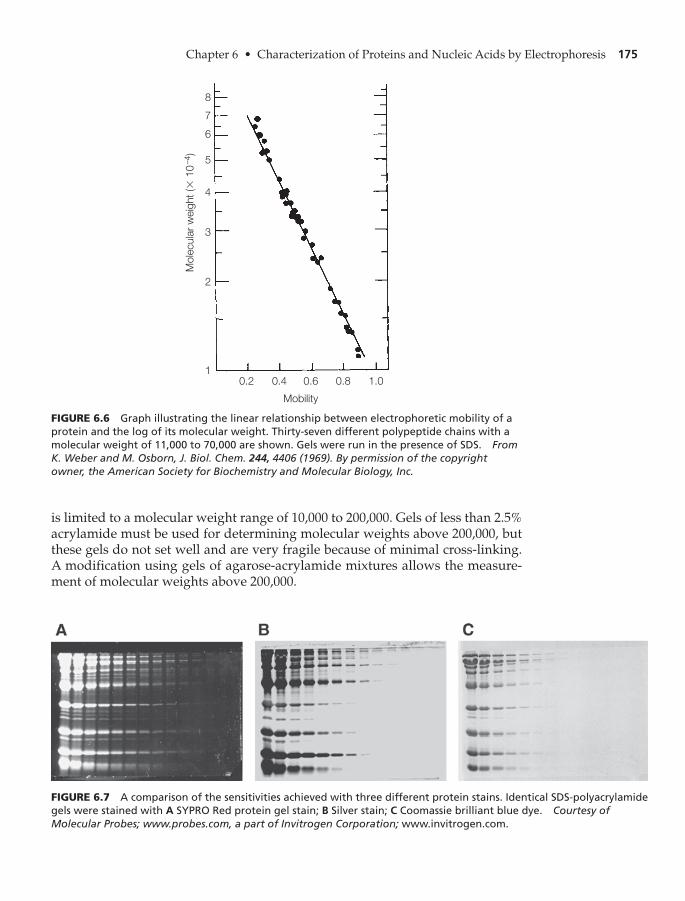
Chapter 6 • Characterization of Proteins and Nucleic Acids by Electrophoresis 175
0.2 0.4 0.6 0.8 1.01
2
Mole
cula
r w
eig
ht
(× 1
0–4)
3
4
5
6
7
8
Mobility
FIGURE 6.6 Graph illustrating the linear relationship between electrophoretic mobility of aprotein and the log of its molecular weight. Thirty-seven different polypeptide chains with amolecular weight of 11,000 to 70,000 are shown. Gels were run in the presence of SDS. FromK. Weber and M. Osborn, J. Biol. Chem. 244, 4406 (1969). By permission of the copyrightowner, the American Society for Biochemistry and Molecular Biology, Inc.
FIGURE 6.7 A comparison of the sensitivities achieved with three different protein stains. Identical SDS-polyacrylamidegels were stained with A SYPRO Red protein gel stain; B Silver stain; C Coomassie brilliant blue dye. Courtesy ofMolecular Probes; www.probes.com, a part of Invitrogen Corporation; www.invitrogen.com.
is limited to a molecular weight range of 10,000 to 200,000. Gels of less than 2.5%acrylamide must be used for determining molecular weights above 200,000, butthese gels do not set well and are very fragile because of minimal cross-linking.A modification using gels of agarose-acrylamide mixtures allows the measure-ment of molecular weights above 200,000.

176 Chapter 6 • Characterization of Proteins and Nucleic Acids by Electrophoresis
Nucleic Acid Sequencing Gels
Sequence analysis of nucleic acids is based on the generation of sets of DNA orRNA fragments with common ends and the separation of these oligonucleotidefragments by polyacrylamide electrophoresis. Two methods have been developedfor sequencing nucleic acids: (1) the partial chemical degradation method ofMaxam and Gilbert, which uses four specific chemical reactions to modify basesand cleave phosphodiester bonds, and (2) the chain termination method devel-oped by Sanger, which requires a single-stranded DNA template and chain exten-sion processes, followed by chain termination caused by the presence ofdideoxynucleoside triphosphates. Both sequencing methods result in nested sets ofDNA or RNA fragments that have one common end and chains varying in length.The smallest possible size difference of nucleic acid fragments is one nucleotide.Separation of the nucleic acid fragments by polyacrylamide electrophoresis allowsone to “read” the sequence of nucleotides from the gel (see Chapter 9, p. 282).
Using Sequencing Gels
The experimental arrangement is the same as that previously described forPAGE; however, the gel is prepared with many sample wells to accommodate alarge number of samples. Sequence gels of 6, 8, 12, and 20% polyacrylamide areroutinely used. Gels of 20% may be used to sequence the first 50 to 100 nu-cleotides of a nucleic acid, and lower percentage gels allow sequencing out to250 nucleotides. Sequencing gels are large (up to 40 cm), and power suppliesmust provide more power than for conventional methods. Precast sequencinggels are now commercially available from Stratagene and other suppliers. Theyhave a gel concentration of 5.5%, have 32 sample wells, and will sequence up to500 nucleotides. Denaturants such as urea and formamide are required to
STUDY EXERCISE 6.2 SDS-PAGE
You have just completed an experiment using SDS-PAGE to study the subunit struc-ture of ferritin (iron storage protein). Ferritin is composed of two types of subunits,H and L, in about equal quantities. You have included in your electrophoresis severalstandard proteins of known molecular weight. Draw the final stained gel in the formof Figure 6.7.
Protein MW
Ferritin 500,000
Subunit H 22,000
Subunit L 19,000
-lactalbumina 14,200
Trypsinogen 24,000
Egg albumin 45,000
Bovine serum albumin 65,000

Chapter 6 • Characterization of Proteins and Nucleic Acids by Electrophoresis 177
1 The Human Genome Project was a federal, government-sponsored program to sequence all DNA inhuman chromosomes. The project was completed in 2001.
FIGURE 6.8 Anapparatus forhorizontal slab gelelectrophoresis ofnucleic acids.Courtesy of Hoefer,Inc. www.hoeferinc.com.
prevent renaturing of the nucleic acid fragments during electrophoresis. For de-tection, nucleic acid chains for sequencing must be end-labeled with or afluorescent tag. - and -labeled nucleic acids on gels are detected by autora-diography (see later). Nucleic acids end-labeled with fluorescent molecules aredetected by fluorimeter scanning of the gels. Many researchers working on thelarge and expensive Human Genome Project1 have generated huge amounts ofDNA sequence data. Much of this information is stored in computer data banksfor use by researchers around the world.
Agarose Gel Electrophoresis
The electrophoretic techniques discussed up to this point are useful for analyz-ing proteins and small fragments of nucleic acids up to 350,000 daltons (500 bp)in molecular size; however, the small pore sizes in the gel are not appropriate foranalysis of large nucleic acid fragments or intact DNA molecules. The standardmethod used to characterize RNA and DNA in the range 200 to 50,000 base pairs(50 kilobases) is electrophoresis with agarose as the support medium.
Agarose, a product extracted from seaweed, is a linear polymer of galac-topyranose derivatives. Gels are prepared by dissolving agarose in warm elec-trophoresis buffer. After cooling the gel mixture to 50̊ C, the agarose solution ispoured between glass plates as described for polyacrylamide. Gels with less than0.5% agarose are rather fragile and must be used in a horizontal arrangement(Figure 6.8). The sample to be separated is placed in a sample well made with acomb, and voltage is applied until separation is complete. Precast agarose gels ofall shapes, sizes, and percent composition are commercially available.
Nucleic acids can be visualized on the slab gel after separation by soaking in asolution of ethidium bromide, a dye that displays enhanced fluorescence whenintercalated between stacked nucleic acid bases. Ethidium bromide may be addeddirectly to the agarose solution before gel formation. This method allows monitor-ing of nucleic acids during electrophoresis. Irradiation of ethidium bromide–treatedgels by UV light results in orange-red bands where nucleic acids are present. Nucleicacids may also be stained with the new, fluorescent SYBR dyes, which are less toxic
35S32P
32P, 35S,

178 Chapter 6 • Characterization of Proteins and Nucleic Acids by Electrophoresis
than the mutagenic ethidium bromide. The newest, least toxic, and most sensitivestains for nucleic acids are GelRed and GelGreen from Biotium, Inc. (See Section C.)
The mobility of nucleic acids in agarose gels is influenced by the agaroseconcentration and the molecular size and molecular conformation of the nucleicacid. Agarose concentrations of 0.3 to 2.0% are most effective for nucleic acid sep-aration (Table 6.3). Adding ethidium bromide to the gel can retard DNA mobility.Like proteins, nucleic acids migrate at a rate that is inversely proportional to thelogarithm of their molecular weights; hence, molecular weights can be estimatedfrom electrophoresis results using standard nucleic acids or DNA fragments ofknown molecular weight. The DNA conformations most frequently encounteredare superhelical circular (form I), nicked circular (form II), and linear (form III).The small, compact, supercoiled form I molecules usually have the greatestmobility, followed by the rodlike, linear form III molecules. The extended, circu-lar form II molecules migrate more slowly. The relative electrophoretic mobilityof the three forms of DNA, however, depends on experimental conditions suchas agarose concentration and ionic strength.
The versatility of agarose gels is obvious when one reviews their manyapplications in nucleic acid analysis. The rapid advances in our understandingof nucleic acid structure and function in recent years are due primarily to thedevelopment of agarose gel electrophoresis as an analytical tool. Two of themany applications of agarose gel electrophoresis will be described here.
Analysis of DNA Fragments after Digestion by Restriction Endonucleases
Restriction endonucleases are enzymes that recognize a specific base sequence indouble-stranded DNA and catalyze cleavage (hydrolysis of phosphodiester bonds)in or near that specific region (see Chapter 10, Section B, p. 297). Many viral, bacterial,or animal DNA molecules are substrates for the enzymes. When each type of DNA istreated with a restriction endonuclease, a specific number of DNA fragments isproduced. The base sequence recognized by the enzyme occurs only a few times inany particular DNA molecule; therefore, the smaller the DNA molecule, the fewerspecific cleavage sites there are. Viral or phage DNA, for example, is cleaved intoabout 50 fragments depending on the enzyme used, whereas larger bacterial oranimal DNA may be cleaved into hundreds or thousands of fragments. SmallerDNA molecules, upon cleavage with a particular enzyme, will produce a limitedset of fragments. It is unlikely that this set of fragments will be the same for any two
TABLE 6.3 Effective Range of Separation of DNA by Agarose
Agarose (% w>v) Effective Range (kb)
0.3 5–50
0.5 2–25
0.7 0.8–10
1.2 0.4–5
1.5 0.2–3
2.0 0.1–2
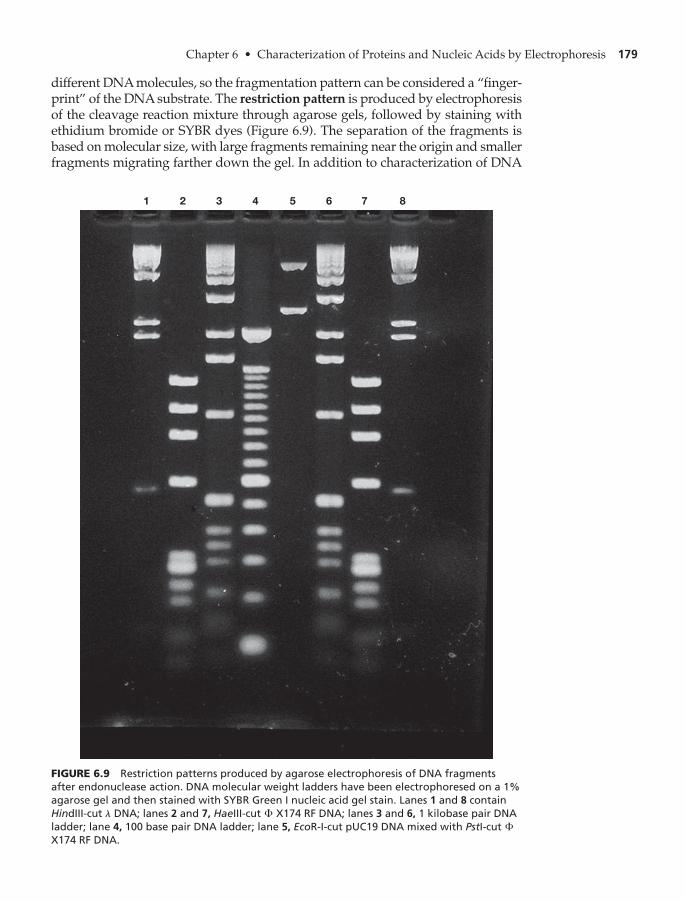
Chapter 6 • Characterization of Proteins and Nucleic Acids by Electrophoresis 179
1 2 3 4 5 6 7 8
FIGURE 6.9 Restriction patterns produced by agarose electrophoresis of DNA fragmentsafter endonuclease action. DNA molecular weight ladders have been electrophoresed on a 1%agarose gel and then stained with SYBR Green I nucleic acid gel stain. Lanes 1 and 8 containHindIII-cut DNA; lanes 2 and 7, HaeIII-cut X174 RF DNA; lanes 3 and 6, 1 kilobase pair DNAladder; lane 4, 100 base pair DNA ladder; lane 5, EcoR-I-cut pUC19 DNA mixed with PstI-cutX174 RF DNA.
££l
different DNA molecules, so the fragmentation pattern can be considered a “finger-print” of the DNA substrate. The restriction pattern is produced by electrophoresisof the cleavage reaction mixture through agarose gels, followed by staining withethidium bromide or SYBR dyes (Figure 6.9). The separation of the fragments isbased on molecular size, with large fragments remaining near the origin and smallerfragments migrating farther down the gel. In addition to characterization of DNA

180 Chapter 6 • Characterization of Proteins and Nucleic Acids by Electrophoresis
structure, endonuclease digestion coupled with agarose gel electrophoresis is avaluable tool for plasmid mapping and DNA recombination experiments.
Characterization of Superhelical Structure of DNA
The structure of plasmid, viral, and bacterial DNA is often closed circular withnegative superhelical turns. It is possible under various experimental conditions toinduce reversible changes in the conformation of DNA. The intercalating dyeethidium bromide causes an unwinding of supercoiled DNA that affects its elec-trophoretic mobility. Electrophoresis of DNA on agarose in the presence ofincreasing concentrations of ethidium bromide provides an unambiguous methodfor distinguishing between closed circular and other DNA conformations.
Closed circular, negatively supercoiled DNA (form I) usually has the great-est electrophoretic mobility of all DNA forms because supercoiled DNA mole-cules tend to be compact. If ethidium bromide is added to form I DNA, the dyeintercalates between the stacked DNA bases, causing unwinding of some ofthe negative supercoils. As the concentration of ethidium bromide is increased,more and more of the negative supercoils are removed until no more are presentin the DNA. The conformational change of the DNA supercoil can be monitoredby electrophoresis because the mobility decreases with each unwinding step.With increasing concentration of ethidium bromide, the negative supercoils areprogressively unwound and the electrophoretic mobility decreases to a mini-mum. This minimum represents the free dye concentration necessary to removeall negative supercoils. (The free dye concentration at this minimum has beenshown to be related to the superhelix density, which is a measure of the extent ofsupercoiling in a DNA molecule.) The circular DNA at this point is equivalent tothe “relaxed” form. If more ethidium bromide is added to the relaxed DNA, pos-itive superhelical turns are induced in the structure and the electrophoreticmobility increases. Forms II and III DNA, under the same conditions of increas-ing ethidium bromide concentration, show a gradual decrease in electrophoreticmobility throughout the entire concentration range.
Agarose gel electrophoresis is able to resolve topoisomers of native, cova-lently closed, circular DNA that differ only in their degree of supercoiling. Thistechnique has proved useful in the analysis and characterization of enzymes thatcatalyze changes in the conformation or topology of native DNA. These enzymes,called topoisomerases, have been isolated from bacterial and mammalian cells.They change DNA conformations by catalyzing nicking and closing of phospho-diester bonds in circular duplex DNA. Agarose gel electrophoresis is an idealmethod for identifying and assaying topoisomerases because the intermediateDNA molecules can be resolved on the basis of the extent of supercoiling.Topoisomerases may be assayed by incubating native DNA with an enzymepreparation, removing aliquots after various periods of time, and subjecting themto electrophoresis on an agarose gel with standard supercoiled and relaxed DNA.
Pulsed Field Gel Electrophoresis (PFGE)
Conventional agarose gel electrophoresis is limited in use for the separation ofnucleic acid fragments smaller than 50,000 bp (50 kb). In practice, that limit iscloser to 20,000 to 30,000 bp if high resolution is desired. Since chromosomal

Chapter 6 • Characterization of Proteins and Nucleic Acids by Electrophoresis 181
A B C D
Sample
well
DNA
fragments Field
direction
Gel
FIGURE 6.10 Pulsed field gel electrophoresis. Generalized PFGE separation of four DNA fragments of different sizesin one lane. A DNA molecules of various shapes and configurations move toward the positive field. B The new fieldorientation pulls the DNA in a different direction, realigning the molecules. C The field returns to the originalconfiguration. D The bands show the final position of a large collection of the molecules. Reprinted with permissionfrom the Journal of NIH Research 1, 115 (1999). Illustration by Terese Winslow.
DNA from most organisms contains thousands and even millions of base pairs,the DNA must be cleaved by restriction enzymes before analysis by standardelectrophoresis. In the early 1980s, Schwartz and Cantor at Columbia Universitydiscovered that large molecules of DNA (yeast chromosomes, 200–3000 kb)could be separated by pulsed field gel electrophoresis (PFGE). There is onemajor distinction between standard gel electrophoresis and PFGE. In PFGE, theelectric field is not constant as in the standard method, but is changed repeated-ly (pulsed) in direction and strength during the separation (Figure 6.10). Thephysical mechanism for separation of the large DNA molecules as they movethrough the gel under these conditions is not yet well understood. An earlyexplanation was that the electrical pulses abruptly perturbed the conformationof the DNA molecules. They would be oriented by the influence of the electricfield coming from one direction and then reoriented as a new electric field at adifferent angle to the first was turned on. According to this explanation, it takeslonger for larger molecules to reorient, so smaller fragments respond faster to thenew pulse and move faster. More recent experiments on dyed DNA moving ingels have shown that conformational changes of the DNA are not abrupt, butmore gradual, in response to the electrical pulse, and DNA molecules tend to“slither” through the gel matrix. In addition, it has been discovered that the gelbecomes more fluid during electrical pulsing.
Applications of PFGE
Even though our theoretical understanding of PFGE is lacking, practical applica-tions and experimental advances are expanding rapidly. The availability ofPFGE has sparked changes in DNA research. New methods for isolating intactDNA molecules have been developed. Because of mechanical breakage, the aver-age size of DNA isolated from cells in the presence of lysozyme, detergent, andEDTA is about 400–500 kb (see Chapter 9, Section B, p. 275). Intact chromosomalDNA can be isolated by embedding cells in an agarose matrix and disrupting thecells with detergents and enzymes. Slices or “plugs” of the agarose with intact

182 Chapter 6 • Characterization of Proteins and Nucleic Acids by Electrophoresis
DNA are then placed on the gel for PFGE analysis. Newly discovered restrictionendonucleases that cut DNA only rarely can now be used to subdividechromosome-sized DNA. Two important endonucleases with eight-base recog-nition sites are Not I and Sfi I.
There are also many instrumental advances that allow changes in theexperimental design of PFGE. Some of the variables that can be changed for eachexperiment are voltage, pulse length, number of electrodes, relative angle of elec-trodes, gel box design, temperature, agarose concentration, buffer pH, and timeof electrophoresis.
Like all laboratory techniques, PFGE has its disadvantages and problems.Long periods of electrophoresis are often required for good resolution, and mi-gration of fragments is extremely dependent on experimental conditions.Therefore, it is difficult to compare gels even when they are run under similarconditions. In spite of these shortcomings, PFGE will continue to advance as asignificant tool for the characterization of very large molecules. The technique,which was widely used in the Human Genome Project, will greatly increase ourunderstanding of chromosome structure and function.
Isoelectric Focusing of Proteins
Another important and effective use of electrophoresis for the analysis of pro-teins is isoelectric focusing (IEF), which examines electrophoretic mobility as afunction of pH. The net charge on a protein is pH dependent. Proteins belowtheir isoelectric pH ( or sometimes the pH at which they have zero netcharge) are positively charged and migrate in a medium of fixed pH toward thenegatively charged cathode. At a pH above its isoelectric point, a protein isdeprotonated and negatively charged and migrates toward the anode. If the pHof the electrophoretic medium is identical to the of a protein, the proteinhas a net charge of zero and does not migrate toward either electrode.Theoretically, it should be possible to separate protein molecules and to esti-mate the of a protein by investigating the electrophoretic mobility in aseries of separate experiments in which the pH of the medium is changed. ThepH at which there is no protein migration should coincide with the of theprotein. Because such a repetitive series of electrophoresis runs is a rathertedious and time-consuming way to determine the IEF has evolved as analternative method for performing a single electrophoresis run in a medium ofgradually changing pH (i.e., a pH gradient).
Separating Proteins by IEF
Figure 6.11 illustrates the construction and operation of an IEF pH gradient. Anacid, usually phosphoric, is placed at the cathode; a base, such as tri-ethanolamine, is placed at the anode. Between the electrodes is a medium inwhich the pH gradually increases from 2 to 10. The pH gradient can be formedbefore electrophoresis is conducted or formed during the course of electrophore-sis. The pH gradient can be either broad (pH 2–10) for separating several pro-teins of widely ranging values, or narrow (pH 7–8) for precise determinationof the of a single protein. P in Figure 6.11 represents different molecules ofpHI
pHI
pHI,
pHI
pHI
pHI
PI;pHI,

Chapter 6 • Characterization of Proteins and Nucleic Acids by Electrophoresis 183
Region 1
pH scale
Region 3
pHI
Region 2
H +
Gel
2 3 4 5 6 7 8 9 10
P P OH –
FIGURE 6.11Illustration ofisoelectric focusing.See text for details.
the same protein in two different regions of the pH gradient. Assuming that thepH in region 1 is less than the of the protein and the pH in region 2 is greaterthan the of the protein, molecules of P in region 1 will be positively chargedand will migrate in an applied electric field toward the cathode. As P migrates, itwill encounter an increasing pH, which will influence its net charge. As itmigrates up the pH gradient, P will become increasingly deprotonated and itsnet charge will decrease toward zero. When P reaches a region where its netcharge is zero (region 3), it will stop migrating. The pH in this region of the elec-trophoretic medium will coincide with the of the protein and can be meas-ured with a surface microelectrode, or the position of the protein can becompared to that of a calibration set of proteins of known values. P mole-cules in region 2 will be negatively charged and will migrate toward the anode.In this case, the net charge on P molecules will gradually decrease to zero as Pmoves down the pH gradient, and P molecules originally in region 2 willapproach region 3 and come to rest. The P molecules move in opposite direc-tions, but the final outcome of IEF is that P molecules located anywhere in thegradient will migrate toward the region corresponding to their isoelectric pointand will eventually come to rest in a sharp band; that is, they will “focus” at apoint corresponding to their
Since different protein molecules in mixtures have different values, it ispossible to use IEF to separate proteins. In addition, the of each protein inthe mixture can be determined by measuring the pH of the region where the pro-tein is focused.
Practical Aspects of IEF
The pH gradient is prepared in a horizontal glass tube or slab. Special precau-tions must be taken so that the pH gradient remains stable and is not disruptedby diffusion or convective mixing during the electrophoresis experiment. Themost common stabilizing technique is to form the gradient in a polyacrylamide,agarose, or dextran gel. The pH gradient is formed in the gel by electrophoresisof synthetic polyelectrolytes, called ampholytes, which migrate to the region of
pHI
pHI
pHI.
pHI
pHI
pHI
pHI

184 Chapter 6 • Characterization of Proteins and Nucleic Acids by Electrophoresis
their values just as proteins do and establish a pH gradient that is stablefor the duration of the IEF run. Ampholytes are low-molecular-weight polymersthat have a wide range of isoelectric points because of their numerous amino andcarboxyl or sulfonic acid groups. The polymer mixtures are available in specificpH ranges (pH 5–7, 6–8, 3.5–10, etc.). It is critical to select the appropriate pHrange for the ampholyte so that the proteins to be studied have values inthat range. The best resolution is, of course, achieved with an ampholyte mixtureover a small pH range (about two units) encompassing the of the sampleproteins. If the values for the proteins under study are unknown, anampholyte of wide pH range (pH 3–10) should be used first and then a narrowerpH range selected for use.
The gel medium is prepared as previously described except that the appro-priate ampholyte is mixed prior to polymerization. The gel mixture is pouredinto the desired form (column tubes, horizontal slabs, etc.) and allowed to set.Immediately after casting of the gel, the pH is constant throughout the medium,but application of voltage will induce migration of ampholyte molecules to formthe pH gradient. The standard gel for proteins with molecular sizes up to 100,000daltons is 7.5% polyacrylamide; however, if larger proteins are of interest, gelswith larger pore sizes must be prepared. Such gels can be prepared with a lowerconcentration of acrylamide (about 2%) and 0.5 to 1% agarose to add strength.Precast gels for isoelectric focusing are also commercially available.
The protein sample can be loaded on the gel in either of two ways. A con-centrated, salt-free sample can be layered on top of the gel as previouslydescribed for ordinary gel electrophoresis. Alternatively, the protein can beadded directly to the gel preparation, resulting in an even distribution of proteinthroughout the medium. The protein molecules move more slowly than the low-molecular-weight ampholyte molecules, so the pH gradient is established beforesignificant migration of the proteins occurs. Very small protein samples can beseparated by IEF. For analytical purposes, 10 to 50 is a typical sample size.Larger sample sizes (up to 20 mg) can be used for preparative purposes.
Two-Dimensional Electrophoresis (2-DE) of Proteins
The separation of proteins by IEF is based on charge, whereas SDS-PAGE sepa-rates molecules based on molecular size. A combination of the two methodsleads to enhanced resolution of complex protein mixtures. Such an experimentwas first reported by O’Farrell and the combined method has since become aroutine and powerful separatory technique. Figure 6.12 shows the results ofO’Farrell’s analysis of total Escherichia coli protein. The sample was first separat-ed in one dimension by IEF. The sample gel was then transferred to an SDS-PAGE slab and electrophoresis was continued in the second dimension. At least1000 discrete protein spots are visible.
The technique of 2-DE is a powerful tool for researchers in the new field ofproteomics, whose goal is the systematic study of the structure, interactions, andbiological function of the proteins expressed by the genome (proteome) of anorganism. We see that the 1000 or so proteins in the E. coli cell are well resolvedby 2-DE (Figure 6.12), but what about the numerous proteins expressed in higherorganisms like humans? It is currently estimated from data generated by the
mg
pHI
pHI
pHI
pHI

Chapter 6 • Characterization of Proteins and Nucleic Acids by Electrophoresis 185
IEF SDS
FIGURE 6.12Two-dimensionalelectrophoresis oftotal E. coliproteins. Photocourtesy of Dr. P. O’Farrell.
Human Genome Project that humans have about 20,000–25,000 genes. This num-ber does not relate directly to the number of proteins because many of the genesare alternately spliced and because of numerous post-translational modificationprocesses. It is now estimated that there may be as many as one million differentprotein products in the human. This is a daunting number even for the high res-olution displayed in 2-DE. It is not realistic to imagine that 2-DE techniques willever be able to analyze this many proteins, not only because of the complexity,but also because the technique is tedious and time-consuming, and the gels aredifficult to analyze. However, when 2-DE data are combined and analyzed bymodern computer software, valuable on-line databases on protein expressionmay be constructed. In addition, when proteins separated by 2-DE are furtheranalyzed by mass spectrometry (see Chapter 7, Section D, p. 230), partial proteinsequence data can be obtained.
The 2-DE technique is also of value in developmental biochemistry, wherethe increase or decrease in intensity of a spot representing a specific protein maybe monitored as a function of cell growth.
Capillary Electrophoresis (CE)
Capillary electrophoresis is a new technique that combines the high resolvingpower of electrophoresis with the speed, versatility, and automation of high-performance liquid chromatography (HPLC). It offers the ability to analyze verysmall samples (5–10 nL) utilizing up to 1 million theoretical plates to achievehigh resolution and sensitivity to the attomole level ( mole). It will becomea widely used technique in the analysis of amino acids, peptides, proteins, nucleicacids, and pharmaceuticals.
CE in Practice
A general experimental design is diagrammed in Figure 6.13. The equipmentconsists of a power supply, two buffer reservoirs, a buffer-filled capillary tube,and an on-line detector. Platinum electrodes connected to the power supply are
10-18

186 Chapter 6 • Characterization of Proteins and Nucleic Acids by Electrophoresis
immersed in each buffer reservoir. A high voltage is applied along the capillary,and a small plug of sample solution is injected into one end of the capillary.Components in the solution migrate along the length of the capillary under theinfluence of the electric field. Molecules are detected as they exit from the oppo-site end of the capillary. The detection method used depends on the type of mol-ecules separated, but the most common are UV-VIS fixed-wavelength detectorsand diode-array detectors (see Chapter 7, pp. 210–211). The capillaries used areflexible, fused, silica tubes of i.d. and 25–100 cm length that may ormay not be filled with chromatographic matrix.
A major advantage of capillary electrophoresis is that many analyticalexperimental designs are possible, just as in the case of HPLC. In HPLC, a widerange of molecules can be separated by changing the column support (seeChapter 5, Section F, p. 140). In CE, the capillary tube may be coated or filled witha variety of materials. For separation of small, charged molecules, bare silica orpolyimide-coated capillaries are often used. If separation by molecular sievingis desired, the tube is filled with polyacrylamide or SDS-polyacrylamide. If thecapillary is filled with electrolyte and an ampholyte pH gradient, isoelectricfocusing experiments on proteins may be done. We can expect to see numerousapplications of CE in all aspects of biochemistry and molecular biology. Newapplications will include DNA sequencing, analysis of single cells, andseparations of neutral molecules. (For example, see nucleotide separation inFigure 6.14.)
Immunoelectrophoresis (IE)
In immunoelectrophoresis, two sequential procedures are applied to the analysisof complex protein mixtures: (1) separation of the protein mixture by agarose gelelectrophoresis, followed by (2) interaction with specific antibodies to examinethe antigenic properties of the separated proteins.
5-100 mm
High voltage
supply
Outlet
vial
Inlet
vialDetector
Column
Data
acquisition
and analysis
Thermostatted
chamber
FIGURE 6.13Experimental setupfor capillaryelectrophoresis.Courtesy of Bio-RadLaboratories, LifeScience ResearchGroup, Hercules, CA.

Chapter 6 • Characterization of Proteins and Nucleic Acids by Electrophoresis 187
0.0200
0.0158
0.0116
0.0074
0.0032
8 mer10 mer12 mer14 mer16 mer18 mer20 mer22 mer24 mer26 mer28 mer30 mer32 mer
GACTGACTGACTGACTGTGACTGACTGACTGACTGACTGACTGTGACTGACTGACTGACTGACTGACTGACTGACTGTGACTGACTGACTGACTGACTGACTGACTGACTGACTGACTGTGACTGACTGACTGACTGACTGACTGACTGACTGACTGACTGACTGACTGTGACTGACTGACTGACTGACTGACTGACTGACTGACTGACTGACTGACTGACTGACTGTGACTGACTGACTGACTGACTGACTGACTGACT
141210
Minutes
Ab
sorb
ance a
t 260 n
m
8
8m
er
10m
er 12m
er
14m
er
16m
er
18m
er
20m
er
22m
er 24m
er
26m
er
28m
er
30m
er
32m
er
64
−0.0010
FIGURE 6.14Separation of a series ofoligonucleotidesusing capillaryelectrophoresis.The compounds areseparated on acapillary coated onthe inside withpolyacryloylamino-ethoxyethanol. Thestructures of thestandard oligonu-cleotides are shownin the lowerdiagram. Adaptedfrom Bio-RadLaboratories, Inc.,www.bio-rad.com.
The technique of IE was first reported by Grabar and Williams in 1953 forthe separation and immunoanalysis of serum proteins, but it can be applied tothe analysis of any purified protein or complex mixture of proteins. In practice(Figure 6.15), a protein mixture is separated by standard electrophoresis in anagarose gel prepared on a small glass plate. This is followed by exposing the sep-arated proteins to a specific antibody preparation. The antibody is added to atrough cut into the gel, as shown in Figure 6.15, and is allowed to diffuse throughthe gel toward the separated proteins. If the antibody has a specific affinity forone of the proteins, a visible precipitin arc forms. This is an insoluble complexformed at the boundary of antibody and antigen protein. The technique is mostuseful for the analysis of protein purity, composition, and antigenic properties.The basic IE technique described here allows only qualitative examination ofantigenic proteins. If quantitative results in the form of protein antigen concen-tration are required, the advanced modifications rocket immunoelectrophoresisand two-dimensional (crossed) immunoelectrophoresis may be used.

188 Chapter 6 • Characterization of Proteins and Nucleic Acids by Electrophoresis
Antigen
Antigen
Trough
Antiserum
Precipitin arcs
B
A
D
CFIGURE 6.15Immunoelec-trophoresis.A Antigen is placedin sample wells. B Electrophoresis.C Antiserum con-taining antibody isplaced in trough. D Insolubleantigen–antibodycomplexes formprecipitin arcs.
C. PRACTICAL ASPECTS OF ELECTROPHORESIS
Instrumentation
The basic components required for electrophoresis are a power supply and anelectrophoresis chamber (gel box). A power supply that provides a constant cur-rent is suitable for most conventional electrophoresis experiments. Power suppliesthat generate both constant voltage (up to 4 kV) and constant current (up to 200 mA)are commercially available. In order to implement the many modifications of elec-trophoresis, such versatile power supplies are essential in a research laboratory.If isoelectric focusing experiments are planned, a power supply that furnishes aconstant voltage is necessary. DNA sequencing experiments require power sup-plies capable of generating 2–4 kV. Because of the high power requirements ofthese experiments, the glass plates sandwiching the gel must be covered with con-ductive aluminum plates to dissipate heat and prevent gel melting and glass platebreakage. CE also requires the use of high voltage, which generates heat as well.However, the heat is quickly dissipated through the thin walls of the capillary tub-ing. Pulsed field electrophoresis experiments have special requirements, includ-ing a high-voltage power supply, electrical switching devices for control of thefield, equipment for temperature control, and a specially designed gel box with anarray of electrodes. All types of electrophoresis chambers for both horizontal andvertical placements of gels are available from commercial suppliers.

Chapter 6 • Characterization of Proteins and Nucleic Acids by Electrophoresis 189
Buffers appropriate for electrophoresis gels include Tris-glycine, Tris-acetate, Tris-phosphate, and Tris-borate at concentrations of about 0.05 M(Chapter 3, Section A, p. 61).
Several advances in gel electrophoresis have recently been made that havestreamlined and improved many of the established techniques. Some of thoseimprovements will be outlined here.
1. Precast Gels As previously mentioned, precast gels of polyacrylamideand agarose are now commercially available. A wide variety of gel sizes,types, configurations, and compositions may be purchased. Costs are rea-sonable, beginning at about $15 for an single percentage poly-acrylamide gel. Precast gels not only offer convenience, but also increasesafety, save time, and provide more reproducible electrophoretic runs.Precast gels with dye/stain already applied are also available (prestaining).
2. Bufferless Precast Gels One of the major inconveniences of running gelsis the necessity of having liquid buffer reservoirs to saturate gels duringelectrophoresis. There is always the chance that reservoirs will leak or thatsolutions perhaps containing acrylamide or ethidium bromide will bespilled. Precast gels (agarose and acrylamide) are now available in dry,plastic cassettes. They do not require liquid buffers because the gels containion-exchange matrices, which sustain the electric field.
3. Reusable Precast Gels Precast agarose gels are now available that may berecycled. After a run, the DNA samples on the gel are removed by reversingthe direction of the electric field. The gels are then reloaded with newsamples and reused.
Staining and Detecting Electrophoresis Bands
Tracking Dyes
During the electrophoretic process, it is important to know when to stop apply-ing the voltage or current. If the process is run for too long, the desired compo-nents may pass entirely through the medium and into the buffer; if too short aperiod is used, the components may not be completely resolved. It is commonpractice to add a “tracking dye,” usually bromphenol blue and/or xylene cyanol,
8 * 10 cm
Reagents
High-quality, electrophoresis grade chemicals must be used, since impuritiesmay influence both the gel polymerization process and electrophoretic mobility.The reagents used for gel formation should be stored in a refrigerator.
Caution
Acrylamide, -tetramethylethylenediamine, -methylene-bis-acrylamide, andammonium persulfate are toxic and must be used with care. Acrylamide is a neurotoxin,a carcinogenic agent, and a potent skin irritant, so gloves and a mask must be worn whilehandling it in the unpolymerized form.
N,N¿N,N,N¿N¿

190 Chapter 6 • Characterization of Proteins and Nucleic Acids by Electrophoresis
to the sample mixture. These dyes, which are small and anionic, move rapidlythrough the gel ahead of most proteins or nucleic acids. After electrophoresis,bands have a tendency to widen by diffusion. Because this broadening maydecrease resolution, gels should be analyzed as soon as possible after the powersupply has been turned off. In the case of proteins, gels can be treated with anagent that “fixes” the proteins in their final positions, a process that is often com-bined with staining.
Staining Proteins with Coomassie Blue
Reagent dyes that are suitable for visualization of biomolecules after elec-trophoresis were mentioned earlier. The most commonly used general stainfor proteins is Coomassie Brilliant Blue. This dye can be used as a 0.25%aqueous solution. It is followed by destaining (removing excess backgrounddye) by repeated washing of the gel with 7% acetic acid. Alternatively, gelsmay be stained by soaking in 0.25% dye in methanol, and acetic acid(5:5:1), followed by repeated washings with the same solvent. The most time-consuming procedure in the Coomassie Blue visualization process is destain-ing, which often requires days of washing. Rapid destaining of gels may bebrought about electrophoretically. The gel, after soaking in the stain, is sub-jected to electrophoresis again, using a buffer of higher concentration toremove excess stain.
The search for more rapid and sensitive methods of protein detection afterelectrophoresis has led to the development of fluorescent staining techniques.Two commonly used fluorescent reagents are fluorescamine and anilinonaph-thalene sulfonate. New dyes based on silver salts (silver diamine orsilver–tungstosilicic acid complex) have been developed for protein staining.They are 10 to 100 times more sensitive than Coomassie Blue (Figure 6.7).
A visualization procedure that is specific for a certain biomolecule, such asan enzyme, is often needed. If the enzyme remains in an active form while in thegel, any substrate that produces a colored product could be used to locate theenzyme on the gel. Although it is less desirable for detection, the electrophoresissupport medium may be cut into small segments and each part extracted withbuffer and analyzed for the presence of the desired component.
Fluorescent SYPRO and CF Dyes
The new fluorescent SYPRO dyes, produced by Molecular Probes, Inc.(www.probes.com), promise to challenge the use of silver staining for proteingel staining. SYPRO Orange stain, SYPRO Ruby stain, and SYPRO Red stainmay be used for 1-D and 2-D gels, and their sensitivities are equal to silverstaining. However, the SYPRO dyes are much easier and faster to use (they re-quire no fixing or destaining) than both Coomassie Blue or silver. Gels treatedwith the SYPRO dyes may be viewed using a standard UV light or with a laserscanner.
The new CF dyes produced by Biotium, Inc., have the advantage ofexcellent brightness, sensitivity, and photostability compared to the SYPROdyes. They are designed primarily for labeling antibodies (see www.biotium.com).
H2O,

Chapter 6 • Characterization of Proteins and Nucleic Acids by Electrophoresis 191
Viewing Nucleic Acids on Gels
Nucleic acids may be visualized in agarose and polyacrylamide gels using thefluorescent dye ethidium bromide. The gel is soaked in a solution of the dye andwashed to remove excess dye. Illumination of the rinsed slab with UV lightreveals red-orange stains where nucleic acids are located.
Although ethidium bromide stains both single- and double-strandednucleic acids, the fluorescence is much greater for double-stranded molecules.The electrophoresis may be performed with the dye incorporated in the gel andbuffer, although this does influence mobility. This has the advantage that the gelcan be illuminated with UV light during electrophoresis to view the extent ofseparation. Precast gels are made in plastic cassettes that are UV transparent. Themobility of double-stranded DNA may be reduced 10 to 15% in the presence ofethidium bromide. Destaining of the gel is not necessary because ethidiumbromide–DNA complexes have a much greater fluorescent yield than freeethidium bromide, so relatively small amounts of DNA can be detected in thepresence of free ethidium bromide. The detection limit for DNA is 10 ng.
Caution
Ethidium bromide must be used with great care, as it is a potent mutagen. Gloves shouldbe worn at all times while using dye solutions or handling gels; however, even this doesnot ensure complete safety, as ethidium bromide has been shown to leak through someplastic gloves.
The new, fluorescent SYBR dyes, produced by Molecular Probes, Inc., offerseveral advantages over ethidium bromide. They are far less toxic than the muta-genic ethidium bromide, and some are as much as five times more sensitive. Themost widely used SYBR dye for staining DNA gels is SYBR Green I, which is acyanine dye and has a sensitivity similar to EtBr. The detailed mechanism forSYBR dye binding to DNA is unknown, but it is most likely not base intercala-tion as is the case for ethidium bromide. Other new dyes now being testedinclude Blueview, Carolina Blu, and 6-diamidino-2-phenylindole dihydrochlo-ride hydrate (DAPI). Currently, the safest and most sensitive dyes now availablefor nucleic acids are the fluorescent GelRed and GelGreen, produced by Biotium.These dyes may be used for either prestaining or poststaining.
Because single-stranded nucleic acids do not stain deeply with ethidiumbromide and some fluorescent dyes, alternate techniques must be used for detec-tion, especially when only small amounts of biological material are available foranalysis. One of the most sensitive techniques is to use radio-labeled molecules.For nucleic acids, this usually means labeling the or end with a strong emitter. Bands of labeled nucleic acids on an electrophoresis gel can easily belocated by autoradiography. For this technique, the electrophoresed slab gel istransferred to heavy chromatography paper. After covering the gel and paperwith plastic wrap, they are placed on X-ray film and wrapped in a cassette toavoid external light exposure. This procedure must be done in a darkroom.The gel-film combination is stored at for exposure. The low temperaturemaintains the gel in a rigid form and prevents diffusion of gel bands.
-70°C
b32P,3¿5¿
4¿

192 Chapter 6 • Characterization of Proteins and Nucleic Acids by Electrophoresis
The exposure time depends on the amount of radioactivity, but can range from afew minutes to several days. Figure 6.16 shows the autoradiogram of a typicalDNA sequencing gel. The autoradiogram also provides a permanent record ofthe gel for storage and future analysis. The actual gel is very fragile and difficultto store. Also, because of the short half-life of (14 days), an autoradiogram ofthe gel cannot be obtained in the distant future. Proteins labeled with or can be dealt with in a manner similar to nucleic acids. If an autoradiogram of agel can be prepared, a permanent record of the experimental data is available.
Because of concerns about the safety of radioisotope use, researchers aredeveloping fluorescent and chemiluminescent methods for detection of smallamounts of biomolecules on gels. One attractive approach is to label biomole-cules before analysis with the coenzyme biotin. Biotin forms a strong complexwith enzyme-linked streptavidin. Some dynamic property of the enzyme is thenmeasured to locate the biotin-labeled biomolecule on the gel. These new meth-ods approach the sensitivity of methods involving radio-labeled molecules, andrapid advances are being made.
Protein and Nucleic Acid Blotting
Only a minute amount of protein or nucleic acid is present in bands on electro-pherograms. In spite of this, there is often a need to extract the desired biomole-cule from the gel for further investigation. This sometimes involves the tediousand cumbersome process of crushing slices of the gel in a buffer to release thetrapped proteins or nucleic acids. Techniques are now available for removingnucleic acids and proteins from gels and characterizing them using probes todetect certain structural features or functions. After electrophoresis, the desiredbiomolecules are transferred or “blotted” out of the gel onto a nitrocellulose filteror nylon membrane. The desired biomolecule is now accessible on the filter for
125I32P
32P
FIGURE 6.16Autoradiogram of aDNA sequencinggel. From Zyskindand Bernstein, DNALaboratory Manual(1999), AcademicPress (San Diego,CA).

Chapter 6 • Characterization of Proteins and Nucleic Acids by Electrophoresis 193
DNA molecule
Cleavage with one or more restriction enzymes
Restriction fragments
Agarose gel electrophoresis
Gel with fragments
fractionated by size
Flow buffer used
to transfer DNA
Transfer to nitrocellulose filter
Gel
Nitrocellulose filter
Nitrocellulose filter with DNA
fragments positioned identically
to those in the gel
Hybridization with radioactively labeled DNA probe
or use of chemiluminescent reagents
Radioautograph or dyed
membrane showing hybrid DNA
FIGURE 6.17Diagram of aSouthern blottingexperiment.
further analysis. The first blotting technique was reported by E. Southern in1975. Using labeled complementary DNA probes, he searched for certainnucleotide sequences among DNA molecules blotted from the gel. This tech-nique of detecting DNA-DNA hybridization is called Southern blotting. Thegeneral blotting technique has now been extended to the transfer and detectionof specific RNA with labeled complementary DNA probes (Northern blotting)and the transfer and detection of proteins that react with specific antibodies(Western blotting). In practice, the electropherogram is alkali treated, neutralized,and placed in contact with the filter or nylon membrane. A buffer is used to facil-itate the transfer. Figure 6.17 shows the setup for a blotting experiment. The location

194 Chapter 6 • Characterization of Proteins and Nucleic Acids by Electrophoresis
of the desired nucleic acid or protein is then detected by incubation of the mem-brane with a radio-labeled probe and autoradiography, by use of a biotinylatedprobe, or by linkage to an enzyme-catalyzed reaction that generates a color.
Blotting techniques have many applications, including mapping the genesresponsible for inherited diseases by using restriction fragment length polymor-phisms (RFLPs), screening collections of cloned DNA fragments (DNA libraries),“DNA fingerprinting” for analysis of biological material remaining at the sceneof a crime, and identification of specific proteins. More details on blotting arefound in Chapter 10, Section C, p. 304.
The Western Blot
Western blotting has become an important, modern technique for analysis andcharacterization of proteins. The procedure consists of the electrophoretic trans-fer (blotting) of proteins from a polyacrylamide gel to a synthetic membrane. Thetransferred blots are then probed using various methods involving antibodiesthat bind to specific proteins.
PAGE is indeed a very effective analytical tool to achieve fractionation ofprotein mixtures, to analyze purity, and to estimate molecular weight, but it pro-vides no experimental data to prove the identity of any of the protein bands.Stained spots simply indicate the presence and location of each and every pro-tein on the gel. It is often possible to identify proteins by treating gel bandsdirectly with chemical reagents that react with a specific protein; for example,enzymes on the gel could be treated with substrates that form a colored product.However, proteins are deeply embedded in the polyacrylamide gel matrix andare not readily accessible to most analytical reagents. This hinders specific analy-sis of the protein bands in order to identify individual proteins. Proteins separatedby PAGE may be transferred (or blotted) from the gel to a thin support matrix,usually a nitrocellulose membrane, which strongly binds and immobilizesproteins. The protein blots on the membrane surface are more accessible tochemical or biochemical reagents for further analysis. When the transfer processis coupled with protein identification using highly specific and sensitiveimmunological detection techniques, the procedure is called Western blotting.Western blotting or immunoblotting assays of proteins have many advantages,including the need for only small reagent volumes, short processing times, rela-tively inexpensive equipment, and ease of performance (see immunoadsorption,Chapter 5, Section G, p. 152).
The Western Blotting Procedure
To begin the Western blot, a protein mixture for analysis and further characteri-zation is fractionated by PAGE. Since denaturing SDS-PAGE results in better res-olution than native PAGE, the SDS version is usually preferred; however, thedetection method used at the conclusion of the blotting experiment must be ableto recognize denatured protein subunits. The next step involves selection of themembrane matrix for transfer. Three types of support matrices are available foruse: nitrocellulose, nylon, and polyvinyldifluoride (PVDF). Nitrocellulose mem-branes, currently the most widely used supports, have a satisfactory general

Chapter 6 • Characterization of Proteins and Nucleic Acids by Electrophoresis 195
protein-binding capacity but they display weak binding of proteinsof molecular weights smaller than 14,000 and they are subject to tearing. Bindingof proteins to nitrocellulose membranes is noncovalent, most likely involvinghydrophobic interactions. Nylon membranes are stronger than nitrocellulose,and some have a binding capacity up to However, since they arecationic, they only weakly bind basic proteins. During detection procedures,nylon membranes often display high background colors, so it is difficult to visu-alize proteins of interest. PVDF membranes bind proteins strongly and, because of their hydrophobic nature, give a light background color afteranalysis. For overall general use in protein transfer and immunoblotting, nitro-cellulose membranes are the most common choice.
The actual blotting process may be accomplished by one of two methods:passive (or capillary) transfer and electroblotting. In passive transfer, the mem-brane is placed in direct contact with the polyacrylamide gel and organized in asandwich-like arrangement consisting of (from bottom to top) filter papersoaked with transfer buffer, gel, membrane, and more filter paper (see Figure6.17). The sandwich is compressed by a heavy weight. Buffer passes by capillaryaction from the bottom filter paper through the gel, transferring the protein mol-ecules to the membrane, where the macromolecules are immobilized. Passivetransfer is very time-consuming, sometimes requiring 1–2 days for complete pro-tein transfer. Faster and more efficient transfer is afforded by the use of an elec-troblotter. Here a sandwich of filter paper, gel, membrane, and more filter paperis prepared in a cassette, which is placed between platinum electrodes. An elec-tric current is passed through the gel, causing the proteins to electrophorese outof the gel and onto the membrane. The electroblotting process usually is com-plete in 1–4 hours.
Detection of Blotted Proteins
The Western blot procedure is concluded by probing the blotted protein bands anddetecting a specific protein or group of proteins among the blots. In other words,visualization of specific protein blots is now possible. The most specific identifica-tion techniques are based on immunology (antigen–antibody interactions; seeChapter 5, Section G, p. 152). A general procedure for immunoblotting is outlinedin Figure 6.18. Before the protein detection process can begin, it is necessary to blockprotein-binding sites on the membrane that are not occupied by blotted proteins.This is essential because antibodies used to detect blotted proteins are also proteinsand will bind to the membrane and interfere with detection procedures. Protein-binding sites still remaining on blotted membranes may be blocked by treatmentwith solutions of casein (major protein in milk), gelatin, or bovine serum albumin.
The blotted membrane, with all protein-binding sites occupied, can now betreated with analytical reagents for detection of specific proteins. Typically, theblotted membrane is incubated with an antibody specific for the protein of inter-est. This is called the primary antibody, which is a protein of the immunoglobu-lin G (IgG) class (see Figure 6.18). The primary antibody binds to the desiredprotein, forming an antigen–antibody complex. The interaction between the pro-tein and its antibody does not usually result in a visible signal. The blot is thenincubated with a secondary antibody, which is directed against the general class
(125 mg>cm2)
450 mg>cm2.
(100 mg>cm2),

196 Chapter 6 • Characterization of Proteins and Nucleic Acids by Electrophoresis
1
2
3
4
S
P
FIGURE 6.18 Specific detection of nitrocellulose membrane-bound proteins using aconjugated enzyme. 1 Proteins are transferred from electrophoresis gel to nitrocellulosemembrane. Blocker proteins bind to unoccupied sites on the membrane. 2 The membrane isincubated with a primary antibody directed against the protein of interest. 3 A secondaryantibody is directed against the primary antibody. 4 The secondary antibody is conjugatedwith an enzyme to provide a detection mechanism. Substrate solution is added to the blot.The conjugated enzyme (HRP or AP) catalyzes the conversion of substrate (S) to product (P) toform a colored precipitate at the site of the protein–antibody complex.
of primary antibody. For example, if the primary antibody was produced in rab-bit serum, then the second antibody would be anti-rabbit IgG, usually from agoat or horse. The second antibody is labeled (conjugated) so that the interactionof the second antibody with the primary antibody produces some visual signal.For most detection procedures, the secondary antibody may be tagged with anenzyme, usually horseradish peroxidase (HRP) or alkaline phosphatase (AP).When the treated blot is incubated in a substrate solution, the conjugated en-zyme catalyzes the conversion of the substrate into a visible product that precip-itates at the blot site. The presence of a colored band indicates the position of theprotein of interest (see Figure 6.19). This general procedure is also the basis forthe widely used enzyme-linked immunosorptive assay (ELISA). The reactionscatalyzed by conjugated enzymes are shown below:
>> (Eq. 6.5)
>> (Eq. 6.6)
A modification of these coloring systems has recently been developed thatleads to more sensitive detection. Chemiluminescent substrates have been
AP
5-bromo-4-chloro-3-indole + Pi + nitroblue tetrazolium
reduced
5-bromo-4-chloro-3-indolylphosphate + nitroblue tetrazoliumoxidized
HRP
4-chloro-1-naphtholreduced
+ H2O
24-chloro-1-naphthol
oxidized + H
2O + O
2
1
2

Chapter 6 • Characterization of Proteins and Nucleic Acids by Electrophoresis 197
FIGURE 6.19 Results from a Western blot. A SDS-PAGE gels, 12%, were run and transferred tonitrocellulose. Lane 1, MW standards; lane 2, biotinylated standards; lane 3, human transferrin;lane 4, E. coli lysate; lane 5, total human serum; lane 6, biotinylated standards. Gel A was stainedwith a protein dye. Blot B was assayed using rabbit anti-human transferrin as the first antibody.The second antibody solution contained anti-rabbit HRP conjugates. Only the transferrin bandsand the prestained biotinylated standards were detected by the antibodies and the avidin-HRPtreatment.
designed that are converted by the enzymes to products that generate a light sig-nal that can be captured on photographic film. This increases the level of sensi-tivity about 1000-fold over standard color detection methods.
Even though primary and secondary antibodies are widely used in Westernblotting detection systems, they do have some disadvantages. For proteins to bedetected, specific antibodies must be available. It is often very time-consumingand expensive for a research laboratory to generate the proper antibodies if theyare not available commercially. Even if antibodies are commercially available,they are very expensive.
The Western blot has gained widespread use in biochemical and clinicalinvestigations. It is one of the best methods for identifying the presence of specif-ic proteins in complex biological mixtures. The Western blot procedure has beenmodified to develop a diagnostic assay that detects the presence in serum ofantibodies to the AIDS virus. The presence of AIDS antibodies in a patient is anindication of viral infection.
Analysis of Electrophoresis Results
By separating biochemicals on the basis of charge, size, and conformation, elec-trophoresis can provide valuable information, such as purity, identity, andmolecular weight. Purity is indicated by the number of stained bands in theelectropherogram. One band usually means that only one detectable compo-nent is present; that is, the sample is homogeneous or “electrophoreticallypure.” Two or more bands usually indicate that the sample contains two ormore components, contaminants, or impurities and is therefore heterogeneousor impure. There are, of course, exceptions. Other proteins or nucleic acids maybe present in what appears to be a homogeneous sample, but they may bebelow the limit of detection of the staining method. Occasionally, a homoge-neous sample may result in two or more bands because of degradation duringthe electrophoresis process. Information on purity may be obtained by all of theelectrophoresis methods discussed.

198 Chapter 6 • Characterization of Proteins and Nucleic Acids by Electrophoresis
The identity of unknown biomolecules can be confirmed by electrophoresisof the unknown along with possible known standards on the same gel. This issimilar to the identification of unknowns by HPLC as discussed in Chapter 5,Section F, p. 140.
As previously discussed in this chapter, the molecular size of protein ornucleic acid samples may be determined by electrophoresis. This requires thepreparation of standard curves of log molecular weight versus (mobility)using standard proteins or nucleic acids.
m
Study Problems
1. What physical characteristics of a biomolecule influence its rate of movement in anelectrophoresis matrix?
2. Each of the proteins listed below is treated with sodium dodecyl sulfate and separatedby electrophoresis on a polyacrylamide slab gel. Draw pictures of the final results.(a) Myoglobin(b) Hemoglobin (two subunits, molecular weight two subunits, molec-
ular weight )3. Draw a slab gel to show the results of nondenaturing electrophoresis of the following
mixture of proteins. The molecular weight is given for each.Lysozyme (13,930) Egg white albumin (45,000)Chymotrypsin (21,600) Serum albumin (65,400)
4. Explain the purpose of each of the chemical reagents that are used for PAGE.(a) acrylamide(b) -methylene-bis-acrylamide(c) TEMEDN,N¿
= 16,000b= 15,500;a
(d) sodium dodecyl sulfate(e) Coomassie Blue dye(f) bromophenol blue
5. What is the main advantage of slab gels over column gels for PAGE?6. Explain the purposes of protein and nucleic acid “blotting.”7. Is it possible to use polyacrylamide as a matrix for electrophoresis of nucleic acids?
What are the limitations, if any?8. Can polyacrylamide gels be used for the analysis of plasmid DNA with greater than
3000 base pairs? Why or why not?9. Describe the toxic characteristics of acrylamide, and outline precautions necessary for
its use.10. The dye ethidium bromide is often used to detect the presence of nucleic acids on elec-
trophoresis supports. Explain how it functions as an indicator.11. The name “Western blot” is derived from other blotting procedures called the Southern
blot (developed by Earl Southern) and the Northern blot. What are the differencesamong these three types of blotting techniques and what is the purpose of each?
12. An economical way to “block” a Western blot membrane is to incubate it in a 10% solu-tion of nonfat milk powder. How does this solution function as a blocking reagent?
13. If a protein you wish to analyze by Western blotting is acidic (anionic under blottingconditions), what type of membrane would be best to ensure the tightest binding?
14. Design a diagnostic test based on the Western blot that would give an indication of infec-tion by the AIDS virus. Assume that a blood serum sample is available from the patient.
15. A protein mixture can be fractionated either by native PAGE or by denaturing SDS-PAGE, before Western blotting. What factors would determine your choice ofelectrophoresis method?

Chapter 6 • Characterization of Proteins and Nucleic Acids by Electrophoresis 199
16. Bromophenol blue dye is often used as a marker to tell you when to stop the elec-trophoresis process. What assumptions must you make about the relative movementof the dye versus sample proteins during electrophoresis?
17. In your biochemistry research project, you have isolated a new protein from spinachleaves. You wish to do a Western blot experiment with the protein to help determineits chemical structure and/or biological function. An amino acid analysis of the pro-tein showed a great abundance of Phe, Leu, and Val. What would be your choice ofmembrane for the blotting experiment?
18. Define each of the following items in terms of their use in Western blotting.(a) SDS-PAGE (e) Secondary antibody(b) Nylon membrane (f) Protein molecular weight standard mixture(c) Electroblotting (g) Conjugated enzyme(d) Primary antibody
Further Reading
J. Berg, J. Tymoczko, and L. Stryer, Biochemistry, 6th ed. (2007), Freeman (New York).Analysis of proteins by electrophoresis.
K. Bourzac, L. LaVine, and M. Rice, J. Chem. Educ. 80, 1292–1297 (2003). “Analysis of DAPIand SYBR Green I as Alternatives to Ethidium Bromide for Nucleic Acid Staining inAgarose Gel Electrophoresis.”
R. Boyer, Concepts in Biochemistry, 3rd ed. (2006), John Wiley & Sons (Hoboken, NJ), pp. 84–86. Introduction to electrophoresis.
R. Boyer, Modern Experimental Biochemistry, 3rd ed. (2000), Benjamin/Cummings (SanFrancisco), pp. 321–333. Identification of serum glycoproteins by SDS-PAGE andWestern blotting.
E. Eberhardt et al., Biochem. Mol. Biol. Educ. 31, 402–409 (2003). “PreparingUndergraduates to Participate in the Post-Genome Era: A Capstone LaboratoryExperience in Proteomics.”
R. Garrett and C. Grisham, Biochemistry, 4th ed. (2010), Brooks Cole (Belmont, CA). Anintroduction to electrophoresis.
D. Nelson and M. Cox, Lehninger Principles of Biochemistry, 5th ed. (2009), Freeman(New York). Introduction to electrophoresis.
N. Price, R. Dwek, M. Wormald, and R. Ratcliffe, Principles and Problems in PhysicalChemistry for Biochemists, 3rd ed. (2002), Oxford University Press (New York).
P. Schmitt-Kopplin, Capillary Electrophoresis: Methods and Protocols, (2008), HumanaPress (Totowa, NJ).
D. Sheehan, Physical Biochemistry: Principles and Applications, 2nd ed. (2009), Wiley-Blackwell (Hoboken, NJ).
I. Tinoco, Jr., K. Sauer, J. Wang, and J. Puglisi, Physical Chemistry: Principles andApplications in Biological Sciences, 4th ed. (2002), Prentice Hall (Upper SaddleRiver, NJ). Chapter 6 covers electrophoresis.
A. Van Eeckhaut and Y. Michotte (Editors), Chiral Separations by CapillaryElectrophoresis (2009), CRC Press.
D. Voet and J. Voet, Biochemistry, 3rd ed. (2005), John Wiley & Sons (Hoboken, NJ).Introduction to electrophoresis.
D. Voet, J. Voet, and C. Pratt, Fundamentals of Biochemistry, 3rd ed. (2008), John Wiley &Sons (Hoboken, NJ). An introduction to electrophoresis.
J. Walker, Editor, The Protein Protocols Handbook, 2nd ed. (2002), Humana Press(Totowa, NJ). Contains several chapters on electrophoresis of proteins and peptides.

200 Chapter 6 • Characterization of Proteins and Nucleic Acids by Electrophoresis
R. Westermeier, Electrophoresis in Practice: A Guide to Methods and Applications ofDNA and Protein Separation, (2005), Wiley-VCH.
J. Yan et al., Electrophoresis 21, 3657–3665 (2000). “Postelectrophoretic Staining of ProteinsSeparated by Two-Dimensional Gel Electrophoresis Using SYPRO Dyes.”
http://biotech.biology.arizona.edu/labs/Electrophoresis_dyes_stude.htmlThe University of Arizona Biotech Project.
http://www.probes.comThis Web site for Molecular Probes Inc. has extensive information on gel staining forproteins and nucleic acids.
http://www.med.unc.edu/wrkunits/3ctrpgm/pmbb/mbt/WESTERN.htmFor introduction and procedures, read Unit 1: Western Blotting.
http://www.bio-rad.comInformation on all areas of electrophoresis and blotting.
http://proteomics.cancer.dkDanish Center for Human Genome Research: Human 2-D PAGE Databases.
http://en.wikipedia.org/wiki/Gel_electrophoresisIntroduction to gel electrophoresis.
http://en.wikipedia.org/wiki/Agarose_gel_electrophoresisIntroduction to agarose gel electrophoresis.
http://harrisphq.com/eThermo/CMA/PDFs/Articles/articlesFile_21627.pdfA basic primer to protein electrophoresis.
http://www.hoeferinc.com/static_products.asp?page=54&gclid=CLiytpynrp8CFRRcbQodHlDu1Q
Protein electrophoresis.
http://www.piercenet.com/Products/Browse.cfm?fldID=020510Protein electrophoresis.
http://www.sigma-aldrich.com/life-science/proteomics/protein-electrophoresis.htmlProtein electrophoresis.
http://www.invitrogen.comSypro dyes.
http://www.hoeferinc.com/static_products.asp?page=57Nucleic acid electrophoresis.
http://www.interchim.com/interchim/bio/cat_bio/pdf/Genomics_DNA_analysis_Electro_Nucleic_acids.pdf
GelRed dye.
http://www.biotium.com/View slide presentation on GelRed and GelGreen dye use and safety info.
Additional Web sites for this chapter are available on the book’s Companion Website,which can be found at http://www.chemplace.com.

7 SPECTROSCOPIC ANALYSIS OF BIOMOLECULES
201
Some of the earliest experimental measurements on biomolecules involved studies oftheir interactions with electromagnetic radiation of all wavelengths, including X-ray,ultraviolet–visible, and infrared. It was experimentally observed that when light
impinges on solutions or crystals of molecules, at least two distinct processes occur: lightscattering and light absorption. Both processes have led to the development of fundamen-tal techniques for characterizing and analyzing biomolecules. We now use the termspectroscopy to label the discipline that studies the interaction of electromagnetic radiationwith matter.
Absorption of ultraviolet–visible light by molecules is an especially valuable process formeasuring concentration and for molecular structure elucidation. The absorption process isdependent upon two factors: (1) the properties of the radiation (wavelength, energy, etc.), and(2) the structural characteristics of the absorbing molecules (atoms, functional groups, etc.).The interaction of electromagnetic radiation with molecules is a quantum process anddescribed mathematically by quantum mechanics; that is, the radiation is subdivided into
A. Ultraviolet-Visible Absorption Spectrometry 202B. Fluorescence Spectrometry 220C. Nuclear Magnetic Resonance Spectroscopy 225D. Mass Spectrometry 230E. X-Ray Crystallography 233
Study Problems 234Further Reading 235
C H A P T E R

202 Chapter 7 • Spectroscopic Analysis of Biomolecules
discrete energy packets called photons. In addition, molecules have quantizedexcitation levels and can accept packets of only certain quantities of energy, thusallowing only certain electronic transitions.
With some molecules, the process of absorption is followed by emission oflight of a longer wavelength. This process, called fluorescence, depends onmolecular structure and environmental factors and assists in the characterizationand analysis of biologically significant molecules and dynamic processes occur-ring between molecules.
Nuclear magnetic resonance spectroscopy and mass spectrometry tech-niques are also now being applied to the study of biological macromoleculesand processes. NMR is especially versatile because, in addition to protonspectra, monitoring the presence of and nuclei in biomole-cules is possible. Multidimensional NMR is being applied to the study ofprotein secondary and tertiary structure. Accurate measurements of proteinmolecular weight and sequence analysis may now be carried out by massspectrometry.
A. ULTRAVIOLET–VISIBLE ABSORPTION SPECTROMETRY
Wavelength and Energy
The electromagnetic spectrum, as shown in Figure 7.1, is composed of a continu-um of waves with different properties defined by wavelength and energy.Several regions of the electromagnetic spectrum are of importance in biochemi-cal studies, including X-ray (X-ray crystallography, up to 7 nm), the ultraviolet(UV, 180–340 nm), the visible (VIS, 340–800 nm), the infrared (IR, 1000–100,000 nm),and radio waves (NMR, nm). In this section, we will concentrate on theUV and VIS regions. Light in these regions has energy sufficient to excite the va-lence electrons of molecules and thus move the electrons from one energy level(or state) to a higher energy level (excited state).
Figure 7.2 shows that the propagation of light is due to an electrical fieldcomponent E and a magnetic field component H that are perpendicular to eachother. The wavelength of light, defined by Equation 7.1, is the distance betweenadjacent wave peaks, as shown in Figure 7.2.
106-1010
31P13C, 19F, 15N,
1 10 102 103 104 105 106
X rays
X-raycrystallography
UV Visible Infrared Microwave
Vibrational Rotational NuclearElectronic
Inner shell Outer shell
Standard
absorption
spectroscopy
Infrared
and Raman
spectroscopy
Nuclear
magnetic
resonance
Type of
transition
Technique
Wavelength (nm)
FIGURE 7.1 Theelectromagneticspectrum. Thewavelengths oflight associatedwith importantspectroscopytechniques areshown in thefigure.

Chapter 7 • Spectroscopic Analysis of Biomolecules 203
E1λ
H
FIGURE 7.2 Anelectromagneticwave, showing the E and Hcomponents.
>> (Eq. 7.1)
where
the number of waves passing a certain point per unit time
Light also behaves as though it were composed of energetic particles. Theamount of energy E associated with these particles (or photons) is given byEquation 7.2:
>> (Eq. 7.2)
where
Planck’s constant, Joules
Equations 7.1 and 7.2 may be combined to yield Equation 7.3:
>> (Eq. 7.3)
Note the inverse relationship between wavelength and energy. In Figure 7.1,X-rays have the shortest wavelength, but the most energy, and microwaves havelong wavelengths, but the least energy.
E = hc>l
# s6.63 * 10-34h =
E = hn
n = frequency,c = speed of light, 3 * 108 m>sl = wavelength
l = c>n
STUDY EXERCISE 7.1 UV-VIS Spectroscopy
What is the amount of energy (E) associated with light of wavelength 300 nm in theultraviolet range?
Solution: Using Equation 7.3:
This is the approximate amount of energy associated with carbon-based covalentbonds.
= 6.63 * 10-19 J>photon = 398 kJ>mole
E =16.63 * 10-34 J # s213 * 108 m>s2
300 * 10-9 m
E = hc>l

204 Chapter 7 • Spectroscopic Analysis of Biomolecules
Light Absorption
When a photon of specified energy interacts with a molecule, one of two processesmay occur. The photon may be scattered, or it may transfer its energy to the mole-cule, producing an excited state of the molecule. The former process, calledRayleigh scattering, occurs when a photon collides with a molecule and is dif-fracted or scattered with unchanged frequency. Light scattering is the physicalbasis of several experimental methods used to characterize macromolecules.Before the development of electrophoresis, light scattering techniques were usedto measure the molecular weights of macromolecules. The widely used techniquesof X-ray diffraction (crystal and solution), electron microscopy, laser light scatter-ing, and neutron scattering all rely in some way on the light scattering process.
The other process mentioned above, the transfer of energy from a photon toa molecule, is absorption. For a photon to be absorbed, its energy must match theenergy difference between two energy levels of the molecule. Molecules possess aset of quantized energy levels, as shown in Figure 7.3. Although several states arepossible, only two electronic states are shown, a ground state, G, and the firstexcited state, These two states differ in the distribution of valence electrons.When electrons are promoted from a ground state orbital in G to an orbital of higherenergy in an electronic transition is said to occur. The energy associated withultraviolet and visible light is sufficient to promote molecules from one electronicstate to another, that is, to move electrons from one quantized level to another.
Within each electronic energy level is a set of vibrational levels. These rep-resent changes in the stretching and bending of covalent bonds. The importanceof these energy levels will not be discussed here, but transitions between thevibrational levels are the basis of infrared spectroscopy.
The electronic transition for a molecule from G to represented by thevertical arrow in Figure 7.3, has a high probability of occurring if the energy ofthe photon corresponds to the energy necessary to promote an electron fromenergy level to energy level
>> (Eq. 7.4)
A transition may occur from any vibrational level in G to some other vibrationallevel in for example, however, not all transitions have equal probability.n = 3;S1,
E2 - E1 = ¢E =hcl
E2:E1
S1,
S1,
S1.
Excited state, S1
Ground state, G
Energy
Distance between atoms in a molecule
FIGURE 7.3Energy-leveldiagram showingthe ground state Gand the first excitedstate S1.

Chapter 7 • Spectroscopic Analysis of Biomolecules 205
The probability of absorption is described by quantum mechanics and will not bediscussed here.
Electronic Transitions in Biomolecules
Absorption of UV and VIS light occurs when the energy associated with the elec-tromagnetic radiation matches the energy difference between molecular states ina molecule. But what are the actual electronic transitions that occur in a mole-cule? If this question can be answered, then it should be possible to predict whichmolecules will or will not absorb UV-VIS light. The reverse is also true—byobserving the wavelengths of light absorbed by a molecule, it should be possibleto speculate on molecular structure (what atoms and functional groups are pres-ent). Consider the electronic properties of a carbonyl group, a functional
group present in many types of biomolecules including amino acids, fatty acids,carbohydrates (open chain), nucleotides, proteins, and nucleic acids. A molecularorbital diagram showing the valence electrons in the higher-energy orbitals of thecarbonyl group is displayed in Figure 7.4. There are three types of orbitals shown:
• nonbonding orbitals with lone pairs of electrons in atoms like O, N,and S
• bonding orbitals formed by overlap of p atomic orbitals• antibonding orbitals
Two kinds of electronic transitions are possible:
• which are “allowed” by quantum mechanics and have a highprobability of occurring, and
• which are “forbidden” and have a low probability of occurring.
These two types of electronic transitions are shown in Figure 7.4.
n: p*,
p: p*,
p* =p =
n =
C O
p*
p p* n p*
p
n
Excited
State
p*
p
n
Ground
State
p*
p
n
Excited
State
FIGURE 7.4 Molecular orbital diagram for the carbonyl group. Only valence electrons inhigher-energy orbitals are shown. Two types of electronic transitions are illustrated: and n: p*.
p: p*
Proteins
The following functional groups in proteins are responsible for absorption ofUV-VIS light:
C
H
Oδ−
δ+N

1. Peptide bonds:• intense absorption at 190 nm• very weak absorption at 210–220 nm
2. Amino acid residues containing aromatic phenyl groups: Phe, Tyr, Trp
•Phe: weak absorption at 250 nmTyr: weak absorption at 274 nmTrp: strong absorption at 280 nmThe absorbance at 280 nm is often used to measure protein concentration(See Chapter 3, Section B, p. 70, The Spectrophotometric Assay).
3. Prosthetic groups:Nucleotide cofactors: etc.HemeChlorophyllMetal ions: Cu(II), Fe(II), Fe(III), Ni(II), etc.Highly conjugated compounds: retinal, etc.
Many of the cofactors and prosthetic groups above absorb in both the UV andVIS regions. Absorption in the VIS region causes many of the biomolecules inGroup 3 to be colored.
Nucleic Acids
Absorption is due to the presence of pyrimidine and purine bases, which have sev-eral different types of electronic transitions (see structures, Chapter 9, p. 268):
1. Extensive aromatic character, 2. Carbonyl groups in bases, 3. Several nitrogen and oxygen atoms,
Nucleic acids display intense absorption in the 200–300-nm range with a maxi-mum at 260 nm. This is the basis for the spectrophotometric assay of DNA andRNA solutions (Chapter 3, Section C, p. 71).
1n: p*2.1p: p*; n: p*21p: p*2
NAD+ , FAD, FMN,
p: p*
n: p*,p: p*,
206 Chapter 7 • Spectroscopic Analysis of Biomolecules
STUDY EXERCISE 7.2 UV-VIS Spectroscopy
Predict the types of electronic transitions in each of the following biomolecules andsuggest whether UV-VIS spectroscopy might be useful in their analysis and character-ization. You may need to review their structures in your biochemistry textbook.
(a) Alanine(b) Lysine(c) Cysteine(d) Glucose(e) Lauric acid
(f) Adenine(g) -carotene(h) Chlorophyll(i) Bilirubin(j) Ferritin, a protein containing Fe(III)
b

Chapter 7 • Spectroscopic Analysis of Biomolecules 207
The Absorption Spectrum
A UV-VIS spectrum is obtained by measuring the light absorbed by a sample asa function of wavelength. Since only discrete packets of energy (specific wave-lengths) are absorbed by molecules in the sample, the spectrum theoreticallyshould consist of sharp discrete lines. However, the many vibrational levels ofeach electronic energy level increase the number of possible transitions. Thisresults in several spectral lines, which together make up the familiar spectrum ofbroad peaks as shown in Figure 7.5.
An absorption spectrum can aid in the identification of a molecule becausethe wavelength of absorption depends on the functional groups or arrangementof atoms in the sample. The spectrum of oxyhemoglobin in Figure 7.5 is due tothe presence of the iron porphyrin moiety and is useful for the characterizationof heme derivatives or hemoproteins. Note that the spectrum consists of severalpeaks at wavelengths where absorption reaches a maximum (415, 542, and 577 nm).These points, called are of great significance in the identification of unknownmolecules and will be discussed later in the chapter.
The Beer-Lambert Law
Quantitative measurements in spectrophotometry are evaluated using theBeer-Lambert law:
>> (Eq. 7.5)
where
intensity of light irradiating the sampleintensity of light transmitted through the sampleabsorption coefficient or absorptivityE =
I =I0 =A = absorbance or - log1I>I02
A = Elc
lmax,
Absorbance
400 500 600
Wavelength (nm)
FIGURE 7.5 Thevisible absorbancespectrum ofhemoglobin.

path length of light through the sample, or thickness of the cellconcentration of absorbing material in the sample
Since the absorbance, A, is derived from a ratio it is unitless. Theterm E, which is a proportionality constant, defines the efficiency or extent ofabsorption. If this is defined for a particular chromophore at a specific wave-length, the term absorption coefficient or absorptivity is used. However,students should be aware that in the older biochemical literature, the termextinction coefficient is often used. The units of E depend on the units of l (usuallycm) and c (usually molar) in Equation 7.5. For biomolecules, E is often used inthe form molar absorption coefficient, which is defined as the absorbance of a1 M solution of pure absorbing material in a 1-cm cell under specified conditionsof wavelength and solvent. The units of are To illustrate the use ofEquation 7.5, consider the following calculation:
M -1 cm-1.e
e,
1- logI>I02,c =l =
208 Chapter 7 • Spectroscopic Analysis of Biomolecules
STUDY EXERCISE 7.3 Beer-Lambert Law
The absorbance, A, of a M solution of the amino acid tyrosine, at a wave-length of 280 nm, is 0.75. The path length of the cuvette is 1 cm. What is the molarabsorption coefficient,
Solution:
Notice that the units of are defined by the concentration units of the tyrosine solution(M) and the dimension units of the cuvette (cm). Although E is most often expressed asa molar absorption coefficient, you may encounter other units such as which is theabsorbance of a solution of pure absorbing material in a 1-cm cuvette at a specified wavelength, l.
1% 1w>v2E1%l,
e
= 1500liter
mole * cm= 1500M -1 cm-1
e =0.75
11 cm215 * 10-4 mole>liter2
c = 5 * 10-4M
l = 1 cm
A = elc = 0.75
e?
5 * 10-4
STUDY EXERCISE 7.4 Absorption Coefficients
In the older biochemical literature, absorption coefficients are often reported asextinction coefficients ( ). The extinction coefficient of the enzyme yeast alcoholdehydrogenase is:
Calculate the molar absorption coefficient for yeast alcohol dehydrogenase. Themolecular weight for the enzyme is 141,000.
E1%l = 12.6
E1%L

Chapter 7 • Spectroscopic Analysis of Biomolecules 209
Instrumentation
The spectrophotometer is used to measure absorbance experimentally. Thisinstrument produces light of a preselected wavelength, directs it through thesample (usually dissolved in a solvent and placed in a cuvette), and measuresthe intensity of light transmitted by the sample. The major components areshown in Figure 7.6. These consist of a light source, a monochromator (includ-ing various filters, slits, and mirrors), a sample chamber, a detector, and ameter or recorder. All of these components are usually under the control of acomputer.
Light Source
For absorption measurements in the ultraviolet region, a high-pressure hydrogenor deuterium lamp is used. These lamps produce radiation in the 200 to 340 nmrange. The light source for the visible region is the tungsten-halogen lamp, with awavelength range of 340 to 800 nm. Instruments with both lamps have greaterflexibility and can be used for the study of most biologically significant molecules.
Monochromator
Both lamps discussed above produce continuous emissions of all wavelengthswithin their range. Therefore, a spectrophotometer must have an optical system toselect monochromatic light (light of a specific wavelength). Modern instrumentsuse a prism or, more often, a diffraction grating to produce the desired wave-lengths. It should be noted that light emitted from the monochromator is not entirelyof a single wavelength, but is enhanced in that wavelength. That is, most of thelight is of a single wavelength, but shorter and longer wavelengths are present.
Before the monochromatic light impinges on the sample, it passes througha series of slits, lenses, filters, and mirrors. This optical system concentrates thelight, increases the spectral purity, and focuses it toward the sample. The opera-tor of a spectrophotometer has little control over the optical manipulation of thelight beam, except for adjustment of slit width. Light passing from the mono-chromator to the sample encounters a “gate” or slit. The slit width, which is con-trolled by a computer, determines both the intensity of light impinging on thesample and the spectral purity of that light. Decreasing the slit width increasesthe spectral purity of the light, but the amount of light directed toward thesample decreases. The efficiency or sensitivity of the detector then becomes alimiting factor.
MonochromatorPhototube
Recorder or printer
SlitsLight
sourceOptical
systemSample
chamber
0.17II0
FIGURE 7.6 Adiagram of aconventional,single-beamspectrophotometer.

In instruments equipped with photodiode array detectors (see Figure 7.7and the following section on detectors), polychromatic light from a source passesthrough the sample and is focused on the entrance slit of a polychromator (a holographic grating that disperses the light into its wavelengths). Thewavelength-resolved light beam is then focused onto the photodiode arraydetector. The relative positions of the sample and grating are reversed comparedto conventional spectrometry; hence, the new configuration is often calledreversed optics. (Compare Figures 7.6 and 7.7.)
Sample Chamber
The processed monochromatic light is then directed into a sample chamber,which can accommodate a wide variety of sample holders. Most UV-VIS meas-urements on biomolecules are taken on solutions of the molecules. The sample isplaced in a tube or cuvette made of glass, quartz, or other transparent material.Figure 7.8 shows the transmission properties of several transparent materialsused in cuvette construction.
Glass cuvettes are inexpensive, but, because they absorb UV light, they canbe used only above 340 nm. Quartz or fused silica cuvettes may be used through-out the UV and visible regions Disposable plastic cuvettes arenow commercially available in polymethacrylate (280–800 nm) and polystyrene(350–800 nm). The care and use of cuvettes were discussed in Chapter 1, p. 15.
Sample chambers for spectrometers come in two varieties—those holdingonly one cuvette at a time (single-beam) and those holding two cuvettes, one fora reference, usually solvent, and one for a sample (double-beam). In the past,single-beam instruments were usually less expensive but more cumbersome touse because reference and sample cuvettes required constant exchange.However, modern single-beam instruments with computer control and analysis
1'200-800 nm2.
210 Chapter 7 • Spectroscopic Analysis of Biomolecules
Slit
Lens
Lens
Cuvette
ShutterLamp
Photodiode arrayGrating
FIGURE 7.7Optical diagram fora diode-arrayspectrophotometer.

Chapter 7 • Spectroscopic Analysis of Biomolecules 211
A
B
Tra
nsm
itta
nce (%
)
C
180
10
20
30
40
50
60
70
80
90
100
200 220 240 260 280 300 320 340 360 380 500 600 700 800
D E
Wavelength λ (nm)
FIGURE 7.8 Thetransmissionproperties ofseveral materialsused in cuvettes.
(quartz)
-crylate
E = glassD = polystyrene
C = polymethaB = NIR silicaA = silica
can be programmed to correct automatically for the reference spectrum, whichmay be stored in a memory file. In double-beam optics, the light beam is splitinto two paths by directing it through a monochromator. The two beams, whichare of identical wavelength and intensity, pass through the sample cell (analyteplus solvent) and reference chamber (solvent only). This allows for the correctionof sample absorbance by continuously subtracting the reference spectrum.
Detector
The intensity of the light that passes through the sample under study depends on theamount of light absorbed by the sample. Intensity is measured by a light-sensitivedetector, usually a photomultiplier tube (PMT). The PMT detects a small amount oflight energy, amplifies this by a cascade of electrons accelerated by dynodes, andconverts it into an electrical signal that can be fed into a meter or recorder.
A new technology has been introduced during the past few years that greatlyincreases the speed of spectrophotometric measurements. New detectors calledphotodiode arrays are being used in modern spectrometers. Photodiodesare composed of silicon crystals that are sensitive to light in the wavelength range170–1100 nm. Upon photon absorption by the diode, a current is generated in thephotodiode that is proportional to the number of photons. Linear arrays of photo-diodes are self-scanning and have response times on the order of 100 millisec-onds; hence, an entire UV-VIS spectrum can be obtained with an extremely briefexposure of the sample to polychromatic light. New spectrometers designed byHewlett-Packard, Perkin-Elmer, and others use this technology and can producea full spectrum from 190 to 820 nm in one-tenth of a second or less.
Printers and Recorders
Less expensive instruments give a direct readout of absorbance and/or transmit-tance in analog or digital form. These instruments are suitable for single-wavelength measurements; however, if a scan of absorbance vs. wavelength(Figure 7.5) is desired, some type of device to display the spectrum must be available.

212 Chapter 7 • Spectroscopic Analysis of Biomolecules
Modern, research-grade spectrometers are available that offer the latest intechnology. All of the components discussed above are integrated into a singlepackage and are completely under the control of a computer. By simply pushinga button, one can obtain the UV-VIS spectrum of a sample displayed on a com-puter screen in less than 1 second. In addition, these modern instruments withcomputers can be programmed to carry out several functions, such as subtrac-tion of solvent spectrum, spectral overlay, storage, difference spectra, derivativespectra, and calculation of concentrations and rate constants.
Applications of UV–VIS Spectroscopy
Now that you are familiar with the theory and instrumentation of absorptionspectrophotometry, you will more easily understand the actual operation andtypical applications of a spectrophotometer. Since virtually all UV-VIS measure-ments are made on samples dissolved in solvents, only those applications will bedescribed here. Although many different types of operations can be carried outon a spectrophotometer, all applications fall in one of two categories:
1. measurement of absorbance at a fixed wavelength;2. measurement of absorbance as a function of wavelength.
Measurements at a fixed wavelength are most often used to obtain quantitativeinformation, such as the concentration of a solute in solution or the absorptioncoefficient of a chromophore. Absorbance measurements as a function of wave-length provide qualitative information that assists in solving the identity andstructure of a pure substance by detecting characteristic groupings of atoms in amolecule.
For fixed-wavelength measurements with a single-beam instrument, acuvette containing solvent only is placed in the sample beam and the instrumentis adjusted to read “zero” absorbance. A matched cuvette containing sample plussolvent is then placed in the sample chamber and the absorbance is read directlyfrom the display. The adjustment to zero absorbance with only solvent in thesample chamber allows the operator to obtain a direct reading of absorbance forthe sample.
Fixed-wavelength measurements using a double-beam spectrophotometerare made by first zeroing the instrument with no cuvette in either the sample orreference holder. Alternatively, the spectrophotometer can be balanced by plac-ing matched cuvettes containing water or solvent in both sample chambers.Then, a cuvette containing pure solvent is placed in the reference position and amatched cuvette containing solvent plus sample is set in the sample position.The absorbance reading given by the instrument is that of the sample; that is, theabsorbance due to solvent is subtracted by the instrument.
An absorbance spectrum of a compound is obtained by scanning a rangeof wavelengths and plotting the absorbance at each wavelength. Most double-beam spectrophotometers automatically scan the desired wavelength range andrecord the absorbance as a function of wavelength. If solvent is placed in the ref-erence chamber and solvent plus sample in the sample position, the instrumentwill continuously and automatically subtract the solvent absorbance from the

Chapter 7 • Spectroscopic Analysis of Biomolecules 213
total absorbance (solvent plus sample) at each wavelength; hence, the recorderoutput is really a difference spectrum (absorbance of sample plus solvent, minusabsorbance of solvent).
Both types of measurements (fixed wavelength and absorbance spectrum)are common in biochemistry, and you should be able to interpret results fromeach. The following four examples are typical of the kinds of problems readilysolved by spectrophotometry.
Measurement of the Concentration of an Analyte in Solution
According to the Beer-Lambert law, the absorbance of a material in solution isdirectly dependent on the concentration of that material. Two methods are com-monly used to measure concentration. If the absorption coefficient is known forthe absorbing species, the concentration can be calculated after experimentalmeasurement of the absorbance of the solution.
STUDY EXERCISE 7.5 Absorbance and Concentration
A solution of the nucleotide base uracil, in a 1-cm cuvette, has an absorbance atof 0.65. Pure solvent in a matched quartz cuvette has an absorbance of
0.07. What is the molar concentration of the uracil solution? Assume the molar absorp-tion coefficient, is
Solution:
c = 7.1 * 10-5M
c =Ael
=0.58
18.2 * 103M -1 cm-1211 cm2
l = 1 cm
e = 8.2 * 103M -1 cm-1
A = 0.65 - 0.07 = 0.58
A = 1absorbance of solvent + sample2 - 1absorbance of solvent2A = elc
8.2 * 103M -1 cm-1.e,
lmax1260 nm2
If the absorption coefficient for an absorbing species is known, the con-centration of that species in solution can be calculated as outlined. However,there are limitations to this application. Most spectrophotometers are usefulfor measuring absorbances up to 1, although more sophisticated instrumentscan measure absorbances as high as 2. (If the absorbance is above 1, dilutesample with the same solvent.) Most absorbance readings below 0.1 are notaccurate. Also, some substances do not obey the Beer-Lambert law; that is,absorbance may not increase in a linear fashion with concentration. Reasonsfor deviation from the Beer-Lambert law are many; however, the majority areinstrumental, chemical, or physical. Spectrophotometers often display a

214 Chapter 7 • Spectroscopic Analysis of Biomolecules
nonlinear response at high absorption levels because of stray light. Physicalreasons for nonlinearity include hydrogen bonding of the absorbing specieswith the solvent and intermolecular interactions at high concentrations.Chemical reasons may include reaction of the solvent with the absorbingspecies and the presence of impurities. Linearity is readily tested by preparinga series of concentrations of the absorbing species and measuring theabsorbance of each. A plot of A vs. concentration should be linear if the Beer-Lambert law is valid. If the absorption coefficient for a species is unknown, itsconcentration in solution can be measured if the absorbance of a standardsolution of the compound is known.
STUDY EXERCISE 7.6 Absorbance and Concentration
The absorbance of a solution of the enzyme tyrosinase, in a 1-cm cell at 280 nm,is 24.9. What is the concentration of a tyrosinase solution that has an of 0.25?
Since the absorption coefficient, E%, is the same for both solutions, the concen-tration can be calculated by a direct ratio:
Solution:
Alternatively, the concentration of a species in solution can be determined bypreparing a standard curve of absorbance vs. concentration.
Cx = 0.01% = 0.01 g>dL = 0.1 mg>mL
24.91%
=0.25Cx
Cx = concentration of the unknown solution in, %
Ax = absorbance of the unknown solution = 0.25
Cstd = concentration of the standard solution = 1% 11 g>dL2Astd = absorbance of the 1% standard solution = 24.9
Astd
Cstd=AxCx
A280
1% 1w>v2
STUDY EXERCISE 7.7 Bradford Protein Assay
The Bradford protein assay is one of the most used spectrophotometric assays in bio-chemistry. (For a discussion of the Bradford assay, see Chapter 3, Section B, p. 69.)Solutions of varying amounts of a standard protein are mixed with reagents that causethe development of a color. The amount of color produced depends on the amount ofprotein present. The absorbance at 595 nm of each reaction mixture is plotted againstthe known protein concentration. A protein sample of unknown concentration is treat-ed with the Bradford reagents, and the color is allowed to develop.

Chapter 7 • Spectroscopic Analysis of Biomolecules 215
Absorbance Measurements on Very Small Sample Volumes
The absorbance experiments described to this point have been applied to samplesizes of 1 and 3 mL measured in glass or quartz cuvettes. Biomolecules are oftenexpensive, difficult to isolate, and not always available in these large sample sizes.Recent advances in the development of spectrophotometers now make availableinstruments for rapidly quantifying and analyzing micro-volume samples. Forexample, NanoDrop UV-VIS spectrophotometers from Thermo Scientific (www.thermo.com/nanodrop) can measure samples as small as 0.5μl in about 5 sec-onds. The wavelength range of the spectrometers is 220–750 nm, and they canmake both individual absorbance measurements and absorption spectra (scans).Cuvettes and capillaries are not necessary, as the sample droplet is applied directlyonto an optical pedestal for measurement. Measurements can be made on anybiomolecules that absorb in the wavelength range. This includes proteins, DNA,RNA, nucleotides, cofactors, fluorescent substances, and many others.
Identification of Unknown Biomolecules by Spectrophotometry
The UV-VIS spectrum of a biomolecule reveals much about its molecular struc-ture. Therefore, a spectral analysis is one of the first experimental measure-ments made on an unknown biomolecule. Natural molecules often contain
The following absorbance measurements are typical for the standard curve of aprotein:
Protein ( g per assay)M A595
15 0.07
25 0.15
50 0.28
100 0.55
150 0.90
0.1 mL unknown protein solution 0.10
0.2 mL unknown protein solution 0.22
A standard curve for the data is plotted in Figure 3.6 on page 70. What standard pro-tein was used in this case? Note the linearity, indicating that the Beer-Lambert law isobeyed over this concentration range of standard protein. Two different volumes ofunknown protein were tested. This was to ensure that one volume would be in theconcentration range of the standard curve. Since the accuracy of the assay is dependenton identical times for color development, the unknowns must be assayed at the sametime as the standards. From graphical analysis, an of 0.22 corresponds to ofprotein per 0.20 mL. This indicates that the original protein solution concentration wasapproximately or 0.20 mg/mL. Using computer graphics, students cannow quickly visualize experimental data and determine the need for further analysis.Most modern computer programs use the method of least squares to calculate auto-matically the slope, intercepts, and correlation coefficients.
200 mg>mL
40 mgA595

216 Chapter 7 • Spectroscopic Analysis of Biomolecules
chromophoric (color-producing) functional groups that have characteristic spec-tra. Figure 7.9 displays spectra of the well-characterized biomolecules DNA,FMN, NADH, a nucleotide, and a pyrimidine base.
The procedure for obtaining a UV-VIS spectrum begins with the prepara-tion of a solution of the species under study. A standard solution should be pre-pared in an appropriate solvent. An aliquot of the solution is transferred to a
FMNH2, NAD+ ,
NADH
Ab
sorb
ance
Ab
sorb
ance
Ab
sorb
ance
225 250 300
nm
350 400
NAD+
220 240 260 280 300 320 400 500 600
nm nm
DNA
FMNH2
FMN
C
A B
FIGURE 7.9UV-VIS absorbancespectra ofsignificantbiomolecules.A DNA, B FMN and
and NADH, D d-GMP, E thymine.
FMNH2, C NAD+

Chapter 7 • Spectroscopic Analysis of Biomolecules 217
cuvette and placed in the sample chamber of a spectrophotometer. A cuvette con-taining solvent is placed in the reference holder. The spectrum is scanned overthe desired wavelength range and an absorption coefficient is calculated for eachmajor
Kinetics of Biochemical Reactions
Spectrophotometry is one of the best methods available for measuring the ratesof biochemical reactions. Consider a general reaction as shown in Equation 7.6.
>> (Eq. 7.6)
If reactants A or B absorb in the UV-VIS region of the spectrum at somewavelength , the rate of the reaction can be measured by monitoring thel1
A + B Δ C + D
lmax.
Ab
sorb
ance
Ab
sorb
ance
200 220 240 260 280 300
200 220 240 260
d-GMP, pH 7.0
280 300
nm
E
nm
D
Thymine, pH 7.0
FIGURE 7.9(Continued )

decrease of absorbance at due to loss of A or B. Alternatively, if products C orD absorb at a specific wavelength the kinetics of the reaction can be evaluatedby monitoring the absorbance increase at According to the Beer-Lambert law,the absorbance change of a reactant or product is proportional to the concentra-tion change of that species occurring during the reaction. This method is widelyused to assay enzyme-catalyzed processes. Since the rates of chemical reactionsvary with temperature, the sample cuvette containing the reaction mixture mustbe held in a thermostated chamber.
Characterization of Macromolecule-Ligand Interactions by Difference Spectroscopy
Many biological processes depend on a specific interaction between mole-cules. The interaction often involves a macromolecule (protein or nucleicacid) and a smaller molecule, a ligand. Specific examples include enzyme-substrate interactions and receptor protein–hormone interactions (seeChapter 8). One of the most effective and convenient methods for detectingand characterizing such interactions is difference spectroscopy. The inter-action of small molecules with the transport protein hemoglobin is a classicexample of the utility of difference spectroscopy. If a small molecule or lig-and, such as inositol hexaphosphate, binds to hemoglobin, there is a changein the heme spectral properties. The spectral change is small and would bedifficult to detect if the experimenter recorded the spectrum in the usual fash-ion. Normally, one would obtain a spectrum of a heme protein by placing asolution of the protein in a cuvette in the sample compartment of a spec-trophotometer and the neat solvent in the reference compartment. Anyabsorption due to solvent is subtracted because the solvent is present in bothlight beams, so the spectrum is that due to the heme protein. Then the ligandto be tested would be added to the heme protein, and the spectrum would beobtained for this mixture vs. solvent. If the free or bound ligand molecule didnot absorb light in the wavelength range studied, there would be no need tohave ligand in the reference cell. The two spectra (heme protein in solvent vs.solvent and heme protein and ligand in solvent vs. solvent) can then be com-pared and differences noted.
A difference spectrum is faster than the preceding method because onlyone spectral recording is necessary. Two cuvettes are prepared in the followingmanner. The reference cuvette contains heme protein and solvent, whereas thesample cuvette contains heme protein, solvent, and ligand. There must be equalconcentrations of the heme protein in the two cuvettes. (Why?) The two cuvettesare placed in a double-beam spectrophotometer and the spectrum is recorded. Ifthe spectrum of the heme protein is not influenced by the ligand, the resultwould be a zero difference spectrum, that is, a straight line (Figure 7.10A). Bothsamples have identical spectral properties, indicating that there is probably littleor no interaction between heme protein and ligand. However, such data shouldbe treated with caution because it is possible that the heme group is not affectedby ligand binding. A nonzero difference spectrum indicates that the ligand inter-acts with the heme protein and induces a change in the environment of the hemegroup (Figure 7.10B).
l2.l2,
l1
218 Chapter 7 • Spectroscopic Analysis of Biomolecules

Chapter 7 • Spectroscopic Analysis of Biomolecules 219
A difference spectrum can be analyzed and used in several ways. This is auseful technique for demonstrating qualitatively whether an interaction occursbetween a macromolecule and a ligand. Quantitative analysis of difference spec-tra requires measurement of and at This method can be used toquantify the strength of ligand-protein interaction. Note that every time yourecord a spectrum in a double-beam spectrometer, you are obtaining a differencespectrum between sample and reference. Although a heme protein was used inthis example, this does not imply that only heme interactions can be character-ized by difference spectroscopy. Any protein that contains a chromophoricgroup, whether it be an aromatic amino acid, cofactor, prosthetic group, or metalion, can be studied by difference spectroscopy.
Limitations and Precautions in Spectrophotometry
The use of a spectrophotometer is relatively straightforward and can be mas-tered in a short period of time. There are, however, difficulties that must beconsidered. A common problem encountered with biochemical measurements isturbidity, or cloudiness, of biological samples. This can lead to great error inabsorbance measurements because much of the light entering the cuvette is notabsorbed but is scattered. This causes artificially high absorbance readings.Occasionally, absorbance readings on turbid solutions are desirable (as in meas-uring the rate of bacterial growth in a culture), but in most cases turbid solutionsmust be avoided or clarified by filtration or centrifugation.
A difficulty encountered in measuring the concentration of an unknownabsorbing species in solution is deviation from the Beer-Lambert law. For rea-sons stated earlier in this chapter, some absorbing species do not demonstratean increase in absorbance that is proportional to an increase in concentration.(In reality, most compounds follow the Beer-Lambert relationship over a
lmax.¢Almax
400
–8
–6
–4
–2
0
2
4
6
8
–8
–6
–4
–2
0
2
4
6
8
420 440 460 400 420 440 460
A B
λ λ
ϵΔϵΔ
FIGURE 7.10Differencespectroscopy. A Hemoglobin vs.hemoglobin.B Hemoglobin vs.hemoglobin �
inositolhexaphosphate.

220 Chapter 7 • Spectroscopic Analysis of Biomolecules
relatively small concentration range.) When measuring solution concentration,adherence to the Beer-Lambert law must always be tested in the concentrationrange under study.
B. FLUORESCENCE SPECTROMETRY
Principles
In our discussion of absorption spectroscopy, we noted that the interaction ofphotons with molecules resulted in the promotion of valence electrons fromground state orbitals to higher energy level orbitals. The molecules were said tobe in an excited state.
Molecules in the excited state do not remain there long, but spontaneouslyrelax to the more stable ground state. With most molecules, the relaxationprocess is brought about by collisional energy transfer to solvent or other mole-cules in the solution. Some excited molecules, however, return to the groundstate by emitting the excess energy as light. This process, called fluorescence, isillustrated in Figure 7.11. The solid vertical arrow in the figure indicates the pho-ton absorption process in which the molecule is excited from G to some vibra-tional level in S. The excited molecule loses vibrational energy by collision withsolvent and ground state molecules. This relaxation process, which is very rapid,leaves the molecule in the lowest vibrational level of S, as indicated by the wavyarrow. The molecule may release its energy in the form of light (fluorescence,dashed arrow) to return to some vibrational level of G.
Two important characteristics of the emitted light should be noted: (1) Theemitted light is of longer wavelength (lower energy) than the excitation light.This is because part of the energy initially associated with the S state is lost asheat energy, and the energy lost by emission may be sufficient only to return theexcited molecule to a higher vibrational level in G. (2) The emitted light is com-posed of many wavelengths, which results in a fluorescence spectrum as shownin Figure 7.12. This is due to the fact that fluorescence from any particular excitedmolecule may return the molecule to one of many vibrational levels in theground state. Just as in the case of an absorption spectrum, a wavelength of
Distance between atoms in a molecule
Excited state, S1
Ground state, G
Energy
FIGURE 7.11Energy-leveldiagram outliningthe fluorescenceprocess. See text for details.

Chapter 7 • Spectroscopic Analysis of Biomolecules 221
maximum fluorescence is observed, and the spectrum is composed of a wave-length distribution centered at this emission maximum.
Quantum Yield
In the foregoing discussion, it was pointed out that a molecule in the excitedstate can return to lower energy levels by collisional transfer or by light emission.Since these two processes are competitive, the fluorescence intensity of a fluo-rescing system depends on the relative importance of each process. The fluores-cence intensity is often defined in terms of quantum yield, represented by Q.This describes the efficiency or probability of the fluorescence process. By defini-tion, Q is the ratio of the number of photons emitted to the number of photonsabsorbed (Equation 7.7).
>> (Eq. 7.7)
Measurement of quantum yield is often the goal in fluorescence spectroscopyexperiments. Q is of interest because it may reveal important characteristics of thefluorescing system. Two types of factors affect the intensity of fluorescence, inter-nal and external (environmental) influences. Internal factors, such as the numberof vibrational levels available for transition and the rigidity of the molecules, areassociated with properties of the fluorescent molecules themselves. Internal fac-tors will not be discussed in detail here because they are of more interest intheoretical studies. The external factors that affect Q are of great interest tobiochemists because information can be obtained about macromolecule confor-mation and molecular interactions between small molecules (ligands) and largerbiomolecules (proteins, nucleic acids). Of special value is the study of experimen-tal conditions that result in quenching or enhancement of the quantum yield.Quenching in biochemical systems can be caused by chemical reactions of the
Q =number of photons emitted
number of photons absorbed
200
1.0
2.0
2.5
220
10
–4 ×
Mola
r ab
sorp
tion
coeffi
cie
nt
(M–1 c
m–1)
240 260 280 300 320
(nm)
340 360 380 400 420 440 460
λ
FIGURE 7.12Absorptionand fluorescence
spectraof the amino acidtryptophan.
1 - - - 21¬ 2

222 Chapter 7 • Spectroscopic Analysis of Biomolecules
fluorescent species with added molecules, transfer of energy to other moleculesby collision (actual contact between molecules), and transfer of energy over adistance (no contact, resonance energy transfer). The reverse of quenching,enhancement of fluorescent intensity, is also observed in some situations. Severalfluorescent dye molecules are quenched in aqueous solution, but their fluores-cence is greatly enhanced in a nonpolar or rigidly bound environment (the interi-or of a protein, for example). This is a convenient method for characterizingligand binding. Both fluorescence quenching and fluorescence enhancementstudies can yield important information about biomolecular structure and function.
Instrumentation
The basic instrument for measuring fluorescence is the spectrofluorometer. Itcontains a light source, two monochromators, a sample holder, and a detector. Atypical experimental arrangement for fluorescence measurement is shown inFigure 7.13. The setup is similar to that for absorption measurements, with twosignificant exceptions. First, there are two monochromators, one for selection ofthe excitation wavelength and another for wavelength analysis of the emittedlight. Second, the detector is at an angle (usually ) to the excitation beam. Thisis to eliminate interference by the light that is transmitted through the sample.Upon excitation of the sample molecules, the fluorescence is emitted in all direc-tions and is detected by a photocell at right angles to the excitation light beam.
The lamp source used in most instruments is a xenon arc lamp that emitsradiation in the ultraviolet, visible, and near-infrared regions (200 to 1400 nm).The light is directed by an optical system to the excitation monochromator,which allows either preselection of a wavelength or scanning of a certain wave-length range. The exciting light then passes into the sample chamber, whichcontains a fluorescence cuvette with dissolved sample. Because of the geometryof the optical system, a typical fused absorption cuvette with two opaque sidescannot be used; instead, special fluorescence cuvettes with four translucent
90°
Emission
monochromator
Phototube
Recorder or printer
Excitation
monochromatorOptical
systemSample
Slits
Light
source
FIGURE 7.13 Adiagram of a typicalspectrofluorometer.

Chapter 7 • Spectroscopic Analysis of Biomolecules 223
quartz or glass sides must be used. When the excitation light beam impinges onthe sample cell, molecules in the solution are excited and some will emit light.
Light emitted at right angles to the incoming beam is analyzed by the emis-sion monochromator. In most cases, the wavelength analysis of emitted light iscarried out by measuring the intensity of fluorescence at a preselectedwavelength (usually the wavelength of emission maximum). The analyzermonochromator directs emitted light of only the preselected wavelength towardthe detector. A photomultiplier tube serves as a detector to measure the intensityof the light. The output current from the photomultiplier is fed to some measur-ing device that indicates the extent of fluorescence. The final readout is not interms of Q, but in units of the photomultiplier tube current (microamperes) or inrelative units of percent of full scale. Therefore, the scale must be standardizedwith a known. Some newer instruments provide, as output, the ratio of emittedlight to incident light intensity.
Applications of Fluorescence Spectroscopy
Two types of measurements are most common in fluorescence experiments,measurements of relative fluorescence intensities and measurements of thequantum yield. Most experiments require only relative fluorescence intensitymeasurements, and they proceed as follows. The fluorometer is set to “zero” or“full scale” fluorescence intensity (microamps or %) with the desired biochemicalsystem under standard conditions. Some perturbation is then made in the system(pH change, addition of a chemical agent in varying concentrations, change ofionic strength, etc.), and the fluorescence intensity is determined relative to thestandard conditions. This is a straightforward type of experiment because it con-sists of replacing one solution with another in the fluorometer and reading thedetector output for each. For these experiments, the excitation wavelength andthe emission wavelength are preselected and set for each monochromator.
The measurement of quantum yield is a more complicated process. Beforethese measurements can be made, the instrument must be calibrated. A thermopileor chemical actinometer may be used to measure the absolute intensity of incidentlight on the sample. Alternatively, quantum yields may be measured relative tosome accepted standard. Two commonly used fluorescence standards are quininesulfate in and fluorescein in The quantum yield of the unknown, is then calculated by Equation 7.8.
>> (Eq. 7.8)
where
quantum yield of unknownquantum yield of standardexperimental fluorescence intensity of unknownexperimental fluorescence intensity of standard
Some biomolecules are intrinsic fluors; that is, they are fluorescent them-selves. The amino acids with aromatic groups (phenylalanine, tyrosine, and
Fstd =Fx =Qstd =Qx =
Qx
Qstd=Fx
Fstd
Qx,0.1MNaOH 1Q = 0.932.0.5MH2SO4 1Q = 0.702
224 Chapter 7 • Spectroscopic Analysis of Biomolecules
tryptophan) are fluorescent; hence, proteins containing these amino acids haveintrinsic fluorescence. The purine and pyrimidine bases in nucleic acids (ade-nine, guanine, cytosine, uracil, thymine) and some coenzymes arealso intrinsic fluors. Intrinsic fluorescence is most often used to study proteinconformational changes (protein folding) and to probe the location of active sitesand coenzymes in enzymes.
Valuable information can also be obtained by the use of extrinsic fluors.These are fluorescent molecules that are added to the biochemical systemunder study. Many fluorescent dyes have enhanced fluorescence when theyare in a nonpolar solution or bound in a rigid hydrophobic environment.Some of these dyes bind to specific sites on proteins or nucleic acid molecules,and the resulting fluorescence intensity depends on the environmental condi-tions at the binding site. Extrinsic fluorescence is of value in characterizing thebinding of natural ligands to biochemically significant macromolecules. Thisis because many of the extrinsic fluors bind in the same sites as natural lig-ands. Extrinsic fluorescence has been used to study the binding of fatty acidsto serum albumin, to characterize the binding sites for cofactors and sub-strates in enzyme molecules, to characterize the heme binding site in varioushemoproteins, and to study the intercalation of small molecules into the DNAdouble helix.
Figure 7.14 shows the structures of extrinsic fluors that have been of valuein studying biochemical systems. ANS, dansyl chloride, and fluorescein are usedfor protein studies, whereas ethidium, proflavine, and various acridines are use-ful for nucleic acid characterization. Ethidium bromide has the unique character-istic of enhanced fluorescence when bound to double-stranded DNA but not tosingle-stranded DNA. Aminomethyl coumarin (AMC) is of value as a fluoro-genic leaving group in measuring peptidase activity.
Difficulties in Fluorescence Measurements
Fluorescence measurements have much greater sensitivity than absorptionmeasurements. Therefore, the experimenter must take special precautions inmaking fluorescence measurements because any contaminant or impurity in thesystem can lead to inaccurate results. The following factors must be consideredwhen preparing for a fluorescence experiment.
Preparation of Reagents and Solutions
Since fluorescence measurements are very sensitive, dilute solutions of biomole-cules and other reagents are appropriate. Special precautions must be taken tomaintain the integrity of these solutions. All solvents and reagents must bechecked for the presence of fluorescent impurities, which can lead to large errorsin measurement. “Blank” readings should be taken on all solvents and solutions,and any background fluorescence must be subtracted from the fluorescence ofthe complete system under study. Solutions should be stored in the dark, in cleanglass-stoppered containers, in order to avoid photochemical breakdown of thereagents and contamination by corks and rubber stoppers. Some biomolecules,especially proteins, tend to adsorb to glass surfaces, which can lead to loss of
1NAD+ , FAD2

Chapter 7 • Spectroscopic Analysis of Biomolecules 225
fluorescent material or to contamination of fluorescence cuvettes. All glasswaremust be scrupulously cleaned. Turbid solutions must be clarified by centrifuga-tion or filtration.
Control of Temperature
Fluorescence measurements, unlike absorption, are temperature dependent. Allsolutions, especially if relative fluorescent measurements are taken, must bethermostated at the same temperature.
C. NUCLEAR MAGNETIC RESONANCE SPECTROSCOPY
Nuclear magnetic resonance (NMR) spectroscopy is a method of absorptionspectroscopy that has some characteristics similar to ultraviolet and visible spec-troscopy, but also some that are unique. In NMR, a molecular sample, usuallydissolved in a liquid solvent, is placed in a magnetic field and the absorption ofradio-frequency waves by certain nuclei (protons and others) is measured. NMR
_
O
O
OS NH
OHO O
COOH
N+ Br _
C2H
5
NH2
H2N
O OS
N(CH3)2
Cl
CH3
O2HN O
N(CH3)2N N(CH
3)2
1-Anilino-8-naphthalene
sulfonate (ANS) Dansyl chloride
FluoresceinAminomethyl coumarin
(AMC)
Ethidium bromide
Acridine orangeFIGURE 7.14Molecules useful asextrinsic fluors inbiochemical studies.

226 Chapter 7 • Spectroscopic Analysis of Biomolecules
spectroscopy was originally developed as an analytical tool to determine molec-ular structure by monitoring the environment of individual protons. The relativepositions and intensity of absorption signals provide detailed information fromwhich chemical structures may be elucidated. Early proton NMR studies focusedprimarily on small organic molecules, some of which had biological origin andsignificance. Since most biomolecules have a very large number of protons, theobserved spectra are extremely complex and difficult to interpret. With theadvent of modern techniques—superconducting magnets, Fourier transformanalysis, multidimensional spectra, and powerful computer control—NMR hasbecome an important method for the study of biological macromolecules. Thefundamental principles, instrumentation, and biochemical applications for NMRwill be outlined here.
NMR Theory
All nuclei possess a positive charge. For some nuclei, this charge confers theproperty of spin, which causes the nuclei to act like tiny magnets. The angularmomentum of the spin is described by the quantum spin number I. If I is an inte-gral number ( 1, 2, etc.), then there is no net spin and no NMR signal forI = 0,that nucleus. However, if I is half-integral the nuclei havespins, and when placed in a magnetic field, the spins orient themselves with(parallel) or opposed (antiparallel) to the external magnetic field. The nucleialigned with the magnetic field have lower energy (are more stable) than thoseopposed. Energy in the radio-frequency range is sufficient to flip the nuclei fromthe parallel to the antiparallel alignment. The NMR instrument is designed tomeasure the energy difference between the nuclear spin states. Absorption ofenergy may be detected by scanning the radio-frequency range and measuringthe absorption that causes spin state transition (resonance). Modern NMR instru-ments instead maintain a constant radio-frequency and electrically induce smallchanges in the strength of the magnetic field until resonance is attained. Thepoint of resonance for a nucleus is dependent upon the electronic environment ofthat nucleus, so an NMR spectrum provides information that helps elucidatebiochemical structures.
NMR in Biochemistry
NMR has found a wide variety of applications in biochemistry. Proton NMR hasa long and rich history in organic chemistry and biochemistry. The structures ofmany small but significant biomolecules were elucidated by proton NMR.Protons on different atoms and in different molecular environments absorb energyof different levels (measured by radio-frequency units or magnetic field units).Two experimentally measured characteristics, chemical shifts and spin-spincoupling, provide important structural information. The chemical shift of anabsorbing nucleus, measured in parts per million (ppm), is the spectral positionof resonance relative to a standard signal, usually tetramethylsilane. The NMRsignal for a proton is “split” by interactions with neighboring protons. This char-acteristic, called spin-spin coupling, helps to determine positions and numbersof equivalent and nonequivalent protons.
1d2
1I = 1>2 ,3>2 ,5>2 , etc.2,

Chapter 7 • Spectroscopic Analysis of Biomolecules 227
TABLE 7.1 Nuclei Important in Biochemical NMR
Isotope1 Natural Abundance (%)2 Relevant Biomolecules
1H 100 Most biomolecules13C 1 Most biomolecules
15N 0.4 Amino acids, proteins, nucleotides
19F 100 Substitute for H
31P 100 Nucleotides, nucleic acids, and other phosphorylated compounds
1All have a spin of 1⁄2.2The percentage of this isotope in naturally occurring molecules containing this element.
NMR experiments are not limited to the study of protons. Resonance sig-nals from other atomic nuclei including and can be detected andmeasured (see Table 7.1). NMR techniques have been especially valuable forthe study of carbohydrate, amino acid, and fatty acid structures. Just as withprotons, each distinct carbon atom in a molecule yields a signal that is split byneighboring interacting nuclei (see Figure 7.15). Because of the low natural abun-dance of the isotope, it is necessary either to enrich the content by chem-ical synthesis or to use powerful computers and magnets (500–600 MHz). The
spectra of phosphorylated biomolecules display a peak for each type of phos-phorus (Figure 7.16). NMR instruments now have the sensitivity necessary tomeasure the in vivo concentrations and reactions of biomolecules in cells. Forexample, the catabolism of glucose by glycolysis in erythrocytes has been moni-tored by NMR, and the involvement of ATP in phosphoryl-group transferprocesses has been studied by NMR (see Figure 7.16).
NMR and Protein Structures
New computer techniques in data analysis and improvements in instrumenta-tion have now made it possible to carry out detailed structural and conforma-tional studies of all biopolymers, but especially proteins. NMR, which may bedone on noncrystalline materials in solution, provides a technique complemen-tary to X-ray diffraction, which requires crystals for analysis. An advantage ofNMR is that proteins can be studied in solution in an environment that mimicsthat in the living cell. One-dimensional NMR, as described to this point, can beapplied to structural analysis of smaller molecules. But proteins and othercomplex biopolymers with large numbers of protons will yield very crowdedspectra with many overlapping lines. In multidimensional NMR (2-D, 3-D, 4-D), peaks are spread out through two or more axes to improve resolution.Protein structure determination depends on several homonuclear NMR experiments: correlation spectroscopy (COSY), nuclear Overhausereffect spectroscopy (NOESY), 2-D total correlation spectroscopy (TOCSY),foldover-corrected spectroscopy (FOCSY), spin-echo correlation spec-troscopy (SECSY), and others. These computational techniques are based on
2-D 1H
31P
13C
31P
13C13C
13C
31P13C, 15N, 19F,

228 Chapter 7 • Spectroscopic Analysis of Biomolecules
10 9 8 7 6 5 4 3 2 1 0
200 160180 140 120 100 80 60 40 20 0QE-300D2O + DCI
L-Valine, 99% CH3H2N
CH3 CH
OH
C C OH
10 9 8 7 6 5 4 3 2 1 0
200 160180 140 120 100 80 60 40 20 0QE-300D2O
Sucrose, 99+%
B
A
CH2OH
HOCH2
O
OH
HO
OH
O O
HO
OH
CH2OH
4
5
6
32
1
6
5
2
134
′′
′′′
′
FIGURE 7.15 and FT-NMR spectra of biomolecules. The lower spectra are for showing appm scale of 0–10. TMS standard is at 0 ppm. The upper spectra are for showing a ppm scale of0–200. A. L-valine in Can you assign each peak to the correct protons and carbon atoms inthe valine structure? Hint: The carboxyl carbon of valine has a peak at about 175 ppm. B. Sucrose in
Carbon numbers in the chemical structure correspond to the following peaks in order from 0 to120 ppm: Reprinted with permission ofAldrich Chemical Co., Inc.
C-6; C-1'; C-6 '; C-4; C-2; C-5; C-3; C-4 '; C-3 '; C-5 '; C-1; C-2 '.D2O.
D2O + DCl.
13C
1H13C1H
the observation that nonequivalent protons interact with each other. By usingmultiple-pulse techniques, it is possible to perturb one nucleus and observe theeffects on the spin states of other nuclei. The availability of powerful comput-ers, strong magnets, and Fourier transform (FT) calculations makes it possibleto elucidate structures of proteins up to one million daltons, and there is futurepromise for studies on larger proteins. In addition to structural studies, NMR
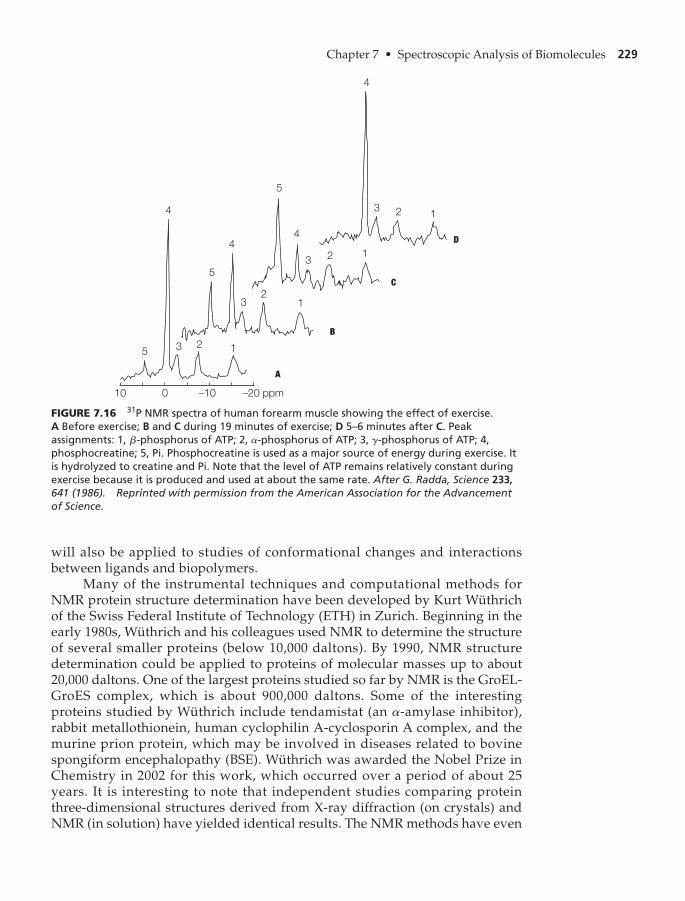
Chapter 7 • Spectroscopic Analysis of Biomolecules 229
will also be applied to studies of conformational changes and interactionsbetween ligands and biopolymers.
Many of the instrumental techniques and computational methods forNMR protein structure determination have been developed by Kurt Wüthrichof the Swiss Federal Institute of Technology (ETH) in Zurich. Beginning in theearly 1980s, Wüthrich and his colleagues used NMR to determine the structureof several smaller proteins (below 10,000 daltons). By 1990, NMR structuredetermination could be applied to proteins of molecular masses up to about20,000 daltons. One of the largest proteins studied so far by NMR is the GroEL-GroES complex, which is about 900,000 daltons. Some of the interestingproteins studied by Wüthrich include tendamistat (an -amylase inhibitor),rabbit metallothionein, human cyclophilin A-cyclosporin A complex, and themurine prion protein, which may be involved in diseases related to bovinespongiform encephalopathy (BSE). Wüthrich was awarded the Nobel Prize inChemistry in 2002 for this work, which occurred over a period of about 25years. It is interesting to note that independent studies comparing proteinthree-dimensional structures derived from X-ray diffraction (on crystals) andNMR (in solution) have yielded identical results. The NMR methods have even
a
FIGURE 7.16 NMR spectra of human forearm muscle showing the effect of exercise. A Before exercise; B and C during 19 minutes of exercise; D 5–6 minutes after C. Peakassignments: 1, -phosphorus of ATP; 2, -phosphorus of ATP; 3, -phosphorus of ATP; 4,phosphocreatine; 5, Pi. Phosphocreatine is used as a major source of energy during exercise. Itis hydrolyzed to creatine and Pi. Note that the level of ATP remains relatively constant duringexercise because it is produced and used at about the same rate. After G. Radda, Science 233,641 (1986). Reprinted with permission from the American Association for the Advancementof Science.
gab
31P
1235
4
10 0 _10 _20 ppm
5
4
32
1
5
4
3 2 1
B
C
3 2 1
4
D
A

230 Chapter 7 • Spectroscopic Analysis of Biomolecules
been used to correct structural mistakes made in the X-ray diffraction method.Protein NMR is now a very active research area and more than 7000 NMR-derived protein structures had been submitted to the Protein Data Bank (PDB)(www.rcsb.org/pdb) by the year 2010. The current total of protein structuressubmitted to the PDB is over 66,000.
The complex principles and techniques behind Wüthrich’s studies are bestdescribed in his own words (Wüthrich, 2001):
“Four principal elements are combined in the NMR method for protein structuredetermination: (i) the nuclear Overhauser effect (NOE) as an experimentallyaccessible NMR parameter in proteins that can yield the information needed for denovo global fold determination of a polymer chain; (ii) sequence-specific assignmentof the many hundred to several thousand NMR peaks from a protein; (iii) computa-tional tools for the structural interpretation of the NMR data and the evaluation ofthe resulting molecular structures; and, (iv) multidimensional NMR techniques forefficient data collection.”
The preparation of a protein sample for NMR studies is relativelystraightforward; however, a rather large amount of protein is required com-pared to mass spectrometry and X-ray crystallography. For NMR analysis, theprotein is usually dissolved in water at concentrations of 3–6 mM. The proteinsolution may be adjusted to the ionic strength, pH, and temperature foundunder physiological conditions. Samples as small as 0.5 mL are sufficient foranalysis.
D. MASS SPECTROMETRY
Mass spectrometry (MS) is similar to NMR in that it has historically been of greatvalue in the structure elucidation of relatively small (MW limit around 1000)organic and biomolecules. Only in the last 15 years has the tool of MS beenapplied to the analysis of biological macromolecules. The MS analysis of proteinsand other biopolymers was initially hindered because analytes are usually meas-ured in the gas phase and it was very difficult to vaporize these large molecules.The development of new methods for sample preparation (ionization), multi-quadrupole analysis, tandem MS instruments, and powerful computers nowmakes it possible to study large molecules, especially proteins.
Ionization and Analysis of Proteins
The mass spectrometer generally consists of three components that are linkedtogether: an ionization device, a mass analyzer, and an ion detector (Figure 7.17).Neutral molecules are ionized, and their positively charged ion products aredirected through an electric and/or magnetic field, where they are separated(analyzed) on the basis of their mass-to-charge ratio A detector thenrecords the ions after separation. The “spectrum” generated by MS displays ionintensity as a function of m/z.
1m>z2.

Chapter 7 • Spectroscopic Analysis of Biomolecules 231
Ionization of small organic and biological molecules prior to MS analysis isdone by electron impact; however, ionization of nonvolatile, biological macromole-cules like peptides, proteins, and nucleic acids requires special treatment. In the late1980s, John Fenn, now at Virginia Commonwealth University, and Koichi Tanaka ofthe Shimadzu instrument company in Kyoto, Japan, introduced methods for the“soft ionization” of macromolecules. These methods are labeled “soft,” as they causeminimal degradation to the sample during ionization. Fenn introduced theelectrospray ionization (ESI) method, in which a solution of the sample is sprayedfrom a metal needle or capillary tip held at a potential of about volts. Thisresults in a spray of tiny droplets containing positively charged ions. The solventevaporates, and the ions are directed into the analyzer for separation. Tanakademonstrated that pulses from a nitrogen laser could be used to ionize proteins froma surface (soft laser desorption, SLD). Because ESI and SLD are liquid-phaseprocesses, the samples may be those purified by HPLC or CE. Fenn and Tanaka wereawarded the Chemistry Nobel Prize (shared with K. Wüthrich) for this work in 2002.
Laser desorption has now been modified by Franz Hillenkamp of theUniversity of Münster, Germany, to a solid phase method, matrix-assisted laserdesorption ionization (MALDI), which is the most widely used technique forprotein analysis. In MALDI, the sample is placed in a matrix of small organicmolecules and irradiated by a laser pulse. The matrices absorb the laser energy,
+5000
Source
Inlet
Sample
Introduction
Vacuum
Pumps
% Intensity
m/z
Data
Handling
Gas Phase Ions
Ion
Detector
Ion Detection
Analyzer
Ion Sorting
Data System
FIGURE 7.17 Thecomponents of amass spectrometer.The final dataoutput consists of agraph of ionintensity versus Mass spectrometry,unlike the othertechniquesdescribed in thischapter, does notinvolve interactionof molecules withelectromagneticradiation; however,it has traditionallybeen combinedwith thespectrophotometrictechniques.
m>z.

232 Chapter 7 • Spectroscopic Analysis of Biomolecules
causing ionization of the macromolecular sample. A common practice is the useof protein samples obtained from 1-D and 2-D PAGE gels.
Several types of mass analyzers are used for ion separation, including time-of-flight (TOF), quadrupoles, and ion traps. In TOF-MS, the most widely usedtechnique, each ion produced has the same initial kinetic energy, but the speedvaries with mass. Mass is determined by measurement of an ion’s time-of-flightto the detector.
MS Applications in Biochemistry
MS is becoming a standard tool in the analysis of biological molecules andbiological processes. Many of the applications of MS described below involvecombining the technique with sample preparation and purification by HPLC,CE, and PAGE (especially 2-DE). (See section on proteomics, Chapter 6,Section B, p. 184.)
1. Identification of Peptides and Proteins Protein identification is perhapsthe most widely used MS application at the present time. The most impor-tant ions resulting from the removal of an electron by ionization proce-dures are the positively charged molecular ions or protonatedmolecular ions Measurement of the molecular mass of thesespecies provides the molecular weight of the original molecule. The accu-racy of this method for molecular weight determination is about 0.01%.(Molecular mass measurements using gel filtration typically have accuraciesno greater than 5–10%.) Some molecular ions are unstable and disintegrateto produce fragment ions. These fragmentation processes are useful instructural elucidation of smaller molecules. It should be expected that pro-teomic studies will be enhanced by coupling SDS-PAGE and 2-DE (forseparation and purification) with further size analysis of the proteins byMALDI-TOF.
One MS method for peptide identification is called peptide mass fin-gerprinting. The unknown sample is digested with the proteolytic enzymetrypsin to produce fragments that are analyzed by MALDI-MS. The result-ing spectrum displays the masses of the peptide fragments. This may beused as a “fingerprint” of the sample and compared with known fragmentedpatterns in a sequence database.
2. Characterization of Post-Translational Modification Processes Aftertranslation, proteins in the cell are often modified by covalent attachmentof specific functional groups. Such processes might include:(a) phosphorylation of hydroxyl groups in serine and tyrosine residues, or(b) addition of carbohydrate residues (glycosylation) to the hydroxyl
groups of serine or threonine or to the amide nitrogen of asparagineresidues.
These chemical modifications can easily be detected by MS, as the additionof a phosphoryl group adds about 80 daltons to the molecularmass of a protein, whereas addition of a glucose residue adds about180 daltons.
1¬PO2-3 2
1M + nH2n- .1M +2

Chapter 7 • Spectroscopic Analysis of Biomolecules 233
3. Peptide Sequencing Small peptides and proteins may be sequenced byMS procedures. The peptide sample is ionized and fragmented at thepeptide bonds by collision-induced dissociation. Size analysis of the seriesof fragments produced leads to the sequence of amino acids.
4. Protein-protein Interactions One of the most important goals of pro-teomics is to study how proteins interact with each other in order to initiatebiological processes. ESI-MS and MALDI-TOF are currently being used toinvestigate how proteins associate to form biologically active multisubunitcomplexes.
E. X-RAY CRYSTALLOGRAPHY
Historically, X-ray crystallography has been the most important tool for study-ing the three-dimensional structures of biomolecules. In fact, this technique wasthe only method available for determining macromolecular structures until theapplication of NMR in the 1980s. Protein crystals were first studied by X-raycrystallography in 1934 by J. D. Bernal and Dorothy Crowfoot Hodgkin.However, the diffraction patterns were extremely complex, and computers werenot available for complete analysis of the proteins. John Kendrew, a biochemistworking at Cambridge University, announced the first three-dimensional struc-ture of a protein, sperm whale myoglobin, in 1958. Kendrew had determined thecomplex structure of the protein (153 amino acid residues) after several years ofanalysis by X-ray crystallography. Other important biomolecules that were stud-ied by X-ray crystallography include DNA (Rosalind Franklin and MauriceWilkins) and vitamin (Dorothy Crowfoot Hodgkin). Analysis of proteinstructures is now routine. As of July 2010, the Protein Data Bank(www.rcsb.org/pdb) had registered approximately 66,000 proteins—about56,000 were obtained by X-ray crystallography and about 10,000 by NMR.Although the number of structures derived by NMR is growing faster than thenumber derived by X-ray crystallography, crystallography is still an importantsource of structural data.
Methodology of X-ray Crystallography
An X-ray crystallography analysis requires three components (see Figure 7.18):(1) a protein crystal, (2) an X-ray source, and (3) a detector (i.e., radiation detectoror photographic film).
B12
X-ray source DetectorBeam of
X-rays
Single protein
crystal
Diffracted
X-rays
FIGURE 7.18 Thecomponentsrequired foranalysis of proteinstructure by X-raycrystallography.

234 Chapter 7 • Spectroscopic Analysis of Biomolecules
Protein Crystals
For many proteins, this can be the most difficult step in three-dimensional analy-sis. The factors important in protein crystallization are not yet fully understood,so the methodology for growing crystals is still an art and involves much trialand error. Crystallization usually occurs best in a saturated or supersaturatedsolution of the protein. A common method often used involves changing solu-tion conditions by adding a precipitant (like ammonium sulfate), changing thepH, or changing the ionic strength. The crystallization process may be hastenedby dialysis of the protein against a solution containing the precipitating factor.
Data Collection and Analysis
The theory supporting X-ray crystallography is quite complex and beyond thescope of this text; however, some practical aspects can be described. The crystalis mounted in the diffractometer and bombarded by a collimated beam of X-rays.The crystal is rotated so that it is struck from many different directions. Many ofthe X-rays passing into the sample are diffracted (scattered) when they en-counter electrons associated with atoms. The diffracted beams impinge upon thedetector and are recorded. The data at this point are in the form of a regular arrayof spots called reflections. (Kendrew’s pattern of myoglobin had nearly 25,000reflections, which were analyzed by computer in order to construct the 3-Dimage of the protein.) The extent of scatter of the reflections depends on the sizeand position of each atom in the crystal. By extensive computer and mathemati-cal analysis (by Fourier transform) of the angle of scatter and of the pattern col-lected by the detector, it is possible to construct an electron density map of theprotein molecule showing the arrangement of the atoms. Using modern equip-ment and computer software, an analyst can collect data and determine a struc-ture in a day or two.
Although X-ray analysis of proteins is slowly being replaced by NMR,there will continue to be interest in and a need for X-ray analysis of very largeand unsymmetrical proteins and other biomolecules. NMR does have someadvantages in structure determination—sample preparation is rapid andstraightforward, and the sample may be studied under physiological-like condi-tions. Numerous comparative studies have confirmed that the analysis of anidentical protein by X-ray and NMR leads to the same three-dimensional result,even though one is done in the solid state and one in the liquid state.
Study Problems
1. For each pair of wavelengths listed below, specify which one is higher in energy.(a) 1 nm (X-ray) or 10,000 nm (IR)(b) 280 nm (UV) or 360 nm (VIS)(c) 200,000 nm (microwave) or 800 nm (VIS)
2. In a laboratory experiment, you are asked to determine the molar concentration of a solu-tion of an unknown compound, X. The solution diluted in half by water (1 mL of X and1 mL of ) has an absorbance at 425 nm of 0.8 and a molar extinction coefficient of
What is the molar concentration of the original solution of X?1.5 * 103M -1 cm-1.H2O

Chapter 7 • Spectroscopic Analysis of Biomolecules 235
3. Match the spectral region listed below with the appropriate molecular transition thatoccurs. The first problem is worked as an example.
Spectral region Transition
a 1. X-rays a. inner-shell electrons
__2. UV b. molecular rotations
__3. VIS c. valence electrons
__4. IR d. molecular vibrations
__5. microwave
4. Explain the differences between a spectrophotometer that uses a phototube for adetector and one that uses a photodiode array detector.
5. Several spectroscopic techniques were studied in this chapter. Which experimentaltechniques involve an actual measurement of radiation absorbed?(a) UV-VIS spectroscopy(b) NMR spectroscopy(c) MS(d) Fluorescence spectroscopy
6. Why can you not use a glass cuvette for absorbance measurements in the UV spectralrange?
7. What single structural characteristic do all of the fluorescent molecules in Figure 7.14possess?
8. Study the spectrum of valine in Figure 7.15 and match each peak to the correspon-ding proton in the chemical structure. Explain any spin-spin coupling.
9. Why must a cuvette with four translucent sides be used for fluorescencemeasurements?
10. Study the spectrum of valine in Figure 7.15. Identify the carbon atom thatproduces each peak in the spectrum.
13C
1H
Further Reading
C. Arnaud, Chem. Eng. News, October 2, 17–25 (2006), “Mass Spec Tackles Proteins.”J. Berg, J. Tymoczko, and L. Stryer, Biochemistry, 6th ed. (2007), Freeman and Company
(New York). Application of NMR, X-ray, and MS to biochemistry.D. Beussman et al., Biochem. Mol. Biol. Educ. 37, 49–55 (2008). “Identifying gel-separated
proteins using in-gel digestion, mass spectrometry, and database searching.”S. Borman, Chem. Eng. News, December 3, 11 (2007), “Probing Large Protein Systems.”A. Burlingame, S. Carr, and M. Baldwin, Mass Spectrometry in Biology and Medicine
(2000), Humana Press (Totowa, NJ).J. Cavanagh et al., Protein NMR Spectroscopy, 2nd ed. (2006), Academic Press
(Burlington, MA).E. De Hoffmann, and V. Stroobant, Mass Spectrometry: Principles and Applications, 2nd
ed. (2001), John Wiley & Sons (New York).E. Eberhardt et al., Biochem. Mol. Biol. Educ. 31, 402–409 (2003). “Preparing
Undergraduates to Participate in the Post-Genome Era: A Capstone LaboratoryExperience in Proteomics.”
R. Ekman (Editor) et al. Mass Spectrometry: Instrumentation, Interpretation andApplications, (2008), John Wiley (Hoboken, NJ).

236 Chapter 7 • Spectroscopic Analysis of Biomolecules
F. Finehout and K. Lee, Biochem. Mol. Biol. Educ 32, 93–100 (2004). “An Introduction toMass Spectrometry Applications in Biological Research.”
R. Garrett and C. Grisham, Biochemistry, 4th ed. (2010), Brooks/Cole (Belmont, CA),Introduction to UV-VIS, NMR, and MS.
B. Giles et al., J. Chem. Educ. 76, 1564–1566 (1999). “An In Vivo NMR Analysis of theAnaerobic Yeast Metabolism of 1- -Glucose.”
G. Hammes, Spectroscopy for the Biological Sciences, (2005), Wiley-Interscience (New York).M. Kinter and N. Sherman, Protein Sequencing and Identification Using Tandem Mass
Spectrometry (2000), Wiley-Interscience (New York).N. Krishna and L. Berliner, Protein NMR for the Millennium (2003), Plenum (New York).
Advances in protein NMR.M. Mann and A. Pandley, Trends Biochem. Sci. 26, 54–61 (2001). “Use of Mass Spectrometry-
Derived Data to Annotate Nucleotide and Protein Sequence Databases.”M. Mann et al., Ann. Rev. Biochem. 70, 437–473 (2001). “Analysis of Proteins and
Proteomes by Mass Spectrometry.”D. Nelson, and M. Cox, Lehninger Principles of Biochemistry, 5th ed. (2009), Freeman
(New York). Introduction to spectroscopy.A. Pavia, G. Lampman, and G. Kriz, Introduction to Spectroscopy, 3rd ed. (2000), Brooks/
Cole (Pacific Grove, CA). An introductory textbook.K. Peterman, K. Lentz, and J. Duncan, J. Chem. Educ. 75, 1283–1284 (1998). “A NMR
Study of Enzyme Activity.”N. Price, R. Dwek, M. Wormald, and R. Ratcliffe, Principles and Problems in Physical
Chemistry for Biochemists, 3rd ed. (2002), Oxford University Press (Oxford). Anintroduction to spectroscopy with theory and applications.
G. Radda, Science, 233, 640–645 (1986). “The Use of NMR Spectroscopy for theUnderstanding of Disease.”
D. Sheehan, Physical Biochemistry: Principles and Applications, 2nd ed. (2009), Wiley-Blackwell (Hoboken, NJ).
I. Tinoco, K. Sauer, J. Wang, and J. Puglisi, Physical Chemistry: Principles andApplications in Biological Sciences, 4th ed. (2002), Prentice-Hall (Upper SaddleRiver, NJ). Chapter 10 covers all areas of spectroscopy.
D. Voet and J. Voet, Biochemistry, 3rd ed. (2005), John Wiley & Sons (Hoboken, NJ), pp. 172–175, 240–244. NMR, X-ray, and MS in biochemistry.
D. Voet, J. Voet, and C. Pratt, Fundamentals of Biochemistry, 3rd ed. (2008), John Wiley &Sons (Hoboken, NJ). NMR, MS, and X-ray in biochemistry.
K. Wilson and J. Walker, Editors, Principles and Techniques of Practical Biochemistry, 5thed. (2000), Cambridge University Press (Cambridge, UK). Chapter 6 covers X-raydiffraction. Chapter 9 covers atomic and molecular electronic spectroscopy.Chapters 10 and 11 cover NMR and MS.
K. Wüthrich, Nat. Struct. Biol 8, 923–925 (2001). “The Way to NMR Structures ofProteins.”
K. Wüthrich, J. Biol. Chem. 265, 22059–22062 (1990). “Protein Structure Determination inSolution by NMR Spectroscopy.”
http://www.scienceofspectroscopy.info/index.htmThe Science of Spectroscopy, funded by NASA.
http://www.cis.rit.edu/htbooks/nmrThe basics of NMR.
http://www.asms.orgWeb site for the American Society of Mass Spectrometry.
19F
13C
13C

Chapter 7 • Spectroscopic Analysis of Biomolecules 237
http://www.rcsb.org/pdbThis Web site, the Protein Data Bank, is the single repository for the three-dimensional
structures of proteins and nucleic acids.
http://www.spectroscopynow.com/coi/cda/home.cda?chId=0Resource for spectroscopy.
http://biop.ox.ac.uk/www/mol_of_life/index.htmlThe Molecules of Life.
http://www.ebi.ac.uk/thornton-srv/software/PROCHECKNMR for protein structures.
www.thermo.com/nanodropInformation on nanodrop spectrometers.
Additional Web sites for this chapter are available on the book’s Companion Website,which can be found at http://www.chemplace.com.

This page intentionally left blank

8BIOMOLECULAR INTERACTIONS:LIGAND BINDING AND ENZYMEREACTIONS
239
Many of the dynamic processes occurring in biological cells and organisms are theresult of interactions between molecules. Most often, these interactions involve thebinding of a molecule or ion to a specific site (or sites) on a macromolecule, usually
a protein or nucleic acid. The binding forces that hold the molecules together are noncovalentand they include hydrogen bonding, van der Waals forces, electrostatic bonds, and hydropho-bic interactions. Usually the combination of the two molecules (formation of a complex) willlead to a specific biological action or response. For example, a hormonal response is the resultof the hormone molecule interacting with its receptor protein; a chemical transformation inmetabolism is the consequence of the initial binding of a substrate to an enzyme, forming anES complex.
A. LIGAND-MACROMOLECULE INTERACTIONS (MOLECULAR RECOGNITION)
Throughout our study of biochemistry we will encounter many examples where noncovalentinteractions bring together, in specific ways, two different molecules that form a complex.Such molecules display a phenomenon called molecular recognition. The importance of theseinteractions in biology is that the combination of two molecules will lead to some biologicalaction. The action of hormones provides an excellent example. A hormonal response is the
A. Ligand-Macromolecule Interactions (Molecular Recognition) 239B. Biological Catalysis (Enzymes) 250
Study Problems 262Further Reading 264
C H A P T E R

240 Chapter 8 • Biomolecular Interactions: Ligand Binding and Enzyme Reactions
consequence of a weak, but specific, interaction between the molecule and areceptor protein in the membrane of the target cell. The biochemical responsemay often be an enhancement in production of an enzyme needed for metabo-lism (signal transduction). Another example of molecular recognition is theinteraction that brings together a substrate molecule with an enzyme. Before ametabolic reaction can occur, a substrate molecule must physically interact in acertain well-defined manner with the macromolecular catalyst, an enzyme. Thebiochemical action of drugs also depends on molecular recognition. A drug isfirst distributed throughout the body via the bloodstream. Drug molecules in thebloodstream are often bound to plasma proteins (e.g., serum albumin), which actas carriers. When the drug molecules are transported to their site of action, asecond molecular interaction is likely to occur. Many drugs elicit their effects byinterfering with biochemical processes. This may take the form of enzyme inhibi-tion, where the drug molecule binds to a specific enzyme and prohibits catalyticaction. Table 8.1 lists several other molecular recognition events that lead tosome dynamic biochemical action. Details of these processes may be found inyour biochemistry textbook.
Properties of Noncovalent Binding Interactions
The process of molecular recognition may be defined by a simple, reversiblereaction that brings together a ligand (L) and a macromolecule (M) (R, for recep-tor, in some textbooks):
>> (Eq. 8.1)
LM represents a complex, held together by noncovalent interactions, that has aspecialized biological function. The ligand is usually a relatively small molecule(hormone, substrate, inhibitor, drug, coenzyme, metal ion, etc.), but not always.Examples of large ligands include protein substrates that are cleaved by aprotease, a protein molecule that binds to DNA as a transcription regulator, orlarge antigens that interact with antibodies.
L + M Δ LM ¡ Biological response
TABLE 8.1 Examples of LM Interactions and Their Biological Responses
Type of Interaction (Ligand:Macromolecule) Biological Significance or Response
Substrate:enzyme Metabolic reactions
Inhibitor:enzyme Metabolic regulation
Allosteric effector:enzyme Metabolic regulation
Coenzyme:enzyme Metabolic reactions
Hormone:receptor protein Metabolic regulation; signal transduction
Antigen:antibody Immune response
Ligand:carrier or transport protein Storage or transport
Drug:protein or nucleic acid Disease treatment
Regulatory protein:DNA Transcription regulation

Chapter 8 • Biomolecular Interactions: Ligand Binding and Enzyme Reactions 241
All molecular interactions that are the basis of molecular recognition haveat least three common characteristics:
1. The binding forces that hold the complex together are noncovalent and rel-atively weak. Four types of noncovalent bonds are important:(a) hydrogen bonds(b) van der Waals forces(c) hydrophobic interactions(d) ionic or electrostatic bonds
Properties and examples of these interactions are reviewed in Table 8.2. Thestrengths of noncovalent binding forces are in the range of 1–30 kJ/mol, com-pared to about 350 kJ/mol for a carbon–carbon single bond, a typical covalentbond. A single, noncovalent bond is usually insufficient to hold two moleculestogether. Typical biopolymers that may serve as macromolecules—DNA,
TABLE 8.2 Properties and Examples of Noncovalent Binding Forces
Type Brief Description and ExampleStabilizationEnergy (kJ/mol) Length (nm)
(i) Hydrogenbonds
Between a hydrogen atom bonded to an electro-negative atom and a second electronegative atom
10–30 0.2–0.3
Between neutral groups
C O H
H
O
H
Between peptide bonds
H NC O
(ii) van derWaalsinteractions
Between molecules with temporary dipoles inducedby fluctuating electrons. This may occur between any two atoms in close proximity.
1–5 0.1–0.2
(iii) Hydrophobicinteractions
The presence of water forces nonpolar groups intoordered arrangements to avoid the water.
5–30 —
CH
CH2
CH3
H3C
CH
CH2
CH3
H3C
(iv) Ionic bonds Interactions that occur between fully charged atomsor groups
20 0.25
Na+Cl-
R¬NH+3
-OOC¬R

242 Chapter 8 • Biomolecular Interactions: Ligand Binding and Enzyme Reactions
RNA, polysaccharides, and proteins—have numerous functional groups thatparticipate in noncovalent interactions. A collection of many of these interac-tions will lead to highly stabilized complexes.
2. Reactions that form noncovalent complexes are reversible. Noncovalentinteractions are initiated when diffusing (wandering or moving) moleculescome into close contact. Diffusion is brought about by thermal motions. Aninitial close encounter may not always result in the successful formation ofa complex. A few weak bonds may form, but be disrupted by thermal mo-tions, causing the molecules to dissociate. Therefore, bonds may constantlyform and break until enough bonds have accumulated to result in an inter-mediate with transient, but significant, existence. The complex can then ini-tiate a specific biological process. An intermediate rarely lasts longer than afew seconds. Eventually, thermal motions cause the complex to dissociateto the individual molecules. Reversibility is an important characteristic ofthese interactions so that a static, gridlock situation does not occur. The bi-ological process initiated by the complex LM must have a finite lifetime—astarting and an ending time.
3. The binding between molecules is specific. Imagine that the interactionsto form LM bring together two molecular surfaces. The two surfaces will beheld together if noncovalent interactions are established. If on one surfacethere is a nonpolar molecular group (phenyl ring, hydrophobic alkylchain), the adjacent region on the other surface must also be hydrophobicand nonpolar. If a positive charge exists on one surface, there may be a neu-tralizing negative charge on the other surface. A hydrogen-bond donor onone surface can interact favorably with a hydrogen-bond acceptor on theother surface. Simply stated, the two molecules must be compatible orcomplementary in a chemical sense so the development of stabilizingforces can hold molecules together. In molecular terms, the binding site (orsites) on M displays high specificity; therefore, only certain ligands canbind. L molecules, for a particular M, will be limited to a single, specificmolecule or perhaps a group of structurally related molecules.
Quantitative Characterization of Ligand Binding
A thorough understanding of the biochemical significance of ligand binding tomacromolecules comes only from a quantitative analysis of the strength of bind-ing (affinity) between L and M. Binding affinity between two molecules is oftenexpressed as an equilibrium constant, the formation constant, which is de-rived from the law of mass action. Consider the specific interaction between a
Kf,
STUDY EXERCISE 8.1 Examples of Noncovalent Interactions
a. Show how the carboxylate group on the side chain of the amino acid aspartatecan interact with a lysyl residue in a protein. Draw structures and define the pos-sible types of noncovalent binding forces.
b. Show how a peptide carbonyl group can form a hydrogen bond with the freeamino acid serine.

Chapter 8 • Biomolecular Interactions: Ligand Binding and Enzyme Reactions 243
small molecule, L (for ligand), and a macromolecule, M (Equation 8.1). Thesetwo species combine to form a complex, LM.
the formation constant for the complex, is defined by Equation 8.2.
>> (Eq. 8.2)
Do not confuse with the dissociation constant. The relationship betweenand is defined in Equation 8.3.
>> (Eq. 8.3)
The larger the value of the greater the strength of binding between Land M. (Large implies a high concentration of LM relative to L and M.) Returnto Equation 8.2 and note that in order to determine a method must be devel-oped to measure equilibrium concentrations of L, M, and the complex LM. In alater section, we will describe experimental techniques that are applied to thesemeasurements of binding constants, but first we must reorganize Equation 8.2 intoa form that contains more readily measurable terms. We will begin with the as-sumption that the macromolecule, M, has several binding sites for L and that thesesites do not interact with each other. That is, is identical for all binding sites. Thefollowing definitions are necessary for the reorganization of Equation 8.2:
equilibrium concentration of macromolecule with no bound L, or the concentration of unoccupied binding sitesequilibrium concentration of ligand–macromolecule complex, or the concentration of occupied sitestotal or initial concentration of macromolecule, or total concentration of available binding sitestotal concentration of bound and unbound ligand, or initial concentration of ligandfraction of available sites on M that are occupied, or the fraction of M that has L in binding site:
>> (Eq. 8.4)
The term is particularly significant because it can be considered a ratio ofthe number of occupied sites to the total number of potential binding sites on M.It can be measured experimentally, but first it must be redefined in the followingmanner: Since then
From Equation 8.2, Therefore,
n =Kf [L][M]
Kf [L][M] + [M]
[LM] = Kf [L][M].
n =[LM]
[LM] + [M]
[M]0 = [LM] + [M],
n
n =[LM][M]0
n =
[L]0 =
[M]0 =
[LM] =
[M] =[L] = equilibrium concentration of free or unbound ligand
Kf
Kf,Kf
Kf,
Kd =[L][M][LM]
=1Kf
KdKf
Kd,Kf
Kf =[LM]
[L][M]
Kf,

244 Chapter 8 • Biomolecular Interactions: Ligand Binding and Enzyme Reactions
Simplifying,
>> (Eq. 8.5)
You should recognize the similarity of Equation 8.5 to the Michaelis-Menten equation for enzyme catalysis. A graph of vs. [L] yields a hyperboliccurve (see Figure 8.1) that approaches a limiting value or saturation level. At thispoint, all binding sites on M are occupied. Because of the difficulty of measuringthe exact point of saturation, this nonlinear curve is seldom used to determine Linear plots are more desirable, so Equation 8.5 is converted to an equation for astraight line. The equation will first be put into a more general form to accountfor any number of potential binding sites on M. The symbol will be used to rep-resent the average number of occupied sites per M, and n will represent the num-ber of potential binding sites per M molecule. Assuming that all the binding siteson M are equivalent, Equation 8.5 becomes
>> (Eq. 8.6)
Scatchard’s Equation
Equation 8.6 contains terms such as [L] that are difficult to determine, so it mustbe converted to a form amenable to experimental measurements.
If is the average number of occupied sites per M molecule, then isthe average number of unoccupied sites per M molecule.
n - n = n -nKf [L]Kf [L] + 1
n - nn
n =nKf [L]Kf [L] + 1
n
Kf.
n
n =Kf [L]Kf [L] + 1
[ L ]Kf
= n
0.5 n
υ
υFIGURE 8.1 Aplot illustratingsaturation ofbinding sites withligand. The isestimated at thepoint when allbinding sites areoccupied by ligand.
is represented bythe [L] when one-half of the sites areoccupied by ligand.
Kf
n

Chapter 8 • Biomolecular Interactions: Ligand Binding and Enzyme Reactions 245
Simplifying,
>> (Eq. 8.7)
To further simplify Equation 8.7, let the term represent the ratio ofoccupied sites to nonoccupied sites on M; it can be mathematically represented as
or
>> (Eq. 8.8)
A more desirable form for graphical use is known as Scatchard’s equation:
>> (Eq. 8.9)
If a plot of versus yields a straight line, shown by the solid line in Figure 8.2,then all the binding sites on M are identical and independent, and and n areestimated as shown in the figure.
Cooperative Binding of Ligands
The derivation of Equation 8.9 assumes that is identical for all binding sites;that is, the binding of one molecule of L does not influence the binding ofother L molecules to binding sites on M. However, it is common for ligand-macromolecule interactions to display such influences. The binding of one Lmolecule to M may encourage or inhibit the binding of a second L molecule toM. For example, the binding of oxygen to one of the four subunits of hemoglo-bin increases the affinity of the other subunits for oxygen. There is said to becooperativity of sequential binding. If the sites do show cooperative binding,the plot is nonlinear, as shown by the dashed line in Figure 8.2. The shape ofthe nonlinear curve may be used to determine the number of types of bindingsites. The dashed line in Figure 8.2 can be resolved into two lines, indicatingthat two types of binding sites are present on M. The n and for each type ofbinding site may be estimated by resolving the smooth curve into straightlines as shown in Figure 8.2. and n can be estimated by extrapolating thetwo straight lines to the axes.
Experimental Measurement of Ligand-Binding Interactions
To analyze ligand-macromolecule interactions quantitatively (to use Equation 8.9),one must be able to distinguish experimentally between bound ligand (LM) andfree ligand (L). Many techniques have been developed for measuring thedynamics of LM interactions. Widely used techniques include equilibrium dialysis(Chapter 3, p. 73), ultrafiltration (Chapter 3, p. 74), and spectroscopic (especially
Kf
Kf
Kf
Kf
nn>[L]
n
[L]= Kf 1n - n2
n
n - n= Kf [L]
n
n - n= a nKf [L]Kf [L] + 1
b aKf [L] + 1n
b
n>n - n
1n - n2 =n
Kf [L] + 1
1n - n21Kf [L] + 12 = n1Kf [L] + 12 - n1Kf [L]2

246 Chapter 8 • Biomolecular Interactions: Ligand Binding and Enzyme Reactions
STUDY EXERCISE 8.2 Using Equilibrium Dialysis
Ligand binding to a protein can be measured by the procedure of equilibrium dialysis(see Chapter 3, Section D, p. 73). A solution of the protein (M) is sealed in a dialysisbag, which is then placed in a large volume of solution containing the ligand (L). Thepore size of the dialysis bag allows the passage of ligand molecules, but not proteinmolecules. After equilibrium is reached several hours later, the bag is opened and theconcentrations of free ligand inside and outside are measured. The difference betweenthese two values is the amount of ligand bound to the protein. The following experi-mental data are collected:
Kf for the reaction L + M Δ LM = 1 * 105 moles>liter
Concentration of bound ligand, [LM] = 5 * 10-6 mole>liter
Concentration of free ligand, [L] = 1 * 10-5 mole>liter
nn
nKf
nKf
Slope = _ Kf
Binding sites that
interact
Noninteracting binding
sites
_
[ L ]υ
_υ
FIGURE 8.2 Scatchard plot. Two types of Scatchard curves are illustrated. The upper plot (solidline) represents binding to a macromolecule with noninteracting sites. The binding of a ligandmolecule at one site is independent of the binding of a second ligand molecule at another site.The plot can be extrapolated to each axis and the and calculated. The lower, dashed linerepresents binding of ligand molecules to binding sites that interact. One ligand moleculebound to the macromolecule influences the rate of binding of other ligand molecules. Thedashed line is evaluated as shown in the figure. The curved line has two distinct slopes. It canbe resolved into two straight lines, each of which may be evaluated for and . This wouldindicate that there are two types of binding sites, each with a unique and .Kfn
Kfn
Kfn
fluorescence) measurements (Chapter 7, p. 220). Many of these methods requirespecialized and expensive equipment, sometimes cumbersome procedures, andthe use of radio-labeled ligands.

Chapter 8 • Biomolecular Interactions: Ligand Binding and Enzyme Reactions 247
One of the simplest and most convenient methods for monitoring ligandbinding is the differential method, which detects and quantifies some measura-ble change in spectral absorption or fluorescence, in the UV-VIS regions, thataccompanies ligand binding (see next section). A ligand may show enhancedfluorescence when bound to a macromolecule, or amino acid residues (i.e., Trp)in a protein may show enhanced fluorescence when a ligand molecule is bound.
The Bradford Protein Assay as an Example of Ligand Binding
When Coomassie Blue dye binds to proteins, the dye undergoes a significantspectral change in the visible region (Figure 8.3). The spectrum of free dye dis-plays a minimum in the range 575–625 nm. When dye and a protein (ovalbumin)are mixed, a new absorption band appears in the region of 595 nm. The increasein absorption at 595 nm is directly related to the concentration of protein, whichis the basis of the Bradford protein assay (Chapter 3, Section B, p. 69). The newabsorption band is due to the presence of dye-ovalbumin complex. Note that thenew band is rather broad and that a range of wavelengths may actually be used,but 595 nm is usually chosen. In this section, we will use the Bradford assay toillustrate an alternate method for using Scatchard’s equation.
Calculate the concentration of the protein, M, in moles per liter. Assume that M hasonly one binding site for the ligand.
Solution:Use Equation 8.2 to calculate [M]. The concentration of moles/liter.M = 5 * 10-6
1.0
C
B
A
0.8
0.6
0.4
0.2
0.0
500 600
Wavelength (nm)
Ab
sorb
ance
700
FIGURE 8.3 Thespectral changesoccurring duringthe binding ofCoomassie Blue dyeto ovalbumin. Afree dye in solution,B dye plus 0.5 mgof ovalbumin, C dyeplus 1.0 mg ofovalbumin. The dyeconcentration isidentical in all threecurves.
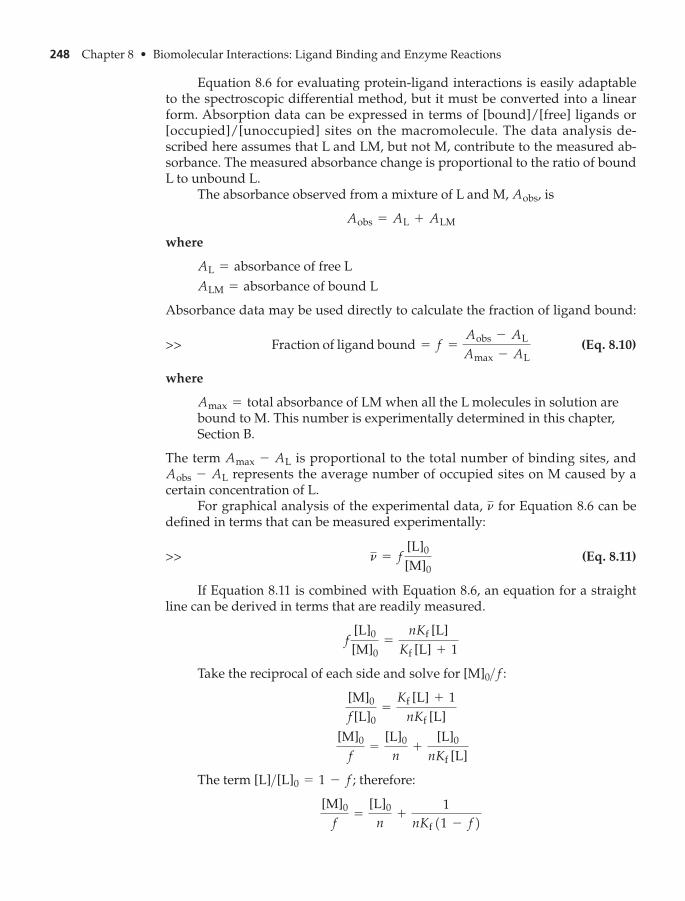
Equation 8.6 for evaluating protein-ligand interactions is easily adaptableto the spectroscopic differential method, but it must be converted into a linearform. Absorption data can be expressed in terms of [bound]/[free] ligands or[occupied]/[unoccupied] sites on the macromolecule. The data analysis de-scribed here assumes that L and LM, but not M, contribute to the measured ab-sorbance. The measured absorbance change is proportional to the ratio of boundL to unbound L.
The absorbance observed from a mixture of L and M, is
where
absorbance of free Labsorbance of bound L
Absorbance data may be used directly to calculate the fraction of ligand bound:
>> (Eq. 8.10)
where
total absorbance of LM when all the L molecules in solution arebound to M. This number is experimentally determined in this chapter,Section B.
The term is proportional to the total number of binding sites, andrepresents the average number of occupied sites on M caused by a
certain concentration of L.For graphical analysis of the experimental data, for Equation 8.6 can be
defined in terms that can be measured experimentally:
>> (Eq. 8.11)
If Equation 8.11 is combined with Equation 8.6, an equation for a straightline can be derived in terms that are readily measured.
Take the reciprocal of each side and solve for
The term therefore:
[M]0
f=
[L]0
n+
1nKf 11 - f2
[L]>[L]0 = 1 - f;
[M]0
f=
[L]0
n+
[L]0
nKf [L]
[M]0
f[L]0=Kf [L] + 1nKf [L]
[M]0>f:f
[L]0
[M]0=nKf [L]Kf [L] + 1
n = f[L]0
[M]0
n
Aobs - AL
Amax - AL
Amax =
Fraction of ligand bound = f =Aobs - AL
Amax - AL
ALM =AL =
Aobs = AL + ALM
Aobs,
248 Chapter 8 • Biomolecular Interactions: Ligand Binding and Enzyme Reactions
Chapter 8 • Biomolecular Interactions: Ligand Binding and Enzyme Reactions 249
Rearrange to the form for a straight line,
>> (Eq. 8.12)
This is an alternate form of the Scatchard equation. The values n and can becalculated from a plot of vs. The slope of the line is representedby whereas the y intercept is If the data points fall on a straight lineas in Figure 8.4, then all the dye binding sites on the protein M are identical andindependent.
The derivation of Equation 8.12 assumes that is identical for all bindingsites; that is, the binding of one molecule of L does not influence the bindingof other L molecules to binding sites on M. However, it is common for ligand-macromolecule interactions to display such influences. The binding of one Lmolecule to M may encourage or inhibit the binding of a second L molecule to M.For example, the binding of oxygen to one of the four subunits of hemoglobinincreases the affinity of the other subunits for oxygen. There is said to be coopera-tivity of sequential binding. If the sites do show cooperative binding, the plotbecomes nonlinear, as shown by the curved line in Figure 8.4. This line is resolvedinto two lines, indicating that two types of binding sites are present on M. The nand for each type of binding may be estimated by resolving the smooth curveinto two straight lines. and n may be calculated from the intercepts and slopes.
Computer Software for Analysis of LM Binding
Numerous computer programs exist that may be used for graphical analysis ofligand binding data. Most programs perform a linear or nonlinear least-squaresregression analysis of experimental data. Many are available as freeware on the
Kf
Kf
Kf
[L]0>n.1>nKf,[M]0>f.1>11 - f2 Kf
[M]0
f=
1nKf11 - f2 +
[L]0
n
y = mx + b:
[M]0
f
1 5
Binding Sites That Interact
Noninteracting Binding Sites
73
1
1− f
FIGURE 8.4Scatchard plot fortypical bindingdata. See text fordetails.

Internet. Some popular and effective software programs are listed and describedin Table 8.6. Additional Web sites and references are available at the end of thischapter and in Appendix I. One very useful program is DynaFit (www.biokin.com), which may be applied to the analysis of ligand binding data or enzymekinetic data. The program has been designed by Dr. Petr Kuzmic, President andCEO of Biokin Ltd. DynaFit is available free for academic users (students, profes-sors, university researchers), but one must register for an academic license at theWeb site.
B. BIOLOGICAL CATALYSIS (ENZYMES)
Enzyme-catalyzed reactions may also be described in terms of ligand-macromolecule interactions. Enzyme reactions are initiated by the interactionof a substrate molecule with an enzyme molecule:
>> (Eq. 8.13)
Enzymes are biological catalysts. Without their presence in a cell, most bio-chemical reactions would not proceed at the required rate. The chemical andbiological properties of enzymes have been investigated since the early1800s. The unrelenting interest in enzymes is due to several factors—their dy-namic and essential roles in the cell, their extraordinary catalytic power, andtheir selectivity.
Enzyme-catalyzed reactions proceed through an ES complex, as shown inEquation 8.14. Individual rate constants k are assigned to each reaction step.
>> (Eq. 8.14)
E represents the enzyme, S the substrate or reactant, and P the product. For a spe-cific enzyme, only one or a few different substrate molecules can bind in theproper manner and produce a functional ES complex. The substrate must have asize, shape, and polarity compatible with the active site of the enzyme. Someenzymes catalyze the transformation of many different molecules as long asthere is a common type of chemical linkage in the substrate. Others haveabsolute specificity and can form reactive ES complexes with only one molecularstructure. In fact, some enzymes are able to differentiate between D and L iso-mers of substrates.
Classes of Enzymes
Thousands of enzymes have now been isolated and studied; confusion wouldreign without some system for nomenclature and classification. Commonnames for enzymes are usually formed by adding the suffix –ase to the nameof the substrate. The enzyme tyrosinase catalyzes the oxidation of tyrosine;cellulase catalyzes the hydrolysis of cellulose to produce glucose. Commonnames of this type define the substrate, but do not describe the chemistry ofthe reaction. Some very early names, such as catalase, trypsin, and pepsin, are
E + S
k1
k2
ESk
3
4
E + Pk
E + S Δ ES
250 Chapter 8 • Biomolecular Interactions: Ligand Binding and Enzyme Reactions

Chapter 8 • Biomolecular Interactions: Ligand Binding and Enzyme Reactions 251
even less descriptive and give no clue to their function or substrates. To avoidsuch confusion, enzymes now have official names that reflect the reactionsthey catalyze. All known enzymes can be classified into one of six categories(Table 8.3). Each enzyme has an official international name ending in –ase anda classification number, called the Enzyme Commision (E.C.) number. Thenumber consists of four digits, each referring to a class and subclass of reac-tion. Table 8.3 shows an example from each class of enzyme.
TABLE 8.3 An Example of Each Class of Enzyme
1. Oxidoreductase
Common name: Lactate dehydrogenaseOfficial name: L-Lactate: oxidoreductase Official E.C. number: 1.1.2.3
2. Transferase
Common name: DNA polymeraseOfficial name: Deoxynucleoside triphosphate: DNA deoxynucleotidyltransferase (DNA-directed)Official E.C. Number: 2.7.7.7
3. Hydrolase
Common name: AcetylcholinesteraseOfficial name: Acetylcholine acetylhydrolaseOfficial E.C. number: 3.1.1.7
4. Lyase
Carbonic acidCommon name: Carbonic anhydraseOfficial name: Carbonate hydrolyaseOfficial E.C. number: 4.2.1.1
(Continued)
CO2 + H2O Δ H2CO3
O−
OH
H3C CH
3CN(CH
3)3
CH2
CH2
CH2
CH2
H2O+ +C O
Acetylcholine Acetate Choline
+N(CH
3)3
+
O O
PPi = Pyrophosphate1d - NMP2n+1 = DNA with n + 1 nucleotides1d - NMP2n = DNA with n nucleotides1d - NMP2n + d - NTP Δ 1d - NMP2n+1 + PPi
NAD+
OH
CH3
CHCOO−
NAD+ NADH + H+
NAD+ NADH + H+
Lactate
CH3CCOO−
Pyruvate
O

Kinetic Properties of Enzymes
The initial reaction velocity, of an enzyme-catalyzed reaction varies with thesubstrate concentration, [S], as shown in Figure 8.5. The Michaelis-Menten equationhas been derived to account for the kinetic properties of enzymes. (Consult a bio-chemistry textbook for a derivation of this equation and for a discussion of the con-ditions under which the equation is valid.) The common form of the equation is
>> (Eq. 8.15)
where
initial reaction velocitymaximal reaction velocity; attained when all enzyme active sitesare filled with substrate molecules
substrate concentration
Michaelis constant
The important kinetic constants and can be graphically determinedas shown in Figure 8.5. Equation 8.15 and Figure 8.5 have all of the disadvan-tages of nonlinear kinetic analysis. can only be estimated because of theasymptotic nature of the line. The value of the substrate concentrationKM,
Vmax
KMVmax
=k2 + k3k1
KM =
[S] =
Vmax =n0 =
n0 =Vmax[S]KM + [S]
n0,
252 Chapter 8 • Biomolecular Interactions: Ligand Binding and Enzyme Reactions
TABLE 8.3 (Continued)
5. Isomerase
Common name: Triose phosphate isomeraseOfficial name: D-Glyceraldehyde-3-phosphate ketoisomeraseOfficial E.C. number: 5.3.1.1
6. Ligase
Common name: Pyruvate carboxylaseOfficial name: Pyruvate: ligase (ADP-forming)Official E.C. number: 6.4.1.1
CO2
OxaloacetatePyruvate
O
CH3C CO
2+COO−
O
CH2CCOO−−OOC
ATP
C O
CH2OH
CH2OPO2−
3CH
2OPO2−
3
CHOH
H
Dihydroxyacetone
phosphate
Glyceraldehyde
3-phosphate
C O

Chapter 8 • Biomolecular Interactions: Ligand Binding and Enzyme Reactions 253
Vmax/2
Vmax
[S] = KM
at V = Vmax/2
0
Substrate concentration, [S]
Velo
city,
0υ
FIGURE 8.5Michaelis-Mentenplot for an enzyme-catalyzed reaction.
that results in a reaction velocity of depends on so both are justan estimate. By taking the reciprocal of both sides of the Michaelis-Mentenequation, however, it is converted into the Lineweaver-Burk relationship(Equation 8.16).
>> (Eq. 8.16)
This equation, which is in the form gives a straight line when isplotted against (Figure 8.6). The intercept on the axis is and theintercept on the axis is A disadvantage of the Lineweaver-Burk plotis that the data points are compressed in the high substrate concentration region.
-1>KM.1>[S]1>Vmax,1>n01>[S]
1>n0y = mx + b,
1v0
=KM
Vmax
# 1[S]
+1Vmax
Vmax,Vmax>2,
1
0
1
KM
–
1
Vmax
KM
VmaxSlope =
1
[S]
υ
FIGURE 8.6Lineweaver-Burkplot for an enzyme-catalyzed reaction.

254 Chapter 8 • Biomolecular Interactions: Ligand Binding and Enzyme Reactions
Significance of Kinetic Constants
The Michaelis constant, for an enzyme-substrate interaction has two mean-ings: (1) is the substrate concentration that leads to an initial reaction velocityof or, in other words, the substrate concentration that results in the fillingof one-half of the enzyme active sites, and (2) The seconddefinition of has special significance in certain cases. When then
so is equivalent to the dissociation constant of the ES complex.When a large implies weak interaction between E and S, whereas asmall indicates strong binding between E and S.
is important because it leads to the analysis of another kinetic con-stant, turnover number. The analysis of begins with the basic rate lawfor an enzyme-catalyzed process (Equation 8.17), which is derived fromEquation 8.14.
>> (Eq. 8.17)
If all of the enzyme active sites are saturated with substrate, then [ES] inEquation 8.17 is equivalent to the total concentration of enzyme, and be-comes hence
>> (Eq. 8.18)
or
For an enzyme with one active site per molecule, the turnover number, isthe number of substrate molecules transformed to product by one enzyme mol-ecule per unit time, usually in minutes or seconds. The turnover number is ameasure of the efficiency of an enzyme. and values for some enzymes arelisted in Table 8.4.
k3KM
k3,
k3 =Vmax
[ET]
Vmax = k3 [ET]
Vmax;n0[ET],
n0 = k3[ES]
k3k3,Vmax
KM
KMk2 � k3,KMKM = k2>k1
k2 � k3,KM
KM = 1k2 + k32>k1.Vmax>2
KM
KM,
TABLE 8.4 and Values for Some Enzyme: Substrate Systemsk3KM
Enzyme Substrate (mM)KM k31sec-12Catalase H2O2 0.001 40,000,000
Carbonic anhydrase HCO3- 9 400,000
Acetylcholinesterase Acetylcholine 0.09 25,000
Penicillinase Benzylpenicillin 0.050 2,000
Chymotrypsin Glycyltyrosinylglycine 108 100
DNA polymerase DNA – 15
Ribulose-1,5-bis-phosphate
Ribulose-1,5-bisphosphate 0.028 3.3
carboxylase CO2 0.009 –

Chapter 8 • Biomolecular Interactions: Ligand Binding and Enzyme Reactions 255
Inhibition of Enzyme Activity
Nonsubstrate molecules may interact with enzymes, leading to a decrease inenzymatic activity. Enzyme inhibition, the phenomenon in which moleculesinterfere with enzymes, is of interest because it often provides clues about themechanism of enzyme action and also reveals information about metabolic con-trol and regulation. In addition, many toxic substances, including drugs, expresstheir action by enzyme inhibition. Inhibition of enzymes by reversible pathwayswill be reviewed here. For more details on enzyme inhibition, including irre-versible processes, see your biochemistry course textbook.
The process of reversible inhibition is described by an equilibrium interac-tion between enzyme (E) and inhibitor molecule (I):
>> (Eq. 8.19)
Most inhibition processes can be classified as competitive, mixed, oruncompetitive, depending on how the inhibitor interferes with enzyme action.
1. Competitive inhibition. A competitive inhibitor is usually similar in struc-ture to the substrate and is capable of reversible binding to the enzyme activesite. In contrast to the substrate molecule, the inhibitor molecule cannot un-dergo chemical transformation to a product; however, it does interfere withsubstrate binding. The binding of substrate and competitive inhibitor is amutually exclusive process: When inhibitor is bound to enzyme, substrate isunable to bind and vice versa. The kinetic scheme for competitive inhibitionis as follows:
2. Mixed inhibition. A mixed inhibitor does not bind in the active site of theenzyme, but binds to some other region of the enzyme molecule. Thepresence of inhibitor may or may not affect substrate binding, but it doesinterfere with the catalytic functioning of the enzyme. [A noncompetitiveinhibitor, a special type of mixed inhibitor, does not affect substrate binding
E
EI
+ +
S ES E + P
no reaction
I
E + I Δ EI
STUDY EXERCISE 8.3 Enzyme Kinetics
An enzyme displays the following reaction kinetics:
Calculate KM.
[S] = 10 mM
Initial rate 1n02 = 75 mmol>min
Vmax = 200 mmol>min

256 Chapter 8 • Biomolecular Interactions: Ligand Binding and Enzyme Reactions
(no change in ), but does affect the catalytic efficiency of the enzymeThe enzyme with mixed inhibitor bound may be converted
to a nonfunctional conformational state. The kinetic scheme for noncom-petitive inhibition is as follows (note that the inhibitor may bind to the freeenzyme, E, to EI, or to ES):
3. Uncompetitive inhibition. An uncompetitive inhibitor is similar to a non-competitive inhibitor—it allows substrate to bind to the active site. It differs,however, because an uncompetitive inhibitor binds only to the ES complex:
Because the inhibitor combines only with ES and not free enzyme, it will in-fluence the activity of the enzyme only when substrate concentrations and,in turn, ES concentrations are high.
Any complete inhibition study requires the experimental differentiation amongthe three types of inhibition. The three inhibitory processes are kinetically distin-guishable by application of the Lineweaver-Burk equation. For each inhibitorstudied, at least two sets of rate experiments are completed. In all sets, the enzymeconcentration is identical. In set 1, the substrate concentration is varied and noinhibitor is added. In set 2, the same variable substrate concentrations from set 1are used, and a constant amount of inhibitor is added to each assay. If additionaldata are desired, more sets are prepared with variable substrate concentrationsas in set 2; however, a constant, and different, concentration of inhibitor is pres-ent. These data, when plotted on a Lineweaver-Burk graph, lead to three lines asshown in Figure 8.7. In competitive inhibition, all three lines intersect at the samepoint on the axis; hence, is not altered by the presence of the competi-tive inhibitor. If enough substrate is added, the competitive inhibition may beovercome. The apparent value (measured on the axis) changes witheach increase in inhibitor concentration. In mixed (noncompetitive) inhibition,the family of lines has a common intercept on the axis (unchanged forthe lines). For uncompetitive inhibition, parallel lines are obtained indicating thatboth and are changed. The kinetic characteristics of reversible inhibi-tion are compared in Table 8.5.
Units of Enzyme Activity
The actual molar concentration of an enzyme in a cell-free extract or purifiedpreparation is seldom known. Only if the enzyme is available in a pure crys-talline form, carefully weighed, and dissolved in a solvent can the actual molar
KMVmax
KM1>[S]1>[S]KM
Vmax1>n0
E + S ES E + P
ESI
I
+
no reaction
E
EI
I
++
S ES E + P
+ S EIS
I
+
no reaction
1lowersVmax2.]KM

Chapter 8 • Biomolecular Interactions: Ligand Binding and Enzyme Reactions 257
concentration be accurately determined. It is, however, possible to develop aprecise and accurate assay for enzyme activity. Consequently, the amount of aspecific enzyme present in solution is most often expressed in units of activity.Three units are in common use, the international unit (IU), the katal, and specificactivity. The International Union of Biochemistry Commission on Enzymeshas recommended the use of a standard unit, the international unit or simplyunit, of enzyme activity. One IU of enzyme corresponds to the amount thatcatalyzes the transformation of of substrate to product per minuteunder specified conditions of pH, temperature, ionic strength, and substrateconcentration. If a solution containing enzyme converts of substrateto product in 5 minutes, the solution contains 2 enzyme units. A new unit ofactivity, the katal, has been recommended. One katal of enzyme activity repre-sents the conversion of 1 mole of substrate to product in 1 second. One inter-national unit is equivalent to or One katal, therefore,0.0167 mkatal.1>60 mkatal
10 mmoles
1 mmole
1/[S]
1/Vmax 1/Vmax
[ I ] = 0
[ I ]
1/y
0
}
1/ [S]
−1/KM
[ I ] = 0
[ I ]
1/y
01/ [S]
[ I ] = 0
[ I ]
1/y
0
A Competitive inhibition B Mixed inhibition C Uncompetitive inhibition
−1/KM
FIGURE 8.7 Lineweaver-Burk plots to determine type of inhibition. Each set of three lines includes a line representingno inhibitor present, and two lines showing two different concentrations of inhibitor. A competitive inhibition: Thelines intersect on the axis, where can be calculated. B Mixed (noncompetitive) inhibition: The lines intersecton the axis, where can be calculated. C Uncompetitive inhibition: The lines are parallel. The and canbe calculated for each line as shown.
KMVmaxKM1>[S]Vmax1>v0
TABLE 8.5 Kinetic Characteristics of Reversible Inhibition
Effect on Inhibited Reaction1
Type of inhibition Km Vmax (Slope)Km/Vmax
Competitive Higher Same Increase
Mixed Higher Lower Increase
Noncompetitive Same Lower Increase
Uncompetitive Lower Lower Same
1Relative to uninhibited reaction.

258 Chapter 8 • Biomolecular Interactions: Ligand Binding and Enzyme Reactions
is equivalent to international units. It is convenient to represent smallamounts of enzyme in millikatals (mkatals), microkatals or nanokatals(nkatals). The enzyme activity in the above example was 2 units, which can beconverted to katals as follows: Since one katal is units, 2 units are equiv-alent to or 33 nkatals If the enzyme is an impurepreparation in solution, the activity is most often expressed as units/mL orkatals/mL.
Specific Activity
Another useful quantitative definition of enzyme efficiency is specific activity.The specific activity of an enzyme is the number of enzyme units or katalsper milligram of protein. This is a measure of the purity of an enzyme. If asolution contains 20 mg of protein that express 2 units of activity (33 nkatals),the specific activity of the enzyme is or
As an enzyme is purified, its specific ac-tivity increases. That is, during purification, the enzyme concentration increasesrelative to the total protein concentration until a limit is reached. The maximumspecific activity is attained when the enzyme is homogeneous, or in a pure form.
The activity of an enzyme depends on several factors, including substrateconcentration, cofactor concentration, pH, temperature, and ionic strength. Theconditions under which enzyme activity is measured are critical and must bespecified when activities are reported.
Design of an Enzyme Assay
Whether an enzyme is obtained commercially or prepared (purified) in a multi-step procedure, an experimental method must be developed to detect and quan-tify the specific enzyme activity. During isolation and purification of an enzyme,the assay is necessary to determine the amount and purity of the enzyme and toevaluate its kinetic properties. An assay is also essential for a further study of themechanism of the catalyzed reaction.
The design of an assay requires certain knowledge of the reaction:
1. The complete stoichiometry.2. What substances are required (substrate, metal ions, cofactors, etc.) and
their kinetic dependence.3. Effect of pH, temperature, and ionic strength.
The most straightforward approach to the design of an enzyme assay is tomeasure the change in substrate or product concentration during the reaction.
If an enzyme assay involves continuous monitoring of substrate or productconcentration, the assay is said to be kinetic. If a single measurement of substrateor product concentration is made after a specified reaction time, a fixed-timeassay results. The kinetic assay is more desirable because the time course of thereaction is directly observed and any discrepancy from linearity can be immedi-ately detected.
33 nkatals>20 mg = 1.65 nkatals>20 mg.2 units>20 mg = 0.1 units>mg,
10.033 mkatals2.2>6 * 1076 * 107
1mkatals2,6 * 107

Chapter 8 • Biomolecular Interactions: Ligand Binding and Enzyme Reactions 259
Kinetic versus Fixed-time Assay
Figure 8.8 displays the kinetic progress curve of a typical enzyme-catalyzedreaction and illustrates the advantage of a kinetic assay. The rate of productformation decreases with time. This may be due to any combination of factorssuch as decrease in substrate concentration, denaturation of the enzyme, andproduct inhibition of the reaction. The solid line in Figure 8.8 represents thecontinuously measured time course of a reaction (kinetic assay). The true rateof the reaction is determined from the slope of the dashed line drawn tangentto the experimental result. From the data given, the rate is of productformed per minute. Data from a fixed-time assay are also shown on Figure 8.8.If it is assumed that no product is present at the start of the reaction, then onlya single measurement after a fixed period is necessary. This is shown by a cir-cle on the experimental rate curve. The measured rate is now ofproduct formed every 5 minutes, or about which is consid-erably lower than the rate derived from the continuous, kinetic assay. Whichrate measurement is correct? Obviously, the kinetic assay gives the true ratebecause it corrects for the decline in rate with time. The fixed-time assaycan be improved by changing the time of the measurement, in this example, to2 minutes of reaction time, when the experimental rate is still linear. It is pos-sible to obtain true rates with the fixed-time assay, but one must choose thetime period very carefully. In the laboratory, this is done by removing aliquotsof a reaction mixture at various times and measuring the concentration of
3 mmoles>minute,16 mmoles
5 mmoles
Kinetic assay
Fixed-time assay
Time (min)
μ m
ole
s
1
4
8
12
16
20
24
2 3 4 5 6 7 8
End of fixed-time assayFIGURE 8.8Kinetic progress of an enzyme-catalyzed reaction.See text for details.

260 Chapter 8 • Biomolecular Interactions: Ligand Binding and Enzyme Reactions
product formed in each aliquot. Figure 8.8 reinforces an assumption used inthe derivation of the Michaelis-Menten equation. Only measurements of initialvelocities lead to true reaction rates. This avoids the complications of enzymedenaturation, decrease of [S], product inhibition, and reversion of the productto substrate.
Several factors must be considered when the experimental assay condi-tions are developed. The reaction rate depends on the concentrations of sub-strate, enzyme, and necessary cofactors. In addition, the reaction rate is underthe influence of environmental factors such as pH, temperature, and ionicstrength. Enzyme activity increases with increasing temperature until theenzyme becomes denatured. The enzyme activity then decreases until allenzyme molecules are inactivated by denaturation. During kinetic measure-ment, it is essential that the temperature of all reaction mixtures be main-tained as constant.
Ionic strength and pH should also be monitored carefully. Although someenzymes show little or no change in activity over a broad pH range, most en-zymes display maximum activity in a narrow pH range. Any assay developed toevaluate the kinetic characteristics of an enzyme must be performed in abuffered solution, preferably at the optimal pH.
Applications of an Enzyme Assay
The conditions used in an enzyme assay depend on what is to be accomplishedby the assay. There are two primary applications of an enzyme assay procedure.First, it may be used to measure the concentration of active enzyme in a prepara-tion. In this circumstance, the measured rate of the enzyme-catalyzed reactionmust be proportional to the concentration of enzyme; stated in more kineticterms, there must be a linear relationship between initial rate and enzyme con-centration (the reaction is first-order in enzyme concentration). To achieve this,certain conditions must be met: (1) the concentrations of substrate(s), cofactors,and other required substances must be in excess; (2) the reaction mixture mustnot contain inhibitors of the enzyme; and (3) all environmental factors such aspH, temperature, and ionic strength should be controlled. Under these condi-tions, a plot of enzyme activity ( product formed/minute) vs. enzyme con-centration is a straight line and can be used to estimate the concentration of activeenzyme in solution.
Second, an enzyme assay may be used to measure the kinetic propertiesof an enzyme, such as and inhibition characteristics. In this situation,different experimental conditions must be used. If for a substrate is desired,the assay conditions must be such that the measured initial rate is first-order insubstrate. To determine of a substrate, constant amounts of enzyme are in-cubated with varying amounts of substrate. A Lineweaver-Burk plot ( vs.
) may be used to determine and If a reaction involves two ormore substrates, each must be evaluated separately. The concentration of onlyone substrate is varied, while the other is held constant at a saturating level.The same procedure holds for determining the kinetic dependence on cofac-tors. Substrate(s) and enzyme are held constant, and the concentration of thecofactor is varied.
Vmax.KM1>[S]1>v0
KM
KM
KM,Vmax,
mmole

Chapter 8 • Biomolecular Interactions: Ligand Binding and Enzyme Reactions 261
Inhibition kinetics are included in the second category of assay applica-tions. An earlier discussion outlined the kinetic differentiation among competi-tive, uncompetitive, and mixed inhibition. In summary, a study of enzymekinetics is approached by measuring initial reaction velocities under conditionsin which only one factor (substrate, enzyme, cofactor) is varied and all others areheld constant.
STUDY EXERCISE 8.4 Converting Rate Data from Unitsto Concentration Units
Because most enzyme assays are completed with the use of spectroscopic methods, ini-tial rate data are in the form of The change of color intensity per time intervalis not a useful unit for kinetics. A more valuable and widely used unit that actually de-fines the amount of product formed per time interval is or Theconversion of units to concentration units may be done using Beer’s Law:
where
the absorbancethe molar absorption coefficient of the substrate or productpath length of the cuvette, usually 1 cmconcentration of substrate or product
For our example, let us assume that we are measuring the appearance of product thathas an E value of According to Beer’s Law, the absorbance change in a3 mL cuvette during 1 minute for production of 1 molar product is 3600:
To convert the raw data to moles of product formed per minute per liter, each is divided by 3600. For example, a of 0.1 is converted to of productformed in the following way:
Now convert to moles/min:
Now convert to
¢c = 8.33 * 10-2mmolesmin
mmoles>min:
2.78 * 10-5 molesliter * min
* 0.003 liters = 8.33 * 10-8 molesmin
¢c =¢A>minEl
=0.1>min
3600M-1cm-1cm= 2.78 * 10-5 M
min
1¢c2mmoles¢A>min
¢A>min
A = 3600
1 molar =A
3600M -1cm-1 * 1 cm
3600M -1cm-1.
c =l =E =A =
c = A>El¢A
mmol>min.mmol>min
¢A>min.
¢A>min
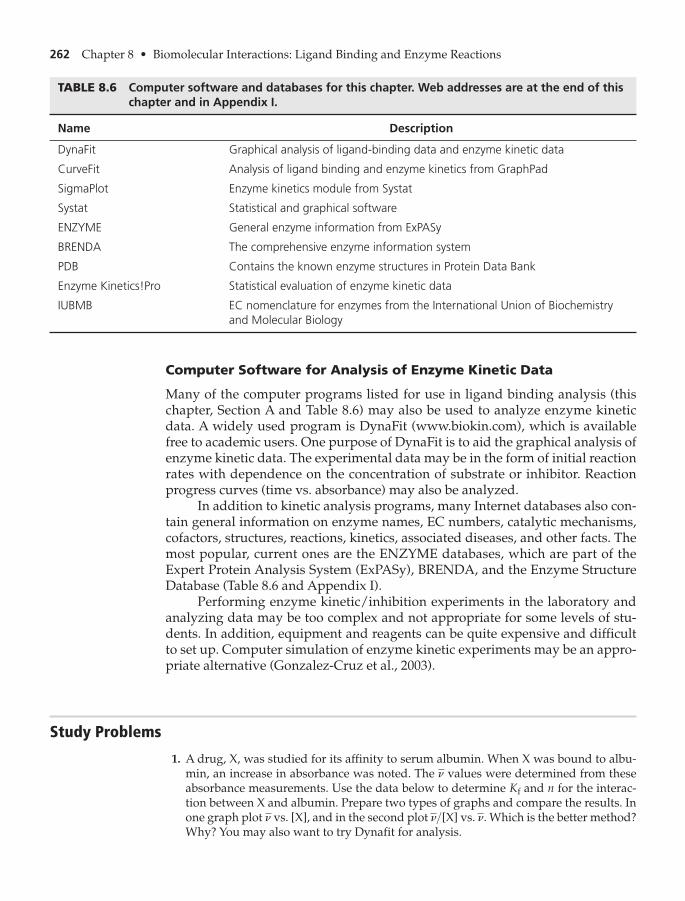
262 Chapter 8 • Biomolecular Interactions: Ligand Binding and Enzyme Reactions
Computer Software for Analysis of Enzyme Kinetic Data
Many of the computer programs listed for use in ligand binding analysis (thischapter, Section A and Table 8.6) may also be used to analyze enzyme kineticdata. A widely used program is DynaFit (www.biokin.com), which is availablefree to academic users. One purpose of DynaFit is to aid the graphical analysis ofenzyme kinetic data. The experimental data may be in the form of initial reactionrates with dependence on the concentration of substrate or inhibitor. Reactionprogress curves (time vs. absorbance) may also be analyzed.
In addition to kinetic analysis programs, many Internet databases also con-tain general information on enzyme names, EC numbers, catalytic mechanisms,cofactors, structures, reactions, kinetics, associated diseases, and other facts. Themost popular, current ones are the ENZYME databases, which are part of theExpert Protein Analysis System (ExPASy), BRENDA, and the Enzyme StructureDatabase (Table 8.6 and Appendix I).
Performing enzyme kinetic/inhibition experiments in the laboratory andanalyzing data may be too complex and not appropriate for some levels of stu-dents. In addition, equipment and reagents can be quite expensive and difficultto set up. Computer simulation of enzyme kinetic experiments may be an appro-priate alternative (Gonzalez-Cruz et al., 2003).
TABLE 8.6 Computer software and databases for this chapter. Web addresses are at the end of thischapter and in Appendix I.
Name Description
DynaFit Graphical analysis of ligand-binding data and enzyme kinetic data
CurveFit Analysis of ligand binding and enzyme kinetics from GraphPad
SigmaPlot Enzyme kinetics module from Systat
Systat Statistical and graphical software
ENZYME General enzyme information from ExPASy
BRENDA The comprehensive enzyme information system
PDB Contains the known enzyme structures in Protein Data Bank
Enzyme Kinetics!Pro Statistical evaluation of enzyme kinetic data
IUBMB EC nomenclature for enzymes from the International Union of Biochemistry and Molecular Biology
Study Problems
1. A drug, X, was studied for its affinity to serum albumin. When X was bound to albu-min, an increase in absorbance was noted. The values were determined from theseabsorbance measurements. Use the data below to determine and n for the interac-tion between X and albumin. Prepare two types of graphs and compare the results. Inone graph plot vs. [X], and in the second plot vs. Which is the better method?Why? You may also want to try Dynafit for analysis.
n.n>[X]n
Kf
n

Chapter 8 • Biomolecular Interactions: Ligand Binding and Enzyme Reactions 263
2. One of the many straight-line modifications of the Michaelis-Menten equation is theEadie-Hofstee equation:
.
Beginning with the Lineweaver-Burk equation, derive the Eadie-Hofstee equation.Explain how it may be used to plot a straight line from experimental rate data. Howare and calculated?
3. A research project you are working on involves the study of sugar binding to humanalbumin. The sugars to be tested are not fluorescent, and you do not wish to use a sec-ondary probe such as a dye. Human albumin has only one tryptophan residue, andyou know that this amino acid is fluorescent. You find that the tryptophan fluorescencespectrum of human albumin undergoes changes when various sugars are added. Canyou explain the results of this experiment and discuss the significance of the finding?
4. Equation 8.6 in this chapter can be used to determine values, but hyperbolic plotsare obtained. Convert Equation 8.6 into an equation that will yield a linear plot with-out going through all the changes necessary for the Scatchard equation. Hint: See theMichaelis-Menten equation and the Lineweaver-Burk equation.
5. You are attempting to develop a colorimetric probe for use in binding studies.List several requirements that the probe must meet in order to be effective. For exam-ple, it must bind at specific locations of the macromolecule. Can you think of otherrequirements?
6. Using the data in Problems 7 and 8, calculate the specific activity of the enzyme inunits/mg and katal/mg. Assume the enzyme has a molecular weight of 55,000 andthe reaction mixture for each assay is contained in a total volume of 1.00 mL.
7. The table below gives initial rates of an enzyme-catalyzed reaction, along with thecorresponding substrate concentration. Use any graphical method or computer pro-gram to determine and Vmax.kM
Kf
KMVmax
no = -KMn0
[S]+ Vmax
[X] v
0.36 0.43
0.60 0.68
1.2 1.08
2.4 1.63
3.6 1.83
4.8 1.95
6.0 1.98
n0 1mM>min2 [S] 1mole>liter2130 65 * 10-5
116 23 * 10-5
87 7.9 * 10-5
63 3.9 * 10-5
30 1.3 * 10-5
10 0.37 * 10-5

264 Chapter 8 • Biomolecular Interactions: Ligand Binding and Enzyme Reactions
( )MM>minn0
[X] � 3.7 * 10-4 M
( )mole>liter[S]
( )MM>minn0
[X] � 1.58 * 10-3 M
125 6.5 * 10-4 110
102 2.3 * 10-4 80
70 7.9 * 10-5 40
45 3.9 * 10-5 20
20 1.3 * 10-5 —
5 0.37 * 10-5 —
10. Show the mathematical steps required to derive the Lineweaver-Burk equation begin-ning with the Michaelis-Menten equation.
11. Figure 8.8 displays the kinetic progress of an enzyme-catalyzed reaction. What timelimit must be imposed on rate measurements taken with the use of the fixed-timeassay? Why?
12. The following data were collected in a ligand binding experiment. The protein concentra-tion was mole/liter. Use a graphical analysis program to determine n andKf.7.5 * 10-6
Reaction No. L added ( )MM L bound ( )MM
1 20 11
2 50 26
3 100 44
4 150 55
5 200 60
6 400 70
Further Reading
A. Attie and R. Raines, J. Chem. Educ. 72, 119–124 (1995). “Analysis of Receptor-LigandInteractions.”
M. Benore-Parsons and K. Sufka, Biochem. Mol. Biol. Educ. 31, 85–92 (2003). “TeachingReceptor Theory to Biochemistry Undergraduates.”
J. Berg, J. Tymoczko, and L. Stryer, Biochemistry, 6th ed. (2007), Freeman (New York).
8. The enzyme concentration used in each assay in Problem 7 is Calculate the turnover number, in units of
9. Compound X was tested as an inhibitor of the enzyme in Problem 6. Use the rate datain Problem 6 and the following inhibition data to evaluate compound X. Is it a com-petitive or noncompetitive inhibitor?
sec -1.k3,5 * 10-7mole>liter.
13. In your biochemistry research project, you find that the binding of a ligand to a proteindecreases if the ionic strength of the buffer solvent is increased. What type of noncova-lent bonding might be involved in the ligand-protein complex?

Chapter 8 • Biomolecular Interactions: Ligand Binding and Enzyme Reactions 265
A. Bordbar, A. Saboury, and A. Moosavi-Movahedi, Biochem. Educ. 24, 172–175 (1996).“The Shapes of Scatchard Plots for Systems with Two Sets of Binding Sites.”
M. Bradford, Anal. Biochem. 72, 248–254 (1976). “A Rapid and Sensitive Method for theQuantitation of Microgram Quantities of Protein Utilizing the Principle of Protein-Dye Binding.”
B. Cantor and P. Schimmel, Biophysical Chemistry, Part III (1980), Freeman (SanFrancisco), pp. 849–886. “Ligand Interactions at Equilibrium.”
P. Frey and A. Hegeman, Enzymatic Reaction Mechanisms (2007), Oxford UniversityPress (New York).
R. Garrett and C. Grisham, Biochemistry, 4th ed. (2010), Brooks Cole-Cengage (Belmont, CA). J. Gonzalez-Cruz, R. Rodriquez-Sotres, and M. Rodriquez-Penagos, Biochem. Mol. Biol.
Educ. 31, 93–101 (2003). “On the Convenience of Using Computer Simulation toTeach Enzyme Kinetics to Undergraduate Students with Biological Chemistry-relatedCurricula.”
J. Goodrich and J, Kugel, Binding and Kinetics for Molecular Biologists (2007), ColdSpring Harbor Laboratory Press (Cold Spring Harbor, NY).
S. Harding and B. Chowdhry, Protein-Ligand Interactions: A Practical Approach, Vol. 2,(2001), Oxford University Press (New York).
P. Kuzmic, Anal. Biochem. 237, 260–273 (1996). “Program DYNAFIT for the Analysis ofEnzyme Kinetic Data: Application to HIV Protease.”
M. Moller and A. Denicola, Biochem. Mol. Biol. Educ. 30, 309–312 (2002). “Study ofProtein-Ligand Binding by Fluorescence.”
D. Nelson and M. Cox, Lehninger Principles of Biochemistry, 5th ed. (2009), Freeman(New York).
N. Price, R. Dwek, M. Wormald, and R. Ratcliffe, Principles and Problems in PhysicalChemistry for Biochemists, 3rd ed. (2002), Oxford University Press (Oxford).Chapter 4 covers ligand binding, and Chapters 9–13 cover enzyme reactions.
N. Price and J. Nairn, Exploring Proteins: A Student’s Guide to Experimental Skills andMethods, (2009), Oxford University Press (New York).
D. Purich, Contemporary Enzyme Kinetics and Mechanism, 3rd ed. (2009), AcademicPress (Burlington, MA).
D. Purich, Enzyme Kinetics: Catalysis and Control, (2010), Elsevier (New York).F. Ranaldi, P. Vanni, and E. Gischetti, Biochem. Educ. 27, 87–91 (1999). “What Students
Must Know about the Determination of Enzyme Kinetic Parameters.”G. Rothenberg, Catalysis: Concepts and Green Applications (2008), Wiley-VCH.I. Schomburg et al., Trends Biochem. Sci. 27, 54–56 (2002). “BRENDA: A Resource for
Enzyme Data and Metabolic Information.”D. Sheehan, Physical Biochemistry: Principles and Applications 2nd ed. (2009), Wiley-
Blackwell (Hoboken, NJ). J. Sohl and A. Splittgerber, J. Chem. Educ. 68, 262–264 (1991). “The Binding of Coomassie
Brilliant Blue to Bovine Serum Albumin—A Physical Biochemistry Experiment.”B. Tsai, Computational Biochemistry (2002), John Wiley & Sons (New York), pp. 107–146.
Ligand interactions and enzyme kinetics.D. Voet and J. Voet, Biochemistry, 3rd ed. (2005), John Wiley & Sons (Hoboken, NJ).D. Voet, J. Voet, and C. Pratt, Fundamentals of Biochemistry, 3rd ed. (2008), John Wiley &
Sons (Hoboken, NJ).
http://www.graphpad.com/www/radiolig/radiolig1.htmGraphPad Software for analyzing binding data. Provides an introduction to analysis of
ligand-protein interactions.
http://www.curvefit.com/index.htmThe CurveFit Web site by GraphPad.

266 Chapter 8 • Biomolecular Interactions: Ligand Binding and Enzyme Reactions
http://www.chem.qmw.ac.uk/iubmb/enzymeThe Enzyme List maintained by the International Union of Biochemistry and Molecular
Biology.
http://www.biokin.comContains the computer program DynaFit, which may be used for the graphical analysis of
ligand-receptor binding and enzyme kinetic data.
http://www.systat.comComputer programs for curve fitting.
http://www.chemsw.com/16029.htmEnzyme Kinetics!Pro.
http://www.brenda-enzymes.orgThe Comprehensive Enzyme Information System.
http://www.biochemweb.org/enzymes.shtmlThe Virtual Library of Biochemistry, Molecular Biology and Cell Biology.
http://themedicalbiochemistrypage.org/enzyme-kinetics.htmlEnzymes, Kinetics and Diagnostics.
http://www.sigmaplot.com/products/sigmaplot/enzyme-mod.phpSigmaplot by Systat Software, Inc.
www.expasy.ch/enzymeGeneral enzyme information.
www.biochem.ucl.ac.uk/bsm/enzymes/index.htmlorhttp://www.ebi.ac.uk/thornton-srv/databases/enzymesEnzymes in PDB.
Additional Web sites for this chapter are available on the book’s Companion Website,which can be found at http://www.chemplace.com.

9MOLECULAR BIOLOGY I:STRUCTURES AND ANALYSIS OF NUCLEIC ACIDS
267
In this chapter, we shall focus on the nucleic acids, biomolecules important for their cellu-lar roles in the storage, transfer, and expression of genetic information. Two fundamentaltypes of nucleic acids participate as genetic molecules: (1) deoxyribonucleic acid (DNA)
and (2) ribonucleic acid (RNA). We begin this chapter with a review of the chemical and bio-logical properties of the nucleic acids and then turn to a discussion of laboratory methods fortheir isolation and characterization. Several procedures are described here that provide infor-mation about the structure and function of DNA and RNA. These include the isolation ofchromosomal and plasmid DNA, isolation of RNA, ultraviolet absorption of the nucleic acids,construction of thermal denaturation curves, ethidium bromide binding and fluorescence,agarose gel electrophoresis, and sequencing DNA molecules. Early studies on DNA and RNAdelved into understanding the molecular details of DNA replication, RNA transcription, andtranslation to produce proteins. More recently, research on the nucleic acids has concentratedon the biotechnological development of recombinant DNA for molecular cloning procedures,which will be discussed in Chapter 10.
A. Introduction to the Nucleic Acids 268B. Laboratory Methods for Investigation of DNA and RNA 275
Study Problems 285Further Reading 286
C H A P T E R
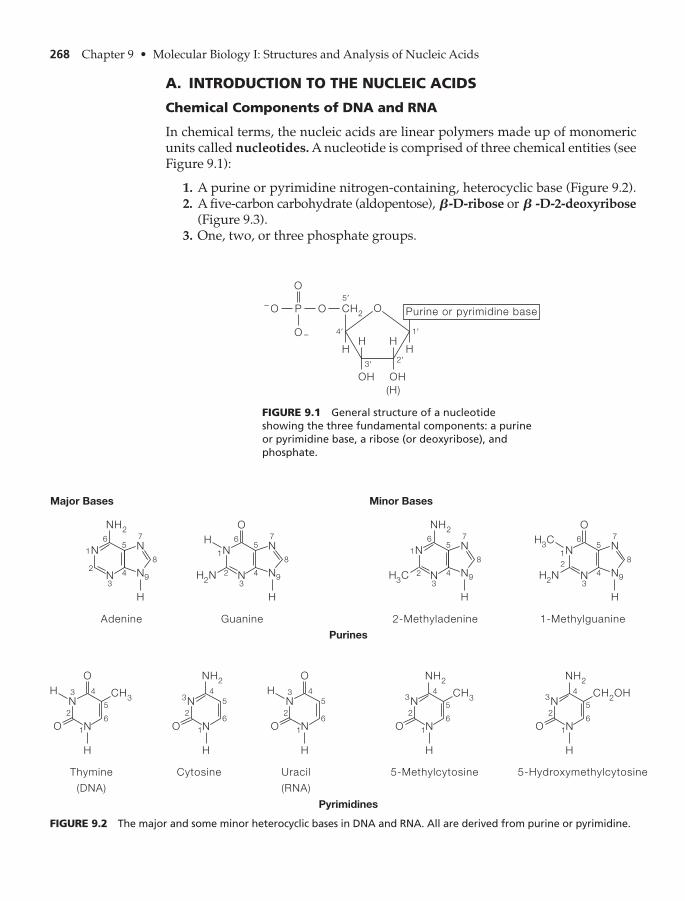
268 Chapter 9 • Molecular Biology I: Structures and Analysis of Nucleic Acids
CH2
H
_O
O _
O
4′
5′
1′
3′ 2′
O
O
P
H
OH
H
OH
(H)
Purine or pyrimidine base
H
FIGURE 9.1 General structure of a nucleotideshowing the three fundamental components: a purineor pyrimidine base, a ribose (or deoxyribose), andphosphate.
A. INTRODUCTION TO THE NUCLEIC ACIDS
Chemical Components of DNA and RNA
In chemical terms, the nucleic acids are linear polymers made up of monomericunits called nucleotides. A nucleotide is comprised of three chemical entities (seeFigure 9.1):
1. A purine or pyrimidine nitrogen-containing, heterocyclic base (Figure 9.2).2. A five-carbon carbohydrate (aldopentose), -D-ribose or -D-2-deoxyribose
(Figure 9.3).3. One, two, or three phosphate groups.
BB
NH2
6 7
81
29
3
4
5
NH2
Adenine
H
H2N
N N
N
H
N
O
6 7
81
29
3
4
5
Guanine
N N
N
H
N
H
O
CH3
O
6
1
2
3 4
5
Thymine
(DNA)
N
H
N
H
O
O
6
1
2
3 4
5
Uracil
(RNA)
N
H
NO6
1
2
34
5
Cytosine
N
H
N
Major Bases
NH2
6 7
81
29
3
4
5
NH2
2-Methyladenine
Purines
Pyrimidines
H3C
H2NH
3C
N N
N
H
N
O
6 7
81
2
93
4
5
1-Methylguanine
N N
N
H
N
O
CH3
6
1
2
34
5
5-Methylcytosine
N
H
N
Minor Bases
NH2
O
CH2OH
6
1
2
34
5
5-Hydroxymethylcytosine
N
H
N
FIGURE 9.2 The major and some minor heterocyclic bases in DNA and RNA. All are derived from purine or pyrimidine.

Chapter 9 • Molecular Biology I: Structures and Analysis of Nucleic Acids 269
CH2
H
4
5
1
3 2
O OH
H
OH
H
OH
H
OH
CH2
H
4
5
1
3 2
O OH
H
OH
H
H
H
OH
A b-D-Ribose B b-D-2-Deoxyribose
FIGURE 9.3 Thealdopentoses inRNA and DNA: A -D-ribose,B -D-2-deoxyribose.b
b
HOCH2
H
1′4′
5′
2′3′
O
H
OH
H
OH
H
Pyrimidine nucleoside
NH2
6 7
81
29
3
4
5N N
NN
NH2
6
1
2
3 4
5N
NO
HOCH2
H
1′4′
5′
2′3′
O
H
OH
H
OH
H
Purine nucleoside
FIGURE 9.4 Anucleoside consistsof a purine orpyrimidine baselinked to a ribose ordeoxyribose by anN-glycosidic bond.Two numberingsystems (primedand unprimed) arenecessary todistinguish the two rings.
The predominant nitrogen bases in DNA include the purines, adenine (A) andguanine (G), and the pyrimidines, thymine (T) and cytosine (C). In RNA, thepurines include A and G and the pyrimidines, C and uracil (U). The nucleic acids,especially RNA, contain small quantities of methylated nitrogen bases (Figure 9.2).
When a nitrogen base and aldopentose are combined via an N-glycosidicbond, the product is a nucleoside (Figure 9.4). Addition of a phosphoryl group
to a hydroxyl group on the carbohydrate leads to a nucleotide. Themost common site for phosphorylation is the -hydroxyl group. The names of nucleotides derived from the common nitrogen bases are listed in Table 9.1.
5¿5¿1¬PO2-
3 2
TABLE 9.1 Nomenclature for Nucleosides and Nucleotides in DNA and RNA
Base Nucleoside Nucleotide (Abbreviation) Nucleic Acid
Purine
Adenine Adenosine, deoxyadenosine Adenosine -monophosphate ( -AMP)5¿5¿ RNADeoxyadenosine -monophosphate ( -dAMP)5¿5¿ DNA
RNAGuanine Guanosine, deoxyguanosine Guanosine -monophosphate ( -GMP)5¿5¿Deoxyguanosine -monophosphate ( -dGMP)5¿5¿ DNA
Pyrimidine
Cytosine Cytidine, deoxycytidine Cytidine -monophosphate ( -CMP)5¿5¿ RNADeoxycytidine -monophosphate ( -dCMP)5¿5¿ DNA
Thymine Deoxythymidine Deoxythymidine -monophosphate ( -dTMP)5¿5¿ DNA
Uracil Uridine Uridine -monophosphate ( -UMP)5¿5¿ RNA

270 Chapter 9 • Molecular Biology I: Structures and Analysis of Nucleic Acids
CH2
O
_O
O O
O
O
To 5′ endThymine
P
O
H3C
H
N
N O
H
Cytosine
H
H
N
N O
CH2
O
_O
O O
O
P
N
H AdenineN
N
N H
H H
N
CH2
O
_O
O O
O
P
CH2
O
_O
O O
O
P
N
H GuanineN
NN
H
H
HN
O
To 3′ end
N
H H
FIGURE 9.5 Thecovalent structureof DNA showingthe phosphodiesterbackbone linkingdeoxyribosethrough the and
hydroxyl groups.5¿3¿
DNA Structure and Function
DNA in all forms of life is a polymer made up of nucleotides containing fourmajor types of heterocyclic nitrogen bases. The nucleotides are held together by
-phosphodiester bonds (Figure 9.5). The quantitative ratio and sequence ofbases vary with the source of the DNA. The covalent backbone of DNA (andRNA) consists of alternating deoxyriboses (or riboses) and phosphate groups.This feature, which is defined as a common, invariant region, is found in all
3¿,5¿

Chapter 9 • Molecular Biology I: Structures and Analysis of Nucleic Acids 271
nucleic acids. The variable region of DNA and RNA displays the sequence of thefour kinds of bases in the nucleic acid. The purine/pyrimidine nitrogen basesprotrude from the backbone-like side chains. The sequence of bases carries thespecific genetic message. The DNA or RNA chain also displays directionality—one end of the chain has a -hydroxyl (or phosphate) group and the other endhas a -hydroxyl (or phosphate) group.
Native DNA exists as two complementary, antiparallel strands arranged ina double helix held together by noncovalent bonding. DNA in most prokaryoticcells (simple cells with no major organelles and a single chromosome) existsas a single molecule in a circular, double-stranded form with a molecularweight of at least Eukaryotic cells (cells with major organelles)contain several chromosomes and, thus, several very large DNA molecules(Table 9.2).
DNA was first isolated from biological material in 1869, but its participa-tion in the transfer of genetic information was not recognized until the mid-1940s. Since that time, DNA has been the subject of thousands of physical,chemical, and biological investigations. A landmark discovery was Watson andCrick’s elucidation of the three-dimensional structure of DNA by X-ray diffrac-tion analysis in 1953. The double helix as envisioned by Watson and Crick isnow recognized as a significant form of native DNA (Figure 9.6). The mostimportant structural and functional feature of the double helix is itscomplementary base pairing. This not only holds the two strands of the doublehelix together, but also allows the DNA to function in the storage and transfer ofgenetic information.
The double helix is stabilized by two types of noncovalent forces (reviewTable 8.2):
1. Hydrogen bonding between pairs of complementary bases: A:T and G:C.This combination leads to the maximum number of hydrogen bonds forstability. Each base pair consists of a pyrimidine and a purine base. The
2 * 109 amu.
5¿3¿
TABLE 9.2 Comparison of DNA from Different Species
Organism Number of Base Pairs Length 1Mm2 Conformation
Viruses
SV40 5100 1.7 Circular
Adenovirus 36,000 12 Linear
phagel 48,600 17 Circular
Bacteria
E. coli 4,700,000 1400 Circular
Eukaryotes
Yeast 13,500,000 4600 Linear
Fruit fly 165,000,000 56,000 Linear
Human 3,200,000,000 1 - 2 * 106 Linear

272 Chapter 9 • Molecular Biology I: Structures and Analysis of Nucleic Acids
distance spanned across the double helix is just right for a purine:pyrimidinepair. Two pyrimidines are too small to form strong hydrogen bonds, andtwo purines are too sterically crowded.
2. Hydrophobic interactions and van der Waals forces between “stackedbases” (see Chapter 8, Section A, p.241). The planes of the nitrogenbases are nearly perpendicular to the common axis of the helix and takeon a stacking arrangement, bringing the purine and pyrimidine ringsclose together. This allows for favorable hydrophobic interactions be-tween nonpolar regions of the bases and interactions between elec-trons in the hybrid orbitals of the aromatic rings.
RNA Structure and Function
Unlike DNA, which is primarily a homogeneous molecule in the cell, RNAexists in three major forms (Table 9.3). Ribosomal RNA (rRNA), the most abun-dant form, is found associated with the ribosomes, the protein-synthesizing
sp2p
Hydrogen
Sugar—phosphate
backbone
A = adenine
T = thymine
G = guanine
C = cytosine
2.0 nm
0.34 nmC G
5′-PO43′-OH
Oxygen
Carbon in sugar-
phosphate backbone
Carbon and nitrogen
in base pairs
Phosphorus
Hydrogen
bond
Base pair
Minor groove
Axis
Major groove
A
G C
G C
C G
T A
C G
3.4 nm
T A
G C
C G
G C
G C
C G
T A
B
5′-PO43′-OH
FIGURE 9.6 A The Watson-Crick double helix. B Pairing of A-T and G-C bases in the DNA double helix. Note that thetwo strands are antiparallel; their and phosphodiester bonds run in opposite directions.5¿3¿

Chapter 9 • Molecular Biology I: Structures and Analysis of Nucleic Acids 273
organelles. The three sizes of prokaryotic rRNA, 5S, 16S, and 23S, can be sepa-rated by centrifugation (Chapter 4). Messenger RNA (mRNA) carries the tran-sient message for protein synthesis from nuclear DNA to the ribosomes. Thesmallest RNA molecules, transfer RNA (tRNA), select, bind, and activate aminoacids for use in protein synthesis. Because RNA molecules are heterogeneousand short-lived in the cell, it has been a challenge to isolate them in an intactform in order to study their structures and properties. RNA is usually single-stranded, but it does have important structural features. tRNA molecules havebeen purified and crystallized for X-ray crystallography. The basic two-dimensional structure of all tRNAs is often shown in a cloverleaf pattern inorder to display its single-stranded and double-stranded regions. mRNA andrRNA molecules recently isolated and crystallized display the structural ele-ments of hairpin turns, right-handed double helixes, and internal loops.Complementary bases in RNA are A:U and G:C.
Now that some of the major players in the flow of biological informa-tion have been identified, it is possible to provide a schematic outline for theprocess of protein synthesis (see Figure 9.7). The general direction of informa-tion flow is:
Note that DNA is the original source of genetic information. DNA is faithfullycopied by the process of replication. In transcription, a smaller region of theDNA (gene) is converted into the language of mRNA. In translation, proteins aresynthesized from amino acids. After synthesis, many proteins are not yet biolog-ically active and must go through posttranslational processing before they arefunctional. Changes that are made in this process include protein folding into thenative conformation (assisted by chaperones), protein shortening by proteases,amino acid residue modification (i.e., phosphorylation of seryl hydroxylgroups), attachment of carbohydrate residues, and addition of prosthetic groups.Finished and biologically active proteins play essential roles in the general main-tenance, functioning, and structure of the cell.
DNA ¡ RNA ¡ Proteins ¡ Cell Structure>Function
TABLE 9.3 RNA Molecules in E. coli
Type
RelativeAmount
(%) ValueSa MW
AverageNumber ofNucleotides
Ribosomal RNA(rRNA)
80 23S16S5S 36,000
0.55 * 1061.2 * 106 3700
1700120
Transfer RNA(tRNA)
15 4S 25,000 74–93
Messenger RNA(mRNA)
5 4S Heterogeneousmixture
aThe S value refers to the sedimentation coefficient (in Svedberg units) and is related to the size ofthe molecule.

274 Chapter 9 • Molecular Biology I: Structures and Analysis of Nucleic Acids
The nucleic acids are among the most complex molecules that you willencounter in your biochemical studies. When the dynamic roles that are playedby DNA and RNA in the life of the cell are realized, the complexity is under-standable. The discovery of the structures and functions of the nucleic acids willalways be considered as some of the most significant breakthroughs in ourunderstanding of the chemistry of life.
This section has provided a brief review of many important concepts inmolecular biology. For more details, refer to one of the standard biochemistrytextbooks and Web sites listed in the Further Reading section at the end of thechapter.
Replication
DNA
mRNA
Reverse
transcriptionTranscription
Translation
Protein
Cell structure and function• Energy metabolism• Synthesis and breakdown of biomolecules• Storage and transport of biomolecules• Muscle contraction• Cellular communication (signal transduction)
FIGURE 9.7 Thestorage andreplication ofbiologicalinformation in DNAand its transfer viaRNA to synthesizeproteins that directand maintaincellular structureand function.
STUDY EXERCISE 9.1 Complementary Bases in DNA
A short polynucleotide strand of DNA has the following sequence of bases. Write thesequence of the complementary strand.
5¿AGCTTACGTCC 3¿

Chapter 9 • Molecular Biology I: Structures and Analysis of Nucleic Acids 275
B. LABORATORY METHODS FOR INVESTIGATION OF DNA AND RNA
Isolation of Chromosomal DNA
Because of the large size and the fragile nature of chromosomal DNA, it is diffi-cult to isolate in a completely intact, undamaged form. Several isolation proce-dures have been developed that provide DNA in a biologically active form, butthis does not mean it is completely undamaged. These preparations yield DNAthat is stable, of high molecular weight, and relatively free of RNA and proteins.Here a general method will be described for the isolation of chromosomal DNA,in a relatively pure form, from microorganisms.
Designing an isolation procedure for DNA requires extensive knowledge ofthe chemical stability of DNA, as well as of its condition in the cellular environ-ment. Figures 9.5 and 9.6 illustrate several chemical bonds in DNA that may besusceptible to cleavage during the extraction process. The experimental factorsthat must be considered and their effects on various structural aspects of intactDNA are outlined below.
1. pH
(a) Hydrogen bonding between the complementary strands is stablebetween pH 4 and 10.
(b) The phosphodiester linkages in the DNA backbone are stable betweenpH 3 and 12.
(c) N-glycosidic bonds to purine bases (adenine and guanine) arehydrolyzed at pH values of 3 and less.
2. Temperature
(a) There is considerable variation in the temperature stability of thehydrogen bonds in the double helix, but most DNA begins to unwindin the range of
(b) Phosphodiester linkages and N-glycosidic bonds are stable up to 3. Ionic strength
(a) DNA is most stable and soluble in salt solutions. Salt concentrations ofless than 0.05 M weaken the hydrogen bonding between complementarystrands.
4. Cellular conditions
(a) Before the DNA can be released, the cell wall of the organism must belysed. The ease with which the cell wall is disrupted varies from
100°C.80-90°C.
STUDY EXERCISE 9.2 Complementary Bases in RNA
A short polynucleotide strand of double-stranded RNA has the following sequence ofbases. Write the sequence of the complementary strand of RNA.
5¿UAGGUACUUCG 3¿

276 Chapter 9 • Molecular Biology I: Structures and Analysis of Nucleic Acids
organism to organism. In some cases (e.g., yeast), extensive grinding orsonic treatment is required, whereas in others (e.g., Bacillus subtilis),enzymatic hydrolysis of the cell wall is possible.
(b) Several enzymes are present in the cell that may act to degrade DNA,but the most serious damage is caused by the deoxyribonucleases.These enzymes catalyze the hydrolysis of phosphodiester linkages.
(c) Native DNA is present in the cell as DNA-protein complexes. Basic pro-teins called histones must be dissociated from the DNA during theextraction process.
5. Mechanical stress on the DNA
(a) Gentle manipulations may not always be possible during the isolationprocess. Grinding, shaking, stirring, and other disruptive proceduresmay cause cleavage (shearing or scission) of the DNA chains. This usu-ally does not cause damage to the secondary structure of the DNA, butit does reduce the length of the molecules.
Now that these factors are understood, a general procedure of DNA extractionfrom bacteria will be outlined.
Step 1. Disruption of the cell wall and release of the DNA into a medium inwhich it is soluble and protected from degradation The isolation proce-dure described here calls for the use of an enzyme, lysozyme, to disrupt thecell wall. Lysozyme catalyzes the hydrolysis of glycosidic bonds in cell wallpeptidoglycans, thus causing destruction of the cell wall and allowing therelease of DNA and other cellular components. The medium for solution ofDNA is a buffered saline solution containing EDTA. DNA, which is ionic,is more soluble and stable in salt solution than in distilled water. TheEDTA serves at least two purposes. First, it binds divalent metal ions
that could form salts with the anionic phosphategroups of the DNA. Second, it inhibits deoxyribonucleases that have arequirement for or The mildly alkaline medium (pH 8) acts toreduce electrostatic interaction between DNA and the basic histones andthe polycationic amines, spermine and spermidine. The relatively high pHalso tends to diminish nuclease activity and denature other proteins.
Step 2. Dissociation of the protein-DNA complexes Detergents are used at thisstage to solubilize the inner membrane and disrupt the ionic interactionsbetween positively charged histones and the negatively charged backboneof DNA. Sodium dodecyl sulfate (SDS), an anionic detergent, binds to pro-teins and gives them extensive anionic character. A secondary action ofSDS is to denature deoxyribonucleases and other proteins. Also favoringdissociation of protein-DNA complexes is the alkaline pH, which reducesthe positive character of the histones. To ensure complete dissociation ofthe DNA-protein complex and to remove bound cationic amines, a highconcentration of a salt (NaCl or sodium perchlorate) is added. The salt actsby diminishing the ionic interactions between DNA and cations.
Step 3. Separation of the DNA from other soluble cellular components BeforeDNA is precipitated, the solution must be deproteinized. This is brought
Mn2+ .Mg2+
(Ca2+ , Mg2+ , Mn2+)

Chapter 9 • Molecular Biology I: Structures and Analysis of Nucleic Acids 277
about by treatment with chloroform–isoamyl alcohol followed by centrifu-gation. Upon centrifugation, three layers are produced: an upper aqueousphase, a lower organic layer, and a compact band of denatured protein atthe interface between the aqueous and organic phases. Chloroform causessurface denaturation of proteins. Isoamyl alcohol reduces foaming and sta-bilizes the interface between the aqueous phase and the organic phaseswhere the protein collects.
The upper aqueous phase containing nucleic acids is then separated andthe DNA precipitated by addition of ethanol. Because of the ionic nature ofDNA, it becomes insoluble if the aqueous medium is made less polar by additionof an organic solvent. The DNA forms a threadlike precipitate that can be collectedby “spooling” onto a glass rod. The isolated DNA may still be contaminated withprotein and RNA. Protein can be removed by dissolving the spooled DNA insaline medium and repeating the chloroform–isoamyl alcohol treatment until nomore denatured protein collects at the interface.
RNA does not normally precipitate like DNA, but it could still be a minorcontaminant. RNA may be degraded during the procedure by treatment withribonuclease after the first or second deproteinization step. Removal of RNA some-times makes it possible to denature more protein using chloroform–isoamylalcohol. If DNA in a highly purified state is required, several deproteinizationand alcohol precipitation steps may be carried out. It is estimated that up to 50%of the cellular DNA is isolated by this procedure. The average yield is 1 to 2 mgper gram of wet packed bacterial cells.
Isolation of Plasmid DNA
Many bacterial cells contain self-replicating, extrachromosomal DNA moleculescalled plasmids. This form of DNA is closed, circular, double-stranded, andmuch smaller than chromosomal DNA; its molecular weight ranges from
to which corresponds to between 3000 and 30,000 base pairs.Plasmids are widely used as cloning vehicles in the preparation of recombinantDNA (see Chapter 10, p. 294). Bacterial plasmids normally contain geneticinformation for the translation of proteins that confer a specialized and some-times protective characteristic (phenotype) on the organism. Examples of thesecharacteristics include enzyme systems that degrade antibiotics, and enzymes neces-sary for the production of antibodies and toxins. Plasmids are replicated in the cellby one of two possible modes. Stringent replicated plasmids are present in only afew copies and relaxed replicated plasmids are present in many copies, sometimesup to 200. Some relaxed plasmids continue to be produced even after the antibioticchloramphenicol is used to inhibit chromosomal DNA synthesis in the host cell.Under those conditions, many copies of the plasmid DNA may be produced (up to2000 or 3000), and may compose up to 30 to 40% of the total cellular DNA.
The extensive use of plasmid DNA as a cloning vehicle often requires theisolation and characterization of plasmids. Characterization of plasmids mightbe necessary for any of the following reasons (see Chapter 10):
1. Construction of new recombinant DNA.2. Analysis of molecular size by agarose gel electrophoresis.
20 * 106,2 * 106

278 Chapter 9 • Molecular Biology I: Structures and Analysis of Nucleic Acids
3. Electrophoretic analysis of restriction enzyme digests and construction of arestriction enzyme map.
4. Sequence analysis of nucleotides by the Sanger or Maxam-Gilbert method.
Several methods for isolating plasmid DNA have been developed; some lead toa more highly purified product than others. All isolation methods have the sameobjective—separation of plasmid DNA from chromosomal DNA. Plasmid DNAhas two major structural differences from chromosomal DNA.
1. Plasmid DNA is almost always extracted in a covalently closed circularform, whereas isolated chromosomal DNA usually consists of shearedlinear fragments, and,
2. Plasmid DNA is much smaller than chromosomal DNA.
The structural differences cause physicochemical differences that can beexploited to separate the two types of DNA molecules. Methods for isolatingplasmid DNA fall into three major categories:
1. Methods that rely on specific interaction between plasmid DNA and a solidsupport. Examples are adsorption to nitrocellulose microfilters andhydroxyapatite columns.
2. Methods that cause selective precipitation of chromosomal DNA by variousagents. These methods exploit the relative resistance of covalently closedcircular DNA to extremes of pH, temperature, or other denaturing agents.
3. Methods based on differences in sedimentation behavior between the twotypes of DNA. This is the approach of choice if highly purified plasmidDNA is required.
Two widely used isolation procedures based on Method 2 are described here.Both procedures yield plasmid DNA that is sufficiently pure for size analysis byagarose gel electrophoresis and for digestion by restriction enzymes.
Method A: Separation of Plasmid DNA by Boiling (Holmes and Quigley)
The total cellular DNA must first be released by lysis of the bacterial cells. This isbrought about by incubation with the enzyme lysozyme in the presence of reagentsthat inhibit nucleases. Chromosomal DNA is then separated from the plasmidDNA by boiling the lysis mixture for a brief period, followed by centrifugation. Incontrast to closed circular plasmid DNA, linear chromosomal DNA becomes irre-versibly denatured by heating and forms an insoluble gel, which sediments duringcentrifugation. Even though plasmid DNA may become partially denatured duringboiling, the closed circular helix reforms upon cooling. The boiling serves a secondpurpose, that of denaturing deoxyribonucleases and other proteins.
Method B: Microscale Isolation of Plasmids by Alkaline Lysis
Often it is necessary to detect and analyze plasmid DNA in a large number ofsmall bacterial samples. One widely used microscale method is the alkaline lysisprocedure. For this procedure, host bacterial cells harboring the plasmids aregrown in small culture volumes (1–5 mL) or in single colonies on agar plates.The cells are lysed and their contents denatured by alkaline sodium dodecyl sul-fate (SDS). Proteins and high-molecular-weight chromosomal DNA denaturedunder these conditions precipitate as a gel that can be centrifuged from thesupernatant, which contains plasmid DNA and bacterial RNA.

Chapter 9 • Molecular Biology I: Structures and Analysis of Nucleic Acids 279
Temperature, °C
90 10080 Tm Tm701.0
1.1
1.2
1.3
1.4
1.5
1.6
1.7
AT
A25
FIGURE 9.8 Atypical thermaldenaturation curvefor DNA. ismeasured as themidpoint of theabsorbanceincrease.
Tm
Characterization of DNA
Ultraviolet Absorption
A complete understanding of the biochemical functions of DNA requires a clearpicture of its structural and physical characteristics. DNA has significant absorp-tion in the UV range because of the presence of the aromatic bases adenine,guanine, cytosine, and thymine. This provides a useful probe into DNA structurebecause structural changes such as helix unwinding affect the extent of absorp-tion. In addition, absorption measurements are used as an indication of DNApurity. The major absorption band for purified DNA peaks at about 260 nm.Protein material, the primary contaminant in DNA, has a peak absorption at280 nm. The ratio is often used as a relative measure of the nucleicacid/protein content of a DNA sample. The typical for isolated DNA isabout 1.8. A smaller ratio indicates increased contamination by protein.
Thermal Denaturation
If DNA solutions are treated with denaturing agents (heat, alkali, organic sol-vents), their ultraviolet-absorbing properties are strikingly increased. Figure 9.8shows the effect of temperature on the UV absorption of DNA. The curve isobtained by plotting vs. temperature Heating through the1T2.A2601T2>A280125°2
A260>A280
A260>A280

280 Chapter 9 • Molecular Biology I: Structures and Analysis of Nucleic Acids
temperature range of to about results in only minor increases inabsorption. However, as the temperature is further increased, there is a suddenincrease in UV absorption followed by a constant The total increase inabsorption is usually on the order of 40% and occurs over a small temperaturerange. Figure 9.8 is called a thermal denaturation curve, a temperature profile,or a melting curve. The temperature corresponding to the midpoint of eachabsorption increase is defined as the transition temperature or melting tem-perature. (This should not be confused with melting point, the transformation of asubstance from solid to liquid, as was routinely studied in the organic laboratory.)Each species of DNA has a characteristic value that can be used for identifica-tion and characterization purposes.
The origin of the absorption increase, called a hyperchromic effect, is wellunderstood. The absorption changes are those that result from the transition ofan ordered double-helix DNA structure to a denatured state or random, unpairedDNA strands. Native DNA in solution exists in the double helix held together pri-marily by hydrogen bonding between complementary base pairs on each strand(see Figure 9.6). Hydrophobic and interactions between stacked base pairsalso strengthen the double helix. Agents that disrupt these forces (hydrogenbonding, hydrophobic and interactions) cause dissociation or unwinding ofthe double helix. In a random coil arrangement, base-base interactions are ata minimum; this alters the resonance behavior of the aromatic rings, causing anincrease in absorption. The process of DNA dissociation can, therefore, be char-acterized by monitoring the UV-absorbing properties of DNA under variousconditions.
Ethidium Bromide Binding and Fluorescence
Fluorescence assays are considered to be among the most convenient, sensitive,and versatile of all laboratory techniques (Chapter 7, p. 220). However, thepurine and pyrimidines of the nucleic acids yield only weak fluorescence spec-tra. The fluorescence of the dye, ethidium bromide, is enhanced about 25-foldwhen it interacts with DNA. Ethidium bromide, which is a relatively small pla-nar molecule (Figure 9.9), binds to DNA by insertion between stacked base pairs(intercalation). The process of intercalation is especially significant for aromaticdyes, antibiotics, and other drugs. Some dyes, when intercalated into DNA,show enhanced fluorescence that can be used to detect DNA molecules after gelelectrophoresis measurements (Chapter 6, Section C, p. 191).
The concentration of RNA and DNA solutions may be determined usingethidium bromide binding. The spectrophotometric assay for DNA/RNA(Chapter 3, p. 71) measures both double-stranded and single-stranded DNA be-cause it measures the UV absorption by purine and pyrimidine bases. Ethidium
p -p
p -p
Tm
Tm,
A260.
80°C25°C
N+Br
_
C2H
5
NH2
H2N
FIGURE 9.9Structure of thefluorescentintercalation dyeethidium bromide.

Chapter 9 • Molecular Biology I: Structures and Analysis of Nucleic Acids 281
bromide interaction with single-stranded DNA does not lead to increasedfluorescence, so duplex DNA can be quantified in the presence of dissociatedDNA. Solutions of purified DNA are commonly contaminated with RNA.Because single-stranded RNA can form hairpin loops with base pairing andduplex formation (as in tRNA), ethidium bromide also binds with enhancedfluorescence to these duplex regions of RNA. Addition of ribonuclease A resultsin digestion of RNA and loss of fluorescence due to ethidium binding of RNA.The amount of fluorescence lost is proportional to the concentration of RNA. Theethidium fluorescence remaining after ribonuclease treatment is directly propor-tional to the concentration of duplex DNA.
where
fluorescence yield due to each type of nucleic acid
When the F (RNA) term is reduced to zero, the total fluorescence is a direct meas-urement of concentration of double-stranded DNA. The actual concentration ofDNA in solution can be calculated by using a standard solution of DNA or froma standard curve.
F =
F1total2 = F1DNA2 + F1RNA2
STUDY EXERCISE 9.3 Ethidium Bromide-Fluorescence Assayfor DNA
Solution A of DNA (unknown concentration) is known to contain double-strandedDNA, damaged single-stranded DNA, and RNA. The ethidium bromide fluorescenceassay was done on the solution, and the following data were collected. The fluores-cence intensity values (F) were obtained on an instrument with a standardized scaleof 0–100.
F of solution
F after treatment of A with
F of a standard solution of double-stranded DNA
What is the concentration of double-stranded DNA in solution A in
Solution:
We begin by making several assumptions. The total fluorescence of solution A is due todouble-stranded DNA and some contaminating RNA. Single-stranded DNA and RNAdo not bind ethidium bromide. The concentration of double-stranded DNA is directlyproportional to the fluorescence reading. The fluorescence intensity due to double-stranded DNA is 80. To calculate the concentration of double-stranded DNA in solu-tion A, compare the fluorescence intensity (80) with that obtained for the standardDNA solution:
[DNA-A] = 8 mg>mL
[DNA-A]>80 = [10 mg>mL]>100
mg>mL?
110 mg>mL2 = 100
ribonuclease = 80
A = 87

282 Chapter 9 • Molecular Biology I: Structures and Analysis of Nucleic Acids
Agarose Gel Electrophoresis
Several techniques for the characterization of nucleic acids have been introducedin this chapter, but the standard method for separation and analysis of plasmidsand other smaller DNA molecules is agarose gel electrophoresis (Chapter 6,Section B, p.177). This method has several advantages, including ease of opera-tion, sensitive staining procedures, high resolution, and the ability to analyze awide range of molecular weights . As discussed in Chapter 6,the mobility of nucleic acids in agarose gels is influenced by the agarose concen-trations, the molecular size of the DNA, and the molecular shape of the DNA. Ingeneral, the lower the agarose concentration in the gels, the larger the DNA thatcan be analyzed. A practical lower limit of agarose concentration is reached at0.3% agarose, below which gels become too fragile for ordinary use. This lowerlimit of agarose in the gels allows for analysis of linear double-stranded DNAwithin the range of 5 and 60 kilobase pairs (up to in molecularweight). Gels with an agarose concentration of 0.8% can separate DNA in therange of kilobase pairs, and 2% agarose gels are used to separate smallerDNA fragments ( kilobase pairs).
Nucleic acids migrate in an agarose medium at a rate that is inversely pro-portional to their size (kilobase pairs or molecular weight). In fact, a near-linearrelationship exists between mobility and the logarithm of kilobase pairs (or molec-ular weight) of a DNA fragment. A standard curve may be prepared by includingon the gel a sample containing DNA fragments of known molecular weights (seeFigure 9.10). Several types of molecular-weight ladders are commercially availableto mark and help estimate the sizes and concentrations of unknown nucleic acids.
Agarose gel electrophoresis is an ideal technique for analysis of DNA frag-ments. In addition to the positive characteristics discussed previously, thetechnique is simple, rapid, and relatively inexpensive. Fragments that differ inmolecular weight by as little as 1% can be resolved on agarose gels, and as littleas 1 ng of DNA can be detected on a gel. Nucleic acids are visualized after elec-trophoresis by treatment with ethidium bromide or one of the less toxic SYBRand GelRed dyes mentioned in Chapter 6, p. 190.
Sequencing DNA Molecules
When it was determined that genetic information in DNA is coded in the form ofnucleotide base sequence, the direction of research turned to the design of experi-mental procedures for determining the base order. Early sequence studies usedthe inefficient, insensitive, and labor-intensive methods of acid-, base-, and nuclease-catalyzed hydrolysis of DNA and analysis of fragments by electrophoresis.
0.1-30.5-10
150 * 106
10.6 - 100 * 1062
Caution
Ethidium bromide must be used with great care, as it is a potent mutagen. Gloves shouldbe worn at all times while handling solutions of the dye. When finished with experiments,used and excess solutions of the dye must be disposed of as directed by your instructor orlaboratory director.

Chapter 9 • Molecular Biology I: Structures and Analysis of Nucleic Acids 283
Two sequencing methods that are both simple and inexpensive are nowwidely used:
1. The Maxam-Gilbert chemical cleavage method (also called the chemi-cal degradation method) uses chemical modification of bases, whichpromotes cleavage at selected phosphodiester linkages. Cleavage prod-ucts, which have one common end and vary in length, are analyzed byPAGE.
2. The Sanger chain-terminating method (also called the dideoxymethod) uses the enzyme DNA polymerase, coupled with the presenceof all four nucleoside triphosphates and one of the -dideoxynucleosidetriphosphates, to synthesize a DNA chain complementary to an addedtemplate. Replication stops when a dideoxynucleotide is in place on thenew chain. Fragments of different lengths are produced and analyzedby PAGE.
In both sequencing methods, electrophoretic procedures are capable of sep-arating nucleic acid fragments that differ in size by only one nucleotide.Detection of the fragments is done with chemiluminescent-labeling or -labelingof deoxynucleoside triphosphates (see Figure 6.16, p. 192).
Sequencing procedures that are automated and computer-controlled havenow made possible the sequencing of entire genomes (Table 9.4). The first
32P
2¿, 3¿
Distance migrated (cm)
2
1000
2000
4000
6000
8000
10,000
20,000
40,000
60,000
80,000
100,000
4 6 8 10 12 14
No. of b
ase p
airs
FIGURE 9.10Standard curveobtained byelectrophoresisof phage DNAfragments fromEcoR1 cleavage.
l

284 Chapter 9 • Molecular Biology I: Structures and Analysis of Nucleic Acids
complete genome of a free-living organism, the prokaryote Haemophilusinfluenzae, was published in 1995. This genome contains 1,830,137 bases and1740 genes. Complete sequencing of the human genome was announced in2001. The human genome contains over 3.2 billion base pairs and about20,000–25,000 genes.
Genomic sequences are now made available in repositories on the Internet.Three primary resources, combined in the International Nucleotide SequenceDatabase Collaboration, are listed in Table 9.5. Database resources for genomeprojects are also listed in Table 9.5 and in Appendix I. Readers may practiceusing the databases by working Study Problem 12.
Isolation and Characterization of RNA
The methods used for the isolation of RNA are similar to those described forDNA at the beginning of this chapter, Section B. However, some proceduralchanges must be made in the purification of RNA because of the presence of
TABLE 9.4 Sequenced Genomes
OrganismGenome Size
(Kilobase Pairs)Number of
Chromosomes
Borrelia burgdorferi (carrier of Lyme disease) 1444 1
Haemophilus influenzae (human pathogenic bacterium) 1830 1
Mycobacterium tuberculosis (cause of tuberculosis) 4412 1
Escherichia coli (bacterium) 4639 1
Saccharomyces cerevisiae (yeast) 11,700 17*
Drosophila melanogaster (fruit fly) 137,000 4*
Oryza sativa (rice) 430,000 12
Homo sapiens (human) 3,200,000 23*
*in haploid chromosomes
TABLE 9.5
Organization Web site
The International Nucleotide Sequence Database Collaboration
1. Genbank of the National Center for Biotechnology Information http://www.ncbi.nlm.nih.gov/Genbank
2. EMBL (European Molecular Biology Laboratory) http://www.ebi.ac.uk
3. DDBJ (DNA Data Bank of Japan) http://www.ddbj.nig.ac.jp
Genome Project Databases
1. dbEST (cDNA and partial sequences) http://www.ncbi.nih.gov
2. Genethon (genetic maps based on repeat markers) http://www.genethon.fr
3.The Broad Institute of MIT and Harvard University (Genomics) http://www.broadinstitute.org

Chapter 9 • Molecular Biology I: Structures and Analysis of Nucleic Acids 285
heterogeneous populations of molecules and the extra susceptibility to cleavageof the phosphodiester bonds in RNA. Here are some general comments on labo-ratory methods for the isolation and characterization of RNA:
• RNA molecules are naturally shorter than DNA. This makes RNA less sus-ceptible to physical shearing, so more vigorous conditions may be used forcell lysis.
• The phosphodiester bonds in DNA are stable in the pH range of 3–12;however, the presence of the -OH groups in RNA makes it especiallysusceptible to base- and enzyme-catalyzed (RNase) cleavage. Specialprecautions must be taken to avoid chemical agents that degrade RNA,and chemicals must be added to isolation buffers that destroy endoge-nous proteins that act as nucleases. The addition of chelating agents likeEDTA and citrate ties up metal ions that are essential for RNase activity.Strong detergents may be added to denature proteins, especially nucle-ases. The chemical reagent guanidinium thiocyanate is a useful addition,as it acts as an RNase inhibitor and protein denaturant.
• It is essential for lab workers to wear plastic gloves to avoid transfer ofnucleases from bare skin.
• Gradient centrifugation procedures as described in Chapter 4 may be usedto isolate, purify, and characterize all types of RNA.
• Isolated RNA samples may be analyzed for purity by agarose gel elec-trophoresis procedures similar to those for DNA.
• Specific types of RNA may be isolated and purified using affinity chro-matography. For example, eukaryotic mRNAs, which make up only about2–5% of cellular RNA, have a poly (A) segment at their ends. This RNAmay be purified using an affinity matrix consisting of poly (T) or poly (U)on agarose or cellulose gels (see Chapter 5, Section G, p. 152).
3¿
2¿
Study Problems
1. During the isolation of DNA, the solution becomes more viscous after treatment withlysozyme and SDS. Explain why.
2. How can RNA be removed from a DNA preparation?3. Explain the action of SDS in disrupting the cell membrane in the extraction procedure
of DNA.4. A solution of purified DNA gave an absorbance of 0.55 at a wavelength of 260 nm. The
absorbance was measured in a quartz cuvette with a path length of 1 cm. What is theconcentration of DNA? (See Chapter 3, Section C, p. 71).
5. The concentration of a purified DNA solution is Predict the absorbance ofthe solution at 260 nm.
6. Why is bromophenol blue dye added to a gel-loading buffer before electrophoresis?
35 mg>mL.
STUDY EXERCISE 9.4
Use PubMed or another computer search method to find new methods for isolation of RNA.

286 Chapter 9 • Molecular Biology I: Structures and Analysis of Nucleic Acids
Further Reading
B. Alberts, et al., Molecular Biology of the Cell, 5th ed. (2007), Garland Press (New York).J. Berg, J. Tymoczko, and L. Stryer, Biochemistry, 6th ed. (2007), Freeman (New York).H. Birnboim, Methods Enzymol. 100, 243–255 (1983). “A Rapid Alkaline Extraction
Method for the Isolation of Plasmid DNA.”R. Boyer, Concepts in Biochemistry, 3rd ed. (2006), John Wiley & Sons (Hoboken, NJ).
Chapters 10–13 cover the concepts in molecular biology.F. Collins, et al., Nature 409, 745–708 (2001). The human genome.R. Garrett and C. Grisham, Biochemistry, 4th ed. (2010), Brooks Cole-Cengage
(Belmont, CA). D. Holmes and M. Quigley, Anal. Biochem. 114, 193–197 (1981). “A Rapid Boiling Method
for the Preparation of Bacterial Plasmids.”C. Liu, Handbook of Nucleic Acid Purification, (2009), CRC Press (Boca Raton, FL).J. Marmur, J. Mol. Biol. 3, 208 (1961). “A Procedure for the Isolation of Deoxyribonucleic
Acid from Microorganisms.”S. Neidle, Principles of Nucleic Acids, 2nd ed. (2007), Academic Press (Reston, VA).D. Nelson, and M. Cox, Lehninger Principles of Biochemistry, 5th ed. (2009), Freeman
(New York).J. Sambrook and D. Russell, Molecular Cloning: A Laboratory Manual, 3rd ed. (2001),
Cold Spring Harbor Laboratory Press (Cold Spring Harbor, NY).C. Tsai, Computational Biochemistry (2002), Wiley–Liss (New York). Chapter 9 covers
nucleotide sequencing.J. Venter, Science 291, 1304 (2001). The sequence of the human genome.
7. What assumptions must be made about the relative mobility of bromophenol bluedye and DNA fragments during electrophoresis?
8. What is the purpose of the ethanol precipitation step in the preparation of plasmids?9. Predict and explain the effect of each of the following conditions on the of native
DNA. Will the be raised or lowered relative to the DNA in Tris-HCl buffer, pH 7.5?(a) Measure in pH 12 buffer.(b) Measure in distilled water.(c) Measure in 50% methanol water.(d) Measure in standard Tris-HCl, pH 7.5 buffer solution containing SDS.
10. The polyamines 1,4-diaminobutane, 1,5-diaminopentane, spermine, and spermidineare metabolic products found in many cells. Although the specific function of thesecompounds has not been determined, they are known to bind to the nucleic acids.Describe how you would combine the ethidium bromide fluorescence assay describedin this chapter with ligand binding plots defined in Chapter 8, Section A, to character-ize the binding of the polyamines to DNA or RNA. Hint: The polyamines are found tobind to some of the same sites on the nucleic acids as does ethidium bromide.
11. A solution of purified RNA gave an absorbance of 0.75 at 260 nm. The absorbance wasmeasured in a quartz cuvette with path length of 1 cm. What is the concentration ofRNA in the solution?
12. Use one of the DNA sequence databases in Table 9.5 to obtain the DNA sequence of:(a) Cytosolic tRNA-phenylalanine from yeast (Saccharomyces cerevisiae)(b) human insulin
Tm
Tm
Tm
Tm
Tm
Tm

Chapter 9 • Molecular Biology I: Structures and Analysis of Nucleic Acids 287
D. Voet and J. Voet, Biochemistry, 3rd ed. (2005), John Wiley & Sons (Hoboken, NJ).Chapters 5–7 and 29–35 cover DNA and RNA.
D. Voet, J. Voet, and C. Pratt, Fundamentals of Biochemistry, 3rd ed. (2008). John Wiley &Sons (Hoboken, NJ).
http://www.cgcsci.com/cminfo.shtmlRestriction map of pBR322 in circular and linear format. Designed by CGC Scientific, a
provider of software tools for biologists.
http://www.fermentas.comClick on “conventional restriction endonucleases” for a listing of enzymes.Click on individual enzymes for specific data including cleavage site and reaction
conditions.
http://biowww.netMolecular Cell Biology Protocol Troubleshooting.
http://learn.genetics.utah.edu/content/labs/extractionDNA Extraction Virtual Lab, “How to Extract DNA from Anything Living.”
http://www.intute.ac.uk/biologicalsciencesHelping you find the best Web sites for study and research.
http://www.genome.ou.edu/protocol_book/protocol_index.htmlProtocols for recombinant DNA isolation, cloning and sequencing.
Additional Web sites for this chapter are available on the book’s Companion Website,which can be found at http://www.chemplace.com.

This page intentionally left blank

10MOLECULAR BIOLOGY II:RECOMBINANT DNA,MOLECULAR CLONING, AND ENZYMOLOGY
289
Investigation of the nucleic acids during the first three quarters of the 20th century led tothe significant discovery that all of the cell’s attributes and activities have their origin inDNA. For example, we now believe that the information needed to make all the proteins
in a cell and organism resides in DNA. This discovery prompted biochemists and molecularbiologists to develop laboratory procedures for the manipulation of DNA, because it was sus-pected that changes to DNA could lead to molecular and genetic changes in cells and organ-isms. A culmination of this research activity was the recent announcement of the sequence ofthe human genome (Human Genome Project, 2001). Medical scientists are now applying thenewly developed lab and clinical procedures to the area of gene therapy, where, dysfunctionalgenes that lead to disease are replaced with functional genes that produce viable proteins.
In this chapter, we will discuss some experimental procedures that have moved us to thepoint where the nucleic acids, especially DNA, are now among the easiest biomolecules towork with. Some of the concepts we will encounter include molecular cloning, recombinantDNA, restriction enzymes, nucleic acid blotting, and the polymerase chain reaction.
A. Recombinant DNA Biotechnology 290B. Important Enzymes in Molecular Biology and Biotechnology 297C. Nucleic Acid Blotting 304
Study Problems 304Further Reading 305
C H A P T E R

290 Chapter 10 • Molecular Biology II: Recombinant DNA, Molecular Cloning, and Enzymology
A. RECOMBINANT DNA BIOTECHNOLOGY
Students often perceive biochemistry as a very research-oriented discipline. It iseasy to see how this idea can develop, because every day students listen to theirinstructors talk about research activities, attend research seminars, and watchtheir professors at work on basic research in the laboratory. Students may evenparticipate in their own research projects. Biochemistry is very dependent onresearch activities that are basic and theoretical, but biochemistry has always hada very “practical” or “applied” side. Many of the early biochemical activitieswere encouraged and funded by companies involved in fermentation of beerand wine, baking, nutrition, and pharmaceuticals. We often refer to this practicalside of biochemistry as biotechnology, which is defined as “the practical use ofbiological cells, biomolecules, and biological processes.” We see many examplesof the daily use of applied biochemistry:
1. Using enzymes to catalyze reactions in the industrial production of specialtychemicals.
2. The use of gene-replacement therapy to treat individuals with diseasescaused by dysfunctional genes.
3. Identification of biological specimens at crime scenes.4. Using bacterial cells to produce large quantities of proteins for medical or
industrial use.5. Using bacteria to clean up chemical waste sites.
Today, one of the most active areas of biotechnology, and also the most con-troversial, is the preparation of recombinant DNA for use in molecular cloning.This activity has bioethical considerations because it has the power to change thegenetic characteristics of fundamental life forms, including humans.
Molecular Cloning
Our knowledge of DNA structure and function has increased at a gradual paceover the past 50 years, but some discoveries have had a special impact on theprogress and direction of DNA research. Although DNA was first discovered incell nuclei in 1869, it was not confirmed as the carrier of genetic information until1944. This major discovery was closely followed by the announcement of thedouble-helix structure of DNA in 1953. The more recent development of technol-ogy that allows for genetic manipulation by inserting “foreign” DNA fragmentsinto an organism’s natural, replicating DNA may well have a greater impact onthe direction of DNA research than the earlier discoveries. In the short time sincethe first construction and replication of plasmid recombinant DNA, severalscientific and medical applications of the new technology have been announced.This new era of genetic engineering has captivated the general public and scien-tists alike. Some of the predicted achievements in recombinant DNA researchhave been slow in coming; however, future workers in biochemistry andrelated fields will continue to see advances in the use of recombinant DNA andmolecular cloning (genetic engineering).
Recombinant DNA or molecular cloning consists of the covalent insertionof DNA fragments from one type of cell or organism into the replicating DNA of

Chapter 10 • Molecular Biology II: Recombinant DNA, Molecular Cloning, and Enzymology 291
another type of cell. Many copies of the hybrid DNA may be produced bythe progeny of the recipient cells; hence, the DNA molecule is cloned. If theinserted fragment contains a functional gene carrying the code for a specificprotein, many copies of that gene and translated protein may be produced inthe host cell. This process has become important for the large-scale productionof proteins (insulin, somatostatin, bovine growth hormone, and othermolecules) that are of value in medicine and basic science, but are difficultand expensive to obtain by other methods (see Chapter 11, Section B andTable 11.3, p. 317).
Our current knowledge of recombinant DNA is the result of severalrecent biotechnological advances. The first major breakthrough was the isola-tion of mutant strains of E. coli that are not able to degrade or restrict foreignDNA. These strains are now used as host organisms for the replication ofrecombinant DNA. The second advance was the development of bacterialextrachromosomal DNA (plasmids) and bacteriophage DNA as cloning vehi-cles to carry the DNA to be cloned into host cells. The final, necessary advancewas the development of methods for inserting the foreign DNA into the natu-ral vehicle. Manipulation of DNA was greatly aided by the discovery ofrestriction endonucleases, enzymes that catalyze the hydrolysis of phosphodi-ester bonds at selected sites in DNA (for details, see this chapter, Section B).The enzymes recognize specific base sequences (usually 4–8 bases) and cat-alyze hydrolytic cleavage of both DNA strands in or near the base sequenceregion (Reaction 10.1):
G 9 A 9 A 9 T 9 T 9 C5′ 3′
C 9 T 9 T 9 A 9 A 9 G3′ 5′
OH
HO
G5′+
C 9 T 9 T 9 A 9 A3′
3′A 9 A 9 T 9 T 9 C
G 5′
EcoRI
H2O
The cleavage leads to one of two types of ends in the DNA (Figure 10.1):
C 9 G 9 T 9 C5′+
G 9 C 9 A 9 G 9 A 9 A 9 T 9 G3′
OH
PO32−
T 9 T 9 A 9 C 9 A 9 T 9 G
T 9 A 9 C
PO32−
OH
A Cohesive ends
3′
5′
C 9 C 9 A5′+
G 9 G 9 T3′
OH
PO32−
C 9 T 9 A
G 9 A 9 T
PO32−
OH
B Blunt ends
3′
5′
FIGURE 10.1Results of thecleavage of DNA by a restrictionendonuclease. Twotypes of ends afterDNA cleavage: A Cohesive endsmay remain weaklyassociated byhydrogen bondsbetween comple-mentary bases. B Blunt ends do not overlap.
(Reaction 10.1)

292 Chapter 10 • Molecular Biology II: Recombinant DNA, Molecular Cloning, and Enzymology
C 9 G 9 T 9 C5′
G 9 C 9 A 9 G 9 A 9 A 9 T 9 G3′
HO
PO32−
T 9 T 9 A 9 C 9 A 9 T 9 G
T 9 A 9 C
PO32−
OH
3′
5′
C 9 G 9 T 9 C5′
G 9 C 9 A 9 G 9 A 9 A 9 T 9 G3′
HO
2−O3P
T 9 T 9 A 9 C 9 A 9 T 9 G
T 9 A 9 C
PO32−
OH
3′
5′
C 9 G 9 T 9 C 9 T 9 T 9 A 9 C 9 A 9 T 9 G5′
G 9 C 9 A 9 G 9 A 9 A 9 T 9 G 9 T 9 A 9 C3′
3′
5′
Foreign DNA fragment
ATP DNA ligase
Linearized plasmid
+
FIGURE 10.2Insertion of a DNAfragment into alinearized plasmidusing DNA ligase.DNA ligase catalyzesthe formation ofphosphodiesterbonds.
1. Cohesive (or sticky) ends, where a few bases can remain weakly associatedby hydrogen bonding, or
2. Blunt ends that do not overlap.
Restriction enzymes provide a gentle and specific method for opening (lineariz-ing) circular vectors at predetermined sites, and for preparing fragments of DNAto be cloned.
Methods for covalent joining of the foreign DNA fragment to the vectorends and closure of the circular hybrid plasmid were then developed. Theenzyme, DNA ligase, which can catalyze the ATP-dependent formation of phos-phodiester linkages at the insertion sites, is used for final closure (Figure 10.2).
Steps for Preparing Recombinant DNA
The basic steps involved in performing a recombinant DNA experiment arelisted below and are outlined in Figure 10.3:
1. Select and prepare a DNA fragment (X) that is to be incorporated into ahost cell, where it will be replicated and translated into a protein product.Often the DNA fragment is a specific gene that carries the information forsynthesis of a particular protein or proteins. As shown in Figure 10.3, theforeign DNA to be cloned may be prepared by chemical synthesis (usuallyby the polymerase chain reaction and sequence-specific primers; seeSection B of this chapter), action of restriction endonucleases, or transcriptionof mRNA catalyzed by reverse transcriptase.
2. Choose a vector or vehicle to carry X, the DNA fragment, into the host cell.The vector may be plasmid DNA, DNA from a phage, or yeast artificial

Chapter 10 • Molecular Biology II: Recombinant DNA, Molecular Cloning, and Enzymology 293
Step 1. Obtain gene to be
transferred.
Steps 4 and 5. Introduce recombinant
DNA into host cell.
Steps 2 and 3. Attach gene to vector.
Gene to be
transferred
Gene to be transferred
(with sticky ends)
Gene attached to vector
(recombinant DNA)
Genetically altered host cell
Nucleotides
mRNA encoded
by gene to be
transferred
Discarded
DNA
fragments
Restriction
endonuclease
Conditions that
favor base pairing
Introduce into
host cell
DNA ligase
Sticky
ends
Plasmid
or
viral vector
Restriction
endonuclease
Reverse
transcriptase Chemical
synthesis
FIGURE 10.3Outline of a typicalexperimentalprocedure forconstructingrecombinant DNA.

294 Chapter 10 • Molecular Biology II: Recombinant DNA, Molecular Cloning, and Enzymology
chromosomes. If a circular vector is used (i.e., a plasmid), it must be lin-earized (broken open) in order to accept X. Ideally, the same restrictionenzyme should be used to prepare X and the vehicle so that there is thepossibility of overlapping cohesive ends.
3. Insert the DNA fragment, X, into the vector by overlapping cohesive endsor by modifying blunt ends using homopolymer tails. The final covalentbonds to hold X into the vector are formed by the action of DNA ligase. Thisenzyme catalyzes the ATP-dependent formation of phosphodiester bonds(Figure 10.2). The final product represents a recombinant or hybrid DNA.
4. Introduce the hybrid DNA into a host organism (usually a bacterial cell),where it can be replicated. This process is called transformation. It hasbeen demonstrated that incorporation of a hybrid plasmid or phage DNAinto host E. coli cells is enhanced by the addition of calcium ions .
5. Develop a method for identifying and screening for host cells that haveaccepted and are replicating the hybrid DNA. This is usually accom-plished by screening for antibiotic resistance (Figure 10.4).
Cloning Vectors
Several types of cloning vectors are commonly used today. Some of the mosteffective ones include plasmids and bacteriophage DNA for prokaryotic cells,and yeast artificial chromosomes and baculovirus for eukaryotic cells.
Plasmids
Many bacterial cells contain self-replicating, extrachromosomal DNA moleculescalled plasmids. This form of DNA is closed circular, double-stranded, and muchsmaller than chromosomal DNA; their molecular weights range from to
, which corresponds to between 3000 and 30,000 base pairs. Bacterialplasmids normally contain genetic information for the translation of proteinsthat confer a specialized and sometimes protective characteristic (phenotype) onthe organism. Examples of these characteristics are enzyme systems necessaryfor the production of antibiotics, enzymes that degrade antibiotics, and enzymesfor production of toxins. Plasmids are replicated in the cell by one of two possi-ble modes. Stringent replicated plasmids are present in only a few copies, andrelaxed replicated plasmids are present in many copies, sometimes up to 200. Inaddition, some relaxed plasmids continue to be produced even after the antibi-otic chloramphenicol is used to inhibit chromosomal DNA synthesis in the hostcell. Under these conditions, many copies of the plasmid DNA may be produced(up to 2000 or 3000) and may accumulate to 30% to 40% of the total cellular DNA.
The ideal plasmid cloning vector has the following properties:
1. The plasmid should replicate in a relaxed fashion so that many copies areproduced.
2. The plasmid should be small; then it is easier to separate from the largerchromosomal DNA, easier to handle without physical damage, and probablycontains very few sites for attack by restriction endonucleases.
3. The plasmid should contain identifiable markers so that it is possible to screenprogeny for the presence of the plasmid. At least two selective markers are
20 * 1062 * 106
(Ca2+)

Chapter 10 • Molecular Biology II: Recombinant DNA, Molecular Cloning, and Enzymology 295
Plasmid pBR322
Cleavage by BamHI
Insert DNA fragment
pBR322
Cells will survive
in ampicillin and
tetracycline.
Cells will survive
in ampicillin but
not tetracycline.
pBR322 hybrid
DNA insert
Transformation
+ +
Tet r
Tet r
Amp r
EcoRI
BamHI
Amp r
Linearized plasmid
Cells will not
survive in
ampicillin.
+
FIGURE 10.4Procedure forselecting bacterialcells that containhybrid DNA.

296 Chapter 10 • Molecular Biology II: Recombinant DNA, Molecular Cloning, and Enzymology
desirable, a primary one to confirm the presence of the plasmid, and asecondary one to confirm the insertion of foreign DNA. Resistance toantibiotics is a convenient type of marker.
4. The plasmid should have only one cleavage site for a specific restrictionendonuclease. This provides only two “ends” to which the foreign DNA canbe attached. Ideally, the single restriction site should be within a gene, sothat insertion of the foreign DNA will inactivate the gene (called insertionalmarker inactivation).
E. coli Plasmids
Among the most widely used E. coli plasmids are derivatives of the repliconplasmid ColE1. This plasmid carries a resistance gene against the antibiotic colicin E.The plasmid is under relaxed control, and up to 3000 copies may be producedwhen the proper E. coli strain is grown in the presence of chloramphenicol. Oneespecially useful derivative plasmid of ColE1 is pBR322. It has all the propertiespreviously outlined; in addition, its nucleotide sequence of 4363 base pairs isknown, and it contains several different restriction endonuclease cleavage siteswhere foreign DNA can be inserted. For example, pBR322 has a single restrictionsite for the restriction enzyme EcoRI. In vitro insertion of a foreign DNA fragmentinto the EcoRI cleavage site and incorporation into a host cell (transformation) leadto immunity of the host cell to colicin E1, but the cell is unable to produce colicin.
Useful modifications of the pBR322 plasmid are the pUC plasmids (devel-oped at The University of California). The pUC plasmids have a resistance genefor tetracycline, and sites for restriction endonuclease cleavage are concentratedin a region called the multiple cloning site.
Strains of E. coli are most often used as host cells because they are easy togrow and maintain. The rate of growth is exponential and can be monitored bymeasuring the absorbance of a culture sample at 600 nm. One absorbance unit cor-responds to a cell density of approximately cells/mL. Some E. coli strainsthat harbor the ColE1 plasmids are RR1, HB101, GM48, 294, SK1592, JC411Thy/ColE1, and CR34/ColE1. The typical procedure for growth and amplification ofplasmids is, first, to establish the cells in normal medium for several hours. Analiquot of this culture is then used to inoculate medium containing the appropri-ate antibiotic. After overnight growth, a new portion of medium containing theantibiotic is inoculated with an aliquot of overnight culture. After the culture hasbeen firmly established, a solution of chloramphenicol is added to inhibit chro-mosomal DNA synthesis. The ColE1 plasmids continue to replicate. The cultureis then incubated for 12 to 18 hours and harvested by centrifugation.
Other Cloning Vectors
Another useful and widely used cloning vector is the DNA from bacteriophage .The DNA from phage is a double-stranded molecule with about 50,000 basepairs. It has many advantages as a cloning vector for prokaryotic proteins:
1. Many copies of recombinant phage DNA may be replicated in a host cell.2. The recombinant phage DNA may be packaged as a viral particle for infecting
the host bacteria.
l
L
8 * 108

Chapter 10 • Molecular Biology II: Recombinant DNA, Molecular Cloning, and Enzymology 297
3. Because phage DNA is larger than plasmid DNA, it is possible to insertlarger fragments of DNA that include smaller fragments of eukaryoticDNA. The inserted DNA may be as large as 25,000 base pairs.
The insertion of larger DNA, including eukaryotic DNA that may containover a million base pairs, is more efficiently done with yeast artificial chromo-somes (YACs) or the baculovirus expression vector system (BEVS). YACs con-taining DNA inserts of 100,000 to 1,000,000 base pairs may be prepared forcloning. The baculoviruses are double-stranded DNA viruses that have as theirnatural hosts different insect species. They are not known to infect vertebratehosts. The BEVS may be used to express complex proteins that require specialprocesses like proteolytic cleavage, intron splicing, chemical modifications(phosphorylation or glycosylation of hydroxyl group), formation of disulfidebonds, and proper protein folding.
l
STUDY EXERCISE 10.1 Cloning Vectors
Use PubMed or a similar computer search to look for new cloning vectors that havebeen developed since publication of this book.
B. IMPORTANT ENZYMES IN MOLECULAR BIOLOGY AND BIOTECHNOLOGY
The Restriction Endonucleases
Bacterial cells produce many enzymes that act to degrade various forms of DNA.Of special interest are the restriction endonucleases, or restriction enzymes, thatrecognize specific base sequences in double-stranded DNA and catalyze hydrolyticcleavage of the two strands in or near that specific region. The biological function ofthese enzymes is to degrade or restrict foreign DNA molecules. Host DNA is pro-tected from hydrolysis because some bases near the cleavage sites are methylated.The action of the restriction enzyme EcoRI is shown in Reaction 10.1.
The site of action of EcoRI is a specific hexanucleotide sequence. Two phos-phodiester bonds are hydrolyzed (see arrows), resulting in fragmentation of bothstrands. Note the twofold rotational symmetry feature at the recognition site andthe formation of cohesive ends. The weak base pairing between the cohesiveends is not sufficient to hold the two fragments together.
At the present time, more than 3500 restriction enzymes have been isolatedand characterized. Nomenclature for the enzymes consists of a three-letter itali-cized abbreviation representing the source a letter representingthe strain (R), and a Roman numeral designating the order of discovery. EcoRI isthe first to be isolated from E. coli (strain R) and characterized. Table 10.1 listsseveral other restriction enzymes, their recognition sequence for cleavage, andoptimum reaction conditions. A useful Web site for the restriction enzymes isREBASE: http://rebase.neb.com.
(Eco = E. coli),

298 Chapter 10 • Molecular Biology II: Recombinant DNA, Molecular Cloning, and Enzymology
Applications of Restriction Enzymes
Restriction enzymes are used extensively in nucleic acid chemistry. They maybe used to cleave large DNA molecules into smaller fragments that are moreamenable to analysis. For example, phage DNA, a linear, double-strandedmolecule of 48,502 base pairs (molecular weight ), is cleaved into sixfragments by EcoRI or into more than 50 fragments by Hinf I (Haemophilusinfluenzae, serotype f). The base sequence recognized by a restriction enzyme islikely to occur only a very few times in any particular DNA molecule; therefore,the smaller the DNA molecule, the fewer the number of specific sites. The phage DNA is cleaved into 0 to 50 or more fragments, depending on the restric-tion enzyme used, whereas larger bacterial or animal DNA will most likely havemany recognition sites and be cleaved into hundreds of fragments. Smaller DNAmolecules, therefore, have a much greater chance of producing a unique set offragments with a particular restriction enzyme. It is unlikely that this set of frag-ments will be the same for any two different DNA molecules, so the fragmenta-tion pattern is unique and can be considered a “fingerprint” of the DNAsubstrate. The fragments are readily separated and sized by agarose gelelectrophoresis.
Restriction endonucleases are also valuable tools in the construction ofhybrid DNA molecules. Several restriction enzymes act on bacterial plasmidvehicles that have only a single site of cleavage. This linearizes the circular plas-mid and allows for the insertion of a foreign DNA fragment. For example, the
l
31 * 106l
TABLE 10.1 Specificity and Optimal Conditions for Several Restriction Endonucleases
Name Recognition Sequence 5 ... ... ... 3œœ T (°C) pHTris
(mM)NaCl(mM)
MgCl2(mM)
DTT2
(mM)
AatII G — A — C — G — T — CT 37 7.9 20 50 10 10
AluI A — G — C — TT 37 7.5 10 50 10 10
BalI T — G — G — C — C — AT 37 7.9 6 – 6 6
BamHI G — G — A — T — C — CT 37 8.0 20 100 0.7 1
BclI T — G — A — T — C — AT 60 7.5 10 50 10 1
EcoRI G — A — A — T — T — CT 37 7.5 10 100 10 1
HaeII Pu1 — G — C — G — C — Py1T 37 7.5 10 50 10 10
HindIII A — A — G — C — T — TT 37–55 7.5 10 60 10 1
HpaI G — T — T — A — A — CT 37 7.5 10 50 10 1
MseI T — T — A — AT 37 7.9 10 50 10 1
NotI G — C — G — G — C — C — G — CT 37 7.9 10 150 10 –
SalI G — T — C — G — A — CT 37 8.0 10 150 10 1
ScaI A — G — T — A — C — TT 37 7.4 10 100 10 1
TaqI T — C — G — AT 65 8.4 10 100 10 10
1 Py = a pyrimidine base.Pu = a purine base;2DTT = dithiothreitol.

Chapter 10 • Molecular Biology II: Recombinant DNA, Molecular Cloning, and Enzymology 299
popular plasmid vehicle pBR322 has a single restriction site for BamHI (Bacillusamyloliquefaciens, H) that is within the tetracycline resistance gene. The enzymenot only opens the plasmid for insertion of a DNA fragment, but also destroys aphenotype; this fact aids in the selection of transformed bacteria.
Restriction enzymes can be used to produce physical maps of DNA mole-cules. Important information can be obtained from maps of DNA, whether themolecules are small and contain only a few genes, such as viral or plasmidDNA, or large and complex, such as bacterial or eukaryotic chromosomalDNA. An understanding of the genetics, metabolism, and regulation of anorganism requires knowledge of the precise arrangement of its genetic mate-rial. The construction of a restriction enzyme map for a DNA molecule pro-vides some of this information. Such a map displays the sites of cleavage byrestriction endonucleases and the number of fragments obtained after diges-tion with each enzyme.
A restriction enzyme map is constructed by first digesting plasmid DNAwith restriction endonucleases that yield only a few fragments. Each digest ofDNA obtained with a single nuclease is analyzed by agarose gel electrophoresis,using standards for molecular weight determination. These are referred to as theprimary digests. Second, each of the primary digests is treated with a series ofadditional restriction enzymes, and the digests are analyzed by agarose gel elec-trophoresis. The restriction map is then constructed by combining the variousfragments by trial and error and logic, much as in sequencing a protein by prote-olytic digestion by several enzymes and searching for overlap regions in thefragments. In the case of the restriction endonuclease digests, two characteristicsof the DNA fragments are known: the approximate molecular weights (fromelectrophoresis) and the nature of the fragment ends (from the known selectivityof the individual restriction enzymes). The fragments may also be sequenced bythe Sanger or Maxam-Gilbert method. A restriction enzyme map for the plasmidpBR322 is shown in Figure 10.5.
Practical Aspects of Restriction Enzyme Use
Restriction enzymes are heat-labile and expensive biochemical reagents. Theiruse requires considerable planning and care. Each restriction nuclease has beenexamined for optimal reaction conditions in regard to specific pH range, buffercomposition, and incubation temperature. This information for each enzyme isreadily available from the commercial supplier of the enzyme or from the litera-ture. Table 10.1 gives important reaction information for several enzymes. Thetemperature range and pH optima for most restriction nucleases are similar(37°C, 7.5–8.0); however, optimal buffer composition is variable. Typical buffercomponents are Tris, NaCl, MgCl2, and a sulfhydryl reagent ( -mercaptoethanolor dithiothreitol). Proper reaction conditions are crucial for optimal reaction rate,but, more importantly, changing reaction conditions have been shown to alterthe specificity of some restriction enzymes.
Although restriction enzymes are very unstable reagents, they can bestored at -20°C in a buffer containing 50% glycerol. They are usually prepared inan appropriate buffer and shipped in packages containing dry ice.
b
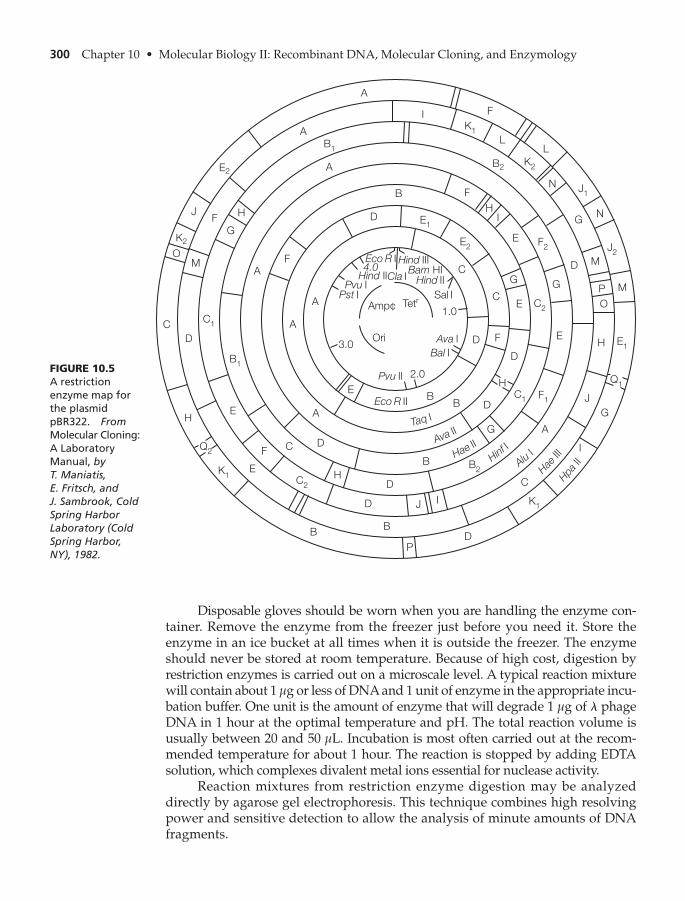
300 Chapter 10 • Molecular Biology II: Recombinant DNA, Molecular Cloning, and Enzymology
Disposable gloves should be worn when you are handling the enzyme con-tainer. Remove the enzyme from the freezer just before you need it. Store theenzyme in an ice bucket at all times when it is outside the freezer. The enzymeshould never be stored at room temperature. Because of high cost, digestion byrestriction enzymes is carried out on a microscale level. A typical reaction mixturewill contain about 1 μg or less of DNA and 1 unit of enzyme in the appropriate incu-bation buffer. One unit is the amount of enzyme that will degrade 1 μg of phageDNA in 1 hour at the optimal temperature and pH. The total reaction volume isusually between 20 and 50 μL. Incubation is most often carried out at the recom-mended temperature for about 1 hour. The reaction is stopped by adding EDTAsolution, which complexes divalent metal ions essential for nuclease activity.
Reaction mixtures from restriction enzyme digestion may be analyzeddirectly by agarose gel electrophoresis. This technique combines high resolvingpower and sensitive detection to allow the analysis of minute amounts of DNAfragments.
l
C
D
C1
B1
EH
FQ
2
A
A
A
A
FM
K2
O
JF
G
E2 A
B1
A
A
D
B
H
I
E1
K1
F
F
L
B2K
2
L
HI
E2
E F2
N J1
NG
DCG
C
G
E C2
D
M
J2
P
O
M
D
F
H
EH
J
E1
Q1
G
A
F1
C1
D
G
B
B
D
I
C
DP
B
D J I
B2
B
H
C D
C2
EK1
Eco R I
Eco R II
Amp¢
Hind Il
Hind III
Hind II
Tetr
Ori3.0
Pvu II
Pvu IPst I Sal I
1.0
Ava I
Bal I
2.0
Bam HICla I
E
Taq I
Ava II
Hae II
B
Hinf I
AluI
Hae
IIIHpa
II
K1
4.0
FIGURE 10.5A restrictionenzyme map forthe plasmidpBR322. FromMolecular Cloning:A LaboratoryManual, byT. Maniatis, E. Fritsch, and J. Sambrook, ColdSpring HarborLaboratory (ColdSpring Harbor,NY), 1982.

Chapter 10 • Molecular Biology II: Recombinant DNA, Molecular Cloning, and Enzymology 301
The Polymerase Chain Reaction
Producing multiple copies of a particular DNA fragment need not alwaysrequire the tedious and time-consuming procedures of molecular cloning asdescribed in Section A of this chapter. If at least part of the sequence of a DNAfragment is known, it is possible to make many copies using the polymerasechain reaction (PCR). The PCR method was conceived by Kary Mullis (1993recipient of the Nobel Prize in chemistry) during a moonlit drive through themountains of northern California.
Fundamentals of the PCR
The fundamentals of this relatively simple process are outlined here using a frag-ment of double-stranded DNA. The DNA template is divided into five regions,designated I to V in Figure 10.6. The complementary regions are I to V’. Theregion targeted for amplification is III (and III ), which can be reproduced byPCR if the nucleotide sequences of the flanking regions, II’ and IV’, are known.Experimental requirements for the PCR include:
1. Two synthetic oligonucleotide primers of about 20 base pairs each, whichare complementary to the flanking sequences II and IV and also have simi-lar binding ability.
2. A heat-stable DNA polymerase.3. The four deoxyribonucleoside triphosphates, dATP, dGTP, dCTP, and dTTP.
The PCR is performed in cycles of three steps. Each cycle consists of:
1. Denaturation to achieve template DNA strand separation is done by heatinga mixture of all components at 95°C for about 15 s.
2. Abrupt cooling of the mixture to the range of 37–55°C allows the primers tohybridize with the appropriate flanking regions. The primers are orientedon the template so their 3 ends are directed toward each other. Synthesis ofDNA extends across regions III and III . Note the dual roles played by thecomplementary oligonucleotides: they locate the starting points for dupli-cation of the desired DNA segment, and they serve as 3 -hydroxy primersto initiate DNA synthesis. A large excess of primers to DNA is added to thereaction mixture to favor hybridization and prevent reannealing of theDNA template strands.
3. Synthesis of the targeted DNA is catalyzed by Taq DNA polymerase. Thetemperature is raised to 72°C to enhance the rate of the polymerizationreaction. The enzyme extends both primers, producing two new strands ofDNA, II-III-IV-V and I’-II -III -IV’. The chosen polymerase is from a ther-mophilic bacterium, Thermus aquaticus, an organism originally discoveredin a Yellowstone National Park hot spring. Other useful polymerases have
¿¿
¿
¿¿
¿¿
STUDY EXERCISE 10.2 Restriction Enzymes
What is the class of the restriction enzyme, EcoRI? See Table 8.3 for classes, p. 251.

302 Chapter 10 • Molecular Biology II: Recombinant DNA, Molecular Cloning, and Enzymology
A Separate strands
by heating to 95ºC
Target sequence
III
5′I
I′
3′
3′ 5′
B Hybridize primers
by cooling to 50ºC
5′ 3′
3′ 5′
C DNA is synthesized
by extending the primers at 72ºC
II
II′
IV
IV′
V
V′III′
5′
I′
3′
3′ 5′II′ IV′III′
III
3′
3′ 5′
II IV V
5′ 3′
3′ 5′
IV
IV′
3′ 5′II′
5′ 3′II
5′
FIGURE 10.6 Thepolymerase chainreaction has threesteps: A Strandseparation byheating at 95°C. B Hybridizationof the primers. C Extension of theprimers by DNAsynthesis. Segmentsare labeled I, II, III,IV, and V on theoriginal DNA strandand I¿, II¿, III¿, IV¿,and V¿ on thecomplementarystrand. Primer II hasdiagonal lines andprimer IV¿ has dots.Newly synthesizedDNA is shown in black.
been isolated from bacteria found in geothermal vents on the ocean floor.These enzymes are heat stable, so the reaction can be carried out at a hightemperature, leading to a high rate of DNA synthesis. The DNA synthesisreaction is usually complete in about 30 s.
The usefulness of the PCR lies in its three steps—denaturation, hybridization,and DNA synthesis—that can be repeated many times simply by changing thetemperature of the reaction mixture. Each newly synthesized strand of DNA canserve as a template, so the target DNA concentration increases at an exponential rate.In a process consisting of 20 cycles, the amplification for the DNA fragment is about

Chapter 10 • Molecular Biology II: Recombinant DNA, Molecular Cloning, and Enzymology 303
a millionfold. Thirty cycles, which can be completed in 1–3 hours, provide a billion-fold amplification. Theoretically, one could begin with a single molecule of targetDNA and produce in 1 hour enough DNA for the Sanger dideoxy chain-terminatingsequence procedure. Another benefit of the PCR is its simplicity. Commerciallyavailable instruments called thermocyclers allow the laboratory technician tomix the reagents and insert the reaction mixture in the cycler, which thenautomatically repeats the reaction steps by changing temperatures.
The PCR has become a routine tool in basic research carried out in univer-sities, hospitals, and pharmaceutical companies. It is especially useful for ampli-fying small amounts of DNA for sequencing. It was used widely in the HumanGenome Project, which in 2001 announced the sequence of the 3 billion basepairs in the human genome.
Applications of the PCR
Diagnostic Medicine
PCR may be used to detect the presence of infectious bacteria and viruses in anindividual even before symptoms begin to appear. HIV infection is usually con-firmed using tests that detect serum antibody proteins made against the viralproteins. However, there may be a period of at least six months between infec-tion and when the anti-HIV antibodies reach a detectable concentration. PCR canbe used to detect proviral DNA. An especially important application is the iden-tification of HIV-infected infants. The antibody-based test cannot be done oninfants because they have maternal antibodies for up to 15 months after birth.Other medical applications of PCR include early detection of tuberculosis andcancers, especially leukemias, and analysis of small samples of amniotic fluid todetect genetic abnormalities in fetuses.
Forensics
Recovery of fingerprints from a crime scene has been a long-standing and well-accepted method in forensics. A new procedure, DNA fingerprinting, is beingdeveloped and achieving widespread use. DNA fingerprinting is the biochemicalanalysis of DNA in biological samples (semen, blood, saliva) remaining at a crimescene. Since every individual possesses a unique hereditary composition, each indi-vidual has a characteristic phenotype that is reflected in his or her DNA sequence.DNA fingerprinting attempts to show the genetic variations that are found fromperson to person. These differences can be detected by analysis of an individual’sDNA. Two experimental methods are currently used in DNA fingerprinting:
1. Restriction Fragment Length Polymorphisms (RFLPs) In this method,DNA samples are digested with restriction enzymes. The resulting fragmentsare separated by gel electrophoresis, blotted onto a membrane, hybridized toa DNA probe, and analyzed by autoradiography (see Section C on blotting inthis chapter). Results vary from individual to individual (except in the case ofidentical twins, who have identical DNA) because of their differences inDNA sequence. Since each person’s DNA has a unique sequence pattern, therestriction enzymes cut differently and lead to different-sized fragments.
2. PCR-Based Analysis The second method of DNA fingerprinting involvesthe use of PCR-amplified DNA. Allele-specific oligonucleotide (ASO)

primers are used for amplification of specific sequences. PCR-based DNAfingerprinting has many advantages over RFLP methods, including speed,simplicity, no requirements for radioactive probes, and greater sensitivity.DNA from a single hair or minute samples of blood, saliva, and semen canbe analyzed.
C. NUCLEIC ACID BLOTTING
Many of the procedures for isolating and characterizing DNA and RNA mole-cules discussed in Chapters 9 and 10 depend on the separation of nucleic acidsby an electrophoresis step, followed by some kind of analysis of the gel bands.Although electrophoresis provides excellent separation of molecules, themethod gives no indication as to the identity of the molecules at each band. Asdescribed in Chapter 6, Section C, p. 192, membrane blotting techniques arenow available for functional analysis of the molecules at each electrophoresisband.
The first blotting technique was reported by E. Southern in 1975. Usinglabeled complementary DNA probes, he searched for certain nucleotidesequences among DNA molecules blotted from the gel. This technique of detectingDNA-DNA hybridization is called Southern blotting. The general blottingtechnique has now been extended to the transfer and detection of specific RNA(for example, mRNA) using labeled complementary DNA probes (Northernblotting) and the transfer and detection of proteins that react with specificantibodies (Western blotting).
Blotting techniques have many applications, including mapping the genesresponsible for inherited diseases by using restriction fragment length polymor-phisms (RFLPs), screening collections of cloned DNA fragments (DNA libraries),and DNA fingerprinting for analysis of biological material remaining at thescene of a crime.
304 Chapter 10 • Molecular Biology II: Recombinant DNA, Molecular Cloning, and Enzymology
Study Problems
1. Explain the action of ampicillin as an inducer of plasmid replication.2. How does chloramphenicol inhibit protein synthesis?3. Why is polyacrylamide gel electrophoresis not suitable for analysis of most plasmid
DNA?4. Why is a wavelength of 600 nm used to measure growth of bacteria? Could other
wavelengths be used?5. How does the addition of an EDTA solution stop a restriction enzyme reaction?6. What kind of chemical bonding holds cohesive ends together after action of a restric-
tion enzyme?7. Which of the following base sequences are probably not recognition sites for cleavage
by restriction endonucleases? Why not?(a) 5 GAATTC 3(b) 5 CATTAG 3(c) 5 CATATG 3(d) 5 CAATTG 3¿¿
¿¿¿¿¿¿

Chapter 10 • Molecular Biology II: Recombinant DNA, Molecular Cloning, and Enzymology 305
Further Reading
W. Backman, Trends Biochem. Sci. 26, 268–270 (2001). “The Advent of GeneticEngineering.”
W. Bains, Biotechnology from A to Z, 3rd ed. (2003), Oxford University Press (New York).J. Berg, J. Tymoczko, and L. Stryer, Biochemistry, 6th ed. (2007), Freeman (New York).R. Boyer, Concepts in Biochemistry, 3rd ed. (2006), John Wiley & Sons (Hoboken, NJ).
Chapter 13 covers biotechnology.J. Brooks, Methods in Enzymol. 152, 113–129 (1987). “Properties and Uses of Restriction
Endonucleases.”T. Brown, Gene Cloning and DNA Analysis, 4th ed. (2001), Blackwell Science
(Malden, MA).F. Collins et al., Nature, 409 708–745 (2001). The human genome.C. Dieffenbach and G. Dveksier (Editors), PCR Primer: A Laboratory Manual, 2nd ed.
(2003), Cold Spring Harbor Laboratory Press (Cold Spring Harbor, NY).R. Garrett and C. Grisham, Biochemistry, 4th ed. (2010), Brooks/Cole (Belmont, CA).B. Glick et al., Molecular Biotechnology: Principles and Applications of Recombinant
DNA, 4th ed. (2009), ASM Press (Washington, DC).C. Hardin, et al. (Editors), Cloning, Gene Expression and Protein Purification: Experimental
Procedures and Process Rationale (2001), Oxford University Press (New York). E. Hilario and J. MacKay (Editors), Protocols for Nucleic Acid Analysis by Nonradioactive
Probes, 2nd ed. (2007), Humana Press (New York).S. Metzenberg, Working with DNA (2007), Taylor and Francis (New York).K. Mullis, Sci. Am. 263(4), 56–65 (1990). “The Unusual Origin of the Polymerase Chain
Reaction.”D. Nelson and M. Cox, Lehninger Principles of Biochemistry, 5th ed. (2009), Freeman
(New York).D. Nicholl, An Introduction to Genetic Engineering, 2nd ed. (2003), Cambridge University
Press (Cambridge, UK).W. Ream and K. Field, Molecular Biology Techniques: An Intensive Laboratory Course
(1998), Academic Press (San Diego).J. Sambrook and D. Russell, Molecular Cloning: A Laboratory Manual, 3rd ed. (2001),
Cold Spring Harbor Laboratory Press (Cold Spring Harbor, NY).C. Tsai, Computational Biochemistry (2002), Wiley-Liss (New York). Chapters 9 and 10
cover nucleotide sequencing and recombinant DNA.J. Venter, Science 291, 1304 (2001). “The Sequence of the Human Genome.”D. Voet and J. Voet, Biochemistry, 3rd ed. (2005), John Wiley & Sons (Hoboken, NJ).J. Watson et al., Molecular Biology of the Gene, 5th ed. (2004), Benjamin/Cummings
(San Francisco).
8. Use the REBASE Web site (http://rebase.neb.com) to search for information about therestriction enzymes listed below. For each enzyme, find the recognition sequence andthe cleavage site, and determine if the DNA cut ends are blunt or cohesive.(a) ApaI(b) SpmI(c) AluI
9. How many DNA fragments result from the action of restriction enzyme HaeII on theplasmid pBR322?
10. Assume the reaction digest from Problem 8 is analyzed by agarose gel electrophoresis.Draw an electrophoresis gel and show the approximate locations of each fragment.

306 Chapter 10 • Molecular Biology II: Recombinant DNA, Molecular Cloning, and Enzymology
J. Watson et al. Recombinant DNA: Genes and Genomes—A Short Course, 3rd ed. (2006),W. H. Freeman (New York).
L. Yount (Editor), Cloning (2000), Greenhaven Press (San Diego).B. Zimm, Trends Biochem. Sci. 24, 121–123 (1999). “One Chromosome: One DNA
Molecule.”
http://www.fermentas.comClick on “Products,” then “Conventional Restriction Endonucleases” for a listing of
enzymes.
http://rebase.neb.comThe Restriction Enzyme Database.
http://www.tutorvista.com/content/biology/biology-iii/biotechnology/biotechnology-tools.phpEnzymes of recombinant DNA.
http://www.rpi.edu/dept/chem-eng/Biotech-Environ/Projects00/rdna/rdna.htmlRecombinant DNA.
http://biog-101-104.bio.cornell.edu/BIOG101_104/tutorials/recomb_DNA.htmlRecombinant DNA.
http://www.biochem.arizona.edu/classes/bioc471/pages/materials.htmlAn excellent resource on recombinant DNA.
http://en.wikipedia.org/wiki/Restriction_enzymeRestriction enzymes.
Additional Web sites for this chapter are available on the book’s Companion Website,which can be found at http://www.chemplace.com.)

11PROTEIN PRODUCTION,PURIFICATION, ANDCHARACTERIZATION
307
Proteins are often considered the workhorses among biomolecules, as they are responsi-ble for the general maintenance and daily functioning of cells and organisms. The pro-teins are extremely versatile functional molecules, as they serve roles in biological
catalysis (enzymes), immune response (antibodies), structural integrity, muscle contraction,cell regulation, and storage/transport processes. Because of their roles as essential biomole-cules, there has always been intense interest in the extraction of proteins from their naturalsources and in their characterization in terms of structure and biological function. In thischapter, we will focus on the purification procedures that are used to obtain native proteinmolecules that may be further characterized. The new discipline of proteomics, the study ofthe thousands of proteins expressed in cells and organisms and how the proteins interact witheach other, has renewed interest in the development of methods for their isolation and charac-terization. Because the normal concentration of proteins in cells is quite low, there is a stronginterest in designing methods to enhance their production. Recombinant DNA proceduresnow play a major role in the production of relatively large quantities of scarce proteins forbasic scientific study and for medical and industrial applications. In the medical technique ofgene therapy, a hybrid DNA containing the genes for the desired protein is transferred into ahost cell, which acts as a factory to produce the desired protein.
A. Procedures for the Purification of Proteins 308B. Production of Proteins by Expression of Foreign Genes 317C. Protein Characterization 322D. Determination of Primary Structure 323
Study Problems 328Further Reading 328
C H A P T E R

308 Chapter 11 • Protein Production, Purification, and Characterization
A. PROCEDURES FOR THE PURIFICATION OF PROTEINS
Protein purification is an activity that has occupied the time of biochemists andmolecular life scientists throughout the last two centuries. In fact, a largepercentage of the biochemical literature is a description of how specific proteinshave been separated from thousands of other proteins and other biomolecules intissues, cells, and biological fluids. Biochemical investigations of all biologicalprocesses require, at some time, the isolation, purification, and characterizationof a protein. In contrast to the repetitive procedures for isolation of DNA andRNA (see Chapter 9, Section B, p. 275), there is no single technique or sequence oftechniques that can be followed to isolate and purify all proteins. It is sometimesstill necessary to proceed by trial and error. Fortunately, the experiences and dis-coveries of thousands of scientists have been combined so that, today, a general,systematic approach is available for protein isolation and purification.
Composition of Proteins
All proteins found in nature are constructed by amide linkages between -aminoacids. The amino acids are selected from a group of 20 molecules that have com-mon structural characteristics. They each have at least one carboxyl group and atleast one amino group (Figure 11.1). The distinctive physical, chemical, and bio-logical properties associated with an amino acid are the result of the R group, aside chain that is unique for each amino acid. A list of the 20 common aminoacids and their one-letter and three-letter abbreviations are given in Table 11.1. Ifyou are not yet familiar with the general structures and properties of amino acidsand proteins, refer to your general biochemistry text.
a
H3N+
C
R
COO_
H
FIGURE 11.1 Thegeneral structure ofthe zwitterionicform of an L-aminoacid. R representsthe side chain.
STUDY EXERCISE 11.1 Peptide Structure
Draw the structure of this peptide: Asp-Phe-Ala-Lys-Trp.
Amount of Protein Versus Purity of Protein Versus Expense
The procedure selected for protein purification is dependent primarily on howmuch of the protein is needed and how pure the protein must be; in other words,what is the purpose for isolating the protein? In terms of amount, one usuallythinks on two scales: preparative, isolation of larger quantities (several mil-ligrams or grams) to use for further characterization or structure and functionstudies; or analytical, isolation of microgram or milligram quantities in order tomake a few precise measurements such as molecular weight, sequencing, orstructure determination by NMR or X-ray diffraction.

Chapter 11 • Protein Production, Purification, and Characterization 309
TABLE 11.1 Abbreviations of the 20 Common AminoAcids Found in Proteins
Abbreviation
Name One-letter Three-letter
Glycine G Gly
Alanine A Ala
Valine V Val
Leucine L Leu
Isoleucine I Ile
Methionine M Met
Phenylalanine F Phe
Proline P Pro
Serine S Ser
Threonine T Thr
Cysteine C Cys
Asparagine N Asn
Glutamine Q Gln
Tyrosine Y Tyr
Tryptophan W Trp
Aspartate D Asp
Glutamate E Glu
Histidine H His
Lysine K Lys
Arginine R Arg
In terms of purity, a protein sample is considered pure when it contains asingle type of protein. It is not practically possible to obtain a protein in 100%purity, but most studies can be done on samples that are 90–95% pure. It often isnot worth the extra time and reagent expense to purify a protein greater than 90%unless absolutely necessary. In general, the best purification scheme is one thatyields the maximum (or appropriate) amount of the protein, of desired purity,with a minimum amount of time and expense. The following discussion outlinesthe basic steps available to develop a protein purification scheme (Table 11.2).
Basic Steps in Protein Purification
Development of Protein Assay
First and foremost in any protein purification scheme is the development of anassay for the protein. This procedure, which may have a physical, chemical, orbiological basis, is necessary in order to determine quantitatively and/or

310 Chapter 11 • Protein Production, Purification, and Characterization
TABLE 11.2 Typical Sequence for the Purification of a Protein
1. Develop an assay for the desired protein.
2. Select the biological source of the protein, including use of recombinant DNAtechniques.
3. Release the protein from the source and solubilize it in an aqueous buffer system.
4. Fractionate the cell components by physical methods (centrifugation).
5. Separate the biomolecules present by differential solubility.
6. Apply chromatographic procedures.
(a) Gel-filtration chromatography
(b) Ion-exchange chromatography
(c) Affinity chromatography
7. Isoelectric focusing, if desired.
8. Determine purity by electrophoresis or HPLC.
qualitatively the presence of the specific protein. During the early stages of thepurification, the particular protein desired must be distinguished from thou-sands of other proteins present in the crude cell homogenate. The desired pro-tein may be less than 0.1% of the total protein. It should be obvious that thegeneral protein assays (spectrophotometric, Bradford, Lowry, etc.; see Chapter 3,Section B, p. 67) are not useful as assays for a specific protein, because theysimply indicate the total protein present. If the desired protein is an enzyme,the obvious assay should be based on biological function, that is, a measure-ment of the enzymatic activity after each isolation–purification step. If the protein to be isolated is not an enzyme or if the biological activity is unknown,physical or chemical methods must be used. One of the most useful analyticalmethods is electrophoresis. If an antibody has been prepared against the desired protein, it may be analyzed by electrophoresis and monitored duringpurification using Western blotting (see Chapter 6, Section C, p. 192).
Source of the Protein
We next consider the selection of the source from which the protein will be isolat-ed. If the objective is simply to obtain a large quantity of a protein for furtherstudy, you would choose a source that contains large amounts of the protein. Apossible choice is an organ from a large animal that can be obtained from a localslaughterhouse. Microorganisms are also good sources because they can beharvested in large quantities. If, however, you desire a specific protein from aspecific type of organism, tissue, cell, cell organelle, or biological fluid, the sourceis limited. For example, if one desires to study the enzymes involved inglycolysis in the alfalfa plant, one would begin with leaves of the plant.
If the desired protein is known to be located in an organelle or subcompart-ment of the cell, partial purification of the protein is achieved by isolating theorganelle by fractional centrifugation (Chapter 4, Section C, Figure 4.11, p. 107).If the protein is, instead, in the soluble cytoplasm of the cell, it will remain dis-solved in the final supernatant obtained after centrifugation at 100,000 * g.

Chapter 11 • Protein Production, Purification, and Characterization 311
With the introduction of techniques in recombinant DNA research, it isnow possible to synthesize relatively large quantities of specific proteins inselected host cells. One begins by preparing the recombinant DNA, which con-sists of inserting the specific gene that contains the code for the desired protein,along with appropriate promoters and markers, into a plasmid or other vector.The recombinant DNA may then be transferred to a host cell (E. coli, or otherbacteria, or yeast), and the host cell is then allowed to grow and synthesize thedesired protein (molecular cloning, Chapter 10, Section A, p. 290). This proce-dure has several advantages over the traditional method of isolating and purify-ing proteins as described in the previous paragraphs and in Table 11.2. Some ofthe benefits of using recombinant DNA include:
• Overexpression of the protein is possible, which produces relatively largeamounts; this is especially helpful when dealing with scarce proteins, orwith proteins for commercial or medical applications.
• Conditions can be controlled so there is less degradation of the desired pro-tein by proteases and less contamination by other biomolecules. Thismakes it easier to isolate and purify the protein from the host cell. Somesteps in Table 11.2 may be eliminated.
• With the use of genetic engineering techniques, including mutation, it ispossible to produce modified proteins, i.e., proteins with one or moreamino acid changes.
Because the techniques for purifying a protein using recombinant DNA proceduresare somewhat different than those of traditional isolation and purification, a special section will be devoted to protein production by cloning (Section B of thischapter, p. 317).
Preparation of the Crude Extract
Once the protein source has been selected, the next step is to release the desiredprotein from its natural cellular environment and solubilize it in aqueous solu-tion. This calls for disruption of the cell membrane without damage to the cellcontents. Proteins are relatively fragile molecules, and only gentle proceduresare allowed at this stage. The gentlest methods for cell breakage are osmoticlysis, gentle grinding in hand-operated glass homogenizers, and disruption byultrasonic waves. These methods are useful for “soft tissue,” as found in greenplants and animals. When dealing with bacterial cells, in which rigid cell wallsare present, the most effective methods are grinding in a mortar with an inertabrasive such as sand or alumina, or treatment with lysozyme and/or a deter-gent. Lysozyme is an enzyme that catalyzes the hydrolysis of polysaccharidemoieties present in cell walls. When very resistant cell walls are encountered(yeast, for example), the French press must be used. Here the cells are disruptedby passage, under high pressure, through a small hole.
Osmotic lysis consists of suspending cells in a solution of relatively highionic strength. This causes water inside the cell to diffuse out through the mem-brane. The cells are then isolated by centrifugation and transferred to pure water.Water rapidly diffuses into the cell, bursting the membrane.

312 Chapter 11 • Protein Production, Purification, and Characterization
Another alternative, gentle grinding, is best accomplished with a glass orTeflon homogenizer. This consists of a glass tube with a close-fitting piston.Several varieties are shown in Figure 11.2A, B. The cells are forced against theglass walls under the pressure of the piston, and the cell components are releasedinto an aqueous solution.
Ultrasonic waves, produced by a sonicator, are transmitted into a suspensionof cells by a metal probe (Figure 11.2C). The vibration set up by the ultrasonicwaves disrupts the cell membrane, releasing the cell components into thesurrounding aqueous solution.
A less gentle, but widely used, solubilization device is the common electricblender. This method may be used for plant or animal tissue, but it is not effec-tive for disruption of bacterial cell walls. A tool that is more scientificallydesigned is the rotor stator homogenizer (Figure 11.2D). The stator is a hollowtube and the rotor, attached to the stator, is a rapidly turning knife blade. Cellsare torn apart by the turbulence and shear generated by the rotor.
The most recently developed homogenizer is the so-called cell bomb,which makes use of high pressure and decompression to disrupt cells. In thistechnique, a gas, usually nitrogen, helium, or air, is forced into cells under highpressure. When the pressure is released, expanding bubbles of the gas (nebuliza-tion) rupture the cell membrane. Cell bombs are available with pressure rangesof 250 to 25,000 psi. Cell bombs have an advantage over sonicators in that theycause no temperature increase that can denature proteins. A disadvantage of cellbombs is the potential for explosions because of the high-pressure conditions.
Since so many cell disruption methods are available, the experimentermust, by trial and error, find a convenient method that yields the maximumquantity of the protein with minimal damage to the molecules.
Stabilization of Proteins in a Crude Extract
Continued stabilization of the protein must always be considered in proteinpurification processes. While the protein is inside the cell, it is in a highly regu-lated environment. Cell components in these surroundings are protected againstsudden changes in pH, temperature, or ionic strength and against oxidation andenzymatic degradation. Once the cell wall/membrane barrier is destroyed, theprotective processes are no longer functional and degradation of the desired pro-tein is likely to begin. An artificial environment that mimics the natural one mustbe maintained so that the protein retains its chemical integrity and biologicalfunction throughout the purification procedure. What factors are important inmaintaining an environment in which proteins are stable? Although numerousfactors must be considered, the following are the most critical:
1. Ionic strength and polarity The standard cellular environment is, ofcourse, aqueous; because of the presence of inorganic salts, though, its ionicstrength is relatively high. Addition of KCl, NaCl, or to the cellextract may be necessary to maintain this condition. Proteins that are nor-mally found in the hydrophobic regions of cells (i.e., membranes) are gen-erally more stable in aqueous environments in which the polarity has beenreduced by the addition of 1 to 10% glycerol or sucrose.
MgCl2

Chapter 11 • Protein Production, Purification, and Characterization 313
A
B
D
C
FIGURE 11.2Tools for thepreparation of acrude cell extract. A Hand-operatedhomogenizers,courtesy of AceGlass, Inc. Vineland,NJ. B Homogenizerwith electric motor,courtesy of Sargent-Welch/VWR; www.sargentwelch.com.C Ultrasonichomogenizer,courtesy ofBioLogics, Inc.,www.biologics-inc.com. D Rotor-stator, courtesy ofOmni International,Inc. www.omni-inc.com.

314 Chapter 11 • Protein Production, Purification, and Characterization
2. pH The pH of a biological cell is controlled by the presence of naturalbuffers. Since protein structure is often irreversibly altered by extremes inpH, a buffer system must be maintained for protein stabilization. Theimportance of proper selection of a buffer system cannot be overempha-sized. The criteria that must be considered in selecting a buffer arediscussed in Chapter 3, Section A, p. 57. For most cell homogenates atphysiological pH values, Tris and phosphate buffers are widely used.
3. Metal ions The presence of metal ions in mixtures of biomolecules can beboth beneficial and harmful. Metal ions such as and
may actually increase the stability of dissolved proteins. Manyenzymes require specific metal ions for activity. In contrast, heavy metalions such as and are deleterious, particularly toproteins that depend on sulfhydryl groups for structural and functionalintegrity. The main sources of contaminating metals are buffer salts, waterused to make buffer solutions, and metal containers and equipment. Toavoid heavy-metal contamination, you should use high-purity buffers,glass-distilled water, and glassware specifically cleaned to remove extrane-ous metal ions (see Chapter 1, Section C, p. 15). If metal contamination stillpersists, a chelating agent such as ethylenediaminetetraacetic acid
may be added to the buffer.4. Oxidation Many proteins are susceptible to oxidation. This is especially a
problem with proteins having free sulfhydryl groups, which are easilyoxidized and converted to disulfide bonds. A reducing environment can bemaintained by adding mercaptoethanol, cysteine, or dithiothreitol
to the buffer system.5. Proteases Many biological cells contain degradative enzymes (proteases)
that catalyze the hydrolysis of peptide linkages. In the intact cell, functional proteins are protected from these destructive enzymes becausethe enzymes are stored in cell organelles (lysosomes, etc.) and released onlywhen needed. The proteases are freed upon cell disruption and immediate-ly begin to catalyze the degradation of protein material. This detrimentalaction can be slowed by the addition of specific protease inhibitors suchas phenylmethylsulfonyl fluoride or certain bioactive peptides. Theseinhibitors are to be used with extreme caution because they arepotentially toxic.
6. Temperature Many of the above conditions that affect the stability of pro-teins in solution are dependent on chemical reactions. In particular, metalions, oxidative processes, and proteases bring about chemical changes inproteins. It is a well-accepted tenet in chemistry that lower temperaturesslow down chemical processes. We generally assume that proteins are morestable at low temperatures. Although there are a few exceptions to this, it isfairly common practice to carry out all procedures of protein isolationunder reduced-temperature conditions (usually in ice bath, ).
After cell disruption, gross fractionation of the properly stabilized, crudecell homogenate may be achieved by physical methods, specifically centrifuga-tion. Figure 4.11 outlines the stepwise procedure commonly used to separatesubcellular organelles such as nuclei, mitochondria, lysosomes, and microsomes.
0–4°C
(1 * 10-3M)
(EDTA, 1 * 10-4M)
Hg2+Ag1+ , Cu2+ , Pb2+ ,
Fe3+Na+ , K+ , Ca2+ , Mg2+ ,

Chapter 11 • Protein Production, Purification, and Characterization 315
Separation of Proteins Based on Solubility Differences
Proteins are soluble in aqueous solutions primarily because their chargedand polar amino acid residues are solvated by water. Any agent that disrupts theseprotein-water interactions decreases protein solubility because the protein-proteininteractions become more important. Protein-protein aggregates are no longer suf-ficiently solvated, and they precipitate from solution. Because each specific type ofprotein has a unique amino acid composition and sequence, the degree and impor-tance of water solvation vary from protein to protein. Therefore, different proteinsprecipitate at different concentrations of precipitating agent. The agents andfactors most often used for protein precipitation are (1) inorganic salts, (2) organicsolvents, (3) polyethylene glycol (PEG), (4) pH, and (5) temperature.
The most commonly used inorganic salt, ammonium sulfate, is highlysolvated in water and actually reduces the water available for interaction withprotein. As ammonium sulfate is added to a protein solution, a concentration ofsalt is reached at which there is no longer sufficient water present to maintain aparticular type of protein in solution. The protein precipitates or is “salted out”of solution. The concentration of ammonium sulfate at which the desired proteinprecipitates from solution cannot be calculated, but must be established by trialand error. In practice, ammonium sulfate precipitation is carried out in stepwiseintervals. For example, a crude cell extract is treated by slow addition of dry,solid, high-purity ammonium sulfate in order to achieve a change in salt concen-tration from 0 to 25%, is gently stirred for up to 60 minutes, and is subjected tocentrifugation at The precipitate that separates upon centrifugationand the supernatant are analyzed for the desired protein. If the protein is stillpredominantly present in the supernatant, the salt concentration is increasedfrom 25 to 35%. This process of ammonium sulfate addition and centrifugation iscontinued until the desired protein is salted out.
Organic solvents also decrease protein solubility, but they are not as widelyused as ammonium sulfate because they sometimes denature proteins. They arethought to function as precipitating agents in two ways: (1) by dehydratingproteins, much as ammonium sulfate does, and (2) by decreasing the dielectricconstant of the solution. The organic solvents used (which, of course, must bemiscible with water) include methanol, ethanol, and acetone.
A relatively new method of selective protein precipitation involves the useof nonionic polymers. The most widely used agent in this category is polyethyl-ene glycol. This polymer is available in a variety of molecular weights rangingfrom 400 to 7500. The biochemical literature reports successful use of differentweights, but lower-molecular-weight polymer has been shown to be the mostspecific. The principles behind the action of PEG as a protein precipitating agentare not completely understood. Possible modes of action include (1) complex for-mation between protein and polymer, and (2) exclusion of the protein from partof the solvent (dehydration), followed by protein aggregation and precipitation.The most attractive advantage of PEG is its ability to fractionate proteins on thebasis of size and shape, as in gel filtration.
Finally, changes in pH and temperature have been used effectively to promoteselective protein precipitation. A change in the pH of the solution alters the ionicstate of a protein and may even bring some proteins to a state of charge neutrality.
20,000 * g.

316 Chapter 11 • Protein Production, Purification, and Characterization
Charged protein molecules tend to repel each other and remain in solution;however, neutral protein molecules do not repel each other, so they tend to aggre-gate and precipitate from solution. A protein is least soluble in aqueous solutionwhen it has no net charge, that is, when it is isoelectric. This characteristic can beused in protein purification, since different proteins usually have different isoelec-tric pH values (see Chapter 6, Section B, p. 182). An increase in temperature gener-ally causes an increase in the solubility of solutes. This general rule is followed bymost proteins up to about Above this temperature, however, many proteinsaggregate and precipitate from solution. If the protein of interest is heat stableand still water soluble above a major step in protein purification can beachieved because most other proteins precipitate at these temperatures and canbe removed by centrifugation.
Selective Techniques in Protein Purification
After gross fractionation of proteins, as discussed above and listed in Table 11.2Step 5, more refined methods with greater resolution can be attempted. Thesemethods, in order of increasing resolution, are gel-filtration chromatography, ion-exchange chromatography, affinity chromatography, and isoelectric focusing.Since the basis of protein separation is different for each of these techniques, it isoften most effective and appropriate to use all of the techniques in the order given.
Chromatographic methods for protein purification are discussed in Chapter 5.However, we must consider another important topic, preparation of proteinsolutions for chromatography. Fractionation of heterogeneous protein mixtures byinorganic salts, organic solvents, or PEG usually precedes column chromatography.The presence of the precipitating agents will interfere with the later chromatographicsteps. In particular, the presence of ammonium sulfate increases the ionic strength ofthe protein solution and damps the ionic protein–ion-exchange resin interactions.Procedures that are in current use to remove undesirable small molecules fromprotein solutions include ultrafiltration (see Chapter 3, Section D, p. 74), dialysis (seeChapter 3, Section D, p. 73), and gel filtration (see Chapter 5, Section E, p. 132).
Chromatography is now, and will continue to be for many years, the mosteffective method for selective protein purification. The more conventional meth-ods (ion exchange and gel filtration) rely on rather nonspecific physicochemicalinteractions between a stationary support and protein molecule. These tech-niques, which separate proteins on the basis of net charge, size, and polarity, donot have a high degree of specificity. The highest level of selectivity in proteinpurification is offered by affinity chromatography—the separation of proteins onthe basis of specific biological interactions (see Chapter 5, Section G. p. 152).
To some individuals, especially those who recall their experiences in theorganic chemistry laboratory, the ultimate step in purification of a molecule is crys-tallization. The desire to obtain crystalline protein has long been strong, and manyproteins have been crystallized. However, there is a common misconception thatthe ability to form crystals of a protein ensures that the protein is homogeneous. Formany reasons (entrapment of contaminants within crystals, aggregation of proteinmolecules, etc.), the ability to crystallize a protein should not be used as a criterionof purity. The interest in protein crystals today has its origin in the demand forX-ray crystallographic analysis of protein structure (see Chapter 7, p. 233).
40°C,
40°C.

Chapter 11 • Protein Production, Purification, and Characterization 317
TABLE 11.3 Recombinant Proteins and Their Use
Protein Use
Human insulin Treatment of diabetes
Human somatotropin (growth hormone) Treatment of dwarfism
Bovine somatotropin (BST) Enhances milk production in dairy cattle
Porcine somatotropin (PST) Enhances growth in pigs
Pulmozyme (DNase) Treatment of cystic fibrosis
Tissue plasminogen activator (TPA) Treatment of heart attack, stroke; dissolves blood clots
Erythropoietin Treatment of anemia by stimulating erythrocyte production
Interferons Treatment of cancers; antiviral agent
Atrial natriuretic factor Reduces high blood pressure
Leptin Treatment of obesity
Hepatitis B vaccine Treatment of hepatitis
Herceptin Treatment of metastatic breast cancer; monoclonal antibody
Amylase and cellulase Removes carbohydrate precipitates from fruit juice
STUDY EXERCISE 11.2 Protein Purification
List at least three types of chromatography useful for protein purification, and identifythe basis of separation for each type.
B. PRODUCTION OF PROTEINS BY EXPRESSION OF FOREIGN GENES
It is now possible to produce large quantities of selected proteins by usingrecombinant DNA technology. In general, a hybrid DNA is prepared by insertingthe gene to be expressed (the gene carries the code for the desired protein) into avector (plasmid, etc.; see Chapter 10, Section A, p. 294) and transferring it into ahost cell where the desired protein is synthesized. These procedures have beenused in the production of hundreds of proteins for scientific, medical, agricultural,and industrial purposes. Table 11.3 lists some of the important protein productsnow made by recombinant DNA methods.
Gene Expression in Prokaryotic Organisms
Bacterial cells, especially E. coli, have been widely used as host cells for the large-scale production of proteins. Special requirements must be considered whilepreparing the recombinant DNA containing the “foreign” gene. The cloned struc-tural gene that contains the message for the desired protein is incorporated into anexpression vector that has all the necessary transcriptional and translational

318 Chapter 11 • Protein Production, Purification, and Characterization
R T
−35 −10Start Stop
Promoter Structural gene
Prokaryotic expression vector
RBS
ori Antibiotic resistance gene
FIGURE 11.3 Components of a typical recombinant DNA prokaryotic expression vector. The structuralgene contains the coding sequence for the protein. Essential components include the promoter (P),ribosome binding site (RBS), regulatory gene (R), and transcription terminator (T). “ori” refers to theorigin of replication.
control sequences (Figure 11.3). If a relaxed plasmid is used as the vector (seeChapter 10, Section A, p. 294) and the proper signals for gene expression are pres-ent, it is possible to overexpress the desired protein so that its concentration mayreach up to 40% of the host bacteria’s total cellular protein. Although this providesa high yield of the expressed protein, the bacterial cells often concentrate the for-eign protein into insoluble inclusion bodies in which the protein is present in adenatured, aggregated form. The protein may be renatured by isolating the inclu-sion bodies by centrifugation and incubating them with a denaturing agent (6 Mguanidinium ion or urea) and then slowly removing the denaturing agent by ultra-filtration or dialysis (see Chapter 3, Section D, p. 73). Initially, the presence of thedesired protein in the inclusion bodies seems to be a disadvantage in the produc-tion of the protein, but it turns out sometimes to be a benefit, as it may actuallysave time in further purification steps. Because the inclusion bodies contain thedesired protein in the absence of most other cellular proteins, this serves as a majorpurification step. The renatured protein often is ready for further purificationusing the final steps of chromatography in Table 11.2. However, the renaturingprocess is very slow, and percent recovery of the protein may be as low as 50%.
Host-Cell Secretion of Protein
The formation of inclusion bodies and other technical problems of gene expres-sion can be avoided if the coding gene is genetically engineered to induce thehost cell to secrete the protein into the periplasmic space (the area between thecell wall and the plasma membrane). The protein can be released from this spaceusing the procedure of osmotic lysis (see this chapter, p. 311). These proceduresgreatly facilitate purification of the protein, as they avoid the preparation of acrude cell homogenate in which the protein is in a mixture of all other cellularmolecules. The host bacterial cell can be coaxed into secreting the desired protein

Chapter 11 • Protein Production, Purification, and Characterization 319
by incorporating a signal sequence for protein targeting into the expressionvector.
The yield of biologically active protein can also be increased by reducing itsintracellular degradation. Because the host bacterial cell recognizes the clonedprotein as “foreign” (and, indeed, some proteins are toxic to the bacterium), itattempts to remove the protein by protease-catalyzed hydrolysis. Degradationby protease action is lessened if the protein is secreted. Protein degradation canalso be reduced if the expression vector is modified to add or label the desiredprotein with a protease-resistant sequence of amino acids.
Many of the above problems, including inclusion body formation, can alsobe minimized or even eliminated by tagging the desired protein with a protein ofbacterial origin. This is accomplished by inserting into the vector a DNA frag-ment carrying the code for a bacterial protein. The bacteria can be tricked intorecognizing the conjugated protein (bacterial protein covalently linked to the de-sired protein) as “native.” The “label” is often added to the N-terminus of thecloned protein. Such modified proteins are called hybrid or fusion proteins. Thelabel may be removed from the desired protein, after extraction, by using aproteolytic enzyme.
Histidine-Tagged Proteins
A unique approach to eliminating some of the problems outlined above andalso facilitating protein purification is to program the expression vector to adda string of six or more histidine residues to the N-terminus of the desired pro-tein. The histidine residues (along with the protein) will bind to an affinitychromatography column containing nickel ions immobilized to a nitrilotri-acetic acid solid support. Protein purification is achieved by passing the celllysate (prepared by treatment of the host cells with lysozyme and/or a deter-gent) directly through the affinity column (Figure 11.4; see immobilized metal-ion affinity chromatography, Chapter 5, Section G, p. 152). Equipment andreagents for these procedures are available in kit form from QIAGEN Inc. andClontech Laboratories Inc. A modified version of this procedure, theMagneHis Protein Purification System, is available from Promega. TheMagneHis system involves the use of paramagnetic precharged nickel parti-cles to isolate His-tagged protein directly from a crude cell lysate. In all proce-dures described above, the His-tagged protein is recovered from the solidsupport by eluting with imidazole, which binds to the nickel ions anddisplaces the protein.
Other peptide fusion labels that facilitate protein purification include:
• Polyarginine—A series of arginine residues is added to the C-terminus ofthe protein. This makes the protein highly basic and thus able to be purifiedusing a cation-exchange resin.
• Flag—A short amino acid sequence (Asp-Tyr-Lys-Asp-Asp-Asp-Asp-Lys–)is attached to the N-terminus of the protein. The protein may then be puri-fied by immunoaffinity chromatography with the use of a commerciallyavailable monoclonal antibody that recognizes the hydrophilic peptidesequence.

320 Chapter 11 • Protein Production, Purification, and Characterization
An extremely useful application of recombinant DNA technology is the abil-ity to modify protein structures by changing the identity of amino acid residues.This provides a powerful tool for monitoring which amino acid residues are im-portant in a protein’s biological function. Amino acid changes may be made by atechnique called site-directed mutagenesis, where an altered gene carrying themessage for different amino acids is inserted into a recombinant DNA.
Bacterial-cell
pellet containing
recombinant protein
Cell lysate
1. Add lysing buffer
2. Centrifuge and load
supernatant onto
affinity column
Purified protein
in solution
3. (a) Wash to remove
unbound materials
(b) Elute proteinFIGURE 11.4Purification of aHis-tagged proteinusing immobilizedmetal-affinitychromatography.See text for details.www.clontech.com.
STUDY EXERCISE 11.3 Genetic Engineering and Chromatography
What kind of chromatography is used to separate His-tagged proteins?
Gene Expression in Eukaryotic Cells
Expression of a eukaryotic gene in a bacterial host cell often leads to many tech-nical problems. Among these problems are:

Chapter 11 • Protein Production, Purification, and Characterization 321
1. Bacterial cells are unable to carry out gene splicing processes that removeintrons from the eukaryotic mRNA.
2. Bacterial cells do not recognize and respond to eukaryotic transcriptionaland translational regulatory elements.
3. Bacterial cells do not have the enzyme systems to direct post translationalmodifications of proteins, as eukaryotic cells are capable of doing. Theseprotein modifications include chemical changes such as addition of carbo-hydrates (glycosylation), formation of correct disulfide bonds, proteolyticcleavage of inactive precursors, phosphorylation of amino acid hydroxylgroups (tyrosine, serine, etc.), and other changes that assist the protein tofold into its native conformation and become biologically active.
The challenges of incorporating all of these messages into an expression vectorfor bacterial cells are great, if not insurmountable. The best approach is to useeukaryotic cells such as yeast as hosts.
The many challenges presented above, such as preparing complex recom-binant DNA with all the proper signals and messages, and maintaining andusing bacterial and eukaryotic host-cell cultures, have encouraged scientists tosearch for more efficient systems for producing proteins.
cDNA
One procedure for making recombinant proteins that is growing in popularity isthe use of complementary DNA (cDNA). All of the proteins in a cell are madefrom their specific mRNAs by translation, so it would seem logical to isolate themRNA associated with a specific protein and then use it to make that protein.However, mRNA is too difficult to purify and too unstable to use directly forprotein synthesis. Instead, the mRNA is converted into a DNA form using theRNA-viral enzyme system reverse transcriptase (RT). RT is able to read an RNAtemplate and catalyze the synthesis of a complementary strand of DNA (cDNA).(RT is the enzyme that retroviruses use to copy their genes, originally in the formof RNA, into DNA, in order to “take over” a cell or organism.) Researchers nowcan isolate and purify the mRNA associated with the desired protein, transformit into cDNA with RT, and insert the cDNA into a suitable vector for cloning.
Cell-Free Systems
Another promising alternative for protein production is to use cell-free transcrip-tion and translation systems for expression of the recombinant DNA. Two in vitrosystems currently being used are wheat-germ extracts and rabbit reticulocytelysates. The in vitro systems require the addition of the isolated mRNA fragmentthat contains the coded message for the protein, as well as amino acids, tRNAs,and ribosomes.
Protein Expression Using Synthesized Genes
Producing large quantities of a protein from naturally-occurring gene sequencesas described above is not always efficient. It can be a challenging, time consum-ing, and costly process. Some of the most valuable and desired proteins neededby biochemists are often expressed in wild-type cells, but in very low amounts.Biochemists have begun to experiment with synthesized genes in which the three

322 Chapter 11 • Protein Production, Purification, and Characterization
nucleotides in the codons are revised or rewritten with the hope of optimizingprotein expression. How is this possible? Recall that the genetic code is degener-ate. Almost all of the 20 amino acids have at least two codons (Leu has six); thus,different codons can specify the same amino acid. For example, a codon for Phe,U-U-U, could be changed to U-C-U, which would also specify Phe. Three of thecodons signal termination, which leaves 61 of the 64 total codons to specify aminoacids. Thus, it is possible to change about a third (20/61) of the nucleotides andstill produce the same protein. The number of alternate gene sequences that willproduce the same protein is enormous. According to Wikipedia, there are 10150
codon combinations for an average-sized protein of 300 amino acids. It has beenshown experimentally that some combinations lead to better protein yields thanothers. Thus, modifying a synthetic gene can potentially enhance protein expres-sion. Synthetic biology companies including DNA2.0, PolyQuant (Entelechon),GENEWIZ, GENEART, GenScript, Epoch Bioloabs, and others are developingcomputer software based on new design algorithms to predict the set of codonsmost effective for protein expression. Gene optimization can offer protein yieldsup to at least 10 times higher than the more conventional procedures. Finding justthe right gene, however, requires extensive computer analysis. A major goal ofthese investigations is to determine the gene sequence characteristics that have asignificant influence on protein expression.
C. PROTEIN CHARACTERIZATION
Now that the sought-after protein has been obtained in a highly purified state, it isusually suitable for further characterization and study. The characterizationtechniques applied to the protein depend on what is already known about the mol-ecule and what kind of protein it is. One is, of course, interested in knowing thebiological role the protein plays in the organism; however, such a determinationmust wait until more is known about its physical and chemical properties. Here isan outline of procedures one should apply to the protein for general characteriza-tion and for specific analysis. References are made to coverage of the characteriza-tion procedures in this book (see Appendix I for a table of useful Web sites, p. 331).
• Concentration of protein solutions—general assays like the Bradford,Lowry, spectrophotometric, etc. (see Chapter 3, Section B, p. 67).
• Purity of protein—PAGE and SDS-PAGE (see Chapter 6, Section B, p. 167),HPLC (see Chapter 5, Section F, p. 140), capillary electrophoresis (seeChapter 6, Section B, p. 185), isoelectric focusing (see Chapter 6, Section B,p. 182), and 2D electrophoresis (see Chapter 6, Section B, p. 184).
• Molecular weight, subunit structure—gel-filtration chromatography (seeChapter 5, Section E, p. 132), SDS-PAGE (see Chapter 6, p. 174), and MS (seeChapter 7, Section D, p. 230).
• Identity and structure determination (including cofactors, coenzymes,metal ions, carbohydrates, etc.)—UV/VIS spectroscopy (see Chapter 7,Section A, p. 202), NMR spectroscopy (see Chapter 7, Section C, p. 225), MS(see Chapter 7, Section D, p. 230), X-ray diffraction (see Chapter 7, SectionE, p. 233), and protein databases (Table 11.4).
• Sequence of amino acids in the protein and of nucleotides in the codinggene—Web sites, databases (see Table 11.4 and Chapters 2, 9, and 10). For

Chapter 11 • Protein Production, Purification, and Characterization 323
TABLE 11.4 Protein Database Resources
Name URL
ExPASy—UniProt Knowledgebase: Swiss-Prot and TrEMBL http://ca.expasy.org/sprot
PIR—Protein Information Resource http://pir.georgetown.edu
RCSB Protein Data Bank (PDB) http://www.rcsb.org
The National Center for Biotechnology http://www.ncbi.nlm.nih.gov
The European Bioinformatics Institute http://www.ebi.ac.uk
analysis of the amino acid sequence (primary structure), see this chapter,Section D.
• Biological function:Enzyme–substrate specificity, kinetics, inhibition, regulation (see
Chapter 8, Section B, p. 250).Transport protein–ligand binding (fluorescence spectroscopy, see
Chapter 7, Section B, p. 220, and Chapter 8, Section A, p. 239).Other type of protein–procedures depend on function.
• Proteomics: identity of unknown proteins by amino acid composition andprediction of structure (see Web sites and databases in Table 11.4 and Chapter 2),analysis by 2D electrophoresis (see Chapter 6, Section B, p. 184), interactionswith other proteins—MALDI-MS (see Chapter 7, Section D, p. 230).
D. DETERMINATION OF PRIMARY STRUCTURE
Structural elucidation of natural macromolecules is an important step in under-standing the relationships between the chemical properties of a biomolecule andits biological function. The techniques used in organic structure determination(NMR, IR, UV, and MS; Chapter 7) are quite useful when applied to biomolecules,but the unique nature of natural molecules also requires the application of spe-cialized chemical procedures. Proteins, polysaccharides, and nucleic acids arepolymeric materials, each composed of hundreds or sometimes thousands ofmonomeric units (amino acids, monosaccharides, and nucleotides, respectively).But there is only a limited number of these types of units from which the biomol-ecules are synthesized. For example, only 20 different amino acids are found inproteins, but these different amino acids may appear several times in the sameprotein molecule. Therefore, the structure of a peptide or protein can be recog-nized only after the amino acid composition and sequence have been determined.
Amino Acid Composition
The amide bonds in peptides and proteins can be hydrolyzed in a strong acid orbase. Treatment of a peptide or protein under either of these conditions yields amixture of the constituent amino acids. Neither acid- nor base-catalyzed hydrol-ysis of a protein leads to ideal results because both tend to destroy someconstituent amino acids. Acid-catalyzed hydrolysis destroys tryptophan andcysteine, causes some loss of serine and threonine, and converts asparagine and

324 Chapter 11 • Protein Production, Purification, and Characterization
glutamine to aspartic acid and glutamic acid, respectively. Base-catalyzedhydrolysis leads to destruction of serine, threonine, cysteine, and cystine, andalso results in racemization of the free amino acids. Because acid-catalyzed hy-drolysis is less destructive, it is often the method of choice. The hydrolysis proce-dure consists of dissolving the protein sample in aqueous acid, usually 6 M HCl,and heating the solution in a sealed, evacuated vial at for 12 to 24 hours.
Now that the free amino acids present in a peptide or protein have beenreleased by hydrolysis, they must be separated and identified. The most versatile,economical, and convenient techniques for separation are based on chromato-graphic methods (see Chapter 5 for a review, p. 118). Earlier workers relied on paperchromatography (PC) and thin-layer chromatography (TLC); however, more sensi-tive techniques are now available. Automated ion-exchange chromatography(amino acid analyzers), capillary electrophoresis (CE), and high-performance liquidchromatography (HPLC) are now powerful tools for the qualitative and quantita-tive analysis of amino acids and their derivatives. Because there is still some demand for rapid, qualitative, routine analysis of amino acids, thin-layer and paperchromatographic methods are still being developed and improved. Amino acidsand their derivatives may be analyzed directly by PC and TLC without further de-rivatization. Several support materials are available, but most analyses are carriedout on silica gel or cellulose. The free amino acids can be detected on the developedchromatographic plates by reaction with ninhydrin. A pink-purple color is obtainedfor all amino acids except proline. A yellow color develops with proline.
High-performance liquid chromatographic techniques have been success-fully applied to the analysis of phenylthiohydantoin, 2,4-dinitrophenyl, and dan-syl amino acid derivatives.
If only very small samples of amino acids are available for analysis,fluorescence is used for detection. One of the most sensitive methods ofmicroanalysis is based on the reaction of amino acids with o-phthalaldehydeand -mercaptoethanol (Equation 11.1). The isoindole derivative is fluorescent,and amounts as small as mole may be measured.
Another important derivatizing reagent for amino acids is 9-fluorenylmethylchloroformate (FMOC) (Equation 11.2). This reagent has the advantages that:(1) the reaction with amino acids is very fast, occurring in less than 1 min; (2) the
2H2O
C
C
O
O+ H
3N+
CH CH2
CH2
OH
R
COO_
+ HS
CH
R
COO_
+
H
H
-Phthalaldehydeο Amino acid
N + H+
S CH2
CH2
OH
Isoindole derivative
of amino acid
β-Mercaptoethanol
10-12b
100°C
(Eq. 11.1)

Chapter 11 • Protein Production, Purification, and Characterization 325
products are stable for long periods of time; (3) the derivatives can be separated byreversed-phase column chromatography and capillary electrophoresis procedures;and (4) the products are fluorescent, allowing for easy detection.
Sequential Analysis
Sequential analysis of amino acids in purified peptides and proteins is best initi-ated by analysis of the terminal amino acids. A peptide has one amino acid witha free amino group ( -terminus) and one amino acid with a free carboxylgroup (COOH-terminus). Many chemical methods have been developed toselectively tag and identify these terminal amino acids.
N-Terminal Analysis
-terminal amino acid analysis is achieved by the use of: (1) 2,4-dinitrofluo-robenzene (Sanger reagent), (2) 1-dimethylaminonaphthalene-5-sulfonyl chlo-ride (dansyl chloride), or (3) phenylisothiocyanate (Edman reagent). Figure 11.5shows the structures of these reagents. Although the chemistry is different for
NH2
aNH2a
O
O O
OCl + H
2N
R
O_
O
R
O_
ONH
FMOC Amino acid N-FMOCderivative
+ HCl
Sanger reagent
F
NO2
NO2
N
C
S
Edman reagent
N
H3C CH
3
O OS
Cl
Dansyl chloride
N N N N C
CH3
CH3
S
DABITC
FIGURE 11.5Reagents useful inamino-terminalanalysis of proteins.
(Eq. 11.2)

326 Chapter 11 • Protein Production, Purification, and Characterization
CX + H2N CH
R H
O
N CCH
R H
O
N
'
CN CH
R HH
N CH
RH
O
N CCH
R H
O
N
'
COO_
H+
Free amino acids
or
intact peptide (Edman)
Derivatized peptide
N-terminal reagent
+
FIGURE 11.6Scheme to showanalysis of amino-terminal residue ofprotein.
each of these reagents, the same general concept applies. These compounds reactwith the -terminal amino acid of a peptide or protein to produce covalentderivatives that are stable to acid-catalyzed hydrolysis. The process is illustratedin Figure 11.6. The mixture of modified amino acid and free amino acids isseparated, and the -terminal amino acid is identified by thin-layer, paper, orhigh-performance liquid chromatography; or capillary electrophoresis. The first
-terminal method to be widely used was based on the Sanger reagent, whichproduces yellow-colored 2,4-dinitrophenyl (DNP) derivatives of -terminalamino acids. The Sanger method has several disadvantages, including poor yieldof the DNP-peptide derivative, low sensitivity of analysis, and instability ofsome DNP-amino acids during acid hydrolysis. The dansyl chloride method haslargely replaced the Sanger method because very sensitive fluorescencetechniques may be used for detection and analysis of the dansyl amino acidderivatives, and the derivatives are more stable during acid hydrolysis.
Edman Sequence Method
Even more versatile than the dansyl method is the Edman method (Figure 11.7).The -terminal amino acid is removed as its phenylthiohydantoin (PTH) deriv-ative under anhydrous acid conditions, while all other amide bonds in the peptideremain intact. The derivatized amino acid is then extracted from the reactionmixture and identified by paper, thin-layer, or high-performance liquid chromatog-raphy. The intact peptide (minus the original -terminal amino acid) may beisolated and recycled by reaction with phenylisothiocyanate. Since this method isnondestructive to the remaining peptide (aqueous acid hydrolysis is not required)and results in good yield, it can be used for stepwise sequential analysis of peptides.
Microsequencing
The development of new chemical reagents and instrumentation has now madeit possible to achieve end-group analysis and sequencing on extremely smallsamples of protein (microsequencing). By using a chromophoric derivative of
NH2
NH2
NH2
NH2
NH2
NH2

Chapter 11 • Protein Production, Purification, and Characterization 327
N
N C S + H2N CH CH
RR H '
C
O
N
H
C
O
N
C CH CH
RR H '
C
O
N
H
C
O
N
CH
R' H
C
O
N
H HS
S
N NC
H
O R H
+ H2N
Phenylthiohydantoin Intact peptide
N
H+
FIGURE 11.7 TheEdman method foranalysis of proteins.
phenylisothiocyanate, 4-N,N-dimethylaminoazobenzene- -isothiocyanate(DABITC; see Figure 11.5), and analyzing the derivatives by HPLC, it is possibleto sequence peptides and proteins at the nanomolar level.
C-Terminal Analysis
The COOH-terminal amino acid of a peptide or protein may be analyzed byenzymatic methods. The method of choice is peptide hydrolysis catalyzed bycarboxypeptidases A and B. These two enzymes catalyze the hydrolysis ofamide bonds at the COOH-terminal end of a peptide (Equation 11.3), since car-boxypeptidase action requires the presence of a free carboxyl group in thesubstrate.
Carboxypeptidase A catalyzes the hydrolysis of carboxyl-terminal acidic orneutral amino acids; however, the rate of hydrolysis depends on the structure ofthe side chain Amino acids with nonpolar aryl or alkyl side chains arecleaved more rapidly. Carboxypeptidase B is specific for the hydrolysis of basicCOOH-terminal amino acids (lysine and arginine). Neither peptidase functionsif proline occupies the COOH-terminal position or is the next to last amino acid.
C CH
O
N
H R
C CH
O
N
H
COO_
+ H2O
C CH
O
N
H R
COO_
CH COO_
+ H2N
carboxypeptidase
R'
R'
R¿.
a
4¿
(Eq. 11.3)

Sequencing DNA Instead of the Protein
New techniques for protein sequence analysis have emerged from recombinantDNA research. It is now possible to clone long stretches of DNA. Genes carryingthe message for selected proteins can be isolated in quantities sufficient fornucleotide sequencing. By using the genetic code, the structure of the proteinproduct from a specific gene can be deduced from the sequence of nucleotides inthe DNA. Techniques for DNA sequencing are faster and more reliable than forprotein sequencing; however, determining protein sequences indirectly fromDNA sequences will never completely replace direct analysis of the proteinproduct. An amino acid sequence determined from DNA will be that of the ini-tial protein product synthesized. That initial form (which is often not biologicallyactive) is changed by post translational modification processes. These changesmay include removal of short stretches of amino acid residues, formation ofdisulfide bonds, and chemical changes on some amino acid residues.
Study Problems
1. A solution of a purified protein yielded an of 1.3. Estimate the proteinconcentration of the solution.
2. Describe the action of the enzyme lysozyme in breaking bacterial cells for proteinisolation and purification.
3. What amino acid residues in a protein absorb light of 280 nm?4. Use a flowchart format to show how you would isolate a protein from an inclusion
body.5. A protein you wish to study is present in the mitochondria of the cell. Show how you
would use fractional centrifugation to isolate mitochondria to begin purification ofthe protein.
6. When would you use the technique of isoelectric focusing in the isolation and charac-terization of a protein?
7. What type of electrophoresis would be better to study the subunit structure of a pro-tein, PAGE or SDS-PAGE? Explain.
8. During the expression of a protein in a bacterial host cell, what are some of the advan-tages of fusing a natural, bacterial protein to the “foreign” protein?
9. When the histidine-tagged protein procedure is used for purification, the expressedprotein is recovered from an affinity column by eluting with a solution of imidazole.What atoms of imidazole displace the protein by binding to nickel?
10. Use a protein database to find the primary structure of the active form of humaninsulin (51 amino acids).
A280>A260
Further Reading
328 Chapter 11 • Protein Production, Purification, and Characterization
J. Berg, J. Tymoczko, and L. Stryer, Biochemistry, 6th ed. (2007), Freeman (New York).P. Bonner, Protein Purification: The Basics (2007), Taylor and Francis (New York).J. Bornhorst and J. Falke, Met. Enzymol. 326, 245–254 (2000). “Purification of Proteins
Using Polyhistidine Affinity Tags.”

R. Boyer, Concepts in Biochemistry, 3rd ed. (2006), John Wiley & Sons (Hoboken, NJ),pp. 84–90. Protein purification and analysis.
A. Campbell and L. Heyer, Discovering Genomics, Proteomics, and Bioinformatics(2003), Benjamin Cummings (San Francisco).
F. Carvalho and M. Gillespie, Biochem. Mol. Biol. Educ. 31, 46–51 (2003). “BringingProteomics into the Lab.”
E. Christodoulou and C. Vorgias, Biochem. Mol. Biol. Educ. 30, 189–191 (2002).“Understanding Heterologous Protein Overproduction Under the T7 Promoter.”
R. Garrett and C. Grisham, Biochemistry, 4th ed. (2010), Brooks/Cole-Cengage(Belmont, CA).
D. Nelson and M. Cox, Lehninger Principles of Biochemistry, 5th ed. (2009), Freeman(New York).
B. Nielsen and S. Echols, Biochem. Mol. Biol. Educ. 30, 408–413 (2002), “Use ofChloroplast rRNA Gene to Introduce Basic Molecular Biology Techniques.”
L. Plesniak and E. Bell, Biochem. Mol. Biol. Educ. 31, 127–130 (2003). “TeachingProteomics.”
N. Price and J. Nairn, Exploring Proteins: A Student’s Guide to Experimental Skills andMethods (2009), Oxford University Press (New York).
S. Roe, Editor, Protein Purification Techniques, 2nd ed. (2001), Oxford University Press(Oxford, UK).
R. Simpson (Editor), Purifying Proteins for Proteomics: A Laboratory Manual (2004),Cold Spring Harbor Laboratory Press (Cold Spring Harbor, NY).
R. Simpson et al., Basic Methods in Protein Purification and Analysis: A LaboratoryManual (2008), Cold Spring Harbor Laboratory Press (Cold Spring Harbor, NY).
C. Sommer et al., Biochem. Mol. Biol. Educ. 32, 7–10 (2004). “Teaching Molecular Biologyto Undergraduate Biology Students.”
C. Tsai, An Introduction to Computational Biochemistry (2002), John Wiley & Sons(New York).
D. Voet and J. Voet, Biochemistry, 3rd ed. (2005), John Wiley & Sons (Hoboken, NJ),pp. 116–160. Introduction to protein purification and molecular cloning.
D. Voet, J. Voet, and C. Pratt, Fundamentals of Biochemistry, 3rd ed. (2008), John Wiley &Sons (Hoboken, NJ).
http://www.piercenet.comA discussion on protein purification.
http://www.promega.comA discussion of the MagneHis Protein Purification System.
Additional Web sites for this chapter are available on the book’s Companion Website,which can be found at http://www.chemplace.com.
Chapter 11 • Protein Production, Purification, and Characterization 329

This page intentionally left blank

APPENDIX I
List of Software Programs and Web Sites Useful forEach ChapterThis table lists Web sites that are particularly relevant to specific chapters. Thelist is not all-inclusive, but it does include popular and especially helpful URLs.Individual chapters also contain detailed lists of associated Web sites. AdditionalWeb sites for each chapter are available on the book’s Companion Website,which can be found at http://www.chemplace.com.
331
Chapter No. Name Description URL
1 Sigma-Aldrich MSDS www.sigma-aldrich.com
1 Swarthmore College
Scientific posters http://www.swarthmore.edu/NatSci/courrin1/posteradvice.htm
1-3 Rainin Pipetting http://www.rainin.com
1-3 Graphpad Statistics http://www.graphpad.com/prism/Prism.htm
1-3 Journal of Chemical EducationResource Shelf
List of all current biochemistrytextbooks
http://www.umsl.edu/divisions/artscience/chemistry/books/welcome.html
1-3 ChemDraw Chemical structure drawing program
http://www.cambridgesoft.com
1-11 Intute Best Web sites http://www.intute.ac.uk/biologicalsciences
1-11 BioChemWeb Biochemistry library http://www.biochemweb.org
2-11 Protocol-Online Your lab’s reference book
http://www.protocol-online.org
2-11 Protein Data Bank (PDB)
Protein structures determined by X-ray and NMR
http://www.rcsb.org/pdb
2-11 ChemBioFinder Life science solutions http://www.chembiofinder.com
2-11 NCBI Molecules to Go
Structures of biomolecules
http://molbio.info.nih.gov.cgi-bin/pdb
2-11 PyMol Molecular Viewer
Structures of biomolecules
http://pymol.org
2-11 Chimera Molecular Modeling System (UCSF)
Advanced molecular modeling
http://www.cgl.ucsf.edu/chimera
2-11 Biomolecules Alive Instructional material http://www.biomoleculesalive.org
2-11 Entrez Browser of NCBI
Database searching includ-ing PubMed literature
http://www.ncbi.nlm.nih.gov/Entrez
(continued)

332 Appendix I
Chapter No. Name Description URL
2-11 MEDLINE (PubMed) U.S. National Library of Medicine
http://www.nlm.nih.gov
2-11 International Union of Biochemistry and Molecular Biology (IUBMB)
Nomenclature http://www.chem.qmul.ac.uk/iubmb
7 Biological Magnetic ResonanceData Bank
NMR data ofbiomolecules
http://bmrb.wisc.edu
7 Science of Spectroscopy
Spectroscopy applicationsand techniques
http://www.scienceofspectroscopy.info/index.htm
8 DynaFit Ligand binding http://www.biokin.com
8 SigmaPlot Enzyme kinetics module
http://www.sigmaplot.com/products/sigmaplot/enzyme-mod.php
8 Enzyme Structures Database
Enzyme structures inProtein Data Bank
http://www.biochem.ucl.ac.uk/bsm/enzymes/index.html
8-11 IUBMB Enzyme List Catalog of enzymes http://www.chem.qmul.ac.uk/iubmb/enzyme
8-11 Worthington Enzyme Manual
Properties of enzymes http://www.worthington-biochem.com/index/manual/html
8-11 BRENDA A comprehensive enzyme information system
http://www.brenda-enzymes.info
9-10 European BioinformaticsInstitute (EBI)
DNA sequences http://www.ebi.ac.uk
9-10 GenBank of the NCBI
Nucleotide sequencedatabase
http://www.ncbi.nlm.nih.gov/Genbank
9-10 EMBL Nucleotide sequence database
http://www.ebi.ac.uk
9-10 The Institute for Genomic Research
Collection of genomic databases
http://www.ebi.ac.uk/genomes/index.html
9-11 Enzyme Database of ExPASy
Enzyme names and numbers
http://www.expasy.ch/enzyme
9-11 The Broad Institute of MIT and Harvard
Genomics http://www.broadinstitutes.org
10 REBASE-The Restriction Enzyme Database
Restriction enzyme directory and action
http://rebase.neb.com
10 Fermentas Restriction enzymes http://www.fermentas.com(continued)

Appendix I 333
Chapter No. Name Description URL
11 Munich Information Center for Protein Sequences (MIPS)
Protein sequences http://www.helmholtz-muenchen.de/en/mips
11 Protein Information Resource (PIR)
Database searching for proteins
http://pir.georgetown.edu
11 Swiss-Protein Protein sequences http://ca.expasy.org/sprot

APPENDIX II
Properties of Common Acids and Bases
334
Compound FormulaMolecular
WeightSpecificGravity
% by Weight Molarity (M)
Acetic acid, glacial CH3COOH 60.1 1.05 99.5 17.4
Ammoniumhydroxide
NH4OH 35.0 0.89 28 14.8
Formic acid HCOOH 46.0 1.20 90 23.4
Hydrochloric acid HCl 36.5 1.18 36 11.6
Nitric acid HNO3 63.0 1.42 71 16.0
Perchloric acid HClO4 100.5 1.67 70 11.6
Phosphoric acid H3PO4 98.0 1.70 85 18.1
Sulfuric acid H2SO4 98.1 1.84 96 18.0

APPENDIX III
Properties of Common Buffer Compounds
335
(20°C)
Compound AbbreviationMolecular
Weight pK1 pK2 pK3 pK4
N-(2-Acetamido)-2-aminoethanesulfonic acid ACES 182.2 6.9 – – –
N-(2-Acetamido)-2-iminodiacetic acid ADA 212.2 6.60 – – –
Acetic acid – 60.1 4.76 – – –
Arginine Arg 174.2 2.17 9.04 12.48 –
Barbituric acid – 128.1 3.79 – – –
N,N-bis (2-Hydroxyethyl)-2-aminoethane-sulfonic acid BES 213.1 7.15 – – –
N,N-bis (2-Hydroxyethyl)glycine Bicine 163.2 8.35 – – –
Boric acid – 61.8 9.23 12.74 13.80 –
Citric acid – 210.1 3.10 4.75 6.40 –
Ethylenediaminetetraacetic acid EDTA 292.3 2.00 2.67 6.24 10.88
Formic acid – 46.03 3.75 – – –
Fumaric acid – 116.1 3.02 4.39 – –
Glycine Gly 75.1 2.45 9.60 – –
Glycylglycine – 132.1 3.15 8.13 – –
N-2-Hydroxyethylpiperazine- ’-2-ethanesulfonic acidN HEPES 238.3 7.55 – – –
N-2-Hydroxyethylpiperazine- ’-3-propanesulfonic acidN HEPPS 252.3 8.0 – – –
Histidine His 209.7 1.82 6.00 9.17 –
Imidazole – 68.1 6.95 – – –
2-(N-Morpholino)ethanesulfonic acid MES 195 6.15 – – –
3-(N-Morpholino)propanesulfonic acid MOPS 209.3 7.20 – – –
Phosphoric acid – 98.0 2.12 7.21 12.32 –
Succinic acid – 118.1 4.18 5.60 – –
3-Tris (hydroxymethyl)aminopropanesulfonic acid TAPS 243.2 8.40 – – –
(continued)

336 Appendix III
(20°C)
Compound AbbreviationMolecular
Weight pK1 pK2 pK3 pK4
N-Tris (hydroxymethyl)methyl-2-aminoethanesulfonic acid TES 229.2 7.50 – – –
N-Tris (hydroxymethyl)methylglycine Tricine 179 8.15 – – –
Tris (hydroxymethyl)aminomethane Tris 121.1 8.30 – – –

APPENDIX IV
Values and Values of Amino AcidspHIpKa
Name Abbreviations ( -carboxyl)A
pK1( -amino)A
pK2(side chain)
pKRpHI
Alanine Ala A 2.3 9.7 – 6.0
Arginine Arg R 2.2 9.0 12.5 10.8
Asparagine Asn N 2.0 8.8 – 5.4
Aspartate Asp D 2.1 9.8 3.9 3.0
Cysteine Cys C 1.7 10.8 8.3 5.0
Glutamate Glu E 2.2 9.7 4.3 3.2
Glutamine Gln Q 2.2 9.1 – 5.7
Glycine Gly G 2.3 9.6 – 6.0
Histidine His H 1.8 9.2 6.0 7.6
Isoleucine Ile l 2.4 9.7 – 6.1
Leucine Leu L 2.4 9.6 – 6.0
Lysine Lys K 2.2 9.0 10.5 9.8
Methionine Met M 2.3 9.2 – 5.8
Phenylalanine Phe F 1.8 9.1 – 5.5
Proline Pro P 2.0 10.6 – 6.3
Serine Ser S 2.2 9.2 – 5.7
Threonine Thr T 2.6 10.4 – 6.5
Tryptophan Trp W 2.4 9.4 – 5.9
Tyrosine Tyr Y 2.2 9.1 10.1 5.7
Valine Val V 2.3 9.6 – 6.0

APPENDIX V
Molecular Weight of Some Common Proteins
338
Name (Source) Molecular Weight
Albumin (bovine serum) 65,400
Albumin (egg white) 45,000
Carboxypeptidase A (bovine pancreas) 35,268
Carboxypeptidase B (porcine) 34,300
Catalase (bovine liver) 250,000
Chymotrypsinogen (bovine pancreas) 23,200
Cytochrome c 13,000
Hemoglobin (bovine) 64,500
Insulin (bovine) 5,700
-Lactalbumin (bovine milk)a 14,200
Lysozyme (egg white) 14,600
Myoglobin (horse heart) 16,900
Pepsin (porcine) 35,000
Peroxidase (horseradish) 40,000
Ribonuclease I (bovine pancreas) 12,600
Trypsinogen (bovine pancreas) 24,000
Trypsin (bovine pancreas) 23,800
Tyrosinase (mushroom) 128,000
Uricase (pig liver) 125,000
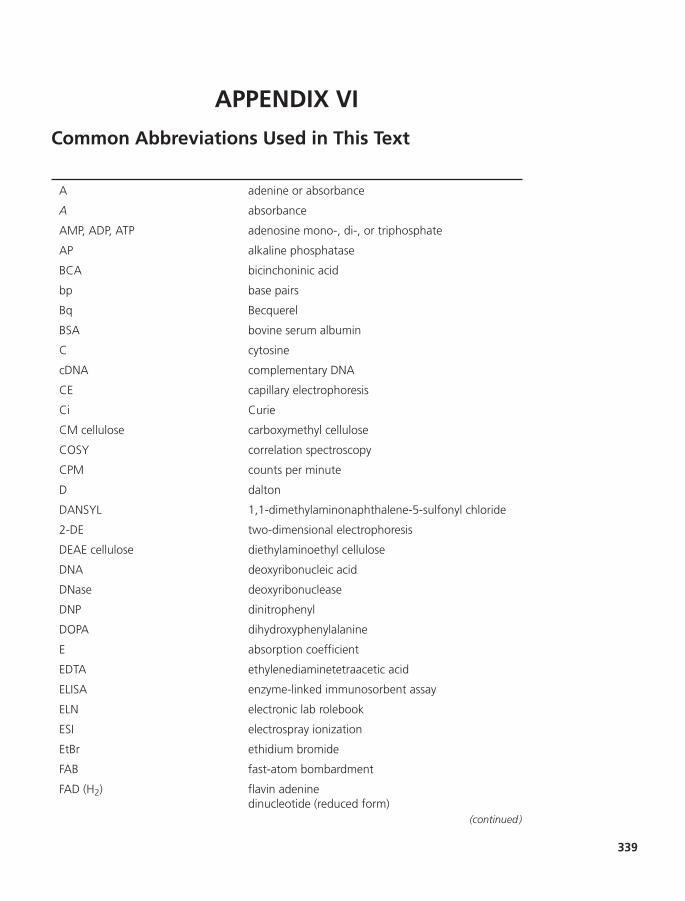
APPENDIX VI
Common Abbreviations Used in This Text
339
A adenine or absorbance
A absorbance
AMP, ADP, ATP adenosine mono-, di-, or triphosphate
AP alkaline phosphatase
BCA bicinchoninic acid
bp base pairs
Bq Becquerel
BSA bovine serum albumin
C cytosine
cDNA complementary DNA
CE capillary electrophoresis
Ci Curie
CM cellulose carboxymethyl cellulose
COSY correlation spectroscopy
CPM counts per minute
D dalton
DANSYL 1,1-dimethylaminonaphthalene-5-sulfonyl chloride
2-DE two-dimensional electrophoresis
DEAE cellulose diethylaminoethyl cellulose
DNA deoxyribonucleic acid
DNase deoxyribonuclease
DNP dinitrophenyl
DOPA dihydroxyphenylalanine
E absorption coefficient
EDTA ethylenediaminetetraacetic acid
ELISA enzyme-linked immunosorbent assay
ELN electronic lab rolebook
ESI electrospray ionization
EtBr ethidium bromide
FAB fast-atom bombardment
FAD (H2) flavin adenine dinucleotide (reduced form)
(continued)

340 Appendix VI
FAME fatty-acid methyl ester
FMN (H2) flavin mononucleotide (reduced form)
FOCSY foldover-corrected spectroscopy
FPLC fast-protein liquid chromatography
FT Fourier transform
g gravitational force
G guanine
GC gas chromatography
GMP, GDP, GTP guanosine mono-, di-, or triphosphate
Hb hemoglobin
HMIS Hazardous Materials Identification System
HPLC high-performance liquid chromatography
HRP horseradish peroxidase
HTML hypertext markup language
IE immunoelectrophoresis
IEF isoelectric focusing
IHP inositol hexaphosphate
IgG immunoglobulin gamma
IMAC immobilized metal-ion affinity chromatography
IR infrared
ISP Internet service provider
IVS intervening sequence
kb kilobase pairs
L ligand
M macromolecule
M molarity
MALDI matrix-assisted laser desorption ionization
MS mass spectrometry
MSDS material safety data sheet
NAD(H) nicotinamide adenine dinucleotide (reduced form)
NADP(H) nicotinamide adenine dinucleotide phosphate(reduced form)
NMR nuclear magnetic resonance
NOESY nuclear Overhauser effect spectroscopy
OSHA Occupational Safety and Health Administration
PAGE polyacrylamide gel electrophoresis
PC paper chromatography

Appendix VI 341
PCR polymerase chain reaction
PEG polyethylene glycol
PFGE pulsed-field gel electrophoresis
PMT photomultiplier tube
POPOP 1,4-bis[5-phenyl-2-oxazolyl]benzene
PPO 2,5-diphenyloxazole
PVDF polyvinyldifluoride
RCF relative centrifugal force
Rf relative mobility in chromatography
RFLP restriction fragment length polymorphism
RIA radioimmunoassay
RNA ribonucleic acid
RNase ribonuclease
RT reverse transcriptase
s sedimentation coefficient
S Svedberg unit (10-13 s)
SDS sodium dodecyl sulfate
SECSY spin-echo correlation spectroscopy
SMP submitochondrial particles
T thymine
TAG triacylglycerol
TEMED N, N, -tetramethylethylenediamineN¿, N¿TLC thin-layer chromatography
TOCSY 2-D total correlation spectroscopy
TOF time of flight
Tris tris(hydroxymethyl)aminomethane
TROSY transverse relaxation-optimized spectroscopy
U uracil
URL uniform resource locator
UV ultraviolet
VIS visible
WWW World Wide Web
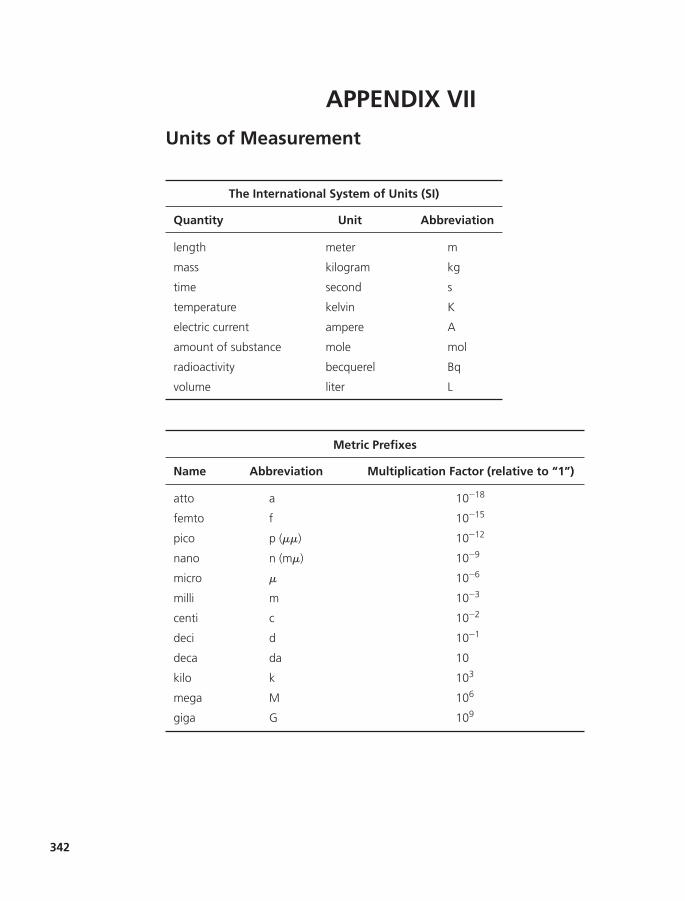
APPENDIX VII
Units of Measurement
342
The International System of Units (SI)
Quantity Unit Abbreviation
length meter m
mass kilogram kg
time second s
temperature kelvin K
electric current ampere A
amount of substance mole mol
radioactivity becquerel Bq
volume liter L
Metric Prefixes
Name Abbreviation Multiplication Factor (relative to “1”)
atto a 10-18
femto f 10-15
pico p (mm) 10-12
nano n (mm) 10-9
micro m 10-6
milli m 10-3
centi c 10-2
deci d 10-1
deca da 10
kilo k 103
mega M 106
giga G 109
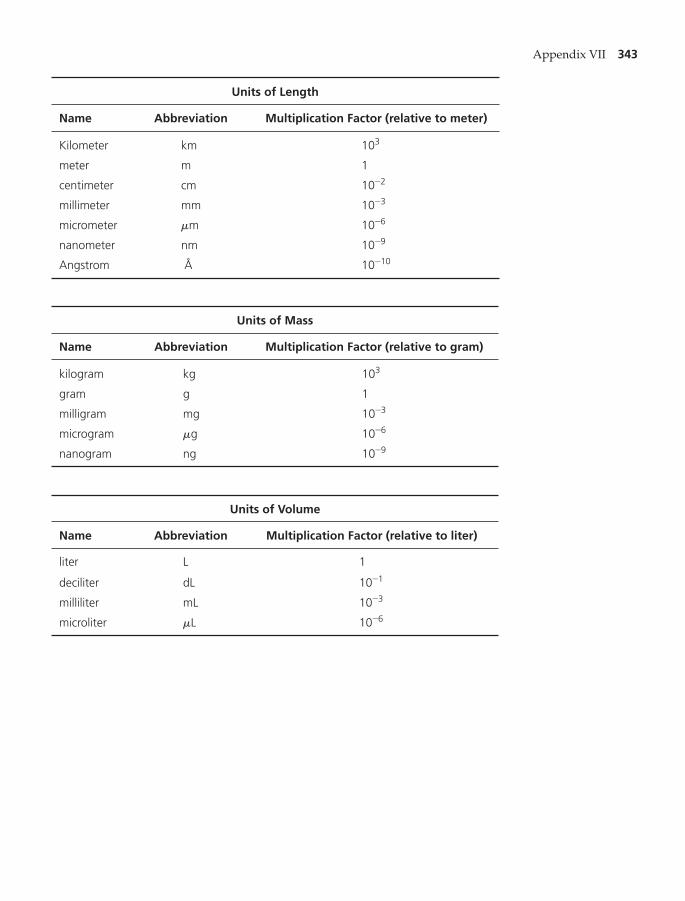
Appendix VII 343
Units of Length
Name Abbreviation Multiplication Factor (relative to meter)
Kilometer km 103
meter m 1
centimeter cm 10-2
millimeter mm 10-3
micrometer mm 10-6
nanometer nm 10-9
Angstrom Å 10-10
Units of Mass
Name Abbreviation Multiplication Factor (relative to gram)
kilogram kg 103
gram g 1
milligram mg 10-3
microgram mg 10-6
nanogram ng 10-9
Units of Volume
Name Abbreviation Multiplication Factor (relative to liter)
liter L 1
deciliter dL 10-1
milliliter mL 10-3
microliter mL 10-6

APPENDIX VIII
Table of the Elements*
344
Symbol Atomic No. Atomic Mass
Actinium Ac 89 227.0278
Aluminum Al 13 26.98154
Americium Am 95 [243]†
Antimony Sb 51 121.75
Argon Ar 18 39.948
Arsenic As 33 74.9216
Astatine At 85 [210]
Barium Ba 56 137.33
Berkelium Bk 97 [247]
Beryllium Be 4 9.01218
Bismuth Bi 83 208.9804
Bohrium Bh 107 [264]
Boron B 5 10.81
Bromine Br 35 79.904
Cadmium Cd 48 112.41
Calcium Ca 20 40.08
Californium Cf 98 [251]
Carbon C 6 12.011
Cerium Ce 58 140.12
Cesium Cs 55 132.9054
Chlorine Cl 17 35.453
Chromium Cr 24 51.996
Cobalt Co 27 58.9332
Copernicium Cn 112 [285]
Copper Cu 29 63.546
Curium Cm 96 [247]
Darmstadtium Ds 110 [281]
Dubnium Db 105 [262]
Dysprosium Dy 66 162.50
Einsteinium Es 99 [252]

Appendix VIII 345
Symbol Atomic No. Atomic Mass
Erbium Er 68 167.26
Europium Eu 63 151.96
Fermium Fm 100 [257]
Fluorine F 9 18.998403
Francium Fr 87 [223]
Gadolinium Gd 64 157.25
Gallium Ga 31 69.72
Germanium Ge 32 72.59
Gold Au 79 196.9665
Hafnium Hf 72 178.49
Hassium Hs 108 [270]
Helium He 2 4.00260
Holmium Ho 67 164.9304
Hydrogen H 1 1.0079
Indium In 49 114.82
Iodine I 53 126.9045
Iridium Ir 77 192.22
Iron Fe 26 55.847
Krypton Kr 36 83.80
Lanthanum La 57 138.9055
Lawrencium Lr 103 [262]
Lead Pb 82 207.2
Lithium Li 3 6.941
Lutetium Lu 71 174.967
Magnesium Mg 12 24.305
Manganese Mn 25 54.9380
Meitnerium Mt 109 [268]
Mendelevium Md 101 [258]
Mercury Hg 80 200.59
Molybdenum Mo 42 95.94
Neodymium Nd 60 144.24
Neon Ne 10 20.179
Neptunium Np 93 237.0482
Nickel Ni 28 58.70
Niobium Nb 41 92.9064
(continued)

346 Appendix VIII
Symbol Atomic No. Atomic Mass
Nitrogen N 7 14.0067
Nobelium No 102 [259]
Osmium Os 76 190.2
Oxygen O 8 15.9994
Palladium Pd 46 106.4
Phosphorus P 15 30.97376
Platinum Pt 78 195.09
Plutonium Pu 94 [244]
Polonium Po 84 [209]
Potassium K 19 39.0983
Praseodymium Pr 59 140.9077
Promethium Pm 61 [145]
Protactinium Pa 91 231.0359
Radium Ra 88 226.0254
Radon Rn 86 [222]
Rhenium Re 75 186.207
Rhodium Rh 45 102.9055
Rubidium Rb 37 85.4678
Ruthenium Ru 44 101.07
Rutherfordium Rf 104 [261]
Samarium Sm 62 150.4
Scandium Sc 21 44.9559
Seaborgium Sg 106 [266]
Selenium Se 34 78.96
Silicon Si 14 28.0855
Silver Ag 47 107.868
Sodium Na 11 22.98977
Strontium Sr 38 87.62
Sulfur S 16 32.06
Tantalum Ta 73 180.9479
Technetium Tc 43 [98]
Tellurium Te 52 127.60
Terbium Tb 65 158.9254
Thallium Tl 81 204.37
Thorium Th 90 232.0381

Appendix VIII 347
Symbol Atomic No. Atomic Mass
Thulium Tm 69 168.9342
Tin Sn 50 118.69
Titanium Ti 22 47.90
Tungsten W 74 183.85
Uranium U 92 238.029
Vanadium V 23 50.9415
Xenon Xe 54 131.30
Ytterbium Yb 70 173.04
Yttrium Y 39 88.9059
Zinc Zn 30 65.38
Zirconium Zr 40 91.22
*Atomic masses are based on carbon-12.†A value given in brackets denotes the mass number of the longest-lived or best-known isotope.

APPENDIX IX
Answers to Odd-Numbered Study ProblemsChapter 1
1. Personal Protection Index for glacial acetic acid: splash goggles, gloves, syn-thetic apron, and vapor respirator.
3. Every biochemistry lab is different, so a general picture is not possible. Youshould know where safety features are present in your lab.
5. Water purified by ion exchange will contain organic molecules that arewashed from the ion-exchange resin. These contaminants will increase the UV-absorbance properties of the water.
7. 100 mM.9. 58.5 mM; 20 mg/mL; 2%.
11. a. .b. Standard deviation .c. 95% confidence limits at a probability of 0.05.
13. Use the graduated cylinder to measure and pour 46.1 mL (1 mole) of 100%ethanol into the volumetric flask. Add water to the etched mark and mix well.
Chapter 2
1. a. The enzyme tyrosinase is found in a wide variety of plants, animals, andfungal species.
b. Copper.c. Inhibitors: benzoic acid, cyanide, and other compounds that complex with
copper. Search for references in PubMed.d. Another substrate: catechol.e. Use PDB or other site to search for a structure.
3. Proteins purified by IMAC: histidine-tagged proteins used in recombinantprotein expression (see Chapter 11, Section B, p. 319); human and bovine
-lactalbumin.5. -A-A-G-C-T-T-; between A and A.7. -lactalbumin is a regulatory protein in milk that when complexed with the
enzyme galactosyl transferase stimulates the synthesis of milk sugar, lactose.9. For a start, see Chapter 11, Section B, p. 321.
Chapter 3
1. : 0.31 mole; 37.2 g.: 0.19 mole; 26.9 g.
3. Use 0.03 mole of isoelectric glycine and 0.07 mole of sodium glycinate for 1 literof solution.
5.
Na2HPO4
NaH2PO4
a
a
= +3.21° ; 0.03°= ;0.043°
Sample mean = +3.21°
348
Tube No. 1 2 3 4 5 6
IgGmg 0 10 20 40 80 100
A595 0.0 0.05 0.10 0.20 0.40 0.50

Appendix IX 349
7. .9. Pure DNA has a 260/280 ratio of about 1.8. The sample is probably contaminated
with protein.11. Primarily Tyr and Trp; no.13. A at 260 A at .15. The very best protein to use as a standard is a purified preparation of the pro-
tein being assayed; however, it is often not available. 17. a. Citrate.
b. Imidazole.c. Glycine.
19. 0.49/day21. Solution B: 0.2 M.
Solution C: 0.02 M.Solution D: 0.002 M.
23. 77 days.
Chapter 4
1. (a), (b), (d).3. Hemoglobin.5. There are four subunits each with molecular weight 10,000 and two subunits
each with molecular weight 30,000.7. Magnesium ions bind to DNA in place of smaller protons, causing the DNA to
spread out and thus become less dense.9.
11. Most mitochondria sediment at
Chapter 5
1. a. Asp, Gly, His.b. Glu, Ala, Arg.c. Glu, Phe, His.
3. Cyt c, , serum albumin, egg albumin, pepsinogen.5. Myosin, catalase, serum albumin, chymotrypsinogen, myoglobin, cyt c.7. Malate dehydrogenase, alcohol dehydrogenase, glucokinase.9. A dilute solution of should elute the enzyme from the affinity gel.
11. Hydrogen bonding, ionic bonds, hydrophobic interactions, van der Waalsforces.
13. Sephadex G-100.15. Use PubMed or other computer bibliographic searches.
Chapter 6
1. Charge, size.3. From top to bottom: serum albumin, egg white albumin, chymotrypsin,
lysozyme.5. The gel matrix in slab gels is more uniform than the gel in column gels, which
are made individually.7. Polyacrylamide gels may be used for nucleic acids up to 2000 base pairs.9. Acrylamide is a potent neurotoxin, suspected carcinogen, and skin irritant.
Gloves and a mask must be worn while handling it in the unpolymerized form.
NAD+
myoglobin = hemoglobin
20,000 * g.125,000 * g.
280 nm = 0.39nm = 0.7;
17.5 mg>mL

350 Appendix IX
Weighing and making solutions of acrylamide should be carried out in a well-ventilated hood.
11. Western blotting: used to identify a specific protein or group of proteins byimmunoblotting (detection by antibodies). Southern blotting: used to identify aspecific base sequence in DNA. Northern blotting: used to identify a specificbase sequence in RNA.
13. Nylon membranes, because they are cationic and strongly bind acidic proteins.15. If SDS-PAGE is used for separation, the proteins to be blotted are denatured.
The antibodies used for the detection process must be able to recognize andbind to denatured proteins.
17. The protein has an abundance of nonpolar amino acid residues; thus, it willbind best to polyvinyldifluoride (PVDF) membranes, which are hydrophobic.
Chapter 7
1. a. X-ray.b. Ultraviolet.c. Visible.
3. (1) a.(2) a.(3) c.(4) d.(5) b.
5. (a), (b), and (d).7. All the molecules contain alternating double bonds (are highly conjugated).9. Fluorescing light is measured at right angles to the light irradiating the sample.
Chapter 8
1. First plot: . Second plot: .3. The tryptophan residue must be close to a site on the human albumin where
sugars bind. Bound sugars interact with the tryptophan.5. The binding of the molecular probe must be reversible; the bound probe must
have a different absorbance spectrum from the unbound probe.7. From Michaelis-Menten plot: ; .9. Type of inhibition: competitive.
11. The rate is linear for only about 2 minutes.13. Ionic bonding.
Chapter 9
1. DNA, which forms viscous solutions, is released from the cells into the medium.3. SDS is a detergent that dissociates protein-lipid complexes in cell membranes.5. The absorbance at .7. It must be assumed that the blue dye marker moves faster in electrophoresis
than any of the proteins or nucleic acids analyzed in the gel.9. a. Lowered.
b. Lowered.c. Lowered.d. Probably little or no effect.
11. .30 mg>mL
260 nm = 0.70
KM = 40–45 mMVmax = 140 mM>min
Kf = 0.6 mMn = 2.5;Kf = 1.1 mMn = 2;

Appendix IX 351
Chapter 10
1. Many plasmids contain genes that carry messages for the synthesis of proteinsthat protect microorganisms against antibiotics. The presence of certain antibi-otics is a signal to a microorganism that more of these proteins are necessary.The microorganism responds by increasing the rate of production of plasmids.
3. Natural DNA molecules and restriction fragments are too large to penetratepolyacrylamide gels. Even gels with low percentage cross linking are not useful.
5. Restriction endonucleases require the presence of magnesium ions for activity.The quench buffer contains EDTA which complexes transition metal ions in thesolution. The metal ions are no longer available for binding by the nucleasemolecules and enzyme activity is inhibited.
7. (b).9. Ten fragments.
Chapter 11
1. The protein concentration is about 1.2 mg/mL.3. Tyrosine and tryptophan. 5. See Figure 4.11.7. SDS-PAGE. 9. Nitrogen atoms in imidazole.

This page intentionally left blank

INDEX
Note: An f indicates a figure and a t indicates a table.
353
AAbbreviations, 339–341Absorbance spectrum, 212Absorption, ultraviolet, 279Absorption coefficient, 208Absorption spectrum, 207, 207fAbsorptivity, 208Accuracy, in error analysis, 24Acids, 56–57, 334Acrylamide, 170Adenine, as nitrogen base in DNA, 268f, 269, 269t,
270f, 272fAdsorbents
in biochemical applications, 123tgroup-specific, 155–156, 156t
Adsorption chromatographydefinition of, 117partition chromatography vs., 117–118
Advanced planar chromatography, 121–122Affinity chromatography, 152–159
experimental procedure for, 157–159, 158fmedia for, 153
Affinity elution, 157Agarose
cyanogen bromide-activated, in affinity chromatography, 154
epoxy-activated, 155, 155fgel preparation from, 177
Agarose beads, 153Agarose gel, 135Agarose gel electrophoresis
description of, 177–180, 178t, 179fin separation and analysis of nucleic acids, 282
Alpha1-acid glycoproteins, 149Amino acid buffer, 63Amino acids, 337
in peptides and proteins, 323–328, 325fin proteins, 309t
6-Aminohexanoic acid-agarose, 154, 155fAmpholytes, 183Amphoteric substance, 53Analyte(s), 116, 213–215Analytical centrifugation, 95, 108–112, 112tAnalytical procedure
for protein purification, 308Anion exchangers, 127, 128tAntibody, 195–196Articles, 45Ascending eluent flow, 137Assays
BCA, 68t, 70Biuret, 67, 68tBradford protein, 68t, 69f–70f, 69–70, 214–215, 247f,
247–249enzyme-linked immunosorptive, 196
fixed-timeof enzyme activity, 259–260kinetic assay vs., 259–260
kineticdescription of, 259f, 259–260fixed-time assay versus, 259–260
Lowry, 67–69, 68tprotein, 309–310
Automated ion-exchange chromatography, 324Automatic pipetting devices, 21–22, 22fAutoradiography, 89–90, 90f, 191Average, 24
BBacteriophage lambda, 296Baculovirus expression vector system (BEVS), 297Bases, 56, 334Batch separation, in ion exchange, 130–131BCA protein assay, 68t, 70Becquerel, 84Bed volume
in column chromatography, 122in gel chromatography, 133
Beer-Lambert law, 207–208BEVS (baculovirus expression vector system), 297Biochemical buffers, 56–63Biochemical databases, 41t–42tBiochemical reactions, 217–218Biochemistry
computational, 39computer use in, 38–40mass spectrometry application in, 232–233nuclear magnetic resonance in, 226–227, 228f
Bioinformatics, 39Biological catalysis, 250–262, 251t–252t, 253f, 257f, 259fBiomolecule(s)
electronic transitions in, 205f, 205–206interactions of, 239–266, 240t–241t, 244f, 247f, 249f,
251t–252t, 253f, 254t, 257f, 257t, 259f, 262t. See alsoBiological catalysis
primary structure of, 323–328, 325f–326fspectroscopic analysis of, 201–234unknown, spectrophotometric identification of, 215–217,
216f–217fviewing structures of, 43–44
Biosensors, 66f, 66–67BIOSIS Previews, 46Biotechnology
enzymes in, 294–304recombinant DNA, 290–297. See also Recombinant DNA
Bisbenzimidazole, 72, 72tBiuret assay of proteins, 67, 68tBlotting
Northern, 193, 304nucleic acid, 304

354 Index
Blotting (cont’d)Southern, 193, 193fWestern, 193–197, 196f–197f
Bookmarks, 42Books, reference, 44–45Borate buffer, 63Bradford protein assay, 68t, 69f–70f, 69–70, 214–215, 247f,
247–249Buffers
amino acid, 63biochemical, 56–63borate, 63carboxylic acid, 63definition of, 57dilutions of, 63–64Good’s, 59–60, 61t–62tphosphate, 58properties of, 335–336range of, 58fzwitterionic, 59–60, 61t–62t
CCalculations, 8Calibrated pipets, 19–21Capacity, of ion exchanger, 127Capillary electrophoresis, 165, 185–186, 186f–187f, 324Capillary transfer, 195Carbonyldiimidazole-activated supports, 154, 155fCarboxylic acid, 63Catalysis, biological, 250–262, 251t–252t, 253f, 254t, 257f, 259fCation exchangers, 127, 128tCE (capillary electrophoresis), 165, 185–186, 186f–187f, 324Cell bomb, 312Cellobiohydrolase, 149Centrifugal force, 96
relative, 96f–97f, 96–98Centrifugal vacuum concentration, 78–79Centrifugation, 96–113
analytical, 95, 108–112, 112tapplications of, 106–113density-gradient, 110–111, 112tdifferential, 108–110, 109f, 112tfractional, 107, 107f, 112tinstrumentation for, 99–106, 101f–103f, 101tisopycnic, 109f, 111, 112tpreparative, 95, 106–107, 112tprinciples of, 96–99summary of, 112tvelocity sedimentation, 107zonal, 109f, 110–111, 112t
Centrifuge rotors, 99, 102fCentrifuges
care of, 112–113high-speed, 101f–103f, 101t, 101–104low-speed, 99–101
CF dyes, 190Chain termination method, 176Channels, in scintillation counters, 87Chaotropic agents, 157–158Chemical degradation method, 283Chemical quenching, 87–88Chemical shifts, 226Chiral chromatography, 148–149
Chromatofocusing, 131Chromatography, 115–164
advanced planar, 121–122affinity, 152–159chiral, 148–149column, 122–126. See also Column chromatographycovalent, 156development of, 115gel exclusion, 132f, 132–140, 134t–135t, 138f. See also Gel
exclusion chromatographyhigh-performance liquid, 140–152. See also
High-performance liquid chromatographyhydrophobic interaction, 155–156introduction to, 116–118ion-exchange, 126–132, 127f, 128t, 129f, 160f. See also
Ion-exchange chromatographyliquid-liquid, 146liquid-solid, 145–146membrane-based, 159–160, 160f–161fmetal affinity, 156paper, 118–122, 119, 119f–120f, 121partition, 117–118perfusion, 151f, 151–152planar, 118–122, 119f–120fprinciples of, 116fin protein purification, 316stationary phase of, 116, 122thin-layer, 118–122, 119f–120ftwo-dimensional, 120f
Chrome, 40Chromosomal DNA, 275–277Chromosomes, yeast artificial, 297Cloning, molecular, 290–292, 291f–292fCoincidence circuit, 85f, 87Color quenching, 87Column chromatography
collecting eluent in, 126detection of eluting components in, 126eluting the column in, 125loading the column in, 125operation of column in, 123–124, 124fpacking column in, 124–125setup for operation of, 124f
Columns, 143Combination electrode, 54, 55fCommunication, of research results, 9–14Competitive inhibition, of enzyme activity, 255, 257f, 257tComplementary base pairing, 271Complementary DNA (cDNA), 321Computational biochemistry, 39Computer software
enzyme kinetic data analysis using, 262freeware, 39ligand-macromolecule binding analysis using, 249–250
Computers, 38–40Concentration effects, 56Confidence limits, 27Controlled-porosity glass (CPG), 153Coomassie Brilliant Blue, 69, 69f, 190, 247, 247fCovalent chromatography, 156Crystallography, x-ray, 233f, 233–234Crystals, protein, 233f, 234C-terminal analysis, 327

Index 355
Curie, 84Cuvettes, 210–211Cyanogen bromide-activated agarose, in affinity
chromatography, 154Cytosine, as nitrogen base in DNA, 268f, 269, 269t,
270f, 272fCytosol, 107
D2-D total correlation spectroscopy (TOCSY), 227Dalton, 108Data
collection and analysis of, 37, 234enzyme kinetic, 262experimental, statistical analysis of, 23–30in experimental write-up, 8sample of, 24
Databases, 39, 41t–42t, 47ß-D-2-deoxyribose, 268, 269f2-DE (two-dimensional electrophoresis), 184–185, 185fDecay constant, 82Denaturation, thermal, 279f, 279–280Denaturing electrophoresis, 174Density gradients, 111Density-gradient centrifugation, 110–111, 112tDeoxyribonucleic acid. See DNADetector
high-performance liquid chromatography, 143–144ion, in mass spectrometer, 230, 231ffor ultraviolet-visible absorption spectrophotometry, 211
Determinate errors, 23Developing, in column chromatography, 122Development, in chromatography, 117Deviation
sample, 25t, 26standard, 26
Dextran, 133, 134t, 135Dextran-polyacrylamide gel, 133, 134t, 135Dialysis, in sample preparation, 73f, 73–741,6-Diaminehexane-agarose, 154, 155fDideoxy method, 283Difference spectroscopy, 218–219, 219fDifferential centrifugation, 108–110, 109f, 112tDifferential refractometer, 143Diffusion pores, 151Dilutions, buffer, 63–64Discontinuous gel electrophoresis, 172f, 172–173Discriminators, 87Discussion, in experimental write-up, 8–9DNA
characterization of, 279f, 279–280chromosomal, 275–277complementary, 321extraction of, from bacteria, 276–277fragments of, 178–180, 179fintroduction to, 268f–269f, 268–275, 269t, 270f, 271t,
273f, 274finvestigation of, 279–284, 280fmolecules of, sequencing of, 282–284, 283f, 284tplasmid, 277–278recombinant, 290–297, 2930, 295fsequencing of, 328solutions of, 280–281
structure and function of, 270f, 270–272, 271t, 273fsuperhelical structure of, 180
DNA fingerprinting, 303DNA ligase, 292, 292fDouble helix structure, of DNA, 271, 272fß-D-ribose, 268, 269fDyes
CF, 190SYBR, 177, 179f, 191SYPRO, 190tracking, 189–190
EEdman sequence method, 326, 327fEffective mass, of particle, 98Effluent, in chromatography, 117Electroblotting, 195Electrodes
combination, 54, 55foxygen, 64–66, 65fpH, 54–56
Electron density map, 234Electronic lab notebook software, 9Electronic transitions, 204
in biomolecules, 205f, 205–206Electrophoresis
agarose gel, 177–180, 178t, 179fbands in, 189–192, 192fcapillary, 165, 185–186, 186f–187f, 324denaturing, 174discontinuous gel, 172f, 172–173instrumentation for, 188methods of, 167–188polyacrylamide gel, 167–172, 168f, 169t, 170f–172f. See also
Polyacrylamide gel electrophoresispractical aspects of, 188–198pulsed field gel, 180–182, 181freagents in, 189results of, 197–198slab gel, 169–172, 171f, 177fsodium dodecyl sulfate–polyacrylamide gel, 174–176, 175ftheory of, 166–167zonal, 165
Electrospray ionization, 231Elements, table of, 344–347ELISA (enzyme-linked immunosorptive assay), 196Eluting, in column chromatography, 122, 125Elution
affinity, 157continual, 125gradient, 125of molecules in chromatography, 116stepwise, 125
Elution volumein column chromatography, 123in gel chromatography, 133
Enantiomers, 148–149, 149fEndonucleases, restriction. See Restriction endonucleasesEnergy, in ultraviolet-visible absorption spectrophotometry,
202–203, 203fEnhancement, of quantum yield in fluorescence
spectrophotometry, 221–222Enzyme-linked immunosorptive assay (ELISA), 196

356 Index
Enzymesactivity of, 255–258, 257f, 257tassay of, 258–261as biological catalysts, 250–262classes of, 250–251, 251t–252tkinetic data on, 262kinetic properties of, 252–253, 253fin molecular biology and biotechnology, 294–304restriction. See Restriction endonucleases
Epoxy-activated agarose, 155, 155fEquilibrium constant, 57Error analysis, 24Errors
definition of, 23determinate, 23indeterminate, 23–24ninety-five hundredths, 27percentage proportional, 27types of, 23–24
Escherichia coli plasmids, 296Ethernet, 39Ethidium bromide, 180, 191Ethidium bromide binding, 280f, 280–281Ethidium bromide-agarose, 72t, 73Eukaryotic cells, 320–322Excited state of molecule, 204, 204fExclusion limit, 133External standard method, 89Extinction coefficient, 208
FFast protein liquid chromatography, 150–151Favorites, 42Fillers, pipet, 18f, 18–19Firefox, 40Fixed-angle rotors
in high-speed centrifuges, 102, 102f–103fin low-speed centrifuges, 100
Fixed-time assayof enzyme activity, 259–260kinetic assay vs., 259–260
Flag, in protein purification, 3199-Fluorenylmethyl chloroformate, 324Fluorescence, 202
definition of, 220ethidium bromide binding and, 280f, 280–281intensities of, relative, 223measurements of, 224–225
Fluorescence detectors, 144Fluorescence intensity, 221–222Fluorescence spectrophotometry, 220f–221f, 220–225, 225f
applications of, 223–224instrumentation for, 222f, 222–223principles of, 220f–221f, 220–221quantum yield in, 221–222
Fluorsextrinsic, 224, 225fintrinsic, 223–224, 225fprimary and secondary, 86
Foldover-corrected spectroscopy, 227Forensics, 303–304FPLC (fast protein liquid chromatography), 150–151Fractional centrifugation, 107, 107f, 112t
Fractionation range, 133Fractionations, gel, 136Freedom, degree of, 27Freeware, 39Frictional coefficient, in centrifugation, 98Frictional force, in centrifugation, 98Fusion proteins, 319
GGaussian distribution, 26, 26fGel(s)
bufferless precast, 189chemical properties of, 133, 134t–135t, 135nucleic acid sequencing, 176–177polyacrylamide, 168f, 168–169, 169t, 170fprecast, 189preparation and storage of, 136resolving, 172, 172freusable precast, 189selecting, 135–136stacking, in discontinuous gel electrophoresis, 172f,
172–173viewing nucleic acids on, 177–178, 179f, 191–192, 192f
Gel column, 136–137Gel exclusion chromatography, 132f, 132–140, 134t–135t, 138f
applications of, 138f, 138–140physical characteristics of, 133theory of, 132f, 132–133
Gel filtration, 132. See also Gel exclusion chromatographyGel fractionation, 136GelGreen, 178, 191Gel particle shape and size, 133Gel permeation chromatography, 133GelRed, 178, 191Gene
expression of, 317–322, 318fforeign, 317–322, 318f
Gene synthesis, 321-322Gene therapy, 307Genomes, sequenced, 283–284, 284tGlass, controlled-porosity, 153Glassware, 15Glycosylation, 232Good’s buffer, 59–60, 61t–62tGoogle, 42Gradient elution, 125Graduated pipets, 18f, 20–21Grinding, in crude protein extract preparation, 312, 313fGround state, 204, 204fGroup separation, in gel chromatography, 136Guanine, as nitrogen base in DNA, 268f, 269, 269t,
270f, 272f
HHalf-life, of radioisotopes, 82Hazardous Materials Identification System, 3, 5fHenderson-Hasselbalch equation, 57, 59High-performance liquid chromatography, 140–152
description of, 324fast protein, 150–151gel exclusion, 147–148instrumentation for, 142f, 142–144ion-exchange, 147, 148f

Index 357
mobile phase of, 150operating conditions for, 150reverse-phase, 146, 147fsample preparation in, 150solvents for, 150stationary phases in, 144, 145f
Histidine, proteins tagged with, 319Histones, 276HMIS (Hazardous Materials Identification System), 3, 5fHomogenizer, rotor stator, 312, 313fHTML (hypertext markup language), 40Human serum albumin, 149Hybrid proteins, 319Hydrophobic interaction chromatography, 155–156Hyperchromic effect, 280Hyperlinks, 40Hypertext, 40Hypertext Markup Language (HTML), 40Hypothesis, 36, 38
IIE (immunoelectrophoresis), 186–187, 188fIEF (isoelectric focusing), of proteins, 131, 182–184, 183fImmunoadsorption, 156–157Immunoaffinity, 156–157Immunoelectrophoresis (IE), 186–187, 188fInclusion bodies, 318Indeterminate errors, 23–24Initial reaction velocity, 252Injection port, for high-performance liquid
chromatography, 143Instrumentation
for centrifugation, 99–106, 101f–103f, 101tfor electrophoresis, 188for fluorescence spectrophotometry, 222f, 222–223for high-performance liquid chromatography, 142f,
142–144for ultraviolet-visible absorption spectrophotometry, 209f,
209–212, 211fInternational unit, 257Internet
accessing of, 39–40glossary for, 50–51World Wide Web, 40, 45–46
Internet Explorer, 40Ion(s)
metal, 314molecular, 232protonated molecular, 232
Ion detector, 230, 231fIon exchangers
anion, 127, 128tcapacity of, 127cation, 127, 128tin high-performance liquid chromatography, 148fpreparation of, 130selection of, 128–130
Ion-exchange chromatography, 126–132, 127f, 128t, 129fautomated, 324illustration of, 160fion exchangers in, 127–130, 128tresins in, 127–128, 128t, 130–131
Ionic strengthaffinity chromatography and, 157DNA structure and, 275protein stability and, 312
Ionization devices, in mass spectrometer, 230, 231fIsoelectric focusing, of proteins, 131, 182–184, 183fIsoelectric pH, 182Isopycnic centrifugation, 109f, 111, 112tIsotopes
in biochemistry, 82–83definition of, 80
JJournals
biochemistry, 9–11, 10fpublication in, 38research, 45
KKatal, 257–258Kilodaltons, 108Kinetic assay, of enzyme activity
description of, 259f, 259–260fixed-time assay versus, 259–260
LLaboratory notebook, 6–9LAN (local area network), 39Library resources, 41tLigands
in affinity chromatography, 152–154, 153fbinding of, 242–250, 244finteractions of, with macromolecules, 218–219, 219f,
239–250, 240t–241t, 244f, 247f, 249fLight absorption, 201
in ultraviolet-visible absorption spectrophotometry, 204f,204–205
Light scattering, 201Light source, for ultraviolet-visible absorption
spectrophotometry, 209Linear dilutions, 63–64, 64tLiquid chromatography
fast protein, 150–151high-performance, 140–152. See also High-performance
liquid chromatographyLiquid scintillation counting, 85f, 85–89Liquid-liquid chromatography, 146Liquids, quantitative transfer of, 18–22Liquid-solid chromatography, 145–146Literature searches, 44–46Loading, in column chromatography, 122Local area network (LAN), 39Lowry protein assay, 67–69, 68tLyophilization, in sample preparation, 77–79, 79f
MMacromolecules
binding of ligands to, 249–250interactions of, with ligands, 218–219, 219f, 239–250,
240t–241t, 244f, 247f, 249fcharacterization of, by difference spectroscopy,
218–219, 219fprimary structure of, 323–328, 325f–326f

358 Index
MALDI (matrix-assisted laser desorption ionization), 231Mass, effective, 98Mass analyzer, in mass spectrometer, 230, 231fMass spectrometry (MS), 202, 230–233Material Safety Data Sheets (MSDS), 2–4, 4fMatrix-assisted laser desorption ionization (MALDI), 231Maxam-Gilbert chemical cleavage method, 283Mean
definition of, 24–25standard deviation of, 26true, 25
Measurement, units of, 342–343Media, chromatographic, 153Melting curve, for DNA, 279f, 280Melting temperature, for DNA, 280Membrane blotting techniques, 304Membrane-based chromatography, 159–160, 160f–161fMesh size, in column chromatography, 123, 123tMessenger RNA, 273, 273tMetal affinity chromatography, 156Michaelis constant, 254Michaelis-Menten equation, 252–253, 253fMicrocurie, 84Microfuge, 104, 104fMicroporous particles, 144, 145fMicrosequencing, 326–327Millicurie, 84Mixed inhibition, of enzyme activity, 255–256, 257f, 257tMobile phase, of chromatography, 116Mobility
of charged particles, 166–167relative, 120
Mohr pipets, 18f, 20–21Molar absorption coefficient, 208Molarity, 15–16Molecular biology, 268–306
enzymes in, 294–304nucleic acids in, 268–287. See also DNA; Nucleic acids;
RNArecombinant DNA technology in, 290–297
Molecular cloning, 290–292, 291f–292fvectors for, 294, 296–297
Molecular ions, 232Molecular mass, 108Molecular recognition, 239–250, 240t–241t, 244f, 247f, 249fMolecular sieve chromatography, 132. See also Gel exclusion
chromatographyMolecular weight
definition of, 108estimation of, 138f, 138–139of proteins, 338
Molecules to Go, 43Monochromator, 209–210MS (mass spectrometry), 202, 230–233MSDS (Material Safety Data Sheets), 2–4, 4fMultichannel pipettor, 23fMultiple cloning site, 296Mutagenesis, site-directed, 320
NNanodrop spectrometer, 215National Library of Medicine, 46
”Native” polyacrylamide gel electrophoresis, 174NMR spectroscopy. See Nuclear magnetic resonance
spectroscopyNOESY (nuclear Overhauser effect spectroscopy), 227Noncovalent bonding interactions, 240–242, 241tNondenaturing polyacrylamide gel electrophoresis, 174Normal distribution curve, 26, 26fNorthern blotting, 193, 304N-terminal analysis, 325f, 325–326Nuclear magnetic resonance spectroscopy, 202, 225–230,
227t, 228f–229fin biochemistry, 226–227, 228f–229fdefinition of, 225development of, 226protein structures and, 227–230theory of, 226
Nuclear Overhauser effect spectroscopy (NOESY), 227Nucleic acid solutions, 71–73, 72tNucleic acids
blotting of, 192–194, 304density-gradient techniques used to study, 111electronic transition in, 206introduction to, 268f–269f, 268–275, 269f, 270f, 271t,
273f, 274fsequencing gels for, 176–177viewing of, on gels, 177–178, 179f, 191–192, 192f
Nucleosides, 269, 269f, 269tNucleotides, 268, 268f
OOral presentation, 11Osmotic lysis, 311Oxidation, protein stability and, 314Oxygen electrode, 64–66, 65f
PPacking, in column chromatography, 122PAGE. See Polyacrylamide gel electrophoresisPaper, scientific, 9–11, 10fPaper chromatography, 118–122, 119f–120fPartial chemical degradation method, of sequencing nucleic
acids, 176Partition chromatography
adsorption chromatography vs., 117–118applications of, 121definition of, 117
Passive transfer, 195Pasteur pipets, 18f, 19PCR. See Polymerase chain reactionPCR-based analysis, 303–304Pellet, 100Pelleting, 101, 112tPeptide mass fingerprinting, 232Peptides, 232–233Percent by volume solutions, 17Percent by weight solutions, 16Percentage proportional error, 27Perfusion chromatography, 151–152PFGE (pulsed field gel electrophoresis), 180–182, 181fpH
biological, 53–56buffer, 157

Index 359
DNA structure and, 275isoelectric, 182measurement of, 54–56protein stability and, 314
pH electrode, 54–56pH range, of stability, 129, 129fPhenylhydantoins, 145fPhosphate buffer, 583’5’-phosphodiester bonds, 270, 270fPhotodiode arrays, 211Photometric detectors, 143Photomultiplier tubes, 86–87Photons, 202
absorption of, 204scattering of, 204in ultraviolet-visible absorption spectrophotometry, 203
Pipets, 18f, 18–21calibrated, 19–21cleaning and drying of, 21graduated, 18f, 20–21Mohr, 18f, 20–21Pasteur, 19, 19fsafety, 19, 20fserological, 19f, 21volumetric, 19f, 19–20
Pipetting devices, 21–22, 22fPlanar chromatography, 118–122, 119f–120f
advanced, 121–122Plasmid(s)
bacterial, 277as cloning vectors, 294, 296E. coli, 296in molecular cloning, 291relaxed replicated, 277stringent replicated, 277
Plasmid ColE1, 296Plasmid DNA, 277–278Plate development chamber, 122Polyacrylamide gel electrophoresis, 167–172, 168f, 169t,
170f–172fpreparation of gels for, 133, 134t, 168f, 168–169,
169t, 170fPolyacrylamide gels, 134t, 135, 153Polyarginine, 319Polymerase chain reaction
applications of, 303–304fundamentals of, 301–303, 302fin molecular biology and biotechnology, 301–304, 302f
Polyvinyl, 153Population, statistical, 24Pores, in POROS particles, 151Porous layer beads, 144, 145fPoster, scientific, 12f–13f, 12–14Posttranslational processing, 273Precision, in error analysis, 24Preparative centrifugation, 95, 112tPreparative models, 105f–106f, 105–106Preparative procedure
definition of, 117for protein purification, 308
Primary antibody, 195–196Primary literature, 36
Printers, 211–212Prokaryotic organisms, 317–322, 318fProteases, 314Protein(s)
amino acids in, 309tamount versus purity versus expense of, 308–309assay for, 309–310blotted, 195–197, 196f–197fcharacterization, 322–323, 323tcomposition of, 308electronic transitions in, 205–206fusion, 319gene synthesis, 321–322histidine-tagged, 319, 320fhost-cell secretion of, 318–319hybrid, 319identification of, mass spectrometry in, 232ionization and analysis of, 230–232, 231fisoelectric focusing of, 182–184, 183fmolecular weight of, 338posttranslational processing of, 273production of, 317t, 317–322, 318fpurification of, 308f, 308–317, 309t, 310t, 313frecombinant, 317tseparation of, 315–316sequence homology in, 47source of, 310–311stabilization of, in crude extract, 312, 314structures of, 227–230two-dimensional electrophoresis of, 184–185, 185f
Protein crystals, 233f, 234Protein Data Bank, 43Protein solutions, 67–71, 68t, 69f–70fProtein-protein interactions, 233Proteomics, 165, 184, 307Proton acceptor, 57Proton donor, 57Protonated molecular ions, 232PubMed, 46pUC plasmids, 296Pulse height analyzers, 87Pulsed field gel electrophoresis (PFGE), 180–182, 181fPumping systems, 143Purification of biomolecules, 138PyMol, 43
QQuantum yield
in fluorescence spectrophotometry, 221–222measurement of, 223–224
Quenchingin measurement of radioactivity, 87–89of quantum yield in fluorescence spectrophotometry,
221–222
RRadioactivity
detection and measurement of, 85–90measurement of, 90origin and properties of, 80–84units of, 84, 84t

360 Index
Radioisotopesapplications of, 89–90biochemically important, 83tin biochemistry, 80–90commonly used, 81–82decay constant of, 82definition of, 80disintegration constant of, 82half-life of, 82safety and, 90
Radio-labeled molecules, 191Rayleigh scattering, 204Reagents
biochemical, 14–17in chromatography, 120in electrophoresis, 189preparation of, 224–225
Recombinant DNA, 267, 290–297in molecular cloning, 290–292, 291f–292fpreparing, steps for, 292–294, 293f, 295f
Recombinant proteins, 317tRecord keeping, 6–9Recorders, 211–212Reference books, 44–45Relative centrifugal force, 96f–97f, 96–98Relative fluorescence intensities, 223Relative mobility, 120Relaxed replicated plasmids, 277, 294Replicated plasmids
as cloning vectors, 294definition of, 277
Replication, of DNA, 273, 274fResearch
communicating results of, 9–14definition of, 35–36goal of, 36
Research articles, 45Research journals, 45Resins, ion-exchange, 127–128, 128t, 130–131Resolution, in high-performance liquid
chromatography, 141Restriction endonucleases
applications of, 298–299, 300fdigestion by, 178–180, 179fin molecular biology and biotechnology, 297–301,
298t, 300fin molecular cloning, 291, 291fuse of, 299–300
Restriction enzyme map, 299, 300fRestriction fragment length polymorphisms, 303Restriction pattern, 179Results, in experimental write-up, 8–9Retention time, in high-performance liquid
chromatography, 141Retention volume, in high-performance liquid
chromatography, 141Reverse transcriptase, 321Reverse-phase high-performance liquid chromatography,
146, 147fRFLP (restriction fragment length
polymorphisms), 303Ribonucleic acid. See RNARibosomal RNA, 272, 273t
RNAintroduction to, 268f–269f, 268–275, 269t, 273t, 274finvestigation of, 275–285, 280fisolation and characterization of, 284–285messenger, 273, 273tribosomal, 272, 273tsolutions of, 280–281structure and function of, 272–274, 273t, 274ftransfer, 273, 273t
Rotor stator homogenizer, 312, 313fRotors, 99, 102f
care of, 112–113in low-speed centrifuges, 100
SSafari, 40Safety
laboratory, 2–5, 4f, 6fradioisotopes and, 90
Safety pipet fillers, 19, 20fSafety pipets, 19, 20fSample deviation, 25t, 26Sample of data, 24Sanger chain-terminating method, of DNA molecular
sequencing, 283Sanger reagent, 325, 325fScaler, 86Scatchard plot, 249fScatchard’s equation, 244–245, 246fScientific method, 36–38, 37fScientific paper, 9–11, 10fScientific poster, 12f–13f, 12–14Scintillation cocktails, 89SDS-Page (sodium dodecyl sulfate-polyacrylamide gel
electrophoresis), 174–176, 175fSearch engine, 42Secondary antibody, 195–196SECSY (spin-echo correlation spectroscopy), 227Sedimentation coefficient, 99Sedimentation equilibrium, 110, 112tSedimentation velocity, 99Sequential analysis, 325Serial dilutions, 64Serological pipets, 19f, 21Signal transduction, 240Site-directed mutagenesis, 320Slab gel electrophoresis, 169–172, 171f, 177fSLD (soft laser desorption), 231Sodium azide, 131Sodium dodecyl sulfate–polyacrylamide gel electrophoresis
(SDS-Page), 174–176, 175fSoft laser desorption (SLD), 231Solutions
analyte concentration in, 213–215concentrations of, 15–17preparation of, 17, 224–225protein, 67–71, 68t, 69f–70fstoring, 17
Solvent reservoir, 142–143Solvents
development of, 119–120in high-performance liquid chromatography, 150
Sorbent, 116, 118

Index 361
Southern blotting, 193, 193fSpecific activity, 84, 258Spectrofluorometer, 222, 222fSpectrometry
mass, 202, 230–233ultraviolet-visible absorption, 202–220. See also
Ultraviolet-visible absorption spectrometrySpectrophotometer, 209, 209fSpectrophotometric assay
nanodrop, 215of nucleic acids, 71, 72tof proteins, 68t, 70–71
Spectrophotometryfluorescence, 220f–221f, 220–225, 225f. See also
Fluorescence spectrophotometrylimitations and precautions in, 219–220
Spectroscopycorrelation, 2272-D total correlation, 227difference, 218–219, 219ffoldover-corrected, 227nuclear magnetic resonance, 202, 225–230, 227t, 228f–229fnuclear Overhauser effect, 227spin-echo correlation, 227
Spin-echo correlation spectroscopy (SECSY), 227
Spin-spin coupling, 226Stacking gel, 172f, 172–173Stationary phase, of chromatography, 116, 122Statistical analysis
of experimental data, 23–30mean in, 24–25in practice, 28–30of radioactivity measurements, 90sample deviation in, 25t, 26spreadsheet statistics in, 28standard deviation in, 26
Statistical population, 24Statistics, spreadsheet, 28Stepwise elution, 125STN database, 46Stringent replicated plasmids, 277
as cloning vectors, 294Supernatant, 101Svedberg equation, 108Swinging bucket rotors, 100, 102SYBR dyes, 177, 179f, 191SYPRO dyes, 190
TTable of elements, 344–347Temperature
control of, for fluorescence spectrophotometry, 225DNA structure and, 275melting, 280protein stability and, 314transition, 280
Temperature effects, in pH measurement, 56Temperature profile, 279f, 280Textbooks, 44Thermal denaturation, 279f, 279–280Thermal denaturation curve, 279f, 280Thermocyclers, 303
Thin-layer chromatographyapplications of, 121description of, 118–122, 119f–120f
Thymine, as nitrogen base in DNA, 268f, 269, 269t,270f, 272f
TOCSY (2-D total correlation spectroscopy), 227Topoisomerases, 180Tracking dyes, 189–190Transcriptase, reverse, 321Transcription, protein synthesis in, 273Transfer RNA, 273, 273tTransition temperature, 280True mean, 25True value, 24Turnover number, 254Two-dimensional chromatography, 120fTwo-dimensional electrophoresis, 184–185, 185f
UUltracentrifuges, 105f–106f, 105–106Ultrafiltration, 74–77, 75f–76f, 78fUltrasonic waves, 312, 313fUltraviolet absorption, 279Ultraviolet-visible absorption spectrometry, 202–220
absorption spectrum in, 207, 207fapplications of, 212–220Beer-Lambert law in, 207–208electronic transitions in biomolecules in, 205f, 205–206energy in, 202–203, 203finstrumentation for, 209f, 209–212, 211flight absorption in, 204f, 204–205in measurement of concentration of analyte
in solution, 213–215nanodrop spectrometer, 215wavelength in, 202f–203f, 202–203
Uncompetitive inhibition, 256, 257f, 257tUniform resource locator (URL), 40Units of measurement, 342–343Uracil, as nitrogen base in DNA, 268f, 269, 269t,
270f, 272fURL (uniform resource locator), 40
VVan der Waals forces, 272Variable region, of DNA and RNA, 271Velocity sedimentation centrifugation, 107, 112tVertical rotor, in high-speed centrifuge, 102,
102f–103fVirtual biochemistry laboratories, 47–48, 48tVoid volume
in column chromatography, 123in gel chromatography, 133
Volumetric pipets, 19f, 19–20
WWater
purification of, 14–15quality of, 14–15
Water regain, in gel chromatography, 133Wavelength, 202f–203f, 202–203Weak acids, 56–57

362 Index
Weak bases, 56Web browser, 40Web directories, 41tWeb rot, 42Web sites, 40–48, 331–333Weight per volume solutions, 17Western blotting, 193–197, 196f–197fWorld Wide Web
description of, 40literature searches on, 45–46
Write-up, experimental, 7–9
XX-ray crystallography, 233f, 233–234
YYahoo, 42Yeast artificial chromosomes, 297
ZZonal centrifugation, 109f, 110–111, 112tZwitterionic buffer, 59–60, 61t–62t