Embed Size (px)
Citation preview

Cliapter 2
Effect of selected biochemicals on the stability of erythrocyte membrane in three different species

Introduction
Erythrocytes have always been choice objects of inquiry in study
of membranes because of their ready availability and relative simplicity.
They lack organelles and are essentially composed of a single membrane,
the plasma membrane, surrounding a solution of hemoglobin (this
protein forms about 95% of the intracellular protein of RBC). An
erythrocyte possesses remarkable mechanical stability and resilience due
to partnership between plasma membrane and underlying meshwork
called membrane skeleton, being exposed to powerful shearing forces,
large changes in shape and much travel through narrow passages always
during its lifetime. Since they are free from intracellular membranes and
organelles, any effect of a metabolite on osmotic hemolysis can be
interpreted as an effect on the plasma membrane. Thus, erythrocyte
membrane is well suited for studies on action of metabolites,
physiological and toxicant stress on membrane stability - since they are
free from intracellular membranes and organelles. The study of
erythrocyte membrane stabilization is simple, rapid, though non-specific
and is useful as a preliminary screening test for the potential anti
inflammatory compounds. *10 Brown & Mackey H.K found that non
steroidal anti-inflammatory drugs protected erythrocyte membranes from
heat-induced and hypotonic hemolysis.
Changes in protein or lipoprotein structure might account for the
development of erythrocyte membrane destabilization in polyarthritis
and rheumatoid arthritis. *11 Prostaglandin El (pg E) was found to act on
erythrocytes in such a way that it causes phospholipid disruption. *12 At
present many erythrocyte membrane stabilizers (eg. Acetyl salicylic
acid, Phenylbutazone, Enfenamic acid.) and destabilizers (eg. Bile salts,
Prostaglandin Eh Penicillic acid, Acetaminophen, Vitamin A) have been
identified.

Many clinically important non-steroidal anti-inflammatory drugs
react with erythrocyte membrane causing membrane stabilization. The
anti-inflammatory drugs tested stabilized the erythrocyte membrane
against hypotonic hemolysis, whereas at higher concentration resulted in
erythrocyte lysis. The. stabilizing effect of the non- steroidal anti
inflammatory drugs on erythrocytes may be due to a stabilizing effect of
the drugs on certain proteins in the cell membranes. *12a The
association of these drugs with biological membrane of cells and cell
organelles is likely to produce a change in selective permeability
attributing to biochemical activities like inhibition of bio-synthesis of
mucopolysaccharides and antibodies and also normal function of cell
organelles.
Hemolytic effect of penicillic acid and changes of erythrocyte
membrane glycoproteins and lipid components during toxicosis are
reported. The decreased membrane glycoproteins and lipid components
indicate membrane damage during penicillic acid toxicosis. * 13
Penicillic acid affects erythrocyte membrane leading to membrane
damage resulting in the liberation of membrane components from the
membranes.
Toxic dose treatment of acetaminophen induces metabolic and
membranal alterations making red cells prone to hemolysis, while
Vitamin E which is an anti- oxidant shows its ameliorating role to these
changes. *14 Acetaminophen is a metabolite of acetophenetidine and it
may cause hemolytic anemia due to metabolites that oxidize glutathione
and components of red cell membrane. * 15 Vitamin E behaves as a
biological antioxidant and preserves membrane integrity. * 16
7

It also protects membrane from oxidative injuries. *17 Prevention
of hemolysis of red cell due to oxidative damage by Vitamin E has been
reported. * 18 The membrane stabilizing effects of Vitamin E has been
studied by Wassall et al.*19 Disruption by Polyene antibiotics of the
cholesterol rich membrane erythrocytes *20 and lysosomes *21 may be
contrasted with failure of polyenes to interact with cholesterol-poor
mitochondrial membrane.
Retinol destabilizes biological membranes causing hemolysis of
erythrocytes while Vitamin E decreases membrane permeability and
protects it from the disrupting effect of Retinol. Its membrane stabilizer
action is through an interaction with the polyunsaturated fatty acid
residues of phospholipid molecules. *22 Taurine, Zinc and Tocopherol
have been found to possess membrane stabilizer action, proposed as the
mechanism underlying the protective effect. *23
The composition of erythrocyte membranes in different species of
animals may differ as reflected in ratio of protein to lipid. The ratio of
lipid to protein etc., in animals of different species may be different
leading to difference in stability of membranes.
In this part of the project, an attempt has been made to study the
effect of selected metabolites on the stability of erythrocyte membranes
in three different species of vertebrates - a fish, Tilapia (Oreochromis
mossambicus), a bird, Chick (Gallus domesticus) and a mammal, Rabbit
(Oryctolagus cuniculus) to establish the relative stability of erythrocyte
membrane in these cases.
Different membranes within the cell and between cells have
different compositions as reflected in their ratio of protein to lipid and
hence the difference in their functions. These compositional differences

may lead to difference in effect of metabolites on erythrocyte membrane
in different species of animals.
In vitro studies of the effects of different compounds on the
stability of erythrocyte membranes of Oreochromis, Oryctolagus and
Gal/us during heat induced and hypotonic hemolysis were carried out.
The experiment was carried out in two steps - (1) Preliminary
screening of physiological concentrations (10 -3M) of the selected
metabolites and amino acids were studied to find out whether the
metabolite has stabilizing or destabilizing effect during hypotonic
hemolysis of RBC membrane. (2) In the next step, series of different
concentrations (lO-IM - 1O-4M) of the stabilizers identified from the
first experiment were used to study the effect on stability of erythrocyte
membrane in the three different species.
Materials & Methods
Erythrocytes were collected from fresh blood of Oreochromis (of
average size collected from Rice Research Station, Vyttila ); Gal/us
(broiler chicken reared for meat) and Oryctolagus (bred for the studies).
The stock suspension of erythrocytes was prepared from fresh blood
collected in Alseiver's solution by centrifugation at 4°C for 20 minutes.
The erythrocytes were then washed thrice with isotonic salt solution (154
mM in 10 mM sodium phosphate buffer pH 7.4). *24 10 -3M solution of
sodium glycotaurocholate, L-glutamic acid, alpha ketoglutaric acid,
sodium succinate, sodium pyruvate, glycine, taurine,- sodium acetate,
cysteine, ornithine and DOPA were prepared in sodium phosphate buffer
pH 7.4.

Blood was collected from Oreochromis by cardinal vem
puncture using plastic syringe as per the rapid method for repetitive
bleeding in fish. *25
Fresh blood was collected from the vein in the neck of Gal/us.
In Oryctolagus, bleeding was carried out by cutting the marginal
vein of ear or puncture of the central artery of the ear. Blood was drawn
from ear vein of Oryctolagus using glass syringe containing Alseiver's
solution. (Isotonic as well as anticoagulant). *26
Erythrocyte lysis in hypotonic solution was determined by release
of hemoglobin as per procedure of Seiman & Weinstein with slight
modifications to suit the working conditions. *27
The experiment was carried out as follows: -
To 0.2 ml of stock erythrocyte suspension, added 4 ml of
hypotonic solution and 0.2 ml of the metabolite whose effect is to be
studied (of known concentration). After incubation at room temperature
for 30 minutes, the tubes were centrifuged at 1000g for 15 minutes. The
hemoglobin content of the clear supernatant was measured in an uv
visible Spectrophotometer at 540 nm.
The effect of metabolite was studied by the above method in two
steps - preliminary screening to identify erythrocyte membrane
stabilizers. Secondly, different (lO-lM - 10-4M) concentrations of the
stabilizers identified: were again screened to find out their effect on the
erythrocyte membrane.
The hemoglobin released in each step measured colorimetrically was expressed
as a percentage of total hemoglobin released (hemoglobin release by known
concentration of Triton x-lOO detergent at the initial stage of incubatipn .and at
the end of the incubation).
The experimental results obtained from the three species were analyzed
statistically using 3 way ANOV A of the raw data to find out if the results were
statistically significant. The verification and analysis was carried out to find
out the level of significance of effect of difference in species and the action of
metabolite on erythrocyte membrane.
Results
a. Preliminary screening of selected biochemicals: -
Preliminary screening carried out helped to reveal the membrane
stabilizers and destabilizers of erythrocyte membrane in Oreochromis,
Gallus and Oryctolagus. The results of the experiment were analyzed
statistically too.
The membrane stabilizers observed in Oreochromis were glycine,
taurine, sodium acetate, cysteine and ornithine. On statistical analysis the
effects of glycine and taurine on the erythrocyte membrane is not
significant.
The membrane labilizers observed in the fish were sodium
glycotaurocholate, L-glutamic acid, alpha ketoglutaric acid, sodium
succinate, sodium pyruvate and DOP A. The labilizing effect of DOPA on
erythrocyte membrane in fish was found to be statistically significant,
while the results of sodium pyruvate, alpha ketoglutaric· acid, L-glutamic
acid and sodium- glycotaurocholate are not significant statistically.

In Gal/us, the observed erythrocyte membrane stabilizers are
glycine, taurine, sodium acetate, cysteine and ornithine. Erythrocyte
membrane labilizers observed in Gal/us - sodium glycotaurocholate, L
glutamic acid, alpha ketoglutaric acid, sodium succinate, sodium pyruvate
and DOPA.
Statistical analysis carried out has revealed the following
significant membrane stabilizers and destabilizers in Gal/us. Statistically
significant erythrocyte membrane stabilizers - sodium acetate, cysteine
and ornithine. Statistically significant membrane labilizers - DOPA.
The experimentally observed membrane stabilizers identified in
Oryctolagus - glycine, taurine, sodium acetate, alpha ketoglutaric acid,
sodium succinate, sodium pyruvate, cysteine and ornithine. Statistically
significant observations of erythrocyte membrane stabilizers In
Oryctolagus - sodium acetate, cysteine and ornithine.
Statistically significant membrane destabilizers in Oryctolagus - DOPA.
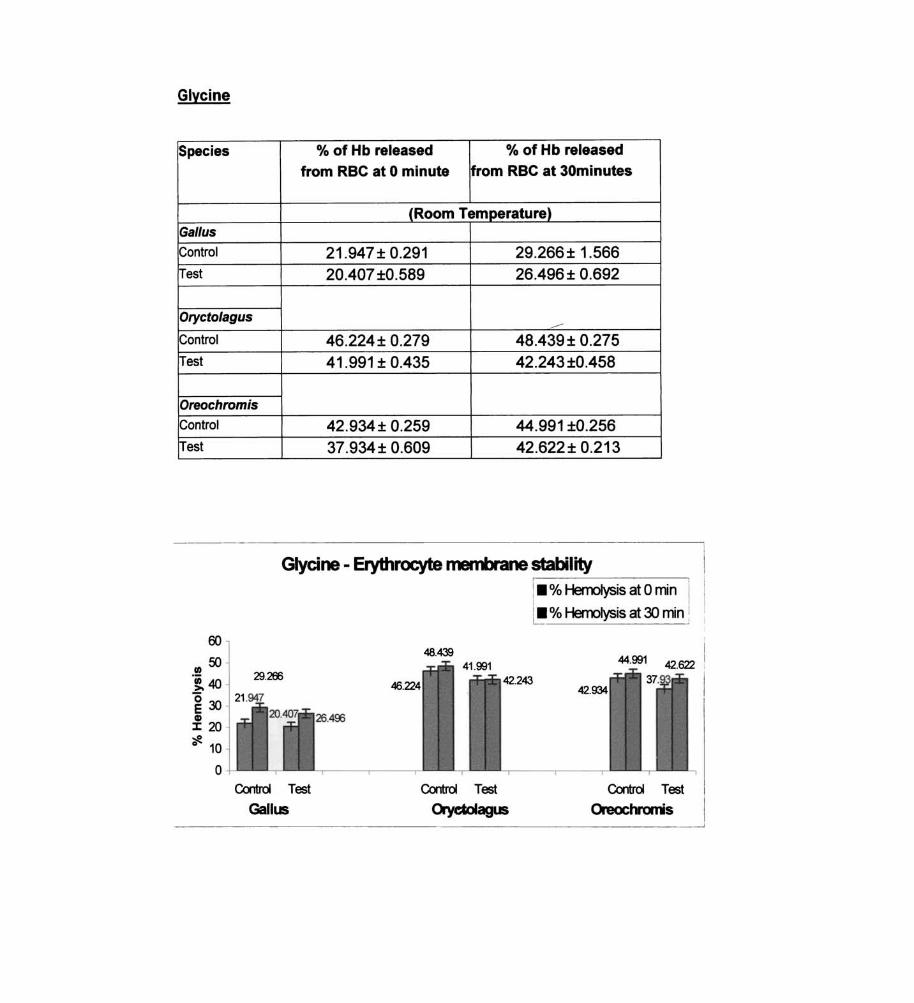
Glycine
Species % of Hb released % of Hb released
from RBC at 0 minute from RBC at 30minutes
(Room Temperature) Gal/us
Control 21.947± 0.291 29.266± 1.566 Test 20.407 ±0.589 26.496± 0.692
Orycto/agus -----Control 46.224± 0.279 48.439± 0.275
Test 41.991 ± 0.435 42.243 ±0.458
Oreochromis
Control 42.934± 0.259 44.991 ±0.256 Test 37.934± 0.609 42.622± 0.213
Glycine - Erythrocyte membrane stability
60
(/)50
l40 ~30 G)
J: 20 ~ o 10
o
29.2ffi
Control Test
Gallus
46.224
26.496
48.439
42.243
Caltrol Test
OrydoIagus
,----------~ I-% HerroIysis at 0 min I I I_ % Hemolysis at 30 min! :
42.934
Control Test
Oreochronis

Taurine
Species % of Hb released % of Hb released
from RBC at 0 minute from RBC at 30minutes
(Room TemJ!erature) Gal/us
Control 21.947± 0.290 29.266± 1.567 Test 19.931 ± 0.477 26.47± 0.725
Oryctolagus
Control 41.084± 0.217 42.056± 0.354 Test 37.85± 0.307 39.626±0.289
Oreochromis
Control 42.934± 0.258 44.991 ± 0.256 Test 40.33± 0.418 41.78± 0.209
• % Hemolysis at 0 min Taurine - Erythrocyte membrane stability • % Hemolysis at 30 min
50
41.004 42.934
Control Test Control Test Control Test
~lIus Oryctolagus Oreochromis

Sodium Acetate
Species % of Hb released % of Hb released
from RBC at 0 minute from RBC at 30minutes
(Room Temperature) Gal/us
Control 78.97 ± 1.047 82.27 ± 0.533 Test 73.67 ± 2.007 77.74± 1.049
Orycto/agus
Control 46.22 ± 0.279 48.43± 0.275 Test 43.42± 0.451 44.98± 0.225
Oreochromis
Control 42.93± 0.258 44.99 ± 0.256 Test 39.14± 0.512 40.71 ± 0.213
-- ~---- -----
Sodium acetate _ Erythrocyte I • % Hemolysis at 0 min
membrane stability i • % Hemolysis at 30 min I
100 90 78.97 82.27
.!! 80 In n.74 >- 70 I '0 E 60 G) 50 ::I: ~ 40 42.93 0
30 20
Control Test Control Test Control Test
Gallus Oryctolagus Oreochromis
15

Cysteine
Species % of Hb released % of Hb released
from RBC at 0 minute from RBC at 30minutes
(Room Temperature) Gal/us
Control 78.97± 1.048 82.278 ± 0.534 Test 70.32± 1.955 72.897± 0.902
OryctoJagus
Control 69.7± 1.48 77.93± 2.97 Test 67.87± 2.523 72.65± 0.615
Oreochromis
Control 41.4± 0.546 43.316± 0.212 Test 38.19± 0.269 42.274± 0.392
Cysteine - Erythrocyte membrane stability • % Hemolysis at 0 min
• % Hemolysis at 30 min
100 78.97
80 In 72.897 'in ~ 60
69.7
0 E
43.316 42.274
Q) 40 ::I: 41.4
';ft. 20
0 Control Test Control Test Control Test
Gallus Oryctolagus Oreochromis -------------.------
16

Sodium Glyco Tauro Cholate
Species % of Hb released % of Hb released
from RBC at 0 minute from RBC at 30minutes
(Room Temperature) Gal/us
Control 18.17± 0.458 23.62 ± 0.279 Test 34.72± 0.375 39.46± 0.357
Oryctolagus
Control 87.41 ± 0.768 90.03± 0.431 Test 86.51 ± 0.963 88.93± 0.58
Oreochromis
Control 39.58± 0.658 40.88± 0.435 Test 42.53 ± 0.630 43.05± 0.630
Sodium Glyco Tauro Cholate
Erythrocyte membrane stability
• % Hermlysis at 0 rnin i
• % Hermlysis at 30 rnin :
120
.!! 100
~ 80 '0 E 60 23.62
:! 40
ffl. 20
o Control Test
Gall us
39.46
90.03 86.51
87.41 88.93 43.05
39.58
Control Test Control Test
Oryctolagus Oreochromis
17
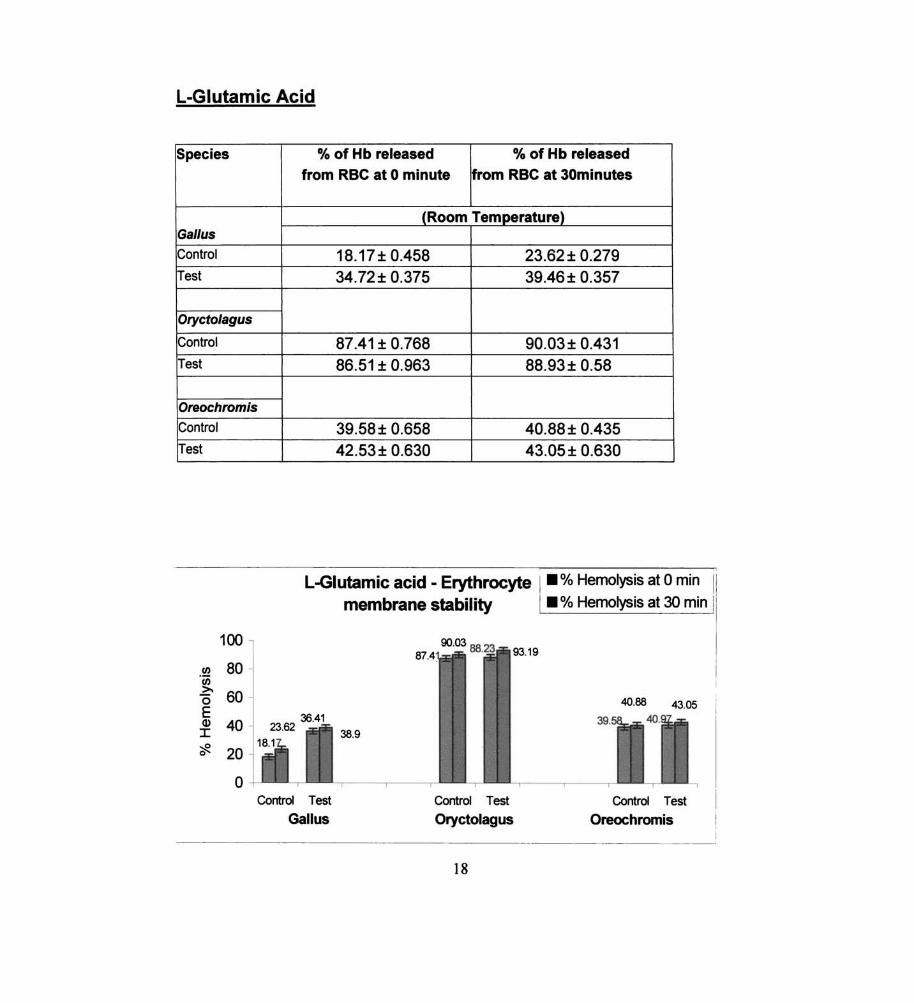
L-Glutamic Acid
Species % of Hb released % of Hb released from RBC at 0 minute from RBC at 30minutes
(Room Temperature) Gal/us
Control 18.17± 0.458 23.62 ± 0.279 Test 34.72± 0.375 39.46± 0.357
Oryctolagus
Control 87.41 ± 0.768 90.03± 0.431 Test 86.51 ± 0.963 88.93± 0.58
Oreochromis
Control 39.58± 0.658 40.88 ± 0.435 Test 42.53 ± 0.630 43.05± 0.630
L-Glutamic acid - Erythrocyte I • % Hemolysis at 0 min 11
Cl) ·w >. 0 E Q)
I ~ 0
100
80
60
40
20
0 Control Test
Gall us
membrane stability 1 • % Hemolysis at 30 min i i
87
38.9
93.19
Control Test
Oryctolagus
40.88 43.05
39.
Control Test
Oreochromis
I
--------
18
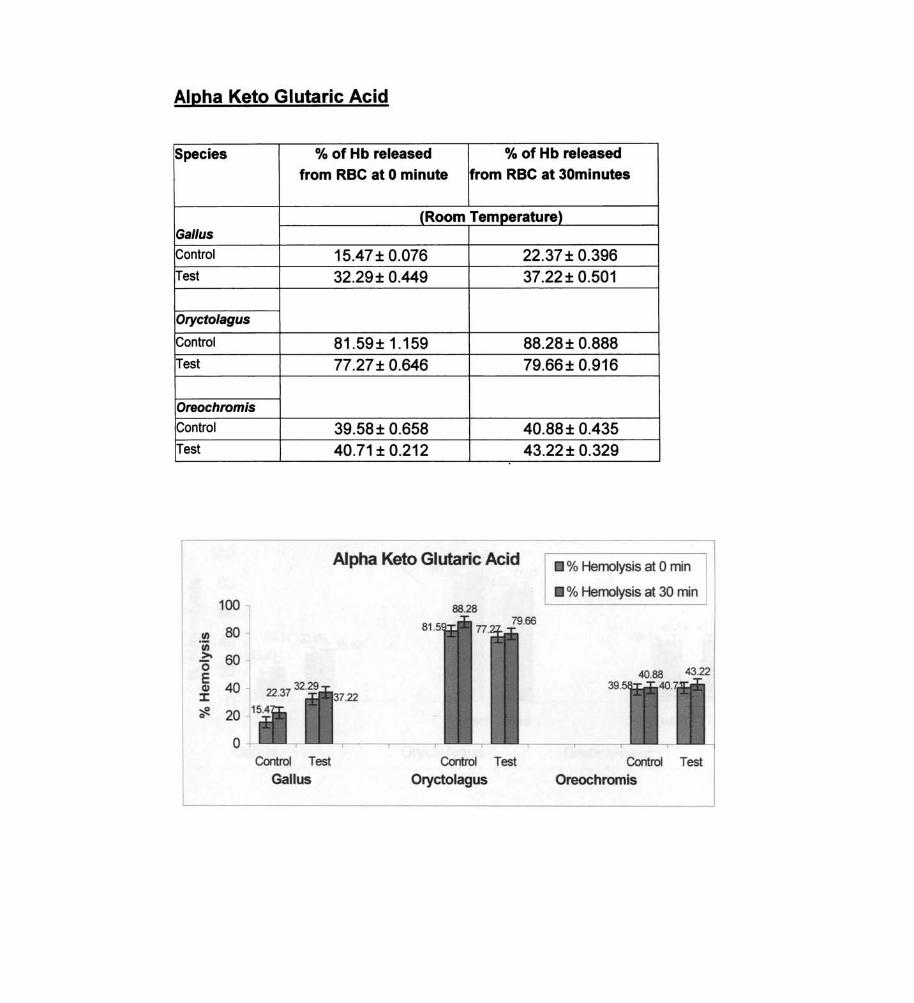
Alpha Keto Glutaric Acid
Species % of Hb released % of Hb released
from RBC at 0 minute from RBC at 30minutes
(Room Temperature) Gal/us
Control 15.47 ± 0.076 22.37 ± 0.396 Test 32.29± 0.449 37.22± 0.501
Oryctolagus
Control 81 .59 ± 1.159 88.28 ± 0.888 Test 77.27± 0.646 79.66± 0.916
Oreochromis
Control 39.58± 0.658 40.88± 0.435 Test 40.71 ± 0.212 43.22 ± 0.329
Alpha Keto Glutaric Acid % Hemolysis at 0 min
• % Hemolysis at 30 min 100 88.28
.!!! 80 81
III >. 60 "0 E
40 Cl)
J: .22 ~ 0 20
0 Control Test Control Test Control Test
Gallus Oryctolagus Oreochromis

Sodium Succinate
Species % of Hb released % of Hb released
from RBC at 0 minute from RBC at 30minutes
(Room Temperature) Gal/us
Control 15.47± 0.076 22.37 ± 0.369 Test 32.98± 0.062 35.42 ± 0.296
Oryctolagus
Control 81.59± 1.159 88.28 ± 0.888 Test 74.67± 0.388 77.27 ± 0.646
Oreochromis
Control 39.14± 0.212 41.14± 0.465 Test 41.58 ± 0.897 43.57± 0.784
Sodium succinate • % Hemolysis at 0 min
• % Hemolysis at 30 min
100 88.28
.~ 80 81
en ~ 60 43.57 0 E
40 39. Q) :r: ~ 0 20
0 Control Test Control Test Control Test
Gall us Oryctolagus Oreochromis

Sodium Pyruvate
Species % of Hb released % of Hb released
from RBC at 0 minute from RBC at 30minutes
(Room Temperature) Gal/us
Control 15.47 ± 0.076 22.37 ± 0.369 Test 29.14± 0.255 34.07± 0.124
Orycto/agus
Control 81.59± 1.159 88.28 ± 0.888 Test 73.26 ± 0.288 75.95 ± 0.579
Oreochromis
Control 39.14± 0.212 41.14± 0.465 Test 41.58± 0.897 43.57 ± 0.784
r~-~----
Sodium Pyruvate- Erythrocyte membrane stability • % Hemolysis at 0 min
100 .~ 80 , fI) ~
'0 60 E 40 G)
~ 20 ~ 0
0 Control
Gallus
Test Control Test
Oryctolagus
• % Hemolysis at 30 min 11
39.
43.57 41.1441.58
Control Test
Oreochromis

Ornithine
Species % of Hb released % of Hb released from RBC at 0 minute from RBC at 30minutes
(Room Temperature) Gal/us
Control 79.53 ± 1.300 87.9± 2.411 Test 57.1 ± 67.089 67.08± 1.666
Oryctolagus
Control 69.7± 1.479 56.41 ± 1.51 Test 77.93± 2.97 68.38 ± 3.395
Oreochromis
Control 41.4± 0.546 43.31 ± 0.212 Test 38.45± 0.608 39.84± 0.285
1
Ornithine - Erythrocyte membrane stability! .% Hemolysis at 0 M~i • % Hemolysis at 30 Min
100
90
1/1 80 .iij
70 >-"0
60 E 411 J: 50 :.l! 0 40
30
20 Control Test Control Test Control Test
Gallus Oryctolagus Oreochromis
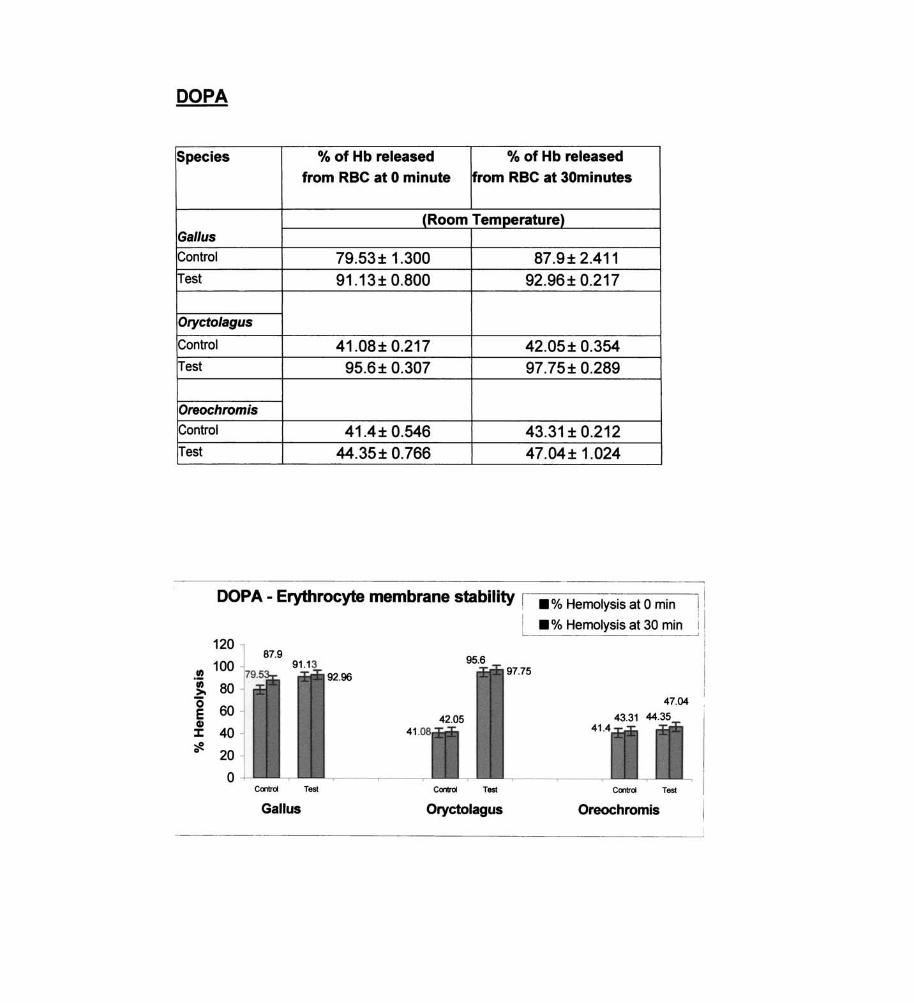
DOPA
Species % of Hb released % of Hb released
from RBC at 0 minute from RBC at 30minutes
(Room Temperature) Gal/us
Control 79.53 ± 1.300 87.9± 2.411 Test 91.13± 0.800 92.96± 0.217
Orycto/agus
Control 41.08± 0.217 42.05± 0.354 Test 95.6± 0.307 97.75± 0.289
Oreochromis
Control 41.4± 0.546 43.31 ± 0.212 Test 44.35± 0.766 47.04± 1.024
DOPA - Erythrocyte membrane stability I .% Hemolysis at 0 min
L • % Hemolysis at 30 min I
120 87.9
97.75 .! 100
92.96 (1) 80 >-"0 60 E
47.04
G)
J: 40 41 41
:::le 0 20
0 Control Test Control Test Control Test
Gallus Oryctolagus Oreochromis
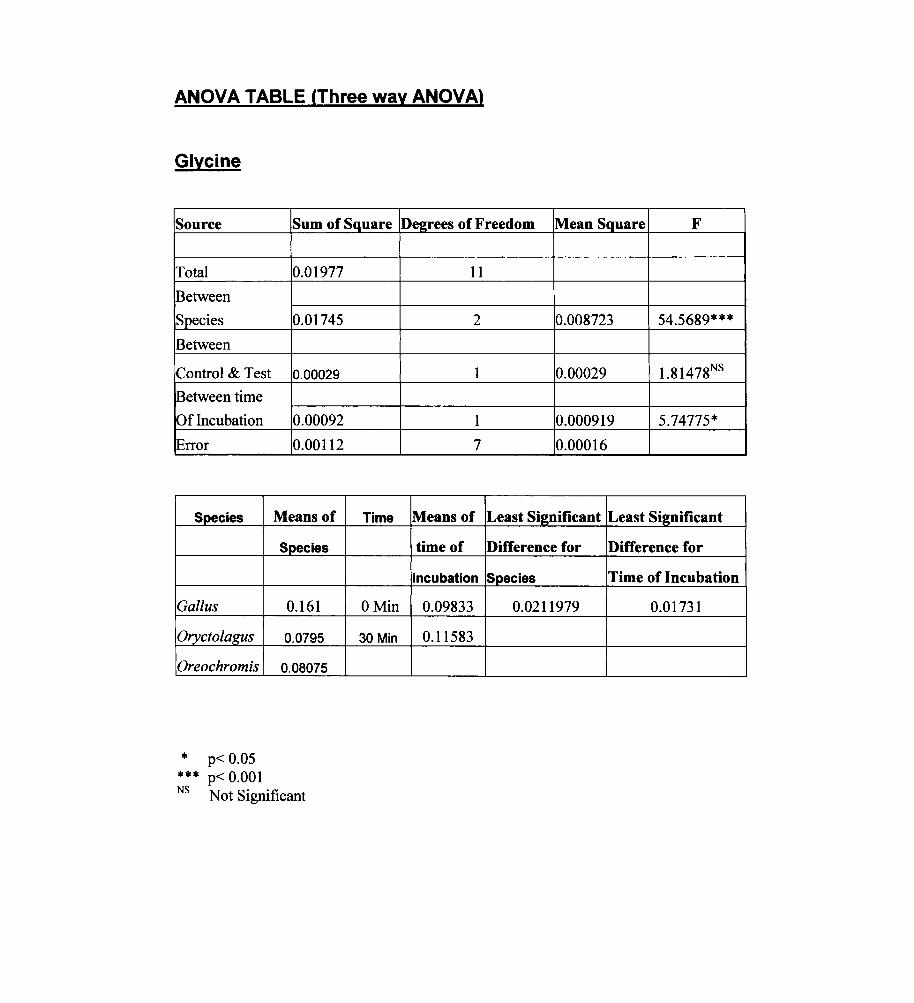
ANOVA TABLE (Three way ANOVA)
Glycine
Source
Total
Between
Species
Between
Control & Test
!Between time
Of Incubation
Error
Species
Gallus
Oryctolagus
Oreochromis
* p< 0.05 *** p< 0.001
Sum of Square
0.01977
0.01745
0.00029
0.00092
0.00112
Means of Time
Species
0.161 OMin
0.0795 30Min
0.08075
NS Not Significant
Degrees of Freedom Mean Square F
11
2 0.008723 54.5689***
1 0.00029 1.81478NS
1 0.000919 5.74775*
7 0.00016
Means of Least Si2llificant Least Significant
time of Difference for Difference for
incubation Species Time of Incubation
0.09833 0.0211979 0.01731
0.11583
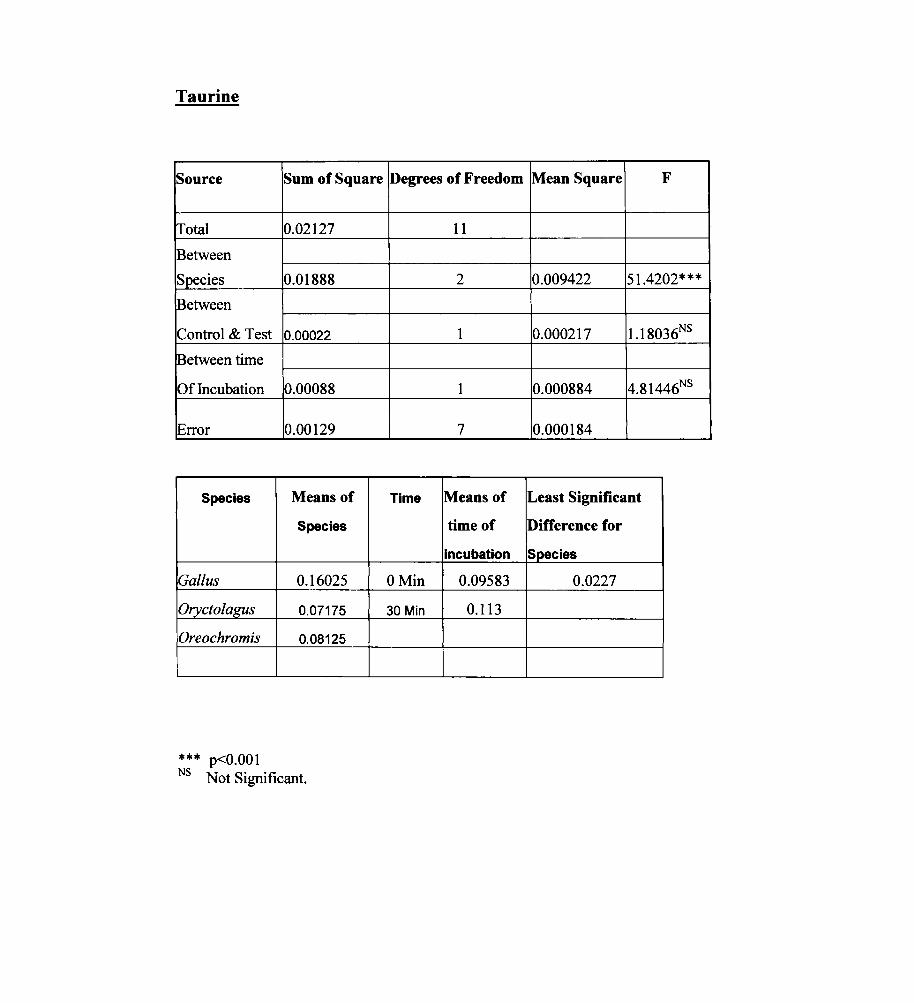
Taurine
Source Sum of Square Degrees of Freedom Mean Square F
lTotal 0.02127 11
Between
Species 0.01888 2 0.009422 51.4202***
Between
Control & Test 0.00022 1 0.000217 1.18036NS
Between time
Of Incubation 0.00088 1 0.000884 4.81446NS
Error 0.00129 7 0.000184
Species Means of Time Means of Least Significant
Species time of Difference for
incubation Species
Gal/us 0.16025 OMin 0.09583 0.0227
Oryctolagus 0.07175 30 Min 0.113
Oreochromis 0.08125
*** p<O.OOI NS Not Significant.
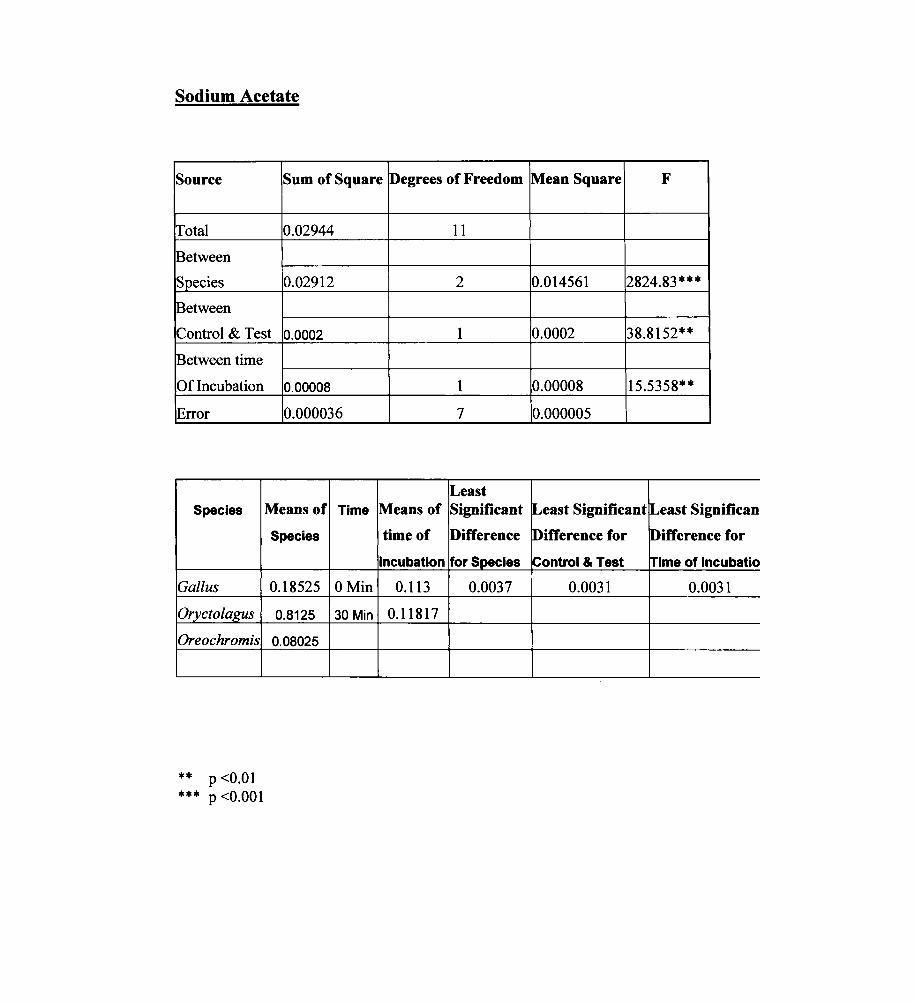
Sodium Acetate
Source Sum of Square Degrees of Freedom
Total 0.02944
Between
Species 0.02912
~etween
Control & Test 0.0002
~etween time
Of Incubation
Error
Species
Gal/us
Orycto/agus
Oreochromis
** P <0.01 P <0.001 ***
0.00008
0.000036
Means of Time
Species
0.18525 OMin
0.8125 30 Min
0.08025
11
2
1
1
7
Least Means of Significant
time of Difference
incubation for Species
0.113 0.0037
0.11817
Mean Square F
0.014561 2824.83***
0.0002 38.8152**
0.00008 15.5358**
0.000005
lLeast Significant lLeast Significan
lDifference for lDifference for
iControl & Test Irime of Incubatio
0.0031 0.0031

Cysteine
Source Sum of Square Degrees of Freedom Mean Square F
Total
Between
Species
Between
Control & Test
Between time
Of Incubation
Error
Species
Gal/us
O~ctola~s
Oreochromis
* p< 0.05 *** p< 0.001
0.03906
0.03849
0.00025
0.000096
0.00023
Means of
Species
0.1805
0.4773
0.0793
NS Not Significant
Control
Test
11
2 0.019245 598.366***
1 0.000248 7.69589*
1 0.000096 2.97759NS
7 0.000032
Means of Least Significant Least Significant
Control Difference for Difference for
and Test Species Control & Test
0.3677 0.00948 0.00774
0.3357

Sodium Glyco Tauro Cholate
Source Sum of Square Degrees of Freedom Mean Square F
Total 0.04662 11
Between
Species 0.03411 2 0.017056 14.9856**
Between
Control & Test 0.004707 1 0.00407 3.57611 NS
Between time
Of Incubation 0.00047 1 0.000469 0.41186NS
Error 0.00797 7 0.001138
Species Means of Least Significant
Species Difference for
Species
Gallus 0.19025 0.0565
Oryctolagus 0.0745
Oreochromis 0.08
** p< 0.01 NS Not Significant
28

L-Glutamic Acid
Source Sum of Square Degrees of Freedom Mean Square F
Total 0.04873 11
~etween
Species 0.03572 2 0.017859 14.7576**
~etween
Control & Test 0.00407 1 0.00407 3.36334NS
Between time
Of Incubation 0.00047 1 0.000469 0.38735NS
Error 0.00847 7 0.00121
Species Means of Least Significant
Species Difference for
Species
Gal/us 0.192 0.0582942
Oryctolagus 0.0735
Oreochromis 0.07925
** p< 0.01 NS Not Significant

Alpha Keto Glutaric Acid
Source Sum of Square Degrees of Freedom Mean Square F
Total 0.04025 11
Between
Species 0.02779 2 0.013894 11.7853**
Between
Control & Test 0.00347 1 0.003468 2.94159NS
Between time
Of Incubation 0.00074 1 0.000736 0.62457NS
Error 0.00825 7 0.00179
Species Means of Least Significant
Species Difference for
Species
Gal/us 0.176 0.575427
Oryctolagus 0.0695
Oreochromis 0.079
** p< 0.01 NS Not Significant
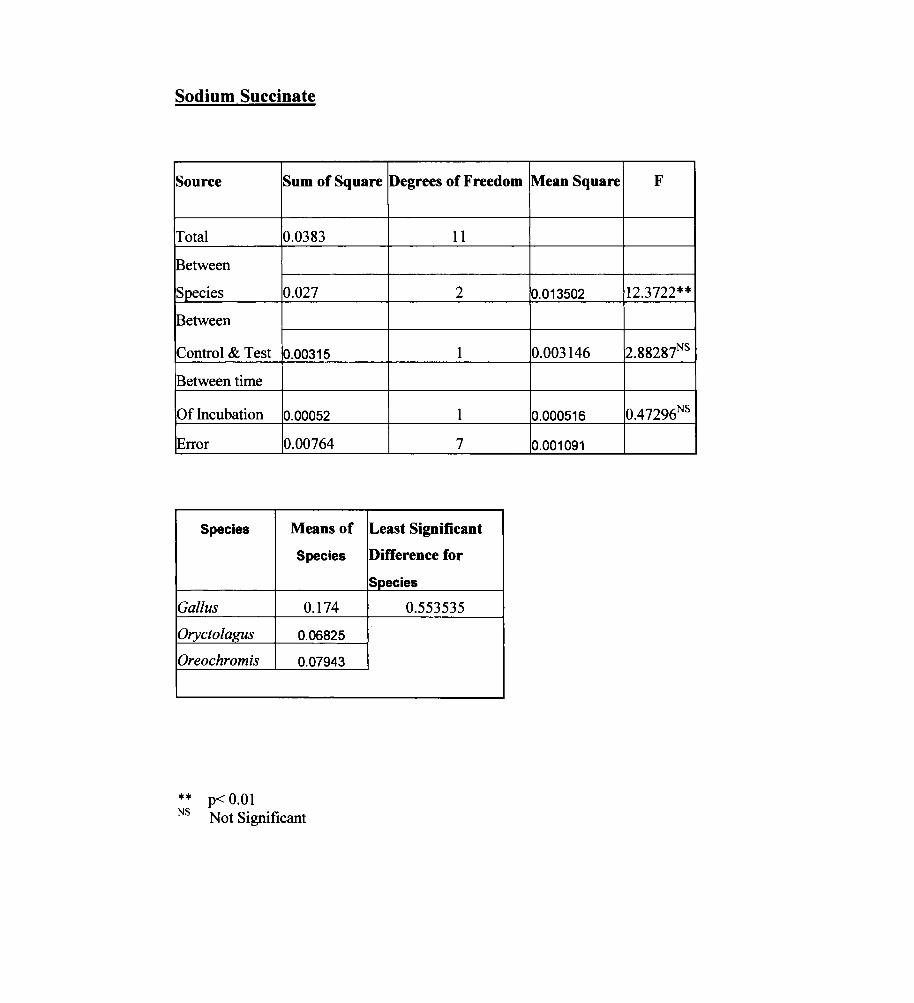
Sodium Succinate
Source Sum of Square Degrees of Freedom Mean Square F
Total 0.0383 11
Between
Species 0.027 2 0.013502 12.3722**
Between
Control & Test 0.00315 1 0.003146 2.88287NS
Between time
Of Incubation 0.00052 1 0.000516 0.47296NS
IError 0.00764 7 0.001091
Species Means of Least Significant
Species Difference for
Species
Gal/us 0.174 0.553535
Oryctoiagus 0.06825
Oreochromis 0.07943
** p< 0.01 NS Not Significant

Sodium Pyruvate
Source Sum of Square Degrees of Freedom Mean Square F
Total 0.03051 11
Between
Species 0.02189 2 0.010944 13.4043**
Between
Control & Test 0.00218 1 0.002182 2.67207NS
Between time
Of Incubation 0.00072 1 0.000724 0.88659NS
Error 0.00572 7 0.000816
Species Means of Least Significant
Species Difference for
Species
Gallus 0.1655 0.4787
Oryctolagus 0.0675
Oreochromis 0.0848
** p< 0.01 NS Not Significant

Ornithine
Source Sum of Square
Total 0.03828
Between
Species 0.03501
Between
Control & Test 0.0014
Between time
Of Incubation
iError
Species
Gallus
Oryctolagus
Oreochromis
* p< 0.05 *** p< 0.001
0.00033
0.00154
Means of
Species
0.17275
0.0453
0.07825
NS Not Significant
Control
Test
Degrees of Freedom Mean Square F
11
2 0.017506 79.4481 ***
1 0.001395 6.33251 *
1 0.000329 1.49151 NS
7 0.00022
Means of Least Significant Least Significant Control Difference for Difference for
and Test Species Control & Test
0.3719 0.0248567 0.0203
0.2931

DOPA
Source Sum of Square Degrees of Freedom Mean Square F
Total 0.04237 11
Between
Species 0.03203 2 0.016016 22.1262**
lBetween
Control & Test 0.00516 1 0.005158 7.12634*
Between time
Of Incubation 0.00011 1 0.000113 0.15591 NS
Error 0.00507 7 0.000724
Species Means of Means of Least Significant Least Significant
Species Control Difference for Difference for
And Test Species Control&Test Gal/us 0.20825 Control 0.4025 0.0450923 0.03682
Oryctolagus Oreochromis
* p< 0.05 ** p< 0.01
0.12325
0.08455
NS Not Significant
Test 0.1003

D.Results of screening of different concentrations of the erythrocyte membrane stabilizers observed in the three species above:-
IDifferent concentrations of membrane stabilizers and erythrocyte membrane stability in Oreochromis
All concentrations (lO-IM - lO-sM) of sodium acetate,
taurine and cysteine were observed to stabilize erythrocyte membrane in
Oreochromis.
The lower concentrations of ornithine and glycine were observed to
destabilize erythrocyte membrane in Oreochromis while higher concentrations
were found to be stabilizing.
The results of statistical analysis using three way ANOVA with
repeated number of observations were carried out on the raw data obtained
from experimental values.
Statistically significant results of effect on erythrocyte membrane
were obtained in the case of glycine and sodium acetate. The results in the
case of cysteine, ornithine and taurine were not statistically significant.

Sodium Acetate
Concentration of ~iochemical
Control (0 M) 0.00001 M
0.0001 M p.001 M
~.01 M
~.1 M
60
Cl! 55 .~ 50
~ 45 GI ~ 40 ~ 35
30
% of Hb released % of Hb released from RBC at 0 Min from RBC at 30 Min
(At Room Temperature)
44.309± 0.315 42.378± 0.51 42.276± 0.315 42.378± 0.51
42.5811± 0.713 41.159± 0.334
Different Cone. - Ornithine
50.203± 0.498 43.598 ± 0.334 42.886± 0.498
42.785± 0.249
42.988± 0.51 43.496 ± 0.629
I • % Hemolysis at 0 min 1I
l_~ % Hemolysis at 3~fT)in -----"I i I
Control (0 M) 0.00001 M 0.0001 M 0.001 M 0.01 M 0.1 M
Concentration

Ornithine
~oncentration of % of Hb released % of Hb released
~iochemical from RBC at 0 Min from RBC at 30 Min (At Room Temperature)
~ontrol (0 M) 47.22± 0.372 50.39 ± 0.668 ~.00001 M 50.28 ± 2.105 56.73± 1.117
~.0001 M 45.86 ± 0.372 45.98± 0.555
~.001 M 45.07 ± 0.555 52.77± 0.351
~.01 M 46.09± 0.277 47.22± 0.372
~ . 1 M 44.281± 2.832 46.54± 0.372
00
[lffetent Cone. - cmthine ~ • % t-erdysis et 0 rrin 11
• % t-erdysis et ~ rrin ~ 1__ _ _ _ _ _ I!
30 Cootro/ (0 M) 0.00001 M 0.0001 M 0.001 M 0.01 M 0.1 M
Cordilbation
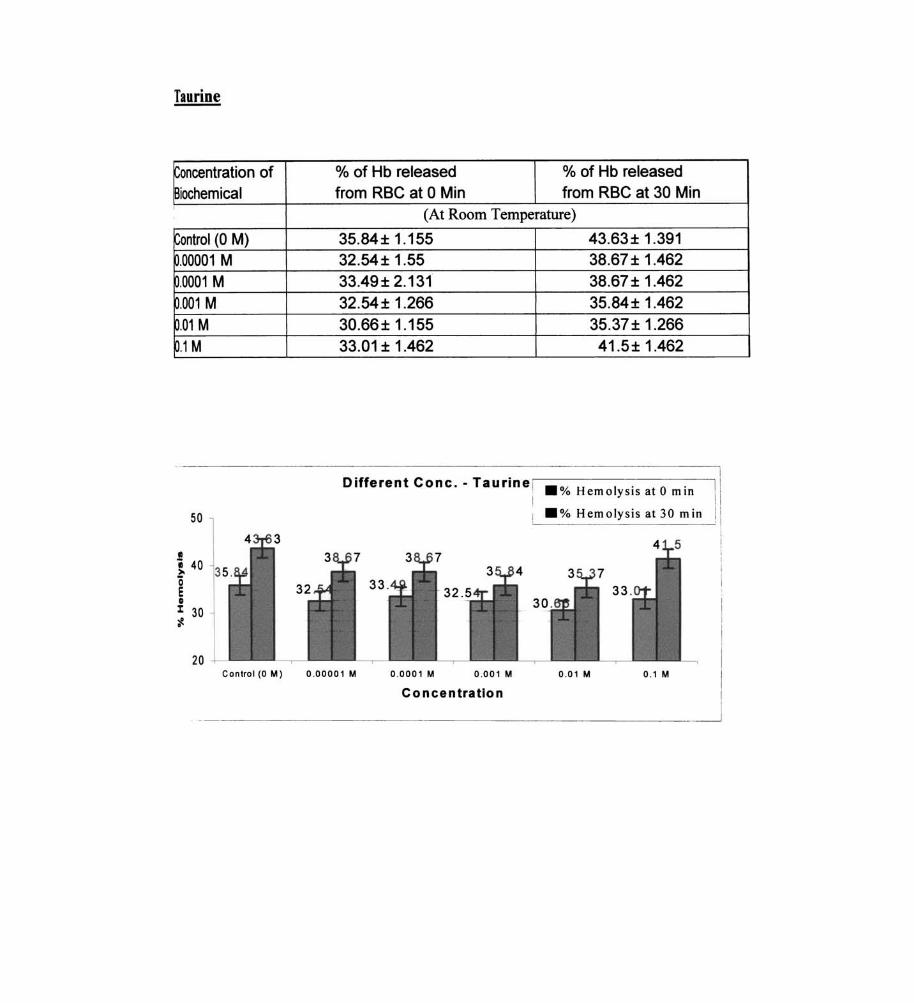
Taurine
~oncentration of ~iochemical I
~ontrol (0 M) ~.00001 M ~ .0001 M
~ .001 M
~.01 M
~. 1 M
50
ID
l 40 o E • I 30 ~ •
20
% of Hb released % of Hb released from RBC at 0 Min from RBC at 30 Min
(At Room Temperature)
35.84± 1.155 43.63± 1.391 32.54± 1.55 38.67 ± 1.462 33.49± 2.131 38.67 ± 1.462 32.54± 1.266 35.84 ± 1.462 30.66± 1.155 35.37 ± 1.266 33.01 ± 1.462 41 .5± 1.462
I Different Cone. - Taurine ,-------- ---------;l .% Hemolysis at 0 min .% Hemolysis at 30 min I
Control (0 M) 0.00001 M 0.0001 M 0.001 M 0.01 M 0 .1 M
Concentration

Glycine
~oncentration of % of Hb released % of Hb released
~iochemical from RBC at 0 Min from RBC at 30 Min (At Room Temperature)
Control (0 M) 30.74± 0.948 ~.00001 M 33.56 ± 0.866
~.0001 M 30.74± 1.161
~.001 M 25.08 ± 1.596
~.Q1 M 26.5± 0.948
~.1 M 22.79± 0.887
[llfaat ccn:.. -G}dne
Ca1rd (0 M 0WlJ1 M 0aD1 M 0001 M
36.04± 1.896 36.39± 0.866
33.21 ± 1.095
39.22± 2.844
33.92± 1.341
28.62± 1.161
II • % H:rrdysis et 0 rrin I
• % H:rrdysis et 3) rrin I1
1
001 M 01M

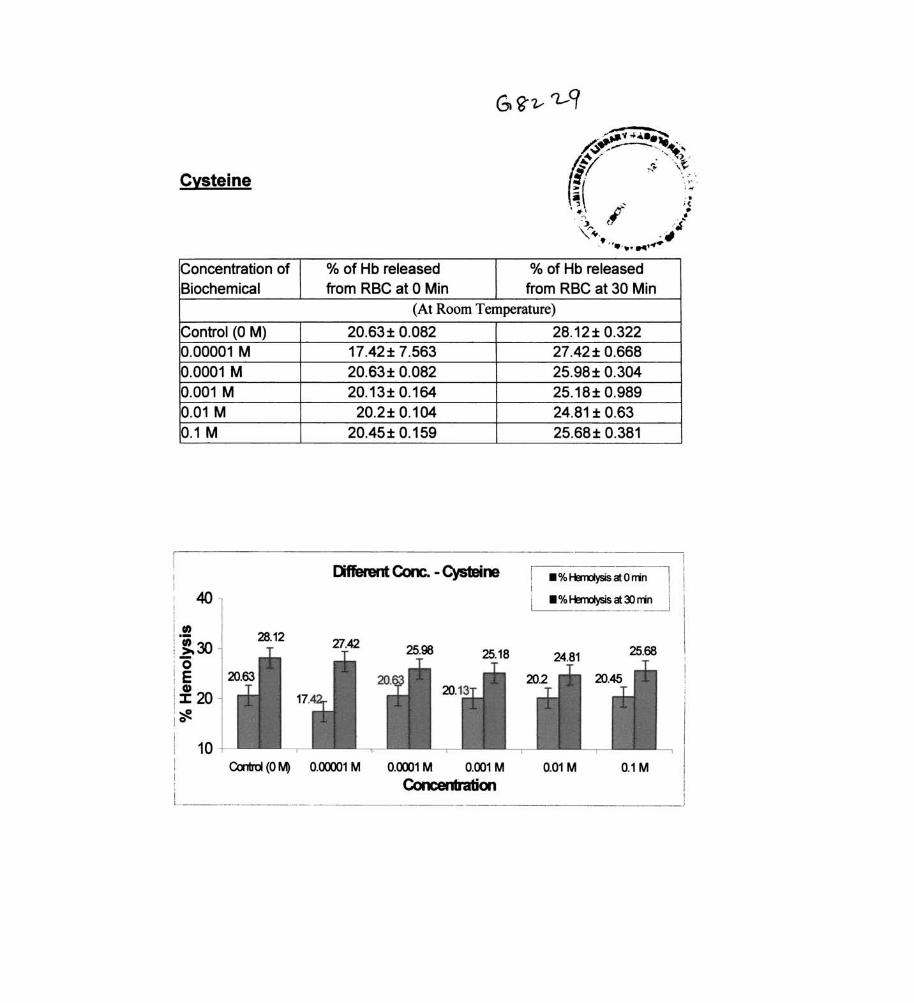
Cysteine
Concentration of Biochemical
~ontrol (0 M) p.00001 M u.0001 M 0.001 M 0.01 M 0.1 M
.! 70 • :>. o~ E , ID
10
% of Hb released % of Hb released from RBC at 0 Min from RBC at 30 Min
(At Room Temperature)
50.35± 0.42 71.94± 1.26 28.77± 0.42 35.97± 1.2 28.77 ± 1.672 35.97 ± 0.56 33.56± 0.65 43.16± 0.42 34.17± 1.012 36.03± 0.42 32.97± 0.84 57.55± 0.86
Different Cone. - Cysteine • % Herrdysis at 0 mn
• % Hermlysis at 30 mn
CootroI (0 M) 0.00001 M 0.0001 M 0.001 M 0.01 M 0.1 M
Concentration
40
I !
i i
I I
. I

t DIFFERENT CONCENTRATIONS OF MEMBRANE STABILIZERS AND ERYTHROCYTE MEMBRANE STABILITY IN GALL US
All concentrations of sodium acetate, taurine, glycine, cysteine and
ornithine were observed to have stabilizing effect on erythrocyte membrane in
Gallus. Statistical analysis using three way ANOV A with repeated number of
observations carried out using the raw data in the above case revealed that only
glycine and sodium acetate had significant effects on the erythrocyte
membrane. In the case of cysteine, ornithine and taurine, the results were not
statistically significant
Sodium Acetate
~ncentration of % of Hb released % of Hb released ~iochemical from RBC at 0 Min from RBC at 30 Min
(At Room Temperature)
~ontrol (0 M) 67.77± 0.592 p.0001 M 65.31 ± 0.105 0.001 M Control 0.01 M 0.1 M
80
! 60 ~
~ 40 • I o-t 20
o
65.11 ± 0.214 68.14± 0.072 54.27 ± 0.393 15.46± 0.276
Diff. Conc. - Sodium Acetate & Erythrocyte membrane stability in Gallus
Control (0 M) 0.00001 M 0.0001 M 0.001 M Control
Concentration
70.36± 0.257 67.95± 0.517 65.41±0.186 69.75± 0.38 56.84± 1.009 17.79± 0.46
.• % Hemolysis at 0 Min
• % Hemolysis at 30 min
0.01 M 0.1 M

Ornithine
Concentration of Biochemical
Control (0 M) 0.00001 M 0.0001 M 0.001 M 0.01 M 0.1 M
% of Hb released % of Hb released from RBC at 0 Min from RBC at 30 Min
(At Room Temperature)
20.09± 0.109 30.13± 0.195 20.19± 0.217 29.53± 0.745 20.26± 0.205 26.37 ± 0.523 20.06± 0.205 26.6± 0.647 20.39 ± 0.125 29.86± 0.149 19.83± 0.149 26.1 ± 0.766
Different Cone. _ Ornithine - % HemoIysis at 0 nin • % HemoIysis at 30
Control (0 ~ 0.00001 M 0.0001 M 0.001 M 0.01 M 0.1 M
Concentration
42
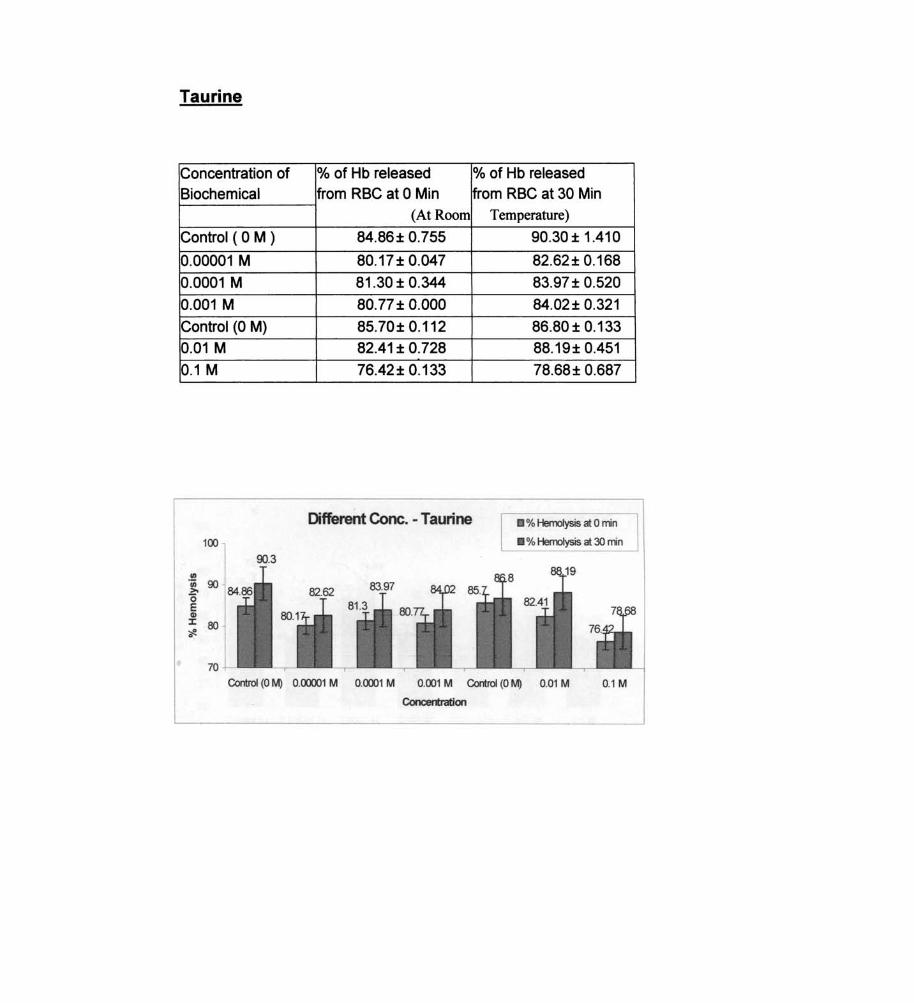
Taurine
Concentration of Biochemical
Control ( 0 M )
0.00001 M
0.0001 M
0.001 M
Control (0 M)
0.01 M
0.1 M
100
tn .(jj 90 >-"0 E Cl)
::t: 80
*" 70
% of Hb released % of Hb released from RBC at 0 Min from RBC at 30 Min
(At Room Temperature)
84.86± 0.755 90.30 ± 1.410
80.17 ± 0.047 82.62± 0.168
81.30 ± 0.344 83.97 ± 0.520
80.77± 0.000 84.02± 0.321
85.70± 0.112 86.80 ± 0.133
82.41 ± 0.728 88.19± 0.451
76.42 ± 0.133 78.68± 0.687
Different Cone. - Taurine • % HemoIysis at 0 min
• % Hemolysis at 30 min
Control (0 M) 0.00001 M 0.0001 M 0.001 M Control (0 M) 0.01 M 0.1 M
Concentration

Glycine
Concentration of % of Hb released % of Hb released Biochemical from RBC at 0 Min from RBC at 30 Min
(At Room Temperature)
Control (0 M) 70.38 ± 0.233 74.98± 1.062 0.00001 M 50.48± 0.233 56.62± 0.761 0.0001 M 68.59± 0.277 74.67± 0.301 0.001 M 52.63 ± 0.489 60.18± 0.301 Control (0 M) 41.39±0.1504 54.78± 1.269 0.01 M 54.35± 0.451 60.37 ± 1.000 0.1 M 51.31 ±1.162 54.22 ± 0.362
1
Diff. Concentrations - Glycine 1.-% HemolysisatO-Mini i
100 I. % Hemolysis at 30 I i
... ______ 1 I
90 I
74.98 80 74.67
, .!! 70 1/1 >-'0 60 E GI J: 50 ~ "
40
30
20 Control (0 0.00001 M 0.0001 M 0.001 M Control (0 0.01 M 0.1 M
M) M)
Concentration -------~ -._- . -------~-..
Cysteine
Concentration of Biochemical
Control (0 M) 0.00001 M 0.0001 M 0.001 M 0.01 M 0.1 M
40
.! ~30
·0 E ~20 ?fe.
10
% of Hb released % of Hb released from RBC at 0 Min from RBC at 30 Min
(At Room Temperature)
20.63± 0.082 28.12 ± 0.322 17.42± 7.563 27.42± 0.668 20.63± 0.082 25.98± 0.304 20.13± 0.164 25.18± 0.989
20.2± 0.104 24.81 ± 0.63 20.45± 0.159 25.68± 0.381
Different Cone. - Cysteine • % Herrdysis at 0 rrin
• % Herrdysis at lJ rrin
Control (0 M) 0.0Cl001 M 0.0001 M 0.001 M 0.01 M 0.1 M
Concet Ibation

iii) DIFFERENT CONCENTRATIONS OF MEMBRANE STABILISERS AND ERYTHROCYTE MEMBRANE STABILITY IN ORYCTOLAGUS
All different concentrations of sodium acetate, glycine and
cysteine were observed to stabilize erythrocyte membrane.
Taurine and ornithine were observed to be membrane
stabilizing only at certain concentrations. In the case of taurine, only
10-1 M solution was found to be stabilizing. The higher
concentrations of ornithine «(lO-IM - 10 -3M) solutions were found
to stabilize erythrocyte membrane but lower concentrations (l0-4M -
10 -5M) were found to labilize red blood cell membranes. Statistical
significance has been noted only in the case of glycine and sodium
acetate.
Sodium Acetate
Concentration of % of Hb released % of Hb released Biochemical from RBC at 0 Min from RBC at 30 Min
(At Room Temperature)
Control (0 M) 59.81 ± 1.146 65.86± 1.48 0.00001 M 59.81 ± 1.146 68.58± 1.782 0.0001 M 69.66± 0.9 72.50± 1.146 Control 74.32± 1.146 82.77± 1.48 0.001 M 53.95± 2.904 60.12± 0.74 0.01 M 51.05± 0.74 61.32± 0.74 0.1 M 38.06± 1.146 45.61 ± 2.409
[liferent Cone. - Sexill11 acetde .%~alOrrin
.%~aI:Drrin
110 fI2.77 en 00 '; >-
70 '0 E 50 Cl)
::I: 30 ~ 0
10 CortroI (0 ~ 0.CXlXl1 M 0.CXX>1 M CortroI 0.001 M 0.01 M 0.1 M
Qr.ca libation I
------------'

Ornithine
Concentration of % of Hb released % of Hb released Biochemical from RBC at 0 Min from RBC at 30 Min
(At Room Temperature)
Control (0 M) 71.57± 0.783 79.37 ± 1.074 0.00001 M 71.05± 0.849 79.20 ± 0.425 0.0001 M 68.97± 1.074 79.37 ± 0.849 0.001 M 68.80 ± 0.783 77.57± 0.509 0.01 M 68.97± 0.537 77.29± 1.566 0.1 M 57.19± 1.315 67.27 ± 1.017
Different Cone. - Ornithine ~
• % Hemolysis at 0 min ! I
1/1 'iii
90
80
~ 70 o E :£ 60 ::.e o 50
40
• % Hemolysis at 30 min i I
Control 0.00001 M 0.0001 M 0.001 M 0.01 M 0.1 M
Concentration
47

Taurine
Concentration of Biochemical
Control (0 M) 0.0001 M 0.001 M 0.01 M 0.1 M
90
·!!80
~70 i60 ~
~50
40
30
% of Hb released % of Hb released from RBC at 0 Min from RBC at 30 Min
(At Room Temperature)
66.37 ± 0.425 6B.97 ± 0.537 61.52± 0.425 6B.97 ± 0.537 73.31 ± 1.091 7B.6B± 0.537 73.13± 0.B49 BO.24± 0.425 70.01 ± 0.537 72.27 ± 0.569
Different Cone. - Taurine • % HerroIysis at 0 rrin
• % HerroIysis at 30 rrin
CootroI (0 M) 0.0001 M 0.001 M
ConceIlbation
0.01 M 0.1 M
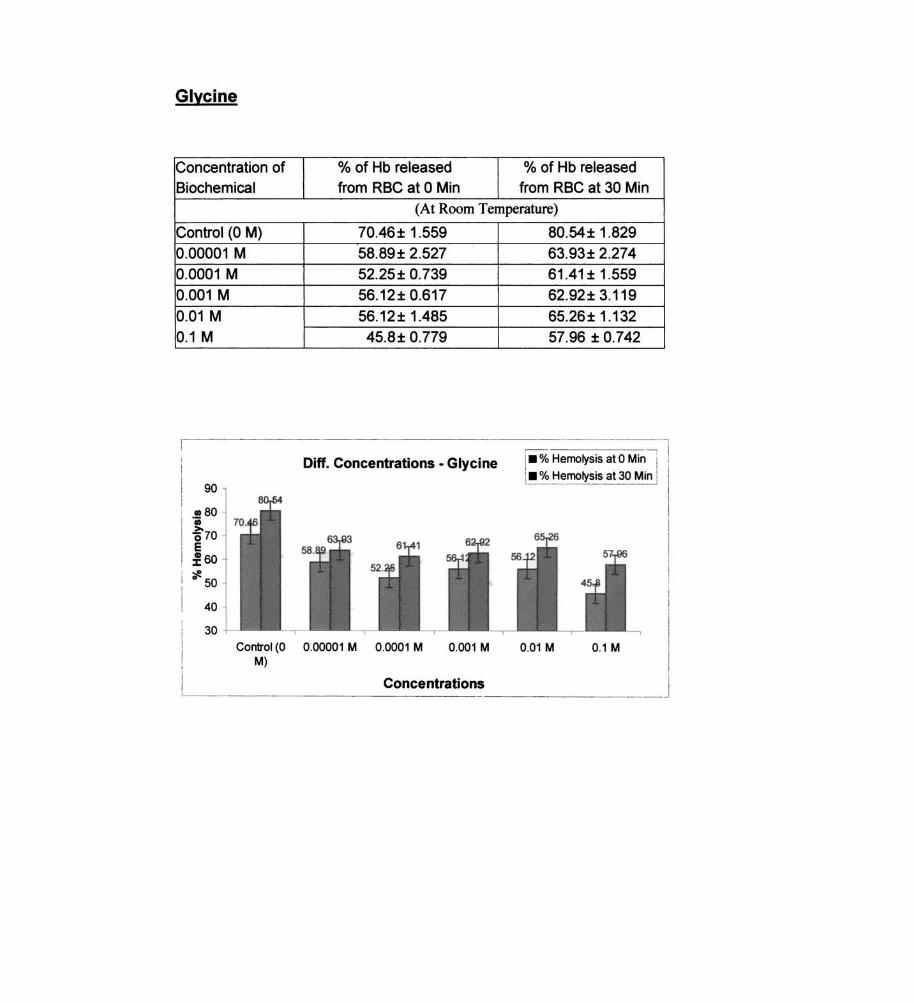
Glycine
Concentration of Biochemical
Control (0 M) 0.00001 M 0.0001 M 0.001 M 0.01 M 0.1 M
90
.80 .;
~70 E :! 60 ~
I 0 50
40
30
% of Hb released % of Hb released from RBC at 0 Min from RBC at 30 Min
(At Room Temperature)
70.46± 1.559 58.89± 2.527 52.25± 0.739 56.12± 0.617
56.12± 1.485 45.8± 0.779
Diff. Concentrations - Glycine
80.54± 1.829 63.93± 2.274 61.41±1.559 62.92± 3.119 65.26± 1.132 57.96 ± 0.742
I_ % Hemolysis at 0 Min I
: _ % Hemolysis at 30 Min I , ~
Control (0 0.00001 M 0.0001 M 0.001 M 0.01 M 0.1 M M)
Concentrations

Cysteine
Concentration of Biochemical
Control (0 M)
0.00001 M
0.0001 M 0.001 M 0.01 M 0.1 M
100
00
.~ ~
~ Cl)
% of Hb released % of Hb released from RBC at 0 Min from RBC at 30 Min
(At Room Temperature)
79.41 ± 0.42 81.81 ± 1.261
73.92±0.42 78.D4± 1.203
74.09± 1.722 78.73± 0.564
72.04± 0.651 75.3± 0.42
74.27± 1.012 80.44± 0.42 48.71 ± 0.84 51.97 ± 0.861
[Jffenri cone. -Cysteine I • % Hsrrdysis at 0 rrin i I • 0/o~"'" at:rJ rrin I I ...... '...,.,~ j
:%:20 ';fl.
CootroI (0 M) 0.00X>1 M 0.(xx)1 M 0.001 M 0.01 M 0.1 M
CorICeI Dation I
~---------------------------- -------------~
50

ANOVA TABLE (Three way Anova)
Sodium Acetate
Source Sum of Degrees of Mean F Square Freedom Square
Total 1.207 35 Between Species 1.002 2 0.5009 102.1*** Between Concentration 0.072 5 0.0145 2.9529* Between Time of Incubation 0.0004 1 0.0004 0.0875 NS
Error 0.132 27 0.0049
Means of Means of Least Least Significant Significant
Species Concentration Difference Difference of forS~cies Concentration
Gal/us 0.4024 Control 0.693 0.0586 0.0829 Oryctoiagus 0.0296 0.1 0.236 Oreochromis 0.0712 0.01 0.569
0.001 0.659 0.0001 0.663 0.00001 0.649
* p<O.05. *** p<O.OOl. NS Not Significant.
Cysteine
Source Sum of Degrees of Mean F Square Freedom Square
[rota I 0.03443 35 Between S~ecies 0.0154 2 0.0077 20.512*** Between Concentration 0.0042 5 0.0008 2.2165 NS
Between Time of Incubation 0.0047 1 0.0047 12.499* Error 0.0101 27 0.0049
51

Means of
Species
Gal/us 0.1151 Orycto/agus 0.0703 Oreochromis 0.1133
* p<O.05. *** p<O.OOl. NS Not Significant.
Ornithine
Source
!rota I Between Species Between Concentration Between Time of Incubation Error
Means of
Species
Gal/us Orycto/agus
Oreochromis
* * p<O.Ol. *** p<O.OOl.
0.1219 0.0694 0.0713
NS Not Significant.
Means of Least Least Significant Significant
Time of Incubation Difference Difference of ~or Species Time of Incubation
OMin 0.0882 0.0168 0.0137 30 Min 0.111
Sum of Degrees of Mean F Square Freedom Square 0.0275 35 0.0213 2 0.0107 102.31*** 0.0005 5 0.8724 0.0872 NS
0.0029 1 27.46 27.46** 0.0028 27 0.0001
Means of Least Least Significant Significant
Time of Incubation Difference Difference of Time of
for Species Incubation o Min 0.0786 0.0084 0.0069
30 Min 0.0964

Glycine
Source
1T0tal Between Species Between Concentration Between Time of Incubation Error
Means of
Species
Gal/us 0.1543 Orycto/agus 0.0404 Oreochromis 0.1479
* p<O.05. ** p<O.Ol.
p<O.OOl. ***
Taurine
Source
Total Between Species
Sum of Square 0.1111 0.0982 0.0040
0.0028 0.0061
Means of
Concentration
Control 0.453 0.1 0.329 0.01 0.367
0.001 0.371 0.0001 0.377 0.00001 0.414
Sum of Square 3.4570 3.4438
Between Concentration 0.0035 Between Time of Incubation 0.0016 Error 0.008035
Degrees of Mean F Freedom Square
35 2 0.0491 216.57-5 0.0008 3.5511*
1 0.0028 12.441** 27 0.0002
Means of Least Least Least Significant Significant !significant
time of Difference Difference of Difference ~or of Time of
Incubation species Concentration Incubation o Min 0.105 0.0119 0.0168 0.0097 30 Min 0.123
Degrees of Mean F Freedom Square
35 2 1.7219 5786.4*** 5 0.0007 2.3437 NS
1 0.0016 5.5142* 27 0.0003
53

Means of
Species
Gallus 0.7260 Orycto/agus 0.0685 Oreochromis 0.0713
* p<O.05. *** p<O.OOl. NS Not Significant.
Discussion
Means of Least Least Significant Significant
Time of Incubation Difference Difference of ~or Species rnme of Incubation
OMin 0.2818 0.0146 0.0119 30Min 0.2953
The mechanism of protective action of taurine on membrane stability is unclear. *23 A possible clue in respect of this mechanism is provided by a recent observation that an increase in the number of poly unsaturated fatty acids in the membrane of cultured human retinoblastoma cells increases affinity of taurine for its carrier transport. This effect is specific for taurine and indicates an important interaction of amino acid (taurine) with poly-unsaturated sites in the membrane. These interactions might be responsible for the stabilizing properties of taurine in membranes containing large number of polyunsaturated fatty acids.
Different resistance of Mammalian RBC to hemolysis by bile salts was studied by Salvioli et aI., *28 No correlation was detected between TDC50 and Phospholipid composition.
The lower concentrations of ornithine and glycine (10-5 M and 10-4
M) were found to de stabilize erythrocyte membrane in Oreochromis while higher concentrations were found to be stabilizing. The critical micellar concentration of these metabolites may be high.
Polyene antibiotics disrupt limiting membrane by interacting with lipids present in them. They preferentially react with sterol of model membranes rather than with phospholipids or other membrane constituents. This was supported by works of Demel et al,. *29 Filipin and Nystatin penetrated mono layers of cholesterol or ergosterol but failed to penetrate mono layers of natural or synthetic phospholipids.
54
In bilayer experiments carried out by Van Zutphen, Van Deenen and Kinsky, *30 Filipin did not show any interaction with black lipid films formed from lecithin but they were rendered unstable by filipin when bilayers were prepared from sterol and lecithin (1 : 1 ).
Studies reported by Demel et al,. *31 suggest that filipin can also interact with cetyl alchohol and oleic acid. Therefore, until sufficient studies are performed in model systems with these lipids it cannot be excluded that the disruption of erythrocytes or lysosomes, the membranes of which are rich in sphingomyelin results from the interaction of filipins with such receptors.
It is by no means certain that mammalian membranes are disrupted by the interaction of polyenes with cholesterol alone. Presently it is reasonable to suspect that polyenes do indeed owe their biological effects to a common but quantitatively different affinity for sterols.
Decreased lipid parameters observed in the study of action of penicillic acid on erythrocytes *13 indicate direct interaction of penicillic acid with erythrocytes leading to shedding of cholesterol and phospholipids from the membrane. *32 reported that leakage of hemoglobin, cholesterol and phospholipids from erythrocytes was due to membrane damage done by methyl salicylate.
Selected clinically important non-steroidal anti-inflammatory drugs react with erythrocyte membrane causing membrane stabilization while at higher concentrations resulted in erythrocyte lysis. The biphasic behaviour of drugs is due to their potentiality to form micellar aggregates at higher concentrations (called the critical micellar concentrations). So, when drugs are present as micelles above the critical micellar concentration the interaction with erythrocyte membrane results in hemolysis.
Since, erythrocytes are free from intracellular membranes and organelles any effect of a drug on osmotic hemolysis can be interpreted as an effect on the plasma membrane. The stabilizing effect of non-steroidal anti-inflammatory drugs on erythrocytes may be due to a stabilizing effect of the drugs on certain proteins in the cell membranes. Erythrocyte membrane stabilization study is simple, rapid, though non-specific and is useful as a preliminary screening test for the potential anti- inflammatory compounds. *10 Oxidative stress induces numerous types of alterations in membrane. *33 The structural role of Vitamin E in preventing hemolysis *34 and protecting the red cell membrane lipid -protein complexes against oxidative damage *35 has been well established. *36 Multivalent cations (e.g., calcium) not only enhances the stability of red cell membranes but also stabilize cell membranes against inverted structures.


![ERYTHROCYTES [RBCs]](https://img.pdfslide.us/doc/110x75/568130b1550346895d96c651/erythrocytes-rbcs-5687466751123.jpg)


![ERYTHROCYTES [RBCs]](https://img.pdfslide.us/doc/110x75/56813dc0550346895da78963/erythrocytes-rbcs-56ea22b2e2743.jpg)