Embed Size (px)
Citation preview
Biochemical and physiological responses of two grapevinerootstock genotypes to drought and salt treatments
F. MEGGIO1, B. PRINSI2, A.S. NEGRI2, G. SIMONE DI LORENZO2, G. LUCCHINI2, A. PITACCO1,O. FAILLA2, A. SCIENZA2, M. COCUCCI2 and L. ESPEN2
1 Dipartimento di Agronomia Animali Alimenti Risorse Naturali e Ambiente (DAFNAE), Università degli Studi di Padova,Viale dell’Università, 16-35020 Legnaro (Padova), Italy
2 Dipartimento di Scienze Agrarie e Ambientali – Produzione, Territorio, Agroenergia (DISAA), Università degli Studi diMilano, Via Celoria, 2-20133 Milano, Italy
Corresponding author: Dr Luca Espen, email [email protected]
AbstractBackground and Aims: In the light of possible climate change, a crucial aspect for future Mediterranean Europeviticulture is the selection of new rootstocks exhibiting adaptability to drought and salt stress. In this context andconsidering recent literature, it is fundamental to increase our knowledge of the biochemical and physiological eventsthat characterise stress responses in grapevine roots. In this study, leaf and root responses induced by water stress(WS) and sodium chloride (NaCl) exposure in a new selected genotype, named M4 (Vitis vinifera × V. berlandieri) ×V. berlandieri cv. Resseguier n. 1), were compared with those of the commercial rootstock 101.14.Methods and Results: The effect of progressive WS and NaCl exposure was studied under controlled environ-mental conditions on ungrafted plants grown in pots. Shoot growth, plant water status and leaf photosyntheticparameters were measured. The concentration of sugars, amino acids and total proteins, as well as the concentra-tion of the more abundant ions, was determined in both leaf and root organs. The M4 genotype showed greatercapacity to maintain photosynthetic activity, to accumulate osmotic compounds as well as to counteract Na and Claccumulation.Conclusion: The M4 genotype exhibited a greater capacity to tolerate both WS and exposure to an increasingconcentration of Na and Cl, maintaining photosynthetic activity also under severe stress conditions. The root systemappeared to play a central role in sustaining biochemical and physiological responses experienced under theseadverse conditions.Significance of the Study: This study showed that the tolerance to abiotic stress conditions, such as WS and NaClexposure, depends on root integrity/functionality, confirming that these aspects must be considered in furtherselection programs.
Keywords: drought, grapevine rootstock, NaCl stress, osmotic adjustment, photosynthesis
IntroductionThe selection of new grapevine genotypes, especially in view ofclimate change events occurring in recent years, is a crucialfactor for the development of sustainable agricultural models(moderate irrigation, fertilisation and recovery of marginal soils)and for ensuring optimal maturation profiles of grapes. As aresult, recurrent drought spells and the increase in salt concen-tration in soils represent the most common environmentalfactors that will have a strong negative impact on Mediterra-nean viticulture (Jones et al. 2005, Cramer 2010, Schultz andStoll 2010).
Although grapevines are relatively tolerant to water deficit,severe drought can affect crop quality and yield (Cramer 2010,Flexas et al. 2010). Stomatal closure is among the earliestresponses to water deficit adopted by plants to reduce evapo-rative water loss and maintain a safe water balance (Chaves1991, Chaves et al. 2010). In this context, an important aspectto be considered is the role of roots in sensing water availabil-ity in the soil, as well as the chemical and/or hydraulic root-to-shoot signalling under drought (Christmann et al. 2007,
Schachtman and Goodger 2008, Lovisolo et al. 2010). As thestress becomes severe, net CO2 assimilation (An) and othermetabolic processes operating in the mesophyll are inhibited,and water use efficiency thus declines (Chaves et al. 2010).Under these conditions, an increased photorespiration hasalso been observed to reduce the risks brought about by anincrease in reactive oxygen species (Medrano et al. 2002,Pinheiro and Chaves 2011). A typical response of plant tissuesallowing adjustment of osmotic potential under these stressconditions is the accumulation of organic solutes and ions(Schultz and Matthews 1988, Patakas et al. 2002, Cramer et al.2007). Moreover, a central role of aquaporins in maintainingan adequate cellular water balance is now emerging (Tyermanet al. 2009, Vandeleur et al. 2009, Lovisolo et al. 2010).Nevertheless, it is important to emphasise that the decrease ofstomatal conductance (gs), as well as the molecular and physi-ological responses described as activated in grapevines underwater deficiency, also depend on both the growth conditionsand the specific genotypic characteristics (Chaves et al. 2010,Lovisolo et al. 2010, Tomás et al. 2012).
Meggio et al. Response of two genotypes to drought and salinity 1
doi: 10.1111/ajgw.12071© 2014 Australian Society of Viticulture and Oenology Inc.
Grapevines are classified as having medium salt tolerance(Tattersall et al. 2007). Considering that under high salt expo-sure a decrease in water availability also occurs, severalresponses to salt are similar to those observed under waterdeficit (i.e. osmotic stress), while others are salt-specific (i.e.ionic stress) (Tattersall et al. 2007, Munns and Tester 2008,Chaves et al. 2009). According to this view, the method bywhich NaCl is added during experiments is a crucial aspect thatmust be considered, causing ‘salt shock’ or ‘salt acclimation’. Inthe first instance, the osmotic effect represents the main driver(Shavrukov 2013). Many studies emphasise that plant salt tol-erance appears mainly related to the capacity to minimise NaClinflux, as well as to the maintenance of a lower concentration ofNaCl in the cytoplasm (Zhu 2002, Munns and Tester 2008).Thus, a better elucidation of the mechanisms involved in theroot Na uptake represents a central point to understand salttolerance (Zhang et al. 2010). Moreover, the emerging literaturesuggests the role of sodium homeostasis in the regulatorynetwork implicated in salt stress responses, such as root systemdevelopment (Hongtao et al. 2013).
Under salt exposure, in order to balance the osmotic pres-sure of the ions in the vacuole, an accumulation of compatiblesolutes in the cytoplasm and in other organelles has beenobserved (Hasegawa et al. 2000, Munns and Tester 2008). Inthis context, but also to counteract Na toxic effects, an increaseof K concentration was also suggested, even though a strongrelationship between leaf K and salt tolerance has not yet beendescribed (Munns and Tester 2008). Another important aspect isthat the concentration of Na and Cl attained in leaf cells appearsto be linked with specific genetic characteristics, suggesting thatthe two ions could impose differing degrees of toxicity (Munnsand Tester 2008).
In cultivated grapevines, commonly derived from the unionof a rootstock with a scion, both genotypes influence the finalphenotype and its physiological performance (Cortell et al.2008, Kodur et al. 2010, Cookson et al. 2012, Gambetta et al.2012).
Considering that the rootstocks used in Europe exhibit arelatively narrow genetic background, because their phenotypicselection was essentially based on only a few traits (rootingability, phylloxera resistance and scion-induced vigour), thediscovery of new genotypes better able to cope with unfavour-able environmental conditions is a key asset for future viticul-ture in this region (Chaves et al. 2007, Schultz and Stoll 2010).As previously pointed out, the achievement of this goal shouldalso be a good strategy to prevent negative effects on scionbehaviour, which remains the major determinant of grape fea-tures and quality (Vivier and Pretorius 2002, Marguerit et al.2012). Nevertheless, it has to be considered that rootstockbehaviour could be influenced by scion genotypes, and thiscould happen under both favourable and unfavourable envi-ronmental conditions (Swanepoel and Southey 1989, Zhanget al. 2002, Tandonnet et al. 2010).
Novel candidate genotypes to be used as a rootstock wereestablished from 1985 by the DiSAA research group operating atMilan University. In a preliminary screening, one of these,named M4 [(V. vinifera × V. berlandieri) × V. berlandieri cv.Resseguier n. 1], was selected for its relatively high tolerance towater deficiency and salt exposure. The aim of the present studywas to assess biochemical and physiological responses of thisgenotype under these stress conditions. The performance of M4was compared against the 101.14 commercial rootstock. Thestudy, which was carried out under semi-controlled environ-mental conditions on ungrafted plants grown in pots, wasfocused on both leaf and root organs. Specifically, several
biometrical, plant water status and leaf gas exchange parameterswere measured, such as internode elongation, leaf area expan-sion, leaf water potential (Ψleaf), osmolality, net CO2 assimilation(An) and gs. Moreover, the concentration of total sugars, aminoacids and total proteins, as well as that of the more abundantions, K, Ca and Mg, was determined. Finally, to investigate thepossible role of K in response to NaCl exposure, the tracerrubidium (Rb) was used to study K accumulation in the shoot.Taken together, the results showed a significant differenceamong the two genotypes in response to water and salt stresses,as well as highlighting that the greater tolerance of M4 to theseunfavourable growth conditions involves adaptive responsesoccurring in the root.
Materials and methods
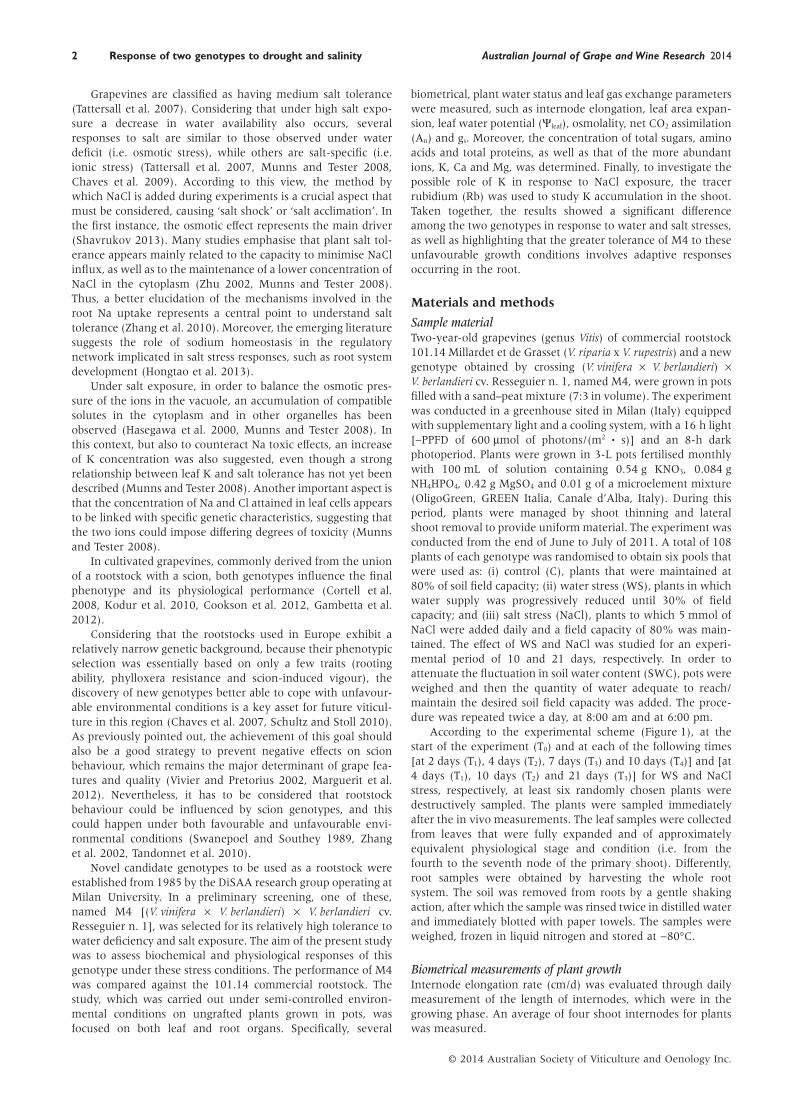
Sample materialTwo-year-old grapevines (genus Vitis) of commercial rootstock101.14 Millardet et de Grasset (V. riparia x V. rupestris) and a newgenotype obtained by crossing (V. vinifera × V. berlandieri) ×V. berlandieri cv. Resseguier n. 1, named M4, were grown in potsfilled with a sand–peat mixture (7:3 in volume). The experimentwas conducted in a greenhouse sited in Milan (Italy) equippedwith supplementary light and a cooling system, with a 16 h light[∼PPFD of 600 μmol of photons/(m2 • s)] and an 8-h darkphotoperiod. Plants were grown in 3-L pots fertilised monthlywith 100 mL of solution containing 0.54 g KNO3, 0.084 gNH4HPO4, 0.42 g MgSO4 and 0.01 g of a microelement mixture(OligoGreen, GREEN Italia, Canale d’Alba, Italy). During thisperiod, plants were managed by shoot thinning and lateralshoot removal to provide uniform material. The experiment wasconducted from the end of June to July of 2011. A total of 108plants of each genotype was randomised to obtain six pools thatwere used as: (i) control (C), plants that were maintained at80% of soil field capacity; (ii) water stress (WS), plants in whichwater supply was progressively reduced until 30% of fieldcapacity; and (iii) salt stress (NaCl), plants to which 5 mmol ofNaCl were added daily and a field capacity of 80% was main-tained. The effect of WS and NaCl was studied for an experi-mental period of 10 and 21 days, respectively. In order toattenuate the fluctuation in soil water content (SWC), pots wereweighed and then the quantity of water adequate to reach/maintain the desired soil field capacity was added. The proce-dure was repeated twice a day, at 8:00 am and at 6:00 pm.
According to the experimental scheme (Figure 1), at thestart of the experiment (T0) and at each of the following times[at 2 days (T1), 4 days (T2), 7 days (T3) and 10 days (T4)] and [at4 days (T1), 10 days (T2) and 21 days (T3)] for WS and NaClstress, respectively, at least six randomly chosen plants weredestructively sampled. The plants were sampled immediatelyafter the in vivo measurements. The leaf samples were collectedfrom leaves that were fully expanded and of approximatelyequivalent physiological stage and condition (i.e. from thefourth to the seventh node of the primary shoot). Differently,root samples were obtained by harvesting the whole rootsystem. The soil was removed from roots by a gentle shakingaction, after which the sample was rinsed twice in distilled waterand immediately blotted with paper towels. The samples wereweighed, frozen in liquid nitrogen and stored at −80°C.
Biometrical measurements of plant growthInternode elongation rate (cm/d) was evaluated through dailymeasurement of the length of internodes, which were in thegrowing phase. An average of four shoot internodes for plantswas measured.
2 Response of two genotypes to drought and salinity Australian Journal of Grape and Wine Research 2014
© 2014 Australian Society of Viticulture and Oenology Inc.
Leaf expansion rate was determined by daily measurementof both leaf length (L) and maximum leaf width (W) to deter-mine leaf area (LA). The leaf L was measured from the tip of theleaf to the base. The leaf W was measured from end to endbetween the widest lobes of the lamina perpendicular to thelongitudinal axis of the leaf. After physiological measurements,for each plant sample, all leaves were removed and the specificarea determined using image analysis software (ImageJ 1.44p,US National Institutes of Health, Bethesda, MD, USA, publicdomain software: http://rsbweb.nih.gov/ij/). Image analysisenabled the development of a relationship to estimate LAthrough L × W. The dependent variable (LA) was regressed withthe product L × W. Linear regression methods were used todevelop the models. The values of the linear regression coeffi-cients (b) and constants (a) were 2.515, 0.762 and 1.959, 0.781for M4 and 101.14, respectively, with a coefficient of determi-nation (R2) of 0.97 for both genotypes. Leaf expansion rate wasevaluated using at least six leaves for plants.
Leaf physiological measurementsSingle-leaf gas exchange measurements were performed with aLI-6400 portable photosynthesis system (Li-Cor Inc. Lincoln,NE, USA). Measurements were made on two fully expandedleaves per plant comprising at least six to eight leaves per treat-ment at regular times during the experimental period, between11:00 am and 2:00 pm solar time. The leaves were analysedwith the circular 2 cm2 leaf cuvette equipped with theLI-6400-40 fluorometer (Li-Cor Inc.) as the light source. Theleaves were subjected to a 10-min acclimation at a constant
saturating photosynthetic photon flux density (PPFD) of600 μmol of photons/(m2 • s), a CO2 concentration of 380 μmol/mol, and relative humidity between 60 and 70%, allowing∼1.5 kPa of vapour pressure deficit (VPD) inside the chamber.Block temperature was maintained at 25°C, allowing leaftemperature to range between 26 and 31°C. The parametersused were net CO2 assimilation rate [An, μmol CO2/(m2 • s)] andstomatal conductance [gs, mmol H2O/(m2 • s)]
Leaf water potential and tissue osmolalityLeaf water potential (Ψleaf, MPa) was measured in leaves usinga Scholander-type pressure chamber (model PMS-1000, PMSInstruments, Corvallis, OR, USA). Measurements were per-formed on the same fully expanded leaves immediately aftergas exchange measurements. Two leaves per plant wereselected. Each leaf was excised from the shoot with a scalpelblade and then placed into the pressure chamber with thepetiole protruding from the chamber lid. The chamber waspressurised using an air pressure tank, and Ψleaf was recorded assoon as the xylem sap was observed emerging from the cut endof the petiole.
Leaf and root tissue osmolality (mOsm) was measuredby a semi-micro osmometer (model K-7400, Knauer GmbH,Berlin, Germany) on the extracts obtained by homogenising thefrozen samples with five volumes of distilled water and centri-fuging at 14 000 g for 20 min. Solute potential (Ψs) was deducedfrom osmolality using the van’t Hoff equation.
Amino acids, total sugars and total proteinsAmino acids and total sugars were extracted by homogenisingfrozen tissues in four volumes of ice-cold 0.5 M perchloric acid(PCA). The homogenate was centrifuged for 10 min at 13 000 gat 4°C, and the resulting pellet was washed with the samevolume of PCA and then centrifuged again under the sameconditions. Potassium hydroxide was added to the collectedsupernatant (up to pH 7.6) to remove excess PCA.
Total amino acids were measured by the ninhydrin method(Moore and Stein 1954). Total soluble sugars were determinedby the same method of boiling an aliquot of the PCA extract for1 h before neutralisation. Sugar concentration was then meas-ured according to the colorimetric method of Nelson (1944).Total proteins were extracted as previously described byMartínez-Garcia and co-workers (Martínez-Garcia et al. 1999)by homogenising the samples, previously powdered in liquidnitrogen, in four volumes of a 125 mmol pH 8.8 Tris-HCl buffercontaining 1% (w/v) sodium dodecyl sulfate, 10% (w/v) gly-cerol and 50 mmol Na2S2O5. The homogenate was centrifuged at13 000 g for 20 min to obtain a clarified supernatant. Theprotein content was measured by using the 2-D Quant Kit (GEHealthcare Europe GmbH, Freiburg, Germany).
Ion concentrationSamples of approximately 0.5 g of dried tissue were digested bya microwave digestor system (Anton Paar Multiwave 3000,Anton Paar, Graz, Austria) in Teflon tubes filled with 9.5 mL of65% HNO3 and 0.5 mL of H2O2 by applying a two-step powerramp (step 1: at 500 W for 10 min, maintained for 5 min; andstep 2: at 1200 W for 10 min, maintained for 15 min). After20 min of cooling time, the mineralised samples were trans-ferred to polypropylene test tubes. Samples were then diluted1:40 with Milli-Q water (EMD Millipore Corporation, Billerica,MA, USA), and the concentration of ions was measured with aVarian 820 ICP-MS (Varian, Inc., Palo Alto, CA, USA). A 2 mg/Laliquot of an internal standard solution (45Sc, 89Y, 159Tb) was
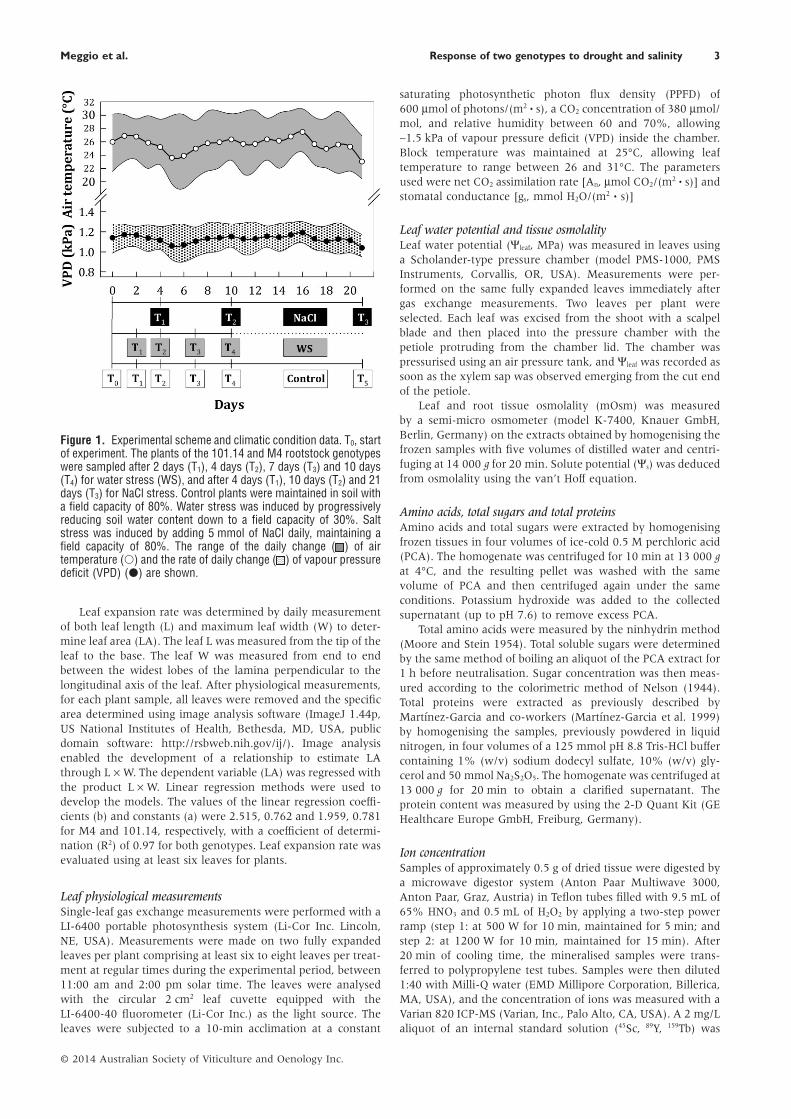
Figure 1. Experimental scheme and climatic condition data. T0, startof experiment. The plants of the 101.14 and M4 rootstock genotypeswere sampled after 2 days (T1), 4 days (T2), 7 days (T3) and 10 days(T4) for water stress (WS), and after 4 days (T1), 10 days (T2) and 21days (T3) for NaCl stress. Control plants were maintained in soil witha field capacity of 80%. Water stress was induced by progressivelyreducing soil water content down to a field capacity of 30%. Saltstress was induced by adding 5 mmol of NaCl daily, maintaining afield capacity of 80%. The range of the daily change ( ) of airtemperature (○) and the rate of daily change ( ) of vapour pressuredeficit (VPD) (●) are shown.
Meggio et al. Response of two genotypes to drought and salinity 3
© 2014 Australian Society of Viticulture and Oenology Inc.
added both to samples and the calibration curve to give a finalconcentration of 20 μg/L. Typical analysis interferences wereremoved by using the collision–reaction interface of the ICP-MSwith an H2 flow of 40 mL/min.
In the pool of plants exposed to NaCl treatment, Rb wasused as a tracer for K (Kochian et al. 1985, Cocucci and Sacchi1993, Kodur et al. 2010, 2011). At the start of the experiment,Rb was added to reach a soil final concentration of 0.1 mmol,(approximately 1% of K concentration). The leaf concentrationof Rb was measured at the end of the experimental period byICP-MS as described above.
Statistical analysesRegression coefficients, correlations and box plots wereobtained using the 10.0 Sigma Plot software package (SPSS,Chicago, IL, USA). The significance of differences betweenmeans within each cultivar and measured parameter wereassessed by univariate analysis of variance, followed by theDuncan multiple range test (P < 0.01) using Statistica 8.0(Statsoft, Tulsa, OK, USA).
Results
Experimental conditionsAir temperature and VPD were measured within the green-house using a humidity and temperature probe (model HMP-45A, Vaisala, Vantaa, Finland) housed inside a solar radiationshield; their trend and range of variation are presented inFigure 1. An average of 26.5 ± 3.1°C and 25.5 ± 4.1°C wasmeasured in the light and dark periods, respectively, while themean daily VPD was 1.1 kPa ± 0.1.
Some plant parameters, such as leaf area, total leaf area, leafbiomass and root biomass, were evaluated on a preliminarybasis (Table 1). The dimension of leaves of the 101.14 genotypewas greater than that of the M4 genotype (+ 56%). The averagenumber of leaves for each plant chosen for the experiments wasabout 35, so the total leaf area, leaf biomass and root biomasswere greater in 101.14 compared with M4.
Changes in SWC were monitored before the start of theexperiment. These preliminary measurements verified that,under the control conditions (i.e. 80% of soil field capacity),SWC decreased during the diurnal period from 8:00 am to 6:00pm to field capacity values of about 70%. From 6:00 pm to 8:00am, the SWC reduction did not exceed 4%. These changes werequite similar for both the studied genotypes and did not affectleaf gas exchange.
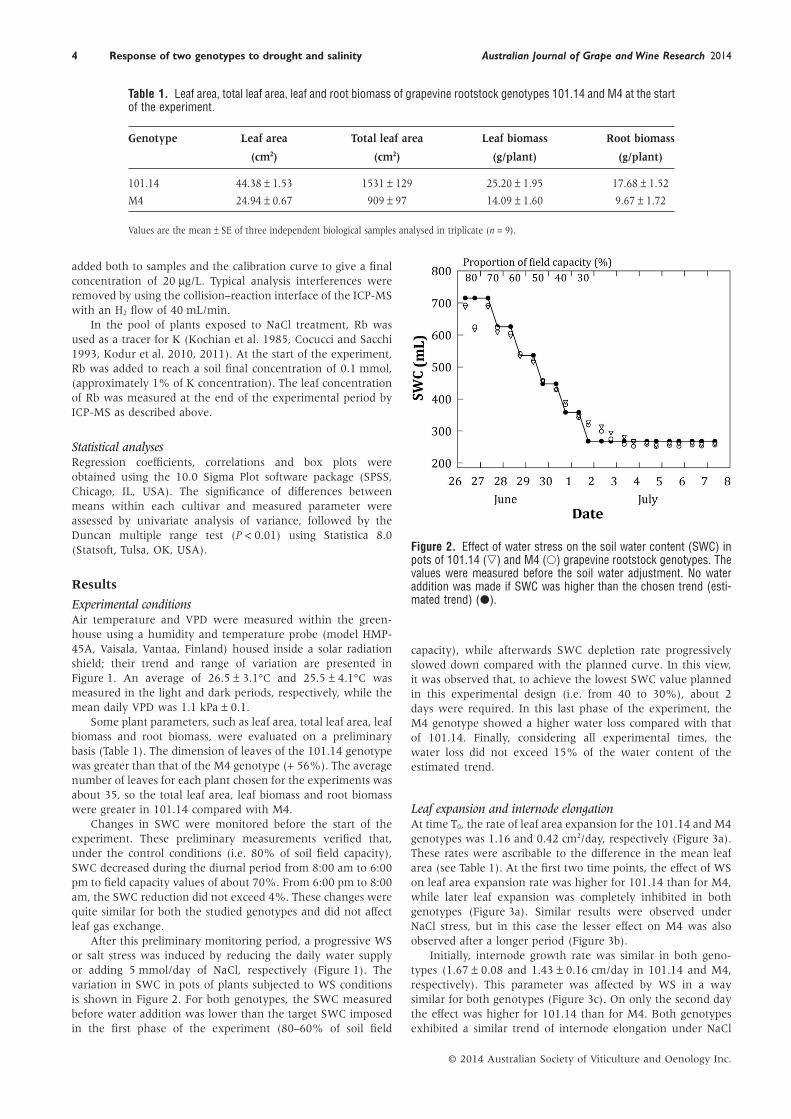
After this preliminary monitoring period, a progressive WSor salt stress was induced by reducing the daily water supplyor adding 5 mmol/day of NaCl, respectively (Figure 1). Thevariation in SWC in pots of plants subjected to WS conditionsis shown in Figure 2. For both genotypes, the SWC measuredbefore water addition was lower than the target SWC imposedin the first phase of the experiment (80–60% of soil field
capacity), while afterwards SWC depletion rate progressivelyslowed down compared with the planned curve. In this view,it was observed that, to achieve the lowest SWC value plannedin this experimental design (i.e. from 40 to 30%), about 2days were required. In this last phase of the experiment, theM4 genotype showed a higher water loss compared with thatof 101.14. Finally, considering all experimental times, thewater loss did not exceed 15% of the water content of theestimated trend.
Leaf expansion and internode elongationAt time T0, the rate of leaf area expansion for the 101.14 and M4genotypes was 1.16 and 0.42 cm2/day, respectively (Figure 3a).These rates were ascribable to the difference in the mean leafarea (see Table 1). At the first two time points, the effect of WSon leaf area expansion rate was higher for 101.14 than for M4,while later leaf expansion was completely inhibited in bothgenotypes (Figure 3a). Similar results were observed underNaCl stress, but in this case the lesser effect on M4 was alsoobserved after a longer period (Figure 3b).
Initially, internode growth rate was similar in both geno-types (1.67 ± 0.08 and 1.43 ± 0.16 cm/day in 101.14 and M4,respectively). This parameter was affected by WS in a waysimilar for both genotypes (Figure 3c). On only the second daythe effect was higher for 101.14 than for M4. Both genotypesexhibited a similar trend of internode elongation under NaCl
Table 1. Leaf area, total leaf area, leaf and root biomass of grapevine rootstock genotypes 101.14 and M4 at the startof the experiment.
Genotype Leaf area Total leaf area Leaf biomass Root biomass
(cm2) (cm2) (g/plant) (g/plant)
101.14 44.38 ± 1.53 1531 ± 129 25.20 ± 1.95 17.68 ± 1.52
M4 24.94 ± 0.67 909 ± 97 14.09 ± 1.60 9.67 ± 1.72
Values are the mean ± SE of three independent biological samples analysed in triplicate (n = 9).
Figure 2. Effect of water stress on the soil water content (SWC) inpots of 101.14 (▽) and M4 (○) grapevine rootstock genotypes. Thevalues were measured before the soil water adjustment. No wateraddition was made if SWC was higher than the chosen trend (esti-mated trend) (●).
4 Response of two genotypes to drought and salinity Australian Journal of Grape and Wine Research 2014
© 2014 Australian Society of Viticulture and Oenology Inc.
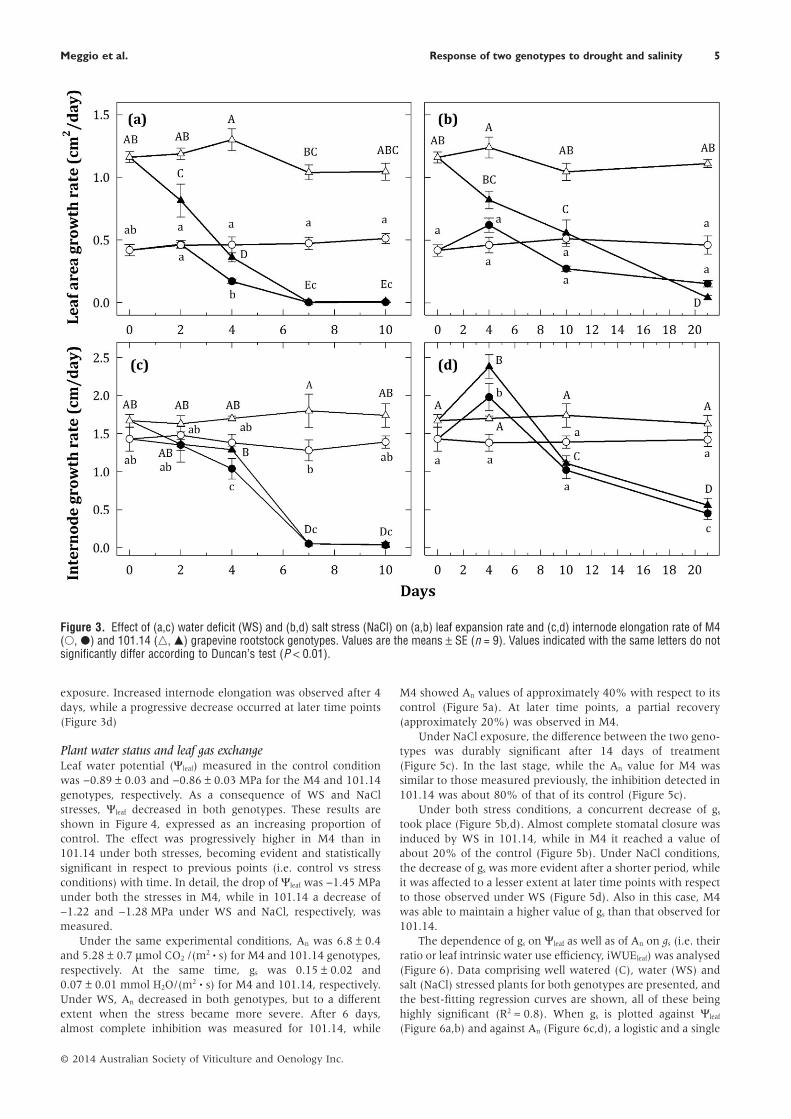
exposure. Increased internode elongation was observed after 4days, while a progressive decrease occurred at later time points(Figure 3d)
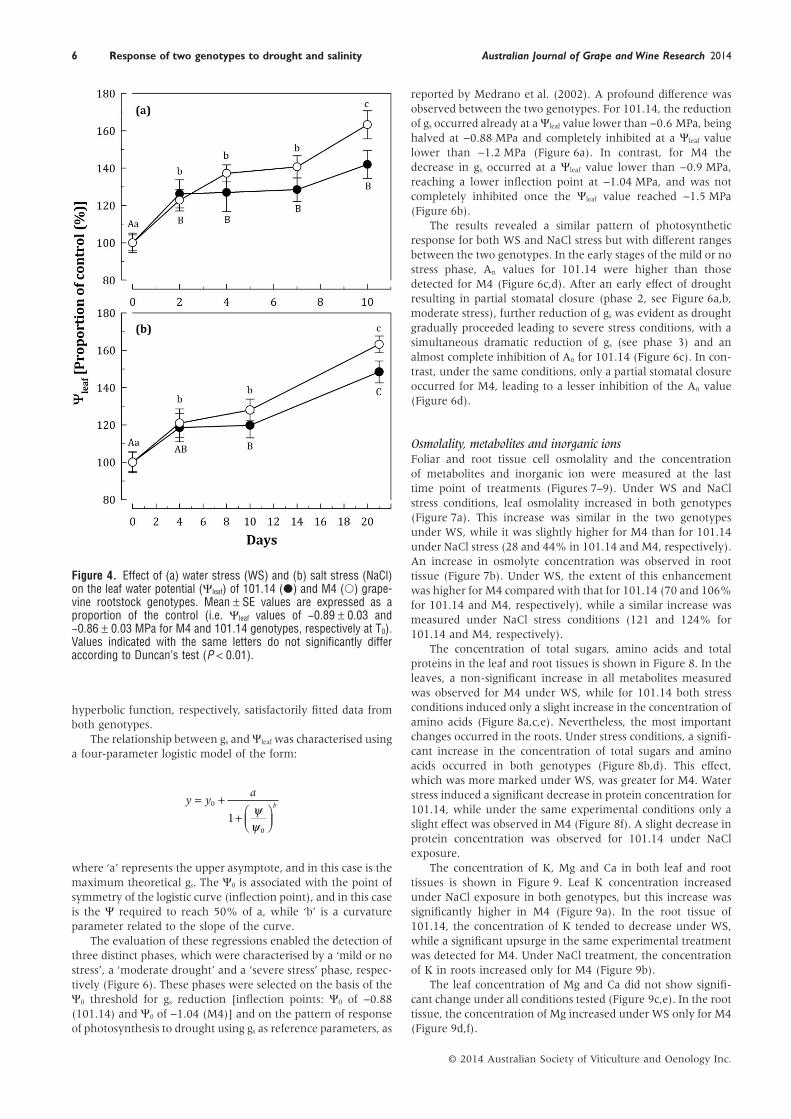
Plant water status and leaf gas exchangeLeaf water potential (Ψleaf) measured in the control conditionwas −0.89 ± 0.03 and −0.86 ± 0.03 MPa for the M4 and 101.14genotypes, respectively. As a consequence of WS and NaClstresses, Ψleaf decreased in both genotypes. These results areshown in Figure 4, expressed as an increasing proportion ofcontrol. The effect was progressively higher in M4 than in101.14 under both stresses, becoming evident and statisticallysignificant in respect to previous points (i.e. control vs stressconditions) with time. In detail, the drop of Ψleaf was −1.45 MPaunder both the stresses in M4, while in 101.14 a decrease of−1.22 and −1.28 MPa under WS and NaCl, respectively, wasmeasured.
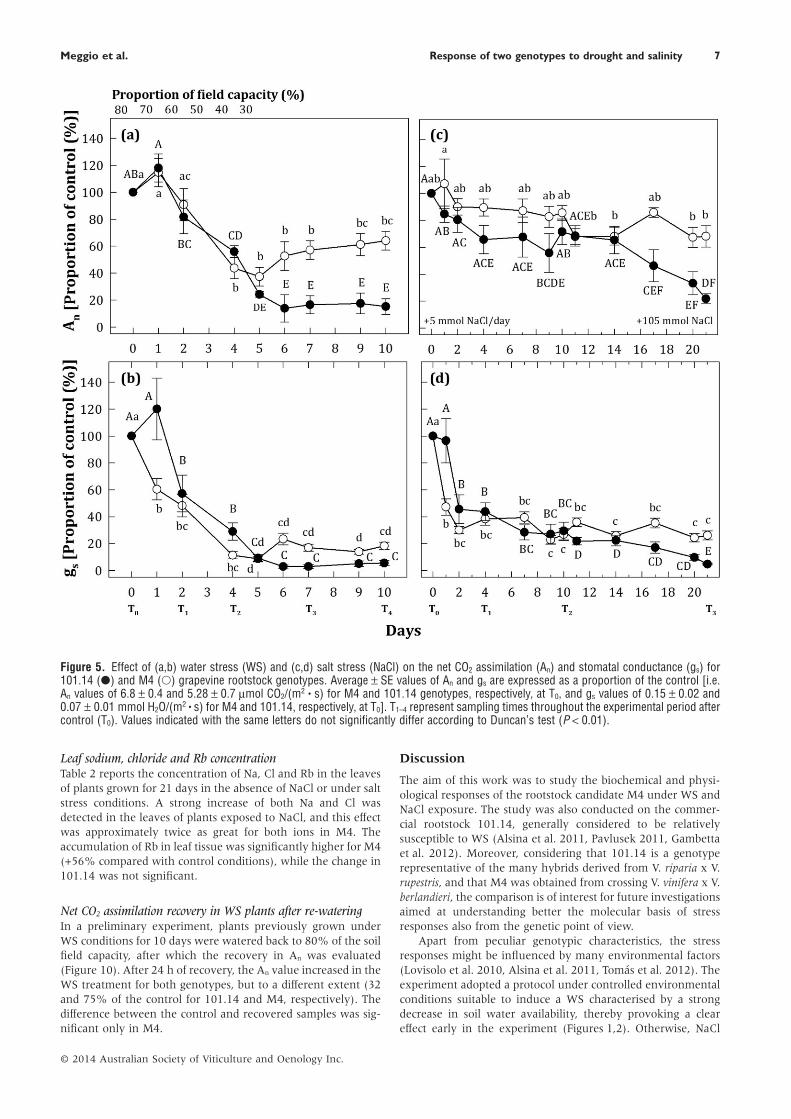
Under the same experimental conditions, An was 6.8 ± 0.4and 5.28 ± 0.7 μmol CO2 /(m2 • s) for M4 and 101.14 genotypes,respectively. At the same time, gs was 0.15 ± 0.02 and0.07 ± 0.01 mmol H2O/(m2 • s) for M4 and 101.14, respectively.Under WS, An decreased in both genotypes, but to a differentextent when the stress became more severe. After 6 days,almost complete inhibition was measured for 101.14, while
M4 showed An values of approximately 40% with respect to itscontrol (Figure 5a). At later time points, a partial recovery(approximately 20%) was observed in M4.
Under NaCl exposure, the difference between the two geno-types was durably significant after 14 days of treatment(Figure 5c). In the last stage, while the An value for M4 wassimilar to those measured previously, the inhibition detected in101.14 was about 80% of that of its control (Figure 5c).
Under both stress conditions, a concurrent decrease of gs
took place (Figure 5b,d). Almost complete stomatal closure wasinduced by WS in 101.14, while in M4 it reached a value ofabout 20% of the control (Figure 5b). Under NaCl conditions,the decrease of gs was more evident after a shorter period, whileit was affected to a lesser extent at later time points with respectto those observed under WS (Figure 5d). Also in this case, M4was able to maintain a higher value of gs than that observed for101.14.
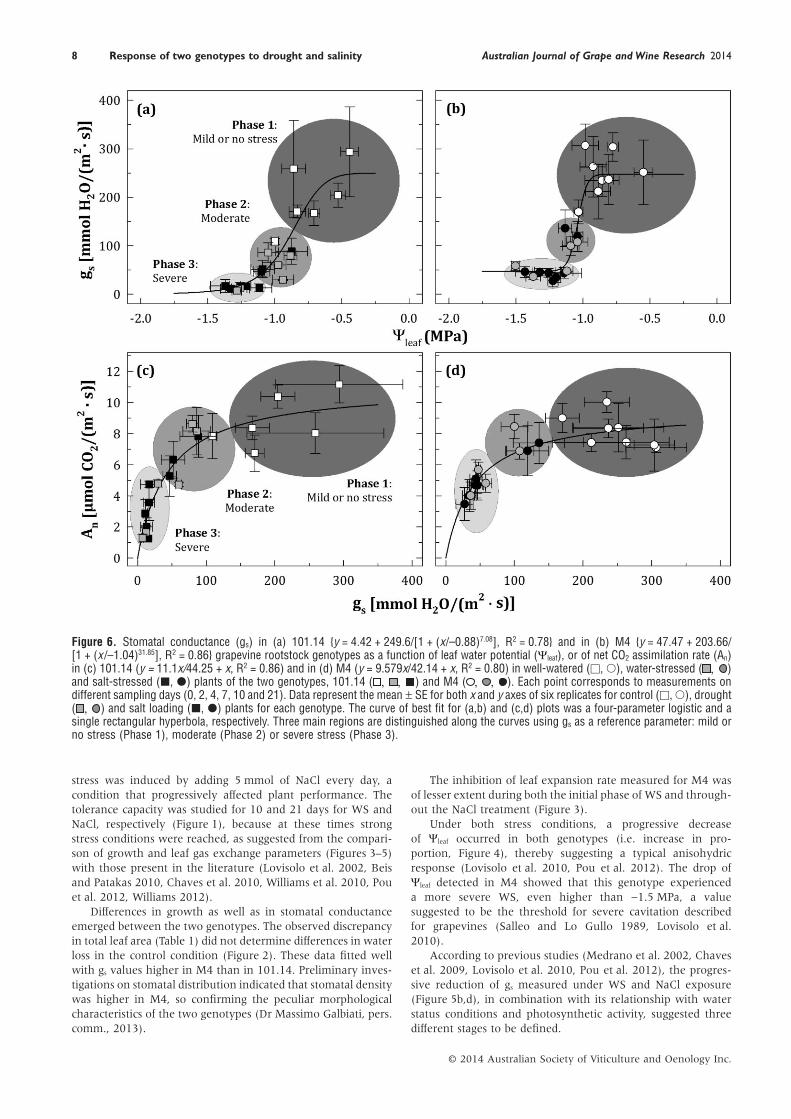
The dependence of gs on Ψleaf as well as of An on gs (i.e. theirratio or leaf intrinsic water use efficiency, iWUEleaf) was analysed(Figure 6). Data comprising well watered (C), water (WS) andsalt (NaCl) stressed plants for both genotypes are presented, andthe best-fitting regression curves are shown, all of these beinghighly significant (R2 ≈ 0.8). When gs is plotted against Ψleaf
(Figure 6a,b) and against An (Figure 6c,d), a logistic and a single
Figure 3. Effect of (a,c) water deficit (WS) and (b,d) salt stress (NaCl) on (a,b) leaf expansion rate and (c,d) internode elongation rate of M4(○, ●) and 101.14 (△, ▲) grapevine rootstock genotypes. Values are the means ± SE (n = 9). Values indicated with the same letters do notsignificantly differ according to Duncan’s test (P < 0.01).
Meggio et al. Response of two genotypes to drought and salinity 5
© 2014 Australian Society of Viticulture and Oenology Inc.
hyperbolic function, respectively, satisfactorily fitted data fromboth genotypes.
The relationship between gs and Ψleaf was characterised usinga four-parameter logistic model of the form:
y ya
b= ++ ⎛
⎝⎜⎞⎠⎟
0
0
1ψψ
where ‘a’ represents the upper asymptote, and in this case is themaximum theoretical gs. The Ψ0 is associated with the point ofsymmetry of the logistic curve (inflection point), and in this caseis the Ψ required to reach 50% of a, while ‘b’ is a curvatureparameter related to the slope of the curve.
The evaluation of these regressions enabled the detection ofthree distinct phases, which were characterised by a ‘mild or nostress’, a ‘moderate drought’ and a ‘severe stress’ phase, respec-tively (Figure 6). These phases were selected on the basis of theΨ0 threshold for gs reduction [inflection points: Ψ0 of −0.88(101.14) and Ψ0 of −1.04 (M4)] and on the pattern of responseof photosynthesis to drought using gs as reference parameters, as
reported by Medrano et al. (2002). A profound difference wasobserved between the two genotypes. For 101.14, the reductionof gs occurred already at a Ψleaf value lower than −0.6 MPa, beinghalved at −0.88 MPa and completely inhibited at a Ψleaf valuelower than −1.2 MPa (Figure 6a). In contrast, for M4 thedecrease in gs occurred at a Ψleaf value lower than −0.9 MPa,reaching a lower inflection point at −1.04 MPa, and was notcompletely inhibited once the Ψleaf value reached −1.5 MPa(Figure 6b).
The results revealed a similar pattern of photosyntheticresponse for both WS and NaCl stress but with different rangesbetween the two genotypes. In the early stages of the mild or nostress phase, An values for 101.14 were higher than thosedetected for M4 (Figure 6c,d). After an early effect of droughtresulting in partial stomatal closure (phase 2, see Figure 6a,b,moderate stress), further reduction of gs was evident as droughtgradually proceeded leading to severe stress conditions, with asimultaneous dramatic reduction of gs (see phase 3) and analmost complete inhibition of An for 101.14 (Figure 6c). In con-trast, under the same conditions, only a partial stomatal closureoccurred for M4, leading to a lesser inhibition of the An value(Figure 6d).
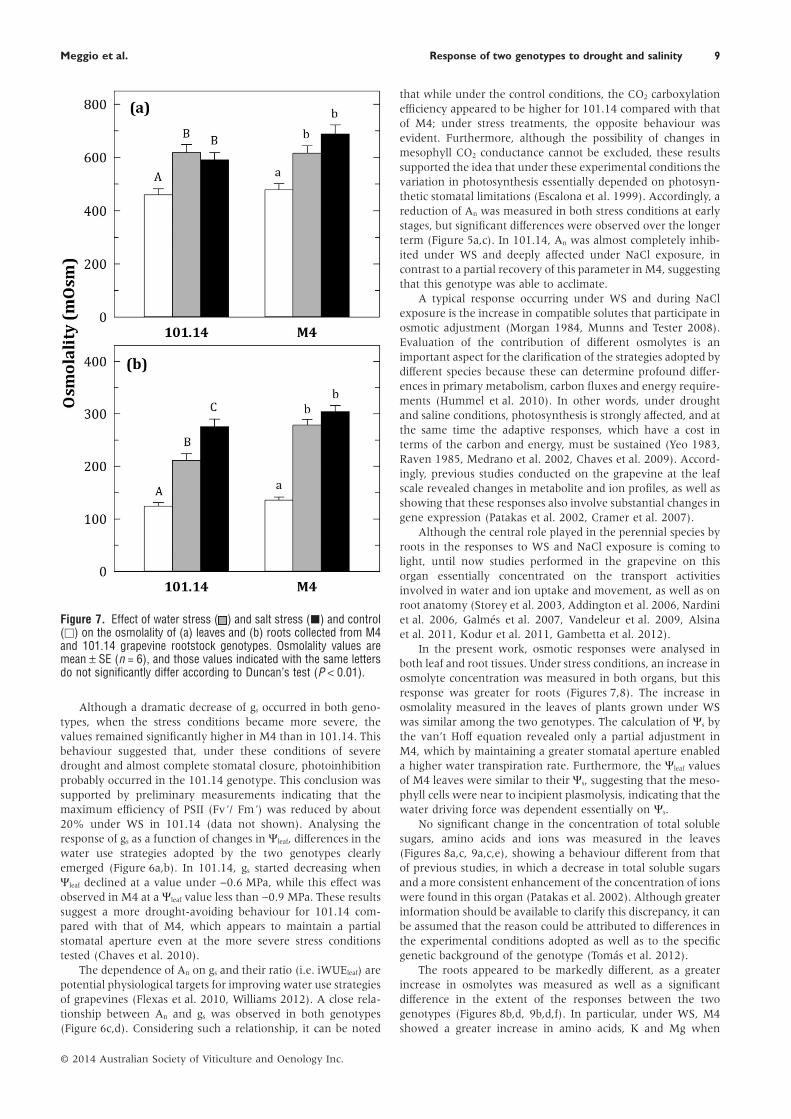
Osmolality, metabolites and inorganic ionsFoliar and root tissue cell osmolality and the concentrationof metabolites and inorganic ion were measured at the lasttime point of treatments (Figures 7–9). Under WS and NaClstress conditions, leaf osmolality increased in both genotypes(Figure 7a). This increase was similar in the two genotypesunder WS, while it was slightly higher for M4 than for 101.14under NaCl stress (28 and 44% in 101.14 and M4, respectively).An increase in osmolyte concentration was observed in roottissue (Figure 7b). Under WS, the extent of this enhancementwas higher for M4 compared with that for 101.14 (70 and 106%for 101.14 and M4, respectively), while a similar increase wasmeasured under NaCl stress conditions (121 and 124% for101.14 and M4, respectively).
The concentration of total sugars, amino acids and totalproteins in the leaf and root tissues is shown in Figure 8. In theleaves, a non-significant increase in all metabolites measuredwas observed for M4 under WS, while for 101.14 both stressconditions induced only a slight increase in the concentration ofamino acids (Figure 8a,c,e). Nevertheless, the most importantchanges occurred in the roots. Under stress conditions, a signifi-cant increase in the concentration of total sugars and aminoacids occurred in both genotypes (Figure 8b,d). This effect,which was more marked under WS, was greater for M4. Waterstress induced a significant decrease in protein concentration for101.14, while under the same experimental conditions only aslight effect was observed in M4 (Figure 8f). A slight decrease inprotein concentration was observed for 101.14 under NaClexposure.
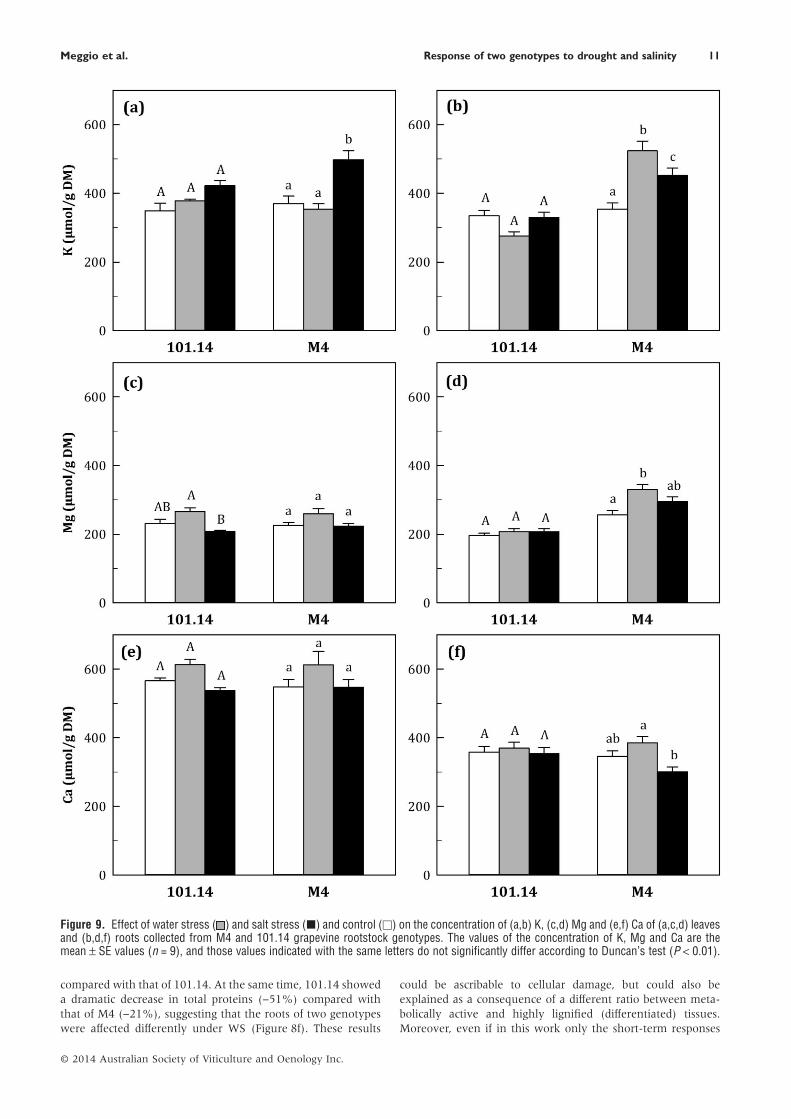
The concentration of K, Mg and Ca in both leaf and roottissues is shown in Figure 9. Leaf K concentration increasedunder NaCl exposure in both genotypes, but this increase wassignificantly higher in M4 (Figure 9a). In the root tissue of101.14, the concentration of K tended to decrease under WS,while a significant upsurge in the same experimental treatmentwas detected for M4. Under NaCl treatment, the concentrationof K in roots increased only for M4 (Figure 9b).
The leaf concentration of Mg and Ca did not show signifi-cant change under all conditions tested (Figure 9c,e). In the roottissue, the concentration of Mg increased under WS only for M4(Figure 9d,f).
Figure 4. Effect of (a) water stress (WS) and (b) salt stress (NaCl)on the leaf water potential (Ψleaf) of 101.14 (●) and M4 (○) grape-vine rootstock genotypes. Mean ± SE values are expressed as aproportion of the control (i.e. Ψleaf values of −0.89 ± 0.03 and−0.86 ± 0.03 MPa for M4 and 101.14 genotypes, respectively at T0).Values indicated with the same letters do not significantly differaccording to Duncan’s test (P < 0.01).
6 Response of two genotypes to drought and salinity Australian Journal of Grape and Wine Research 2014
© 2014 Australian Society of Viticulture and Oenology Inc.
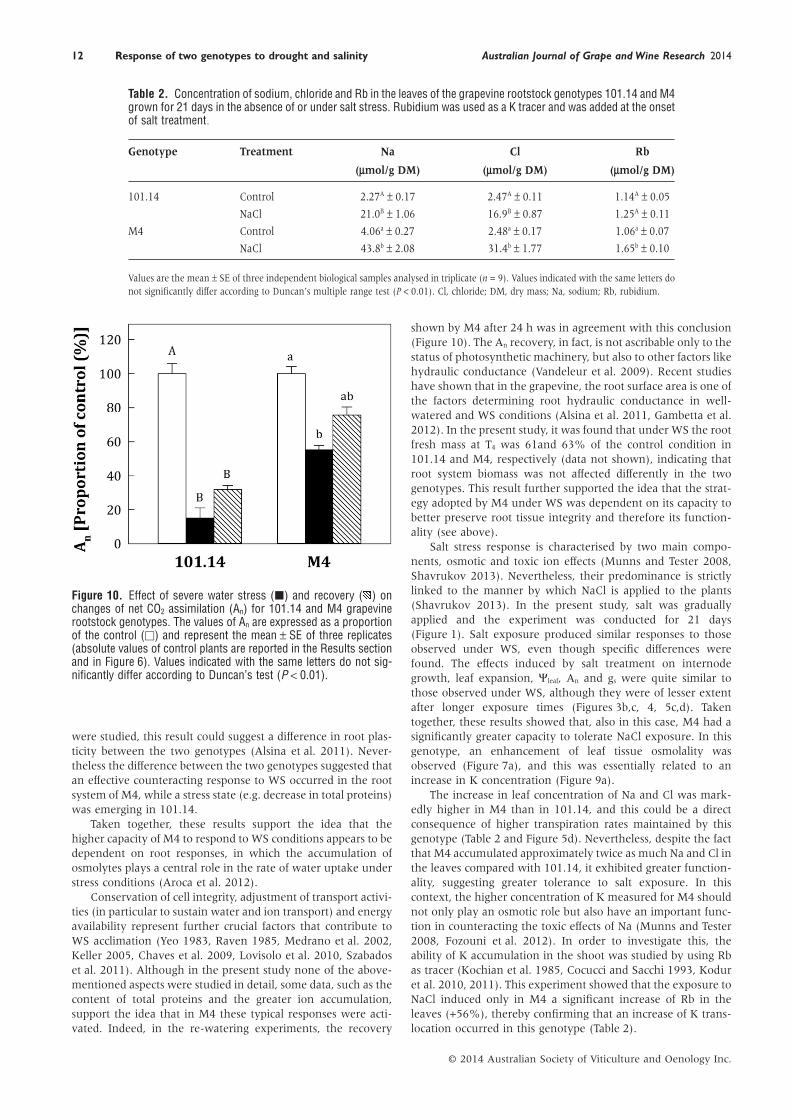
Leaf sodium, chloride and Rb concentrationTable 2 reports the concentration of Na, Cl and Rb in the leavesof plants grown for 21 days in the absence of NaCl or under saltstress conditions. A strong increase of both Na and Cl wasdetected in the leaves of plants exposed to NaCl, and this effectwas approximately twice as great for both ions in M4. Theaccumulation of Rb in leaf tissue was significantly higher for M4(+56% compared with control conditions), while the change in101.14 was not significant.
Net CO2 assimilation recovery in WS plants after re-wateringIn a preliminary experiment, plants previously grown underWS conditions for 10 days were watered back to 80% of the soilfield capacity, after which the recovery in An was evaluated(Figure 10). After 24 h of recovery, the An value increased in theWS treatment for both genotypes, but to a different extent (32and 75% of the control for 101.14 and M4, respectively). Thedifference between the control and recovered samples was sig-nificant only in M4.
Discussion
The aim of this work was to study the biochemical and physi-ological responses of the rootstock candidate M4 under WS andNaCl exposure. The study was also conducted on the commer-cial rootstock 101.14, generally considered to be relativelysusceptible to WS (Alsina et al. 2011, Pavlusek 2011, Gambettaet al. 2012). Moreover, considering that 101.14 is a genotyperepresentative of the many hybrids derived from V. riparia x V.rupestris, and that M4 was obtained from crossing V. vinifera x V.berlandieri, the comparison is of interest for future investigationsaimed at understanding better the molecular basis of stressresponses also from the genetic point of view.
Apart from peculiar genotypic characteristics, the stressresponses might be influenced by many environmental factors(Lovisolo et al. 2010, Alsina et al. 2011, Tomás et al. 2012). Theexperiment adopted a protocol under controlled environmentalconditions suitable to induce a WS characterised by a strongdecrease in soil water availability, thereby provoking a cleareffect early in the experiment (Figures 1,2). Otherwise, NaCl
Figure 5. Effect of (a,b) water stress (WS) and (c,d) salt stress (NaCl) on the net CO2 assimilation (An) and stomatal conductance (gs) for101.14 (●) and M4 (○) grapevine rootstock genotypes. Average ± SE values of An and gs are expressed as a proportion of the control [i.e.An values of 6.8 ± 0.4 and 5.28 ± 0.7 μmol CO2/(m2 • s) for M4 and 101.14 genotypes, respectively, at T0, and gs values of 0.15 ± 0.02 and0.07 ± 0.01 mmol H2O/(m2 • s) for M4 and 101.14, respectively, at T0]. T1–4 represent sampling times throughout the experimental period aftercontrol (T0). Values indicated with the same letters do not significantly differ according to Duncan’s test (P < 0.01).
Meggio et al. Response of two genotypes to drought and salinity 7
© 2014 Australian Society of Viticulture and Oenology Inc.
stress was induced by adding 5 mmol of NaCl every day, acondition that progressively affected plant performance. Thetolerance capacity was studied for 10 and 21 days for WS andNaCl, respectively (Figure 1), because at these times strongstress conditions were reached, as suggested from the compari-son of growth and leaf gas exchange parameters (Figures 3–5)with those present in the literature (Lovisolo et al. 2002, Beisand Patakas 2010, Chaves et al. 2010, Williams et al. 2010, Pouet al. 2012, Williams 2012).
Differences in growth as well as in stomatal conductanceemerged between the two genotypes. The observed discrepancyin total leaf area (Table 1) did not determine differences in waterloss in the control condition (Figure 2). These data fitted wellwith gs values higher in M4 than in 101.14. Preliminary inves-tigations on stomatal distribution indicated that stomatal densitywas higher in M4, so confirming the peculiar morphologicalcharacteristics of the two genotypes (Dr Massimo Galbiati, pers.comm., 2013).
The inhibition of leaf expansion rate measured for M4 wasof lesser extent during both the initial phase of WS and through-out the NaCl treatment (Figure 3).
Under both stress conditions, a progressive decreaseof Ψleaf occurred in both genotypes (i.e. increase in pro-portion, Figure 4), thereby suggesting a typical anisohydricresponse (Lovisolo et al. 2010, Pou et al. 2012). The drop ofΨleaf detected in M4 showed that this genotype experienceda more severe WS, even higher than −1.5 MPa, a valuesuggested to be the threshold for severe cavitation describedfor grapevines (Salleo and Lo Gullo 1989, Lovisolo et al.2010).
According to previous studies (Medrano et al. 2002, Chaveset al. 2009, Lovisolo et al. 2010, Pou et al. 2012), the progres-sive reduction of gs measured under WS and NaCl exposure(Figure 5b,d), in combination with its relationship with waterstatus conditions and photosynthetic activity, suggested threedifferent stages to be defined.
Figure 6. Stomatal conductance (gs) in (a) 101.14 {y = 4.42 + 249.6/[1 + (x/–0.88)7.08], R2 = 0.78} and in (b) M4 {y = 47.47 + 203.66/[1 + (x /–1.04)31.85], R2 = 0.86} grapevine rootstock genotypes as a function of leaf water potential (Ψleaf), or of net CO2 assimilation rate (An)in (c) 101.14 (y = 11.1x/44.25 + x, R2 = 0.86) and in (d) M4 (y = 9.579x/42.14 + x, R2 = 0.80) in well-watered (□, ○), water-stressed ( , )and salt-stressed (■, ●) plants of the two genotypes, 101.14 ( , , ) and M4 ( , , ). Each point corresponds to measurements ondifferent sampling days (0, 2, 4, 7, 10 and 21). Data represent the mean ± SE for both x and y axes of six replicates for control (□, ○), drought( , ) and salt loading (■, ●) plants for each genotype. The curve of best fit for (a,b) and (c,d) plots was a four-parameter logistic and asingle rectangular hyperbola, respectively. Three main regions are distinguished along the curves using gs as a reference parameter: mild orno stress (Phase 1), moderate (Phase 2) or severe stress (Phase 3).
8 Response of two genotypes to drought and salinity Australian Journal of Grape and Wine Research 2014
© 2014 Australian Society of Viticulture and Oenology Inc.
Although a dramatic decrease of gs occurred in both geno-types, when the stress conditions became more severe, thevalues remained significantly higher in M4 than in 101.14. Thisbehaviour suggested that, under these conditions of severedrought and almost complete stomatal closure, photoinhibitionprobably occurred in the 101.14 genotype. This conclusion wassupported by preliminary measurements indicating that themaximum efficiency of PSII (Fv’/ Fm’) was reduced by about20% under WS in 101.14 (data not shown). Analysing theresponse of gs as a function of changes in Ψleaf, differences in thewater use strategies adopted by the two genotypes clearlyemerged (Figure 6a,b). In 101.14, gs started decreasing whenΨleaf declined at a value under −0.6 MPa, while this effect wasobserved in M4 at a Ψleaf value less than −0.9 MPa. These resultssuggest a more drought-avoiding behaviour for 101.14 com-pared with that of M4, which appears to maintain a partialstomatal aperture even at the more severe stress conditionstested (Chaves et al. 2010).
The dependence of An on gs and their ratio (i.e. iWUEleaf) arepotential physiological targets for improving water use strategiesof grapevines (Flexas et al. 2010, Williams 2012). A close rela-tionship between An and gs was observed in both genotypes(Figure 6c,d). Considering such a relationship, it can be noted
that while under the control conditions, the CO2 carboxylationefficiency appeared to be higher for 101.14 compared with thatof M4; under stress treatments, the opposite behaviour wasevident. Furthermore, although the possibility of changes inmesophyll CO2 conductance cannot be excluded, these resultssupported the idea that under these experimental conditions thevariation in photosynthesis essentially depended on photosyn-thetic stomatal limitations (Escalona et al. 1999). Accordingly, areduction of An was measured in both stress conditions at earlystages, but significant differences were observed over the longerterm (Figure 5a,c). In 101.14, An was almost completely inhib-ited under WS and deeply affected under NaCl exposure, incontrast to a partial recovery of this parameter in M4, suggestingthat this genotype was able to acclimate.
A typical response occurring under WS and during NaClexposure is the increase in compatible solutes that participate inosmotic adjustment (Morgan 1984, Munns and Tester 2008).Evaluation of the contribution of different osmolytes is animportant aspect for the clarification of the strategies adopted bydifferent species because these can determine profound differ-ences in primary metabolism, carbon fluxes and energy require-ments (Hummel et al. 2010). In other words, under droughtand saline conditions, photosynthesis is strongly affected, and atthe same time the adaptive responses, which have a cost interms of the carbon and energy, must be sustained (Yeo 1983,Raven 1985, Medrano et al. 2002, Chaves et al. 2009). Accord-ingly, previous studies conducted on the grapevine at the leafscale revealed changes in metabolite and ion profiles, as well asshowing that these responses also involve substantial changes ingene expression (Patakas et al. 2002, Cramer et al. 2007).
Although the central role played in the perennial species byroots in the responses to WS and NaCl exposure is coming tolight, until now studies performed in the grapevine on thisorgan essentially concentrated on the transport activitiesinvolved in water and ion uptake and movement, as well as onroot anatomy (Storey et al. 2003, Addington et al. 2006, Nardiniet al. 2006, Galmés et al. 2007, Vandeleur et al. 2009, Alsinaet al. 2011, Kodur et al. 2011, Gambetta et al. 2012).
In the present work, osmotic responses were analysed inboth leaf and root tissues. Under stress conditions, an increase inosmolyte concentration was measured in both organs, but thisresponse was greater for roots (Figures 7,8). The increase inosmolality measured in the leaves of plants grown under WSwas similar among the two genotypes. The calculation of Ψs bythe van’t Hoff equation revealed only a partial adjustment inM4, which by maintaining a greater stomatal aperture enableda higher water transpiration rate. Furthermore, the Ψleaf valuesof M4 leaves were similar to their Ψs, suggesting that the meso-phyll cells were near to incipient plasmolysis, indicating that thewater driving force was dependent essentially on Ψs.
No significant change in the concentration of total solublesugars, amino acids and ions was measured in the leaves(Figures 8a,c, 9a,c,e), showing a behaviour different from thatof previous studies, in which a decrease in total soluble sugarsand a more consistent enhancement of the concentration of ionswere found in this organ (Patakas et al. 2002). Although greaterinformation should be available to clarify this discrepancy, it canbe assumed that the reason could be attributed to differences inthe experimental conditions adopted as well as to the specificgenetic background of the genotype (Tomás et al. 2012).
The roots appeared to be markedly different, as a greaterincrease in osmolytes was measured as well as a significantdifference in the extent of the responses between the twogenotypes (Figures 8b,d, 9b,d,f). In particular, under WS, M4showed a greater increase in amino acids, K and Mg when
Figure 7. Effect of water stress ( ) and salt stress (■) and control(□) on the osmolality of (a) leaves and (b) roots collected from M4and 101.14 grapevine rootstock genotypes. Osmolality values aremean ± SE (n = 6), and those values indicated with the same lettersdo not significantly differ according to Duncan’s test (P < 0.01).
Meggio et al. Response of two genotypes to drought and salinity 9
© 2014 Australian Society of Viticulture and Oenology Inc.
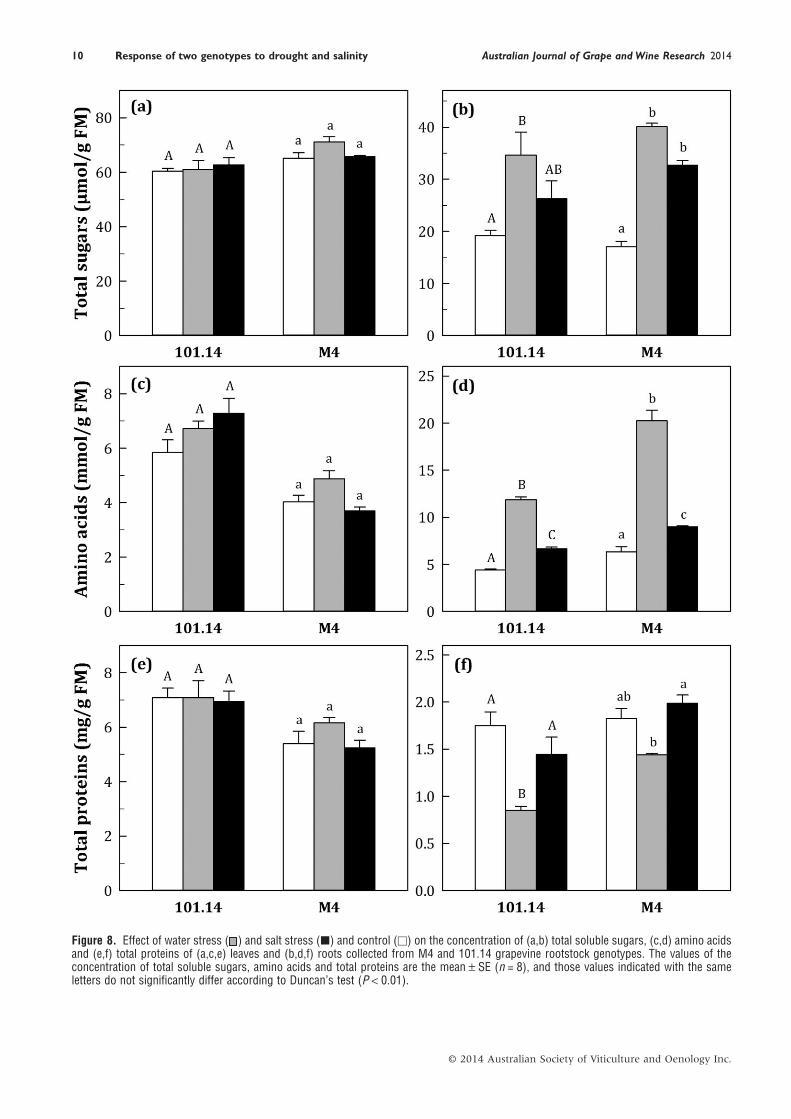
Figure 8. Effect of water stress ( ) and salt stress (■) and control (□) on the concentration of (a,b) total soluble sugars, (c,d) amino acidsand (e,f) total proteins of (a,c,e) leaves and (b,d,f) roots collected from M4 and 101.14 grapevine rootstock genotypes. The values of theconcentration of total soluble sugars, amino acids and total proteins are the mean ± SE (n = 8), and those values indicated with the sameletters do not significantly differ according to Duncan’s test (P < 0.01).
10 Response of two genotypes to drought and salinity Australian Journal of Grape and Wine Research 2014
© 2014 Australian Society of Viticulture and Oenology Inc.
compared with that of 101.14. At the same time, 101.14 showeda dramatic decrease in total proteins (−51%) compared withthat of M4 (−21%), suggesting that the roots of two genotypeswere affected differently under WS (Figure 8f). These results
could be ascribable to cellular damage, but could also beexplained as a consequence of a different ratio between meta-bolically active and highly lignified (differentiated) tissues.Moreover, even if in this work only the short-term responses
Figure 9. Effect of water stress ( ) and salt stress (■) and control (□) on the concentration of (a,b) K, (c,d) Mg and (e,f) Ca of (a,c,d) leavesand (b,d,f) roots collected from M4 and 101.14 grapevine rootstock genotypes. The values of the concentration of K, Mg and Ca are themean ± SE values (n = 9), and those values indicated with the same letters do not significantly differ according to Duncan’s test (P < 0.01).
Meggio et al. Response of two genotypes to drought and salinity 11
© 2014 Australian Society of Viticulture and Oenology Inc.
were studied, this result could suggest a difference in root plas-ticity between the two genotypes (Alsina et al. 2011). Never-theless the difference between the two genotypes suggested thatan effective counteracting response to WS occurred in the rootsystem of M4, while a stress state (e.g. decrease in total proteins)was emerging in 101.14.
Taken together, these results support the idea that thehigher capacity of M4 to respond to WS conditions appears to bedependent on root responses, in which the accumulation ofosmolytes plays a central role in the rate of water uptake understress conditions (Aroca et al. 2012).
Conservation of cell integrity, adjustment of transport activi-ties (in particular to sustain water and ion transport) and energyavailability represent further crucial factors that contribute toWS acclimation (Yeo 1983, Raven 1985, Medrano et al. 2002,Keller 2005, Chaves et al. 2009, Lovisolo et al. 2010, Szabadoset al. 2011). Although in the present study none of the above-mentioned aspects were studied in detail, some data, such as thecontent of total proteins and the greater ion accumulation,support the idea that in M4 these typical responses were acti-vated. Indeed, in the re-watering experiments, the recovery
shown by M4 after 24 h was in agreement with this conclusion(Figure 10). The An recovery, in fact, is not ascribable only to thestatus of photosynthetic machinery, but also to other factors likehydraulic conductance (Vandeleur et al. 2009). Recent studieshave shown that in the grapevine, the root surface area is one ofthe factors determining root hydraulic conductance in well-watered and WS conditions (Alsina et al. 2011, Gambetta et al.2012). In the present study, it was found that under WS the rootfresh mass at T4 was 61and 63% of the control condition in101.14 and M4, respectively (data not shown), indicating thatroot system biomass was not affected differently in the twogenotypes. This result further supported the idea that the strat-egy adopted by M4 under WS was dependent on its capacity tobetter preserve root tissue integrity and therefore its function-ality (see above).
Salt stress response is characterised by two main compo-nents, osmotic and toxic ion effects (Munns and Tester 2008,Shavrukov 2013). Nevertheless, their predominance is strictlylinked to the manner by which NaCl is applied to the plants(Shavrukov 2013). In the present study, salt was graduallyapplied and the experiment was conducted for 21 days(Figure 1). Salt exposure produced similar responses to thoseobserved under WS, even though specific differences werefound. The effects induced by salt treatment on internodegrowth, leaf expansion, Ψleaf, An and gs were quite similar tothose observed under WS, although they were of lesser extentafter longer exposure times (Figures 3b,c, 4, 5c,d). Takentogether, these results showed that, also in this case, M4 had asignificantly greater capacity to tolerate NaCl exposure. In thisgenotype, an enhancement of leaf tissue osmolality wasobserved (Figure 7a), and this was essentially related to anincrease in K concentration (Figure 9a).
The increase in leaf concentration of Na and Cl was mark-edly higher in M4 than in 101.14, and this could be a directconsequence of higher transpiration rates maintained by thisgenotype (Table 2 and Figure 5d). Nevertheless, despite the factthat M4 accumulated approximately twice as much Na and Cl inthe leaves compared with 101.14, it exhibited greater function-ality, suggesting greater tolerance to salt exposure. In thiscontext, the higher concentration of K measured for M4 shouldnot only play an osmotic role but also have an important func-tion in counteracting the toxic effects of Na (Munns and Tester2008, Fozouni et al. 2012). In order to investigate this, theability of K accumulation in the shoot was studied by using Rbas tracer (Kochian et al. 1985, Cocucci and Sacchi 1993, Koduret al. 2010, 2011). This experiment showed that the exposure toNaCl induced only in M4 a significant increase of Rb in theleaves (+56%), thereby confirming that an increase of K trans-location occurred in this genotype (Table 2).
Table 2. Concentration of sodium, chloride and Rb in the leaves of the grapevine rootstock genotypes 101.14 and M4grown for 21 days in the absence of or under salt stress. Rubidium was used as a K tracer and was added at the onsetof salt treatment.
Genotype Treatment Na Cl Rb
(μmol/g DM) (μmol/g DM) (μmol/g DM)
101.14 Control 2.27A ± 0.17 2.47A ± 0.11 1.14A ± 0.05
NaCl 21.0B ± 1.06 16.9B ± 0.87 1.25A ± 0.11
M4 Control 4.06a ± 0.27 2.48a ± 0.17 1.06a ± 0.07
NaCl 43.8b ± 2.08 31.4b ± 1.77 1.65b ± 0.10
Values are the mean ± SE of three independent biological samples analysed in triplicate (n = 9). Values indicated with the same letters donot significantly differ according to Duncan’s multiple range test (P < 0.01). Cl, chloride; DM, dry mass; Na, sodium; Rb, rubidium.
Figure 10. Effect of severe water stress (■) and recovery ( ) onchanges of net CO2 assimilation (An) for 101.14 and M4 grapevinerootstock genotypes. The values of An are expressed as a proportionof the control (□) and represent the mean ± SE of three replicates(absolute values of control plants are reported in the Results sectionand in Figure 6). Values indicated with the same letters do not sig-nificantly differ according to Duncan’s test (P < 0.01).
12 Response of two genotypes to drought and salinity Australian Journal of Grape and Wine Research 2014
© 2014 Australian Society of Viticulture and Oenology Inc.
Nevertheless, it was observed that the values measured inthis organ at the final time point (i.e. 21 days of NaCl treatment)were not high enough to induce severe Na and/or Cl toxicity(Munns and Tester 2008, Fozouni et al. 2012, Shavrukov 2013).Although information on Na and Cl distribution in the leaftissue should be gathered to clarify this point in detail (Storeyet al. 2003), it should be remembered that the inhibitory effectsdetected in the leaves could also be determined by long distancesignals originated from roots exposed to NaCl (Munns andTester 2008).
For some species, Cl is considered to be the most toxic ionbecause it is accumulated to a greater concentration in theleaves, although this characteristic appears to be dependent ongenotype (Munns and Tester 2008, Gong et al. 2011, Fozouniet al. 2012). In both genotypes, leaf Cl accumulation appearedto parallel the increase in Na, reaching a value that was,however, of lesser extent with respect to this cation (Table 2).These results, however, did not highlight a difference between101.14 and M4 for the ability to exclude/translocate Cl.
In the roots, a greater enhancement of total soluble sugars,amino acids, K and Mg was measured under NaCl for M4compared with that of 101.14, while only slight but not signifi-cant difference was observed for total protein concentration(Figures 8b,d,f, 9b,d). Taken together, these observations indi-cated that in M4 a different activation of metabolism implicatedin response to NaCl occurred. As observed for WS, the toleranceto NaCl showed by M4 was also dependent on its capacity tomaintain an adequate integrity/functionality of the root system.In this context, it was observed that after 21 days, root biomasswas affected to a greater extent for 101.14 than for M4 (−34 and−13%, respectively; data not shown).
Although further studies are required to clarify the relation-ship between roots and leaves in the grapevine under stressconditions, this work highlights the central role of the rootorgan in response to WS and NaCl exposure. In this context, theimportance of the rootstock role in the adjustment to adverseenvironmental conditions, in addition to the selection of geno-types that can tolerate combinations of stresses, is emerging as akey hint for future viticulture (Storey et al. 2003, Mittler andBlumwald 2010, Alsina et al. 2011, Gambetta et al. 2012,Marguerit et al. 2012). It should be stressed, however, that thesedata were obtained on ungrafted plants, so they did not permitan in-depth clarification of the possible performance of M4 as arootstock, and as well as they did not consider that in graftedplants the scion could also influence its characteristics(Swanepoel and Southey 1989, Zhang et al. 2002, Tandonnetet al. 2010).
The data obtained in this study should encourage furtherwork aimed to investigate the molecular responses occurring inM4 compared with that of 101.14 to research putative molecu-lar markers that will assist genetic selection within the genusVitis.
AcknowledgementsThis work was supported by AGER-SERRES Project, grantn°2010–2105. We thank Dr Simon Pierce (University of Milan)for polishing the English in the final version of the manuscript.
ReferencesAddington, R.N., Donovan, L.A., Mitchell, R.J., Vose, J.M., Pecot, S.D., Jack,
S.B., Hacke, U.G., Sperry, J.S. and Oren, R. (2006) Adjustments inhydraulic architecture of Pinus palustris maintain similar stomatal conduct-ance in xeric and mesic habitats. Plant, Cell and Environment 29, 535–545.
Alsina, M.M., Smart, D.R., Bauerle, T., de Herralde, F., Biel, B., Stockert, C.,Negron, C. and Save, R. (2011) Seasonal changes of whole root systemconductance by a drought-tolerant grape root system. Journal of Experi-mental Botany 62, 99–109.
Aroca, R., Porcel, R. and Ruiz-Lozano, J.M. (2012) Regulation of root wateruptake under abiotic stress conditions. Journal of Experimental Botany63, 43–57.
Beis, A. and Patakas, A. (2010) Differences in stomatal responses and root toshoot signalling between two grapevine varieties subjected to drought.Functional Plant Biology 37, 139–146.
Chaves, M.M. (1991) Effects of water deficits on carbon assimilation.Journal of Experimental Botany 42, 1–16.
Chaves, M.M., Flexas, J. and Pinheiro, C. (2009) Photosynthesis underdrought and salt stress: regulation mechanisms from whole plant to cell.Annals of Botany 103, 551–560.
Chaves, M.M., Santos, P.T., Souza, C.R., Ortuño, M.F., Rodrigues, M.L.,Lopes, C.M., Maroco, J.P. and Pereira, J.S. (2007) Deficit irrigation ingrapevine improves water-use efficiency while controlling vigour andproduction quality. Annals of Applied Biology 150, 237–252.
Chaves, M.M., Zarrouk, O., Francisco, R., Costa, J.M., Santos, T., Regalado,A.P., Rodrigues, M.L. and Lopes, C.M. (2010) Grapevine under deficitirrigation: hints from physiological and molecular data. Annals of Botany105, 661–676.
Christmann, A., Weiler, E.W., Steudle, E. and Grill, E. (2007) A hydraulicsignal in root-to-shoot signalling of water shortage. The Plant Journal 52,167–174.
Cocucci, M. and Sacchi, G.A. (1993) Effects of rubidium and potassium onpotassium efflux from subapical segments of maize roots. Plant Physiologyand Biochemistry 31, 9–16.
Cookson, S.J., Hevin, C., Donnart, M. and Ollat, N. (2012) Grapevinerootstock effects on scion biomass are not associated with large modifica-tions of primary shoot growth under nonlimiting conditions in the firstyear of growth. Functional Plant Biology 39, 650–660.
Cortell, J.M., Sivertsen, H.K., Kennedy, J.A. and Heymann, H. (2008) Influ-ence of vine vigor on Pinot noir fruit composition, wine chemical analysis,and wine sensory attributes. American Journal of Enology and Viticulture59, 1–10.
Cramer, G.R. (2010) Abiotic stress and plant responses from the whole vineto the genes. Australian Journal of Grape and Wine Research 16, 86–93.
Cramer, G.R., Ergül, A., Grimplet, J., Tillett, R.L., Tattersall, E.A.R.,Bohlman, M.C., Vincent, D., Sonderegger, J., Evans, J., Osborne, C.,Quilici, D., Schlauch, K.A., Schooley, D.A. and Cushman, J.C. (2007)Water and salinity stress in grapevines: early and late changes in transcriptand metabolite profiles. Functional and Integrative Genomics 7, 111–134.
Escalona, J.M., Flexas, J. and Medrano, H. (1999) Stomatal and non-stomatal limitations of photosynthesis under water stress in field-growngrapevines. Australian Journal of Plant Physiology 26, 421–433.
Flexas, J., Galmés, J., Gallé, A., Gulías, J., Pou, A., Ribas-Carbo, M., Tomás,M. and Medrano, H. (2010) Improving water use efficiency in grapevines:potential physiological targets for biotechnological improvement. Austral-ian Journal of Grape and Wine Research 16, 106–121.
Fozouni, M., Abbaspour, N. and Doulati Baneh, H. (2012) Short termresponse of grapevine grown hydroponically to salinity: mineral compo-sition and growth parameters. Vitis 51, 95–101.
Galmés, J., Pou, A., Alsina, M.M., Tomàs, M., Medrano, H. and Flexas, J.(2007) Aquaporin expression in response to different water stress inten-sities and recovery in Richter-110 (Vitis sp.): relationship withecophysiological status. Planta 226, 671–681.
Gambetta, G.A., Manuck, C.M., Drucker, S.T., Shaghasi, T., Fort, K.,Matthews, M.A., Walker, M.A. and McElrone, A.J. (2012) The relation-ship between root hydraulics and scion vigour across Vitis rootstocks: whatrole do root aquaporins play? Journal of Experimental Botany 63, 6445–6455.
Gong, H., Blackmore, D., Clingeleffer, P., Sykes, S., Jha, D., Tester, M. andWalker, R. (2011) Contrast in chloride exclusion between two grapevinegenotypes and its variation in their hybrid progeny. Journal of Experi-mental Botany 62, 989–999.
Hasegawa, P.M., Bressan, R.A., Zhu, J.-K. and Bohnert, H.J. (2000) Plantcellular and molecular responses to high salinity. Annual Review of PlantPhysiology and Plant Molecular Biology 51, 463–499.
Hongtao, J., Pardob, J.M., Batellic, G., Van Oostend, M.J., Bressane, R.A.and Lia, X. (2013) The salt overly sensitive (SOS) pathway: established andemerging roles. Molecular Plant 6, 275–286.
Hummel, I., Pantin, F., Sulpice, R., Piques, M., Rolland, G., Dauzat, M.,Christophe, A., Pervent, M., Bouteillé, M., Stitt, M., Gibon, Y. and Muller,B. (2010) Arabidopsis plants acclimate to water deficit at low cost throughchanges of carbon usage: an integrated perspective using growth, metabo-lite, enzyme, and gene expression analysis. Plant Physiology 154, 357–372.
Meggio et al. Response of two genotypes to drought and salinity 13
© 2014 Australian Society of Viticulture and Oenology Inc.
Jones, G.V., White, M.A., Cooper, O.R. and Storchmann, K. (2005) Climatechange and global wine quality. Climatic Change 73, 319–343.
Keller, M. (2005) Deficit irrigation and mineral nutrition. American Journalof Enology and Viticulture 56, 267–282.
Kochian, L.V., Xin-Xhi, J. and Lucas, W.J. (1985) Potassium transport incorn roots. IV. Characterization of the linear component. Plant Physiology79, 771–776.
Kodur, S., Tisdall, J.M., Tang, C. and Walker, R.R. (2010) Accumulation ofpotassium in grapevine rootstocks (Vitis) grafted to ‘Shiraz’ as affected bygrowth, root-traits and transpiration. Vitis 49, 7–13.
Kodur, S., Tisdall, J.M., Tang, C. and Walker, R.R. (2011) Uptake, transport,accumulation and retranslocation of potassium in grapevine rootstocks(Vitis). Vitis 50, 145–149.
Lovisolo, C., Hartung, W. and Schubert, A. (2002) Whole-plant hydraulicconductance and root-to-shoot flow of abscisic acid are independentlyaffected by water stress in grapevines. Functional Plant Biology 29, 1349–1356.
Lovisolo, C., Perrone, I., Carra, A., Ferrandino, A., Flexas, J., Medrano, H.and Schubert, A. (2010) Drought-induced changes in development andfunction of grapevine (Vitis spp.) organs and in their hydraulic and non-hydraulic interactions at the whole-plant level: a physiological andmolecular update. Functional Plant Biology 37, 98–116.
Marguerit, E., Brendel, O., Lebon, E., Van Leeuwen, C. and Ollat, N. (2012)Rootstock control of scion transpiration and its acclimation to water deficitare controlled by different genes. The New Phytologist 194, 416–429.
Martínez-Garcia, J.F., Monte, E. and Quall, P.H. (1999) A simple, rapid andquantitative method for preparing Arabidopsis protein extracts forimmunoblot analysis. The Plant Journal 20, 251–257.
Medrano, H., Escalona, J.M., Bota, J., Gulías, J. and Flexas, J. (2002)Regulation of photosynthesis of C3 plants in responses to progressivedrought: stomatal conductance as a reference parameter. Annals ofBotany 89, 895–905.
Mittler, R. and Blumwald, E. (2010) Genetic engineering for modern agri-culture: challenges and perspectives. Annual Review of Plant Biology 61,443–462.
Moore, S. and Stein, W.H. (1954) A modified ninhydrin reagent for thephotometric determination of amino acids and related compounds. TheJournal of Biological Chemistry 211, 907–913.
Morgan, J.M. (1984) Osmoregulation and water stress in higher plants.Annual Review of Plant Physiology 35, 299–319.
Munns, R. and Tester, M. (2008) Mechanisms of salinity tolerance. AnnualReview of Plant Biology 59, 651–681.
Nardini, A., Gascó, A., Raimondo, F., Gortan, E., Lo Gullo, M.A., Caruso, T.and Salleo, S. (2006) Is rootstock-induced dwarfing in olive an effect ofreduced plant hydraulic efficiency? Tree Physiology 26, 1137–1144.
Nelson, N.A. (1944) A photometric adaptation of the Somogyi method forthe determination of glucose. The Journal of Biological Chemistry 153,375–384.
Patakas, A., Nikolaou, N., Zioziou, E., Radoglou, K. and Noitsakis, B. (2002)The role of organic solute and ion accumulation in osmotic adjustment indrought-stressed grapevines. Plant Science 163, 361–367.
Pavlusek, P. (2011) Evaluation of drought tolerance of new grapevine root-stock hybrids. Journal of Environmental Biology 32, 543–549.
Pinheiro, C. and Chaves, M.M. (2011) Photosynthesis and drought: can wemake metabolic connections from available data? Journal of ExperimentalBotany 62, 869–882.
Pou, A., Medrano, H., Tomàs, M., Martorell, S., Ribas-Carbó, M. and Flexas,J. (2012) Anisohydric behaviour in grapevines results in better perfor-mance under moderate water stress and recovery than isohydric behavior.Plant and Soil 359, 335–349.
Raven, J.A. (1985) Regulation of pH and generation of osmolarity invascular plants: a cost-benefit analysis in relation to efficiency of use ofenergy, nitrogen and water. The New Phytologist 101, 25–77.
Salleo, S. and Lo Gullo, M.A. (1989) Xylem cavitation in nodes and inter-nodes of Vitis vinifera L. plants subjected to water stress. Limits of resto-ration of water conduction in cavitated xylem conduits. Kreeb, K.H.,Richter, H. and Hinckley, T.M., eds. Structural and functional responsesto environmental stresses (SPB Academic Publishing: The Hague, TheNetherlands) pp. 33–42.
Schachtman, D.P. and Goodger, J.Q.D. (2008) Chemical root to shootsignaling under drought. Trends in Plant Science 13, 281–287.
Schultz, H.R. and Matthews, M.A. (1988) Resistance to water transport inshoots of Vitis vinifera L. Plant Physiology 88, 718–724.
Schultz, H.R. and Stoll, M. (2010) Some critical issues in environmentalphysiology of grapevines: future challenges and current limitations. Aus-tralian Journal of Grape and Wine Research 16, 4–24.
Shavrukov, Y. (2013) Salt stress or salt shock: which genes are we studying?Journal of Experimental Botany 64, 119–127.
Storey, R., Schachtman, D.P. and Thomas, M.R. (2003) Root structure andcellular chloride, sodium and potassium distribution in salinized grape-vines. Plant, Cell and Environment 26, 789–800.
Swanepoel, J.J. and Southey, J.M. (1989) The influence on rootstock on therooting pattern of the grapevine. South African Journal of Enology andViticulture 10, 23–28.
Szabados, L., Kovács, H., Zilberstein, A. and Bouchereau, A. (2011) Plants inextreme environments: importance of protective compounds in stresstolerance. Turkan, I., ed. Plant responses to drought and salinity stressdevelopments in a post-genomic era, Advances in Botanical Research 57(Academic Press: London, England) pp. 105–150.
Tandonnet, J.P., Cookson, S.J., Vivin, P. and Ollat, N. (2010) Scion genotypebiomass allocation and root development in grafted grapevine. AustralianJournal of Grape and Wine Research 16, 290–300.
Tattersall, E.A.R., Grimplet, J., DeLuc, L., Wheatley, M.D., Vincent, D.,Osborne, C., Ergül, E., Lomen, L., Blank, R.R., Schlauch, A.K., Cushman,C.J. and Cramer, G.R. (2007) Transcript abundance profiles reveal largerand more complex responses of grapevine to chilling compared to osmoticand salinity stress. Functional and Integrative Genomics 7, 317–333.
Tomás, M., Medrano, H., Pou, A., Escalona, J.M., Martorell, S., Ribas-Carbó,M. and Flexas, J. (2012) Water-use efficiency in grapevine cultivars grownunder controlled conditions: effects of water stress at the leaf and whole-plant level. Australian Journal of Grape and Wine Research 18, 164–172.
Tyerman, S.D., Vandeleur, R.K., Shelden, M.C., Tilbrook, J., Mayo, G.,Gilliham, M. and Kaiser, B.N. (2009) Water transport and aquaporins ingrapevine. Roubelakis-Angelakis, K.A., ed. Grapevine molecular physiol-ogy & biotechnology, 2nd edn (Kluwer Academic Publishers: Dordrecht,The Netherlands) pp. 73–104.
Vandeleur, R.K., Mayo, G., Shelden, M.C., Gilliham, M., Kaiser, B.N. andTyerman, S.D. (2009) The role of plasma membrane intrinsic proteinaquaporins in water transport through roots: diurnal and drought stressresponses reveal different strategies between isohydric and anisohydriccultivars of grapevine. Plant Physiology 149, 445–460.
Vivier, M.A. and Pretorius, I.S. (2002) Genetically tailored grapevines forthe wine industry. Trends in Biotechnology 20, 472–478.
Williams, L.E. (2012) Effects of applied water amounts at various fractions ofevapotranspiration (ETc) on leaf gas exchange of Thompson seedlessgrapevines. Australian Journal of Grape and Wine Research 18, 100–108.
Williams, L.E., Grimes, D.W. and Phene, C.J. (2010) The effects of appliedwater at various fractions of measured evapotranspiration on water rela-tions and vegetative growth of Thompson Seedless grapevines. IrrigationScience 28, 221–232.
Yeo, A.R. (1983) Salinity resistance: physiologies and prices. PhysiologiaPlantarum 58, 214–222.
Zhang, J.L., Flowers, T.J. and Wang, S.M. (2010) Mechanisms of sodiumuptake by roots of higher plants. Plant and Soil 326, 45–60.
Zhang, X., Waker, R.R., Stevens, R.M. and Prior, L.D. (2002) Yield-salinityrelationships of different grapevine (Vitis vinifera L.) scion-rootstock com-binations. Australian Journal of Grape and Wine Research 8, 150–156.
Zhu, J.-K. (2002) Salt and drought stress signal transduction in plants.Annual Review of Plant Biology 53, 247–273.
Manuscript received: 21 June 2013
Revised manuscript received: 20 September 2013
Accepted: 13 October 2013
14 Response of two genotypes to drought and salinity Australian Journal of Grape and Wine Research 2014
© 2014 Australian Society of Viticulture and Oenology Inc.