Embed Size (px)
Citation preview
Gardner & Escalante-Semerena the protein acetyltransferase (AcuA) enzyme of B. subtilis 1Supplemental Information
Biochemical and mutational analyses of AcuA, the acetyltransferase enzyme thatcontrols the activity of the acetyl-CoA synthetase (AcsA) in Bacillus subtilis
Jeffrey G. Gardner and Jorge C. Escalante-Semerena*Department of Bacteriology, University of Wisconsin-Madison
MATERIALS AND METHODSBacterial strains, media, and growth conditions. A list of strains and plasmids and their genotypes isprovided in Table 2. S. enterica strains were grown on no-carbon essential (NCE) medium (1)supplemented with MgSO4 (1 mM) and L-methionine (0.5 mM). Acetate (10 mM) was used as sole carbonand energy source for cells grown in minimal medium. L-(+)-arabinose (500 µM) or isopropyl-b-D-thiogalactoside (IPTG, 400 µM) was used to induce expression of cloned genes. Lysogenic broth (LB) (3, 4)was used as rich medium. Antibiotics were used as needed at the following concentrations: ampicillin (Amp),100 (µg/ml); tetracylcline (Tet), 15 (µg/ml). All chemicals were purchased from Sigma.Recombinant DNA techniquesPCR gene amplifications. All amplifications used TripleMaster polymerase (Eppendorf) and were performed in anEppendorf Mastercycler gradient PCR thermal cycler (Brinkmann Instruments). Primers were purchased fromIntegrated DNA Technologies.Introduction of single-base changes into acuA. Random single point mutations were introduced into the acuAcoding sequence using a commercially available E. coli mutator strain as per manufacturer’s instructions(XL-1 Red mutagenesis kit, Stratagene).Plasmid constructions. The cloning protocol for the acuA+ allele of B. subtilis under the control of thearabinose-inducible PBAD promoter has been described (5). Restriction enzymes were purchased fromPromega.Mobilization of plasmids. Plasmids were introduced into S. enterica strains by transformation (9), or byelectroporation (8).DNA sequencing. DNA sequences were determined using nonradioactive BigDye® protocols (ABI-PRISM),and the reactions were resolved and analyzed at the Biotechnology Center of the University of Wisconsin-Madison.Biochemical techniquesPurification of AcuABs proteins. AcuABs proteins were overproduced in E. coli strain ER2566. Cells werebroken using a French press (Spectronic Unicam) at 1.26 kPa. Cell debris was removed by centrifugation at12,000 xg for 45 min at 4°C in an Avanti J-25I refrigerated centrifuge (Beckman-Coulter) using a J25-5rotor; the clarified cell extract was filtered using a 45-µm filter syringe. Extract was loaded onto a 5-ml chitinaffinity chromatography column (New England Biolabs), which was developed as per manufacturer’sinstructions. Purified proteins (>95% homogeneous, data not shown) were dialyzed against 4-(2-hydroxyethyl)-1-piperazineethanesulfonic acid buffer (HEPES, 0.05 M, pH 7.5) containing KCl (0.1 M) andglycerol (25% v/v). Protein samples (100 µl) were flash frozen in liquid nitrogen and stored at -80°C untilused. The yield of wild-type and variant AcuA proteins was 1-2 mg per liter of culture, consistent withpreviously reported work (5).Protein purity analysis. Protein purity was assessed by SDS-PAGE followed by densitometry usingFotodyne’s FOTO/Eclipse® Electronic Documentation & Analysis System, including software packagesFOTO/Analyst® PC Image v5.0 and TotalLab™ 1D gel analysis v2003 from NonLinear Dynamics, Ltd.Gel permeation studies. The oligomeric state of AcuABs was determinted by FPLC using Superdex-200column (Amersham) with a mobile phase of sodium phosphate (50 mM, pH 7.4) containing NaCl (0.15 M).The column was equilibrated and run at a flow-rate of 0.5 ml/min. Molecular mass standards (Bio-Rad Labs)were used as per manufacturer’s instructions to establish a standard curve. The compensation volume was 0.5ml and the empty loop volume was 0.2 ml. Protein (elution was monitored by following the absorbance of
Gardner & Escalante-Semerena the protein acetyltransferase (AcuA) enzyme of B. subtilis 2Supplemental Information
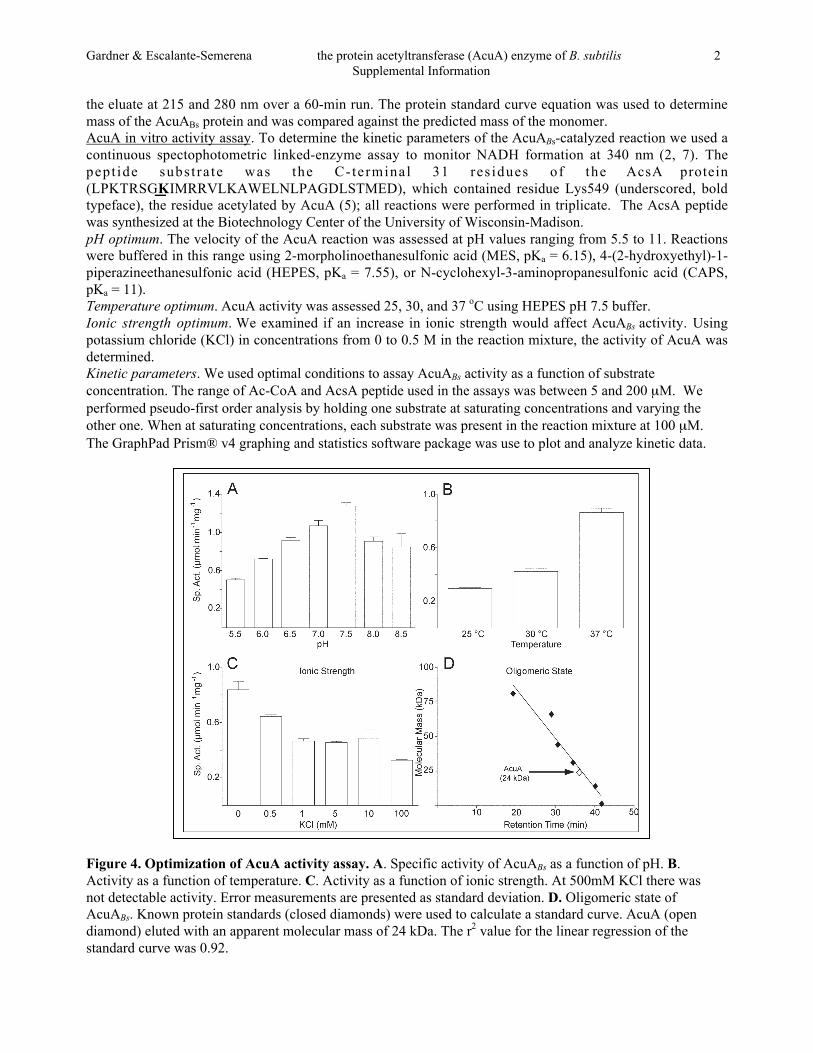
the eluate at 215 and 280 nm over a 60-min run. The protein standard curve equation was used to determinemass of the AcuABs protein and was compared against the predicted mass of the monomer.AcuA in vitro activity assay. To determine the kinetic parameters of the AcuABs-catalyzed reaction we used acontinuous spectophotometric linked-enzyme assay to monitor NADH formation at 340 nm (2, 7). Thepept ide subs t ra te was the C- terminal 31 res idues of the AcsA protein(LPKTRSGKIMRRVLKAWELNLPAGDLSTMED), which contained residue Lys549 (underscored, boldtypeface), the residue acetylated by AcuA (5); all reactions were performed in triplicate. The AcsA peptidewas synthesized at the Biotechnology Center of the University of Wisconsin-Madison.pH optimum. The velocity of the AcuA reaction was assessed at pH values ranging from 5.5 to 11. Reactionswere buffered in this range using 2-morpholinoethanesulfonic acid (MES, pKa = 6.15), 4-(2-hydroxyethyl)-1-piperazineethanesulfonic acid (HEPES, pKa = 7.55), or N-cyclohexyl-3-aminopropanesulfonic acid (CAPS,pKa = 11).Temperature optimum. AcuA activity was assessed 25, 30, and 37 oC using HEPES pH 7.5 buffer.Ionic strength optimum. We examined if an increase in ionic strength would affect AcuABs activity. Usingpotassium chloride (KCl) in concentrations from 0 to 0.5 M in the reaction mixture, the activity of AcuA wasdetermined.Kinetic parameters. We used optimal conditions to assay AcuABs activity as a function of substrateconcentration. The range of Ac-CoA and AcsA peptide used in the assays was between 5 and 200 µM. Weperformed pseudo-first order analysis by holding one substrate at saturating concentrations and varying theother one. When at saturating concentrations, each substrate was present in the reaction mixture at 100 µM.The GraphPad Prism® v4 graphing and statistics software package was use to plot and analyze kinetic data.
Figure 4. Optimization of AcuA activity assay. A. Specific activity of AcuABs as a function of pH. B.Activity as a function of temperature. C. Activity as a function of ionic strength. At 500mM KCl there wasnot detectable activity. Error measurements are presented as standard deviation. D. Oligomeric state ofAcuABs. Known protein standards (closed diamonds) were used to calculate a standard curve. AcuA (opendiamond) eluted with an apparent molecular mass of 24 kDa. The r2 value for the linear regression of thestandard curve was 0.92.
Gardner & Escalante-Semerena the protein acetyltransferase (AcuA) enzyme of B. subtilis 3Supplemental Information
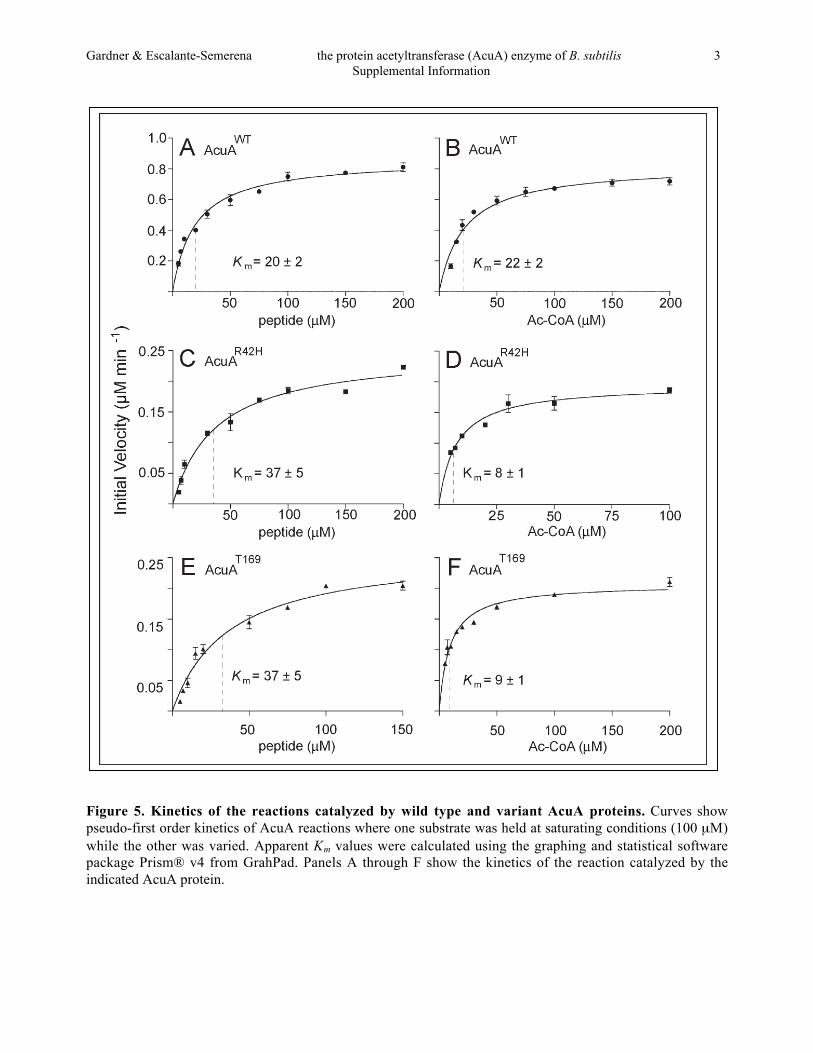
Figure 5. Kinetics of the reactions catalyzed by wild type and variant AcuA proteins. Curves showpseudo-first order kinetics of AcuA reactions where one substrate was held at saturating conditions (100 µM)while the other was varied. Apparent Km values were calculated using the graphing and statistical softwarepackage Prism® v4 from GrahPad. Panels A through F show the kinetics of the reaction catalyzed by theindicated AcuA protein.
Gardner & Escalante-Semerena the protein acetyltransferase (AcuA) enzyme of B. subtilis 4Supplemental Information
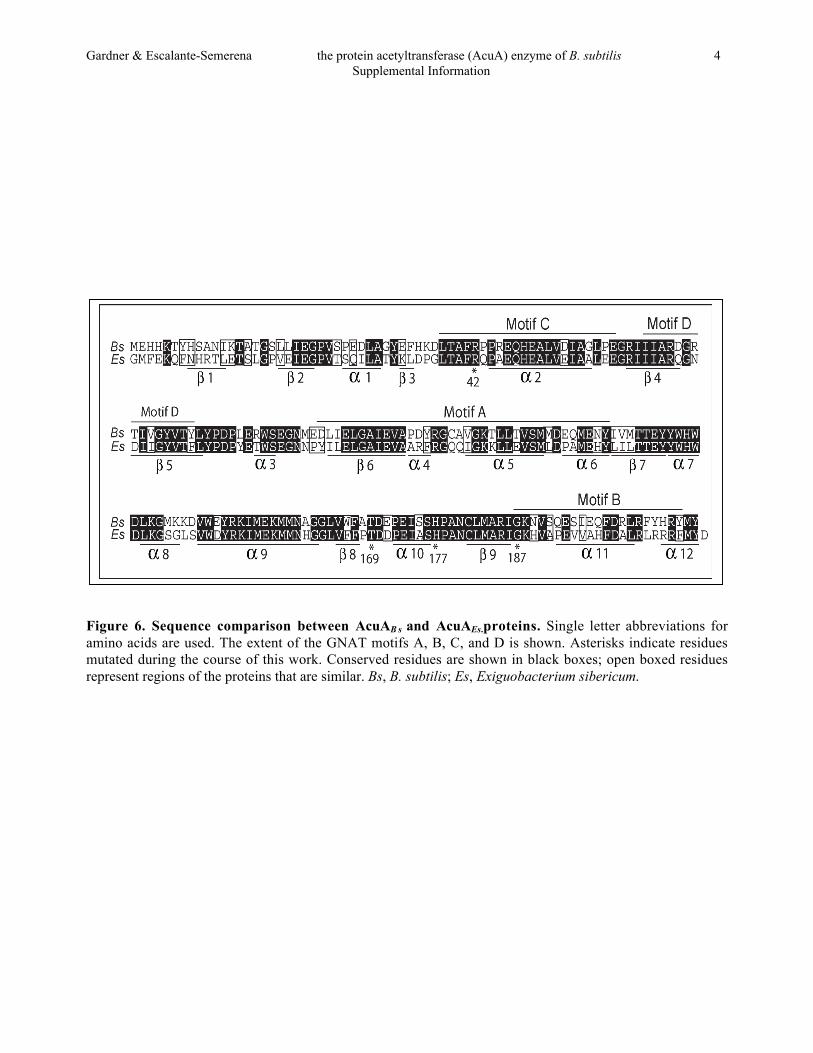
Figure 6. Sequence comparison between AcuAB s and AcuAEs.proteins. Single letter abbreviations foramino acids are used. The extent of the GNAT motifs A, B, C, and D is shown. Asterisks indicate residuesmutated during the course of this work. Conserved residues are shown in black boxes; open boxed residuesrepresent regions of the proteins that are similar. Bs, B. subtilis; Es, Exiguobacterium sibericum.
Gardner & Escalante-Semerena the protein acetyltransferase (AcuA) enzyme of B. subtilis 5Supplemental Information
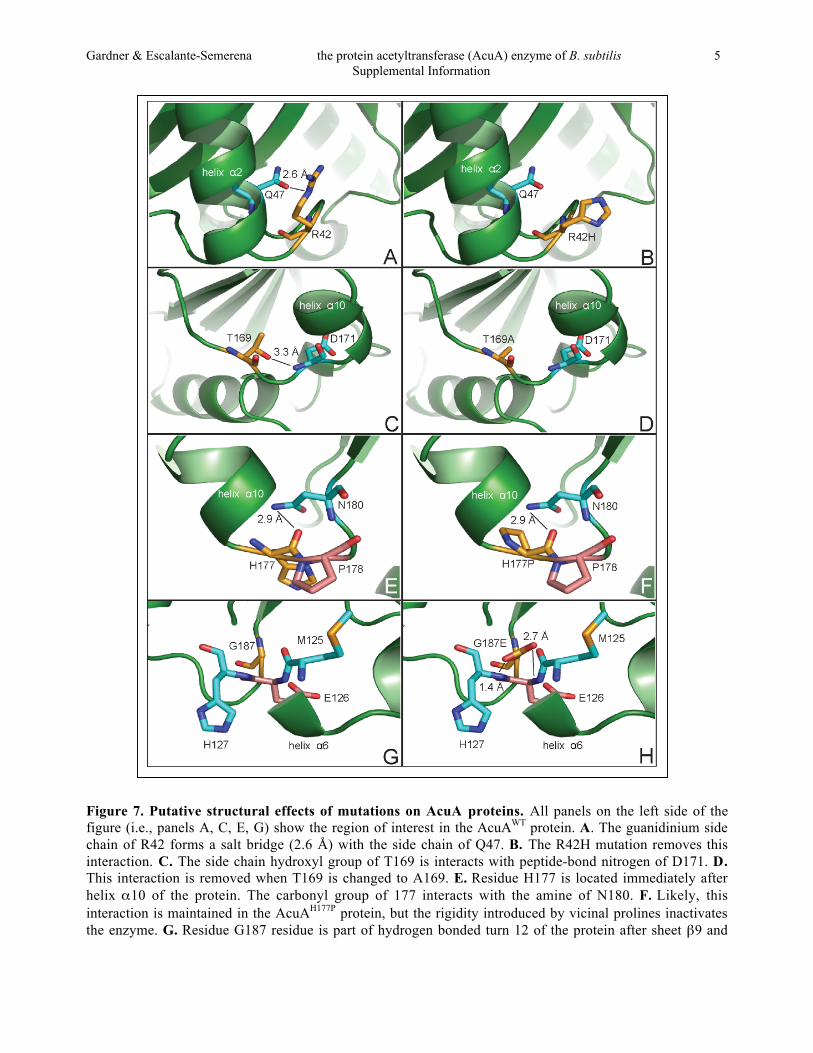
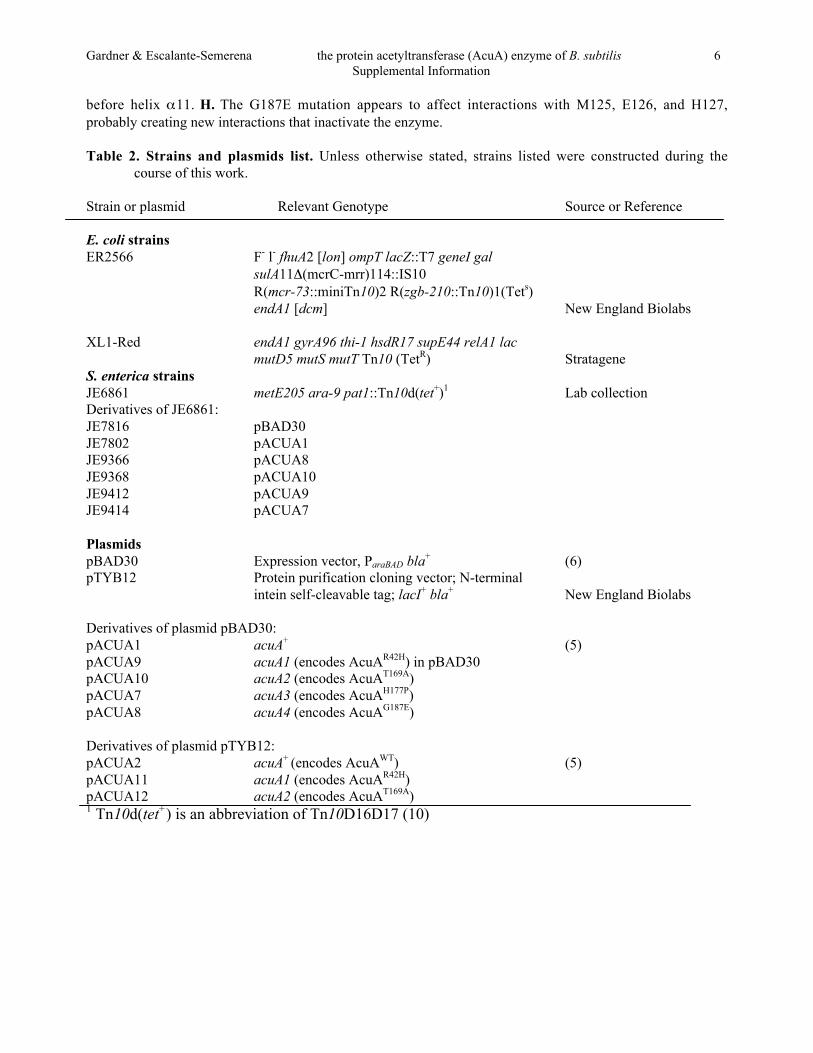
Figure 7. Putative structural effects of mutations on AcuA proteins. All panels on the left side of thefigure (i.e., panels A, C, E, G) show the region of interest in the AcuAWT protein. A. The guanidinium sidechain of R42 forms a salt bridge (2.6 Å) with the side chain of Q47. B. The R42H mutation removes thisinteraction. C. The side chain hydroxyl group of T169 is interacts with peptide-bond nitrogen of D171. D.This interaction is removed when T169 is changed to A169. E. Residue H177 is located immediately afterhelix α10 of the protein. The carbonyl group of 177 interacts with the amine of N180. F. Likely, thisinteraction is maintained in the AcuAH177P protein, but the rigidity introduced by vicinal prolines inactivatesthe enzyme. G. Residue G187 residue is part of hydrogen bonded turn 12 of the protein after sheet β9 and
Gardner & Escalante-Semerena the protein acetyltransferase (AcuA) enzyme of B. subtilis 6Supplemental Information
before helix α11. H. The G187E mutation appears to affect interactions with M125, E126, and H127,probably creating new interactions that inactivate the enzyme.
Table 2. Strains and plasmids list. Unless otherwise stated, strains listed were constructed during thecourse of this work.
Strain or plasmid Relevant Genotype Source or Reference
E. coli strainsER2566 F- l- fhuA2 [lon] ompT lacZ::T7 geneI gal
sulA11Δ(mcrC-mrr)114::IS10R(mcr-73::miniTn10)2 R(zgb-210::Tn10)1(Tets)endA1 [dcm] New England Biolabs
XL1-Red endA1 gyrA96 thi-1 hsdR17 supE44 relA1 lacmutD5 mutS mutT Tn10 (TetR) Stratagene
S. enterica strainsJE6861 metE205 ara-9 pat1::Tn10d(tet+)1 Lab collectionDerivatives of JE6861:JE7816 pBAD30 JE7802 pACUA1JE9366 pACUA8JE9368 pACUA10JE9412 pACUA9JE9414 pACUA7
PlasmidspBAD30 Expression vector, ParaBAD bla+ (6)pTYB12 Protein purification cloning vector; N-terminal
intein self-cleavable tag; lacI+ bla+ New England Biolabs
Derivatives of plasmid pBAD30:pACUA1 acuA+ (5)pACUA9 acuA1 (encodes AcuAR42H) in pBAD30pACUA10 acuA2 (encodes AcuAT169A)pACUA7 acuA3 (encodes AcuAH177P)pACUA8 acuA4 (encodes AcuAG187E)
Derivatives of plasmid pTYB12:pACUA2 acuA+ (encodes AcuAWT) (5)pACUA11 acuA1 (encodes AcuAR42H)pACUA12 acuA2 (encodes AcuAT169A)1 Tn10d(tet+) is an abbreviation of Tn10D16D17 (10)
Gardner & Escalante-Semerena the protein acetyltransferase (AcuA) enzyme of B. subtilis 7Supplemental Information
REFERENCES
1. Berkowitz, D., J. M. Hushon, H. J. Whitfield, Jr., J. Roth, and B. N. Ames. 1968. Procedure foridentifying nonsense mutations. J. Bacteriol. 96:215-220.
2. Berndsen, C. E., and J. M. Denu. 2005. Assays for mechanistic investigations of protein/histoneacetyltransferases. Methods 36:321-331.
3. Bertani, G. 2004. Lysogeny at mid-twentieth century: P1, P2, and other experimental systems. J.Bacteriol. 186:595-600.
4. Bertani, G. 1951. Studies on lysogenesis. I. The mode of phage liberation by lysogenic Escherichiacoli. J. Bacteriol. 62:293-300.
5. Gardner, J. G., F. J. Grundy, T. M. Henkin, and J. C. Escalante-Semerena. 2006. Control ofacetyl-coenzyme A synthetase (AcsA) activity by acetylation/deacetylation without NAD(+)involvement in Bacillus subtilis. J. Bacteriol. 188:5460-5468.
6. Guzman, L. M., D. Belin, M. J. Carson, and J. Beckwith. 1995. Tight regulation, modulation, andhigh-level expression by vectors containing the arabinose PBAD promoter. J. Bacteriol. 177:4121-4130.
7. Kim, Y., K. G. Tanner, and J. M. Denu. 2000. A continuous, nonradioactive assay for histoneacetyltransferases. Anal. Biochem. 280:308-314.
8. O'Toole, G. A., M. R. Rondon, and J. C. Escalante-Semerena. 1993. Analysis of mutants ofdefective in the synthesis of the nucleotide loop of cobalamin. J. Bacteriol. 175:3317-3326.
9. Ryu, J., and R. J. Hartin. 1990. Quick transformation in Salmonella typhimurium LT2.Biotechniques 8:43-45.
10. Way, J. C., M. A. Davis, D. Morisato, D. E. Roberts, and N. Kleckner. 1984. New Tn10derivatives for transposon mutagenesis and for construction of lacZ operon fusions by transposition.Gene 32:369-379.