Embed Size (px)
Citation preview
Biochar Production for
Project Reporting Protocol
GHG Emission Reduction Accounting
Version 3.0
August 2014
Biochar Production for Project Reporting Protocol August 2014
Version 3.0
Page 2 of 82
CONTENTS
1.0 Introduction .......................................................................................................................... 5
2.0 Project .................................................................................................................................... 6
2.1 Project Definition ............................................................................................................. 6
2.2 Project Proponent ............................................................................................................. 7
2.3 Methane and Nitrous Oxide Global Warming Potential Characterization Factors .......... 7
3.0 Eligibility ................................................................................................................................. 8
3.1 Biochar production from Qualified Operations ............................................................... 8
3.2 Additionality..................................................................................................................... 8
3.3 Biochar Production and Product Use ............................................................................... 9
3.4 Location ............................................................................................................................ 9
3.5 Project Start Date ............................................................................................................. 9
4.0 Assessment Boundary ........................................................................................................... 10
4.1 Baseline, Business as Usual ........................................................................................... 10
4.2 Biochar Production Project ............................................................................................ 10
5.0 Calculation Methods .............................................................................................................. 11
5.1 Project Emissions ........................................................................................................... 11
5.1.1 Feedstock Transportation ........................................................................................ 11
5.1.2 Processing and Drying Feedstock ........................................................................... 12
5.1.3 Auxiliary Fuel Combustion..................................................................................... 12
5.1.4 Electricity Consumption ......................................................................................... 13
5.1.5 Non-Biogenic Thermochemical Conversion .......................................................... 13
5.1.6 Fuel for Processing Bio-Oil .................................................................................... 13
5.1.7 Fuel for Processing Syngas ..................................................................................... 14
5.1.8 Fuel for Processing and/or Blending Biochar ......................................................... 14
5.1.9 Bio-Oil Use ............................................................................................................. 15
5.1.10 Syngas Use .............................................................................................................. 15
5.1.11 Biochar in Situ ........................................................................................................ 16
5.2 Baseline Emissions ......................................................................................................... 17
5.2.1 Default Baseline ...................................................................................................... 17
5.2.2 Alternative Baseline ................................................................................................ 17
Biochar Production for Project Reporting Protocol August 2014
Version 3.0
Page 3 of 82
5.2.3 Bioenergy Production (Default Project) ................................................................. 19
5.2.4 Aerobic Decomposition (Alternative) ..................................................................... 19
5.2.5 Anaerobic Decomposition in a SWDS (Alternative) .............................................. 20
5.2.6 Combustion (Alternative) ....................................................................................... 21
5.2.7 Electricity Production ............................................................................................. 21
5.2.9 Oil ........................................................................................................................... 22
5.2.10 Gas .......................................................................................................................... 23
5.2.11 Heat ......................................................................................................................... 23
5.3 Leakage .......................................................................................................................... 24
5.4 Summary of GHG Emission Reduction and/or Removals ............................................. 25
6.0 Monitoring ............................................................................................................................. 27
7.0 Reporting and Recordkeeping ............................................................................................... 28
7.1 Project Commencement ................................................................................................. 28
7.2 Recordkeeping ................................................................................................................ 28
7.3 Reporting ........................................................................................................................ 28
8.0 Verification ............................................................................................................................ 29
9.0 Glossary of Terms ................................................................................................................. 30
10.0 References ............................................................................................................................. 35
11.0 Emission Factors ................................................................................................................... 38
12.0 Attachments ........................................................................................................................... 42
Figure 1.0: System Boundary Definition .................................................................................. 42
Attachment A: Project Definition ............................................................................................. 43
Attachment B: Monitoring and Recordkeeping ....................................................................... 44
Attachment C: Reporting .......................................................................................................... 49
13.0 Appendix ............................................................................................................................... 53
Appendix A: Standard test method for estimating Biochar carbon stability (BC+100) .............. 53
Appendix B: Justification for the “Standard test method for estimating Biochar carbon stability
(BC +100) .................................................................................................................................. 61
Biochar Production for Project Reporting Protocol August 2014
Version 3.0
Page 4 of 82
Tables
Table 1.0: Baseline Conditions 18
Table 2.0: Biochar Production Project 38
Figures
Figure 1.0: System Boundary Definition 42
Attachments
Attachment A: Project Definition 43
Attachment B: Monitoring and Recordkeeping 44
Attachment C: Reporting 49
Appendix
Appendix A: Standard test method for estimating Biochar carbon stability (BC +100) 53
Appendix B: Justification for the “Standard test method for estimating Biochar carbon
Stability (BC +100)” 61
Biochar Production for Project Reporting Protocol August 2014
Version 3.0
Page 5 of 82
1.0 Introduction
This protocol provides accounting, reporting, and monitoring procedures to determine
greenhouse gas (GHG) reductions associated with biochar production and use as defined herein.
Biochar is produced through the Thermochemical Conversion of biomass in the absence of
oxygen. Under this protocol, potential Feedstocks are defined as woody biomass and include
forestry and agriculture residues, along with a limited set of other biomass-based materials
approved for use under the International Biochar Initiative’s (IBI) Biochar Standards (2013) and
as defined herein. In the absence of Thermochemical Conversion, these Feedstocks would
otherwise be combusted or decompose, releasing carbon dioxide (if combustion or
decomposition under aerobic conditions occurs) or methane (if decomposition occurs under
anaerobic conditions).
Thermochemical Conversion physically and chemically transforms the carbon in raw biomass
into a more recalcitrant form, which can be applied to soil for long-term sequestration. A large
portion of the Fixed Carbon in Biochar, as measured using the testing methods identified herein,
is sequestered for a time period well in excess of 100 years. By transforming the biomass carbon
to a highly stable form that resists degradation, and ensuring that it remains in this form,
emissions from the decomposition or combustion of feedstocks are significantly reduced.
In addition to this sequestration, Thermochemical Conversion can also generate bio-oil and
syngas. These fuels may be used as renewable energy and thus reduces anthropogenic
greenhouse gas (GHG) emissions by offsetting fossil fuel use.
This protocol quantifies these GHG emission reductions and sequestration benefits that result
from the implementation of Biochar projects.
Biochar Production for Project Reporting Protocol August 2014
Version 3.0
Page 6 of 82
2.0 Project
Under this protocol Biochar feedstock is restricted to woody biomass that is generated from
forestry, agriculture, urban landscaping, and related industries. Biochar is a solid material
obtained from the carbonisation of biomass. Alternatives to biochar production include open
burning, decay and decomposition in the field, or landfill. Eligible biomass residues shall reduce
wildfire fuel loads and include, but are not limited to forestry and agricultural residues including:
Forest slash (non-merchantable) remains from forest management activities
including timber harvesting or forest thinning and fuel hazard reduction. These
include small trees, brush, tree tops, and branches.
Defensible space clearing residues (brush, tree branches and trunks, clippings).
Orchard and vineyard removals and prunings.
Field straws and stalks.
Urban prunings/cuttings residues.
Applicable Biochar uses include as a grow media and/or soil amendment. The production of the
Biochar may also result in the production of heat, electricity, oil and/or gas.
Sources of GHG emissions from a biochar production project are shown in Table 1.
2.1 Project Definition
For this protocol, the GHG reduction project involves the creation of Biochar, where otherwise
under baseline business as usual conditions, the various feedstock would be left to decay, be
combusted via open pile burning, transported to a local landfill for aerobic decay or used for
bioenergy production.
The project developer must provide information defining the project operations, including:
Location where the biochar feedstock is generated.
Operation for which the biochar feedstock is a byproduct, i.e. how is the biochar
feedstock generated.
Generation (rate and timing) of the biochar feedstock.
Composition of the biochar feedstock.
Historical, current, and anticipated future, disposal practice for the biochar feedstock
in the absence of the proposed biochar feedstock to energy project.
Biochar feedstock processing operations prior to transport, such as conveyors,
grinders, and loaders.
Biochar feedstock transportation method.
Location of biochar production facility.
Generation rate of energy from biochar feedstock.
End-uses of the Biochar
Permitting status of the biochar production facility.
Biochar Production for Project Reporting Protocol August 2014
Version 3.0
Page 7 of 82
Documentation of environmental assessments required as part of the biochar feedstock
generating activities. These might include the National Environmental Policy Act
(NEPA), California Environmental Quality Act (CEQA), California Forest Practices
Rules and Regulations, and/or Timber Harvest Plans.
This information must be provided in Attachment A, included as an attachment to the protocol.
Attachment A must be completed, submitted, and approved prior to project commencement.
2.2 Project Proponent
The Project Proponent must demonstrate uncontested and exclusive claim to the ownership of
the GHG benefits derived from the project activities. The Project Proponent must have
documentation to address and resolve all potential claims to GHG benefits by the Feedstock
producer, Biochar producer, retailer and end-user. Any transfer of carbon rights must be clearly
documented.
2.3 Methane and Nitrous Oxide Global Warming Potential Characterization Factors
Methane (CH4) has a global warming potential characterization factor of 25 tons of CO2e per ton
of methane.
Nitrous oxide (N2O) has a global warming potential characterization factor of 298 tons CO2e per
ton N2O.
Biochar Production for Project Reporting Protocol August 2014
Version 3.0
Page 8 of 82
3.0 Eligibility
Projects must meet the following requirements to be eligible for GHG offset credits under this
protocol.
3.1 Biochar production from Qualified Operations
The biomass waste material used for energy recovery must be characterized as:
“Feedstock” – The material undergoing thermochemical conversion processes to
create Biochar. Feedstock materials for Biochar consist of Biogenic materials, but
may also contain Diluents and no more than 2% by dry weight of Contaminants.
(International Biochar Initiative 2013)
“Excess waste” – The material must be an excess waste byproduct that, in the absence
of the project, would be left to decay, be combusted via open pile burning,
transported to a local landfill for aerobic decay or used for bioenergy production.
“Sustainable” – The material must be a byproduct of operations which:
o Protect or enhance long-term productivity of the site by maintaining or
improving soil productivity, water quality, wildlife habitat, and biodiversity.
o Meet all local, state, and federal environmental regulations, including
National Environmental Policy Act (NEPA), California Environmental
Quality Act (CEQA), California Forest Practices Rules and Regulations,
and/or Timber Harvest Plans.
3.2 Additionality
Project GHG emission reductions must be “additional” to what would have otherwise occurred.
It must be demonstrated that the existing, baseline business as usual disposal practice of the
biochar feedstocks at the beginning date of the project is through either:
Open burning in the vicinity of the production site. It must be demonstrated that this
disposal practice is a legally allowable method under the local Air District and the
State and that an open pile burn permit has been or could be obtained.
Decay and decomposition in the vicinity of the production site, with no commercial
value derived from the end-product.
Landfilled.
In the alternative, the baseline assumption will be that the biomass was being used for the
production of bioenergy, as outlined under the default baseline calculations in this protocol.
The project developer must demonstrate there are no alternative uses for the biochar feedstock,
other than those listed above. It must not be currently economical within the local market to
utilize or sell the biochar feedstock as a product or process feedstock. This requires providing
Biochar Production for Project Reporting Protocol August 2014
Version 3.0
Page 9 of 82
documentation of previous historical disposal practices, current disposal practices in the absence
of the proposed project, and future planned/anticipated disposal practices.
3.3 Biochar Production and Product Use
The Biochar production facility must acquire all applicable permits for operation. Biochar
products must be handled and used in a manner that complies with all local, state and federal
regulations. Project proponents are expected to present relevant documentation to indicate that
regulatory requirements have been met upon request from governing authorities.
Co and end-products, including but not limited to Biochar, bio oil, biogas, heat and electricity,
must be documented and exempt from claims on other projects to ensure accuracy in GHG
accounting and quantification of other mitigation activities.
3.4 Location
This protocol is applicable to biochar production project operations that are located within the
state of California.
3.5 Project Start Date
Projects are eligible which begin after the date of approval of the protocol, or after January 1,
2007 for qualifying early action projects, and after the necessary project initiation forms have
been completed and approved (including Attachment A).
Biochar Production for Project Reporting Protocol August 2014
Version 3.0
Page 10 of 82
4.0 Assessment Boundary
The biochar feedstock project boundary is defined to include all GHG emissions from operations
that are the result of the biochar production project. The physical boundary of the biochar
feedstock for energy project is shown in Figure 1. GHG emissions must be accounted for
operations, as detailed in Table 2.0, including:
4.1 Baseline, Business as Usual
Open biomass burning. Includes quantification of CO2, CH4, and N2O.
Decay and decomposition of biomass disposal in field. Includes quantification of CH4
and N2O.
Landfill. Includes quantification of CH4.
In the alternative, the baseline assumption will be that the biomass was being used for the
production of bioenergy, as outlined under the default baseline calculations in this protocol.
Alternative heat and electricity production as well as fossil fuel (oil and gas) use. Includes
quantification of CO2, CH4, and N2O.
4.2 Biochar Production Project
Biomass Fossil fuel fired engines used to facilitate transport of biochar feedstock from the
site of generation to the biochar production facility. Includes quantification of CO2, CH4
and N2O.
Biochar feedstock usage at the biochar production facility. For biomass combustion
boilers, quantification of CO2 is not required as it is considered biogenic. The
quantification of CH4 and N2O is required for the combustor. Includes quantification of
CH4 and N2O.
Fossil fuel fired engines used at biochar production facility for operation of auxiliary
equipment, such as conveyors, loaders, processing equipment and blending equipment that
would not have been used otherwise in the absence of the project. Includes quantification
of CO2, CH4 and N2O emissions.
Bio-oil and syngas eventual use either on- or off-site. Quantification of the CO2 is not
required as it is considered biogenic. The quantification of CH4 and N2O is required for the
combustor. Includes quantification of CH4 and N2O.
Sequestration of carbon in biochar that is secured for a period of greater than 100 years.
Includes quantification of CO2.
Processing of non-biogenic feedstock elements that may be present in the feedstock.
Includes quantification of CO2, CH4 and N2O emissions.
Biochar Production for Project Reporting Protocol August 2014
Version 3.0
Page 11 of 82
5.0 Calculation Methods
5.1 Project Emissions
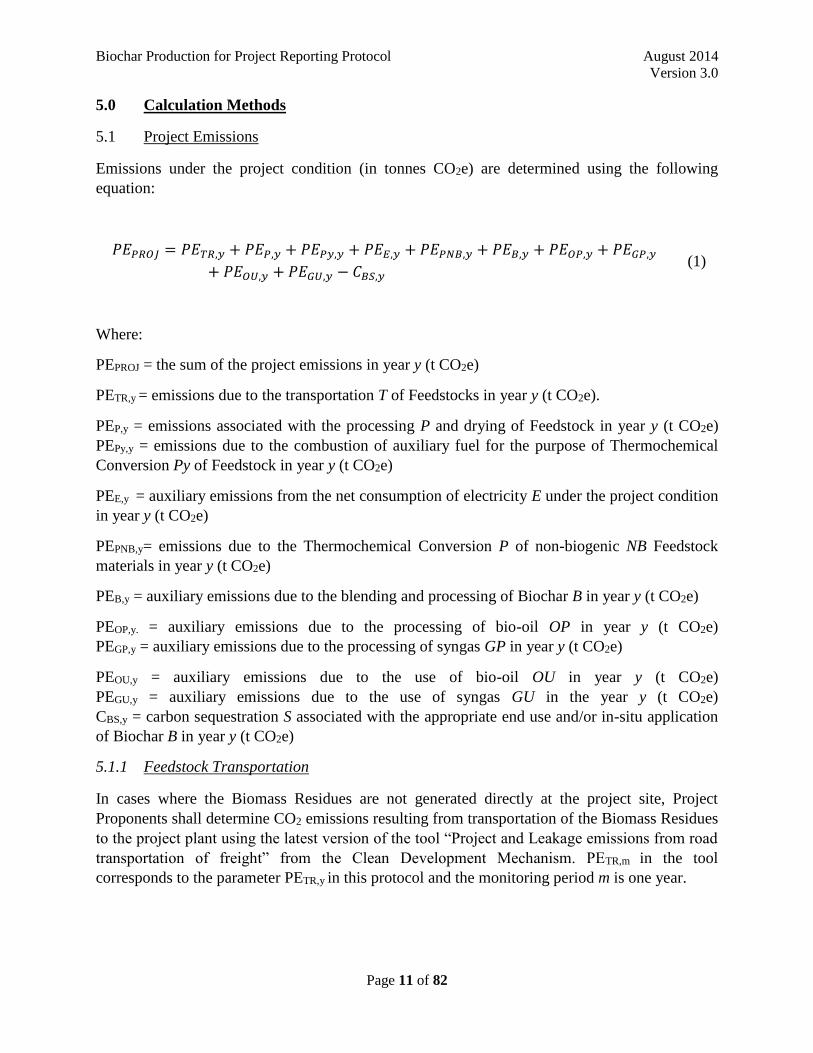
Emissions under the project condition (in tonnes CO2e) are determined using the following
equation:
𝑃𝐸𝑃𝑅𝑂𝐽 = 𝑃𝐸𝑇𝑅,𝑦 + 𝑃𝐸𝑃,𝑦 + 𝑃𝐸𝑃𝑦,𝑦 + 𝑃𝐸𝐸,𝑦 + 𝑃𝐸𝑃𝑁𝐵,𝑦 + 𝑃𝐸𝐵,𝑦 + 𝑃𝐸𝑂𝑃,𝑦 + 𝑃𝐸𝐺𝑃,𝑦
+ 𝑃𝐸𝑂𝑈,𝑦 + 𝑃𝐸𝐺𝑈,𝑦 − 𝐶𝐵𝑆,𝑦 (1)
Where:
PEPROJ = the sum of the project emissions in year y (t CO2e)
PETR,y = emissions due to the transportation T of Feedstocks in year y (t CO2e).
PEP,y = emissions associated with the processing P and drying of Feedstock in year y (t CO2e)
PEPy,y = emissions due to the combustion of auxiliary fuel for the purpose of Thermochemical
Conversion Py of Feedstock in year y (t CO2e)
PEE,y = auxiliary emissions from the net consumption of electricity E under the project condition
in year y (t CO2e)
PEPNB,y= emissions due to the Thermochemical Conversion P of non-biogenic NB Feedstock
materials in year y (t CO2e)
PEB,y = auxiliary emissions due to the blending and processing of Biochar B in year y (t CO2e)
PEOP,y. = auxiliary emissions due to the processing of bio-oil OP in year y (t CO2e)
PEGP,y = auxiliary emissions due to the processing of syngas GP in year y (t CO2e)
PEOU,y = auxiliary emissions due to the use of bio-oil OU in year y (t CO2e)
PEGU,y = auxiliary emissions due to the use of syngas GU in the year y (t CO2e)
CBS,y = carbon sequestration S associated with the appropriate end use and/or in-situ application
of Biochar B in year y (t CO2e)
5.1.1 Feedstock Transportation
In cases where the Biomass Residues are not generated directly at the project site, Project
Proponents shall determine CO2 emissions resulting from transportation of the Biomass Residues
to the project plant using the latest version of the tool “Project and Leakage emissions from road
transportation of freight” from the Clean Development Mechanism. PETR,m in the tool
corresponds to the parameter PETR,y in this protocol and the monitoring period m is one year.
Biochar Production for Project Reporting Protocol August 2014
Version 3.0
Page 12 of 82
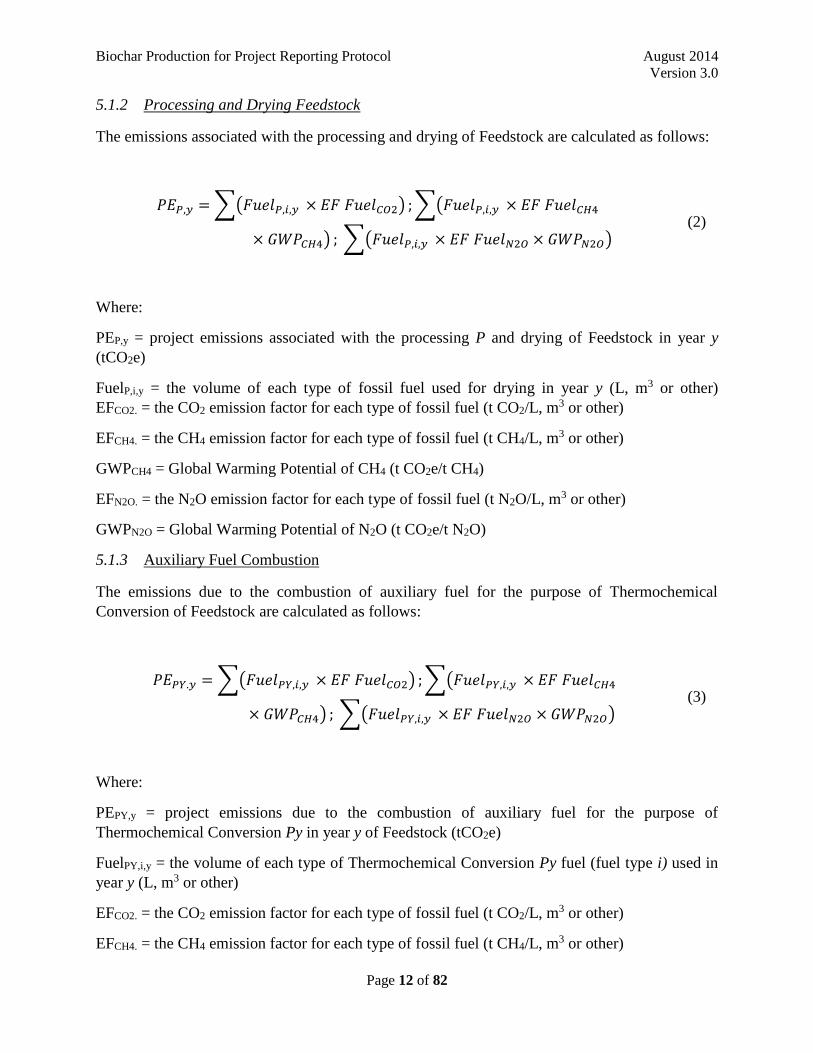
5.1.2 Processing and Drying Feedstock
The emissions associated with the processing and drying of Feedstock are calculated as follows:
𝑃𝐸𝑃,𝑦 = ∑(𝐹𝑢𝑒𝑙𝑃,𝑖,𝑦 × 𝐸𝐹 𝐹𝑢𝑒𝑙𝐶𝑂2) ; ∑(𝐹𝑢𝑒𝑙𝑃,𝑖,𝑦 × 𝐸𝐹 𝐹𝑢𝑒𝑙𝐶𝐻4
× 𝐺𝑊𝑃𝐶𝐻4) ; ∑(𝐹𝑢𝑒𝑙𝑃,𝑖,𝑦 × 𝐸𝐹 𝐹𝑢𝑒𝑙𝑁2𝑂 × 𝐺𝑊𝑃𝑁2𝑂) (2)
Where:
PEP,y = project emissions associated with the processing P and drying of Feedstock in year y
(tCO2e)
FuelP,i,y = the volume of each type of fossil fuel used for drying in year y (L, m3 or other)
EFCO2. = the CO2 emission factor for each type of fossil fuel (t CO2/L, m3 or other)
EFCH4. = the CH4 emission factor for each type of fossil fuel (t CH4/L, m3 or other)
GWPCH4 = Global Warming Potential of CH4 (t CO2e/t CH4)
EFN2O. = the N2O emission factor for each type of fossil fuel (t N2O/L, m3 or other)
GWPN2O = Global Warming Potential of N2O (t CO2e/t N2O)
5.1.3 Auxiliary Fuel Combustion
The emissions due to the combustion of auxiliary fuel for the purpose of Thermochemical
Conversion of Feedstock are calculated as follows:
𝑃𝐸𝑃𝑌.𝑦 = ∑(𝐹𝑢𝑒𝑙𝑃𝑌,𝑖,𝑦 × 𝐸𝐹 𝐹𝑢𝑒𝑙𝐶𝑂2) ; ∑(𝐹𝑢𝑒𝑙𝑃𝑌,𝑖,𝑦 × 𝐸𝐹 𝐹𝑢𝑒𝑙𝐶𝐻4
× 𝐺𝑊𝑃𝐶𝐻4) ; ∑(𝐹𝑢𝑒𝑙𝑃𝑌,𝑖,𝑦 × 𝐸𝐹 𝐹𝑢𝑒𝑙𝑁2𝑂 × 𝐺𝑊𝑃𝑁2𝑂) (3)
Where:
PEPY,y = project emissions due to the combustion of auxiliary fuel for the purpose of
Thermochemical Conversion Py in year y of Feedstock (tCO2e)
FuelPY,i,y = the volume of each type of Thermochemical Conversion Py fuel (fuel type i) used in
year y (L, m3 or other)
EFCO2. = the CO2 emission factor for each type of fossil fuel (t CO2/L, m3 or other)
EFCH4. = the CH4 emission factor for each type of fossil fuel (t CH4/L, m3 or other)
Biochar Production for Project Reporting Protocol August 2014
Version 3.0
Page 13 of 82
GWPCH4 = Global Warming Potential of CH4 (t CO2e/t CH4)
EFN2O. = the N2O emission factor for each type of fossil fuel (t N2O/L, m3 or other)
GWPN2O = Global Warming Potential of N2O (t CO2e/t N2O)
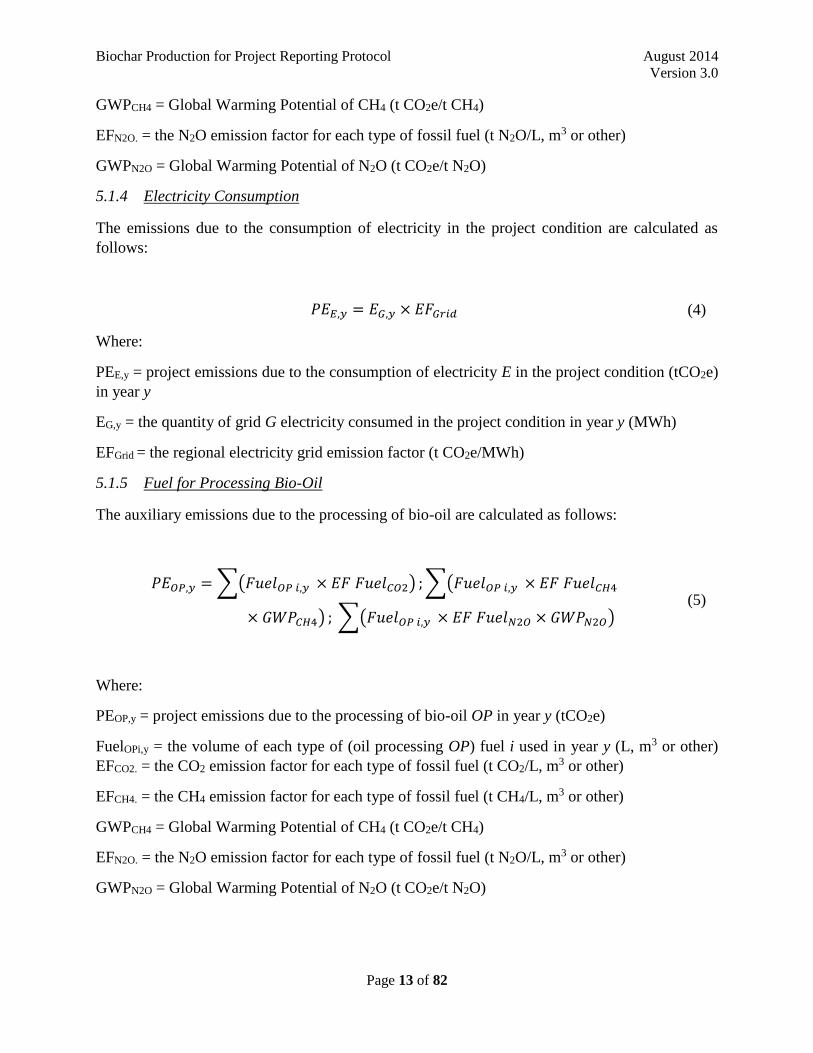
5.1.4 Electricity Consumption
The emissions due to the consumption of electricity in the project condition are calculated as
follows:
𝑃𝐸𝐸,𝑦 = 𝐸𝐺,𝑦 × 𝐸𝐹𝐺𝑟𝑖𝑑 (4)
Where:
PEE,y = project emissions due to the consumption of electricity E in the project condition (tCO2e)
in year y
EG,y = the quantity of grid G electricity consumed in the project condition in year y (MWh)
EFGrid = the regional electricity grid emission factor (t CO2e/MWh)
5.1.5 Fuel for Processing Bio-Oil
The auxiliary emissions due to the processing of bio-oil are calculated as follows:
𝑃𝐸𝑂𝑃,𝑦 = ∑(𝐹𝑢𝑒𝑙𝑂𝑃 𝑖,𝑦 × 𝐸𝐹 𝐹𝑢𝑒𝑙𝐶𝑂2) ; ∑(𝐹𝑢𝑒𝑙𝑂𝑃 𝑖,𝑦 × 𝐸𝐹 𝐹𝑢𝑒𝑙𝐶𝐻4
× 𝐺𝑊𝑃𝐶𝐻4) ; ∑(𝐹𝑢𝑒𝑙𝑂𝑃 𝑖,𝑦 × 𝐸𝐹 𝐹𝑢𝑒𝑙𝑁2𝑂 × 𝐺𝑊𝑃𝑁2𝑂) (5)
Where:
PEOP,y = project emissions due to the processing of bio-oil OP in year y (tCO2e)
FuelOPi,y = the volume of each type of (oil processing OP) fuel i used in year y (L, m3 or other)
EFCO2. = the CO2 emission factor for each type of fossil fuel (t CO2/L, m3 or other)
EFCH4. = the CH4 emission factor for each type of fossil fuel (t CH4/L, m3 or other)
GWPCH4 = Global Warming Potential of CH4 (t CO2e/t CH4)
EFN2O. = the N2O emission factor for each type of fossil fuel (t N2O/L, m3 or other)
GWPN2O = Global Warming Potential of N2O (t CO2e/t N2O)
Biochar Production for Project Reporting Protocol August 2014
Version 3.0
Page 14 of 82
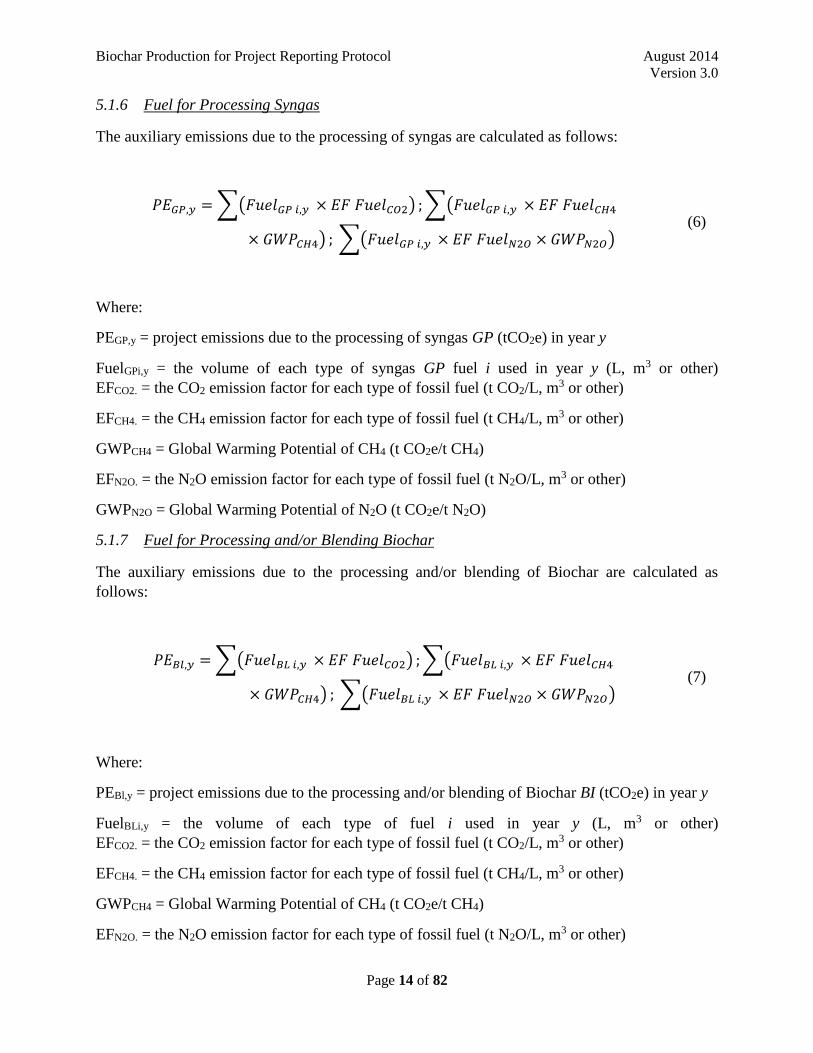
5.1.6 Fuel for Processing Syngas
The auxiliary emissions due to the processing of syngas are calculated as follows:
𝑃𝐸𝐺𝑃,𝑦 = ∑(𝐹𝑢𝑒𝑙𝐺𝑃 𝑖,𝑦 × 𝐸𝐹 𝐹𝑢𝑒𝑙𝐶𝑂2) ; ∑(𝐹𝑢𝑒𝑙𝐺𝑃 𝑖,𝑦 × 𝐸𝐹 𝐹𝑢𝑒𝑙𝐶𝐻4
× 𝐺𝑊𝑃𝐶𝐻4) ; ∑(𝐹𝑢𝑒𝑙𝐺𝑃 𝑖,𝑦 × 𝐸𝐹 𝐹𝑢𝑒𝑙𝑁2𝑂 × 𝐺𝑊𝑃𝑁2𝑂) (6)
Where:
PEGP,y = project emissions due to the processing of syngas GP (tCO2e) in year y
FuelGPi,y = the volume of each type of syngas GP fuel i used in year y (L, m3 or other)
EFCO2. = the CO2 emission factor for each type of fossil fuel (t CO2/L, m3 or other)
EFCH4. = the CH4 emission factor for each type of fossil fuel (t CH4/L, m3 or other)
GWPCH4 = Global Warming Potential of CH4 (t CO2e/t CH4)
EFN2O. = the N2O emission factor for each type of fossil fuel (t N2O/L, m3 or other)
GWPN2O = Global Warming Potential of N2O (t CO2e/t N2O)
5.1.7 Fuel for Processing and/or Blending Biochar
The auxiliary emissions due to the processing and/or blending of Biochar are calculated as
follows:
𝑃𝐸𝐵𝑙,𝑦 = ∑(𝐹𝑢𝑒𝑙𝐵𝐿 𝑖,𝑦 × 𝐸𝐹 𝐹𝑢𝑒𝑙𝐶𝑂2) ; ∑(𝐹𝑢𝑒𝑙𝐵𝐿 𝑖,𝑦 × 𝐸𝐹 𝐹𝑢𝑒𝑙𝐶𝐻4
× 𝐺𝑊𝑃𝐶𝐻4) ; ∑(𝐹𝑢𝑒𝑙𝐵𝐿 𝑖,𝑦 × 𝐸𝐹 𝐹𝑢𝑒𝑙𝑁2𝑂 × 𝐺𝑊𝑃𝑁2𝑂) (7)
Where:
PEBl,y = project emissions due to the processing and/or blending of Biochar BI (tCO2e) in year y
FuelBLi,y = the volume of each type of fuel i used in year y (L, m3 or other)
EFCO2. = the CO2 emission factor for each type of fossil fuel (t CO2/L, m3 or other)
EFCH4. = the CH4 emission factor for each type of fossil fuel (t CH4/L, m3 or other)
GWPCH4 = Global Warming Potential of CH4 (t CO2e/t CH4)
EFN2O. = the N2O emission factor for each type of fossil fuel (t N2O/L, m3 or other)
Biochar Production for Project Reporting Protocol August 2014
Version 3.0
Page 15 of 82
GWPN2O = Global Warming Potential of N2O (t CO2e/t N2O)
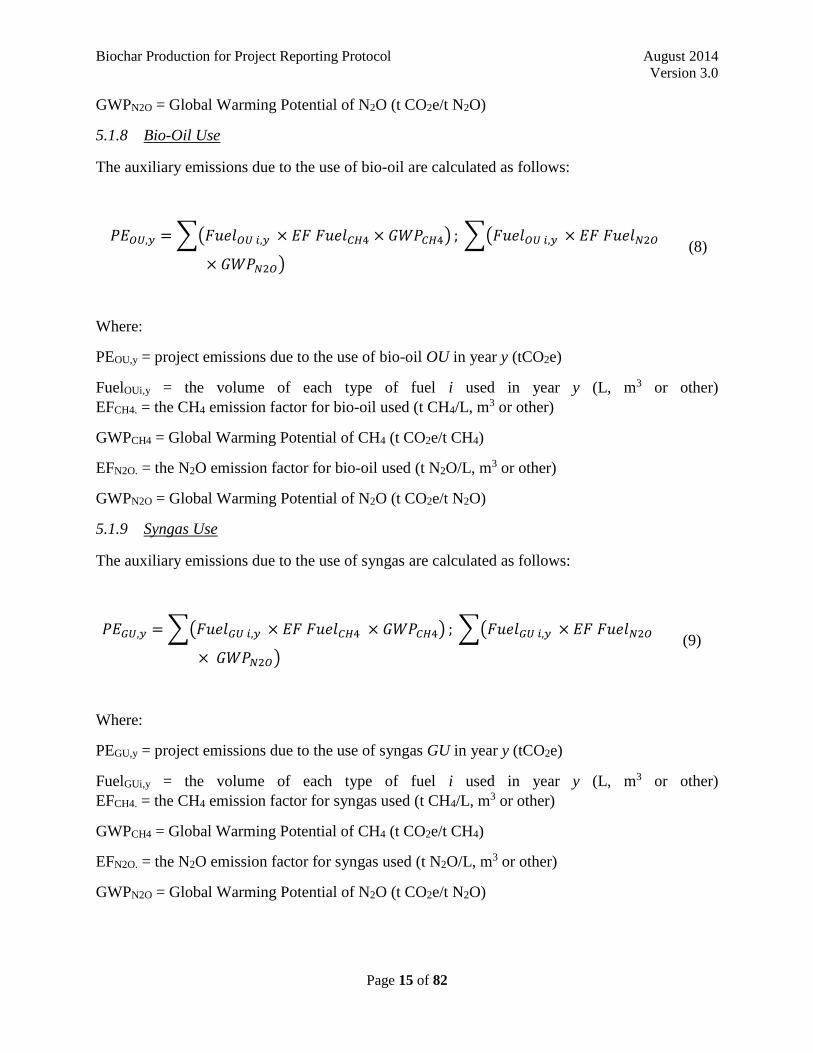
5.1.8 Bio-Oil Use
The auxiliary emissions due to the use of bio-oil are calculated as follows:
𝑃𝐸𝑂𝑈,𝑦 = ∑(𝐹𝑢𝑒𝑙𝑂𝑈 𝑖,𝑦 × 𝐸𝐹 𝐹𝑢𝑒𝑙𝐶𝐻4 × 𝐺𝑊𝑃𝐶𝐻4) ; ∑(𝐹𝑢𝑒𝑙𝑂𝑈 𝑖,𝑦 × 𝐸𝐹 𝐹𝑢𝑒𝑙𝑁2𝑂
× 𝐺𝑊𝑃𝑁2𝑂) (8)
Where:
PEOU,y = project emissions due to the use of bio-oil OU in year y (tCO2e)
FuelOUi,y = the volume of each type of fuel i used in year y (L, m3 or other)
EFCH4. = the CH4 emission factor for bio-oil used (t CH4/L, m3 or other)
GWPCH4 = Global Warming Potential of CH4 (t CO2e/t CH4)
EFN2O. = the N2O emission factor for bio-oil used (t N2O/L, m3 or other)
GWPN2O = Global Warming Potential of N2O (t CO2e/t N2O)
5.1.9 Syngas Use
The auxiliary emissions due to the use of syngas are calculated as follows:
𝑃𝐸𝐺𝑈,𝑦 = ∑(𝐹𝑢𝑒𝑙𝐺𝑈 𝑖,𝑦 × 𝐸𝐹 𝐹𝑢𝑒𝑙𝐶𝐻4 × 𝐺𝑊𝑃𝐶𝐻4) ; ∑(𝐹𝑢𝑒𝑙𝐺𝑈 𝑖,𝑦 × 𝐸𝐹 𝐹𝑢𝑒𝑙𝑁2𝑂
× 𝐺𝑊𝑃𝑁2𝑂) (9)
Where:
PEGU,y = project emissions due to the use of syngas GU in year y (tCO2e)
FuelGUi,y = the volume of each type of fuel i used in year y (L, m3 or other)
EFCH4. = the CH4 emission factor for syngas used (t CH4/L, m3 or other)
GWPCH4 = Global Warming Potential of CH4 (t CO2e/t CH4)
EFN2O. = the N2O emission factor for syngas used (t N2O/L, m3 or other)
GWPN2O = Global Warming Potential of N2O (t CO2e/t N2O)
Biochar Production for Project Reporting Protocol August 2014
Version 3.0
Page 16 of 82
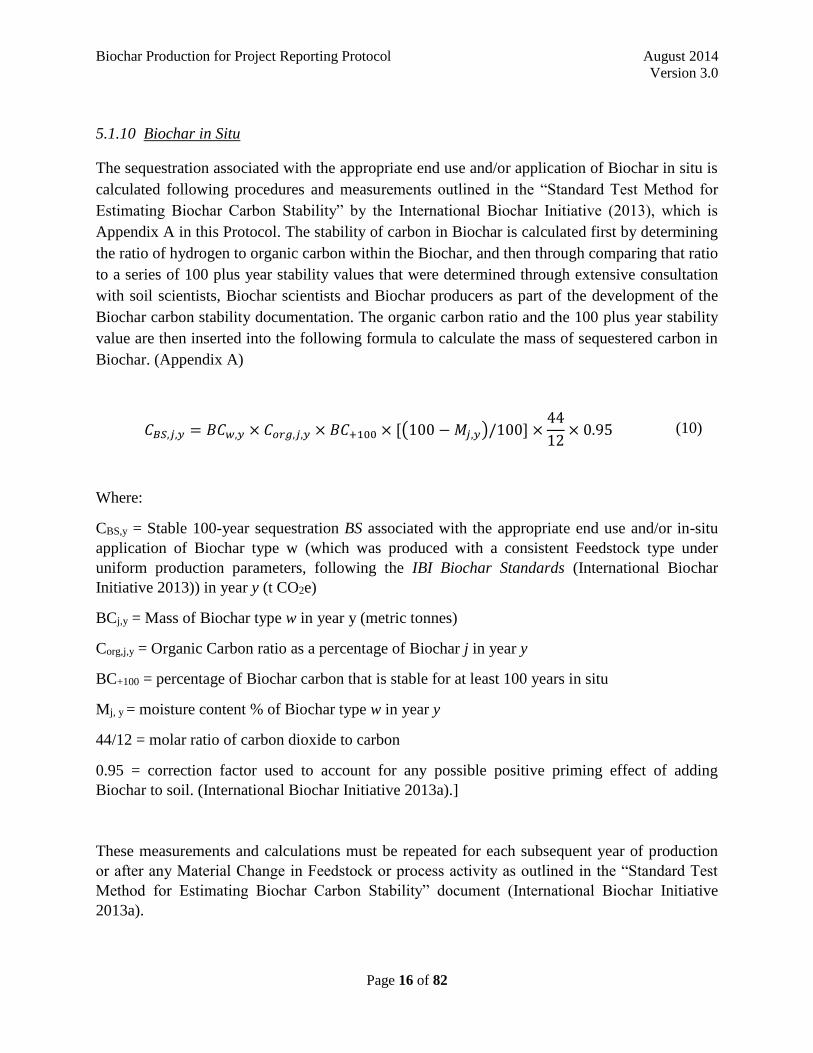
5.1.10 Biochar in Situ
The sequestration associated with the appropriate end use and/or application of Biochar in situ is
calculated following procedures and measurements outlined in the “Standard Test Method for
Estimating Biochar Carbon Stability” by the International Biochar Initiative (2013), which is
Appendix A in this Protocol. The stability of carbon in Biochar is calculated first by determining
the ratio of hydrogen to organic carbon within the Biochar, and then through comparing that ratio
to a series of 100 plus year stability values that were determined through extensive consultation
with soil scientists, Biochar scientists and Biochar producers as part of the development of the
Biochar carbon stability documentation. The organic carbon ratio and the 100 plus year stability
value are then inserted into the following formula to calculate the mass of sequestered carbon in
Biochar. (Appendix A)
𝐶𝐵𝑆,𝑗,𝑦 = 𝐵𝐶𝑤,𝑦 × 𝐶𝑜𝑟𝑔,𝑗,𝑦 × 𝐵𝐶+100 × [(100 − 𝑀𝑗,𝑦)/100] ×44
12× 0.95 (10)
Where:
CBS,y = Stable 100-year sequestration BS associated with the appropriate end use and/or in-situ
application of Biochar type w (which was produced with a consistent Feedstock type under
uniform production parameters, following the IBI Biochar Standards (International Biochar
Initiative 2013)) in year y (t CO2e)
BCj,y = Mass of Biochar type w in year y (metric tonnes)
Corg,j,y = Organic Carbon ratio as a percentage of Biochar j in year y
BC+100 = percentage of Biochar carbon that is stable for at least 100 years in situ
Mj, y = moisture content % of Biochar type w in year y
44/12 = molar ratio of carbon dioxide to carbon
0.95 = correction factor used to account for any possible positive priming effect of adding
Biochar to soil. (International Biochar Initiative 2013a).]
These measurements and calculations must be repeated for each subsequent year of production
or after any Material Change in Feedstock or process activity as outlined in the “Standard Test
Method for Estimating Biochar Carbon Stability” document (International Biochar Initiative
2013a).
Biochar Production for Project Reporting Protocol August 2014
Version 3.0
Page 17 of 82
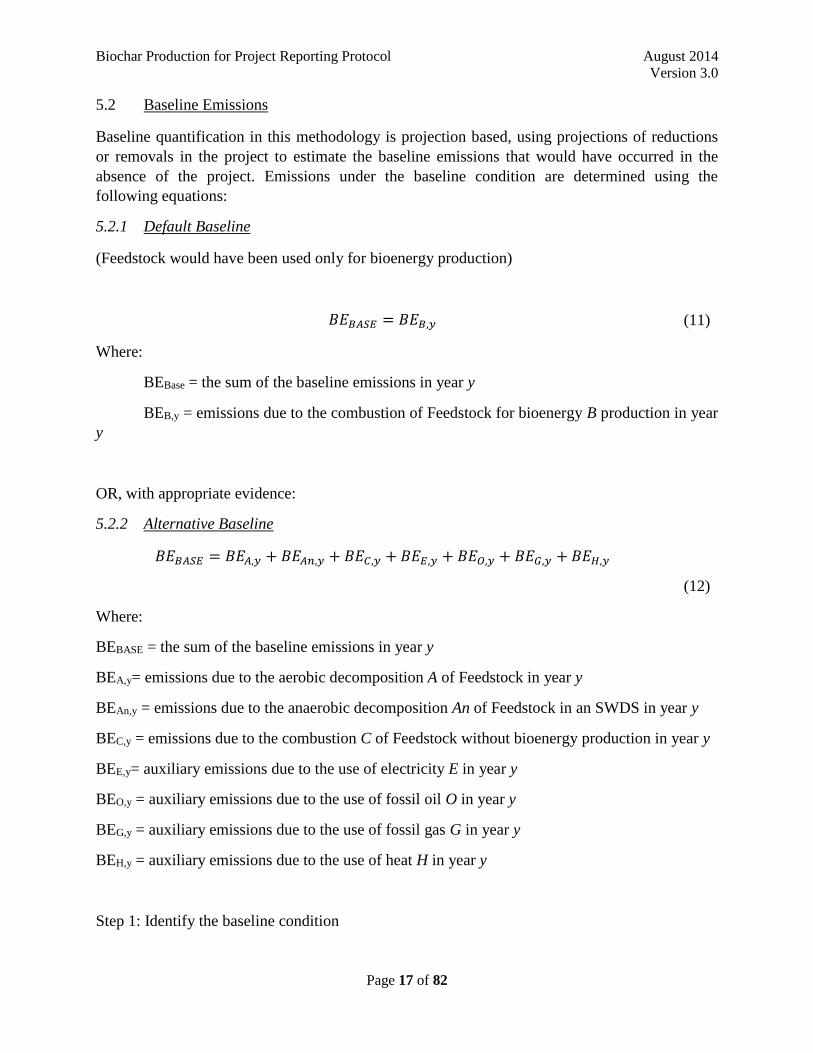
5.2 Baseline Emissions
Baseline quantification in this methodology is projection based, using projections of reductions
or removals in the project to estimate the baseline emissions that would have occurred in the
absence of the project. Emissions under the baseline condition are determined using the
following equations:
5.2.1 Default Baseline
(Feedstock would have been used only for bioenergy production)
𝐵𝐸𝐵𝐴𝑆𝐸 = 𝐵𝐸𝐵,𝑦 (11)
Where:
BEBase = the sum of the baseline emissions in year y
BEB,y = emissions due to the combustion of Feedstock for bioenergy B production in year
y
OR, with appropriate evidence:
5.2.2 Alternative Baseline
𝐵𝐸𝐵𝐴𝑆𝐸 = 𝐵𝐸𝐴,𝑦 + 𝐵𝐸𝐴𝑛,𝑦 + 𝐵𝐸𝐶,𝑦 + 𝐵𝐸𝐸,𝑦 + 𝐵𝐸𝑂,𝑦 + 𝐵𝐸𝐺,𝑦 + 𝐵𝐸𝐻,𝑦
(12)
Where:
BEBASE = the sum of the baseline emissions in year y
BEA,y= emissions due to the aerobic decomposition A of Feedstock in year y
BEAn,y = emissions due to the anaerobic decomposition An of Feedstock in an SWDS in year y
BEC,y = emissions due to the combustion C of Feedstock without bioenergy production in year y
BEE,y= auxiliary emissions due to the use of electricity E in year y
BEO,y = auxiliary emissions due to the use of fossil oil O in year y
BEG,y = auxiliary emissions due to the use of fossil gas G in year y
BEH,y = auxiliary emissions due to the use of heat H in year y
Step 1: Identify the baseline condition
Biochar Production for Project Reporting Protocol August 2014
Version 3.0
Page 18 of 82
Project Proponents shall use the steps outlined in Section 4.0 of this document to determine the
Baseline condition i for each Feedstock.
Table 1: Baseline Conditions
Baseline condition i Parameter (FSi)
Bioenergy production (default) FS B
Aerobic decomposition FS A
Anaerobic decomposition in a SWDS FS An
Combustion without bioenergy production FS C
Every stream of Feedstock that is processed into Biochar is assumed to be diverted from
bioenergy production under the default calculations (Equation 12:
𝐵𝐸𝐵𝐴𝑆𝐸 = 𝐵𝐸𝐵,𝑦), unless otherwise justified by the procedure for determining the Baseline
Scenario. Alternative Feedstock diversions may include those for aerobic decomposition,
anaerobic decomposition in a Solid Waste Disposal Site (SWDS), or combustion without energy
capture, and are addressed using the alternative calculations.
Step 2: Identify the Feedstock Composition
The composition of Feedstock from Biomass Residues should be assessed. The amount of
Feedstock type w prevented from baseline disposal i is calculated using sampling as follows:
𝐹𝑆𝑖,𝑗,𝑦 = ∑ 𝐹𝑆𝑖,𝑦 ×∑ 𝑝𝑛,𝑗,𝑦
𝑧𝑛=1
𝑧𝑖
(13)
Where:
FS i,j,y = the amount of Feedstock type w prevented from baseline disposal i in year y (t)
FS i,y = total amount of Feedstock prevented from baseline disposal i in year y (t)
P n,j,y = weight fraction of the Feedstock type W in the sample n collected during year y (t)
Z = number of samples collected during year y
Equation (14) determines the fraction of each individual Feedstock type used for one discreet
Biochar production event (same Feedstock blend ratios and same production parameters). The
mass of each Feedstock type (e.g. straw) is calculated by identifying the fraction it represents in
the total mass of incoming Feedstock. Thus, if a Feedstock is a 60:35:5 blend of straw, wood
chips, and non-biogenic material (as identified by following Feedstock determination and
Biochar Production for Project Reporting Protocol August 2014
Version 3.0
Page 19 of 82
sampling procedures outlined in the IBI Biochar Standards (2013)), and the total volume of
incoming Feedstock diverted from landfill disposal is 240 tonnes for year 1, the calculation is:
240t * 0.6 for straw, 240t * 0.35 for wood chips, and 240t * 0.05 for non-biogenic materials,
resulting in 144, 84, and 12 tonnes for straw, wood chips and non-biogenic Feedstocks,
respectively. This same procedure may be used to identify the total volume of each Feedstock
fraction, for each disposal type, including non-biogenic materials. These FSi,j,y values will be
used in subsequent calculations to determine the total emission reduction.
5.2.3 Bioenergy Production (Default Project)
The emissions due to the combustion of Feedstock for producing bioenergy (heat and/or
electricity) are calculated as follows:
𝐵𝐸𝐵,𝑦 = ∑ 𝐹𝑆𝐵𝑗,𝑦 × 𝐸𝐹𝐶𝐻4,𝑖
𝑖
× 𝐺𝑊𝑃𝐶𝐻4; ∑ 𝐹𝑆𝐵𝑗,𝑦 × 𝐸𝐹𝑁2𝑂,𝑖 × 𝐺𝑊𝑃𝑁2𝑂
𝑖
(14)
Where:
BEB,y = Baseline emissions due to the combustion of Feedstock for bioenergy B (tCO2e)
production in year y
FS B,w,y = the amount of Feedstock type prevented from baseline condition bioenergy production
B in year y (t)
EFCH4,i = the CH4 emission factor for the Feedstock type w prevented from the baseline
condition i (t CH4/t)
GWPCH4 = Global Warming Potential of CH4 (t CO2e/t CH4)
EFN2O,i = the N2O emission factor for the Feedstock type w prevented from the baseline
condition i (t N2O/t)
GWPN2O = Global Warming Potential of N2O (t CO2e/t N2O)
5.2.4 Aerobic Decomposition (Alternative)
The emissions due to the aerobic decomposition of Feedstock are calculated as follows:
𝐵𝐸𝐴,𝑦 = ∑(𝐹𝑆𝐴,𝑗,𝑦 × 𝐸𝐹𝐴𝐶𝐻4,𝑦 × 𝐺𝑊𝑃𝐶𝐻4) ; (𝐹𝑆𝐴,𝑗,𝑦 × 𝐸𝐹𝐴𝑁2𝑂,𝑦 × 𝐺𝑊𝑃𝑁2𝑂) (15)
Where:
BEA,y= Baseline emissions due to the aerobic decomposition A of Feedstock in year y
Biochar Production for Project Reporting Protocol August 2014
Version 3.0
Page 20 of 82
FS A,j,y = the fraction of Feedstock type w diverted from aerobic decomposition A in year y (t)
EFACH4,y = the emission factor for methane CH4 per tonne of waste diverted from aerobic
decomposition A valid in year y (t CH4/t)
GWPCH4 = Global Warming Potential of CH4 (t CO2e/t CH4)
EFAN2O,y = the emission factor for nitrous oxide N20 per tonne of waste diverted from aerobic
decomposition A, valid in year y (t N2O/t)
GWPN2O = Global Warming Potential of N2O (t CO2e/t N2O)
5.2.5 Anaerobic Decomposition in a SWDS (Alternative)
The emissions due to the anaerobic decomposition of Feedstock in an SWDS are calculated as
follows:
𝐵𝐸𝐴𝑛,𝑦 = 𝜑 × (1 − 𝑓𝑦) × 𝐺𝑊𝑃𝐶𝐻4 × (1 − 𝑂𝑋) ×16
12× 𝐹 × 𝐷𝑂𝐶𝑓,𝑦 × 𝑀𝐶𝐹𝑦
× ∑ ∑ 𝐹𝑆𝑎𝑛,𝑗,𝑦 × [𝑒−𝑘𝑗∙(𝑦−1) × (1 − 𝑒−𝑘𝑗)]
𝑖
10
𝑦=1
× 𝐷𝑂𝐶𝑗
(16)
Where:
BEAn,y = Baseline emissions due to the anaerobic decomposition An of Feedstock in an SWDS in
year y
𝜑 = Model correction factor to account for model uncertainties for year y
fy = the recovered methane at the landfill in year y (%)
GWPCH4 = the Global Warming Potential of methane CH4 (t CO2e/t CH4)
OX = the oxidation factor (reflecting the amount of methane from SWDS that is oxidized in the
soil or other material covering the waste)
16/12 = Ratio of molecular weights of Methane (16) to Carbon (12)
F = the fraction of methane in the SWDS gas (%)
DOCf,y= the fraction f of degradable organic carbon that decomposes under the specific
conditions occurring in the SWDS for year y
MCFy = Methane conversion factor for year y
Biochar Production for Project Reporting Protocol August 2014
Version 3.0
Page 21 of 82
FSan,j,y = the amount of Feedstock type w prevented from baseline condition anaerobic
decomposition AN in an SWDS in year y (t)
DOCj = the degradable organic carbon in the Feedstock type w
kj = the decay rate for the Feedstock type w (l/yr)
5.2.6 Combustion (Alternative)
The emissions due to the combustion of Feedstock without bioenergy production are calculated
as follows:
𝐵𝐸𝐶,𝑦 = ∑ 𝐹𝑆𝐶,𝑗,𝑦 × 𝐸𝐹𝐶𝐻4,𝑖
𝑖
× 𝐺𝑊𝑃𝐶𝐻4; ∑ 𝐹𝑆𝐶,𝑗,𝑦 × 𝐸𝐹𝑁2𝑂,𝑖 ×
𝑖
𝐺𝑊𝑃𝑁2𝑂 (17)
Where:
BEC,y = baseline emissions due to the combustion C of Feedstock without bioenergy production
(tCO2e) in year y
FSC,j,y = the amount of Feedstock type w prevented from baseline condition combustion C in
year y (t)
EFCH4,i = the CH4 emission factor for combustion of the Feedstock type w baseline condition
(pathways i) (t CH4/t)
GWPCH4 = Global Warming Potential of CH4 (t CO2e/t CH4)
EFN2O,i = the N2O emission factor for combustion of the Feedstock type w (t N2O/t)
GWPN2O = Global Warming Potential of N2O (t CO2e/t N2O)
5.2.7 Electricity Production
The emissions due to the production of electricity that would have been required to compensate
for the renewable electricity produced in the project condition are calculated as follows:
𝐵𝐸𝐸,𝑦 = 𝐸𝑅,𝑦 × 𝐸𝐹𝐺𝑟𝑖𝑑 (18)
Where:
BEE,y = baseline emissions due to the production of electricity E that would have been required
to compensate for the renewable electricity produced in the project condition (tCO2e) in year y
Biochar Production for Project Reporting Protocol August 2014
Version 3.0
Page 22 of 82
ER,y = the net quantity of renewable electricity R generated in the project condition and used off-
site in year y (MWh)
EFGrid = the regional electricity grid emission factor (t CO2e/MWh)
These baseline emissions BEE,y, however, cannot be accounted for in the following scenarios:
1. The default baseline bioenergy production has been indicated for the project. If any portion
of the Feedstock used by the project would have been used for bioenergy production in the
baseline, the Project Proponent cannot account for BEE,y
2. If the project is generating, claiming and selling Renewable Energy Certificates (RECs) or
other environmental credits, the Project Proponent cannot account for BEE,y. If RECs have
been issued, the Project Proponent shall either not include this emission source or provide
evidence that the RECs have not been used and have been cancelled from the environmental
credit program.
5.2.9 Oil
The emissions due to the use of fossil oil that would have been required to compensate for the
bio-oil produced in the project condition are calculated as follows:
𝐵𝐸𝑂,𝑦 = ∑(𝐹𝑢𝑒𝑙𝑖,𝑦 × 𝐸𝐹 𝐹𝑢𝑒𝑙𝐶𝑂2) ; ∑(𝐹𝑢𝑒𝑙𝑖,𝑦 × 𝐸𝐹 𝐹𝑢𝑒𝑙𝐶𝐻4
× 𝐺𝑊𝑃𝐶𝐻4) ; ∑(𝐹𝑢𝑒𝑙𝑖,𝑦 × 𝐸𝐹 𝐹𝑢𝑒𝑙𝑁2𝑂 × 𝐺𝑊𝑃𝑁2𝑂)
𝐹𝑢𝑒𝑙𝑖 = 𝑂𝑦 × %𝑖
(19)
Where:
BEO,y = baseline emissions due to the use of fossil oil O that would have been required to
compensate for the bio-oil produced in the project condition (tCO2e) in year y
Fueli,y = the volume of each type of liquid fuel i to generate an equivalent amount of bio-oil on
an energy basis in year y (L, m3 or other)
Oy = the volume of bio-oil produced in the project condition in year y (L, m3 or other)
%i = the percentage of each type of fuel offset (%)
EFCO2. = the CO2 emission factor for each type of fuel (t CO2/L, m3 or other)
EFCH4. = the CH4 emission factor for each type of fuel (t CH4/L, m3 or other)
GWPCH4 = Global Warming Potential of CH4 (t CO2e/t CH4)
Biochar Production for Project Reporting Protocol August 2014
Version 3.0
Page 23 of 82
EFN2O. = the N2O emission factor for each type of fuel (t N2O/L, m3 or other)
GWPN2O = Global Warming Potential of N2O (t CO2e/t N2O)
5.2.10 Gas
The emissions due to the use of fossil gas that would have been required to compensate for the
syngas produced in the project condition are calculated as follows:
𝐵𝐸𝐺,𝑦 = ∑(𝐹𝑢𝑒𝑙𝑖,𝑦 × 𝐸𝐹 𝐹𝑢𝑒𝑙𝐶𝑂2) ; ∑(𝐹𝑢𝑒𝑙𝑖,𝑦 × 𝐸𝐹 𝐹𝑢𝑒𝑙𝐶𝐻4
× 𝐺𝑊𝑃𝐶𝐻4) ; ∑(𝐹𝑢𝑒𝑙𝑖,𝑦 × 𝐸𝐹 𝐹𝑢𝑒𝑙𝑁2𝑂 × 𝐺𝑊𝑃𝑁2𝑂)
𝐹𝑢𝑒𝑙𝑖 = 𝐺𝑦 × %𝑖
(20)
Where:
BEG,y = baseline emissions due to the use of fossil gas G that would have been required to
compensate for the syngas produced in the project condition (tCO2e) in year y
Fueli,y = the volume of each type of gaseous fossil fuel i to generate an equivalent amount of
syngas on an energy basis in year y (L, m3 or other)
G y = the volume of syngas produced in the project condition in year y (L, m3 or other)
%i = the percentage of each type of fuel i offset (%)
EFCO2. = the CO2 emission factor for each type of fossil fuel (t CO2/L, m3 or other)
EFCH4. = the CH4 emission factor for each type of fossil fuel (t CH4/L, m3 or other)
GWPCH4 = Global Warming Potential of CH4 (t CO2e/t CH4)
EFN2O. = the N2O emission factor for each type of fuel (t N2O/L, m3 or other)
GWPN2O = Global Warming Potential of N2O (t CO2e/t N2O)
5.2.11 Heat
The emissions due to the production of heat that would have been required to compensate for the
heat produced in the project condition are calculated as follows:
Biochar Production for Project Reporting Protocol August 2014
Version 3.0
Page 24 of 82
𝐵𝐸𝐻,𝑦 = ∑(𝐹𝑢𝑒𝑙𝑖,𝑦 × 𝐸𝐹 𝐹𝑢𝑒𝑙𝐶𝑂2) ; ∑(𝐹𝑢𝑒𝑙𝑖,𝑦 × 𝐸𝐹 𝐹𝑢𝑒𝑙𝐶𝐻4
× 𝐺𝑊𝑃𝐶𝐻4) ; ∑(𝐹𝑢𝑒𝑙𝑖,𝑦 × 𝐸𝐹 𝐹𝑢𝑒𝑙𝑁2𝑂 × 𝐺𝑊𝑃𝑁2𝑂)
𝐹𝑢𝑒𝑙𝑖 = (𝐻𝑦 × %𝑖)/(𝑁𝐶𝑉 𝐹𝑢𝑒𝑙𝑖 × %𝑒𝑓𝑓 )
(21)
Where:
BEH,y = baseline emissions due to the production of heat H that would have been required to
compensate for the heat produced in the project condition (tCO2e) in year y
Fueli,y = the volume of fuel (fuel type i) to generate equivalent heat on an energy basis in year y
(L, m3 or other)
H y = the heat load produced under the project condition in year y (GJ)
%i = the percentage of each type of fuel offset (%)
NCV Fueli = the net calorific value of each type of fuel i offset by the project (GJ/L, m3 or other)
%eff = the percentage of efficiency eff of the thermal energy heating system (%)
EFCO2. = the CO2 emission factor for each type of fuel (t CO2/L, m3 or other)
EFCH4. = the CH4 emission factor for each type of fuel (t CH4/L, m3 or other)
GWPCH4 = Global Warming Potential of CH4 (t CO2e/t CH4)
EFN2O. = the N2O emission factor for each type of fuel (t N2O/L, m3 or other)
GWPN2O = Global Warming Potential of N2O (t CO2e/t N2O)
5.3 Leakage
Restricting Biochar production to non-purpose-grown Feedstocks will prevent Leakage from
upstream sources. Further, Leakage due to the depletion of soil organic Carbon Stocks and the
potential for overharvesting organic agricultural residue is addressed in Appendix B. The
provisions of this Protocol require documentation supporting the end use of Biochar, limiting the
risk of Leakage by providing tangible, substantive evidence of stable sequestration.
Leakage could occur if, in the absence of the project, the Biomass Residues would have been
used to generate renewable energy. When a Thermochemical Conversion unit is optimized to
make both energy and Biochar, it will make less energy than a biomass facility which is
optimized to make energy alone, due to Efficiency reductions. Fossil fuels could therefore be
used to compensate for the loss of energy associated with diverting some energy production into
the production of Biochar instead.
Biochar Production for Project Reporting Protocol August 2014
Version 3.0
Page 25 of 82
If Feedstock type w was used for bioenergy production, as in the default Baseline Scenario, the
Project Proponent must account for the increase in emissions needed to compensate for the
renewable energy that would have been produced in the Baseline Scenario. The Leakage
emissions resulting from a loss in Efficiency of the biomass facility are calculated as follows:
𝐿𝑒𝑎𝑘𝑎𝑔𝑒𝑦 = 𝐿𝐸𝜂𝑙𝑜𝑠𝑠
𝐿𝐸𝜂𝑙𝑜𝑠𝑠 = ∑(𝐹𝑆𝐵,𝑗,𝑦 × 𝑁𝐶𝑉𝑗,𝑦) × (𝜂𝐵 − 𝜂𝑃) × 𝐸𝐹 𝐿𝑒𝑎𝑘𝑎𝑔𝑒 (22)
Where:
Leakagey = Leakage that occurs in year y (t CO2e)
LEηloss = Leakage due to Thermochemical Conversion of Feedstocks that otherwise would have
been used purely for the generation of energy (t CO2e)
FSB,j,y = the amount of Feedstock type w diverted from baseline condition bioenergy production
B in year y (t)
NCVj,y = net calorific value of the Feedstock type w processed at the Biochar facility in year y
(GJ/t of dry matter)
𝜂𝐵 = the baseline B Efficiency of the biomass facility where the Biomass Residues would have
been combusted before the implementation of the project (kWh/GJ or GJ/GJ)
𝜂𝑃 = the Efficiency of the Thermochemical Conversion facility in the project P condition
(kWh/GJ or GJ/GJ)
EFLeakage= Emission factor for reduced energy production. If the Feedstock would have produced
electricity in the baseline condition, use the regional electricity grid emission factor (t
CO2e/kWh). If thermal heat would have been produced in the baseline, use the emission factor
associated with the most carbon intensive fuel that could reasonably be used to replace this
biomass heat (t CO2e/GJ)
5.4 Summary of GHG Emission Reduction and/or Removals
The emission reductions for this project activity are calculated as follows:
𝐸𝑅𝑁𝐸𝑇 = 𝐵𝐸𝐵𝐴𝑆𝐸 − 𝑃𝐸𝑃𝑅𝑂𝐽 − 𝐿𝑒𝑎𝑘𝑎𝑔𝑒𝑦 (23)
Biochar Production for Project Reporting Protocol August 2014
Version 3.0
Page 26 of 82
Where:
ERNET = Net GHG emissions reductions and/or removals in year y
Y = year, where the baseline year is 0 and the first year of production is 1
BEBASE = Baseline emissions in year y
PEPROJ = Project emissions in year y
Leakagey = Leakage that occurs in year y

Biochar Production for Project Reporting Protocol August 2014
Version 3.0
Page 27 of 82
6.0 Monitoring
Project data monitoring requirements are shown in Attachment B
Biochar Production for Project Reporting Protocol August 2014
Version 3.0
Page 28 of 82
7.0 Reporting and Recordkeeping
7.1 Project Commencement
Attachment A must be completed, submitted, and approved prior to project commencement, as
discussed in Section 2.1 and Section 3.5.
7.2 Recordkeeping
Attachment B can be used to collect, maintain, and document the required information.
Information is to be kept for a period of 10 years after it is generated, or 7 years after the last
verification.
7.3 Reporting
Attachment C can be used to report on project emission reductions. Reporting must be made on
a monthly basis.
Project developers must report GHG emission reductions on an annual (12-month) calendar
basis.
Biochar Production for Project Reporting Protocol August 2014
Version 3.0
Page 29 of 82
8.0 Verification
Project activities and GHG emission reductions must be verified and certified by a qualified third
party prior to GHG emission reduction issuance. The verifier must review and assess the
reported data to confirm that is adheres with the all the requirements of this protocol; and
determine that the emissions reductions are accurate, consistent, and credible. The third party
verifier must be approved by the responsible entity that issues the emission reductions.
Biochar Production for Project Reporting Protocol August 2014
Version 3.0
Page 30 of 82
9.0 Glossary of Terms
Biochar: Biochar is a solid material obtained through the thermochemical
conversion of biomass in an oxygen-limited environment. Biochar
differs from charcoal in the sense that its primary use is not for fuel,
but for biosequestration or atmospheric carbon capture and storage.
To be credited by this Methodology, Biochar must comply with all
requirements of the most recent version of the International Biochar
Initiative’s Standardized Product Definition and Product Testing
Guidelines for Biochar that is Used in Soil (aka IBI Biochar
Standards).
Bioenergy: Energy that is produced or originating from a recently living
organism.
Biogenic: Material that is produced or originating from a recently living
organism.
Biomass Residues:
Biomass by-products, residues and waste streams from agriculture,
forestry and related industries. (United Nations 2006). Any Biomass
Residue meeting the Feedstock expectations of the IBI Biochar
Standards (2013) is eligible for Biochar production under this
methodology.
Bio-oil: A liquid material obtained during the thermochemical conversion of
biomass into biochar.
Chain of Custody: Documenting/tracking the location and ownership history of
feedstock step-by-step from its harvesting source to the final
product of Biochar.
Contaminant: An undesirable material in a biochar material or biochar feedstock
that compromises the quality or usefulness of the biochar or through
its presence or concentration causes an adverse effect on the natural
environment or impairs human use of the environment (adapted
from Canadian Council of Ministers of the Environment, 2005).
Contaminants include fossil fuels and fossil-fuel-derived chemical
Biochar Production for Project Reporting Protocol August 2014
Version 3.0
Page 31 of 82
compounds, glass, and metal objects. (International Biochar
Initiative 2013)
Developed/Industrialized
Nation:
There are no established conventions for designating “developed”
or “developing” nations. This Methodology will follow the listing of
industrialized nations and economies in transition included within
Annex I Parties to the United Nations Framework Convention on
Climate Change (UNFCCC) (United Nations 2012g).
Developing Nation:
Following the definition of developed nation provided above, a
Developing Nation will be considered to include all nations not
listed within the Annex I parties to the UNFCCC (United Nations
2012g), which have been identified as Developing Nations or least
developed countries.
Diluent/Dilutant: Inorganic material that is deliberately mixed or inadvertently
comingled with biomass feedstock prior to processing. These
materials will not carbonize in an equivalent fashion to the biomass.
These materials include soils and common constituents of natural
soils, such as clays and gravel that may be gathered with biomass or
intermixed through prior use of the feedstock biomass.
Diluents/dilutants may be found in a diverse range of Feedstocks,
such as agricultural residues, manures, and Municipal Solid Wastes.
(International Biochar Initiative 2012).
Efficiency: Efficiency is defined as the net quantity of useful energy generated
by the energy generation system per quantity of energy contained in
the fuel fired. In case of boilers that are used only for thermal
energy generation (and not for power generation), the Efficiency is
defined as the net quantity of useful heat generated per quantity of
energy contained in the fuel fired in the boiler. In case of power
plants producing only electric power (not cogeneration plants), the
Efficiency is defined as the net electricity generated by the power
plant as a whole divided by the quantity of energy contained in the
fuel fired.
Feedstock: The material undergoing thermochemical conversion processes to
create Biochar. Feedstock materials for Biochar consist of Biogenic
Biochar Production for Project Reporting Protocol August 2014
Version 3.0
Page 32 of 82
materials, but may also contain Diluents and no more than 2% by
dry weight of Contaminants. (International Biochar Initiative 2013)
Fixed Carbon:
Fixed Carbon is the component of the Biochar that has been shown
to be stable through the application of the Ultimate Analysis or
otherwise, as required in the Methodology to assess the stability of
the sequestration of the carbon.
Gasification: A partial oxidation process that converts biomass into a mixture of
synthesis gases composed of carbon monoxide, hydrogen and
carbon dioxide.
Material Change: Material Changes in Feedstock reflect shifts in Feedstock type from
one source of biomass to a distinctly different source of biomass. In
mixed Feedstocks, whether processed or unprocessed, a 10% or
greater shift in total Feedstock composition shall constitute a
Material Change in Feedstock.
Material Changes in production processes reflect increases or
decreases in process temperature or residence time. A Material
Change in thermochemical production parameters has occurred if
process temperature (also known as heat treatment temperature)
changes by +/- 50˚C, or if the thermochemical processing time
(residence time) changes by more than 10%. See Appendix 4 of the
IBI Biochar Standards (2013) for more information on how to
determine Feedstock types that constitute a Material Change in
type.
Mobile Biochar
Operations:
Mobile Biochar Operations are Biochar facilities that are built on a
trailer or that otherwise can be relocated. These operations may be
moved on a daily or similarly frequent basis.
Municipal Waste /
Municipal Solid Waste
(MSW):
Solid, non-hazardous refuse that originates from residential,
industrial, commercial, institutional, demolition, land clearing or
construction sources (Canadian Council of Ministers of the
Environment 2005). Municipal solid waste includes durable goods,
non-durable goods, containers and packaging, food wastes and yard
trimmings, and miscellaneous inorganic wastes (US Environmental
Biochar Production for Project Reporting Protocol August 2014
Version 3.0
Page 33 of 82
Protection Agency 2011).
Non-Biogenic: Material that is not produced or originating from a recently living
organism such as fossil fuels.
Project Proponent:
An individual or entity that undertakes, develops, and/or owns a
project. This may include the project investor, designer, and/or
owner of the lands/facilities on which project activities are
conducted. The Project Proponent and landowner/facility owner
may be different entities.
Proximate Analysis: This methodological approach establishes the loss of material as
samples are heated to predefined temperatures and typically reports
volatile matter, Fixed Carbon, moisture content, and ash present in a
fuel as a percentage of dry fuel weight. International Standards
under ASTM exist for this measure; the relevant method is ASTM
D1762-84 (2007).
Pyrolysis: The thermochemical decomposition of a material or compound into
a carbon rich residue, non-condensable combustible gases, and
condensable vapors, by heating in the absence of oxygen, or low
oxygen environment, without any other reagents, except possibly
steam (United Nations 2012c).
Soil Amendment: Any material added to soil to improve its physical and chemical
properties, such as water retention, permeability, water infiltration,
drainage, aeration and structure; for the goal of providing an
improved rooting environment (Davis and Wilson 2005).
Solid Waste Disposal
Site (SWDS)
Designated areas intended as the final storage place for solid waste.
Stockpiles are considered a SWDS if (a) their volume to surface
area ratio is 1.5 or larger and if (b) a visual inspection by the
Department Of Environment or responsible governing body
confirms that the material is exposed to anaerobic conditions (i.e. it
has a low porosity and is moist).
Biochar Production for Project Reporting Protocol August 2014
Version 3.0
Page 34 of 82
Syngas: Short for synthesis gas, syngas is a mixture of gases obtained during
the thermochemical conversion of biomass into biochar.
Thermochemical
Conversion:
The decomposition of biomass into biochar, bio-oils and syngas
through controlled heating under low or no oxygen conditions.
Ultimate Analysis:
A quantitative analysis in which percentages of all elements in the
substance are determined. International Standards under ASTM
(www.astm.org) exist for Ultimate Analysis; the relevant method is
ASTM D3176-09 (2005).
Verification Statement:
A verification statement provides assurance that, through
examination of objective evidence by a competent and independent
third party, a GHG assertion is in conformity with applicable
requirements.
Verifier:
A competent and independent person, persons or firm responsible
for performing the verification process. To conduct verification the
verifier must be ACR-approved.
Biochar Production for Project Reporting Protocol August 2014
Version 3.0
Page 35 of 82
10.0 References
Alberta Environment and Sustainable Resource Development, Alberta Offset System, Specified
Gas Emitters Regulation. 2007. Quantification protocol for innovative feeding of swine and
storing and spreading of swine manure. http://environment.gov.ab.ca/info/library/7913.pdf
(Accessed November 2012)
Alberta Environment and Sustainable Resource Development, Alberta Offset System, Specified
Gas Emitters Regulation. 2008. Quantification protocol for aerobic composting projects.
http://environment.gov.ab.ca/info/library/7905.pdf (Accessed September 2012)
Alberta Environment and Sustainable Resource Development, Alberta Offset System, Specified
Gas Emitters Regulation. 2011. Quantification protocol for reducing the age at harvest of beef
cattle. http://environment.gov.ab.ca/info/library/7916.pdf (Accessed November 2012)
American Society for Testing and Materials (ASTM) International. 2005. ASTM D3176-09,
2005 Standard practice for Ultimate Analysis of coal and coke. DOI: 10.1520/D3176-09
American Society for Testing and Materials (ASTM) International. 2007. ASTM D 1762-84,
2007 Standard test method for chemical analysis of wood charcoal. DOI: 10.1520/D1762-84R07
British Standards Institution. 1999. Methods for Assessing thermal performance of boilers for
steam, hot water and high temperature heat transfer fluids. BS 845-1:1987 ISBN 0 580 15856 X
Canadian Council of Ministers for the Environment. 2005. Guidelines for Compost Quality. PN
1340 Winnipeg Manitoba, Canada. ISBN 1-896997-60-0.
Carbon Consulting LLC and Leading Carbon Ltd. 2010. Draft Quantification Protocol: Biochar
Projects v.1, submitted to the Alberta Specified Gas Emitters Regulation
http://carbonoffsetsolutions.climatechangecentral.com/files/microsites/OffsetProtocols/DraftProt
ocolsDocs/Biochar_Intent_to_Develop_Protocol_Proposal_April_2011.pdf (Accessed August
2012)
Climate Action Reserve. 2010. Organic waste composting project protocol. Version 1.0
http://www.climateactionreserve.org/how/protocols/organic-waste-composting/ (Accessed
November 2012)
Climate Action Reserve. 2011. Organic waste digestion project protocol. Version 2.0
http://www.climateactionreserve.org/how/protocols/organic-waste-digestion/ (Accessed July
2012)
Climate Action Reserve. 2011. U.S. landfill project protocol. Version 4.0
http://www.climateactionreserve.org/how/protocols/us-landfill/ (Accessed November 2012)
Davis, J.G. and Wilson, C.R. 2005. Choosing a Soil Amendment. Colorado State University
Extension. Fact Sheet No. 7.235. www.ext.colostate.edu/pubs/garden/07235.html (Accessed July
2012)
Biochar Production for Project Reporting Protocol August 2014
Version 3.0
Page 36 of 82
Intergovernmental Panel on Climate Change (IPCC). 2006. Guidelines for National Greenhouse
Gas Inventories. http://www.ipcc-nggip.iges.or.jp/public/2006gl/index.html (Accessed
November 2012)
Intergovernmental Panel on Climate Change (IPCC). 2006. Good Practice Guidance and
Uncertainty Management in National Greenhouse Gas Inventories. http://www.ipcc-
nggip.iges.or.jp/public/gp/english/
Intergovernmental Panel on Climate Change (IPCC). 2007. Contribution of Working Group I to
the Fourth Assessment Report of the Intergovernmental Panel on Climate Change. Solomon, S.,
Qin, D., Manning, M., Chen, Z., Marquis, M., Averyt, K.B., Tignor, M., and Miller, H.L. (eds.)
Direct Global Warming Potentials: http://www.ipcc.ch/publications_and_data/ar4/wg1/en/ch2s2-
10-2.html (Accessed October 2012)
International Biochar Initiative. 2013. Standardized Product Definition and Product Testing
Guidelines for Biochar that is Used in Soil (IBI Biochar Standards). http://Biochar-
international.org/characterizationstandard (Accessed July 2013)
International Biochar Initiative. 2013a. Standard test method for estimating Biochar carbon
stability (BC+100). In press.
International Biochar Initiative. 2013b. Biochar Carbon Stability Test Method: an assessment of
methods to determine Biochar carbon stability. In press.
Oonk, H., Weenk, A., Coops, O., and Luning, L. 1994. Validation of landfill gas formation
models. TNO. Dutch organization for Applied Scientific Research, Report No. 94-315.
Apeldoorn, The Netherlands
United Nations. 2006. Framework Convention on Climate Change, Clean Development
Mechanism. Executive Board Report. Annex 18 Definition of renewable biomass.
http://cdm.unfccc.int/EB/023/eb23_repan18.pdf (Accessed October 2012)
United Nations 2012a. Framework Convention on Climate Change. Clean Development
Mechanism. AM0036. Fuel switch from fossil fuels to Biomass Residues in heat generation
equipment.
http://cdm.unfccc.int/methodologies/DB/7P3CG1OWTTS3XX0N9XKCENFI050SH6 (Accessed
September 2012)
United Nations. 2012b. Framework Convention on Climate Change, Clean Development
Mechanism. AMS III.E Avoidance of methane production from decay of biomass through
controlled combustion, gasification, or mechanical/thermal treatment. - Version 16.
http://cdm.unfccc.int/methodologies/DB/GPWCV89KQ7IFPEDCXA92BL6XK7JR3Y
(Accessed August 2012)
United Nations. 2012c. Framework Convention on Climate Change, Clean Development
Mechanism. AMS III.L Avoidance of methane production from biomass decay through
controlled Pyrolysis – Version 2.0.
Biochar Production for Project Reporting Protocol August 2014
Version 3.0
Page 37 of 82
http://cdm.unfccc.int/methodologies/DB/72XV0Z89701S2D87UBPFD57WE5AFP5 (Accessed
August 2012)
United Nations. 2012d. Framework Convention on Climate Change, Clean Development
Mechanism. Combined tool to identify the Baseline Scenario and demonstrate Additionality.
http://cdm.unfccc.int/methodologies/PAmethodologies/tools/am-tool-02-v4.0.0.pdf/history_view
(Accessed September 2012)
United Nations. 2012e. Framework Convention on Climate Change, Clean Development
Mechanism. Methodological tool: Tool for the demonstration and assessment of Additionality
http://cdm.unfccc.int/methodologies/PAmethodologies/tools/am-tool-01-v5.2.pdf/history_view
(Accessed August 2012)
United Nations. 2012f. Framework Convention on Climate Change, Clean Development
Mechanism. Tool to determine methane emissions avoided from disposal of waste at a Solid
Waste Disposal Site. http://cdm.unfccc.int/methodologies/PAmethodologies/tools/am-tool-04-
v4.pdf/history_view (Accessed September 2012)
United Nations. 2012g. Framework Convention on Climate Change: Parties and Observers.
http://unfccc.int/parties_and_observers/items/2704.php (Accessed August 2012)
United Nations. 2012h. Framework Convention on Climate Change, Clean Development
Mechanism. Approved consolidated baseline and monitoring Methodology ACM0022
“Alternative waste treatment processes.”
http://cdm.unfccc.int/methodologies/DB/V6E6Y5C7KYQAB6CW8BD9CDO0767BOW/view.ht
ml (Accessed October 2012)
United Nations. 2012i. Framework Convention on Climate Change, Clean Development
Mechanism. Approved consolidated baseline Methodology ACM0010 Consolidated baseline
Methodology for GHG emission reductions from manure management systems. Version 07.0.0.
http://cdm.unfccc.int/methodologies/DB/FP0LYUJJMH0CE6O4KLG8PC24XXPEXF (Accessed
November 2012)
United Nations. 2012j. Framework Convention on Climate Change, Clean Development
Mechanism. Project and leakage emissions from transportation of freight. Version 01.1.0.
http://cdm.unfccc.int/methodologies/PAmethodologies/tools/am-tool-12-v1.1.0.pdf (Accessed
September 2012)
United States Environmental Protection Agency. 2011. Summary of the EPA Municipal Solid
Waste program. http://www.epa.gov/reg3wcmd/solidwastesummary.htm (Accessed July 2012)
Woolf, D., and Lehmann, J. 2012. Modeling the long-term response to positive and negative
priming of soil organic carbon by black carbon. August 2012. Biogeochemistry. DOI:
10.1007/s10533-012-9764-6
Biochar Production for Project Reporting Protocol August 2014
Version 3.0
Page 38 of 82
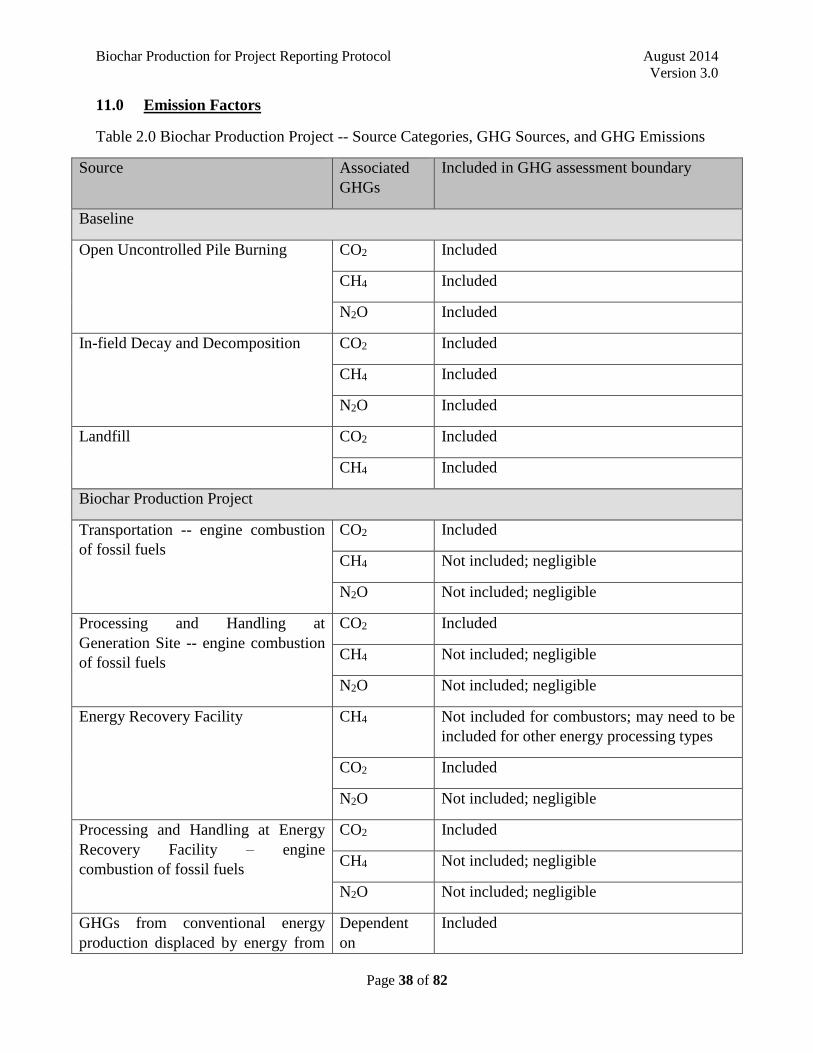
11.0 Emission Factors
Table 2.0 Biochar Production Project -- Source Categories, GHG Sources, and GHG Emissions
Source Associated
GHGs
Included in GHG assessment boundary
Baseline
Open Uncontrolled Pile Burning CO2 Included
CH4 Included
N2O Included
In-field Decay and Decomposition CO2 Included
CH4 Included
N2O Included
Landfill CO2 Included
CH4 Included
Biochar Production Project
Transportation -- engine combustion
of fossil fuels
CO2 Included
CH4 Not included; negligible
N2O Not included; negligible
Processing and Handling at
Generation Site -- engine combustion
of fossil fuels
CO2 Included
CH4 Not included; negligible
N2O Not included; negligible
Energy Recovery Facility CH4 Not included for combustors; may need to be
included for other energy processing types
CO2 Included
N2O Not included; negligible
Processing and Handling at Energy
Recovery Facility – engine
combustion of fossil fuels
CO2 Included
CH4 Not included; negligible
N2O Not included; negligible
GHGs from conventional energy
production displaced by energy from
Dependent
on
Included
Biochar Production for Project Reporting Protocol August 2014
Version 3.0
Page 39 of 82
biomass waste conventional
energy
source
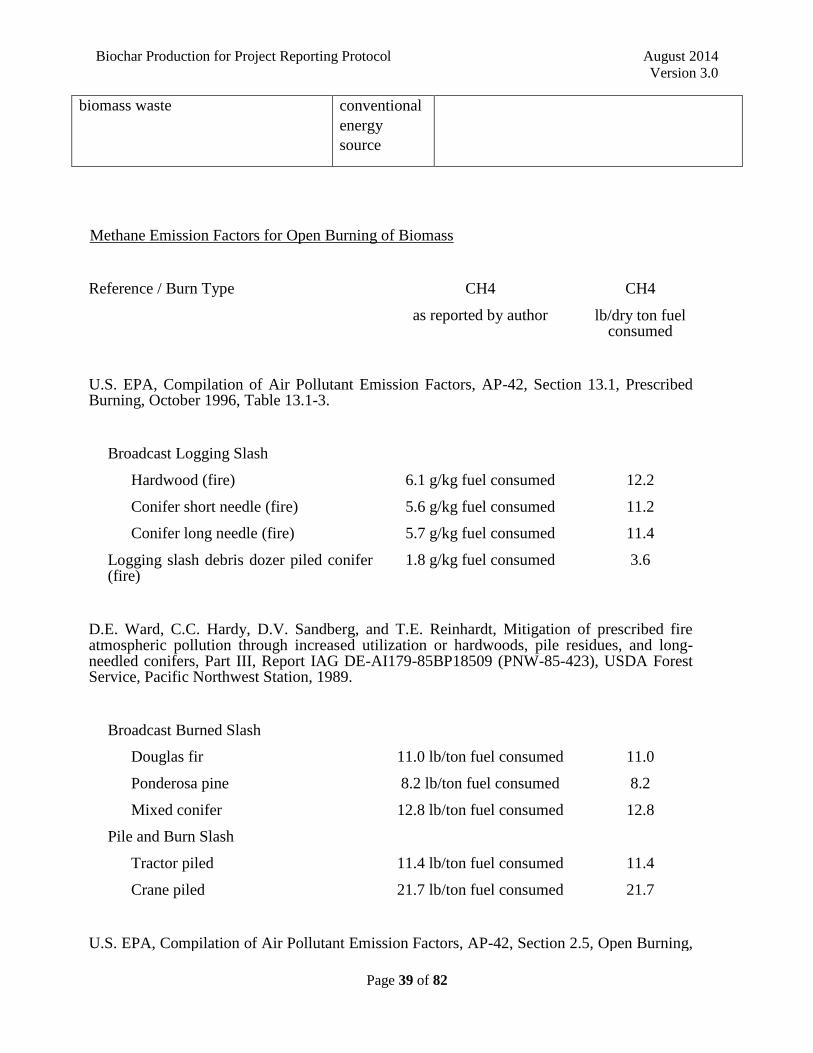
Methane Emission Factors for Open Burning of Biomass
Reference / Burn Type CH4
as reported by author
CH4
lb/dry ton fuel consumed
U.S. EPA, Compilation of Air Pollutant Emission Factors, AP-42, Section 13.1, Prescribed Burning, October 1996, Table 13.1-3.
Broadcast Logging Slash
Hardwood (fire) 6.1 g/kg fuel consumed 12.2
Conifer short needle (fire) 5.6 g/kg fuel consumed 11.2
Conifer long needle (fire) 5.7 g/kg fuel consumed 11.4
Logging slash debris dozer piled conifer (fire)
1.8 g/kg fuel consumed 3.6
D.E. Ward, C.C. Hardy, D.V. Sandberg, and T.E. Reinhardt, Mitigation of prescribed fire atmospheric pollution through increased utilization or hardwoods, pile residues, and long-needled conifers, Part III, Report IAG DE-AI179-85BP18509 (PNW-85-423), USDA Forest Service, Pacific Northwest Station, 1989.
Broadcast Burned Slash
Douglas fir 11.0 lb/ton fuel consumed 11.0
Ponderosa pine 8.2 lb/ton fuel consumed 8.2
Mixed conifer 12.8 lb/ton fuel consumed 12.8
Pile and Burn Slash
Tractor piled 11.4 lb/ton fuel consumed 11.4
Crane piled 21.7 lb/ton fuel consumed 21.7
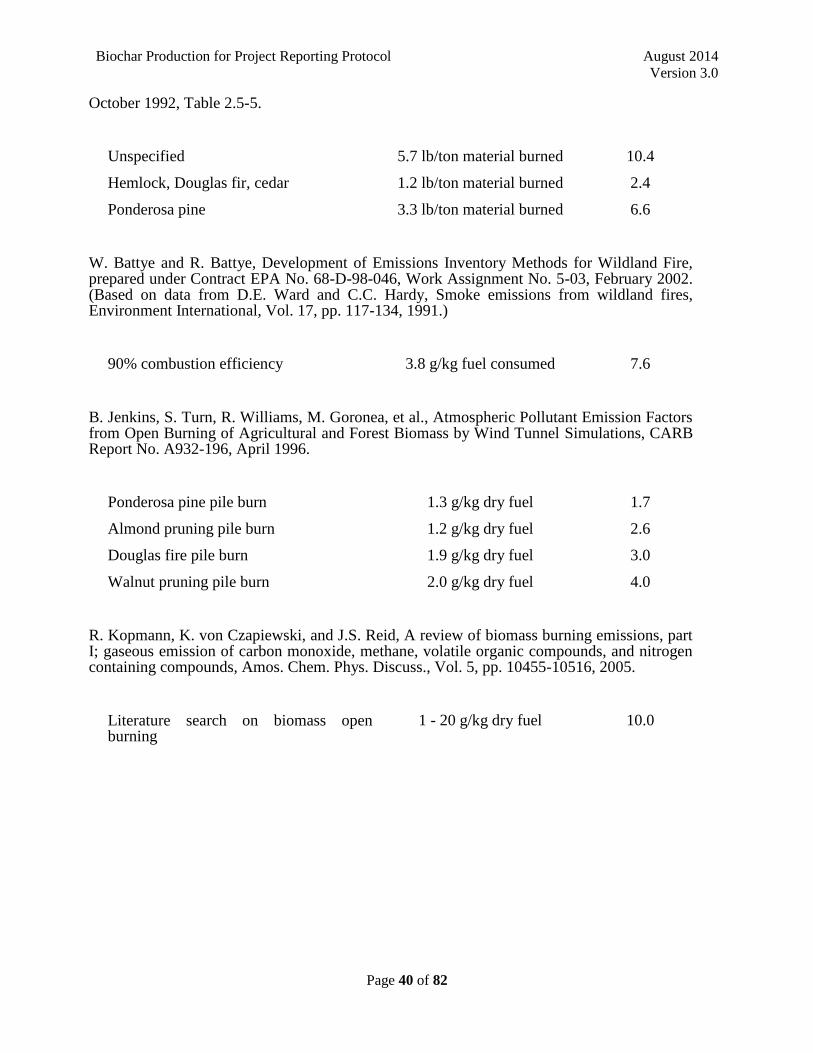
U.S. EPA, Compilation of Air Pollutant Emission Factors, AP-42, Section 2.5, Open Burning,
Biochar Production for Project Reporting Protocol August 2014
Version 3.0
Page 40 of 82
October 1992, Table 2.5-5.
Unspecified 5.7 lb/ton material burned 10.4
Hemlock, Douglas fir, cedar 1.2 lb/ton material burned 2.4
Ponderosa pine 3.3 lb/ton material burned 6.6
W. Battye and R. Battye, Development of Emissions Inventory Methods for Wildland Fire, prepared under Contract EPA No. 68-D-98-046, Work Assignment No. 5-03, February 2002. (Based on data from D.E. Ward and C.C. Hardy, Smoke emissions from wildland fires, Environment International, Vol. 17, pp. 117-134, 1991.)
90% combustion efficiency 3.8 g/kg fuel consumed 7.6
B. Jenkins, S. Turn, R. Williams, M. Goronea, et al., Atmospheric Pollutant Emission Factors from Open Burning of Agricultural and Forest Biomass by Wind Tunnel Simulations, CARB Report No. A932-196, April 1996.
Ponderosa pine pile burn 1.3 g/kg dry fuel 1.7
Almond pruning pile burn 1.2 g/kg dry fuel 2.6
Douglas fire pile burn 1.9 g/kg dry fuel 3.0
Walnut pruning pile burn 2.0 g/kg dry fuel 4.0
R. Kopmann, K. von Czapiewski, and J.S. Reid, A review of biomass burning emissions, part I; gaseous emission of carbon monoxide, methane, volatile organic compounds, and nitrogen containing compounds, Amos. Chem. Phys. Discuss., Vol. 5, pp. 10455-10516, 2005.
Literature search on biomass open burning
1 - 20 g/kg dry fuel 10.0
Biochar Production for Project Reporting Protocol August 2014
Version 3.0
Page 41 of 82
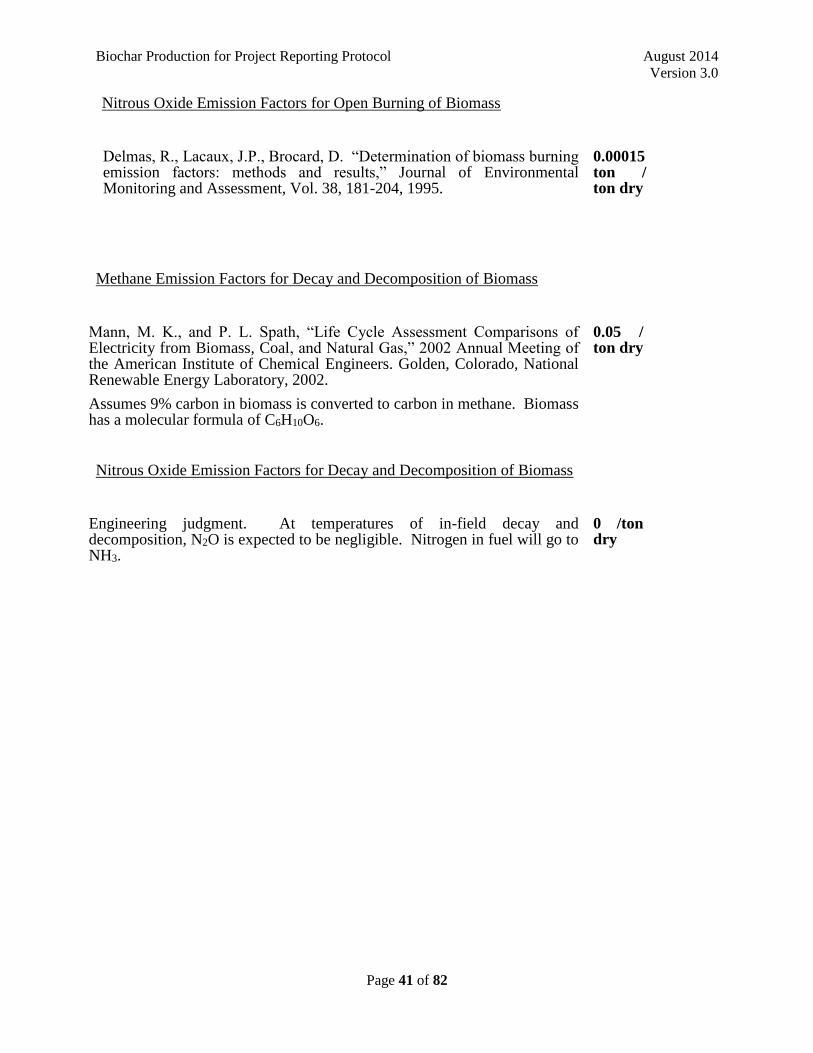
Nitrous Oxide Emission Factors for Open Burning of Biomass
Delmas, R., Lacaux, J.P., Brocard, D. “Determination of biomass burning emission factors: methods and results,” Journal of Environmental Monitoring and Assessment, Vol. 38, 181-204, 1995.
0.00015 ton / ton dry
Methane Emission Factors for Decay and Decomposition of Biomass
Mann, M. K., and P. L. Spath, “Life Cycle Assessment Comparisons of Electricity from Biomass, Coal, and Natural Gas,” 2002 Annual Meeting of the American Institute of Chemical Engineers. Golden, Colorado, National Renewable Energy Laboratory, 2002.
Assumes 9% carbon in biomass is converted to carbon in methane. Biomass has a molecular formula of C6H10O6.
0.05 / ton dry
Nitrous Oxide Emission Factors for Decay and Decomposition of Biomass
Engineering judgment. At temperatures of in-field decay and decomposition, N2O is expected to be negligible. Nitrogen in fuel will go to NH3.
0 /ton dry
Biochar Production for Project Reporting Protocol August 2014
Version 3.0
Page 42 of 82
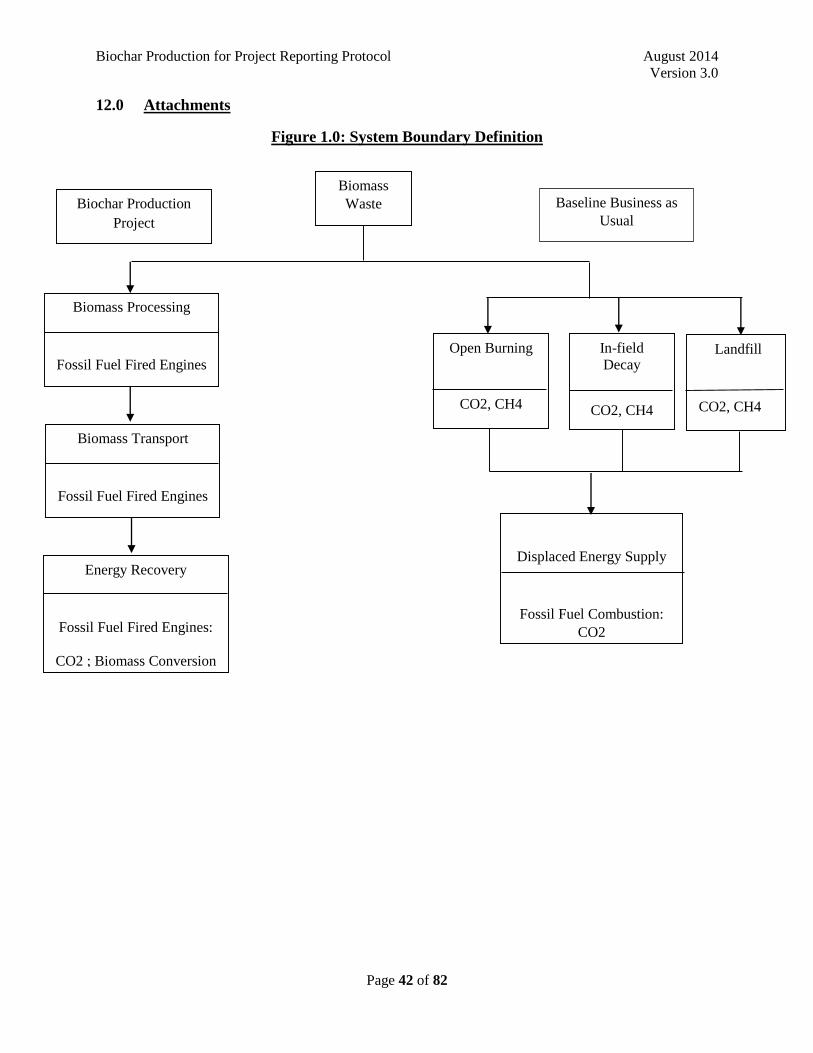
12.0 Attachments
Figure 1.0: System Boundary Definition
Landfill
CO2, CH4
Biomass Processing
Fossil Fuel Fired Engines
Open Burning
CO2, CH4
In-field
Decay
CO2, CH4
Biomass Transport
Fossil Fuel Fired Engines
Energy Recovery
Fossil Fuel Fired Engines:
CO2 ; Biomass Conversion
Displaced Energy Supply
Fossil Fuel Combustion:
CO2
Biomass
Waste Biochar Production
Project
Baseline Business as
Usual

Biochar Production for Project Reporting Protocol August 2014
Version 3.0
Page 43 of 82
Attachment A: Project Definition
Date:
Project Title:
Project Developer:
Project Address:
Anticipated Project
Dates:
Start Date: End Date:
Permitting Status:
Biochar Feedstock Production & Disposal Information
Composition of Biochar
Feedstock (including
moisture content)
Historic, Current, and
Anticipated Disposal
Practice
Biochar Feedstock
Production Rate (green
tons/day)
Cost of Biochar
Feedstock Processing
and Transport ($/green
ton)
Biochar Production Information
Type of Energy
Produced
Electricity Heat Fuels Other
Name & Location of
Energy Recovery
Facility
Generation Rate of
Recovered Energy
(MMBtu/day)
Users/Purchasers of
Recovered Energy
Biochar Production for Project Reporting Protocol August 2014
Version 3.0
Page 44 of 82
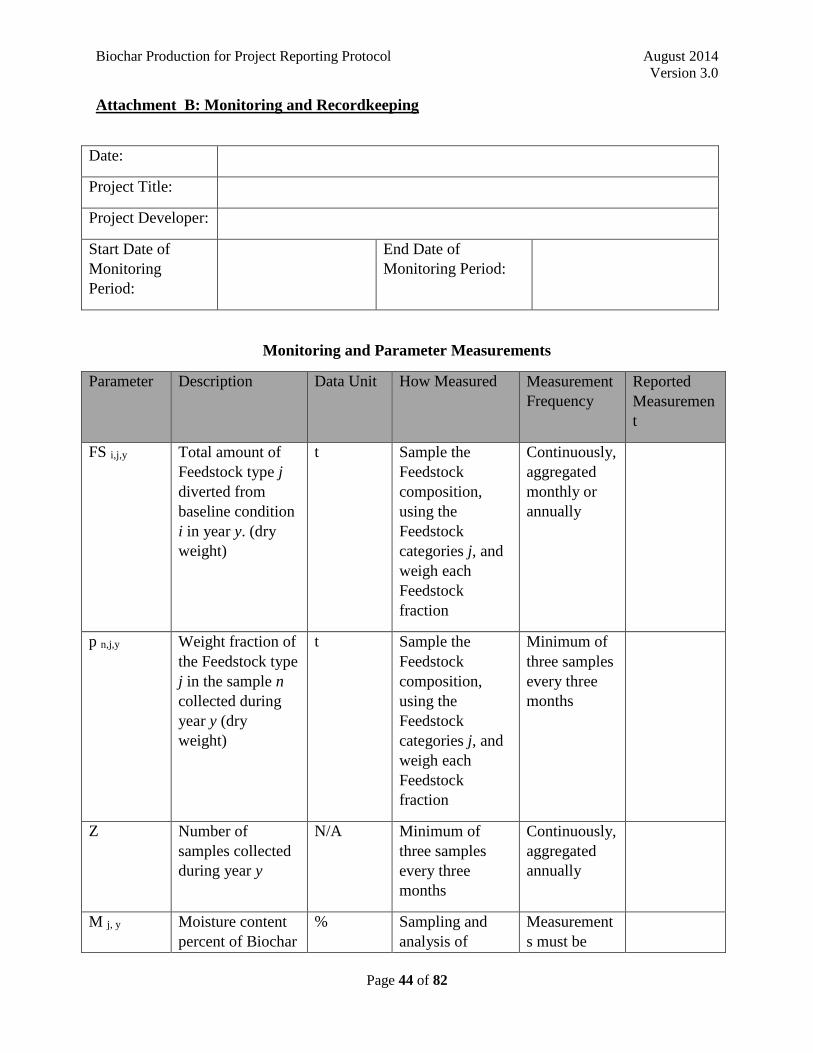
Attachment B: Monitoring and Recordkeeping
Date:
Project Title:
Project Developer:
Start Date of
Monitoring
Period:
End Date of
Monitoring Period:
Monitoring and Parameter Measurements
Parameter Description Data Unit How Measured Measurement
Frequency
Reported
Measuremen
t
FS i,j,y Total amount of
Feedstock type j
diverted from
baseline condition
i in year y. (dry
weight)
t Sample the
Feedstock
composition,
using the
Feedstock
categories j, and
weigh each
Feedstock
fraction
Continuously,
aggregated
monthly or
annually
p n,j,y Weight fraction of
the Feedstock type
j in the sample n
collected during
year y (dry
weight)
t Sample the
Feedstock
composition,
using the
Feedstock
categories j, and
weigh each
Feedstock
fraction
Minimum of
three samples
every three
months
Z Number of
samples collected
during year y
N/A Minimum of
three samples
every three
months
Continuously,
aggregated
annually
M j, y Moisture content
percent of Biochar
% Sampling and
analysis of
Measurement
s must be
Biochar Production for Project Reporting Protocol August 2014
Version 3.0
Page 45 of 82
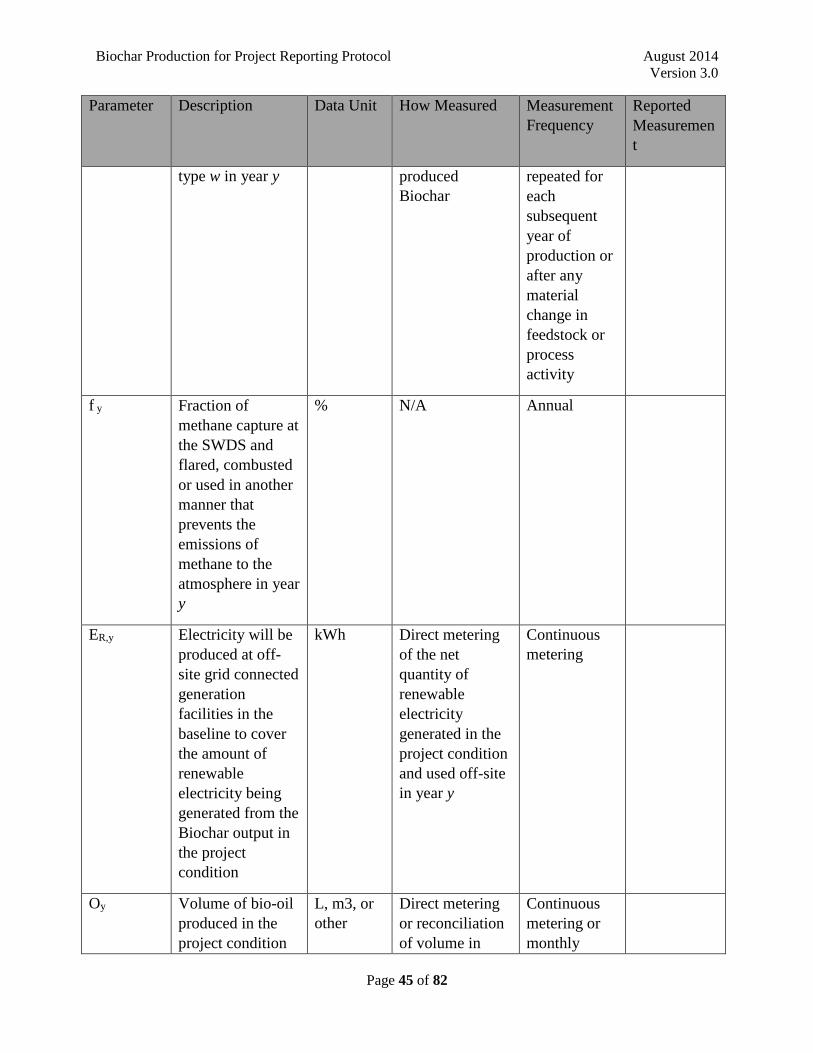
Parameter Description Data Unit How Measured Measurement
Frequency
Reported
Measuremen
t
type w in year y produced
Biochar
repeated for
each
subsequent
year of
production or
after any
material
change in
feedstock or
process
activity
f y Fraction of
methane capture at
the SWDS and
flared, combusted
or used in another
manner that
prevents the
emissions of
methane to the
atmosphere in year
y
% N/A Annual
ER,y Electricity will be
produced at off-
site grid connected
generation
facilities in the
baseline to cover
the amount of
renewable
electricity being
generated from the
Biochar output in
the project
condition
kWh Direct metering
of the net
quantity of
renewable
electricity
generated in the
project condition
and used off-site
in year y
Continuous
metering
Oy Volume of bio-oil
produced in the
project condition
L, m3, or
other
Direct metering
or reconciliation
of volume in
Continuous
metering or
monthly
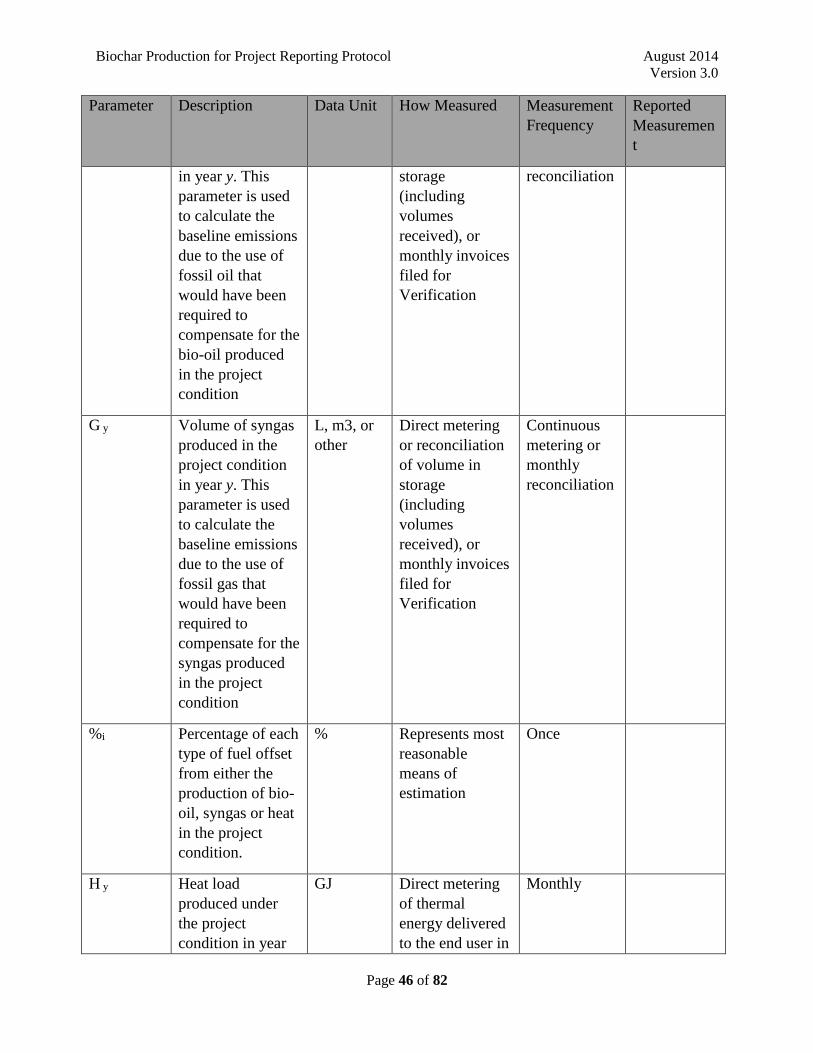
Biochar Production for Project Reporting Protocol August 2014
Version 3.0
Page 46 of 82
Parameter Description Data Unit How Measured Measurement
Frequency
Reported
Measuremen
t
in year y. This
parameter is used
to calculate the
baseline emissions
due to the use of
fossil oil that
would have been
required to
compensate for the
bio-oil produced
in the project
condition
storage
(including
volumes
received), or
monthly invoices
filed for
Verification
reconciliation
G y Volume of syngas
produced in the
project condition
in year y. This
parameter is used
to calculate the
baseline emissions
due to the use of
fossil gas that
would have been
required to
compensate for the
syngas produced
in the project
condition
L, m3, or
other
Direct metering
or reconciliation
of volume in
storage
(including
volumes
received), or
monthly invoices
filed for
Verification
Continuous
metering or
monthly
reconciliation
%i Percentage of each
type of fuel offset
from either the
production of bio-
oil, syngas or heat
in the project
condition.
% Represents most
reasonable
means of
estimation
Once
H y Heat load
produced under
the project
condition in year
GJ Direct metering
of thermal
energy delivered
to the end user in
Monthly
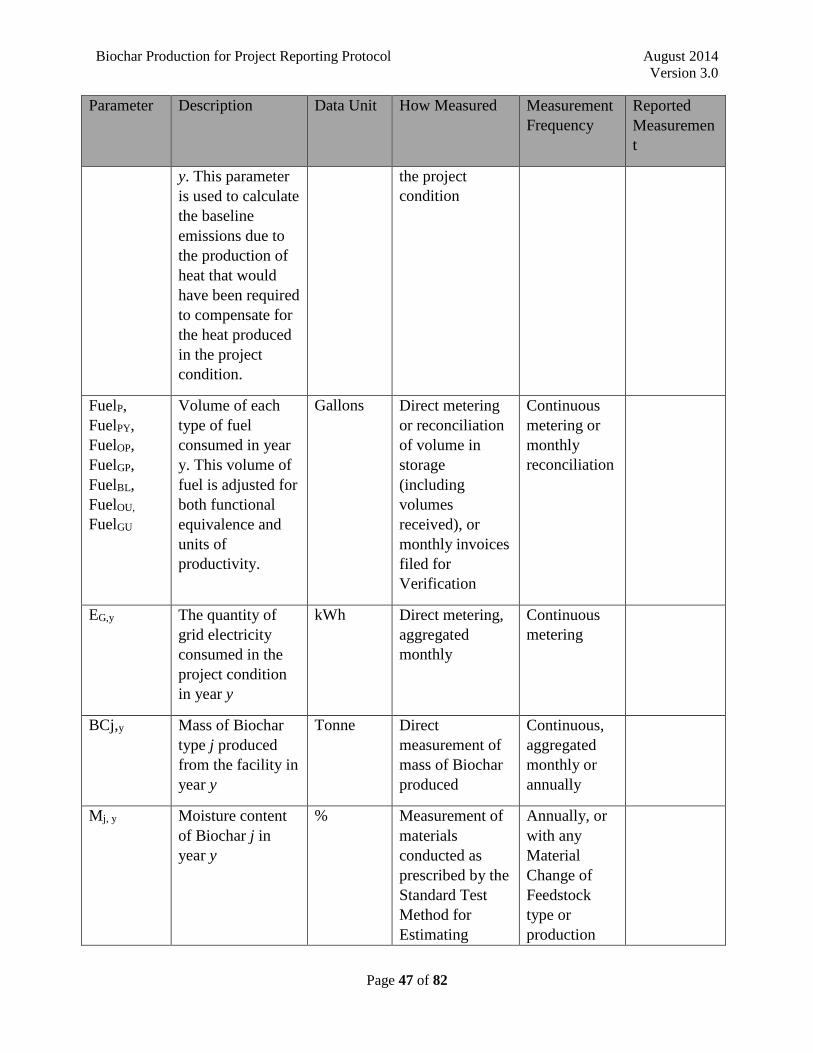
Biochar Production for Project Reporting Protocol August 2014
Version 3.0
Page 47 of 82
Parameter Description Data Unit How Measured Measurement
Frequency
Reported
Measuremen
t
y. This parameter
is used to calculate
the baseline
emissions due to
the production of
heat that would
have been required
to compensate for
the heat produced
in the project
condition.
the project
condition
FuelP,
FuelPY,
FuelOP,
FuelGP,
FuelBL,
FuelOU,
FuelGU
Volume of each
type of fuel
consumed in year
y. This volume of
fuel is adjusted for
both functional
equivalence and
units of
productivity.
Gallons Direct metering
or reconciliation
of volume in
storage
(including
volumes
received), or
monthly invoices
filed for
Verification
Continuous
metering or
monthly
reconciliation
EG,y The quantity of
grid electricity
consumed in the
project condition
in year y
kWh Direct metering,
aggregated
monthly
Continuous
metering
BCj,y Mass of Biochar
type j produced
from the facility in
year y
Tonne Direct
measurement of
mass of Biochar
produced
Continuous,
aggregated
monthly or
annually
Mj, y Moisture content
of Biochar j in
year y
% Measurement of
materials
conducted as
prescribed by the
Standard Test
Method for
Estimating
Annually, or
with any
Material
Change of
Feedstock
type or
production
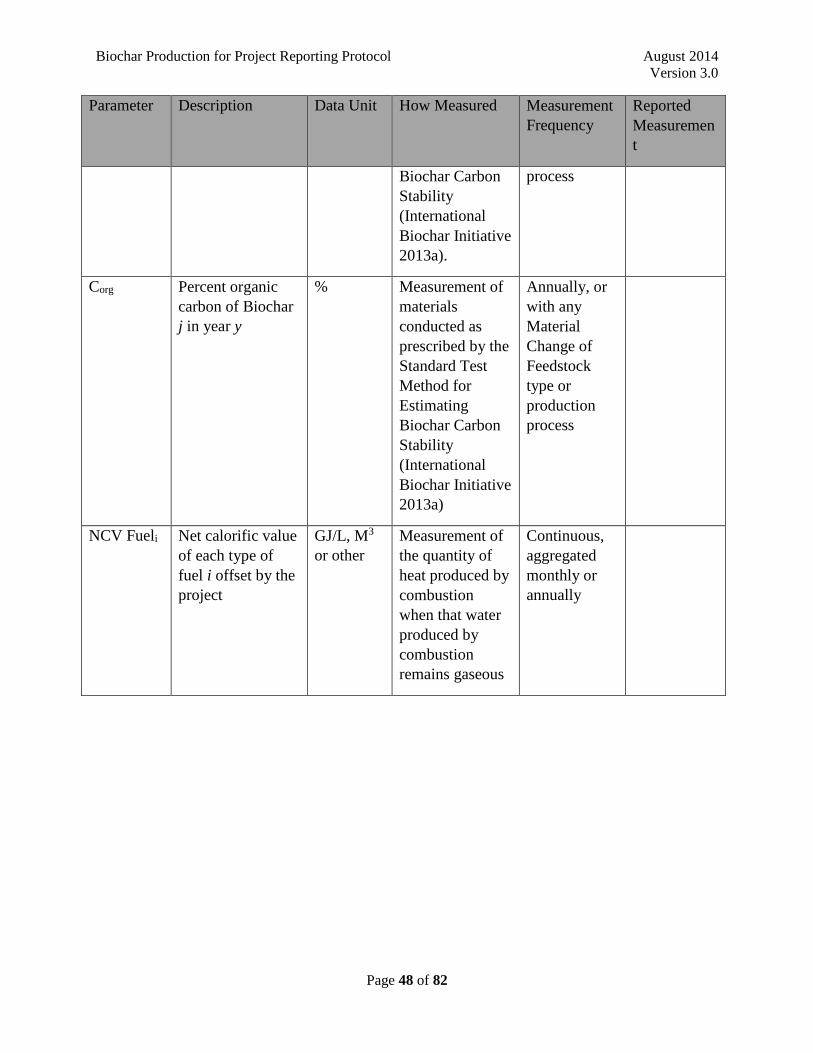
Biochar Production for Project Reporting Protocol August 2014
Version 3.0
Page 48 of 82
Parameter Description Data Unit How Measured Measurement
Frequency
Reported
Measuremen
t
Biochar Carbon
Stability
(International
Biochar Initiative
2013a).
process
Corg Percent organic
carbon of Biochar
j in year y
% Measurement of
materials
conducted as
prescribed by the
Standard Test
Method for
Estimating
Biochar Carbon
Stability
(International
Biochar Initiative
2013a)
Annually, or
with any
Material
Change of
Feedstock
type or
production
process
NCV Fueli Net calorific value
of each type of
fuel i offset by the
project
GJ/L, M3
or other
Measurement of
the quantity of
heat produced by
combustion
when that water
produced by
combustion
remains gaseous
Continuous,
aggregated
monthly or
annually
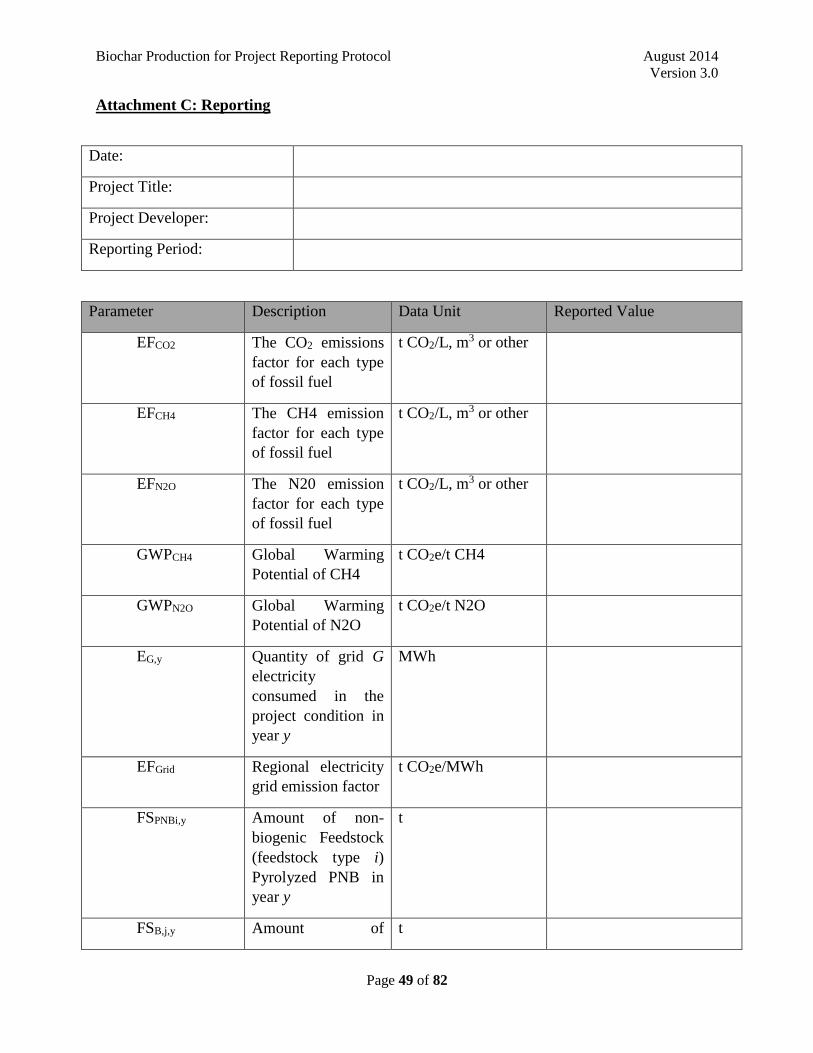
Biochar Production for Project Reporting Protocol August 2014
Version 3.0
Page 49 of 82
Attachment C: Reporting
Date:
Project Title:
Project Developer:
Reporting Period:
Parameter Description Data Unit Reported Value
EFCO2 The CO2 emissions
factor for each type
of fossil fuel
t CO2/L, m3 or other
EFCH4 The CH4 emission
factor for each type
of fossil fuel
t CO2/L, m3 or other
EFN2O The N20 emission
factor for each type
of fossil fuel
t CO2/L, m3 or other
GWPCH4 Global Warming
Potential of CH4
t CO2e/t CH4
GWPN2O Global Warming
Potential of N2O
t CO2e/t N2O
EG,y Quantity of grid G
electricity
consumed in the
project condition in
year y
MWh
EFGrid Regional electricity
grid emission factor
t CO2e/MWh
FSPNBi,y Amount of non-
biogenic Feedstock
(feedstock type i)
Pyrolyzed PNB in
year y
t
FSB,j,y Amount of t
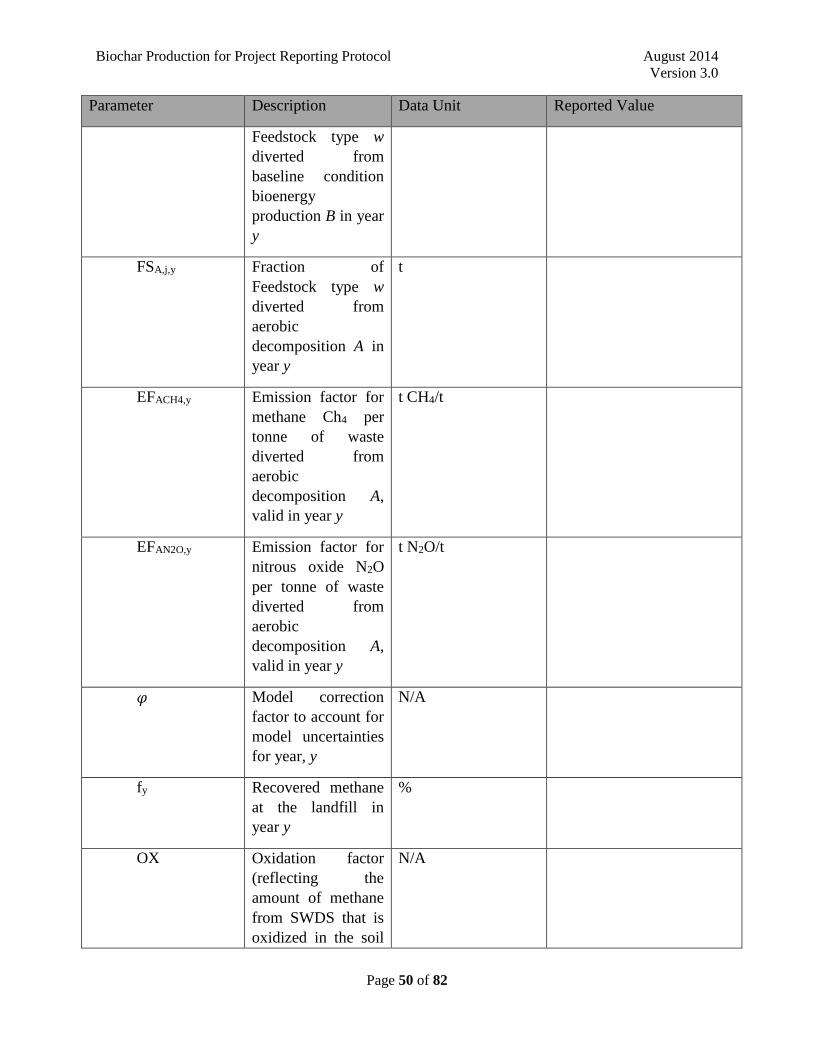
Biochar Production for Project Reporting Protocol August 2014
Version 3.0
Page 50 of 82
Parameter Description Data Unit Reported Value
Feedstock type w
diverted from
baseline condition
bioenergy
production B in year
y
FSA,j,y Fraction of
Feedstock type w
diverted from
aerobic
decomposition A in
year y
t
EFACH4,y Emission factor for
methane Ch4 per
tonne of waste
diverted from
aerobic
decomposition A,
valid in year y
t CH4/t
EFAN2O,y Emission factor for
nitrous oxide N2O
per tonne of waste
diverted from
aerobic
decomposition A,
valid in year y
t N2O/t
𝜑 Model correction
factor to account for
model uncertainties
for year, y
N/A
fy Recovered methane
at the landfill in
year y
%
OX Oxidation factor
(reflecting the
amount of methane
from SWDS that is
oxidized in the soil
N/A
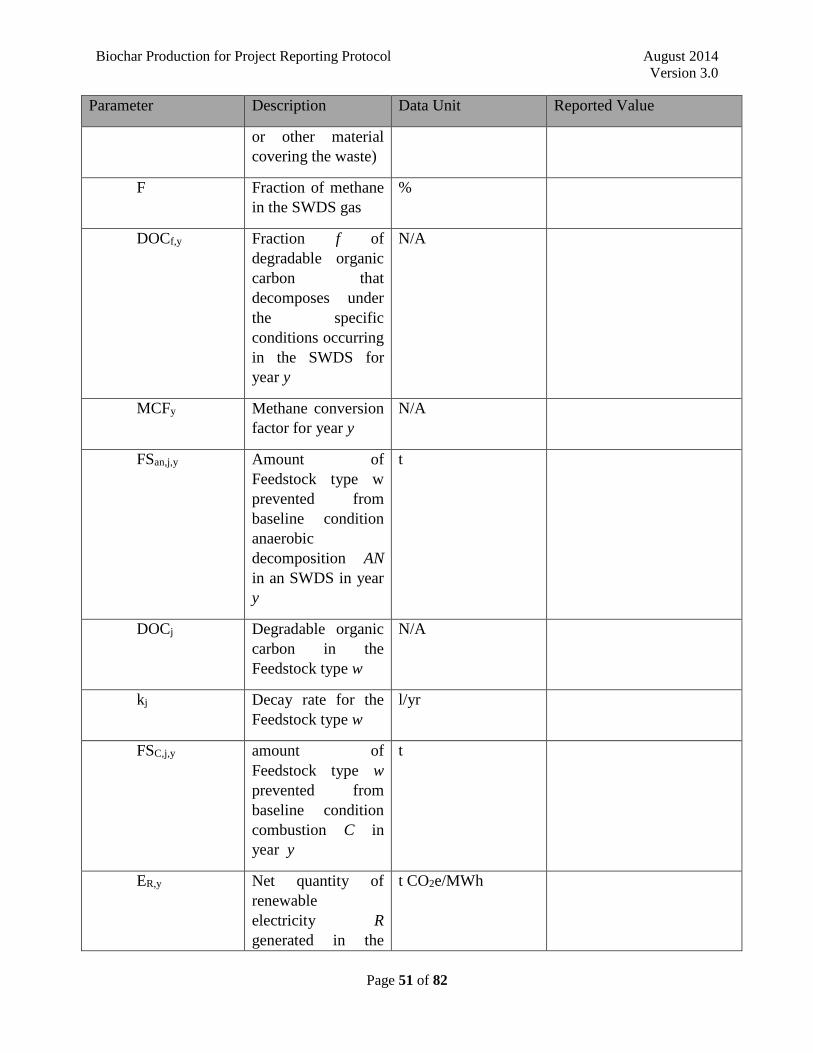
Biochar Production for Project Reporting Protocol August 2014
Version 3.0
Page 51 of 82
Parameter Description Data Unit Reported Value
or other material
covering the waste)
F Fraction of methane
in the SWDS gas
%
DOCf,y Fraction f of
degradable organic
carbon that
decomposes under
the specific
conditions occurring
in the SWDS for
year y
N/A
MCFy Methane conversion
factor for year y
N/A
FSan,j,y Amount of
Feedstock type w
prevented from
baseline condition
anaerobic
decomposition AN
in an SWDS in year
y
t
DOCj Degradable organic
carbon in the
Feedstock type w
N/A
kj Decay rate for the
Feedstock type w
l/yr
FSC,j,y amount of
Feedstock type w
prevented from
baseline condition
combustion C in
year y
t
ER,y Net quantity of
renewable
electricity R
generated in the
t CO2e/MWh
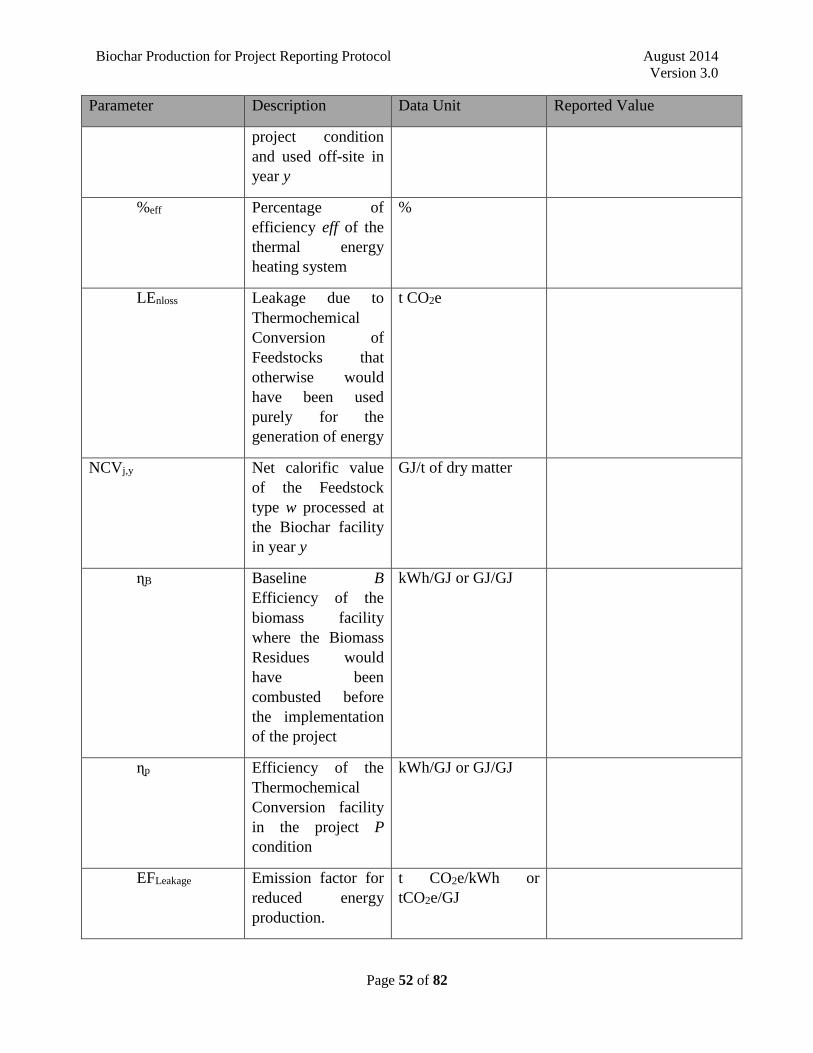
Biochar Production for Project Reporting Protocol August 2014
Version 3.0
Page 52 of 82
Parameter Description Data Unit Reported Value
project condition
and used off-site in
year y
%eff Percentage of
efficiency eff of the
thermal energy
heating system
%
LEnloss Leakage due to
Thermochemical
Conversion of
Feedstocks that
otherwise would
have been used
purely for the
generation of energy
t CO2e
NCVj,y Net calorific value
of the Feedstock
type w processed at
the Biochar facility
in year y
GJ/t of dry matter
ɳB Baseline B
Efficiency of the
biomass facility
where the Biomass
Residues would
have been
combusted before
the implementation
of the project
kWh/GJ or GJ/GJ
ɳp Efficiency of the
Thermochemical
Conversion facility
in the project P
condition
kWh/GJ or GJ/GJ
EFLeakage Emission factor for
reduced energy
production.
t CO2e/kWh or
tCO2e/GJ
Biochar Production for Project Reporting Protocol August 2014
Version 3.0
Page 53 of 82
13.0 Appendix
Appendix A: Standard test method for estimating Biochar carbon stability (BC+100)
Scope
This test method provides the calculations needed to estimate the amount of carbon that is
expected to remain in Biochar after a period of 100 years (BC+100), which is considered “stable”
for the purpose of determining a GHG emissions reduction value. This stable portion of the
carbon sequestered in Biochar is deducted from Project Emissions in Equation 1. As part of that
method, this covers the determination of hydrogen, total carbon and organic carbon in a sample
of Biochar.
This document builds upon previous work coordinated by The International Biochar Initiative
(IBI) to develop the “Standardized Product Definition and Product Testing Guidelines for
Biochar that Is Used in Soil” (International Biochar Initiative 2012). This document constrains
its scope to materials with properties that satisfy the criteria for Biochar as defined by the IBI
Standards (International Biochar Initiative 2012).
This Standard test method does not purport to address all of the safety concerns, if any,
associated with use of Biochar. It is the responsibility of the user of this Standard test method to
establish appropriate safety and health practices and determine the applicability of regulatory
limitations prior to use. The minimum safety equipment should include protective gloves and
sturdy eye and face protection.
Terminology
Biochar – A solid material obtained from the thermochemical conversion of biomass in an
oxygen-limited environment (International Biochar Initiative 2012) that complies with the
definition in the IBI Biochar Standards 2012.
BC+100 – The fraction of carbon present in Biochar that is expected to remain in soil for at least
100 years (Kyoto Protocol 1998) when added to soil.
Total carbon – The total amount of carbon in a sample, both organic and inorganic.
Organic carbon – The fraction of carbon in the sample that is derived from biogenic material.
Inorganic carbon – The fraction of material derived from geologic or soil parent material
(Schumacher, 2002), which is mineral. Carbon Dioxide, salts of carbonates and soluble
carbonates are the most common forms of inorganic carbon.
Summary of Test Method
The sample is prepared in a specified manner (see section 6). An elemental analyzer is used to
determine hydrogen and total carbon in the Biochar sample. Inorganic carbon is measured and
subtracted from total carbon to estimate the organic carbon (Corg) content, which allows the
calculation of the molar ratio of hydrogen to organic carbon (H/Corg). Finally, the calculated
Biochar Production for Project Reporting Protocol August 2014
Version 3.0
Page 54 of 82
H/Corg value is converted into its equivalent BC+100 value – based on the report Biochar Carbon
Stability Test Method: An Assessment of Methods to Determine Biochar Carbon Stability –
needed to calculate the amount of stable (+100) Biochar carbon sequestration (CBS,y) as used in
equations (1) and (11) GHG.
Significance and Use
The production of Biochar can qualify as a carbon sequestration strategy because of the
increased stability of Biochar carbon that is obtained through Thermochemical Conversion. This
test method allows for the determination of the GHG emission reduction that could be claimed
through the production of Biochar, based on the carbon estimated to remain stable in Biochar
after 100 years.
Apparatus and Reagents
Use only reagents of recognized analytical grade.
105°C ±2 drying oven
200°C heat resistant drying vessel (high silica or porcelain evaporating dish)
Balance (0.01 g capacity)
Mortar and Pestle
#10 (2 mm) Sieve
Elemental analyzer for Hydrogen and Carbon
Rapid Carbonate Analyzer (ASTM D4373 fig.2)
1 N HCl
Reagent Grade Calcium Carbonate (CaCO3)
20mL Graduated Cylinder
Sample Collection and Handling
Development of appropriate sampling plans
As mentioned in the United States Environmental Protection Agency (EPA) Manual SW-846
(US Environmental Protection Agency 2006), which addresses the development and
implementation of a scientifically credible sampling plan and the documentation of the chain of
custody for such a plan, the initial, and perhaps most critical, element in a program designed to
evaluate the physical and chemical properties of a sample (in this case, of Biochar), is the
sampling plan.
A sampling plan is usually a written document that describes objectives and tasks and identifies
how the individual tasks will be performed. The SW-846 Manual (US Environmental Protection
Agency 2006) suggests that a sampling plan should be designed with input from the various
sectors involved in the project, which include: regulatory sampling, end-users, field team
members, analytical chemists, process engineers or equivalent, statisticians and quality assurance
representatives.
Biochar Production for Project Reporting Protocol August 2014
Version 3.0
Page 55 of 82
The referenced manual describes a number of sampling procedures (simple, stratified, systematic
random, composite), of which one must be selected which is most appropriate, according to the
characteristics of the sampled object. The team involved in the elaboration of the sampling plan
must therefore consult the SW-846 Manual during the development of a sampling plan. This test
method proposes the use of composite sampling, as it will help reduce the physical/chemical
heterogeneity of a sample.
Sample selection and frequency
The sample shall be selected so as to be representative of all the material contained in a
production lot. This is achieved by employing a composite sampling procedure (US
Environmental Protection Agency 2006), which requires the collection of multiple random sub-
samples from the final volume of produced Biochar, and mixing them together to obtain a
homogeneous sample of no less than 500 g. It needs to be demonstrated that the sample size is
representative of the whole production lot, via statistical analysis. Samples must be taken:
- Annually; or
- After a material change in Feedstock; or
- After a material change in thermochemical production parameters;
Whichever is more frequent.
Material changes (International Biochar Initiative 2012, section 6.2) in Feedstock reflect shifts in
Feedstock type from one source of biomass to a distinctly different source of biomass. See
Appendix 4 of the IBI Standards (International Biochar Initiative 2012) for more information on
how to determine Feedstock types that constitute a “material change”. In mixed Feedstocks,
whether processed or unprocessed, a 10% or greater shift in total Feedstock composition shall
constitute a material change in Feedstock.
Material changes in production processes reflect increases or decreases in process temperature or
residence time. A material change in thermochemical production parameters has occurred if
process temperature (also known as Heat Treatment Temperature) changes by +/- 50˚C, or if the
thermochemical processing time (residence time) changes by more than 10% of the initial
processing time.
Testing of Biochar materials should occur after thermochemical processing is complete and
before final shipment. If the material is intended to be mixed with another material, testing of the
Biochar material must occur before mixing or blending with any other product.
Additional Considerations for Sampling
Sampling practices should follow a composite sampling procedure (well-mixed batch), where a
single sample (or group of samples) is taken to represent a specific period of production time.
Frequency of sampling depends on the appropriate number of samples needed to achieve the
necessary precision (at least 95% confidence level). Precision is improved by increasing the
number of samples while maintaining a sampling pattern to guarantee a spatially uniform
distribution. The number of samples required is the least amount to generate a sufficiently
precise estimate of the true mean concentration. The number of samples required must also
Biochar Production for Project Reporting Protocol August 2014
Version 3.0
Page 56 of 82
demonstrate that the upper limit of the confidence interval of the true mean is less than
applicable regulatory threshold value. Detailed calculations for the number of samples required
can be found within the US EPA SW-846 manual (US Environmental Protection Agency 2006)
and within the US Composting Council TMECC composting methods manual (US Composting
Council 2001).
Chain of Custody form
Chain of custody forms and procedures should be used with all environmental or regulatory
samples. These forms are used to track sampling and handling from the time of collection
through laboratory analysis and data reporting. The form should include, at a minimum:
collector’s name, signature of collector, date and time of collection, location (place and address)
of collection, identification of sample to be used in all reporting, requested analysis (code
number) and signature of people involved in the chain of possession (a sample form is included
at the end of this document).
Sample preparation
The sample must leave the production facility in a sealed, moisture-proof container for transport
to the analyzing facility, to prevent moisture loss/gain before it is to be analyzed.
Sample Analysis Procedures
Materials
Make replicate determinations and run appropriate Standard reference materials (SRM) with
each analysis to ensure quality.
Moisture
Zero the balance. Place a 200°C heat resilient vessel (high silica or porcelain evaporating dish)
on the balance, and record the mass to the nearest 0.01g (mv).
Working quickly so as to not lose or gain moisture during preparation, mix the sample and place
no less than 5 g in the vessel. Record the mass of the vessel and as-received sample (msr) to the
nearest 0.01 g. Immediately place the vessel containing the sample in a 105°C oven until a
constant mass is reached.
Remove the vessel and sample from the oven and let cool in a desiccator until it reaches room
temperature. Record the mass of the vessel and dried sample (msd) to the nearest 0.01g.
In a clean and dry mortar and pestle place your dried sample and grind it as many times as
necessary until the material passes through a 2mm sieve.
The dried and ground sample will be separated into two sub-samples, with masses determined by
the requirements of the specific equipment to be used for the measurement of H, Ctot and Corg.
Sample quantities must be large enough to complete all analyses. One sub-sample is used to
determine the hydrogen and total carbon and the other to determine organic carbon content via
inorganic carbon measurement and subtraction from measured total carbon.
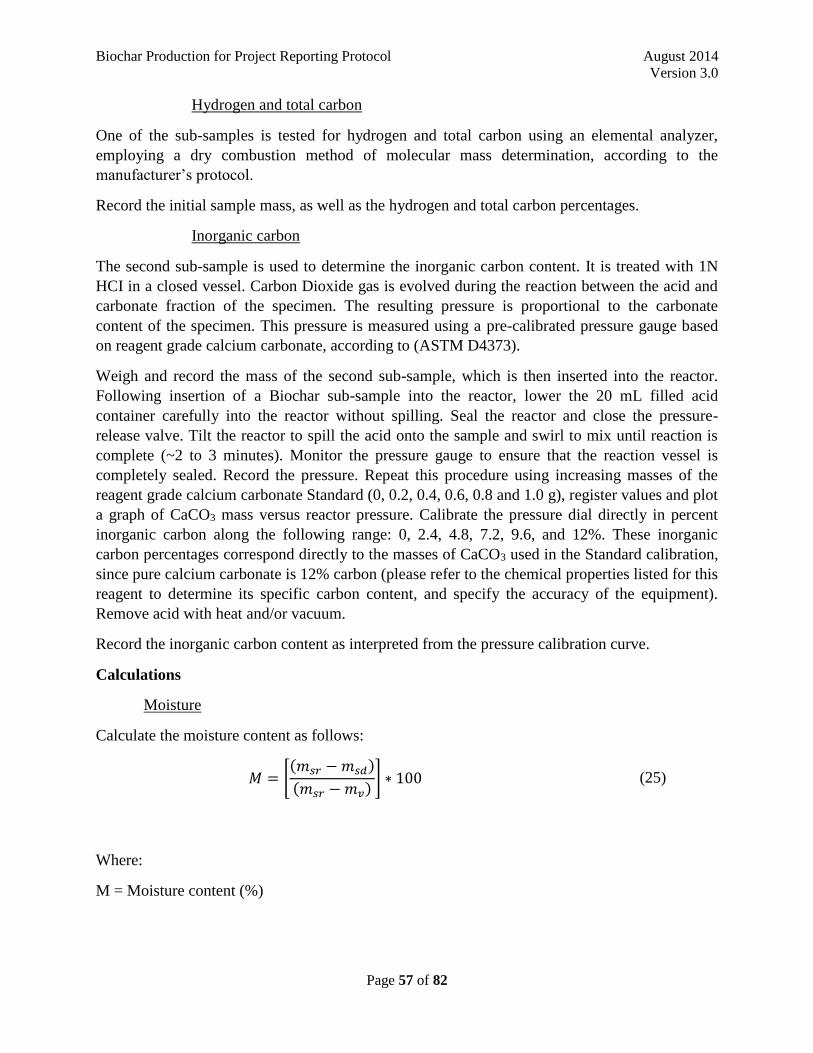
Biochar Production for Project Reporting Protocol August 2014
Version 3.0
Page 57 of 82
Hydrogen and total carbon
One of the sub-samples is tested for hydrogen and total carbon using an elemental analyzer,
employing a dry combustion method of molecular mass determination, according to the
manufacturer’s protocol.
Record the initial sample mass, as well as the hydrogen and total carbon percentages.
Inorganic carbon
The second sub-sample is used to determine the inorganic carbon content. It is treated with 1N
HCI in a closed vessel. Carbon Dioxide gas is evolved during the reaction between the acid and
carbonate fraction of the specimen. The resulting pressure is proportional to the carbonate
content of the specimen. This pressure is measured using a pre-calibrated pressure gauge based
on reagent grade calcium carbonate, according to (ASTM D4373).
Weigh and record the mass of the second sub-sample, which is then inserted into the reactor.
Following insertion of a Biochar sub-sample into the reactor, lower the 20 mL filled acid
container carefully into the reactor without spilling. Seal the reactor and close the pressure-
release valve. Tilt the reactor to spill the acid onto the sample and swirl to mix until reaction is
complete (~2 to 3 minutes). Monitor the pressure gauge to ensure that the reaction vessel is
completely sealed. Record the pressure. Repeat this procedure using increasing masses of the
reagent grade calcium carbonate Standard (0, 0.2, 0.4, 0.6, 0.8 and 1.0 g), register values and plot
a graph of CaCO3 mass versus reactor pressure. Calibrate the pressure dial directly in percent
inorganic carbon along the following range: 0, 2.4, 4.8, 7.2, 9.6, and 12%. These inorganic
carbon percentages correspond directly to the masses of CaCO3 used in the Standard calibration,
since pure calcium carbonate is 12% carbon (please refer to the chemical properties listed for this
reagent to determine its specific carbon content, and specify the accuracy of the equipment).
Remove acid with heat and/or vacuum.
Record the inorganic carbon content as interpreted from the pressure calibration curve.
Calculations
Moisture
Calculate the moisture content as follows:
𝑀 = [(𝑚𝑠𝑟 − 𝑚𝑠𝑑)
(𝑚𝑠𝑟 − 𝑚𝑣)] ∗ 100 (25)
Where:
M = Moisture content (%)
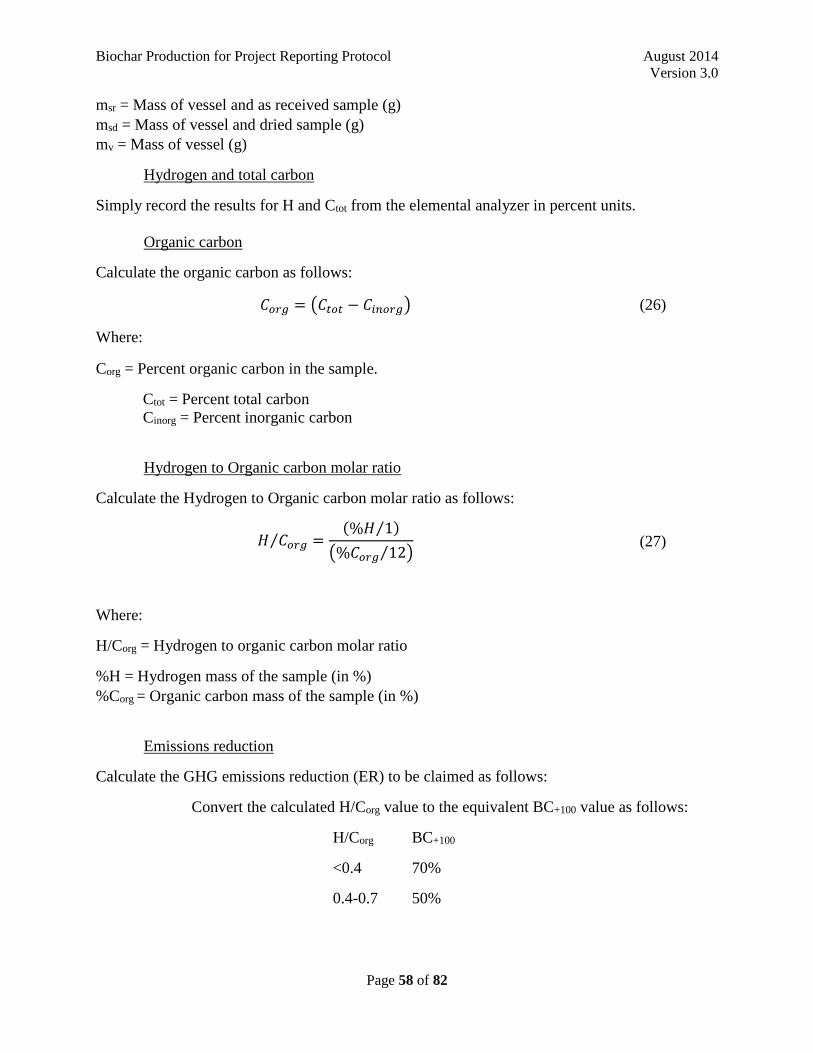
Biochar Production for Project Reporting Protocol August 2014
Version 3.0
Page 58 of 82
msr = Mass of vessel and as received sample (g)
msd = Mass of vessel and dried sample (g)
mv = Mass of vessel (g)
Hydrogen and total carbon
Simply record the results for H and Ctot from the elemental analyzer in percent units.
Organic carbon
Calculate the organic carbon as follows:
𝐶𝑜𝑟𝑔 = (𝐶𝑡𝑜𝑡 − 𝐶𝑖𝑛𝑜𝑟𝑔) (26)
Where:
Corg = Percent organic carbon in the sample.
Ctot = Percent total carbon
Cinorg = Percent inorganic carbon
Hydrogen to Organic carbon molar ratio
Calculate the Hydrogen to Organic carbon molar ratio as follows:
𝐻 𝐶𝑜𝑟𝑔⁄ =(%𝐻 1⁄ )
(%𝐶𝑜𝑟𝑔 12⁄ ) (27)
Where:
H/Corg = Hydrogen to organic carbon molar ratio
%H = Hydrogen mass of the sample (in %)
%Corg = Organic carbon mass of the sample (in %)
Emissions reduction
Calculate the GHG emissions reduction (ER) to be claimed as follows:
Convert the calculated H/Corg value to the equivalent BC+100 value as follows:
H/Corg BC+100
<0.4 70%
0.4-0.7 50%
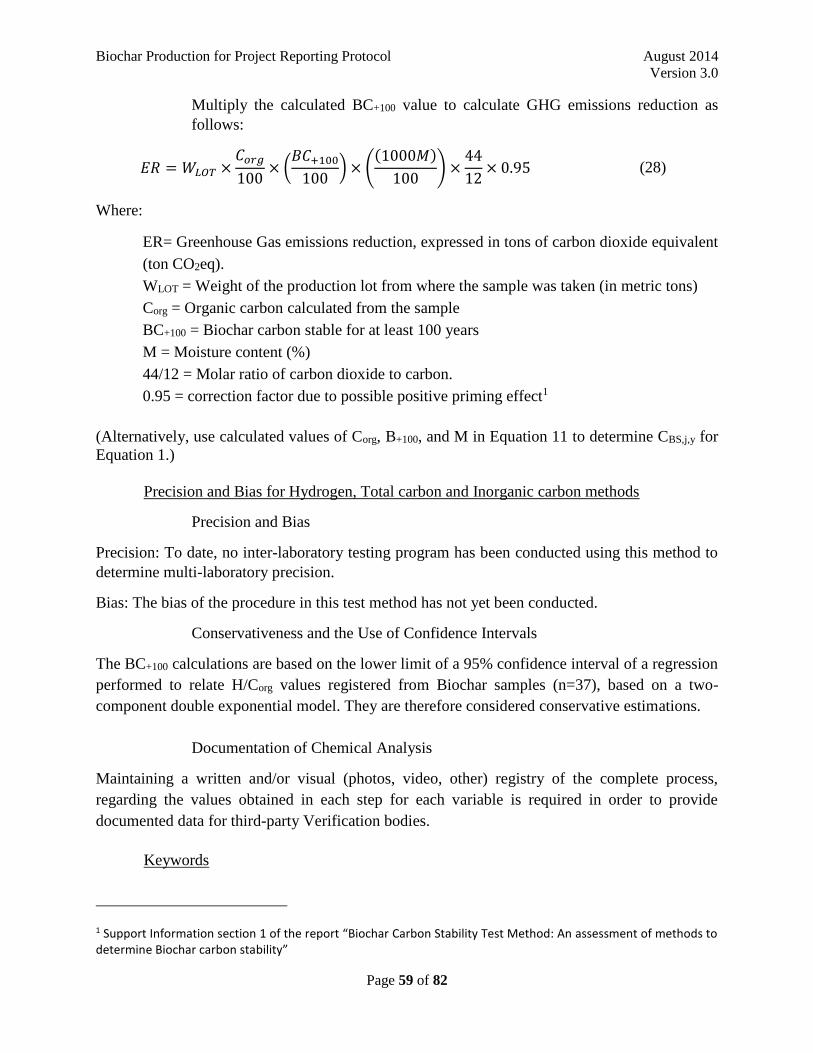
Biochar Production for Project Reporting Protocol August 2014
Version 3.0
Page 59 of 82
Multiply the calculated BC+100 value to calculate GHG emissions reduction as
follows:
𝐸𝑅 = 𝑊𝐿𝑂𝑇 ×𝐶𝑜𝑟𝑔
100× (
𝐵𝐶+100
100) × (
(1000𝑀)
100) ×
44
12× 0.95 (28)
Where:
ER= Greenhouse Gas emissions reduction, expressed in tons of carbon dioxide equivalent
(ton CO2eq).
WLOT = Weight of the production lot from where the sample was taken (in metric tons)
Corg = Organic carbon calculated from the sample
BC+100 = Biochar carbon stable for at least 100 years
M = Moisture content (%)
44/12 = Molar ratio of carbon dioxide to carbon.
0.95 = correction factor due to possible positive priming effect1
(Alternatively, use calculated values of Corg, B+100, and M in Equation 11 to determine CBS,j,y for
Equation 1.)
Precision and Bias for Hydrogen, Total carbon and Inorganic carbon methods
Precision and Bias
Precision: To date, no inter-laboratory testing program has been conducted using this method to
determine multi-laboratory precision.
Bias: The bias of the procedure in this test method has not yet been conducted.
Conservativeness and the Use of Confidence Intervals
The BC+100 calculations are based on the lower limit of a 95% confidence interval of a regression
performed to relate H/Corg values registered from Biochar samples (n=37), based on a two-
component double exponential model. They are therefore considered conservative estimations.
Documentation of Chemical Analysis
Maintaining a written and/or visual (photos, video, other) registry of the complete process,
regarding the values obtained in each step for each variable is required in order to provide
documented data for third-party Verification bodies.
Keywords
1 Support Information section 1 of the report “Biochar Carbon Stability Test Method: An assessment of methods to determine Biochar carbon stability”
Biochar Production for Project Reporting Protocol August 2014
Version 3.0
Page 60 of 82
Biochar, BC+100, hydrogen, total carbon, organic carbon, hydrogen-to-organic carbon molar ratio.
Documents Cited
(1) ASTM D4373 – 96 Standard test method for Calcium Carbonate Content in Soils.
(2) International Biochar Initiative (IBI) (2013). Standardized Product Definition and Product
Testing Guidelines for Biochar That Is Used In Soil. Version 1.1. April, 2013.
(3) Kyoto Protocol (1998) COP3 Decision 2/CP.3 Methodological issues related to the Kyoto
Protocol, paragraph 3.
(4) Schumacher, B. (2002) Methods for determination of Total Organic carbon (TOC) in soils
and sediments. US Environmental Protection Agency (EPA), Environmental Sciences Division
National Exposure Research Laboratory, Office of Research and Development.
(5) US Composting Council (2001) Test Methods for the Examination of Composting and
Compost (TMECC) Composting methods Manual, Field Sampling of Compost Material Section
02.01-C.
(6) US Environmental Protection Agency (2006), Test Methods for Evaluating Solid Waste,
Physical/Chemical methods, Chapter 9.
Biochar Production for Project Reporting Protocol August 2014
Version 3.0
Page 61 of 82
Appendix B: Justification for the “Standard test method for estimating Biochar carbon
stability (BC +100)
A. Budai2; A. R. Zimmerman3; A.L. Cowie4; J.B.W. Webber5; B.P. Singh6; B. Glaser7; C. A.
Masiello8; D. Andersson9; F. Shields10; J. Lehmann11; M. Camps Arbestain12; M. Williams13; S.
Sohi14; S. Joseph15, Miguel Rodriquez16
Abstract
Twenty seven methods currently used to characterize Biochar were assessed in terms of their
usefulness to determine the stability of Biochar carbon in the environment. The International
Biochar Initiative (IBI), which led the effort, gathered fourteen experts in different fields of
Biochar relevant to stability, who guided the process for obtaining a simple, yet reliable, measure
for Biochar stability. Important requisites were defined for the test, including cost, repeatability
and availability. Identification of a cost-effective, scientifically valid test to measure the stable
carbon component of Biochar is imperative to distinguish Biochar from non-Biochar (non-stable)
materials, and to develop a Biochar offset Methodology for carbon markets. The stability of
Biochar carbon in soils makes it a highly promising product for consideration as a strategy for
climate change mitigation. The definition of the variable BC+100, which represents the amount
of Biochar carbon that is expected to remain stable after 100 years, along with predictions of
stability based on simple (Alpha) and more sophisticated (Beta) methods, allowed to correlate a
molar ratio (H/Corg) to the relative stability of Biochar. The process for identifying the Biochar
Carbon Stability Test Method is summarized here, and the method itself is available as a
separate, technical document (Appendix A).
Introduction
The stability of Biochar is of fundamental importance in the context of Biochar use for
environmental management for two primary reasons: first, stability determines how long carbon
applied to soil, as Biochar, will remain in soil and contribute to the mitigation of climate change;
second, stability will determine how long Biochar will continue to provide benefits to soil, plant,
2 Norwegian Institute for Agricultural and Environmental Research – Bioforsk, Høgskoleveien 7, N-1432 Ås, Norway 3 Department of Geological Science, University of Florida, 241 Williamson Hall, P. O. Box 112120, Gainesville, Florida 32611-2120, United States 4 Rural Climate Solutions, University of New England, NSW Department of Primary Industries, Armidale 2351, Australia 5 School of Physical Sciences, University of Kent, CT2 7NH, UK 6 NSW Department of Primary Industries, PO Box 100, Beecroft NSW 2119, Australia 7 Soil Biogeochemistry, Martin-Luther-Univ. Halle-Wittenberg, von-Seckendorff-Platz 3, 06120 Halle, Germany 8 Department of Earth Science, 6100 Main St. MS 126, Rice University, Houston, TX 77005, United States 9 EcoEra, Orkestergatan 21 181, 42139 Göteborg, Sweden 10 Control Laboratories, Inc., 42 Hangar Way, Watsonville, CA 95076, United States 11 Department of Crop and Soil Sciences, Cornell University, Ithaca, NY 14853, United States 12 Institute of Natural Resources, Massey University, Palmerston North 4442, New Zealand 13 Biochar Solutions Inc., PO Box 2048, Carbondale, CO 81623, United States 14 UK Biochar Research Centre (UKBRC), School of GeoSciences, University of Edinburgh, Crew Building, The King's Buildings, Edinburgh, EH9 3JN, UK 15 School of Material Science and Engineering, University of New South Wales, 2052 Sydney, Australia 16 International Biochar Initiative,640 Brook Run Drive, Westerville, OH, 43081, United States
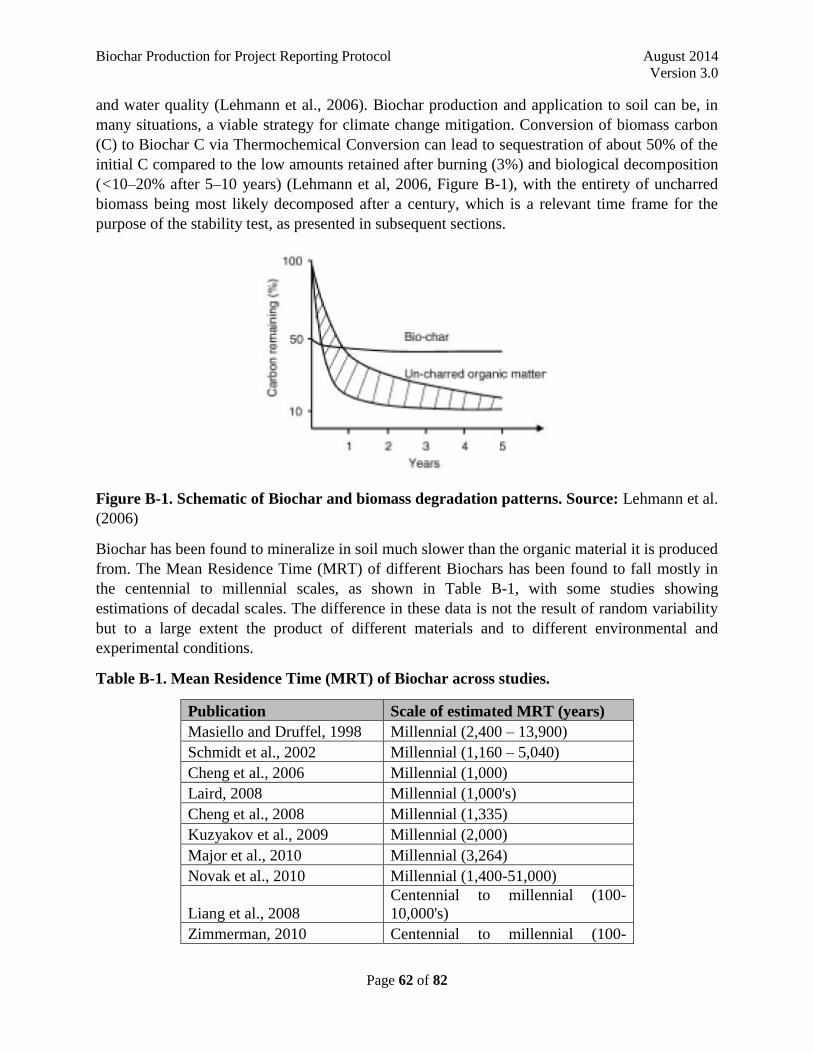
Biochar Production for Project Reporting Protocol August 2014
Version 3.0
Page 62 of 82
and water quality (Lehmann et al., 2006). Biochar production and application to soil can be, in
many situations, a viable strategy for climate change mitigation. Conversion of biomass carbon
(C) to Biochar C via Thermochemical Conversion can lead to sequestration of about 50% of the
initial C compared to the low amounts retained after burning (3%) and biological decomposition
(<10–20% after 5–10 years) (Lehmann et al, 2006, Figure B-1), with the entirety of uncharred
biomass being most likely decomposed after a century, which is a relevant time frame for the
purpose of the stability test, as presented in subsequent sections.
Figure B-1. Schematic of Biochar and biomass degradation patterns. Source: Lehmann et al.
(2006)
Biochar has been found to mineralize in soil much slower than the organic material it is produced
from. The Mean Residence Time (MRT) of different Biochars has been found to fall mostly in
the centennial to millennial scales, as shown in Table B-1, with some studies showing
estimations of decadal scales. The difference in these data is not the result of random variability
but to a large extent the product of different materials and to different environmental and
experimental conditions.
Table B-1. Mean Residence Time (MRT) of Biochar across studies.
Publication Scale of estimated MRT (years)
Masiello and Druffel, 1998 Millennial (2,400 – 13,900)
Schmidt et al., 2002 Millennial (1,160 – 5,040)
Cheng et al., 2006 Millennial (1,000)
Laird, 2008 Millennial (1,000's)
Cheng et al., 2008 Millennial (1,335)
Kuzyakov et al., 2009 Millennial (2,000)
Major et al., 2010 Millennial (3,264)
Novak et al., 2010 Millennial (1,400-51,000)
Liang et al., 2008
Centennial to millennial (100-
10,000's)
Zimmerman, 2010 Centennial to millennial (100-
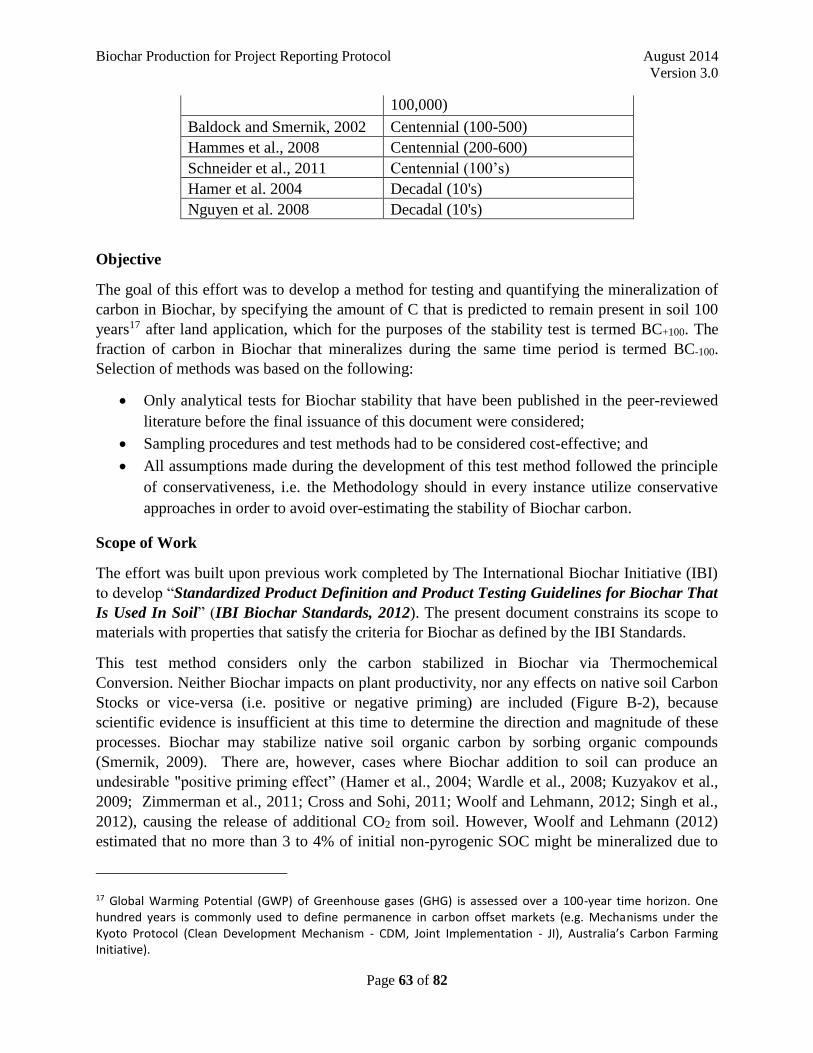
Biochar Production for Project Reporting Protocol August 2014
Version 3.0
Page 63 of 82
100,000)
Baldock and Smernik, 2002 Centennial (100-500)
Hammes et al., 2008 Centennial (200-600)
Schneider et al., 2011 Centennial (100’s)
Hamer et al. 2004 Decadal (10's)
Nguyen et al. 2008 Decadal (10's)
Objective
The goal of this effort was to develop a method for testing and quantifying the mineralization of
carbon in Biochar, by specifying the amount of C that is predicted to remain present in soil 100
years17 after land application, which for the purposes of the stability test is termed BC+100. The
fraction of carbon in Biochar that mineralizes during the same time period is termed BC-100.
Selection of methods was based on the following:
Only analytical tests for Biochar stability that have been published in the peer-reviewed
literature before the final issuance of this document were considered;
Sampling procedures and test methods had to be considered cost-effective; and
All assumptions made during the development of this test method followed the principle
of conservativeness, i.e. the Methodology should in every instance utilize conservative
approaches in order to avoid over-estimating the stability of Biochar carbon.
Scope of Work
The effort was built upon previous work completed by The International Biochar Initiative (IBI)
to develop “Standardized Product Definition and Product Testing Guidelines for Biochar That
Is Used In Soil” (IBI Biochar Standards, 2012). The present document constrains its scope to
materials with properties that satisfy the criteria for Biochar as defined by the IBI Standards.
This test method considers only the carbon stabilized in Biochar via Thermochemical
Conversion. Neither Biochar impacts on plant productivity, nor any effects on native soil Carbon
Stocks or vice-versa (i.e. positive or negative priming) are included (Figure B-2), because
scientific evidence is insufficient at this time to determine the direction and magnitude of these
processes. Biochar may stabilize native soil organic carbon by sorbing organic compounds
(Smernik, 2009). There are, however, cases where Biochar addition to soil can produce an
undesirable "positive priming effect” (Hamer et al., 2004; Wardle et al., 2008; Kuzyakov et al.,
2009; Zimmerman et al., 2011; Cross and Sohi, 2011; Woolf and Lehmann, 2012; Singh et al.,
2012), causing the release of additional CO2 from soil. However, Woolf and Lehmann (2012)
estimated that no more than 3 to 4% of initial non-pyrogenic SOC might be mineralized due to
17 Global Warming Potential (GWP) of Greenhouse gases (GHG) is assessed over a 100-year time horizon. One hundred years is commonly used to define permanence in carbon offset markets (e.g. Mechanisms under the Kyoto Protocol (Clean Development Mechanism - CDM, Joint Implementation - JI), Australia’s Carbon Farming Initiative).
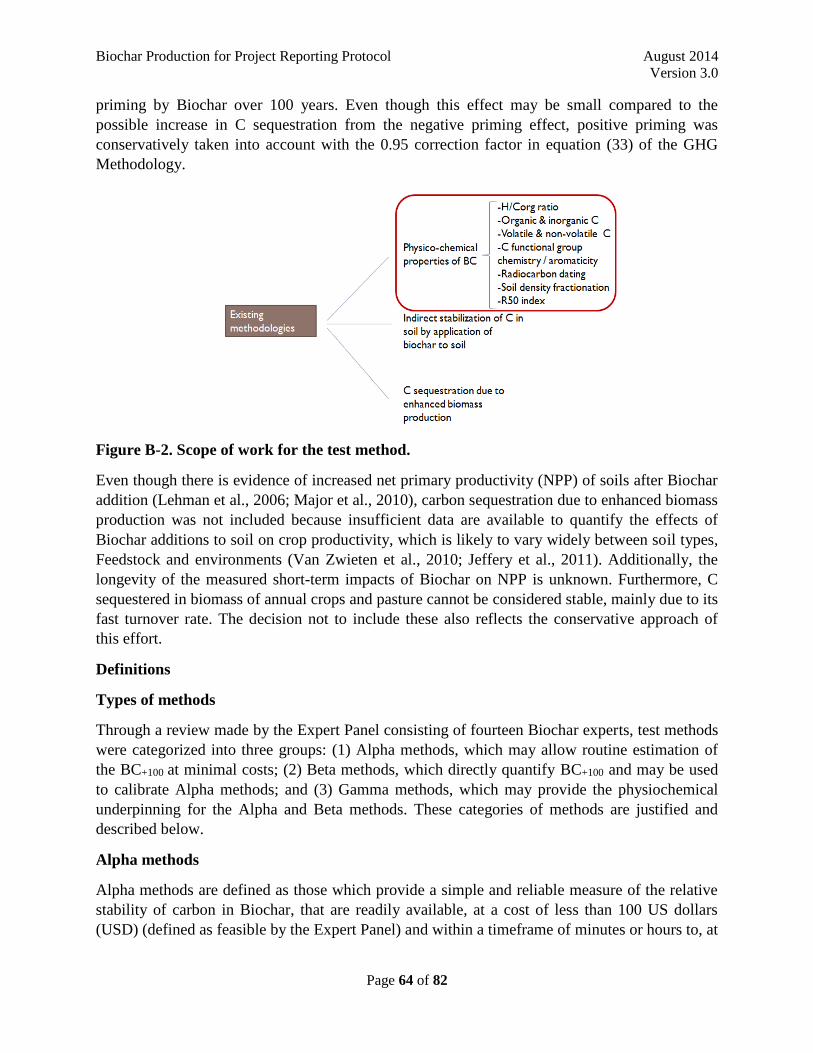
Biochar Production for Project Reporting Protocol August 2014
Version 3.0
Page 64 of 82
priming by Biochar over 100 years. Even though this effect may be small compared to the
possible increase in C sequestration from the negative priming effect, positive priming was
conservatively taken into account with the 0.95 correction factor in equation (33) of the GHG
Methodology.
Figure B-2. Scope of work for the test method.
Even though there is evidence of increased net primary productivity (NPP) of soils after Biochar
addition (Lehman et al., 2006; Major et al., 2010), carbon sequestration due to enhanced biomass
production was not included because insufficient data are available to quantify the effects of
Biochar additions to soil on crop productivity, which is likely to vary widely between soil types,
Feedstock and environments (Van Zwieten et al., 2010; Jeffery et al., 2011). Additionally, the
longevity of the measured short-term impacts of Biochar on NPP is unknown. Furthermore, C
sequestered in biomass of annual crops and pasture cannot be considered stable, mainly due to its
fast turnover rate. The decision not to include these also reflects the conservative approach of
this effort.
Definitions
Types of methods
Through a review made by the Expert Panel consisting of fourteen Biochar experts, test methods
were categorized into three groups: (1) Alpha methods, which may allow routine estimation of
the BC+100 at minimal costs; (2) Beta methods, which directly quantify BC+100 and may be used
to calibrate Alpha methods; and (3) Gamma methods, which may provide the physiochemical
underpinning for the Alpha and Beta methods. These categories of methods are justified and
described below.
Alpha methods
Alpha methods are defined as those which provide a simple and reliable measure of the relative
stability of carbon in Biochar, that are readily available, at a cost of less than 100 US dollars
(USD) (defined as feasible by the Expert Panel) and within a timeframe of minutes or hours to, at
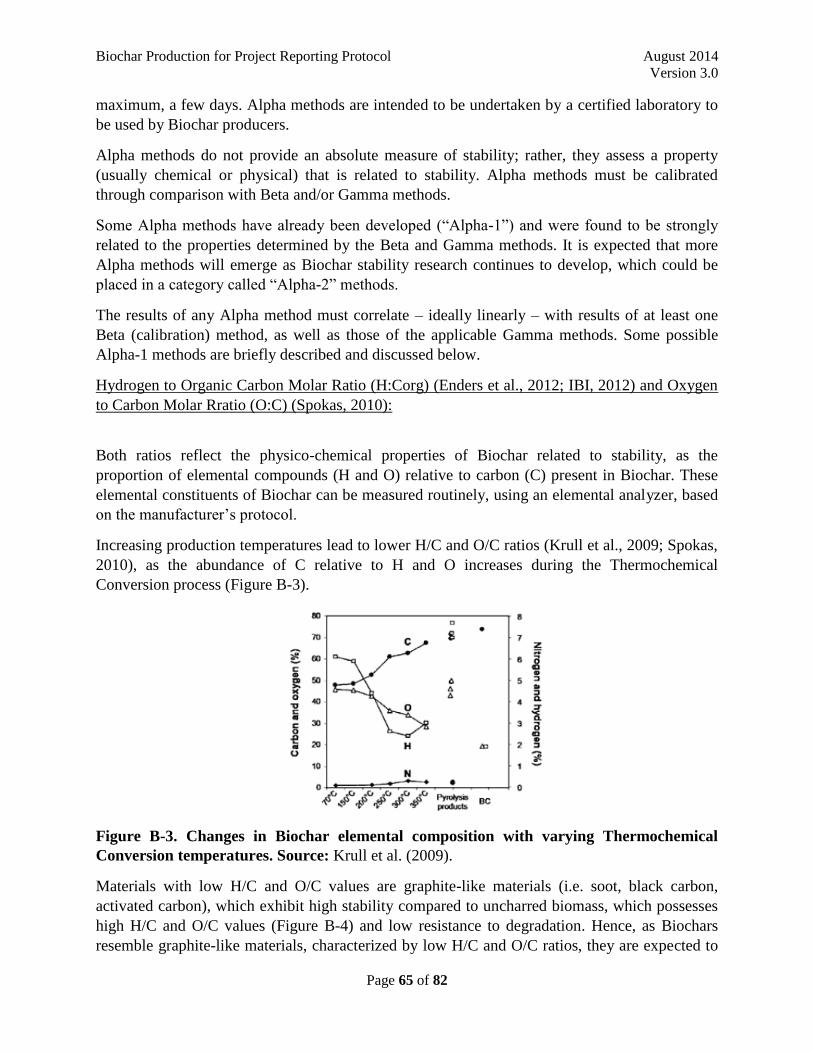
Biochar Production for Project Reporting Protocol August 2014
Version 3.0
Page 65 of 82
maximum, a few days. Alpha methods are intended to be undertaken by a certified laboratory to
be used by Biochar producers.
Alpha methods do not provide an absolute measure of stability; rather, they assess a property
(usually chemical or physical) that is related to stability. Alpha methods must be calibrated
through comparison with Beta and/or Gamma methods.
Some Alpha methods have already been developed (“Alpha-1”) and were found to be strongly
related to the properties determined by the Beta and Gamma methods. It is expected that more
Alpha methods will emerge as Biochar stability research continues to develop, which could be
placed in a category called “Alpha-2” methods.
The results of any Alpha method must correlate – ideally linearly – with results of at least one
Beta (calibration) method, as well as those of the applicable Gamma methods. Some possible
Alpha-1 methods are briefly described and discussed below.
Hydrogen to Organic Carbon Molar Ratio (H:Corg) (Enders et al., 2012; IBI, 2012) and Oxygen
to Carbon Molar Rratio (O:C) (Spokas, 2010):
Both ratios reflect the physico-chemical properties of Biochar related to stability, as the
proportion of elemental compounds (H and O) relative to carbon (C) present in Biochar. These
elemental constituents of Biochar can be measured routinely, using an elemental analyzer, based
on the manufacturer’s protocol.
Increasing production temperatures lead to lower H/C and O/C ratios (Krull et al., 2009; Spokas,
2010), as the abundance of C relative to H and O increases during the Thermochemical
Conversion process (Figure B-3).
Figure B-3. Changes in Biochar elemental composition with varying Thermochemical
Conversion temperatures. Source: Krull et al. (2009).
Materials with low H/C and O/C values are graphite-like materials (i.e. soot, black carbon,
activated carbon), which exhibit high stability compared to uncharred biomass, which possesses
high H/C and O/C values (Figure B-4) and low resistance to degradation. Hence, as Biochars
resemble graphite-like materials, characterized by low H/C and O/C ratios, they are expected to
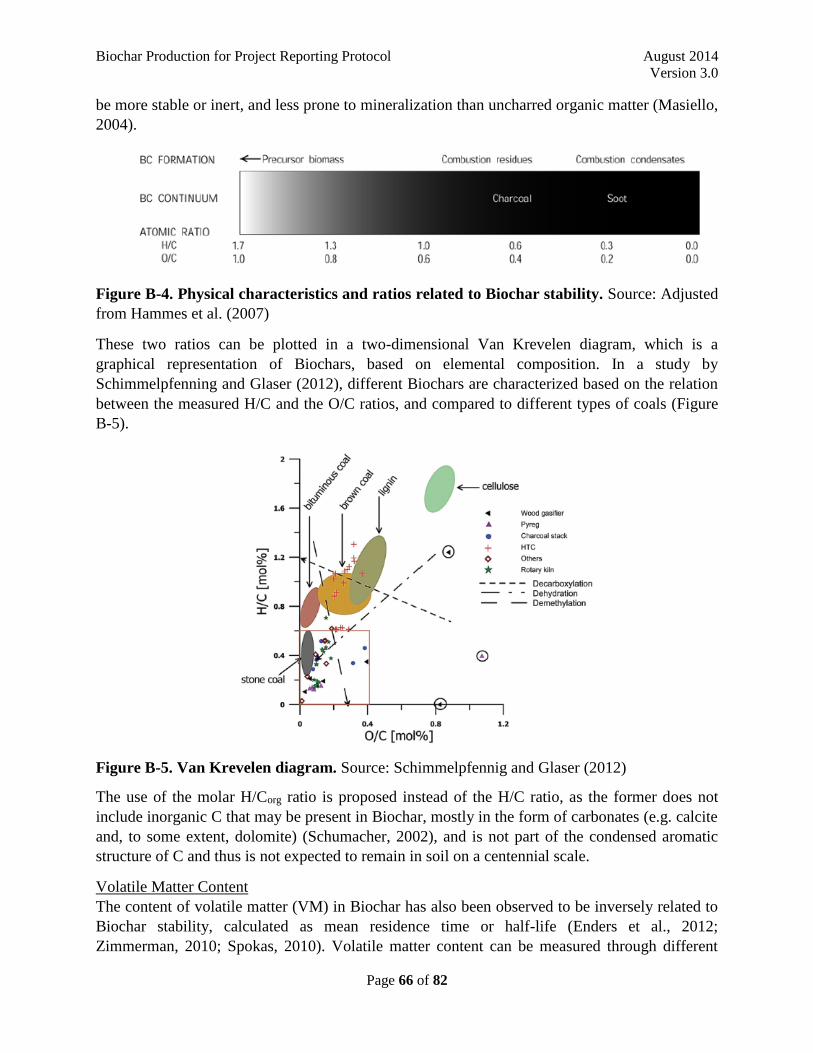
Biochar Production for Project Reporting Protocol August 2014
Version 3.0
Page 66 of 82
be more stable or inert, and less prone to mineralization than uncharred organic matter (Masiello,
2004).
Figure B-4. Physical characteristics and ratios related to Biochar stability. Source: Adjusted
from Hammes et al. (2007)
These two ratios can be plotted in a two-dimensional Van Krevelen diagram, which is a
graphical representation of Biochars, based on elemental composition. In a study by
Schimmelpfenning and Glaser (2012), different Biochars are characterized based on the relation
between the measured H/C and the O/C ratios, and compared to different types of coals (Figure
B-5).
Figure B-5. Van Krevelen diagram. Source: Schimmelpfennig and Glaser (2012)
The use of the molar H/Corg ratio is proposed instead of the H/C ratio, as the former does not
include inorganic C that may be present in Biochar, mostly in the form of carbonates (e.g. calcite
and, to some extent, dolomite) (Schumacher, 2002), and is not part of the condensed aromatic
structure of C and thus is not expected to remain in soil on a centennial scale.
Volatile Matter Content
The content of volatile matter (VM) in Biochar has also been observed to be inversely related to
Biochar stability, calculated as mean residence time or half-life (Enders et al., 2012;
Zimmerman, 2010; Spokas, 2010). Volatile matter content can be measured through different
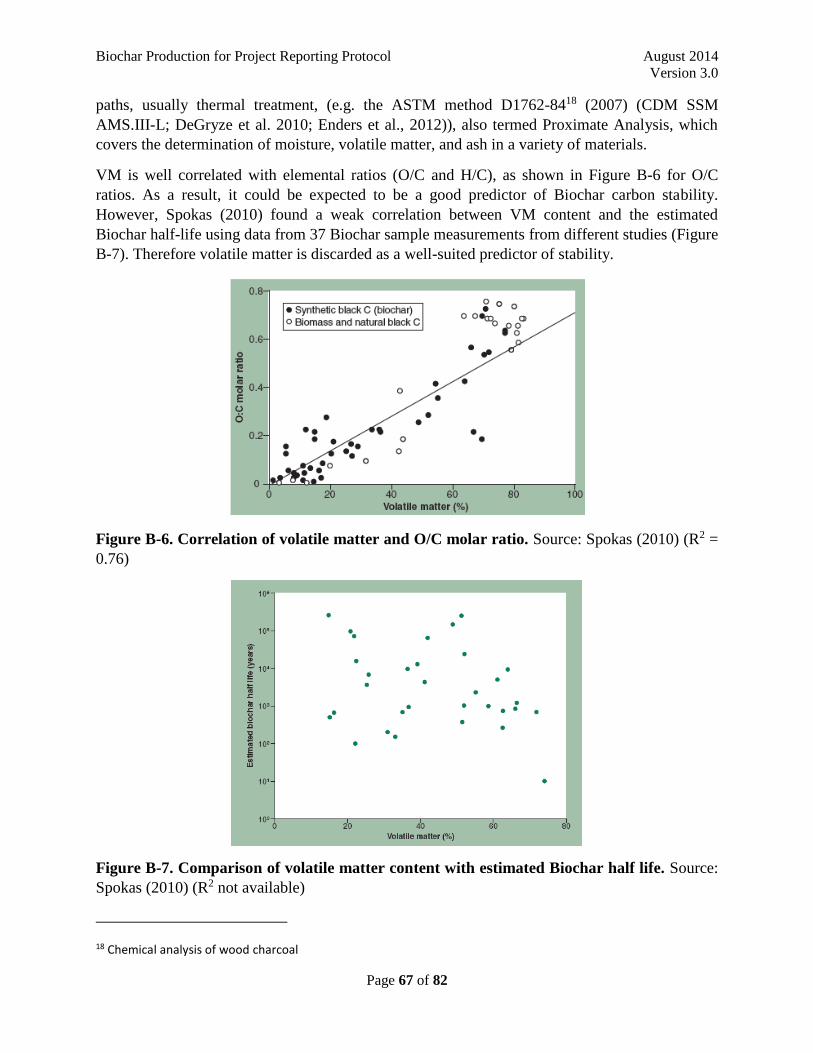
Biochar Production for Project Reporting Protocol August 2014
Version 3.0
Page 67 of 82
paths, usually thermal treatment, (e.g. the ASTM method D1762-8418 (2007) (CDM SSM
AMS.III-L; DeGryze et al. 2010; Enders et al., 2012)), also termed Proximate Analysis, which
covers the determination of moisture, volatile matter, and ash in a variety of materials.
VM is well correlated with elemental ratios (O/C and H/C), as shown in Figure B-6 for O/C
ratios. As a result, it could be expected to be a good predictor of Biochar carbon stability.
However, Spokas (2010) found a weak correlation between VM content and the estimated
Biochar half-life using data from 37 Biochar sample measurements from different studies (Figure
B-7). Therefore volatile matter is discarded as a well-suited predictor of stability.
Figure B-6. Correlation of volatile matter and O/C molar ratio. Source: Spokas (2010) (R2 =
0.76)
Figure B-7. Comparison of volatile matter content with estimated Biochar half life. Source:
Spokas (2010) (R2 not available)
18 Chemical analysis of wood charcoal
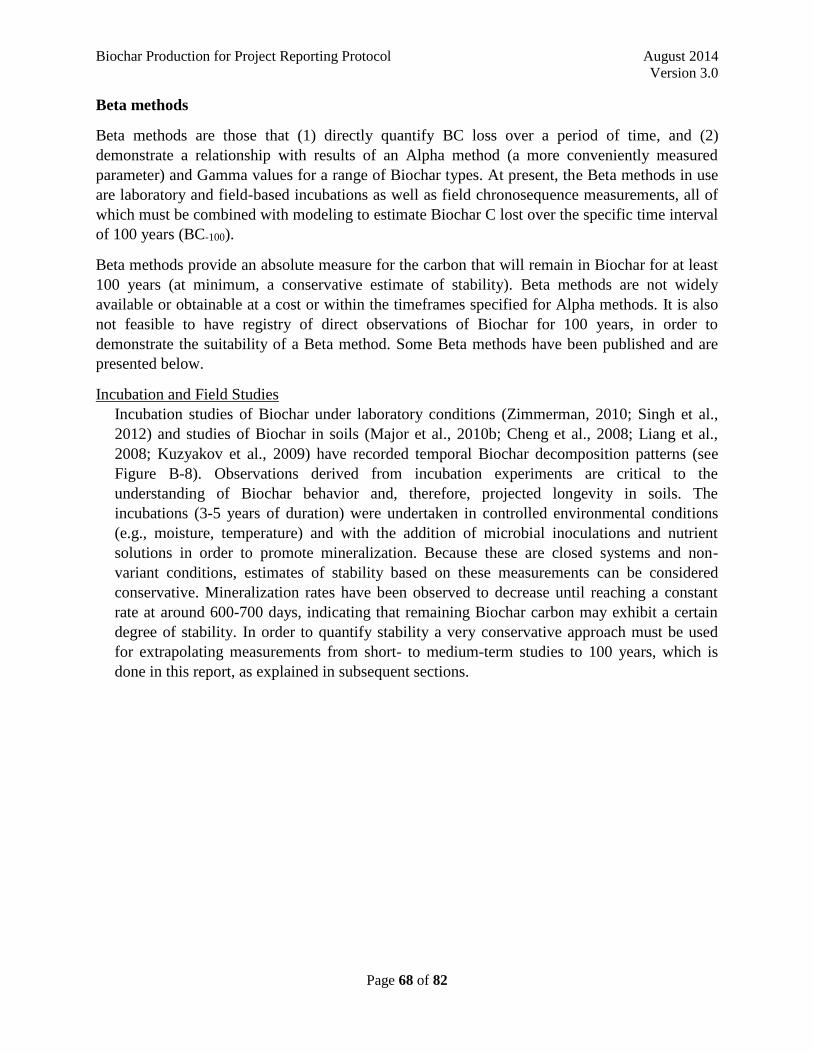
Biochar Production for Project Reporting Protocol August 2014
Version 3.0
Page 68 of 82
Beta methods
Beta methods are those that (1) directly quantify BC loss over a period of time, and (2)
demonstrate a relationship with results of an Alpha method (a more conveniently measured
parameter) and Gamma values for a range of Biochar types. At present, the Beta methods in use
are laboratory and field-based incubations as well as field chronosequence measurements, all of
which must be combined with modeling to estimate Biochar C lost over the specific time interval
of 100 years (BC-100).
Beta methods provide an absolute measure for the carbon that will remain in Biochar for at least
100 years (at minimum, a conservative estimate of stability). Beta methods are not widely
available or obtainable at a cost or within the timeframes specified for Alpha methods. It is also
not feasible to have registry of direct observations of Biochar for 100 years, in order to
demonstrate the suitability of a Beta method. Some Beta methods have been published and are
presented below.
Incubation and Field Studies
Incubation studies of Biochar under laboratory conditions (Zimmerman, 2010; Singh et al.,
2012) and studies of Biochar in soils (Major et al., 2010b; Cheng et al., 2008; Liang et al.,
2008; Kuzyakov et al., 2009) have recorded temporal Biochar decomposition patterns (see
Figure B-8). Observations derived from incubation experiments are critical to the
understanding of Biochar behavior and, therefore, projected longevity in soils. The
incubations (3-5 years of duration) were undertaken in controlled environmental conditions
(e.g., moisture, temperature) and with the addition of microbial inoculations and nutrient
solutions in order to promote mineralization. Because these are closed systems and non-
variant conditions, estimates of stability based on these measurements can be considered
conservative. Mineralization rates have been observed to decrease until reaching a constant
rate at around 600-700 days, indicating that remaining Biochar carbon may exhibit a certain
degree of stability. In order to quantify stability a very conservative approach must be used
for extrapolating measurements from short- to medium-term studies to 100 years, which is
done in this report, as explained in subsequent sections.
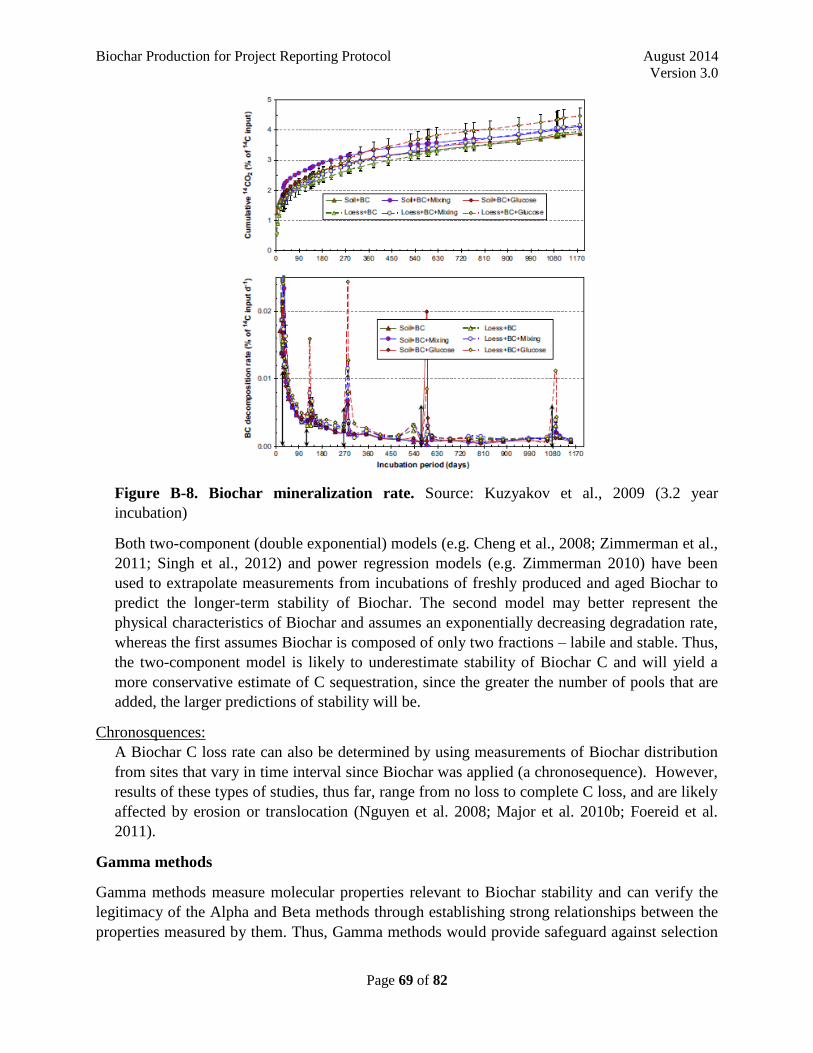
Biochar Production for Project Reporting Protocol August 2014
Version 3.0
Page 69 of 82
Figure B-8. Biochar mineralization rate. Source: Kuzyakov et al., 2009 (3.2 year
incubation)
Both two-component (double exponential) models (e.g. Cheng et al., 2008; Zimmerman et al.,
2011; Singh et al., 2012) and power regression models (e.g. Zimmerman 2010) have been
used to extrapolate measurements from incubations of freshly produced and aged Biochar to
predict the longer-term stability of Biochar. The second model may better represent the
physical characteristics of Biochar and assumes an exponentially decreasing degradation rate,
whereas the first assumes Biochar is composed of only two fractions – labile and stable. Thus,
the two-component model is likely to underestimate stability of Biochar C and will yield a
more conservative estimate of C sequestration, since the greater the number of pools that are
added, the larger predictions of stability will be.
Chronosquences:
A Biochar C loss rate can also be determined by using measurements of Biochar distribution
from sites that vary in time interval since Biochar was applied (a chronosequence). However,
results of these types of studies, thus far, range from no loss to complete C loss, and are likely
affected by erosion or translocation (Nguyen et al. 2008; Major et al. 2010b; Foereid et al.
2011).
Gamma methods
Gamma methods measure molecular properties relevant to Biochar stability and can verify the
legitimacy of the Alpha and Beta methods through establishing strong relationships between the
properties measured by them. Thus, Gamma methods would provide safeguard against selection
Biochar Production for Project Reporting Protocol August 2014
Version 3.0
Page 70 of 82
of Alpha or Beta methods based on empirical correlations that do not reflect a functional
relationship. Some Gamma methods are briefly described below.
NMR spectroscopy (Brewer et al., 2011; McBeath et al., 2011)
Direct polarization 13C nuclear magnetic resonance spectroscopy with magic angle spinning
(DP/MAS 13C NMR) is a well-established technique for measuring the aromaticity (fraction of
total carbon that is aromatic) of Biochars. Aromaticity is strongly correlated to C stability (Singh
et al., 2012) and aromaticity can be predicted by the H/Corg values of Biochar (Wang et al.,
2013). The 13C NMR spectrum of aryl carbon (i.e. derived from condensed aromatic carbon) is
very characteristic, comprising a single resonance centered at approximately 130 ppm. Spinning
side bands associated with the presence of aromatic carbon can be detected.
Pyrolysis Gas Chromatography mass spectrometry (Py GC/MS) – analytical Pyrolysis (Kaal et
al., 2008, 2009, 2012; Fabbri et al., 2012)
Analytical Pyrolysis is a technique that uses controlled invasive thermal degradation to break
down large molecules for identification. The resultant Pyrolysis products are separated and
identified using gas chromatography and mass spectroscopy. The sum of the most abundant
fingerprints of charred material in pyrograms (i.e., monoaromatic hydrocarbons, polyaromatic
hydrocarbons, benzonitriles/total quantified peak area) is related to the proportion of condensed
aromatic carbon present in Biochar.
Ring Current NMR (McBeath and Smernik, 2009; McBeath et al., 2011)
This method gauges the degree of aromatic condensation of Biochars. It involves sorbing 13C-
labeled benzene to the Biochar structure. The 13C NMR chemical shift of the sorbed benzene
(relative to straight 13C-benzene) is affected by diamagnetic ring currents that are induced in the
conjugated aromatic structures when the Biochar is placed in a magnetic field. These ring
currents increase in magnitude with the increasing extent of aromatic condensation.
Benzene polycarboxylic acids (BPCA) (Glaser et al., 1998; Brodowski et al., 2005; Schneider et
al., 2010)
The BPCA are molecules formed during the nitric acid oxidation of Biochar. The maximum
number of carboxylic groups reflects the number of quaternary C atoms initially present. Biochar
with a higher degree of condensation should result in higher proportion of the penta (B5CA) and
hexacarboxylic (B6CA) benzoic acids relative to BPCAs with less quaternary carbon atoms
(B3CA, B4CA). The ratio of B6CA-C/total BPCA-C thus is positively related to the degree of
condensed aromatic C present in Biochar; the larger the ratio the greater the aromaticity. The
concentration of the sum of BPCA can be used to quantify Biochar in the environment, e.g. in
soil amended with pure Biochar or in mixture with other organic materials.
Gamma methods are not expected to be used by Biochar producers for determining Biochar C
stability. This is mainly because of the high level of technical expertise required to perform
these tests, specialized expensive instruments, high costs per analysis, and low availability.
Instead, Gamma methods are intended to be used by scientists in order to calibrate Alpha and
Beta methods for iterative improvement of a simple Biochar C stability test method.
Biochar Production for Project Reporting Protocol August 2014
Version 3.0
Page 71 of 82
Material and methods: Biochar Carbon Stability Test Method selection process
Twenty-eight test methodologies currently used to assess Biochar characteristics, mostly related
to stability, were reviewed and evaluated by the Expert Panel. H/Corg was selected as the
preferred Alpha method for being cost-effective, simple, replicable, and published in peer-
reviewed literature. Modeled data from observations of carbon degradation from 3- to 5-year
incubation studies (Zimmerman, 2010 as extended in Zimmerman and Gao, 2013; and Singh et
al., 2012) was used as the Beta method to calibrate the predictions and determine BC+100.
Results
A strong relationship was found between the H/Corg values of 31 Biochar samples from the two
mentioned studies and the predicted BC+100 values, based on the two-component model (Figure
A2-9).
The observed behavior for carbon in each of the 31 samples followed a typical pattern as shown
in Figure B-8, where after some months, the turnover rate slowed, and exhibiting little carbon
loss. The two Q10 adjustments for harmonizing the data between both studies were not made.
However, even if a low value were to be used, e.g. Q10 = 2 (compared to Cheng et al., 2008),
harmonizing the data from 30°C that lack soil minerals (Zimmerman, 2010) to 22°C (Singh et
al., 2012), would yield higher BC+100 values than the ones reported in this Methodology, thus
complying with the conservativeness principle. In addition, it is conservative to utilize the data
with high incubation temperatures of 30°C and 22°C, given that the global mean temperature is
less than 10°C (Rohde et al., 2013). With even a low Q10 of 2, a recaluculation of only 22°C to
10°C would make a large change to BC+100. Grouping the predicted BC+100 values, based on the
two-component model, results in Figure B-9.
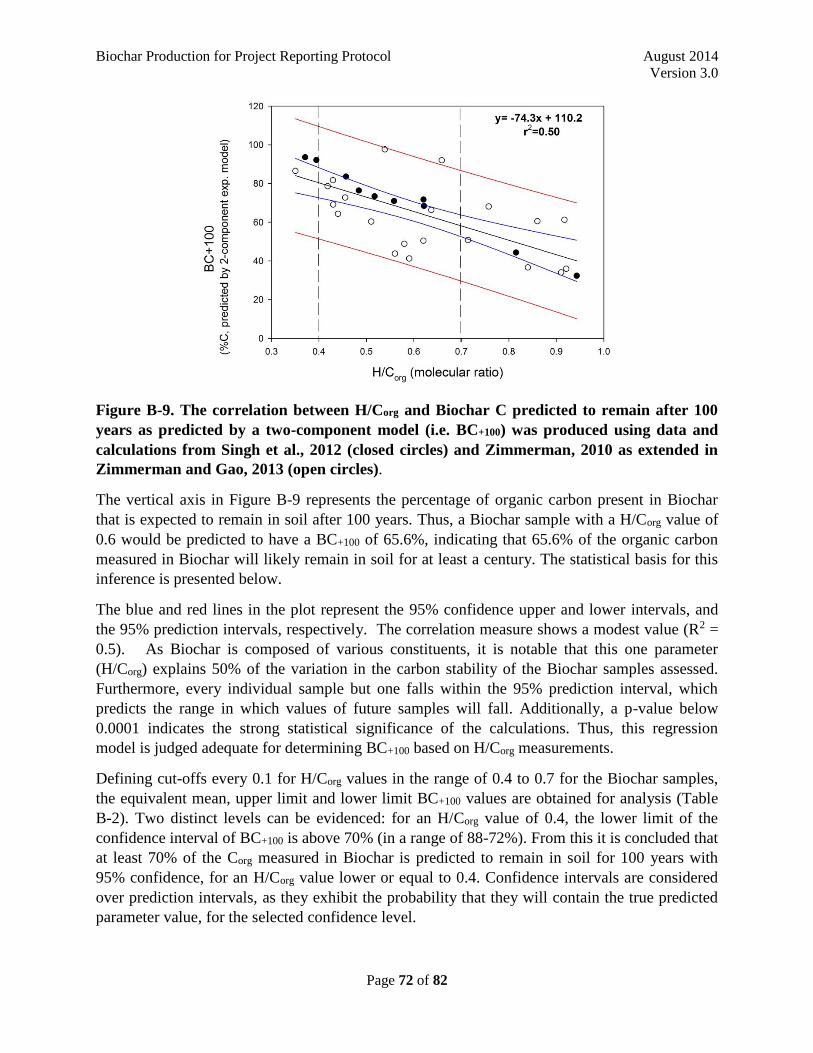
Biochar Production for Project Reporting Protocol August 2014
Version 3.0
Page 72 of 82
Figure B-9. The correlation between H/Corg and Biochar C predicted to remain after 100
years as predicted by a two-component model (i.e. BC+100) was produced using data and
calculations from Singh et al., 2012 (closed circles) and Zimmerman, 2010 as extended in
Zimmerman and Gao, 2013 (open circles).
The vertical axis in Figure B-9 represents the percentage of organic carbon present in Biochar
that is expected to remain in soil after 100 years. Thus, a Biochar sample with a H/Corg value of
0.6 would be predicted to have a BC+100 of 65.6%, indicating that 65.6% of the organic carbon
measured in Biochar will likely remain in soil for at least a century. The statistical basis for this
inference is presented below.
The blue and red lines in the plot represent the 95% confidence upper and lower intervals, and
the 95% prediction intervals, respectively. The correlation measure shows a modest value (R2 =
0.5). As Biochar is composed of various constituents, it is notable that this one parameter
(H/Corg) explains 50% of the variation in the carbon stability of the Biochar samples assessed.
Furthermore, every individual sample but one falls within the 95% prediction interval, which
predicts the range in which values of future samples will fall. Additionally, a p-value below
0.0001 indicates the strong statistical significance of the calculations. Thus, this regression
model is judged adequate for determining BC+100 based on H/Corg measurements.
Defining cut-offs every 0.1 for H/Corg values in the range of 0.4 to 0.7 for the Biochar samples,
the equivalent mean, upper limit and lower limit BC+100 values are obtained for analysis (Table
B-2). Two distinct levels can be evidenced: for an H/Corg value of 0.4, the lower limit of the
confidence interval of BC+100 is above 70% (in a range of 88-72%). From this it is concluded that
at least 70% of the Corg measured in Biochar is predicted to remain in soil for 100 years with
95% confidence, for an H/Corg value lower or equal to 0.4. Confidence intervals are considered
over prediction intervals, as they exhibit the probability that they will contain the true predicted
parameter value, for the selected confidence level.
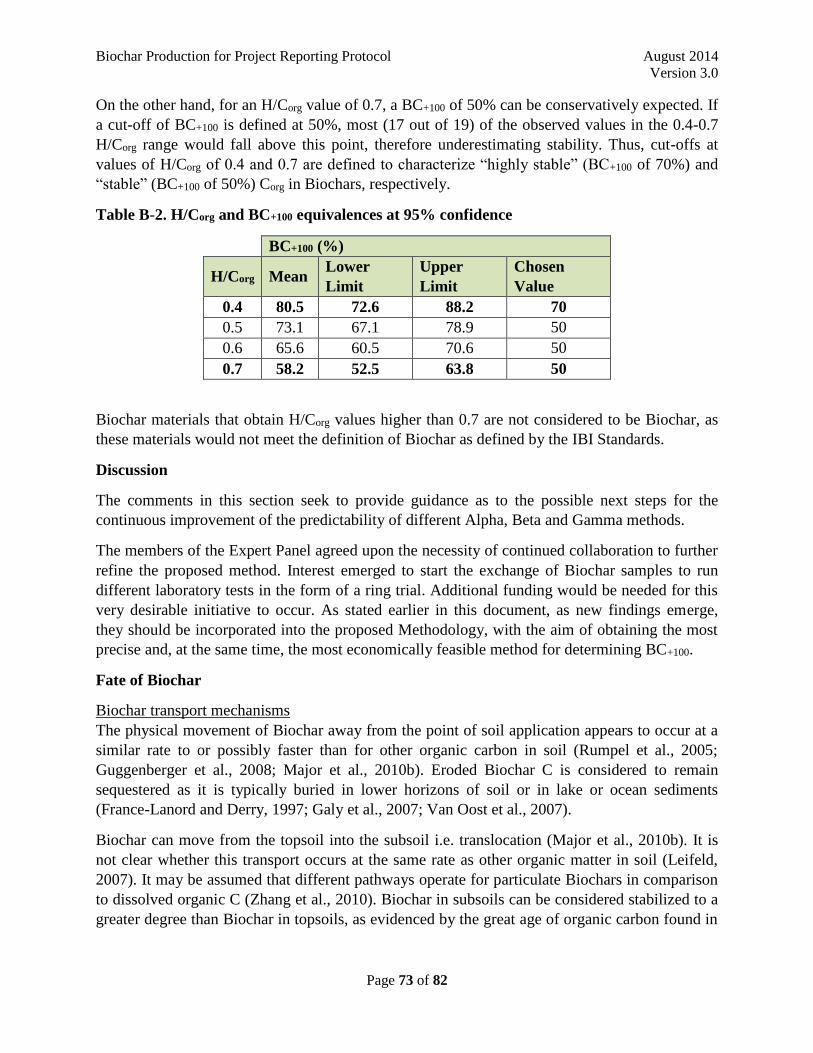
Biochar Production for Project Reporting Protocol August 2014
Version 3.0
Page 73 of 82
On the other hand, for an H/Corg value of 0.7, a BC+100 of 50% can be conservatively expected. If
a cut-off of BC+100 is defined at 50%, most (17 out of 19) of the observed values in the 0.4-0.7
H/Corg range would fall above this point, therefore underestimating stability. Thus, cut-offs at
values of H/Corg of 0.4 and 0.7 are defined to characterize “highly stable” (BC+100 of 70%) and
“stable” (BC+100 of 50%) Corg in Biochars, respectively.
Table B-2. H/Corg and BC+100 equivalences at 95% confidence
BC+100 (%)
H/Corg Mean Lower
Limit
Upper
Limit
Chosen
Value
0.4 80.5 72.6 88.2 70
0.5 73.1 67.1 78.9 50
0.6 65.6 60.5 70.6 50
0.7 58.2 52.5 63.8 50
Biochar materials that obtain H/Corg values higher than 0.7 are not considered to be Biochar, as
these materials would not meet the definition of Biochar as defined by the IBI Standards.
Discussion
The comments in this section seek to provide guidance as to the possible next steps for the
continuous improvement of the predictability of different Alpha, Beta and Gamma methods.
The members of the Expert Panel agreed upon the necessity of continued collaboration to further
refine the proposed method. Interest emerged to start the exchange of Biochar samples to run
different laboratory tests in the form of a ring trial. Additional funding would be needed for this
very desirable initiative to occur. As stated earlier in this document, as new findings emerge,
they should be incorporated into the proposed Methodology, with the aim of obtaining the most
precise and, at the same time, the most economically feasible method for determining BC+100.
Fate of Biochar
Biochar transport mechanisms
The physical movement of Biochar away from the point of soil application appears to occur at a
similar rate to or possibly faster than for other organic carbon in soil (Rumpel et al., 2005;
Guggenberger et al., 2008; Major et al., 2010b). Eroded Biochar C is considered to remain
sequestered as it is typically buried in lower horizons of soil or in lake or ocean sediments
(France-Lanord and Derry, 1997; Galy et al., 2007; Van Oost et al., 2007).
Biochar can move from the topsoil into the subsoil i.e. translocation (Major et al., 2010b). It is
not clear whether this transport occurs at the same rate as other organic matter in soil (Leifeld,
2007). It may be assumed that different pathways operate for particulate Biochars in comparison
to dissolved organic C (Zhang et al., 2010). Biochar in subsoils can be considered stabilized to a
greater degree than Biochar in topsoils, as evidenced by the great age of organic carbon found in
Biochar Production for Project Reporting Protocol August 2014
Version 3.0
Page 74 of 82
subsoils in general, and because microbial activity sharply decreases with depth (Rumpel and
Koegel-Knabner, 2011).
Some studies indicate that a significant fraction of land-applied Biochar can be exported within
the first few years following amendment, even when Biochar is incorporated into soil (Rumpel et
al., 2009; Major et al., 2010b). However, physical transport of Biochar offsite does not
necessarily result in a CO2 flux to the atmosphere, as the final fate of charcoal erosion from the
land surface may be deposition in marine sediments. The intrinsic refractivity of charcoal in
marine environments may lead to its long-term storage in sediments (Masiello, 2004). It is
reasonable to assume that mobilized Biochar does not decompose, and remains a long-term
carbon sink as it transits to the sea floor.
There is a small risk of losing C to the atmosphere from Biochar which has been exported
through the mobilization of Biochar C into pyrogenic dissolved organic C (DOC). But studies
show that this mechanism only accounts for the movement of a small fraction of the total carbon
in Biochar. Over 2 years after field application, 1% of Biochar applied to an Oxisol was
mobilized by percolating water, mostly in the form of DOC rather than particulate organic C
(Major et al., 2010b). In a study simulating the geochemical weathering of Biochar, only 0.8% of
the total organic C was released as DOC (Yao et al., 2010). And a maximum of 1.3% of the C
was extracted from any of the Biochars tested using multiple sequential leaching experiments
(Zimmerman and Gao, 2013). Because soluble C may represent the same portion of C that is
mineralizable C (Leinweber, 1995; Zimmerman and Gao, 2013), the additional mineralization of
Biochar C via DOC is assumed to be minor, even when translocation occurs. While further
research pertaining to C mineralization of dissolved Biochar is crucial, existing field and
laboratory experiments show the loss of C to the atmosphere due to mobilized Biochar DOC
mineralization to be minor.
Combustion
Biochar can be combusted, either unintentionally due to inappropriate handling during transport,
storage or application, or intentionally, by diverting it from the intended land application to a use
as fuel, since many Biochars can possess a significant energy value. Through Applicability
Condition 4, the methodology assures that Biochar used only as a soil amendment qualifies
therefore mitigating the risk that the Biochar will be combusted. Another theoretical oxidation by
combustion is through vegetation fires. Re-burning of previously deposited pyrogenic carbon
from vegetation fires has been observed in Mediterranean forests (Knicker et al., 2006). It is
unlikely that vegetation fires will lead to a significant re-burning of applied Biochar that is
incorporated into the soil. Temperatures during fires decrease dramatically with soil depth, and
mixtures of Biochar and soil will exhibit no greater combustibility than that of other organic
matter in soil.
Resolution of information on carbon stability
Although there is a clear correlation between the H/Corg ratios and BC+100 over a wide range of
values at a 95% confidence level (Figure B-9), variability will remain in the stability predictions.
Future refinement and a greater data set with longer-term incubation experiments, including field
Biochar Production for Project Reporting Protocol August 2014
Version 3.0
Page 75 of 82
data, will allow better constraint of the relationship. For the purpose of this first Methodology, as
mentioned previously, a very conservative approach was chosen (e.g. via the selection of the
model to obtain BC+100 and the conditions of the incubation experiments) and thus predictability
can be further improved over time.
The second analytical constraint stems from the quantification of inorganic and organic C (and
H) in the Biochar (Wang et al., 2013). Some uncertainties in the Standard method using
acidification and repeated determination of total C led to an initial recommendation of restricting
the Methodology to class 1 Biochars (as defined in the IBI Biochar Standards under the criteria
for Organic Carbon in Table 1). For these Biochars, which by definition contain more than 60%
organic carbon, the proportion of inorganic carbon is likely negligible and organic carbon is
roughly equivalent to total carbon. However, data analysis determined that this restriction
yielded no change in the prediction results. Nevertheless, a method for calculating inorganic
carbon in the sample was included, allowing the calculation of organic carbon by difference to
total carbon. This exemplifies how the conservative approach mentioned was operationalized in
the decisions made to arrive at a test method.
Future improvements to Alpha, Beta and Gamma methods
Alpha
The choice amongst routine analytical procedures that would reflect a robust, repeatable, and
analytically sound result was limited to those that had been used in the peer-reviewed literature.
These included the Standard Test Method for Chemical Analysis of Wood Charcoal, so-called
Proximate Analysis (ASTM-D1762-84, 2007) and elemental ratios of O, H and C. Structural
information beyond stoichiometric relationships between elements may provide better estimates
of stability and may be attainable through spectroscopy or automated thermogravimetry.
However, these have not been sufficiently developed or are not available at a sufficiently low
cost or time requirement to be included at present, or both.
Beta
Longer periods of observation will likely provide evidence to improve precision of predictions of
BC+100 (Lehmann et al., 2009; Zimmerman et al., 2012), likely increasing the stable carbon
component calculated, since the current proposed method is highly conservative. The known
long-term incubations experiments will continue and a revised future Methodology will reflect
improvements based on longer periods of observation. Only a few long-term field experiments
have been published beyond a few years (Major et al., 2010), but are expected to be available for
up to 10 year-periods in the coming years. However, pitfalls of field experiments are that these
often do not distinguish between mineralization and physical loss by erosion and leaching, and
the capabilities to estimate these differential losses over long periods of time are typically low.
Therefore, these experiments often give, at best, a minimum mean residence time. A third
approach is the use of aged Biochars as proxies for Biochar that has weathered in soil for long
periods of time. Examples are Biochar-type materials from Terra Preta (Liang et al., 2008), from
charcoal storage sites (Cheng et al., 2010) or possibly archaeological deposits. The challenge
using this approach is to develop adequate proxies for the starting material to assess its
properties.
Biochar Production for Project Reporting Protocol August 2014
Version 3.0
Page 76 of 82
Gamma
Great progress has been made over the past years in understanding the change in the chemical
form of fused aromatic carbons beyond aromaticity. Advancement in this area may come from
NMR studies (Mao et al., 2012), measurements of adsorbed C-13-benzene (McBeath et al.,
2012) and wet chemical methods such as BPCA (Glaser et al., 1998; Brodowski et al., 2005;
Schneider et al., 2010). To improve predictability of Biochar decomposition, next steps may
include systematically relating structural information to improved Alpha-type methods, as
defined in this document
Conclusions
One of the most important properties of Biochar – if not the most important one – is its stability,
as it allows all other ancillary environmental benefits, especially as they pertain to agronomic
properties (i.e., soil amelioration and enhancement), to persist in time. Mainly, the stability of the
carbon component in Biochar makes it particularly useful as a long-term climate change
mitigation strategy, and thus having a scientifically valid Methodology for the quantification of
stable carbon will allow unlocking the potential benefits of Biochar. That is what makes this
effort, oriented by an Expert Panel, ground-breaking, and as such can contribute to the
development of policies and programs that promote the deployment of Biochar systems.
Given that this is the first such Methodology to be developed, and that the science is rapidly
evolving, the Panel necessarily devised a conservative Methodology that is likely to
underestimate the amount of stable carbon in Biochar to a period of 100 years. But with
continued research and development, some of which is described herein, we are confident that
the test Methodology will grow more robust and more rigorous over time, allowing for a more
complete and precise estimation of stable carbon in Biochar.
Acknowledgements
The International Biochar Initiative wishes to express its gratitude toward Dr. Dominic Woolf
from Cornell University and PhD student Tao Wang from Massey University, who assisted in
the development of the test method, dedicating their scarce time and vast expertise to this effort,
in the pursuit of the continuity of the development of Biochar science, in order to translate it into
action.
References
ASTM (2007) Standard Test Method for the Analysis of Wood Charcoal (D1762-84)
Abiven, S., Andreoli, R. (2010) Charcoal does not change the decomposition rate of mixed litters
in a mineral cambisol: a controlled conditions study. Biol Fertil Soils doi: 10.1007/s00374-
010-0489-1
Baldock J.A., Smernik, R.J. (2002). Chemical composition and bioavailability of thermally,
altered Pinus resinosa (Red Pine) wood. Org. Geochem. 33(9), 1093–1109.
Brewer, C., Unger, R., Schmidt-Rohn, K., Brown, R. (2011). Criteria to select Biochars for field
studies based on Biochar chemical properties. Bioenergy Research 4:312-323.
Biochar Production for Project Reporting Protocol August 2014
Version 3.0
Page 77 of 82
Brodowski S., Rodionov, A., Haumaier, L., Glaser, B., Amelung, W. (2005). Revised black
carbon assessment using benzene polycarboxylic acids. Organic Geochemistry 36:1299-
1310.
Calvelo-Pereira, R. , Kaal, J., Camps Arbestain, M., Pardo Lorenzo, R., Aitkenhead, W., Hedley,
M. , Macias, F., Hindmarsh, J., Macia-Agullo, J.A. (2011). Contribution to characterisation
of Biochar to estimate the labile fraction of carbon. Org. Geochem. 42:1331-1342.
Clean Development Mechanism (CDM) Small-scale Methodology AMS.III-L. Avoidance of
methane production from biomass decay through controlled Pyrolysis. United Nations
Framework Convention on Climate Change. Retrieved from
http://cdm.unfccc.int/methodologies/SSCmethodologies/approved.html (Last access on
21/09/2012).
Cheng, C.H., Lehmann, J., Thies, J.E., Burton, S.D. (2008). Stability of black carbon in soils
across a climatic gradient. Journal of Geophysical Research – Biogeosciences 113, G02027.
Cheng, C.H., Lehmann, J., Thies, J.E., Burton, S.D., Engelhard, M.H. (2006). Oxidation of black
carbon by biotic and abiotic processes. Org. Geochem. 37(11), 1477–1488.
Cross, A., Sohi, S.P. (2011). The priming potential of Biochar products in relation to labile
carbon contents and soil organic matter status. Soil Biol Biochem 43:2127–2134.
doi:10.1016/j.soilbio.2011.06.016
Davidson, E.A., Ackerman, I.L (1993) Changes in soil carbon inventories following cultivation
of previously untilled soils. Biocgeochem 20:161-193
DeGryze, S., Cullen, M., Durschinger, L. (2010). Evaluation of the opportunities for generating
Carbon Offsets from soil sequestration of Biochar. Terra Globa Capital LLC. Commissioned
by the Climate Action Reserve.
Elmquist, M., Cornelissen, G., Kukulska, Z., Gustafsson, Ö. (2006). Distinct oxidative stabilities
of char versus soot black carbon: implications for quantification and environmental
recalcitrance. Global Biogeochem. Cy. 20(2), GB2009.
Enders, A., Hanley, K., Whitman, T., Joseph, S., Lehmann, J. (2012) Characterization of
biochars to evaluate recalcitrance and agronomic performance. Bioresour Technol. 114:644-
53. Epub 2012 Mar 21.
Fabbri, D., Torri, C., Spokas, K.A. (2012) Analytical Pyrolysis of synthetic chars derived from
biomass with potential agronomic application (Biochar). Relationships with impacts on
microbial carbon dioxide production. Journal of Analytical and Applied Pyrolysis. 93:77-84.
Foereid, B., Lehmann, J., Major, J. (2011). Modeling black carbon degradation and movement in
soil. Plant Soil 345:223–236.
France-Lanord, C., Derry, L.A. (1997). Organic carbon burial forcing of the carbon cycle from
himalayan erosion.Nature 390:65-67.
Galy, V., France-Lanord, C., Beyssac, O., Faure, P., Kudrass, H., Palhol, F. (2007). Efficient
organic carbon burial in the bengal fan sustained by the himalayan erosional system. Nature
450:407-410.
Glaser, B., Haumaier, L., Guggenberger, G. Zech W. (1998). Black carbon in soils: the use of
benzenecarboxylic acids as specific markers. Organic Geochemistry 29:811-819.
Guggenberger, G., Rodionov, A., Shibistova, O., Grabe, M., Kasansky, O. A., Fuchs, H.,
Mikheyeva, N., Zhazhevskaya, G. and Flessa, H. (2008). Storage and mobility of black
Biochar Production for Project Reporting Protocol August 2014
Version 3.0
Page 78 of 82
carbon in permafrost soils in the forest tundra ecotone in northern Siberia, Global Change
Biology 1:1367–1381.
Gundale, M.J., DeLuca, T.H. (2007). Charcoal effects on soil solution chemistry and growth of
Koeleria macrantha in the ponderosa pine/Douglasfir ecosystem. Biology and Fertility of
Soils, 43:303–311.
Hamer, U., Marschner, B., Brodowski, S., Amelung, W. (2004). Interactive priming of black
carbon and glucose mineralisation. Org. Geochem. 35(7):823–830.
Hammes, K., Torn, M.S., Lapenas, A.G., Schmidt, M.W.I. (2008). Centennial black carbon
turnover observed in a Russian steppe soil. Biogeosci. 5(5):1339–1350.
International Biochar Initiative (IBI) (2012). Standardized Product Definition and Product
Testing Guidelines for Biochar That Is Used In Soil. May, 2012.
Jeffery, S., Verheijen, F.G.A., van der Velde, M., Bastos, A.C. (2011). A quantitative review of
the effects of Biochar application to soils on crop productivity using meta-
analysis. Agriculture, Ecosystems and the Environment. 144, 1, 175-187.
Jones, D.L., Murphy, D.V., Khalid, M., et al. (2011) Short-term Biochar-induced increase in soil
CO2 release is both biotically and abiotically mediated. Soil Biology and Biochemistry
43:1723–1731. doi: 10.1016/j.soilbio.2011.04.018
Kaal, J., Martinez Cortizas, A., Nierop, K.G.J. (2008). Characterisation of aged charcoal using a
coil probe Pyrolysis-GC/MS method optimised for black carbon. Journal of Analytical and
Applied Pyrolysis. 85:408-416.
Kaal, J., Rumpel, C. (2009). Can Pyrolysis-GC/MS be used to estimate the degree of thermal
alteration of black carbon? Organic Geochemistry 40:1179-1187.
Kaal, J., Schneider M.P.W., Schmidt, M.W.I. (2012). Rapid molecular screening of black carbon
(Biochar) thermosequences obtained from chestnut wood and rice straw: A Pyrolysis-
GC/MS. Biomass and Bioenergy 45:115-128.
Keith, A., Singh, B., Singh, B.P. (2011) Interactive Priming of Biochar and Labile Organic
Matter Mineralization in a Smectite-Rich Soil. Environ Sci Technol. doi: 10.1021/es202186j
Knicker, H., Almendros, G., Gonzalez-Vila, F.J., Gonzalez-Perez, J.A., Polvillo, O. (2006).
Characteristic alterations of quantity and quality of soil organic matter caused by forest fires
in continental Mediterranean ecosystems: a solid-state C-13 NMR study. Eur. J. Soil Sci.
57(4), 558–569
Krull, E., Baldock, J., Skjemstad, J. (2003) Importance of mechanisms and processes of the
stabilization of soil organic matter for modeling carbon turnover. Funct Plant Biol 30:207–
222. doi:10.1071/FP02085
Krull, E., Baldock, J., Skjemstad, J., Smernik, N. (2009). Characteristics of Biochar: organo-
chemical properties. IN Lehmann J. and Joseph, S. (Eds.) Biochar for environmental
management: Science and Technology. London, Earthscan.
Kuzyakov, Y., Subbotina, I., Chen, H.Q., Bogomolova, I., Xu, X.L. (2009). Black carbon
decomposition and incorporation into soil microbial biomass estimated by C-14 labeling. Soil
Biol. Biochem. 41(2): 210–219.
Kyoto Protocol (1998) COP3 Decision 2/CP.3 Methodological issues related to the Kyoto
Protocol, paragraph 3.
Biochar Production for Project Reporting Protocol August 2014
Version 3.0
Page 79 of 82
Laird, D. (2008) The Charcoal Vision: A win-win-win scenario for simultaneously for producing
bioenergy, permanently sequestrating carbon while improving soil and water quality.
Agronomy Journal 100:178-181
Lehmann, J., Gaunt J., and Rondon M. (2006). Bio-char sequestration in terrestrial ecosystems -
a review, Mitigation and Adaptation Strategies for Global Change , Volume 11.
Lehmann, J., Czimczik, C., Laird, D. and Sohi, S. (2009) Stability of Biochar in the soil. In
Lehmann, J. and Joseph, S. (Eds.) Biochar for environmental management, Science and
technology. London: Earthscan.
Leifeld, J., Fenner, S. and Mueller, M. (2007) Mobility of black carbon in drained peatland soils,
Biogeosciences 4:425–432
Leinweber, P. Schulten, H. R., Kerschens, M. (1995). Hot water extracted organic matter:
chemical composition and temporal variations in a long-term field experiment. Biol Fertil
Soils 20:17-23.
Liang, B., Lehmann, J., Sohi, S.P., et al. (2010) Black carbon affects the cycling of non-black
carbon in soil. Organic Geochemistry 41:206–213. doi: 10.1016/j.orggeochem.2009.09.007
Liang, B., Lehmann, J., Solomon, D., Sohi, S., Thies, J.E., Skjemstad, J.O, Luizao, F.J.,
Engelhard, M.H., Neves, E.G., Wirick, S (2008) Stability of biomass-derived black carbon in
soils. Geochim. Cosmochim. Acta 72(24):6069–6078.
Luo, Y., Durenkamp, M., De Nobili, M., et al. (2011) Short term soil priming effects and the
mineralisation of Biochar following its incorporation to soils of different pH. Soil Biology
and Biochemistry 43:2304–2314. doi: 10.1016/j.soilbio.2011.07.020
Major, J., Rondon, M., Molina, D., Riha, S. and Lehmann, J. (2010). Maize yield and nutrition
during 4 years after Biochar application to a Colombian savanna oxisol. Plant and Soil
333:117-128.
Major, J., Lehmann, J., Rondon, M., Goodale, C. (2010b). Fate of soil-applied black carbon:
downward migration, leaching and soil respiration. Global Change Biology 16:1366-1379.
Masiello, C.A. (2004). New directions in black carbon organic geochemistry. Mar. Chem. 92(1–
4):201–213.
McBeath, A.V., Smernik, R.J. (2009). Variation in the degree of aromatic condensation of chars.
Organic Geochemistry 40:1161-1168.
McBeath, A.V., Smernik, R.J., Schneider, M.P.W., Schmidt, M.W.I., Plant, E.L. (2011).
Determination of the aromaticity and the degree of condensed aromatic condensation of a
thermosequence of wood charcoal using NMR. Organic Geochemistry. 42:1194-1202.
Nguyen, B.T., Lehmann, J., Kinyangi, J., Smernik, R., Riha, S.J., Engelhard, M.H. (2008). Long
term black carbon dynamics in cultivated soil. Biogeochem. 89(3):295–308.
Novak, J.M., Busscher, W.J., Watts, D.W., Laird, D.A., Ahmedna, M.A., Niandou, M.A.S.
(2010). Short-term CO2 mineralization after additions of Biochar and switchgrass to a Typic
Kandiudult. Geoderma 154(3–4):281–288.
Rondon, M.A., Lehmann, J., Ramirez, J., Hurtado, M. (2007). Biological nitrogen fixation by
common beans (Phaseolus vulgaris L.) increases with bio-char additions. Biol. Fertil. Soils
43:699–708.
Rumpel, C. and Kögel-Knabner, I. (2011) Deep soil organic matter—a key but poorly
understood component of terrestrial C cycle Plant and Soil 338(1-2):143-158
Biochar Production for Project Reporting Protocol August 2014
Version 3.0
Page 80 of 82
Rumpel, C., Alexis, M., Chabbi, A., et al. (2005). Black carbon contribution to soil organic
matter decomposition in tropical sloping land under slash-and-burn agriculture. Geoderma:
35–46
Schimmelpfennig, S., Glaser, B. (2012) One Step Forward toward Characterization: Some
Important Material Properties to Distinguish Biochars. Journal of Environmental Quality: 41:
1001–1013 doi:10.2134/jeq2011.0146doi:10.2134/jeq2011.0146
Schneider, M.P.W., Hilf, M., Vogt, U.F., Schmidt, M.W.J. (2010). The benzene polycarboxylic
acid (BPCA) pattern of wood pyrolyzed between 200 °C and 1000 °C. Organic
Geochemistry 41:1082-1088.
Schumacher, B. (2002). Methods for determination of Total Organic Carbon (TOC) in soils and
sediments. US EPA, Environmental Sciences Division National Exposure Research
Laboratory, Office of Research and Development.
Singh, B.P., Cowie, A.L,, Smernik, R.J. (2012). Biochar carbon stability in a clayey soil as a
function of Feedstock and Pyrolysis temperature. Environmental Science & Technology
46 (21), pp 11770–11778 DOI: 10.1021/es302545b.
Smernik, R.J. (2009). Biochar and sorption of organic compounds. In Lehmann, J. and Joseph, S.
(Eds.) Biochar for environmental management, Science and technology. London: Earthscan.
Spokas, K.A. (2010) Review of the stability of Biochar in soils: predictability of O:C molar
ratios. Carbon Management 289-303.
Spokas, K.A., Reicosky, D.C. (2009) Impacts of sixteen different Biochars on soil Greenhouse
Gas production. Annals of Environmental Science vol. 3:179-193.
Van Oost, K. , Quine, T. A., Govers, G., De Gryze, S., Six, J., Harden, J. W., Ritchie, J. C.,
McCarty, G. W., Heckrath, G., Kosmas, C., Giraldez, J. V., Marques da Silva, J. R., Merckx,
R. (2007) The Impact of Agricultural Soil Erosion on the Global Carbon Cycle, Science
26(318):626-629
Van Zwieten, L., Kimber, S., Morris, S., Chan, K. Y., Downie, A., Rust, J., Joseph, S., Cowie, A.
(2010) Effects of Biochar from slow Pyrolysis of papermill waste on agronomic performance
and soil fertility. Plant and Soil 327(1-2):235-246
Wang, T., Camps-Arbestain, M., Hedley, M. (2013) Predicting C aromaticity of biochars based
on their
elemental composition. Organic Geochemistry. accepted, in press.
Wardle, D.A., Nilsson, M.C., Zackrisson, O. (2008) Fire-derived charcoal causes loss of forest
humus. Science 320, 629.
Woolf, D., Lehmann, J. (2012) Modelling the long-term response to positive and negative
priming of soil organic carbon by black carbon. BioGeoChem 1-13. DOI: 10.1007/s10533-
012-9764-6
Yanai, Y., Toyota, K. and Okazaki, M. (2007). Effects of charcoal addition on N2O emissions
from soil resulting from rewetting air-dried soil in short-term laboratory experiments. Soil
Sci. Plant Nutr. 53:181–188.Yao, F., Arbestain, M., Virgel, S., Blanco, F., Arostegui, J.,
Marcia-Agullo, J., Marias, F. (2010). Simulated geochemical weathering of a mineral ash-
rich biochar in a modified Soxhlet reactor. Chemosphere. 80:724-732.
Biochar Production for Project Reporting Protocol August 2014
Version 3.0
Page 81 of 82
Zhang, W., Niu, J., Morales, V.L., Chen, X., Hay, A.G., Lehmann, J. and Steenhuis, T.S. (2010)
Transport and retention of Biochar particles in porous media: effect of pH, ionic strength, and
particle size. Ecohydrology 3:497–508.
Zimmerman, A.R. (2010) Abiotic and microbial Oxidation of Laboratory-Produced Black
Carbon (Biochar). Environ. Sci. Tech. 44(4): 1295–1301.
Zimmerman, A.R., Gao, M., Ahn M.Y. (2011). Positive and negative carbon mineralization
priming effects among a variety of Biochar-amended soils. Soil Bio. & Biogeochem.
43:1169-1179.
Zimmerman, A.R. and Gao, B. (2013). The Stability of Biochar in the Environment. In: Biochar
and Soil Biota, (N. Ladygina and F. Rineau, eds.), CRC Press, Boca