Embed Size (px)
Citation preview

Thesis for the Master’s degree in chemistry Andreas Smebye Biochar changes the concentration and characteristics of dissolved organic matter in soil
60 study points
DEPARTMENT OF CHEMISTRY Faculty of mathematics and natural sciences UNIVERSITY OF OSLO 05/2014


Biochar changes the concentration and composition of dissolved
organic matter in soil
A laboratory study of release and sorption of dissolved organic matter
Alt1: The biochar initiative is unique as it both improves soil quality to
ensure food security and enables carbon sequestration to mitigate climate
change.
Alt2: Biochar; improves soil quality and mitigates climate change? Or !

© Andreas Smebye – Department of Chemistry, Faculty of Mathematics and Natural Sciences,
University of Oslo
2014
Biochar changes the concentration and composition of dissolved organic matter in soil
A laboratory study of release and sorption of dissolved organic matter
Andreas Smebye B.Sc.
Cover photo: “Scanning electron microscope (SEM) photo of activated charcoal” by
Mydriatic is licensed under CC BY-SA 3.0
Photo on previous page: “Illustration photo of biochar”, by Andreas Smebye
http://www.duo.uio.no/
Print: The University Print Centre, University of Oslo

V
Abstract
Biochar, the product of pyrolysis of organic matter, has been shown to increase fertility in acidic soils
by enhancing soil properties such as pH, cation-exchange-capacity and water-holding-capacity. All
these parameters are closely related to the organic matter found in soils. However, the effect of biochar
on the dissolved organic matter (DOM) in soils is poorly understood. This study focuses on two
different biochars made of agricultural waste through slow pyrolysis. A laboratory batch experiment
showed that a biochar dosage of 10 wt% increased the pH from 4.9 up to 8.7 along with the
concentration of dissolved organic C (DOC) up to 0.7 g kg-1 soil, shown when mixed with an acidic
ferralsol. Compared to a DOC release of 0.05 g kg-1for the soil itself, this illustrates biochars potential
to mobilise DOM. Another batch experiment, where known reference material was used, revealed that
biochar has a higher sorption of aliphatic over aromatic DOM. The same sorption affinity for aliphatic
DOM was also found when looking at characteristics of the DOM remaining in solution after sorption
by biochar. Column leaching of biochar showed a total leachable DOC concentration of 0.27 g kg-1 for
both biochars at a water-biochar-ratio of 50 L kg-1. These findings of biochars effect on DOM could,
indicate the potential of biochar to increase DOM leaching and reduce DOM bioavailability.
Keywords: Biochar, dissolved organic matter, ferralsol, adsorption, absorption, DOM characteristics,
reverse osmosis isolates, specific UV absorbency, specific absorbency ratio
Graphical abstract: Conceptual models illustrating the study’s main findings (Modified after: Kalbitz et al., 2000).
VI
Foreword
The research for this thesis is part of the project: “Biochar on acidic agricultural lands in
Indonesia and Malaysia”, funded by the Research Council of Norway, NorGlobal program,
project 203901. The work for the thesis was primarily done at the Department of Chemistry at the
University of Oslo (UiO), in the group for environmental analysis between August 2012 and May
2014. In addition the following laboratories are acknowledged with gratitude for the possibility to
work at their facilities: Limnology laboratory, the Department of Biosciences, UiO; Center for
Molecular Medicine Norway (NCMM), UiO; Miljølaboratoriet at the Norwegian Geotechnical
Institute (NGI) and the Soil Laboratory, Norwegian University of Life Sciences (NMBU).
I would also like to use this opportunity to thank my helpful and inspirational supervisors;
Prof. Rolf D. Vogt (UiO), Phd. Vanja Alling (Norwegian Environment Agency), Prof. Jan
Mulder (NMBU), Phd. Tone C. Gadmar (UiO) and Phd. Gerard Cornelissen (NGI). Thank
you all for good guidance along the path to a final thesis. Furthermore, I would like to thank
Phd. Sarah E. Hale (NGI) for reading my thesis and providing very useful advices. I learned a
lot from the experience with fluorescence analysis at the NCMM group, thanks to Phd. Jens P.
Morth (UiO). Technicans; Emma J. Wade (NGI), Geir W. Åsli (NGI), Marita Clausen (UiO)
and Anne-Marie Skramstad (UiO) are thanked for their support and helpfulness.
Writing a master’s thesis is also an exercise of the art of procrastination. All the members and
my fellow student at the environmental analysis made this a period full of good memories;
“how does I live without you”. My home base is very dear to me, and I gratefully thank my
family and friends for their support. It’s inspiring to see true curiosity in my nephews, Alfred
and Edvard, for the little things among us.
Last, yet most important, I thank my girlfriend Synnøve Botnen for her everlasting support
and patience; I look forward to finish this thesis now so I can go home to you.
Andreas Smebye

VII
Abbreviations
DOC — Dissolved Organic Carbon DOM — Dissolved Organic Matter RefDOM — Reference Dissolved Organic Matter sUVa — specific UV absorbency SAR — Specific Absorbency Ratio wt% — weight percentage SOM — Soil Organic Matter SOC — Soil Organic Carbon — — — — — — — — —

VIII
Table of Contents
Abstract .................................................................................................................................................................. V
Foreword .............................................................................................................................................................. VI
Abbreviations .................................................................................................................................................... VII
Table of Contents ............................................................................................................................................. VIII
1. Introduction ....................................................................................................................................................... 1
1.1. The biochar initiative addresses climate change and food security ............................................................ 1
1.2. Biochar properties ....................................................................................................................................... 2
1.3. Ameliorating weathered tropical ferralsols with biochar ............................................................................ 4
1.4. The role of dissolved organic matter in biogeochemistry ............................................................................ 5
1.5. The aim of the study ..................................................................................................................................... 7
2. Materials and methods ................................................................................................................................... 10
2.1. Biochars ..................................................................................................................................................... 10
2.2. Soils ........................................................................................................................................................... 11
2.3. Reference dissolved organic matter ........................................................................................................... 12
2.4. Batch extractions ....................................................................................................................................... 12 2.4.1. Experiment 1: Batch extractions with soil and biochar ...................................................................... 13 2.4.2. Experiment 2: Batch extractions with reference material and biochar ............................................... 13
2.5. Analyses ..................................................................................................................................................... 14 2.5.1. Dissolved organic carbon quantification ............................................................................................ 14 2.5.2. Calculation of sorption coeffecients (Kd)........................................................................................... 14 2.5.3. Analysis of dissolved organic matter characteristics .......................................................................... 15 2.5.4. Basic solution parameters ................................................................................................................... 16 2.5.5. Determination of cations .................................................................................................................... 16 2.5.5. Surface area measurements ................................................................................................................ 17
2.6. Statistics ..................................................................................................................................................... 17
2.7. Quality assurance ...................................................................................................................................... 18
3. Results and discussion..................................................................................................................................... 19
3.1. Dissolved organic matter released from biochar ...................................................................................... 19 3.1.1. Differences in DOM released from cacao shell and rice husk biochar ............................................... 21 3.1.2. Water-washing of biochar increased the surface area ........................................................................ 22

IX
3.1.3. Implications ...................................................................................... Feil! Bokmerke er ikke definert.
3.2. Biochar increases the concentration of dissolved organic matter in soil .................................................. 23 3.2.1. Elevation in pH gives a dissolved organic matter release ................................................................... 23 3.2.2. Increased dissolved organic matter charge density gives a higher solubility ..................................... 25 3.2.3. Biochar could potentially change the charge of soil sorption sites ..................................................... 27 3.2.4. The characterization was biased by a high iron concentrations .......................................................... 28 3.2.5. Implications ........................................................................................................................................ 29
3.3. Biochar changes the composition of dissolved organic matter.................................................................. 30 3.3.1. Differences in the sorption of RefDOM between the two biochars .................................................... 32 3.3.2. Changes in DOM characteristics ........................................................................................................ 33 3.3.3. Potential size exclusion in micropores ............................................................................................... 35 3.3.4. Implications ........................................................................................................................................ 38
4. Conclusion ....................................................................................................................................................... 40
5. Future outlook ................................................................................................................................................. 42
6. References ........................................................................................................................................................ 43
Appendix 1: Illustration of the experimental design .......................................................................................... 1
Appendix 2: Additional analysis details .............................................................................................................. 2
Appendix 3: Surface area regressions and determination plots ........................................................................ 5
Appendix 4: Grubbs-test for outliers .................................................................................................................. 9
Appendix 5: Residual plots for the linear regression ....................................................................................... 10
Appendix 6: Additional results for biochar washing pre-treatment............................................................... 11
Appendix 7: Additional results for mixtures of soil and biochar .................................................................... 12
Appendix 8: Additional results for mixtures of reference dissolved organic matter and biochar ............... 15
List of tables and figures..................................................................................................................................... 19

X

XI
“There is only one way we could save ourselves and that is through the massive
burial of charcoal."
James Lovelock, originator of the Gaia Theory

XII

1
1. Introduction
This thesis follows the structure and layout specified in the author guidelines for the Journal
of Organic Geochemistry (retrieved from: www.elsevier.com/journals/organic-geochemistry,
01.05.2014). In the following text relevant literature findings and current research initiatives
are rather discussed in the introduction, than in a separate theory section.
1.1. The biochar initiative addresses climate change and food security
A major global challenge is to ensure food security for the entire global population, and at the
same time mitigate climate change. The proportion of people who suffer from hunger is likely
to be halved within 2015, according to the United Nations millennium developing goals (UN,
2013). But further abetment is necessary as more than 850 million people will still probably
lack food security by 2015 (FAO et al., 2012). At the same time, the Intergovernmental Panel
on Climate Change (IPCC, 2007) has addressed climate change as a new threat to food
security. Production of commercial crops has declined in many parts of Asia the latest
decades due to water stress induced by climate change (Cruz et al., 2007). The biochar
initiative is unique as it both improves soil quality to ensure food security and enables C
sequestration to mitigate climate change (Lehmann, 2007).
Biochar as a substance refers to charred organic material that is produced for the purpose as a
soil amendment and long-term C storage (Lehmann, 2007). The feedstock for this production
could be organic matter of any kind. However, agricultural waste is the most commonly
feedstock used, as it available at large quantities at a low cost. To produce biochar, the
organic matter undergoes pyrolysis at high temperature where oxygen is limited, either in
industrial combustion reactors or traditional kilns. Through pyrolysis, the C content increases
along with the stability of the organic matter (Bai et al., 2013), giving the material a residence
time in order of millennia (Kuzyakov et al., 2009). Biochar has been used for centuries to
improve soil quality, with the formation of the Amazonian anthrosols of Terrra Preta di indio
(Terra Preta) as the most renowned example. In pre-Columbian times, large amounts of
2
charred C were buried in these soils together with plant residues and inorganic ash, which
altogether gave the Terra Preta soils with their characteristic black colour (Glaser and Birk,
2012). These black soils have a remarkably higher fertility compared to adjacent weathered
and acidic ferralsols. Even today, a controlled experiments of the Terra Preat and adjacent
ferralsol showed 38-45% higher biomass production as when no fertilizer is applied
(Lehmann et al., 2003). It was the rediscovery of ancient anthrosols, such as the Terra Pretas,
that inspired the use of biochar to ameliorate infertile tropical soils (Figure 3) (Glaser et al.,
2014).
1.2. Biochar properties
Pyrolysis thermally converts the organic matter into black C that is depleted in O and H
(Spokas, 2010), and enriched in aromatic C (Baldock and Smernik, 2002); relative to the
feedstock material. If the black C is used as a soil amendment, it is by definition termed as
biochar (Lehmann, 2007). The thermally conversion changes the molecular structures and
yields a recalcitrant material (Kuzyakov et al., 2009), with varying properties depending on
pyrolysis conditions and feedstock. Biochar’s fixed C content has been shown to vary from 0
to 91 wt% (Chan and Xu, 2006) and for example; slow pyrolysis at 300-6000C of agricultural
waste feedstock gives a fixed C content that varies from 40 to 77% (Enders et al., 2012). In
addition biochar contains an ash component that is usually alkaline and could potentially
increase soil pH if added to an acidic soil (Chintala et al., 2014; Martinsen et al., n.d.). The
alkalinity of biochar depends on the amount and characteristics of the alkaline ash and
counteracting acidic functional groups on the biochar surface (Enders et al., 2012).

3
Figure 1 - Scanning electron microscope pictures taken of (a) cacao shell and (b) rice husk biochar produced for this projects field trials and experiments. The pictures are magnified approx. 600 times, at a high voltage of 3.0 kVolt using a Quanta 200 instrument (FEI, Hillsboro, USA).
The pyrolysis of the organic material gives the resulting biochar a large surface area by
increasing the porosity (Figure 1). Increasing the pyrolysis temperature has been shown to
accelerate this process and give a higher surface area (Keiluweit et al., 2010). The increase
itself has been suggested to result from the loss of volatile organic C creating new pores in the
biochar structure (Guo and Rockstraw, 2007). The large surface area enhances ion-exchange
and sorption of nutrients and organic materials (Alling et al., n.d.; Hale et al., 2013a; Liang et
al., 2006). These capabilities of biochar are also enabled by a high density of functional
groups on the biochar surface, measured by the cation-exchange-capacity (CEC) and anion-
exchange-capacity (AEC) for hence negatively and positively charged sites. Biochar have
reported CEC values up to 112 cmolc kg-1 (Cheng et al., 2008) compared to only 1-12 cmolc
kg-1 in soils reported to respond to biochar amendments (Martinsen et al., n.d.; Yamato et al.,
2006). Contrary to the surface area, the cation-exchange-capacity (CEC) has been reported to
decreases with increasing temperature, this apparent contradiction is usually ascribed to the
concurrent loss of acidic functional groups during pyrolysis (Guo and Rockstraw, 2007). Few
studies have dealt with the AEC, but wood biochar produced through traditional slow
pyrolysis at high temperature have reported AES values of 2 cmolc kg-1 at a pH of 3.5 (Cheng
et al., 2008).

4
1.3. Ameliorating weathered tropical ferralsols with biochar
The productivity of natural tropical soils typically declines after harvest of a few crops due to
loss of soil organic matter, which in turn increases nutrient leaching (Glaser et al., 2002). This
reduction in soil fertility was documented in a three year field trial in the humid tropics were
the total C and N was reduced by 30 percent after the conversion of forest into agricultural
land (Henrot & Robertson, 1993). Primary minerals and clay in tropical soils exposed to
intense weathering, will eventually transform into minerals such as kaolinite and/ or
sesquioxides, and are hence referred to as ferralsols (van Wambeke, 1974). The pH of these
soils is often acidic and below or close to isoelectric point of their dominating minerals (Parks,
1965), giving a low CEC (Glaser, 2007). The low CEC reduces these soils ability to retain
cations, which includes important macronutrients such as K and ammonium (Brady and Nyle,
2004).
Biochar has proven useful to improve soil fertility by increasing both soil pH and CEC (Liang
et al., 2006; Martinsen et al., n.d.). A high concentration of Al has a phytotoxic effect which
reduces plant growth (Barceló et al., 1995), elevation of the pH will increase the sorption of
Al to biochar reducing the availability below phytotoxic levels (Alling et al., n.d.). Sorption of
nutrients, such as phosphate and ammonium, only show weak bonds to the biochar surface
(Hale et al., 2013a). A weak binding is crucial so nutrients are adsorb when the concentration
is high e.g. after fertilization, but then also desorbed and made plant available when the
concentration drops. In addition, several studies indicate that biochar amendments could also
increases the fertility by improving the soil water holding capacity (Cornelissen et al., 2013;
Glaser et al., 2002).
Biochar amendments can also increase the soil organic matter (SOM) (Glaser and Birk, 2012),
which is essential for good soil quality. Soil amendments of biochar in many ways
compensate for the low levels of SOM. Ferralsols generally contain low levels of soil organic
matter (van Wambeke, 1974), as they mainly exists in the subtropical regio where added
organic material through litter etc. biodegrades rapidly due to high temperature and humidity
(Liang et al., 2010). Since the biochar has a high recalcitrance, the biochar will persists in the

5
soil for millenia (Kuzyakov et al., 2009), compared to a fallen tree that has totally
decomposed after 10 to 100 years (Lackner, 2003). The favorable properties of biochar
remain in the soils for a long period of time due to recalcitrance of biochar.
1.4. The role of dissolved organic matter in biogeochemistry
As litter and organisms degrade in soil, their organic matter decomposes into smaller
compounds, which either evaporates as volatiles, leaches out as dissolved organic matter
(DOM) or is incorporated into the SOM (Figure 2). Some of the partly decomposed organic
compounds will polymerise and form humic substances, which easily sorbs to mineral
surfaces (Kalbitz et al., 2000). The amount of SOM correlates with the available mineral
surfaces under the same soil conditions (Brady and Nyle, 2004), which illustrates the
importance of sorption for the preservation of SOM. Along other processes, the sorption
creates equilibrium between the dissolved and particulate organic matter. Parts of the SOM
could then dissolved if soil conditions changes and are hence denoted potential DOM (Kalbitz
et al., 2000). Convective transportation will bring the DOM down through the soil horizon,
unless it is immobilized in micropores (Kalbitz et al., 2000).
6
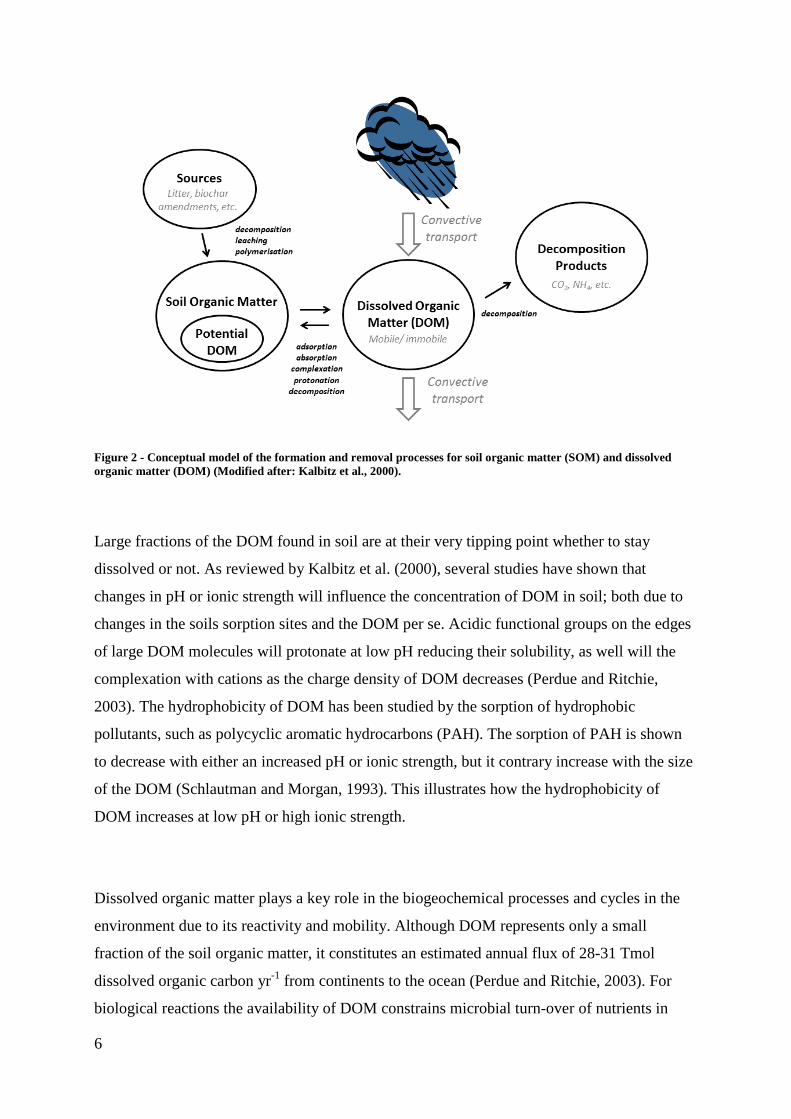
Figure 2 - Conceptual model of the formation and removal processes for soil organic matter (SOM) and dissolved organic matter (DOM) (Modified after: Kalbitz et al., 2000).
Large fractions of the DOM found in soil are at their very tipping point whether to stay
dissolved or not. As reviewed by Kalbitz et al. (2000), several studies have shown that
changes in pH or ionic strength will influence the concentration of DOM in soil; both due to
changes in the soils sorption sites and the DOM per se. Acidic functional groups on the edges
of large DOM molecules will protonate at low pH reducing their solubility, as well will the
complexation with cations as the charge density of DOM decreases (Perdue and Ritchie,
2003). The hydrophobicity of DOM has been studied by the sorption of hydrophobic
pollutants, such as polycyclic aromatic hydrocarbons (PAH). The sorption of PAH is shown
to decrease with either an increased pH or ionic strength, but it contrary increase with the size
of the DOM (Schlautman and Morgan, 1993). This illustrates how the hydrophobicity of
DOM increases at low pH or high ionic strength.
Dissolved organic matter plays a key role in the biogeochemical processes and cycles in the
environment due to its reactivity and mobility. Although DOM represents only a small
fraction of the soil organic matter, it constitutes an estimated annual flux of 28-31 Tmol
dissolved organic carbon yr-1 from continents to the ocean (Perdue and Ritchie, 2003). For
biological reactions the availability of DOM constrains microbial turn-over of nutrients in

7
soils (Marschner and Noble, 2000), which is essential for the fertility of soils. Furthermore,
increased nitrous oxide emissions, contributing to climate change, could occur by reduced co-
metabolism of DOM and nitrous oxide by nitrifying bacteria (Cayuela et al., 2013). The
interaction between biochar and DOM in soils is however poorly understood. It is known that
1.5. Analysis of DOM
DOM is a continuum mixture of labile to recalcitrant organic molecules with different size
and chemical properties. The aromatic fraction of the DOM is regarded as larger and more
recalcitrant than the smaller labile aliphatic fraction (Marschner and Kalbitz, 2003). Aromatic
DOM molecules also have a lower solubility than aliphatic DOM, due to their lower charge
density (Perdue and Ritchie, 2003). The relative amount of aromatic moieties in DOM can
easily be approximated through the specific UV absorbency (sUVa); by standardising the
aromatic DOMs absorbency at 254nm with the dissolved organic carbon (DOC) concentration
(Traina et al., 1990; Weishaar et al., 2003). The sUVa parameter then describes the relative
amount of aromatic DOM in a sample. The specific absorbency ratio (SAR), measured as the
absorbancy at 254nm relative to 400nm, indicates the size of the aromatic DOM moieties
(Vogt et al., 2004), and then also likely the size of the molecule. This can be rationalised as
conjugated chromophores in large aromatic DOM absorbs light at higher wavelength (Pavia,
2009) with too low energy for absorbance by smaller aromatic DOM.
1.5. The aim of the study
The study aimed to test the following hypothesis: “Biochar increases the release of DOM in
amended soils due to pH elevation.” To observe the effect of biochar on the DOM mobility
and physiochemical characteristics, soil and biochar were analysed in a laboratory batch
experiment. Two different biochars, cacao shell and rice husk, were mixed with two different
soils: i) a tropical acidic soil was collected from the projects field trial in Indonesia and ii) a
previously studied temperate pH-neutral soil in Norway (Brandli et al., 2009). This study used
a high biochar dose of 10 wt% to study the interaction mechanisms between biochar and soil.
In addition to observe the effect of untreated biochar, each biochar was column washed with

8
water to give a biochar with minimal DOM release. Each biochar was also washed with acid,
to give a biochar without acid neutralizing capacity. To the knowledge of the author, only one
study (Mukherjee and Zimmerman, 2013a) have previously documented the effect on DOM
by the interaction between biochar on soil. That study however, focuses on recreating field
conditions in a column experiment, rather than focusing on the mechanisms involved.
The study also aimed to test a second hypothesis: “Biochar changes the DOM composition
due to selective sorption of DOM”. The same untreated and washed biochars were mixed with
reference dissolved organic matter (RefDOM) (Vogt et al., 2004) to observe the changes in
DOM composition of a well characterised DOM solution, during another batch experiment.
To the knowledge of the author, there has only been conducted one previous study (Kasozi et
al., 2010) of this kind. However, this study used RefDOM of natural origin to limit the
deviation from natural conditions, in contrast to the laboratory produced DOM used in the
study of Kasozi et al. (2010). The inclusion of naturally DOM represents more of the natural
variability seen in DOM, than laboratory produced DOM.
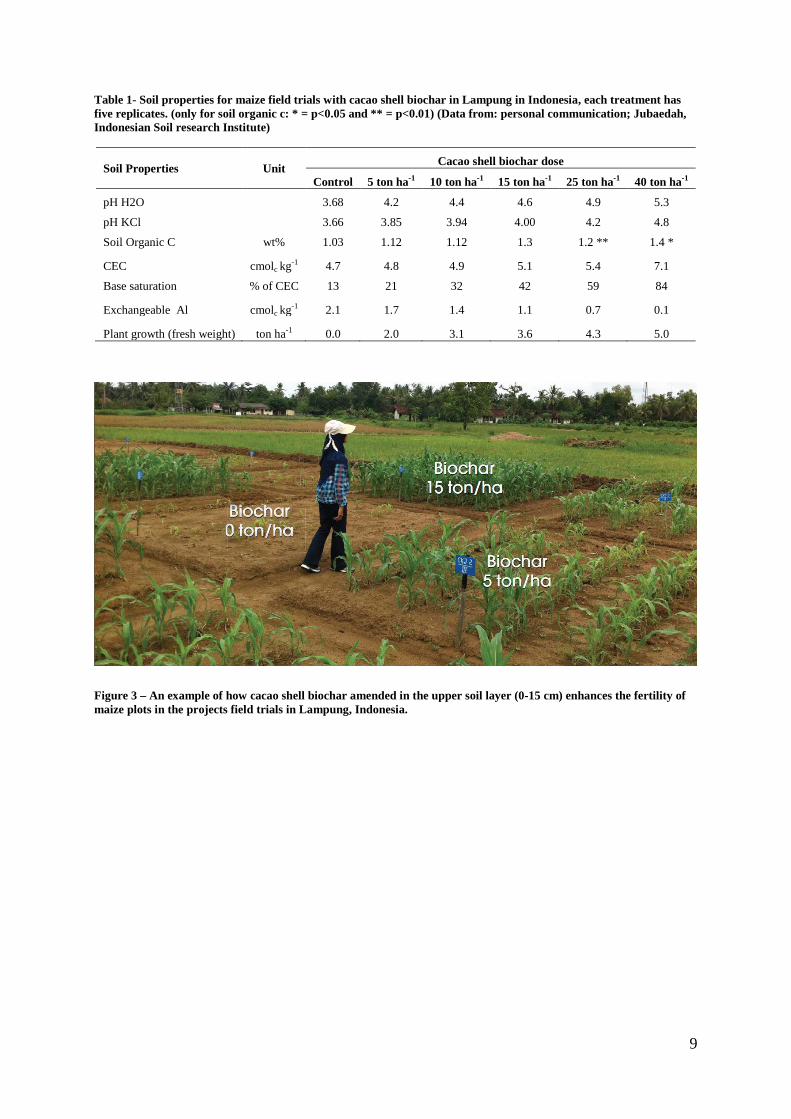
The motivation to study the DOM was related to preliminary findings in the projects maize
field trials in Lampung, Indonesia. Cacao shell biochar amendments to the upper soil (0-0.15
m) increased the pH, CEC and base saturation and gave an improved plant growth from 0.0 to
5.0 tons of biomass per hectare for hence the control and an 50 tons ha-1 biochar amended plot
(Figure 3 and table 1) (for description of the biochar, see Methods and materials). However,
despite the observed increase in fertility these results urged for a study of DOM as the fraction
of soil organic C remained constant despite biochar amendments. A significant increase in the
soil organic C was first found at very high biochar dosages (>15 tons ha-1) (Table 1). This
finding is surprising as ancient biochar amended sites, such as the previously Terra Preta,
have shown 100% higher amounts of soil organic C than adjacent sites (Glaser and Birk,
2012). Increased decomposition and/ or convective transport of DOM down the soil horizon
could on the other hand explain these trends. To evaluate the likeliness of these mechanisms a
basic understanding of biochars effect on DOM concentration and composition is necessary.
9
Table 1- Soil properties for maize field trials with cacao shell biochar in Lampung in Indonesia, each treatment has five replicates. (only for soil organic c: * = p<0.05 and ** = p<0.01) (Data from: personal communication; Jubaedah, Indonesian Soil research Institute)
Soil Properties Unit Cacao shell biochar dose
Control 5 ton ha-1 10 ton ha-1 15 ton ha-1 25 ton ha-1 40 ton ha-1
pH H2O
3.68 4.2 4.4 4.6 4.9 5.3
pH KCl
3.66 3.85 3.94 4.00 4.2 4.8
Soil Organic C wt% 1.03 1.12 1.12 1.3 1.2 ** 1.4 *
CEC cmolc kg-1 4.7 4.8 4.9 5.1 5.4 7.1
Base saturation % of CEC 13 21 32 42 59 84
Exchangeable Al cmolc kg-1 2.1 1.7 1.4 1.1 0.7 0.1
Plant growth (fresh weight) ton ha-1 0.0 2.0 3.1 3.6 4.3 5.0
Figure 3 – An example of how cacao shell biochar amended in the upper soil layer (0-15 cm) enhances the fertility of maize plots in the projects field trials in Lampung, Indonesia.

10
2. Materials and methods
All chemicals used were of pro analysis quality (>99.5%) and only ultra-pure (>1 MΩ cm-1)
water ion-exchanged with Elix-5 system (Millipore, Bedford, USA) were used for
preparations.
2.1. Biochars
The biochars were produced using a slow pyrolysis method and were from two different
feedstocks; cacao shell and rice husk. Both feedstock were pyrolyzed at 250-350 0C
(average300 0C) using a pyrolysis time of 3.5 hours at the Indonesia Soil Research Institute in
Bagor, Indonesia. In prior of pyrolysis, the feedstock was packed in a locally modified kiln of
30-40 L, which was heated by the combustion of syngas (further details see: Hale et al.,
2013a). The sundried rice husk and cacao shell feedstock gave a biochar yield of 22.0 and
30.4 %wt. respectively after pyrolysis (Table 4). After production the biochar were stored in
air-tight glass jars. The biochar samples were sieved through a 2 mm mesh before use, but not
dried. Throughout the text the biochars are referred to as hence cacao shell and rice husk
biochar.
Figure 4 - The modified locally constructed kiln used to produce the biochars; to the left in the photo, the pyrolysis chamber can be seen, while at the right a smoke chamber.

11
To give biochar with minimized DOM release a water-washing pre-treatment in columns was
applied. This water-washing was conducted until a water-to-biochar ratio of 50 was reached.
Some of the water-washed biochar was further washed with acid (0.01M HCl) to remove
biochars acid neutralising capacity. Using an acid-to-biochar ratio of 20 and 10 for cacao shell
and rice husk biochars, the pH of both biochar leachates dropped from approximately 9 to 2
and the acid-washing was stopped. All washing was performed at a low flow (<0.13L/hr.) to
prevent physical changes of the material. A 0.45µm cellulose nitrate filter (Sartorius,
Göttingen, Germany) prevented loss of particulate material from the column during washing.
After the pre-treatments each biochar was then available as untreated, water-washed and acid-
washed. In total six different biochars were used in the experiments and will be referred to as:
Untreated, washed and acid cacao shell or rice husk biochar.
2.2. Soils
Two different agricultural soils were included to analyse biochars effect on DOM in soil
(Table 2); i) a pH-neutral sandy loam with a pH of 6.5, CEC of 13.2 cmolc kg-1 and TOC of
1.4% from Ås in Norway (Norderås; 59.67945 N, 10.76888 E) (Data from: Hale et al., 2013b),
and ii) an acidic ferralsol with a pH of 3.7, CEC of 4.5 cmolc kg-1 and TOC of 0.9% from
Lampung in Indonesia (Tamanbogo; 0.89570 N, 112.55680 E) (Data from: Alling et al., n.d.).
Although these soils are denoted agricultural they have not been cultivated or fertilized
(personal communication, , but are termed so . The acidic soil is also included in our on-going
field trial where this soil is amended with the previously described biochars (as reviewed in
the introduction). The soils were collected from the upper layer down to 15 cm depth from
five different locations, mixed thoroughly and kept in air-tight plastic bags during shipping.
The soil samples were sieved through a 2 mm mesh, but not dried before use.
Table 2 – Physiochemical properties of the soils included in the study: Organic C (Org. C), H, N, pH, cation exchange capacity (CEC) and base saturation (BS) (Data from: Alling et al., n.d.).
Org. C H N pH CECa BS
Soil Soil type (wt%) (H2O) cmolc kg-1 (% of CEC)
Acidic Infertile ferralsol 0.87 0.45 0.05 3.7 4.48 11.70

12
pH-neutral Fertile brown soil 1.41 n.d. n.d. 6.5 13.2 100 aEffective CEC measured as the sum of base cations and exchangeable acidity in 1M NH4NO3. n.d, not determined.
2.3. Reference dissolved organic matter
RefDOM was included to analyse biochar sorption patterns of already characterised DOM.
This RefDOM was produced by Vogt et al. (2004) through reverse-osmosis of samples from
Nordic catchments. Further up-concentration and freeze-drying of the DOM gives RefDOM
in the form of a dry powder. This dry powder of RefDOM can be dissolve to give a
reproducible solution enabling several studies on the same material (Vogt et al., 2004).
Overall, these RefDOM solutions show a low biodegradability; only 6-17 wt% of the DOC in
these
the and a hydrophobic characterThree different RefDOM was included with characteristics
ranging from more aliphatic to aromatic RefDOM based on their sUVa (Table 3); i) Aliphatic
RefDOM with a sUVa of 2.5, ii) Intermediate RefDOM with a sUVa of 3.5, and iii) Aromatic
RefDOM with a sUVa of 3.9.
Table 3 - Selected characteristics of the reference dissolved organic matter (RefDOM); C-N-ratio (C:N), Organic C (Org. C), Hydrophobic Acids (HPO-A) in DOM adsorbed by a non-polar XAD-8 resin, specific UV absorbency (sUVa) of λ254 relative to DOC, specific absorbency ratio (SAR) of λ254/ λ400, biodegradable organic carbon (BDOC), loss after 10 days under ideal conditions and molecular weight from HP-SEC (Mw). (Data from: Vogt et al., 2004).
C:N Org. C HPO-A sUVa SAR BDOC Radii
Denotation (wt%.) (C wt%) L mg-1 m-1 (wt%) nm
Aliphatic RefDOM 24 0.16 55 2.5 10.7 17 2.51
Intermediate RefDOM 33 0.23 62 3.6 7.9 11 2.24
Aromatic RefDOM 42 0.15 62 3.9 5.2 6 1.88
2.4. Batch experiments

13
The two batch experiments were conducted with a very similar batch extractions method, but
there was a difference in the filtration setup. To avoid a fouling effect a vacuum filtration with
a higher suspended solid capacity was used for soil and biochar mixture samples. For samples
with mixtures of RefDOM and biochar, the amount of suspended solids was adequately low to
use syringe filtration. Only filtrated samples were used for analyses, to avoid a potential bias
from the filtration method. All samples were prepared in triplicate.
2.4.1. Experiment 1: Batch extractions with soil and biochar
The batch extractions were conducted by preparation of mixtures with 90% soil and 10%
biochar by dry weight at a water-to-solid ratio of 10 L/kg. This water-to-solid ratio was
chosen to assemble field conditions (REF!!!). In addition control batches were prepared with
only soil or biochar (An illustration of the experimental design can be found in appendix 1).
The mixtures were shaken for 72 hrs. in the dark. The dissolved fraction was then collected
for analyses by funnel filtration with 2µm Blue Ribbon Filters (GE Healthcare, Freiburg,
Germany) followed by vacuum filtration with 0.45µm cellulose nitrate filters (Sartorius,
Göttingen, Germany).
The biochar dose was chosen to investigate mechanisms instead of an achievable field dose. A
10% biochar dose by dry weight would correspond to 225 tons ha-1 in the field; assuming
application to the top soil (0-15 cm in depth), a soil bulk density of 1.5 g (cm3)-1 and no
change in bulk density after biochar application. The soil will probably though change bulk
density with biochar amendments (Jones et al., 2011), but for this coarse comparison this
effect is neglected.
2.4.2. Experiment 2: Batch extractions with reference material and biochar
The RefDOM and biochar mixtures were prepared with a RefDOM-solution-to-biochar ratio
of 500 L/kg, where the RefDOM solution was prepared at a concentration of 10 mg C L-1 (An
illustration of the experimental design can be found in appendix 1). A pilot study of sorption

14
isotherms gave this ratio where the sorption is observable and pH changes limited. In addition
control batches were prepared with only RefDOM solution or biochar mixed with water (at
the same liquid-to-solid ratio as for the mixtures). The dissolved fraction was collected for
analyses after 72 hours shaking in the dark with a funnel filtration using 2µm Blue Ribbon
Filters (GE Healthcare, Freiburg, Germany) following syringe filtration with 0.45µm
polyethersulfone syringe membrane filters (VWR, Radnor, USA).
2.5. Analyses
Details regarding the calculation of limit of detection (LOD) can be found in appendix 2.
2.5.1. Dissolved organic carbon quantification
To determine the concentration of DOC was determined by high temperature catalytic
oxidation using a TOC-V instrument (Shimadzu, Kyoto, Japan). Inorganic C was removed in
prior to analysis by acidifying the samples to pH 2 with 2M HCl and purging for 10 min. with
C free air (ISO-8245). In total 8 standards were prepared by the instruments auto-dilution
function in the range from 0 – 25 mg C L-1. All standards and samples had five measurement
replicates. The analysis of the instrument blank gave a standard deviation of 0.06 and LOD of
0.22 mg C L-1.
2.5.2. Calculation of sorption coeffecients (Kd)
Sorption coefficients (Kd) for RefDOM sorption to biochar were calculated from the loss of
aqueous DOC (sorbed DOC) relative to the DOC found after sorption (DOC in solution)
(Equation 1). The DOC concentrations for control batches of RefDOM and biochar were
added to give a before sorption concentration. While the concentration found in the batch
extraction sample for the mixture of RefDOM and biochar gave the concentration after

15
sorption (Figure 4). To find the concentration of sorbed DOC to biochar, the after sorption
concentration was subtracted from the before sorption.
Equation 1 – The calculation of the sorption coefficient (Kd) from the concentrations found before and after sorption.
𝐾𝑑(𝐿𝑘𝑔
) = 𝐷𝑂𝐶(𝑏𝑖𝑜𝑐ℎ𝑎𝑟 − 𝑚𝑔/𝑘𝑔)𝐷𝑂𝐶(𝑠𝑜𝑙𝑢𝑡𝑖𝑜𝑛 − 𝑚𝑔/𝐿)
= 𝐷𝑂𝐶(𝑏𝑒𝑓𝑜𝑟𝑒 𝑠𝑜𝑟𝑝𝑡𝑖𝑜𝑛) − 𝐷𝑂𝐶(𝑎𝑓𝑡𝑒𝑟 𝑠𝑜𝑟𝑝𝑡𝑖𝑜𝑛)
𝐷𝑂𝐶(𝑎𝑓𝑡𝑒𝑟 𝑠𝑜𝑟𝑝𝑡𝑖𝑜𝑛)
Figure 5 - Illustration of the calculations of the before and after sorption concentrations.
2.5.3. Analysis of dissolved organic matter characteristics
The DOM characteristics were measured by UV and visual absorbency. Two parameters were
estimated; i) specific UV absorbency (sUVa), indicating the relative amount of aromatic DOC;
defined as the absorbency at λ254nm relative to the DOC concentrations, ii) specific absorbency
ratio (SAR), indicating the relative size of aromatic DOM; defined as the absorbency at λ254nm
relative to λ400nm. The samples were analysed in a 10 mm Suprasil Quartz cuvette (Hellma,

16
Müllheim, Germany) with a UV-1800 spectrophotometer (Shimadzu, Kyoto, Japan). A
reference cuvette with water compensated drift from the light source. The blank had a specific
absorbency mean and standard deviation of hence 0.000 and 0.001 and gave a LOD of 0.003
cm-1.
Before-sorption sUVa for the RefDOM and biochar mixtures was calculated from the control
batch samples of RefDOM and biochar. The sum of the absorbency at λ254, for the control
batches, relative to, their sum of DOC concentration, gave this parameter (Equation 2), using
the same approach of control batches as described for the sorption coefficients (Figure 4).
Equation 2 – Calculation of the before-sorption sUVa for RefDOM and biochar mixtures.
𝑩𝒆𝒇𝒐𝒓𝒆 − 𝒔𝒐𝒓𝒑𝒕𝒊𝒐𝒏 𝒔𝑼𝑽𝒂 = 𝑨𝒃𝒔 (𝑹𝒆𝒇𝑫𝑶𝑴) + 𝑨𝒃𝒔 (𝒃𝒊𝒐𝒄𝒉𝒂𝒓)𝑫𝑶𝑪 (𝑹𝒆𝒇𝑫𝑶𝑴) + 𝑫𝑶𝑪 (𝒃𝒊𝒐𝒄𝒉𝒂𝒓) ∗ 𝟏𝟎𝟎
2.5.4. Basic solution parameters
Conductivity and pH were hence measured with a conductivity meter (Mettler Toledo,
Greifensee, Switzerland) and an Orion pH-electrode (Thermo Fisher Scientific, Waltham,
USA), using buffers of pH 4 and 7 for calibration (VWR, Radnor, USA).
2.5.5. Determination of cations
The cations of Al, Ca, Fe, K, Mg, Mn and Na were determined with a Vista inductive coupled
plasma optical emission spectrometer (Varian, Palo Alto, USA) with axial viewing.
Multielement standards were prepared from commercial single element stock solutions
(Teknolab, Kolbotn, Norway). All standards and samples were conserved with nitric acid (0.3
wt%) and had a concentration of 461 mg/L caesium chloride to reduce alkali metals ionization
and hence improve their LOD. A new calibration, with minimum four data points, was
performed after every 20th sample to correct for instrument drifting. Low analyte
concentrations could fall below the LOD due to necessary dilutions if the sample had very

17
high (>500mg/L) overall cation concentration given instrument limitations. Further analytical
parameters and list of the analytes LOD can be found in appendix 2.
2.5.5. Surface area measurements
Surface area of the biochars was measured by N2-adsorption at 77K using a Belsorp2-
instrument (Bel, Osaka, Japan). In prior to analysis, the samples were degassed at 130 0C
under vacuum (<1mm Hg) for one hour. Isotherm data were recorded at partial N2-pressures
of 0.02-1 atm. The apparent surface area was estimated from the statistical monolayer
capacities of N2 according to the BET-theory (Brunauer et al., 1938). The fraction surface
area found in micropores was calculated from slope regressions in thet-plots (de Boer et al.,
1966). All BET- and thet-plots, in addition to all regression parameters, can be found in
appendix 3.
2.6. Statistics
All statistics and plots were done in the statistical environment R (R core team, 2013). The
chemCal-package (Ranke, 2013) was applied to estimate sample concentrations from
calibration regressions. To check for outliers among measurement replicates a Grubbs-test
was written rejecting at most one outlier per measurement if the p-value < 0.05 (Appendix 4).
The number of digits is presented according to the standard deviation to communicate the
variation for the statistic presented, although for simplicity a two digit standard deviations are
presented in certain cases to avoid standard form.
Linear regressions were performed, with the R-package written by Venables and Ripley
(2002), according to the least-square-regression method. A t-test was used to determine
explanatory coefficients significance from zero (Miller and Miller, 2005). The significant
differences between samples were also determined using a t-test for comparison of two
samples, and a one-way analysis of variance test for comparison of multiple groups (Miller
and Miller, 2005).

18
2.7. Quality assurance
In prior to the experiments, a pre-trial was conducted to detect potential DOC contamination
from high density polyethylene containers (Sarstedt, Nümbrecht, Germany) and filters used
(specified in previous section). A study of DOM could easily gain high uncertainty by the
combination of low DOC sample concentrations and a high potential background. A total
background for the method applied gave a DOC concentration of approx. 4 mg C L-1. All
containers were therefore acid washed and all filters flushed three times with water. The blank
for the method with pre-washed equipment, gave a DOC concentration of 0.78 ± 0.01 mg C L-
1. This background could vary depending on the sample and is therefore difficult to correct for.
The background was regarded as low enough to exclude from calculations of the sample
concentrations. The blank had neither any detectable cations nor absorbance in the UV-visual
spectra.
In addition, the DOC determination method robustness was ensured through different
dilutions of samples with high alkalinity. This test would reveal a potential bias of remaining
inorganic C after acidification and sparging, as different dilutions gave the same concentration
the method was regarded as applicable. Also control samples of dissolved quinine dihydrate
sulphate, ensured the reliability of the analyses.
Iron could potentially interfere with DOM during analysis of DOM characteristics by UV-
visual absorbency. Weishaar et al.’s (2003) empirical absorptivity constant was therefore
used to calculate a theoretical maximum non-influential concentration of dissolved iron.
Assuming an absorbance of 0.3 cm-1, this calculation gave a limit of approx. 0.38 mg Fe L-1 in
samples to ensure that a minimum of 90% of the absorbance can be attributed DOM. DOM
characteristics for samples with iron concentration above this limit was regarded as biased and
discarded. The less significant interference from nitrate was not regarded relevant as there
was no reason to expect high enough concentrations for interference.

19
The determination of cations was quality ensured by comparison of analysis result with the
projects partner at the Norwegian University of Life Sciences, as a simplified inter-calibration.
A comparison of the K concentrations for a similar sample analysed and prepared at each
laboratory showed little variation. The results of the comparison can be found in appendix 2.
3. Results and discussion
While the results and discussion of the intrinsic properties of biochar will focus on absolute
values, the presentation of the batch experiments will focus on relative changes. Laboratory
experiments simulating natural processes are always constrained by exclusion of natural
factors such as climate, which in this case would be important in a field setting. The strength
though of the approach taken in this study, is that the results can be used to analyse how
different substances react under the same conditions, relative to each other.
During discussion of results, the dissolved organic matter (DOM) and dissolved organic C
(DOC) are used to refer to the physiochemical characteristics of DOM and the approximation
of the concentration of DOM, respectively.
3.1. Intrinsic properties of the two biochars in the study
While the cacao shell and rice husk biochar are produced under the same pyrolysis conditions,
their different feedstock gives them different properties. Cacao shell biochar has a large
fraction of organic C of 69.6 wt% compared to 41.2 wt% for rice husk biochar (Table 4).
However, the ash fraction is smaller for cacao shell than rice husk biochar of hence 51.0 and
18.9 wt%. Ash is usually related to the acid neutralicing capacity (ANC) of biochar, but cacao
shell has any how an unexpected higher value of 217 cmolc kg-1 and pH of 10.5 compared to
45 cmolc kg-1 and pH of 7.3 for rice husk biochar.

20
Table 4 - Selected attributes of biochars produced from cacao shell and rice husk feedstock: Organic C (Org. C); N; pH; cation exchange capacity (CEC); ash and acid neutralising capacity (ANC). (Data retrieved from: Martinsen et al., n.d.).
Org. C N pH CECa CECb Ash ANC
Biochar type (wt%) (wt%) (H2O) (1M KCl) cmolc kg-1 (wt%) cmolc kg-1
Cacao Shell 69.6 1.37 10.5 10.0 37 ± 2 30 ± 4 18.9 217
Rice Husk 41.2 1.00 7.3 6.1 26 ± 5 7.0 ± 0.1 51.0 45 aPotential CEC measured as the amount of extractable NH4 after saturation with NH4Acetate and subsequent extraction with 1M KCl. bEffective CEC measured after saturation with 1M KCl and subsequent extraction with 0.5M NaNO3.
The higher amount of organic C found in the cacao shell biochar could indicate a higher
degree of carbonisation of the feedstock than for the rice husk biochar (hence 70 versus 41 wt%
organic C) (Table 4). Although they have been produced under the same conditions, the
feedstock will influence the degree of carbonization as well. Keiluweit et al. (2010) found that
the organic C likely first undergoes dehydration and depolymerisation into smaller volatile
compounds during pyrolysis. At higher temperature these volatile compounds will condensate
and form stable aromatic C giving a higher total organic C amount in the biochar.
Rice husk is a unique feedstock for biochar production, due to the high amount of silica
found in the plant tissue (Shen et al., 2014). This silica gives a high ash content for rice husk
biochar in comparison with other similar feedstock. Additional ash will also form as product
of the pyrolysis with high alkalinity seen by biochars high pH (Chintala et al., 2014). The
results indicate that the rice husk biochar used most likely has a silica ash fraction, as it has a
lower ANC and pH than cacao shell biochar.
Cacao shell had a barely significant (p=0.04) larger surface charge with a potential CEC of 37,
compared to 26 cmolc kg-1 for rice husk biochar (Table 4). Nevertheless, cacao shell biochar
has a clearly significant (p<0.01) larger effective CEC of 30 versus 7 cmolc kg-1 for rice husk
biochar. This leads to the conclusion that CEC of rice husk biochar consists of more pH-
dependent sorption sites than for cacao shell biochar. Despite the same pyrolysis conditions, a
rice husk feedstock has also previously been shown to have a lower CEC than a legume

21
feedstock, such as cacao shell (Yuan and Xu, 2011); this illustrates the dependency on the
feedstock as well for the biochar properties.
3.1.1. Differences in DOM released from cacao shell and rice husk biochar
We found a large release of DOM from biochar during water-washing, and the same
cumulative DOC release of 0.27 mg g-1 biochar for both cacao shell and rice husk biochar.
The release of DOM was high at first but flattened out with increasing water-biochar-ratio for
both biochars (Figure 5a) (for description of the water-washing, see Materials and methods).
The conductivity and concentration of cations in the leachate followed the same trend as the
DOC concentration, decreasing along water-washing (Appendix table 7). However, the
relative amount of aromatics in the DOM, as measured by sUVa, was far lower for cacao shell
than rice husk biochar (Figure 5b). However, the relative amount of aromatics only showed
small fluctuations during water-washing. The first measurement of sUVa, was discarded due
to iron concentrations above the non-influential limit defined of 15.28 and 0.74 for cacao shell
and rice husk biochar. The variation is unknown as the washing was only performed once.
Figure 6 – Changes in (a) DOC concentration and (b) relative amount of aromatics in the DOM, as measured by specific UV absorbency (sUVa), in the DOM released from biochar during water-washing.
(a) (b)
22
The concept of “combustion continuum” assumes that the organic feedstock likely first
undergoes dehydration and depolymerisation into smaller aromatic compounds. These volatile
compounds will then further condenses into larger sheets along pyrolysis (Preston and
Schmidt, 2006). The difference patterns in the sUVa measured aromatics for the biochars can
be explained by the degree of condensation of the biochars. The rice husk biochar contained
much less sUVa measured aromatics and because rice husk is regarded as less carbonized the
aromatic compounds would be less fixated able to leachate out. Yun et al. (2012) found as
well that the aromaticity of the DOM released from saw dust biochar declined with increasing
degree of carbonisation. The DOM release of 0.27 mg g-1 found for both the biochar in this
study, is within the range of release found in other studies of wood biochars, 0.04-0.93 mg g-1
(Yun et al., 2012), and grass and wood biochars, 0.46-8.62 mg g-1 (Mukherjee and
Zimmerman, 2013b).
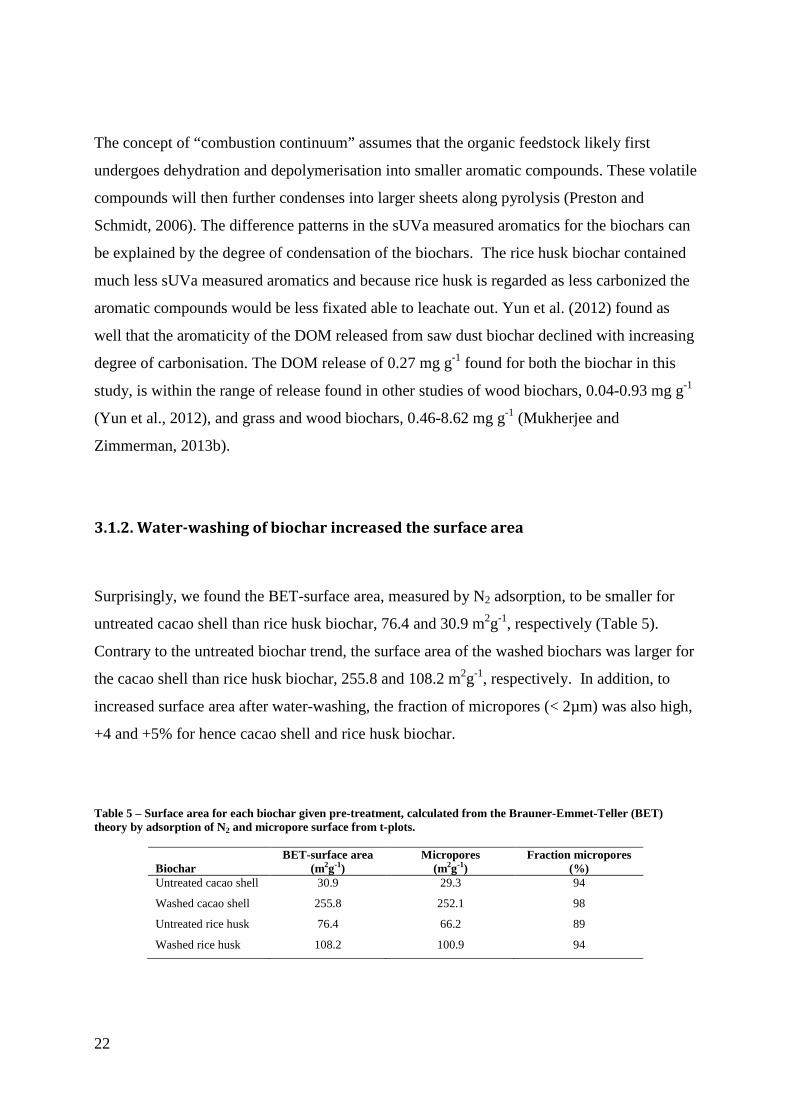
3.1.2. Water-washing of biochar increased the surface area
Surprisingly, we found the BET-surface area, measured by N2 adsorption, to be smaller for
untreated cacao shell than rice husk biochar, 76.4 and 30.9 m2g-1, respectively (Table 5).
Contrary to the untreated biochar trend, the surface area of the washed biochars was larger for
the cacao shell than rice husk biochar, 255.8 and 108.2 m2g-1, respectively. In addition, to
increased surface area after water-washing, the fraction of micropores (< 2µm) was also high,
+4 and +5% for hence cacao shell and rice husk biochar.
Table 5 – Surface area for each biochar given pre-treatment, calculated from the Brauner-Emmet-Teller (BET) theory by adsorption of N2 and micropore surface from t-plots.
Biochar BET-surface area
(m2g-1) Micropores
(m2g-1) Fraction micropores
(%) Untreated cacao shell 30.9 29.3 94
Washed cacao shell 255.8 252.1 98
Untreated rice husk 76.4 66.2 89
Washed rice husk 108.2 100.9 94

23
The surface area is expected to increase with the degree of carbonization (Keiluweit et al.,
2010), and was therefore incorrectly expect to be highest for the cacao shell biochar. A
previous study (Nguyen et al., 2004) have discussed the possibility that large aromatic C
molecules, such as polycyclic aromatic hydrocarbons (PAH), are able to clog micropores in
black C. This illustrates a possible mechanism for large aromatic C molecules to exclude
micropores from the available surface area. After water-washing potential clogging aromatic
C could have been removed revealing more of the micropores, observed as the increased
surface area after water-washing. Assuming DOM could clog micropores, the surface area of
washed biochar represents a more realistic figure for the surface area created in biochars
during pyrolysis. The larger surface area found for washed cacao shell is also as expected
from the assumption that this biochar is more carbonized than rice husk biochar.
During acid-washing the cumulative DOC release from biochar was minimal, <0.03 mg DOC
g-1 for both biochars (Appendix table 7). However, considerable amounts of Al and Fe were
exchanged and found in the leachate (Appendix table 7). A low pH will significantly reduce
the DOM solubility (Kalbitz et al., 2000) and exchange for acidic cations made available as
the base cations are lost (Brady and Nyle, 2004).
3.2. Biochar increases the concentration of dissolved organic matter in soil
The soil batch experiment shows effects of biochar in a mixture with soil, compared to soil
control batches, to enlighten the hypothesis: “Biochar increases the DOM concentration in
amended soils due to pH increase”.
3.2.1. Increase in pH causes a release of dissolved organic matter
Figure 7 illustrates the release of DOM by the interaction of the biochar with the soil, by
depicting the change in DOC concentration in the water extractants from before to after
mixing the biochar with the soil. The ‘before’ mixing, is the sum of DOC release measured in
the control batches of both soil and biochar. While the ‘after’ mixing concentration, is the

24
amount of DOC measured in the water extractant with the same amount of soil and biochar, as
for the control batches, mixed together. The control batch of acidic soil gave a low release of
2.4 mg L-1 DOC compared to 11 mg L-1 DOC released from the pH-neutral soil (control
batches of biochars see, appendix 6). After mixing with 10 wt% untreated cacao shell biochar,
the mixture of biochar and acidic soil gave the highest observed release of 69 mg L-1 DOC,
while the mixture with the same biochar and the pH-neutral soil released 30 mg L-1 DOC.
These mixtures of untreated cacao shell therefore show a biochar soil interaction of 64 and 16
mg L-1 increase DOC release for hence the acidic and pH-neutral soil (Figure 6).
Figure 7 – The change in DOC concentrations from before to after the mixing of soil and (a) cacaos shell or (b) rice husk biochar (DOC background; pH-neutral soil: 12 ± 2 mg C L-1 (pH 7.0) and acidic soil : 2.7 ± 0.1 mg C L-1 (pH 4.9).)
Overall the highest interactions between biochar and soil were found for untreated biochar,
where cacao shell gave a higher release than rice husk biochar (Figure 6). Even though lower,
the release of DOC from some mixtures of washed biochar and soil also gave a high release,
as seen for the DOC release of 27 mg L-1 in the mixture of washed cacao shell and acidic soil.
For the untreated and washed biochars the increase in pH from the soil pH, followed the same
trend as the release of DOM (Figure 6). For example the previously mentioned mixtures of
soil and untreated cacao shell biochar gave a pH increase of 3.8 from the pH of the acidic soil
and a pH increase of 1.7 from the pH of the pH-neutral soil.
(a) (b)
ΔDOC
"After" "Before"

25
Acid washed biochars gave the only observed reductions in DOC concentration after mixing
with the pH-neutral soil (Figure 6). These mixtures had a lower pH, than the pH of the pH-
neutral soil, likely reducing the DOM solubility. The acid cacao shell biochar gave a pH of
4.4 and reduced the DOC release by -5 mg L-1. Although, the decrease in DOM for the
mixtures with acid biochar, could also indicate sorption processes.
3.2.2. Increased dissolved organic matter charge density gives a higher solubility
Figure 7 compares the biochar soil interaction, effect on the pH and DOC concentration for
the different mixtures. Mixtures with an increased pH also show an increased release of DOM.
Vice versa, the only reductions in DOM are seen for mixtures with acid biochar, which also
gave a lowered pH. Cacao shell biochar gave the most extreme changes (Figure 7) and an
overall larger effect in most mixtures, than rice husk biochar (Figure 6). This representation
confirms the acidic soil higher DOM release than the pH-neutral soil, also seen for the
absolute values (Figure 6).
Figure 8 – The change in dissolved organic C (ΔDOC) concentration plotted against the change in pH from before to after the soil and biochar were mixed together; cacao shell biochar (triangles), rice husk biochar (circles), acidic soil (solid points) and pH-neutral soil (hallow points).

26
Cacao shell biochar higher acid neutralising capacity (Table 4) could explain the higher DOM
release in mixtures with soil, than for rice husk biochar. A high acid neutralising capacity
have been proven to raise soil pH in acidic soils (Martinsen et al., n.d.), similar to the acidic
soil used in this study. Elevation of the soil pH will both change sorption sites and the
solubility of DOM. This could also explain some of the higher release of DOM seen for the
acidic soil as the
Especially, the deprotonation of DOM increasing with pH, will have great influence on the
DOM solubility. Tipping and Woof (1990), conducting batch experiments with acidic organic
soils, showed that an increase in 0.5 pH units could give a 50% increased DOC concentration.
They verified their findings by applying Tipping & Hurly’s (1988) model estimating the
increased DOM charge density and then DOM solubility as pH increases. Increased DOC
release induced by biochar has also been found in another batch extraction study (Alling et al.,
n.d.). A total DOC releases, up to 35 mg L-1, were found at a pH above 7 in different mixtures
with seven tropical soils and biochar, at a biochar dosage up to 10 wt%, (Alling et al., n.d.).
However, the reductions in DOC release for mixtures with acid biochar (Figure 7) indicate
that biochar itself may potentially sorb DOM. A column leaching study showed a
predominantly reduction in DOC concentration, for mixtures of 1 wt% biochar and two
subtropical weathered soils (Mukherjee and Zimmerman, 2013b). The pH for the mixture of
soil and biochar were not addressed nor reported, excluding the possibility to evaluate the pH
significance. The authors (Mukherjee and Zimmerman, 2013b) suggest sorption of DOM by
biochar as a possible explanation for the trends. Biochars potential to sorb DOM has been
confirmed in sorption isotherm studies, indicating Kd values up to 2150 L kg-1 (Kasozi et al.,
2010). These high Kd-values found for wood and grass biochar indicate an abundant sorption
of DOM, whether these figures are valid for the biochar used in this study remains unknown.
This study indicates on the contrary a release of DOC that exceeds the sorption of DOM by
the untreated and washed biochars used, at a biochar dosage of 10 wt%.
Biodegradation could also potentially change the amount of DOM during the biochar and soil
batch experiment, but this is unlikely to give observable changes after only 72 hrs. Biochar

27
amendments have been shown to improve the microbial activity, but the response is typically
on the order of weeks to months (Zimmerman et al., 2011). Therefore only a low degradation
can be expected from the indigenous inoculum in the soil, which as well will have a low
response the first days (Kalbitz et al., 2000).
3.2.3. Biochar could potentially change the charge of soil sorption sites
The charge of the DOM sorption sites in the acidic soil reverses more easily from positive to
negative, than the sites found in the pH-neutral soil. This mechanism could contribute to the
higher release of DOM shown in mixtures with biochar and acidic soil, than with the pH-
neutral soil. Complexation with negative sorption sites have been suggest to be the most
important binding of DOM in soil (Kaiser and Guggenberger, 2000). For a brown soil, such as
the pH-neutral soil in the study, charged sorption sites will be found on mineral surfaces in
addition to the negatively charged clay (Clarke et al., 2010). This is different from the acidic
soil where weathering have removed most of the clay fraction (van Wambeke, 1974), leaving
sorption sites predominantly on mineral surfaces.
Aluminum and iron oxides, that dominate in ferralsols, have isoelectric points from pH 5.0-
9.0 (Parks, 1965), which is below the pH for the acidic soil in this study. When biochar
amendments then increase the pH above an isoelectric point of an oxide, the charge of the
sorption site turns negative. The negative charged sorption site then releases the negatively
charged DOM. This mechanism was proven in a study of the B horizon of a podzol, high in
oxides such as ferralsols; elevation of the pH from 4.5 to 6.0 gave an 11 time increase in the
release of DOM, which was attributed to the reversion of the charge of mineral sorption sites
(Kennedy and Billett, 1996). There has also been shown an increased release of DOM after
biochar amendments in a previous laboratory study (Mukherjee and Zimmerman, 2013a), the
authors did not provide any explanation for the observation. The reversion of the charge of
sorption sites could potentially increase the release of DOM.

28
Dissolved organic matter could however, still be retained by a negative sorption site through
bridging of sorbed cations in the diffuse double layer in the solution (Schlautman and Morgan,
1994). This is possible as the negatively charged ligands of DOM counteracts the sorbed
cations positive charge, but this sorption mechanism is regarded as less pronounced than
surface complexation (Kaiser and Guggenberger, 2000). The exchange of acidic cations with
base cations released from biochars could further increase this retention in the diffuse double
layer.
3.2.4. The characterization was biased by a high iron concentrations
Most of the mixtures in the soil and biochar batch experiment, 33 out of 42 sample replicates,
had higher or close to the maximum tolerable concentration of Fe (Appendix 7) (further
details regarding maximum tolerable concentration of Fe, see materials and methods). This
gave an interference that excluded a proper characterisation of the DOM collected during the
soil and biochar batch experiment. The iron concentration influence on the sUVa parameter is
illustrated in figure 8. The sUVa and SAR (not shown see, appendix 7) parameters where
therefore regarded as uncontrolled biased and were therefore discarded. With the lack of
DOM characteristics parameters it was not possible to observe sorption patterns for the
aliphatic or the aromatic DOM in the soil batch experiment. Characterisation of DOM could
have potentially provided trends on the differences for the DOM released from the acidic and
pH-neutral soil, enlightening the possible mechanisms of desorption of DOM.

29
Figure 9 - The dissolved iron concentration influence on the sUVa parameter for the acidic (squares) and pH-neutral (diamonds) soil samples.
The high concentrations of Fe likely origins from biochars ash fraction of silicates and oxides,
accumulated in the biochar feedstock during plant growth (Epstein, 1994). Peculiarly, rice
plants have shown a Si content of more than 10 wt% (Epstein, 1994), illustrating the ability
for metal accumulation. In addition, the soils in the experiment are also potential sources for
colloidal oxides, especially the acidic ferralsol (Brady and Nyle, 2004). These oxides could
form suspended solids only few nanometers large (14 - 50nm) (Schlautman and Morgan,
1994), and are hence operationally defined as part of the dissolved fraction in this study and
not removed in prior to absorbency measurements. An acidification test of samples with high
concentration of Fe indicated the presences of colloids by the imidate appearance of a white
fog in the solution. This scattering is typical for colloidal clustering in emulsions also seen in
other similar colloids such as cow milk. However, whether this is due to colloidal iron or
DOM is unknown.
3.2.5. Implications
The batch experiment with soil and biochar illustrated biochars potential to release of DOM
from soil, especially seen in mixtures with the acidic soil. Assuming all the released DOM

30
due to the biochar soil interaction origins from the soil, the amount of DOM released can be
as high as 0.7 g kg-1 found in the mixture of untreated cacao shell biochar and the acidic soil.
This could partly explain the invariable soil organic C concentration seen in the field trial with
the acidic ferralsol, despite biochar amendments up to 15 ton ha-1 (further details see,
Introduction). The release of DOM induced by biochar could enable leaching of DOM
throughout the soil horizon.
Table 6 - The release, or sorption (negative values), of DOM from the two soils induced by the biochar soil interaction, assuming all released DOM origins from the soil.
Acidic soil pH-neutral soil
Biochar type DOC (g kg-1)
Cacao shell
Untreated 0.7 ± 0.1 0.2 ± 0.1
Washed 0.3 ± 0.1 0.00 ± 0.03
Acid -0.001 ± 0.002 -0.06 ± 0.03
Rice husk
Untreated 0.14 ± 0.03 0.06 ± 0.03
Washed 0.04 ± 0.02 0.03 ± 0.03
Acid 0.00 ± 0.01 -0.02 ± 0.03
The release of DOM from soils could also potentially increase the microbial activity in soils
amended with biochar. This is due to the fact that the availability of DOM often restricts the
microbial activity in soil. With the current knowledge, the response of microbes to biochar
amendments is still poorly understood with contradicting trends among for different studies
(Lehmann et al., 2011). The detection of changes of biochar for basic soil parameters, such as
DOC concentration, could help explaining secondary responses such as microbial activity.
3.3. Biochar changes the composition of dissolved organic matter
The RefDOM batch experiment compared the sorption of DOM from materials with different
composition to the biochars. Figure 9 shows the sorption coefficients (Kd) (Equation 2)

31
determined at a RefDOM DOC concentration of 10 mg L-1. The sorption coefficients reveal a
surprising repetitive trend for untreated and washed biochars higher sorption of aliphatic over
aromatic RefDOM. For the washed cacao shell biochar the Kd for the aliphatic RefDOM was
158 L kg-1, while only 34 L kg-1 for the aromatic RefDOM. The same trend was observed for
the untreated rice husk biochar, though lower, with a Kd for the aliphatic RefDOM of 53 L
kg-1 and a negative value of -10 L kg-1 for the aromatic RefDOM. The negative values most
likely only represents artefacts of the filtration method used in mixtures where very little or no
RefDOM was sorbed. The intermediate RefDOM show trends similar as the aromatic
RefDOM; as expected as this RefDOM are closer in chemical properties to the aromatic than
the aliphatic RefDOM (Table 3). The specific RefDOM sorption observed indicate that
biochar can change the DOM composition in solution.
Figure 10 - Sorption coefficients (Kd) for RefDOM when mixed with (a) cacao shell or (b) rice husk biochar.
The repetitive sorption trend found for untreated and washed biochar was unaffected by
differences in solution parameters for the mixtures. Untreated biochars gave solutions with a
higher electrical conductivity and cation concentration than the washed biochar. The untreated
cacao shell biochar also gave a higher pH than the washed, without any observed difference in
(a) (b)

32
sorption trends (Figure 9). E.g. the mixture of aliphatic RefDOM and untreated compare to
the washed cacao shell biochar had hence an electrical conductivity of 533 and 99 µS cm-1
(Appendix table 10) and pH of 9.5 and 7.2 (Figure 9).The similar sorption patterns for
untreated and washed biochar lead us to expect that there are intrinsic biochar properties
governing the RefDOM sorption observed, and not solution parameters, for these mixtures.
Acid biochar gave a low pH, and a different RefDOM sorption trend than observed for
untreated and washed biochar. A low pH is known to reduce the solubility of DOM and
therefore increase the sorption. The sorption trends of RefDOM in mixtures with acid biochar
are therefore expected to be influenced by pH in addition to intrinsic biochar parameters.
There is one study (Kasozi et al., 2010) that has previously focused on the sorption of DOM
by biochar. The Kd-values for DOM sorption in their study ranges from 92-2150 L kg-1, in
experiments with a very small aromatic DOM molecule, catechol, sorption to wood and grass
biochar. A comparison of Kd-values is difficult as the biochar, DOM and solutions
concentrations differ. Other previous studies concerning sorption of DOM by biochar has
focused on sorption of pollutants and pesticides, instead of DOM per se. Results from these
studies focuses on DOC concentration 103 to 106 lower than found in our experiments (Graber
et al., 2011; Hale et al., 2012; Qiu et al., 2009), which makes it impossible to compare the Kd-
values.
3.3.1. Differences in the sorption of RefDOM between the two biochars
Although the affinity for RefDOM follows the same trends for both biochars, the cacao shell
biochar gave overall higher Kd-values than rice husk biochar. Some of the mixtures of
RefDOM and untreated and washed rice husk biochar even had Kd-values close to zero,
which practically excludes any sorption of DOM. Previous experiments with Al and Fe oxides
and hydroxides, have shown that the adsorption of DOM was highly affected by the surface
charge, as well as the surface area (Kaiser and Guggenberger, 2000). The sorption of organic
matter to charged functional groups of biochar has been observed in field analyses of aged

33
biochar (Liang et al., 2006). This described trend can be seen for the two biochars sorption of
RefDOM as charge density and sorption is higher for the cacao shell than the rice husk
biochar. Rice husk has a large surface area of 76.4 compared to 30.9 m2g-1 for cacao shell
biochar (Table 4). However, the lower potential CEC of 26 cmolc kg-1 for rice husk compared
to 37 cmolc kg-1 for cacao shell biochar gives a lower charge density.
Sorption increased with washing giving higher Kd-values for washed than untreated biochar
and the highest values for the acid biochar.
The increased sorption of RefDOM of washed compared to untreated biochar, follows the
same trends as the increase in surface area after washing (Table 4). Cacao shell biochar had an
increased sorption after water-washing, and also an 8.5 times larger surface area. On the
contrary, the rice husk biochar had no increase in sorption, but then only a 1.4 times increased
surface area after water washing.
3.3.2. Changes in DOM characteristics
The analyses of the DOM characteristics following sorption indicates the same trend of higher
sorption of aliphatic over aromatic DOM, as also found for the Kd-values of the RefDOM
(Figure 9). After sorption taking place by untreated and washed biochar, the remaining
RefDOM in solution either had the same or higher aromatic DOM fraction (Figure 10). A
higher sorption of aliphatic compared to aromatic DOM could explain this observed shift in
DOM characteristics. Untreated biochar mixed with the aliphatic RefDOM gave the highest
shift in sUVa for both biochars of 1.21 and 0.38 sUVa units for hence the cacao shell and rice
husk biochar.

34
Figure 11 – The specific UV absorbency (sUVa) illustrates the shift in the aromatic DOM fraction in mixtures of RefDOM with (a) cacao shell or (b) rice husk biochar from before sorption estimates.
An alternative hypothesis to the higher sorption of aliphatic DOM, could be a higher release
of aromatic DOM from biochar when it is mixed with RefDOM (samples) than when mixed
with water (control batches). To be written: (Liang et al., 2006) highly oxidized OM sorbed to
biochar.
Inorganic ligands, such as sulphate, could potentially compete for binding sites with DOM at
high concentrations (0.002 M) (Tipping, 1981). However, the amount of inorganic ligands is
very low in the RefDOM; phosphate < 0.03, sulphate < 134 µM (Gundersen, 2012). This
implies that the RefDOM solution does not than what is necessary to give an exchange of
DOM. The sorption of sulphate is also weaker for sulphate than DOM reducing the
competition (Tipping, 1981).
Biodegradation could be another potential confounding factor for the trends in DOM
characteristics, although previous studies on the RefDOM show an overall recalcitrance
(Gundersen, 2012; Vogt et al., 2004). Aliphatic DOM biodegrades more easily than the
aromatic DOM, this difference has also been documented for the RefDOM (Table 3).
(a) (b)

35
Biodegradation during the batch experiment would then give an increased aromatic DOM
fraction, by a higher degradation of the aliphatic fraction. In this study this factor can be ruled
out: The control batches for the three RefDOMs experienced only a very small and similar
change in DOC concentration (0.6-0.7 mg C L-1) after equilibration and filtration.
Biodegradation cannot explain the trends in DOM characteristics.
Increased cation concentration by biochar could enable DOM retention in the diffuse double
layer (Tipping, 1981). Biochar is high in base cations overall, but only the cacao shell biochar
gave an observable increase in Ca2+ and Mg2+ (Appendix table 10), which are important
cations for the diffuse double layer. The effects of base cations released from biochar should
though not bias the DOM characteristics, as the source for the base cations is the biochar itself.
This implies that there will be a very small difference in cation concentration between control
batches and mixtures (Appendix table 10). Nevertheless, it is likely that the base cations
introduced with biochar increases the sorption of RefDOM. However, this effect would be the
same for all RefDOM mixtures and could hence not explain the sorption trends observed.
The acid biochar gave a loss of aromatic DOM during sorption from the solution (Figure 10).
All these mixtures with acid-biochar had a low pH (<4.1). The solubility of aromatic DOM
explains this trend as low pH decreases the solubility and then facilitates sorption. Our
confirmation of this well-known mechanism, confirms the validity of the method used.
3.3.3. Potential size exclusion in micropores
Aromatic DOM, found in the RefDOM, has a larger diameter than micropores found in
biochars. As aromatic DOM is a continuum of different molecules the precise hydrodynamic
radii distribution is unknown, but estimates of the mean diameter for the RefDOM used in this
study ranges from 3.76 to 5.02 nm (Table 3). The large aromatic DOM enables a size
exclusion effect; large parts of the biochar micropore surface area, with a diameter below 2nm,
are inaccessible for aromatic DOM (Figure 11). A size exclusion mechanism is already
documented for polycyclic aromatic hydrocarbons (PAH) sorption to black C (Pignatello et al.,

36
2006). When additional DOM was introduced to the sorption experiment, larger PAH-
molecules sorption was suppressed to a higher degree than smaller PAH. This observation
was attributed to the blockage of micropores by DOM-molecules only enabling very small
PAH to pass.
Figure 12 – Simplified conceptual model: Large aromatic DOM (red) could clog biochars micropores, while small aliphatic DOM (blue) could absorb into them.
Both the Kd-values and the changes in DOM characteristics indicated a higher sorption of
aliphatic DOM, which could be rationalised by a size exclusion effect. The Kd-values further
correlates strongly with the changes in relative amount of aromatic DOM (ΔsUVa) during
sorption, for the untreated and the washed biochars (Figure 12). The linear variation of Kd
could to a large extent (R2 of 0.89) be explained by the change in sUVa in addition to the pre-
treatment given for the untreated or washed biochar (Equation 3; residual plots, Appendix 5).
This linear model was independent of solution parrameters, such as electrical conductivity and
pH. Acid biochar mixtures lacked a significant correlation for the Kd and change in sUVa
during sorption (p>0.5) and were therefore excluded from the model.

37
Figure 13 – The sorption coefficients shows a linear relation with the change in the aromatic DOM fraction, dependent on the biochar pre-treatment; untreated or washed biochar. The linear relation is independent of biochar type; cacao shell (circles) and rice husk biochar (triangles). No significant correlation was found for acid biochar.
Equation 3 - Linear model predicting the Kd given the change in sUVa during sorption and the pre-treatment of the biochar; β0, intercept; β1, increase per change in sUVa (numerical variable); β2, increase if washed biochar (categorical variable); β3, increase per change in sUVa if washed biochar (numerical variable) and ε, residual (error).
𝑦𝑖 = 𝛽0 + 𝛽1𝑥∆𝑠𝑈𝑉𝑎,𝑖 + 𝛽2𝑥𝑝𝑟𝑒−𝑡𝑟𝑒𝑎𝑡,𝑖 + 𝛽0𝑥∆𝑠𝑈𝑉𝑎,𝑖𝑥𝑝𝑟𝑒−𝑡𝑟𝑒𝑎𝑡,𝑖 + 𝜀𝑖
𝑦𝑖 = −18 + 136𝑥∆𝑠𝑈𝑉𝑎,𝑖 − 19𝑥𝑝𝑟𝑒−𝑡𝑟𝑒𝑎𝑡,𝑖 + 179𝑥∆𝑠𝑈𝑉𝑎,𝑖𝑥𝑝𝑟𝑒−𝑡𝑟𝑒𝑎𝑡,𝑖 + 𝜀𝑖
The linear regression (Equation 3) also showed that there is a significant interaction (p<0.02)
between the biochar induced change in sUVa during sorption and the pre-treatment given.
The interpretation of this interaction states: The washed biochar gives a greater change in the
sUVa than the untreated biochar during sorption of the same amount of DOM. During water-
washing the fraction of microporosity of washed compared to untreated biochar, has been
shown to increase +4 and +5%, for hence cacao shell and rice husk biochar (Table 4). The
increase in microporosity enables a higher size exclusion effect which could give the more
selective sorption of aliphatic DOM observed for washed than untreated biochar.
y = 315x - 38
y = 136x - 18

38
The size of the aromatic DOM found in solution after sorption are larger molecules, a lower
SAR parameter, in mixtures with cacao shell than for rice husk biochar (Figure 13). As the
pores of biochar will vary it is likely that it is the largest aromatic DOM that can access the
fewest sorption sites and hence will remain in solution. The largest aromatic DOM can
therefore be expected where the largest size exclusion takes place in the mixtures of cacao
shell biochar. Although this cannot fully explain the trend as the largest difference should be
seen for the washed biochar, which this is not the case.
Figure 14 - Spesific absorbency ratio (SAR) describing the size distribution of aromatic DOM for the mixtures of RefDOM and (a) cacao shell and (b) rice husk biochar.
The sorption of acid biochar gives very small aromatic DOM left in the solution, high SAR-
values (Figure 13). Large aromatic DOM solubility is expected to reduce more in solubility
due to pH changes as they likely have lower charge density than smaller aromatic DOM. The
size distribution of aromatic DOM confirms a large pH effect for the acid biochar mixtures.
3.3.4. Implications
(a) (b)

39
The selective sorption of aliphatic DOM indicated by the RefDOM batch experiment
confirms biochar ability to sorb DOM.
The selective sorption of aliphatic DOM indicated by the RefDOM batch experiment could
change the bioavailability of DOM in amended soils.

40
4. Conclusion
DOM release
Basic idea: to sum up the findings in the model presented in the introduction, as seen in the
coarse sketch below.
Expr1: Biochar could increases flux of organic matter out of the soil ecosystem by its
alkalinity effect.
Expr2: Biochar could change the bioavailability of DOM. This can also have implications for
nitrification and hence nitrous oxide emissions.
Analysis of the DOC released from biochars in this study, indicates that rice husk gives a
more aromatic DOC than cacao shell biochar. The released DOM will therefore probably vary
in biodegradability and effect on the soil microbes.
Analyses of the surface of the biochars revealed a potential clogging of micropores by
aromatic DOC. After amending the biochar in the field some of the surface area could
therefore be easily lost.

41

42
5. Future outlook
The results from this laboratory studies cannot be extrapolated to field results as the biochar
dose in these experiments is far higher than what is applicable in the field. This study simply
identifies possible mechanism biochar could change the DOC concentration and DOM
composition. A naturally follow-up of this study would be similar laboratory experiments
using a different approach to confirm the trends. Fractionation of DOM to confirm the
selective sorption of aliphatic DOM, could be done by high performance organic C detection
chromatography or parallel factor analysis of fluorescence matrices. And of course the final
step would be the confirmation of the laboratory findings in field trials.

43
6. References
Alling, V., Sarah, H., Martinsen, V., Mulder, J., Smebye, A., Breedveld, G., Cornelissen, G., n.d. The role of biochar in retaining nutrients in amended tropical soils. J. Plant Nutr. Soil Sci. in press.
Bai, M., Wilske, B., Buegger, F., Esperschütz, J., Kammann, C.I., Eckhardt, C., Koestler, M., Kraft, P., Bach, M., Frede, H.-G., Breuer, L., 2013. Degradation kinetics of biochar from pyrolysis and hydrothermal carbonization in temperate soils. Plant Soil 372, 375–387. doi:10.1007/s11104-013-1745-6
Baldock, J.A., Smernik, R.J., 2002. Chemical composition and bioavailability of thermally altered Pinus resinosa (Red pine) wood. Org. Geochem. 33, 1093–1109. doi:10.1016/S0146-6380(02)00062-1
Barceló, J., Poschenrieder, C., Vázquez, M.D., Gunsé, B., 1995. Aluminium phytotoxicity. Fertil. Res. 43, 217–223. doi:10.1007/bf00747705
Brady, N.C., Nyle, C., 2004. Elemenst of the nature and properties of soils, 2nd ed. Pearson Education, New Jersey.
Brandli, R.C., Bergsli, A., Ghosh, U., Hartnik, T., Breedveld, G.D., Cornelissen, G., 2009. Quantification of activated carbon contents in soils and sediments using chemothermal and wet oxidation methods. Environ. Pollut. 157, 3465–3470. doi:10.1016/j.envpol.2009.06.015
Brunauer, S., Emmett, P., Teller, E., 1938. Adsorption of gases in multimolecular layers. J. Am. … 407.
Cayuela, M.L., van Zwieten, L., Singh, B.P., Jeffery, S., Roig, a., Sánchez-Monedero, M. a., 2013. Biochar’s role in mitigating soil nitrous oxide emissions: A review and meta-analysis. Agric. Ecosyst. Environ. doi:10.1016/j.agee.2013.10.009
Chan, K.Y., Xu, Z., 2006. Biochar: Nutrient Properties and Their Enhancement, in: Lehmann, J., Joseph, S. (Eds.), Biochar for Envirnomental Mangament: Science and Technology. Earthscan, New York, pp. 67–84.
Cheng, C.H., Lehmann, J., Engelhard, M.H., 2008. Natural oxidation of black carbon in soils: Changes in molecular form and surface charge along a climosequence. Geochim. Cosmochim. Acta 72, 1598–1610. doi:10.1016/j.gca.2008.01.010
Chintala, R., Mollinedo, J., Schumacher, T.E., Malo, D.D., Julson, J.L., 2014. Effect of biochar on chemical properties of acidic soil. Arch. Agron. Soil Sci. 60, 393–404. doi:10.1080/03650340.2013.789870
Clarke, B.O., Porter, N.A., Symons, R.K., Marriott, P.J., Stevenson, G.J., Blackbeard, J.R., 2010. Investigating the distribution of polybrominated diphenyl ethers through an Australian wastewater treatment plant. Sci. Total Environ. 408, 1604–1611. doi:10.1016/j.scitotenv.2009.11.059
Cornelissen, G., Martinsen, V., Shitumbanuma, V., Alling, V., Breedveld, G., Rutherford, D., Sparrevik, M., Hale, S., Obia, A., Mulder, J., 2013. Biochar Effect on Maize Yield and Soil Characteristics in Five Conservation Farming Sites in Zambia. Agronomy 3, 256–274. doi:10.3390/agronomy3020256

44
Cruz, R.V., Harasawa, H., Lal, M., Wu, S., Anokhin, Y., Punsalmaa, B., Honda, Y., Jafari, M., Li, C., Ninh, N.H., 2007. Chapter 10 - Asia, in: Climate Change 2007: Working Group III: Mitigation of Climate Change. pp. 469–506.
De Boer, J.H., Lippens, B.C., Linsen, B.G., Broekhoff, J.C.P., van den Heuvel, A., Osinga, T.J., 1966. Thet-curve of multimolecular N2-adsorption. J. Colloid Interface Sci. doi:10.1016/0095-8522(66)90006-7
Enders, A., Hanley, K., Whitman, T., Joseph, S., Lehmann, J., 2012. Characterization of biochars to evaluate recalcitrance and agronomic performance. Bioresour. Technol. 114, 644–653. doi:10.1016/j.biortech.2012.03.022
Epstein, E., 1994. The anomaly of silicon in plant biology. Proc. Natl. Acad. … 91, 11–17.
FAO, IFAD, WFP, 2012. The State of Food Insecurity in the World 2012. Economic growth is necessary but not sufcient to accelerate reduction of hunger and malnutrition, Food and argiculture organization of the united nations. FAO, Rome.
Glaser, B., 2007. Prehistorically modified soils of central Amazonia: a model for sustainable agriculture in the twenty-first century. Philos. Trans. R. Soc. B Biol. Sci. 362, 187–196.
Glaser, B., Birk, J.J., 2012. State of the scientific knowledge on properties and genesis of Anthropogenic Dark Earths in Central Amazonia (terra preta de Índio). Geochim. Cosmochim. Acta 82, 39–51. doi:10.1016/j.gca.2010.11.029
Glaser, B., Haumaier, L., Guggenberger, G., Zech, W., 2014. The “Terra Preta” phenomenon: a model for sustainable agriculture in the humid tropics. Naturwissenschaften 88, 37–41. doi:10.1007/s001140000193
Glaser, B., Lehmann, J., Zech, W., 2002. Ameliorating physical and chemical properties of highly weathered soils in the tropics with charcoal - a review. Biol. Fertil. Soils 35, 219–230. doi:10.1007/s00374-002-0466-4
Graber, E.R., Tsechansky, L., Gerstl, Z., Lew, B., 2011. High surface area biochar negatively impacts herbicide efficacy. Plant Soil 353, 95–106. doi:10.1007/s11104-011-1012-7
Gundersen, C.B., 2012. Biodegradation and characterization of dissolved organic matter (DOM) along the flowpath of a N-saturated subtropical forested catchment in China. C.B. Gundersen, Oslo.
Guo, Y., Rockstraw, D. a., 2007. Activated carbons prepared from rice hull by one-step phosphoric acid activation. Microporous Mesoporous Mater. 100, 12–19. doi:10.1016/j.micromeso.2006.10.006
Hale, S., Lehmann, J., Rutherford, D., Zimmerman, A.R., Bachmann, R.T., Shitumbanuma, V., O’Toole, A., Sundqvist, K.L., Arp, H.P.H., Cornelissen, G., 2012. Quantifying the Total and Bioavailable Polycyclic Aromatic Hydrocarbons and Dioxins in Biochars. Environ. Sci. Technol. 46, 2830. doi:dx.doi.org/10.1021/es203984k
Hale, S.E., Alling, V., Martinsen, V., Mulder, J., Breedveld, G.D., Cornelissen, G., 2013a. The sorption and desorption of phosphate-P, ammonium-N and nitrate-N in cacao shell and corn cob biochars. Chemosphere 91, 1612–9. doi:10.1016/j.chemosphere.2012.12.057

45
Hale, S.E., Jensen, J., Jakob, L., Oleszczuk, P., Hartnik, T., Henriksen, T., Okkenhaug, G., Martinsen, V., Cornelissen, G., 2013b. Short-term effect of the soil amendments activated carbon, biochar, and ferric oxyhydroxide on bacteria and invertebrates. Environ. Sci. Technol. 47, 8674–83. doi:10.1021/es400917g
IPCC, 2007. Climate Change 2007: Synthesis Report. Contribution of Working Groups I, II and III to the Fourth Assessment Report of the Intergovernmental Panel on Climate Change [Core Writing Team, Pachauri, R.K and Reisinger, A. (eds.)]. IPCC, Geneva, Switzerland.
IUPAC (International Union of Pure and Applied Chemistry), 1997. Compendium of Chemical Terminology (the “Gold Book”), 2nd ed. ed. Blackwell Scientific Publications, Oxford. doi:10.1351/goldbook
Jones, D.L., Murphy, D. V., Khalid, M., Ahmad, W., Edwards-Jones, G., DeLuca, T.H., 2011. Short-term biochar-induced increase in soil CO2 release is both biotically and abiotically mediated. Soil Biol. Biochem. 43, 1723–1731. doi:10.1016/j.soilbio.2011.04.018
Kaiser, K., Guggenberger, G., 2000. The role of DOM sorption to mineral surfaces in the preservation of organic matter in soils. Org. Geochem. 31, 711–725. doi:10.1016/S0146-6380(00)00046-2
Kalbitz, K., Solinger, S., Park, J.H., Michalzik, B., Matzner, E., 2000. Control on the dynamics of the dissolved organic matter in soil: a review. Soil Sci. 165, 277–304.
Kasozi, G.N., Zimmerman, A.R., Nkedi-Kizza, P., Gao, B., 2010. Catechol and humic acid sorption onto a range of laboratory-produced black carbons (biochars). Environ. Sci. Technol. 44, 6189–95. doi:10.1021/es1014423
Keiluweit, M., Nico, P.S., Johnson, M.G., Kleber, M., 2010. Dynamic molecular structure of plant biomass-derived black carbon (biochar). Environ. Sci. Technol. 44, 1247–53. doi:10.1021/es9031419
Kennedy, J., Billett, M., 1996. Organic matter retention in an upland humic podzol; the effects of pH and solute type. Eur. J. … 615–625.
Kuzyakov, Y., Subbotina, I., Chen, H., Bogomolova, I., Xu, X., 2009. Black carbon decomposition and incorporation into soil microbial biomass estimated by 14C labeling. Soil Biol. Biochem. 41, 210–219. doi:10.1016/j.soilbio.2008.10.016
Lackner, K.S., 2003. Climate change. A guide to CO2 sequestration. Science (80-. ). 300, 1677–8. doi:10.1126/science.1079033
Lehmann, J., 2007. A handful of carbon. Nat. (London, U. K.) 447, 143–144. doi:10.1038/447143a
Lehmann, J., Pereira da Silva, J., Steiner, C., Nehls, T., Zech, W., Glaser, B., 2003. Nutrient availability and leaching in an archaeological Anthrosol and a Ferralsol of the Central Amazon basin: fertilizer, manure and charcoal amendments. Plant Soil 249, 343–357. doi:10.1023/a:1022833116184
Lehmann, J., Rillig, M.C., Thies, J., Masiello, C. a., Hockaday, W.C., Crowley, D., 2011. Biochar effects on soil biota – A review. Soil Biol. Biochem. 43, 1812–1836. doi:10.1016/j.soilbio.2011.04.022

46
Liang, B., Lehmann, J., Sohi, S.P., Thies, J.E., O’Neill, B., Trujillo, L., Gaunt, J., Solomon, D., Grossman, J., Neves, E.G., Luizão, F.J., 2010. Black carbon affects the cycling of non-black carbon in soil. Org. Geochem. 41, 206–213. doi:10.1016/j.orggeochem.2009.09.007
Liang, B., Lehmann, J., Solomon, D., Kinyangi, J., Grossman, J., O’Neill, B., Skjemstad, J.O., Thies, J., Luizão, F.J., Petersen, J., Neves, E.G., 2006. Black Carbon Increases Cation Exchange Capacity in Soils. Soil Sci. Soc. Am. J. 70, 1719. doi:10.2136/sssaj2005.0383
Marschner, B., Kalbitz, K., 2003. Controls of bioavailability and biodegradability of dissolved organic matter in soils. Geoderma 113, 211–235. doi:10.1016/s0016-7061(02)00362-2
Marschner, B., Noble, A.D., 2000. Chemical and biological processes leading to the neutralisation of acidity in soil incubated with litter materials. Soil Biol. Biochem. 32, 805–813. doi:10.1016/S0038-0717(99)00209-6
Martinsen, V., Alling, V., Nurida, N.L., Mulder, J., Hale, S., Ritz, C., Rutherford, D., Heikens, A., Breedveld, G.D., Cornelissen, G., n.d. Plant and Soil pH effects of the addition of three biochars to acidic Indonesian mineral soils.
Miller, J.N., Miller, J.C., 2005. Statistics and Chemometrics for Analytical Chemistry Statistics and Chemometrics, 5th ed.
Mukherjee, A., Zimmerman, A.R., 2013a. Organic carbon and nutrient release from a range of laboratory-produced biochars and biochar-soil mixtures. Geoderma 193-194, 122–130. doi:10.1016/j.geoderma.2012.10.002
Mukherjee, A., Zimmerman, A.R., 2013b. Organic carbon and nutrient release from a range of laboratory-produced biochars and biochar–soil mixtures. Geoderma 193–194, 122–130. doi:http://dx.doi.org/10.1016/j.geoderma.2012.10.002
Nguyen, T.H., Brown, R. a, Ball, W.P., 2004. An evaluation of thermal resistance as a measure of black carbon content in diesel soot, wood char, and sediment. Org. Geochem. 35, 217–234. doi:10.1016/j.orggeochem.2003.09.005
Parks, G.A., 1965. The isoelectric points of solid oxides, solid hydroxides, and aqueous hydroxo complex systems. Chem. Rev.
Pavia, D.L., 2009. Introduction to spectroscopy. Thomson Brooks/Cole.
Perdue, E.M., Ritchie, J.D., 2003. 5.10 - Dissolved Organic Matter in Freshwaters, in: Editors-in-Chief: Heinrich, D.H., Karl, K.T. (Eds.), Treatise on Geochemistry. Pergamon, Oxford, pp. 273–318. doi:10.1016/b0-08-043751-6/05080-5
Pignatello, J.J., Kwon, S., Lu, Y., 2006. Effect of natural organic substances on the surface and adsorptive properties of environmental black carbon (char): attenuation of surface activity by humic and fulvic acids. Environ. Sci. Technol. 40, 7757–63.
Preston, C.M., Schmidt, M.W.I., 2006. Black (pyrogenic) carbon: a synthesis of current knowledge and uncertainties with special consideration of boreal regions. Biogeosciences 3, 397–420. doi:10.5194/bg-3-397-2006

47
Qiu, Y., Xiao, X., Cheng, H., Zhou, Z., Sheng, G.D., 2009. Influence of environmental factors on pesticide adsorption by black carbon: pH and model dissolved organic matter. Environ. Sci. Technol. 43, 4973–8.
R core team, 2013. R: A language and environment for statistical computing. R Foundation for Statistical Computing, Vienna, Austria.
Ranke, J., 2013. chemCal: Calibration functions for analytical chemistry. R package version 0.1-29.
Schlautman, M. a, Morgan, J.J., 1993. Effects of aqueous chemistry on the binding of polycyclic aromatic hydrocarbons by dissolved humic materials. Environ. Sci. Technol. 27, 961–969. doi:10.1021/es00051a028
Schlautman, M. a., Morgan, J.J., 1994. Adsorption of aquatic humic substances on colloidal-size aluminum oxide particles: Influence of solution chemistry. Geochim. Cosmochim. Acta 58, 4293–4303. doi:10.1016/0016-7037(94)90334-4
Shen, Y., Zhao, P., Shao, Q., 2014. Porous silica and carbon derived materials from rice husk pyrolysis char. Microporous Mesoporous Mater. 188, 46–76. doi:10.1016/j.micromeso.2014.01.005
Spokas, K., 2010. Review of the stability of biochar in soils: predictability of O:C molar ratios. Carbon Manag. 1, 289.
Tipping, E., 1981. The adsorption of aquatic humic substances by iron oxides. Geochim. Cosmochim. Acta 45.
Tipping, E., Hurley, M., 1988. A model of solid-solution interactions in acid organic soils, based on the complexation properties of humic substances. J. Soil Sci. 505–519.
Tipping, E., Woof, C., 1990. Humic substances in acid organic soils: modelling their release to the soil solution in terms of humic charge. J. Soil Sci. 573–586.
Traina, S.J., Novak, J., Smeck, N.E., 1990. An Ultraviolet Absorbance Method of Estimating the Percent Aromatic Carbon Content of Humic Acids. J. Environ. Qual. 19, 151–153.
UN, 2013. The Millennium Development Goals Report 2013. United Nations, New York.
Van Wambeke, A., 1974. Management properties of ferralsols. FAO soils Bull. 23.
Venables, W.N., Ripley, B.D., 2002. Modern Applied Statistics with S. Fourth Edition. Springer, New York.
Vogt, R.D., Akkanen, J., Andersen, D.O., Bruggemann, R., Chatterjee, B., Gjessing, E., Kukkonen, J.V.K., Larsen, H.E., Luster, J., Paul, A., Pflugmacher, S., Starr, M., Steinberg, C.E.W., Schmitt-Kopplin, P., Zsolnay, A., 2004. Key site variables governing the functional characteristics of Dissolved Natural Organic Matter (DNOM) in Nordic forested catchments. Aquat. Sci. 66, 195–210. doi:10.1007/s00027-004-0710-0
Weishaar, J.L., Aiken, G.R., Bergamaschi, B. a, Fram, M.S., Fujii, R., Mopper, K., 2003. Evaluation of specific ultraviolet absorbance as an indicator of the chemical composition and reactivity of dissolved organic carbon. Environ. Sci. Technol. 37, 4702–8.

48
Yamato, M., Okimori, Y., Wibowo, I.F., Anshori, S., Ogawa, M., 2006. Effects of the application of charred bark of Acacia mangium on the yield of maize, cowpea and peanut, and soil chemical properties in South Sumatra, Indonesia. Soil Sci. Plant Nutr. 52, 489–495. doi:10.1111/j.1747-0765.2006.00065.x
Yuan, J.H., Xu, R.K., 2011. The amelioration effects of low temperature biochar generated from nine crop residues on an acidic Ultisol. Soil Use Manag. 27, 110–115. doi:10.1111/j.1475-2743.2010.00317.x
Yun, L., Paul, M., Stephen, J., Rita, H., Artur, Z., 2012. Water extractable organic carbon in untreated and chemical treated biochars. Chemosphere 87, 151.
Zimmerman, A.R., Gao, B., Ahn, M.-Y., 2011. Positive and negative carbon mineralization priming effects among a variety of biochar-amended soils. Soil Biol. Biochem. 43, 1169–1179. doi:10.1016/j.soilbio.2011.02.005

1
Appendix 1: Illustration of the experimental design
The experimental design for all mixtures and control batches of biochar, soil and RefDOMs
used in the batch experiments can be found in appendix figure 1.
Appendix figure 1 – Illustration of the experimental design for the batch extraction experiments.

2
Appendix 2: Additional analysis details
The Limit of Detection (LOD) for all analysis was defined as the concentration equal to the
blank concentration (cB), taken from the calibration with the highest estimate if multiple
calibrations were performed, plus three standard deviation for the blank (sB) (Equation 4).
This definition is in accordance with the general IUPAC definition (IUPAC, 1997) and gives
a conservative estimate, worst-case-scenario, that reduces the risk of falsely detecting an
absent analyte (type one error).
Equation 4 - Definition of Limit of Detection (cB, concentration of blank; sB, standard deviation for blank):
𝐿𝑖𝑚𝑖𝑡 𝑜𝑓 𝑑𝑒𝑡𝑒𝑐𝑡𝑖𝑜𝑛 = 𝑐𝐵 + 3𝑠𝐵
Appendix figure 2 - Illustration of the approach to estimate the limit of detection (LOD); (cB, concentration of blank; sB, standard deviation for blank)
The cations of Al, Ca, Fe, K, Mg, Mn and Na were determined with a Vista inductive coupled plasma optical emission spectrometer (Varian, Palo Alto, USA) with axial viewing. The instrument was operated with the instrumental settings listed in appendix table 1. The standards used are listed in
appendix table 2. The LOD for the different elements are listed in appendix table 3. The
method was validated by comparison of analysis results with the soil laboratory at the

3
Norwegian University of Life Sciences. This validation was performed by a determination of
K concentrations in water leachate from the water-washing of rice husk and cacao shell
biochar. The results of this simplified inter-calibration showed only minor fluctuations ().
Appendix table 1 – Experimental settings applied for the inductive coupled plasma optical emission spectroscopy analysis.
Parameter Value
RF power (kW) 1.1
Plasma Argon flow (L min-1) 15
Auxiliary Argon flow (L min-1) 1.5
Nebulizer Argon flow (L min-1) 0.75
Sample flow rate (L min-1) 1
Reading time (s) 1
Number of replicates 3
Reading per replicate 3
Appendix table 2 - Standards prepared for the cation determination by inductive coupled plasma optical emission spectroscopy.
Na K Ca Mg Al Fe Mn
Element mg L-1 Stnd1 0.96 0.96 0.96 0.96 0.096 0.096 0.048
Stnd2 2.4 2.4 2.4 2.4 0.24 0.24 0.12
Stnd3 6 6 6 6 0.6 0.6 0.3
Stnd4 12 12 12 12 1.2 1.2 0.6
Stnd5 20 20 20 20 2 2 1
Stnd6 40 40 40 40 4 4 2
Stnd7 64 64 64 64 6.4 6.4 3.2
Appendix table 3 – Limit of detection for major cations and trace element determination by inductive coupled plasma optical emission spectroscopy.
Element Wavelength (nm)
Limit of detection (mg/L)
Al 237.312 0.07
Ca 422.673 0.3
Fe 238.204 0.06
K 766.491 0.4

4
Mg 285.213 0.4
Mn 257.610 0.03
Na 589.592 0.5
Appendix table 4 – Results from the comparison of K determination of two similar samples analysed in this study and also at the soil laboratory at the Norwegian University of Life Sciences (Addition data from personal communication with Alfred Obia, NMBU).
Sample This study NMBU
Water leachate of cacao shell 64.47 60.07
Acid leachate of cacao shell 8.53 8.75
Water leachate of rice husk 3.14 5.49
Acid leachate of rice husk 4.04 2.70

5
Appendix 3: Surface area regressions and determination plots
Surface area of the biochars was measured by N2-adsorption at 77K (procedure, previously
described in material and methods). The apparent surface area was estimated from the
statistical monolayer capacities of N2 according to the BET-theory (Brunauer et al., 1938). A
linear regression for the linear range of the sorption isotherms (Appendix figure 3) gave the
data basis for the BET-surface area calculation (Appendix table 5). The regression parameters
to find the fraction micropores was calculated from two slope regressions in thickness plots (t-
plots) (de Boer et al., 1966). Pore volumes and average pore diameter was not calculated as
the desorption measurements failed.
Appendix table 5 – Regression parameters for the calculation of the BET-surface area calculated for the untreated and washed biochars in the study; Starting and end datum point for the linear regression; the linear regressions slope, intercept and correlation coefficient; volume of the adsorbed gas (Vm); BET-surface area and BET-constant (C).
Parameter Units
Untreated cacao shell
biochar
Washed cacao shell
biochar
Untreated rice husk biochar
Washed rice husk biochar
Starting point 2 2 8 2
End point 9 21 35 6
Slope 0.140 0.017 0.057 0.040
Intercept 5.97 ∗ 10-4 5.45 ∗ 10-5 2.79 ∗ 10-4 3.77 ∗ 10-4
Correlation coefficient 0.9999 0.9989 0.9998 0.9998
Vm (cm3 (N2) g-1) 7.1 58.8 17.5 24.9
C 235.8 309.99 204.3 1065.6
BET – surface area (m2 g-1) 30.9 255.8 76.4 108.2

6
Appendix figure 3 – BET plots showing the linear relation (black line) used to calculate the BET-surface area for (a) untreated cacao shell, (b) washed cacao shell, (c) untreated rice husk and (d) washed rice husk biochar.
(a) (b)
(c) (d)

7
Appendix table 6 - Regression parameters for the calculation of the fraction micropores found in the untreated and washed biochars in the study; Starting and end datum point for the linear regression; the linear regressions slope and intercept; surface area for total surface, surface excl. micropores and micropore surface; and fraction micropores.
Parameter Unit
Untreated cacao shell
biochar
Washed cacao shell
biochar
Untreated rice husk biochar
Washed rice husk biochar
Total surface
Starting point 0 0 0 0
End point 5 3 2 3
Slope 21.2 181.5 51.8 78.5
Intercept 0 0 0 0
Total surface (m2 g-1) 32.6 279.7 79.9 121.0 Surface excl. micropores
Starting point 16 26 13 18
End point 26 33 16 27
Slope 1.10 2.64 6.75 5.29
Intercept 7.87 70.05 17.63 29.14 Surface exclusive micropores
(m2 g-1) 1.7 4.1 10.4 8.2
Micropores (m2 g-1) 30.9 275.6 69.5 112.8 Fraction micropores (%) 95 99 87 93

8
Appendix figure 4 - Thickness plots showing the linear relations (black line) used to calculate the fraction micropores for (a) untreated cacao shell, (b) washed cacao shell, (c) untreated rice husk and (d) washed rice husk biochar.
(a) (b)
(c) (d)

9
Appendix 4: Grubbs-test for outliers
To check for outliers among measurement replicates a Grubbs-test was written, which rejects
at most one outlier per measurement, if the p-value < 0.05 (Appendix figure 5). The Grubbs
equation (Equation 5) gives a G-statistic for a suspected value which can be compared to
critical literature levels (Miller and Miller, 2005).
Equation 5 - Calculation of the G-statistic (G) in a Grubbs test for suspected outliers; suspected value (xsuspected value), mean (𝒙) and standard deviation (s)
𝐺 = 𝑥𝑠𝑢𝑠𝑝𝑒𝑐𝑡𝑒𝑑 𝑣𝑎𝑙𝑢𝑒 −
𝑠
Appendix figure 5 - Script written for the statistical software R to run Grubbs test for outliers based on the equations of Miller and Miller (2005).

10
Appendix 5: Residual plots for the linear regression
The residual plots for the linear regression confirm that the assumptions for the linear model
are satisfied. Homoscedasticity and randomly distribution for the fitted values plotted against
the residuals (Appendix figure 6a) and standardised residuals (Appendix figure 6b), indicates
a linear relation and equally influential data points. The normally distribution of the data are
seen in the Q-Q plot where the distribution of data indicates a bow, but the low divergence of
from the theoretical distribution (straight line in plot) indicates low significance (Appendix
figure 6d). Non highly influential outliers (Cook’s distance > 1) were found (Appendix figure
6d).
Appendix figure 6 - Residual plot for the linear model fitted for the ΔsUVa and Kd values for RefDOM and biochar mixtures.
(b) (a)
(c) (d)

11
Appendix 6: Additional results for biochar washing pre-treatment
Appendix table 7 - Physiochemical properties of leachates collected during biochar (BC) washing pre-treatments; pH, conductivity (EC), absorbance at λ254 (Abs254), dissolved organic carbon (DOC), specific UV absorbency (sUVA, absorbency at λ254 standardised by DOC concentration), specific absorbency ratio (SAR, absorbency at λ254 relative to absorbency at λ400) and concentrations of Al, Ca, Fe, K, Mg, Mn and Na.
Washing sample pH EC Abs254 DOC sUVa SAR Al Ca Fe K Mg Mn Na
(µS cm-1) (cm-1) (mg (g biochar)-1) (L (mg DOC) -1 cm-1) (mg (g biochar)-1)
Water-washing
Cacao shell BC
Starta 9.64 41800 0.101 6.26 1.62 27.96 n.d. n.d. n.d. 1108.400 11.517 n.d. n.d.
24hrs.a 10.40 538 b.d. 0.50 0.67 11.17 n.d. 0.047 n.d. 10.252 0.224 n.d. n.d.
48hrs.a 9.57 237 b.d. 0.34 0.36 Inf. n.d. 0.092 n.d. 4.968 0.095 n.d. n.d.
72hrs.a 10.28 237 b.d. 0.34 0.43 Inf. 0.006 0.121 0.005 4.126 0.118 0.002 0.035 Rice husk BC
Starta 8.38 2360 0.138 3.60 3.85 7.68 0.047 0.558 0.035 48.627 1.354 0.078 0.770
24hrs.a 9.63 157 0.011 0.22 5.20 5.42 0.005 0.035 0.004 2.893 0.053 0.008 0.046
48hrs.a 9.57 103 0.010 0.17 5.92 4.45 0.004 b.d. 0.004 2.000 0.018 0.005 b.d.
72hrs.a 9.38 78 0.007 0.13 5.25 5.11 0.004 b.d. 0.003 1.574 b.d. 0.004 b.d.
Acid-washing
Cacao shell BC Leachateb 1.73 10871 0.090 0.02 9.40 n.d. 0.100 14.866 0.100 8.525 6.198 0.540 0.109 Rice husk BC
Leachateb 1.81 16930 0.009 0.01 65.22 62.43 0.449 2.719 0.254 4.044 0.899 0.231 0.064
a Small sample aliquot collected at denoted time. b All leachate collected during acid-washing. n.d. = not determined. b.d. = below detection

12
Appendix 7: Additional results for mixtures of soil and biochar
Appendix table 8 – Pysiochemical properties for mixtures of soil and biochar at a liquid:solid ratio of 10L/kg; pH, conductivity (EC), dissolved organic carbon (DOC), specific UV absorbency (sUVa) and specific UV absorbency ratio (SAR).
pH EC Abs254 DOC sUVa SAR.UV
Biochar/Soil (µS cm-1) (cm-1) (mg L-1) (L mg-1 DOC cm-1) Biochar
Cacao shell Untreated 9.78 ± 0.01 16880 ± 81.9 0.553 ± 0.023 20.95 ± 0.60 2.64 ± 0.05 19.5 ± 0.4 Washed 9.2 ± 0.19 655 ± 23.5 0.043 ± 0.005 4.39 ± 1.07 0.99 ± 0.14 n.d. Acid 3.72 ± 0.01 3936.7 ± 35.1 0.010 ± 0.001 1.2 ± 0.21 0.85 ± 0.18 n.d.
Rice husk Untreated 8.35 ± 0.03 742.3 ± 10 0.839 ± 0.093 24.77 ± 1.55 3.38 ± 0.29 7.4 ± 2.3 Washed 7.98 ± 0.03 135.2 ± 3.1 0.507 ± 0.048 10.22 ± 0.69 4.96 ± 0.31 2.9 ± 0.2 Acid 1.71 ± 0.01 5976.7 ± 25.2 0.052 ± 0.006 5.21 ± 0.34 1.01 ± 0.16 n.d.
Acidic soil
Only soil 4.94 ± 0.89 46 ± 9 0.021 ± 0.001 2.65 ± 0.12 0.78 ± 0.02 n.d. Mixtures with Cacao shell BC
Untreated 8.73 ± 0.07 1428.7 ± 194.8 2.559 ± 0.698 68.68 ± 5.01 3.69 ± 0.74 8.7 ± 0.8 Washed 7.84 ± 0.20 284.3 ± 33.9 0.585 ± 0.031 30.18 ± 2.42 1.95 ± 0.22 13.8 ± 3.2 Acid 3.59 ± 0.04 831.7 ± 12.5 0.014 ± 0.001 2.43 ± 0.01 0.59 ± 0.02 n.d.
Mixtureses with Rice husk BC Untreated 5.86 ± 0.17 63.9 ± 1.4 3.777 ± 0.71 17.04 ± 1.17 22.05 ± 2.62 4.2 ± 0.1 Washed 5.67 ± 0.08 35 ± 1.9 1.154 ± 0.176 7.32 ± 0.67 15.73 ± 1.62 4.1 ± 0.1 Acid 3.29 ± 0.05 357 ± 14.7 0.019 ± 0 3.33 ± 0.36 0.58 ± 0.07 n.d.
pH neutral soil
Only soil 7.07 ± 0.14 40.2 ± 4.4 1.474 ± 0.369 12.37 ± 1.64 12.1 ± 3.42 5.1 ± 0.2 Mixtures with Cacao shell BC
Untreated 8.74 ± 0.01 1450.3 ± 85.7 2.061 ± 0.268 29.61 ± 2.14 6.97 ± 0.80 5.7 ± 0.2 Washed 7.71 ± 0.09 203.6 ± 5.2 0.604 ± 0.051 11.82 ± 0.50 5.13 ± 0.63 5.7 ± 0.1 Acid 4.36 ± 0.14 830.7 ± 21.1 0.04 ± 0.002 6.29 ± 0.22 0.63 ± 0.04 n.d.
Mixtures with Rice husk BC Untreated 7.72 ± 0.03 105.5 ± 2.1 1.038 ± 0.021 18.79 ± 0.29 5.53 ± 0.18 5.7 ± 0.1 Washed 7.53 ± 0.02 52.7 ± 0.6 0.904 ± 0.136 14.69 ± 0.34 6.15 ± 0.89 5.3 ± 0.3

13
pH EC Abs254 DOC sUVa SAR.UV
Biochar/Soil (µS cm-1) (cm-1) (mg L-1) (L mg-1 DOC cm-1) Acid 4.73 ± 0.22 254.7 ± 6.1 0.143 ± 0.008 10.11 ± 0.13 1.41 ± 0.06 12.7 ± 0.7
Blank 6.33 ± 0.17 1.8 ± 0.2 b.d. 0.78 ± 0.10 n.d. n.d.
n.d., not determined b.d., below detection limit
Appendix table 9 – Cation concentrations for mixtures of soil and biochar at a liquid:solid ratio of 10L/kg.
Al Ca Fe K Mg Mn Na
Biochar/Soil (mg L-1)
Biochar Cacao shell BC
Untreated b.d. b.d. b.d. 5981.81 ± 365.73 88.45 ± 7.92 b.d. b.d. Washed b.d. b.d. b.d. 204 ± 3.34 4.24 ± 0.45 b.d. b.d. Acid 1.76 ± 0.27 459.32 ± 1.59 b.d. 58.32 ± 2.64 102.49 ± 3.56 28.92 ± 0.6 b.d.
Rice husk BC Untreated b.d. 2.12 ± 0.45 b.d. 295.14 ± 6.05 4.64 ± 0.25 b.d. 6.14 ± 0.38 Washed 0.61 ± 0.22 0.96 ± 0.19 0.26 ± 0.07 49.19 ± 9.34 1.43 ± 0.19 0.07 ± 0.01 1.72 ± 0.61 Acid 8.02 ± 1.06 8.88 ± 0.3 2.53 ± 0.38 20.87 ± 0.49 4.48 ± 0.2 1.52 ± 0.09 0.99 ± 0.15
Acidic soil
Only soil b.d. 1.05 ± 0.11 b.d. 1.26 ± 0.35 0.53 ± 0.03 0.24 ± 0.04 1.85 ± 0.82 Mixtures with Cacao shell BC
Untreated 11.95 ± 6.47 8.3 ± 0.57 4.1 ± 1.93 418.73 ± 62.84 8.89 ± 0.9 b.d. 8.11 ± 0.49 Washed 0.92 ± 0.74 19.06 ± 4.22 0.32 ± 0.25 33.99 ± 3.49 8.16 ± 1.27 0.07 ± 0 1.85 ± 0.13 Acid 7.09 ± 1.5 57 ± 1.63 0.19 ± 0.01 7.95 ± 0.29 11.76 ± 0.25 4.95 ± 1.19 1.72 ± 0.11
Mixtures with Rice husk BC Untreated 58 ± 11 1.51 ± 0.37 20.33 ± 3.88 17.75 ± 3.25 1.16 ± 0.1 0.14 ± 0.04 2.89 ± 0.27 Washed 20.28 ± 4.23 0.9 ± 0.04 7.28 ± 1.59 7.21 ± 1.42 0.6 ± 0.04 0.07 ± 0.01 1.81 ± 0.3 Acid 9.87 ± 0.08 4.99 ± 0.28 0.33 ± 0.01 4.42 ± 0.51 1.5 ± 0.02 2.3 ± 0.1 2.86 ± 0.75
pH neutral soil
Only soil 0.93 ± 0.08 3.97 ± 0.34 0.67 ± 0.05 3.04 ± 0.58 1.26 ± 0.08 0.06 ± 0.03 1.33 ± 0.05 Mixtures with Cacao shell BC
Untreated 4.14 ± 0.59 9.04 ± 3 3.81 ± 0.5 480.45 ± 49.71 6.08 ± 2.03 0.37 ± 0.07 b.d. Washed 0.97 ± 0.14 14.81 ± 0.52 0.69 ± 0.1 34.83 ± 0.67 5.81 ± 0.15 0.05 ± 0.01 1.06 ± 0.08 Acid b.d. 82.3 ± 8.16 b.d. 10.75 ± 1 19.47 ± 0.34 6.89 ± 0.22 1.21 ± 0.16

14
Al Ca Fe K Mg Mn Na
Biochar/Soil (mg L-1) Mixtures with Rice husk BC
Untreated 4.96 ± 0.75 5.97 ± 0.33 3.53 ± 0.62 34.78 ± 0.97 2.23 ± 0.16 0.11 ± 0 2.54 ± 0.18 Washed 4.6 ± 2.19 5.53 ± 0.12 3.28 ± 1.52 14 ± 0.43 2.07 ± 0.34 0.16 ± 0.04 1.5 ± 0.27 Acid 0.22 ± 0.02 36.16 ± 0.47 0.1 ± 0.01 9.82 ± 0.13 7.07 ± 0.05 2.27 ± 0.04 1.28 ± 0.28
Blank b.d. b.d. b.d. b.d. b.d. b.d. b.d.
n.d., not determined b.d., below detection limit

15
Appendix 8: Additional results for mixtures of reference dissolved organic matter and biochar
Appendix table 10 – Pysiochemical properties for mixtures of reference dissolved organic matter (RefDOM) and biochar (BC) at a liquid:solid ratio of 500L/kg; pH, conductivity (EC), dissolved organic carbon (DOC), specific UV absorbency (sUVa) , specific UV absorbency ratio (SAR), sorption coefficients (Kd) and before sorption sUVa estimate (Estimated sUVa).
pH EC Abs254 DOC sUVa Estimated sUVa SAR Kd
Biochar/Reference DOM (µS cm-1) (cm-1) (mg L-1) (L (mg DOC) -1 cm-1) (L (mg DOC) -1 cm-1) (L kg-1)
Biochar Cacao shell BC
Untreated 9.93 ± 0.02 424 ± 5 0.041 ± 0.003 4.11 ± 0.13 1.00 ± 0.10 8.4 ± 1.2 Washed 7.75 ± 0.08 36 ± 2 0.013 ± 0.001 2.95 ± 0.06 0.43 ± 0.03 n.d. Acid 3.67 ± 0.02 142 ± 6 b.d. 1.18 ± 0.04 n.d. n.d.
Rice husk BC Untreated 6.99 ± 0.11 23.3 ± 1.3 0.059 ± 0.006 2.98 ± 0.10 1.97 ± 0.14 5.9 ± 0.4 Washed 6.3 ± 0.15 4.2 ± 0.4 0.019 ± 0.001 2.0 ± 0.5 0.98 ± 0.30 n.d. Acid 3.34 ± 0.01 152 ± 1.6 b.d. 0.75 ± 0.06 n.d. n.d.
Aliphatic Ref DOM Only RefDOM 4.41 ± 0.05 64.5 ± 0.2 0.239 ± 0.005 9.1 ± 0.1 2.64 ± 0.03 10.7 ± 0.5
Mixtures with Cacao shell BC Untreated 9.52 ± 0.07 533 ± 9 0.35 ± 0.03 10.0 ± 1.0 3.47 ± 0.09 2.3 ± 0.3 6.6 ± 0.1 158 ± 17 Washed 7.15 ± 0.11 99 ± 6 0.248 ± 0.004 7.6 ± 0.2 3.25 ± 0.06 2.2 ± 0.3 8.8 ± 0.6 287 ± 9 Acid 3.88 ± 0.03 191 ± 9 0.11 ± 0.006 4.7 ± 0.2 2.35 ± 0.07 2.5 ± 0.3 12.3 ± 0.7 590 ± 37
Mixtures with Rice husk BC Untreated 6.86 ± 0.11 81.8 ± 1.4 0.324 ± 0.005 10.9 ± 0.3 2.98 ± 0.04 2.6 ± 0.5 10.2 ± 0.4 53 ± 2 Washed 6.66 ± 0.06 63.5 ± 1.9 0.286 ± 0.009 10.1 ± 0.3 2.84 ± 0.11 2.5 ± 0.7 11.3 ± 0.7 51 ± 13 Acid 3.37 ± 0.01 223.7 ± 1.5 0.143 ± 0.003 6.14 ± 0.02 2.32 ± 0.04 2.6 ± 0.4 20.4 ± 0.4 298 ± 25
Intermediate Ref DOM Only RefDOM 4.64 ± 0.06 30.9 ± 0.3 0.354 ± 0.004 9.32 ± 0.05 3.8 ± 0.05 8.2 ± 0.3
Mixtures with Cacao shell BC Untreated 9.68 ± 0.12 516 ± 45 0.441 ± 0.007 11.9 ± 0.2 3.71 ± 0.12 3.1 ± 0.5 6 ± 0.2 64 ± 2 Washed 7.52 ± 0.06 73 ± 7 0.352 ± 0.015 9.6 ± 0.5 3.69 ± 0.25 3.2 ± 0.4 7.8 ± 0.1 141 ± 8 Acid 3.87 ± 0.02 163 ± 4 0.116 ± 0.006 5.49 ± 0.14 2.11 ± 0.09 3.6 ± 0.5 12 ± 0.8 456 ± 19

16
pH EC Abs254 DOC sUVa Estimated sUVa SAR Kd
Biochar/Reference DOM (µS cm-1) (cm-1) (mg L-1) (L (mg DOC) -1 cm-1) (L (mg DOC) -1 cm-1) (L kg-1)
Mixtures with Rice husk BC Untreated 6.8 ± 0.10 52.0 ± 1.6 0.451 ± 0.004 12.3 ± 0.6 3.68 ± 0.21 3.6 ± 0.6 8.6 ± 0.1 0.19 ± 0.01 Washed 6.4 ± 0.5 35 ± 4 0.403 ± 0.009 11.44 ± 0.11 3.52 ± 0.11 3.5 ± 1 9 ± 0.4 -4.3 ± 1.14 Acid 3.34 ± 0.01 203 ± 3 0.161 ± 0.006 7.5 ± 0.2 2.15 ± 0.02 3.8 ± 0.6 15.1 ± 0.4 172 ± 15
Aromatic RefDOM Only soil 5.07 ± 0.08 31.3 ± 1.2 0.412 ± 0.005 9.2 ± 0.2 4.5 ± 0.06 7.7 ± 0.2
Mixtures with Cacao shell BC Untreated 9.58 ± 0.13 528 ± 22 0.532 ± 0.009 12.4 ± 0.2 4.28 ± 0.02 3.6 ± 0.5 5.4 ± 0 33.7 ± 1.5 Washed 7.6 ± 0.2 71.2 ± 1.7 0.402 ± 0.017 9.47 ± 0.07 4.24 ± 0.21 3.7 ± 0.5 6.9 ± 0.2 139 ± 4.4 Acid 3.96 ± 0.02 159.5 ± 1.2 0.135 ± 0.004 4.89 ± 0.07 2.77 ± 0.11 4.3 ± 0.6 9.3 ± 0.7 557 ± 24
Mixtures with Rice husk BC Untreated 6.87 ± 0.06 56 ± 4 0.53 ± 0.006 12.38 ± 0.11 4.28 ± 0.05 4.1 ± 0.7 7.5 ± 0.1 -9.8 ± 0.4 Washed 6.56 ± 0.08 36.1 ± 1.4 0.499 ± 0.01 11.13 ± 0.01 4.48 ± 0.09 4.1 ± 1.2 7.7 ± 0 1.8 ± 0.5 Acid 3.45 ± 0.01 180 ± 3 0.214 ± 0.008 6.79 ± 0.18 3.16 ± 0.04 4.5 ± 0.7 10.9 ± 0.2 229 ± 21
Blank 6.33 ± 0.17 1.8 ± 0.2 b.d. 0.78 ± 0.1 n.d. n.d.
n.d., not determined b.d., below detection limit

17
Appendix table 11 – Cation concentrations for mixtures of reference dissolved organic matter (RefDOM) and biochar, at a liquid:solid ratio of 500 L/kg.
Al Ca Fe K Mg Mn Na
Biochar/Reference DOM (mg L-1)
Biochar Cacao shell BC
Untreated b.d. 1.83 ± 0.4 b.d. 122.61 ± 6.72 3.37 ± 0.56 b.d. b.d. Washed b.d. 1.15 ± 0.06 b.d. 9.44 ± 0.74 0.58 ± 0.01 b.d. b.d. Acid 0.44 ± 0.04 8.77 ± 0.52 b.d. 1.2 ± 0.07 1.95 ± 0.12 0.63 ± 0.04 b.d.
Rice husk BC Untreated b.d. b.d. b.d. 8.09 ± 0.41 b.d. b.d. b.d. Washed b.d. b.d. b.d. 1.33 ± 0.25 b.d. b.d. b.d. Acid b.d. b.d. b.d. b.d. b.d. b.d. b.d.
Aliphatic Ref DOM Only RefDOM 0.13 ± 0 b.d. b.d. b.d. b.d. b.d. 7.8 ± 0.17
Mixtures with Cacao shell BC Untreated b.d. 1.85 ± 0.05 b.d. 135.91 ± 5.17 3.13 ± 0.23 b.d. 9.95 ± 0.68 Washed b.d. 1.94 ± 0.12 b.d. 11.28 ± 0.8 0.84 ± 0.09 b.d. 6.92 ± 0.36 Acid 0.18 ± 0.04 8.1 ± 0.66 b.d. 0.98 ± 0.1 1.8 ± 0.15 0.53 ± 0.04 7.69 ± 0.57
Mixtures with Rice husk BC Untreated b.d. b.d. b.d. 10.13 ± 0.19 b.d. b.d. 7.5 ± 0.31 Washed b.d. b.d. b.d. 5.13 ± 0.98 b.d. b.d. 8.11 ± 0.2 Acid b.d. b.d. b.d. b.d. b.d. b.d. 9.86 ± 0.63
Intermediate Ref DOM Only RefDOM b.d. b.d. 0.11 ± 0 b.d. b.d. b.d. 4.83 ± 0.14
Mixtures with Cacao shell BC Untreated b.d. 2.32 ± 0.79 b.d. 154.26 ± 12.22 3.97 ± 1.2 b.d. 6.14 ± 0.21 Washed b.d. 2.23 ± 0.27 b.d. 13.26 ± 1.1 b.d. b.d. 4.31 ± 0.18 Acid 0.1 ± 0.02 10.18 ± 0.12 b.d. 1.35 ± 0.03 2.21 ± 0.02 0.65 ± 0.01 5.31 ± 0.04
Mixtures with Rice husk BC Untreated b.d. b.d. 0.14 ± 0 10.48 ± 0.42 b.d. b.d. 4.29 ± 0.09 Washed b.d. b.d. 0.11 ± 0.01 4.85 ± 0.64 b.d. b.d. 4.4 ± 0.58 Acid b.d. b.d. b.d. b.d. b.d. b.d. 5.24 ± 0.31

18
Al Ca Fe K Mg Mn Na
Biochar/Reference DOM (mg L-1)
Aromatic RefDOM Only soil b.d. b.d. 0.27 ± 0 b.d. b.d. b.d. 4.72 ± 0.07
Mixtures with Cacao shell BC Untreated b.d. 1.99 ± 0.35 b.d. 129.45 ± 4.92 3.47 ± 0.69 b.d. 5.4 ± 0.16 Washed b.d. 1.82 ± 0.16 b.d. 10.72 ± 0.32 0.69 ± 0.07 b.d. 3.63 ± 0.15 Acid 0.14 ± 0 9.31 ± 0.37 b.d. 1.36 ± 0.05 2.08 ± 0.07 0.58 ± 0.02 5.17 ± 0.16
Mixtures with Rice husk BC Untreated b.d. b.d. 0.22 ± 0 9.66 ± 0.57 b.d. b.d. 4.18 ± 0.14 Washed b.d. b.d. 0.22 ± 0.01 3.91 ± 0.13 b.d. b.d. 3.67 ± 0.26 Acid 0.09 ± 0.02 0.41 ± 0.04 0.19 ± 0.01 b.d. b.d. b.d. 4.82 ± 0.11
Blank b.d. b.d. b.d. b.d. b.d. b.d. b.d.
n.d., not determined b.d., below detection limit

19
List of tables and figures
LIST OF FIGURES
FIGURE 1 - SCANNING ELECTRON MICROSCOPE PICTURES TAKEN OF (A) CACAO SHELL AND (B) RICE HUSK BIOCHAR PRODUCED FOR THIS
PROJECTS FIELD TRIALS AND EXPERIMENTS. THE PICTURES ARE MAGNIFIED APPROX. 600 TIMES, AT A HIGH VOLTAGE OF 3.0
KVOLT USING A QUANTA 200 INSTRUMENT (FEI, HILLSBORO, USA). ........................................................................... 3
FIGURE 2 - CONCEPTUAL MODEL OF THE FORMATION AND REMOVAL PROCESSES FOR SOIL ORGANIC MATTER (SOM) AND DISSOLVED
ORGANIC MATTER (DOM) (MODIFIED AFTER: KALBITZ ET AL., 2000). ......................................................................... 6
FIGURE 3 – AN EXAMPLE OF HOW CACAO SHELL BIOCHAR AMENDED IN THE UPPER SOIL LAYER (0-15 CM) ENHANCES THE FERTILITY OF
MAIZE PLOTS IN THE PROJECTS FIELD TRIALS IN LAMPUNG, INDONESIA. .......................................................................... 9
FIGURE 4 - ILLUSTRATION OF THE CALCULATIONS OF THE BEFORE AND AFTER SORPTION CONCENTRATIONS. ................................. 15
FIGURE 5 – CHANGES IN DOC CONCENTRATION FOR DOM RELEASED FROM BIOCHAR, DURING WATER-WASHING, FOR (A) DOC
CONCENTRATION AND (B) DOM CHARACTERISTICS BY THE RELATIVE AMOUNT OF AROMATIC DOM, PRESENTED BY THE SPECIFIC
UV ABSORBENCY (SUVA). .................................................................................................................................. 21
FIGURE 6 – THE CHANGE IN DOC CONCENTRATIONS FROM BEFORE TO AFTER THE MIXING OF SOIL AND (A) CACAOS SHELL OR (B) RICE
HUSK BIOCHAR (DOC BACKGROUND; PH-NEUTRAL SOIL: 12 ± 2 MG C L-1 (PH 7.0) AND ACIDIC SOIL : 2.7 ± 0.1 MG C L-1 (PH
4.9).) ............................................................................................................................................................ 24
FIGURE 7 – THE CHANGE IN DISSOLVED ORGANIC CARBON (ΔDOC) CONCENTRATION PLOTTED AGAINST THE CHANGE IN PH FROM
BEFORE TO AFTER THE SOIL AND BIOCHAR WERE MIXED TOGETHER; CIRCLES INDICATE CACAO SHELL WHILE TRIANGLES INDICATE
RICE HUSK BIOCHAR MIXTURES WITH SOIL. ............................................................................................................. 25
FIGURE 8 - THE DISSOLVED IRON CONCENTRATION INFLUENCE ON THE SUVA PARAMETER FOR THE ACIDIC (SQUARES) AND PH-NEUTRAL
(DIAMONDS) SOIL SAMPLES................................................................................................................................. 29
FIGURE 9 - SORPTION COEFFICIENTS (KD) FOR REFDOM WHEN MIXED WITH (A) CACAO SHELL OR (B) RICE HUSK BIOCHAR. ............ 31
FIGURE 10 – THE SPECIFIC UV ABSORBENCY (SUVA) ILLUSTRATES THE SHIFT IN THE AROMATIC DOM FRACTION IN MIXTURES OF
REFDOM WITH (A) CACAO SHELL OR (B) RICE HUSK BIOCHAR FROM BEFORE SORPTION ESTIMATES. .................................. 34
FIGURE 11 – SIMPLIFIED CONCEPTUAL MODEL: LARGE AROMATIC DOM (RED) COULD CLOG BIOCHARS MICROPORES, WHILE SMALL
ALIPHATIC DOM (BLUE) COULD ABSORB INTO THEM. ............................................................................................... 36
FIGURE 12 – THE SORPTION COEFFICIENTS SHOWS A LINEAR RELATION WITH THE CHANGE IN THE AROMATIC DOM FRACTION,
DEPENDENT ON THE BIOCHAR PRE-TREATMENT; UNTREATED OR WASHED BIOCHAR. THE LINEAR RELATION IS INDEPENDENT OF
BIOCHAR TYPE; CACAO SHELL (CIRCLES) AND RICE HUSK BIOCHAR (TRIANGLES). NO SIGNIFICANT CORRELATION WAS FOUND FOR
ACID BIOCHAR. ................................................................................................................................................. 37
FIGURE 13 - SPESIFIC ABSORBENCY RATIO (SAR) DESCRIBING THE SIZE DISTRIBUTION OF AROMATIC DOM FOR THE MIXTURES OF
REFDOM AND (A) CACAO SHELL AND (B) RICE HUSK BIOCHAR. .................................................................................. 38

20
LIST OF APPENDIX FIGURES
APPENDIX FIGURE 1 – ILLUSTRATION OF THE EXPERIMENTAL DESIGN FOR THE BATCH EXTRACTION EXPERIMENTS. ______________ 1
APPENDIX FIGURE 2 - ILLUSTRATION OF THE APPROACH TO ESTIMATE THE LIMIT OF DETECTION (LOD); (CB, CONCENTRATION OF BLANK;
SB, STANDARD DEVIATION FOR BLANK) ___________________________________________________________ 2
APPENDIX FIGURE 3 – BET PLOTS SHOWING THE LINEAR RELATION (BLACK LINE) USED TO CALCULATE THE BET-SURFACE AREA FOR (A)
UNTREATED CACAO SHELL, (B) WASHED CACAO SHELL, (C) UNTREATED RICE HUSK AND (D) WASHED RICE HUSK BIOCHAR. ____ 6
APPENDIX FIGURE 4 - THICKNESS PLOTS SHOWING THE LINEAR RELATIONS (BLACK LINE) USED TO CALCULATE THE FRACTION
MICROPORES FOR (A) UNTREATED CACAO SHELL, (B) WASHED CACAO SHELL, (C) UNTREATED RICE HUSK AND (D) WASHED RICE
HUSK BIOCHAR. ___________________________________________________________________________ 8
APPENDIX FIGURE 5 - SCRIPT WRITTEN FOR THE STATISTICAL SOFTWARE R TO RUN GRUBBS TEST FOR OUTLIERS BASED ON THE
EQUATIONS OF MILLER AND MILLER (2005). ______________________________________________________ 9
APPENDIX FIGURE 6 - RESIDUAL PLOT FOR THE LINEAR MODEL FITTED FOR THE ΔSUVA AND KD VALUES FOR REFDOM AND BIOCHAR
MIXTURES. _____________________________________________________________________________ 10
LIST OF TABLES
TABLE 1- SOIL PROPERTIES FOR MAIZE FIELD TRIALS WITH CACAO SHELL BIOCHAR IN LAMPUNG IN INDONESIA. (ONLY FOR SOIL ORGANIC
C: * = P<0.05 AND ** = P<0.01) ______________________________________________________________ 9
TABLE 2 – PHYSIOCHEMICAL PROPERTIES OF THE SOILS INCLUDED IN THE STUDY: ORGANIC C (ORG. C), H, N, PH, CATION EXCHANGE
CAPACITY (CEC) AND BASE SATURATION (BS) (DATA FROM: ALLING ET AL., N.D.). ____________________________ 11
TABLE 3 - SELECTED CHARACTERISTICS OF THE REFERENCE DISSOLVED ORGANIC MATTER (REFDOM); C-N-RATIO (C:N), ORGANIC C
(ORG. C), HYDROPHOBIC ACIDS (HPO-A) IN DOM ADSORBED BY A NON-POLAR XAD-8 RESIN, SPECIFIC UV ABSORBENCY
(SUVA) OF Λ254 RELATIVE TO DOC, SPECIFIC ABSORBENCY RATIO (SAR) OF Λ254/ Λ400, BIODEGRADABLE ORGANIC MATTER
(BDOM) OF DOC LOSS AFTER 10 DAYS UNDER IDEAL CONDITIONS AND MOLECULAR WEIGHT FROM HP-SEC (MW). (DATA
FROM: VOGT ET AL., 2004). _________________________________________________________________ 12
TABLE 4 - SELECTED ATTRIBUTES OF BIOCHARS PRODUCED FROM CACAO SHELL AND RICE HUSK FEEDSTOCK: ORGANIC C (ORG. C); N;
PH; CATION EXCHANGE CAPACITY (CEC); ASH AND ACID NEUTRALISING CAPACITY (ANC). (DATA RETRIEVED FROM: MARTINSEN
ET AL., N.D.). ___________________________________________________________________________ 20
TABLE 5 – SURFACE AREA CALCULATED FROM THE BRAUNER-EMMET-TELLER (BET) THEORY AND FRACTION MICROPORES FROM T-
PLOTS FOR BIOCHARS GIVEN PRE-TREATMENT. _____________________________________________________ 22
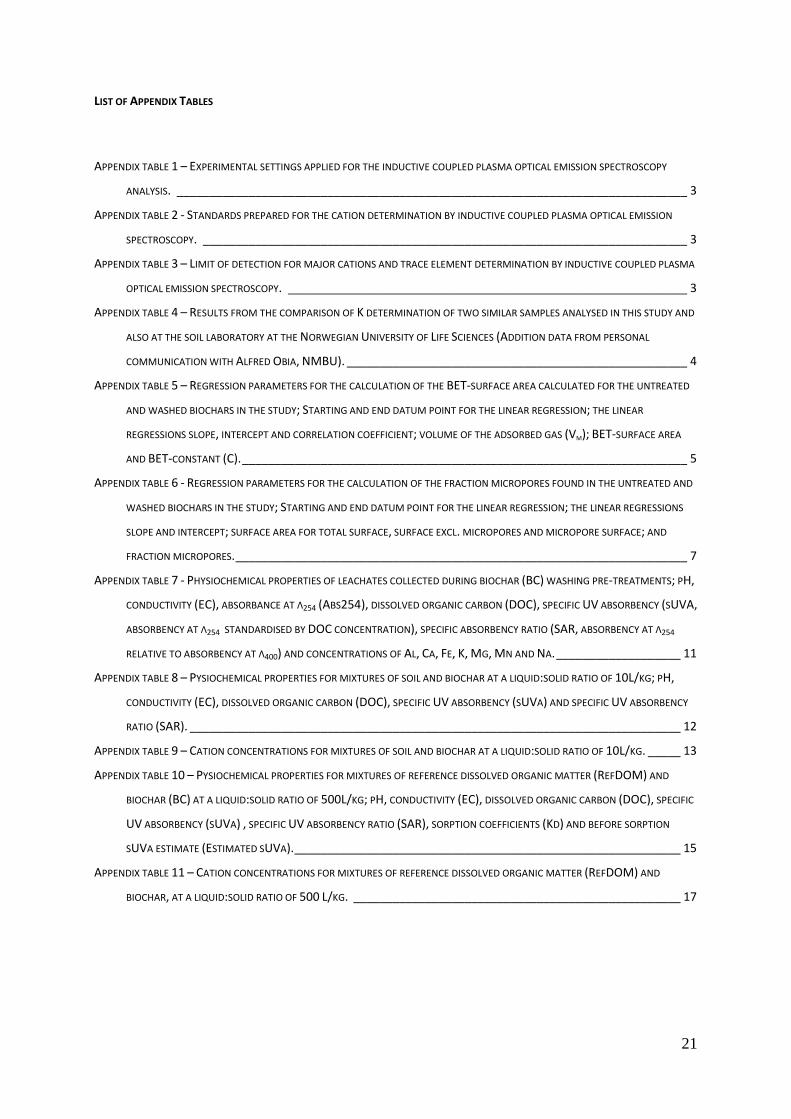
21
LIST OF APPENDIX TABLES
APPENDIX TABLE 1 – EXPERIMENTAL SETTINGS APPLIED FOR THE INDUCTIVE COUPLED PLASMA OPTICAL EMISSION SPECTROSCOPY
ANALYSIS. ______________________________________________________________________________ 3
APPENDIX TABLE 2 - STANDARDS PREPARED FOR THE CATION DETERMINATION BY INDUCTIVE COUPLED PLASMA OPTICAL EMISSION
SPECTROSCOPY. __________________________________________________________________________ 3
APPENDIX TABLE 3 – LIMIT OF DETECTION FOR MAJOR CATIONS AND TRACE ELEMENT DETERMINATION BY INDUCTIVE COUPLED PLASMA
OPTICAL EMISSION SPECTROSCOPY. _____________________________________________________________ 3
APPENDIX TABLE 4 – RESULTS FROM THE COMPARISON OF K DETERMINATION OF TWO SIMILAR SAMPLES ANALYSED IN THIS STUDY AND
ALSO AT THE SOIL LABORATORY AT THE NORWEGIAN UNIVERSITY OF LIFE SCIENCES (ADDITION DATA FROM PERSONAL
COMMUNICATION WITH ALFRED OBIA, NMBU). ____________________________________________________ 4
APPENDIX TABLE 5 – REGRESSION PARAMETERS FOR THE CALCULATION OF THE BET-SURFACE AREA CALCULATED FOR THE UNTREATED
AND WASHED BIOCHARS IN THE STUDY; STARTING AND END DATUM POINT FOR THE LINEAR REGRESSION; THE LINEAR
REGRESSIONS SLOPE, INTERCEPT AND CORRELATION COEFFICIENT; VOLUME OF THE ADSORBED GAS (VM); BET-SURFACE AREA
AND BET-CONSTANT (C). ____________________________________________________________________ 5
APPENDIX TABLE 6 - REGRESSION PARAMETERS FOR THE CALCULATION OF THE FRACTION MICROPORES FOUND IN THE UNTREATED AND
WASHED BIOCHARS IN THE STUDY; STARTING AND END DATUM POINT FOR THE LINEAR REGRESSION; THE LINEAR REGRESSIONS
SLOPE AND INTERCEPT; SURFACE AREA FOR TOTAL SURFACE, SURFACE EXCL. MICROPORES AND MICROPORE SURFACE; AND
FRACTION MICROPORES. _____________________________________________________________________ 7
APPENDIX TABLE 7 - PHYSIOCHEMICAL PROPERTIES OF LEACHATES COLLECTED DURING BIOCHAR (BC) WASHING PRE-TREATMENTS; PH,
CONDUCTIVITY (EC), ABSORBANCE AT Λ254 (ABS254), DISSOLVED ORGANIC CARBON (DOC), SPECIFIC UV ABSORBENCY (SUVA,
ABSORBENCY AT Λ254 STANDARDISED BY DOC CONCENTRATION), SPECIFIC ABSORBENCY RATIO (SAR, ABSORBENCY AT Λ254
RELATIVE TO ABSORBENCY AT Λ400) AND CONCENTRATIONS OF AL, CA, FE, K, MG, MN AND NA. ___________________ 11
APPENDIX TABLE 8 – PYSIOCHEMICAL PROPERTIES FOR MIXTURES OF SOIL AND BIOCHAR AT A LIQUID:SOLID RATIO OF 10L/KG; PH,
CONDUCTIVITY (EC), DISSOLVED ORGANIC CARBON (DOC), SPECIFIC UV ABSORBENCY (SUVA) AND SPECIFIC UV ABSORBENCY
RATIO (SAR). ___________________________________________________________________________ 12
APPENDIX TABLE 9 – CATION CONCENTRATIONS FOR MIXTURES OF SOIL AND BIOCHAR AT A LIQUID:SOLID RATIO OF 10L/KG. _____ 13
APPENDIX TABLE 10 – PYSIOCHEMICAL PROPERTIES FOR MIXTURES OF REFERENCE DISSOLVED ORGANIC MATTER (REFDOM) AND
BIOCHAR (BC) AT A LIQUID:SOLID RATIO OF 500L/KG; PH, CONDUCTIVITY (EC), DISSOLVED ORGANIC CARBON (DOC), SPECIFIC
UV ABSORBENCY (SUVA) , SPECIFIC UV ABSORBENCY RATIO (SAR), SORPTION COEFFICIENTS (KD) AND BEFORE SORPTION
SUVA ESTIMATE (ESTIMATED SUVA). ___________________________________________________________ 15
APPENDIX TABLE 11 – CATION CONCENTRATIONS FOR MIXTURES OF REFERENCE DISSOLVED ORGANIC MATTER (REFDOM) AND
BIOCHAR, AT A LIQUID:SOLID RATIO OF 500 L/KG. __________________________________________________ 17