Embed Size (px)
Citation preview
Biochar Carbon Sequestration
Christoph SteinerLaurens RademakersWinfried E. H. Blum
In Tropical Land Use Systems
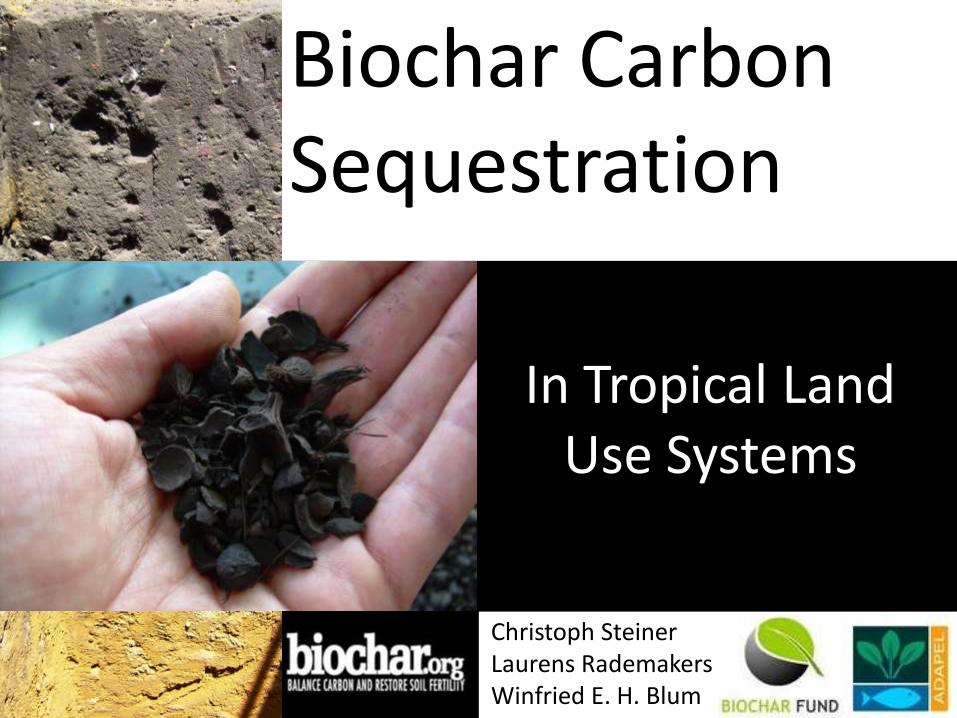
Greenhouse gas emissions
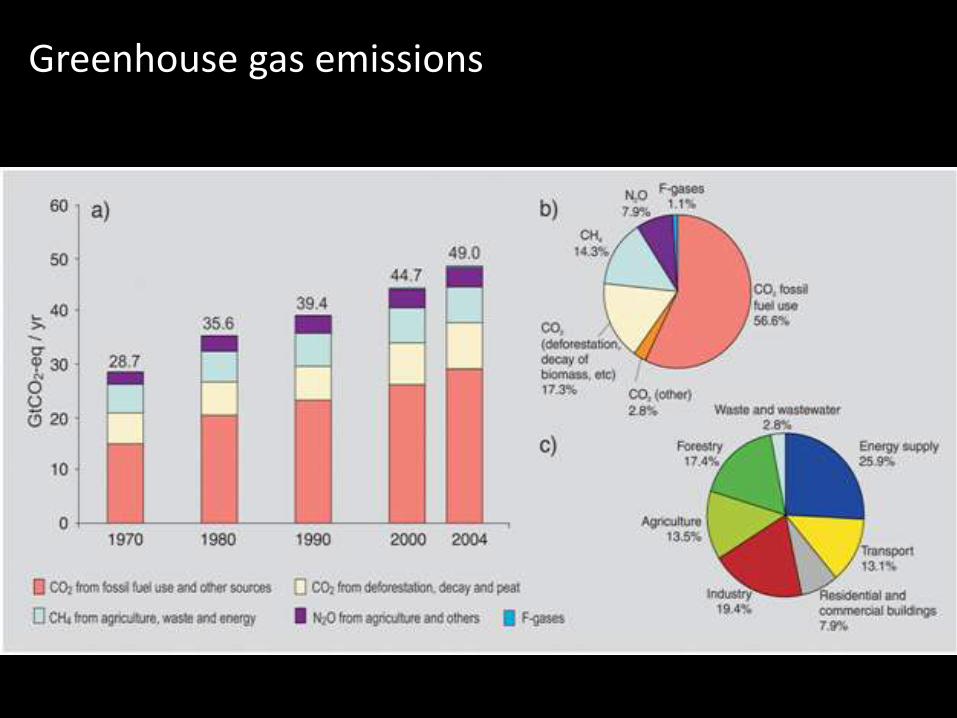
Biofuels fossil fuel substitutionHolly K Gibbs et al 2008 Environ. Res. Lett. 3
Annual biofuel carbon saving (tons C/ha/year)
Biofuels may substitute fossil fuels but not sequester carbon
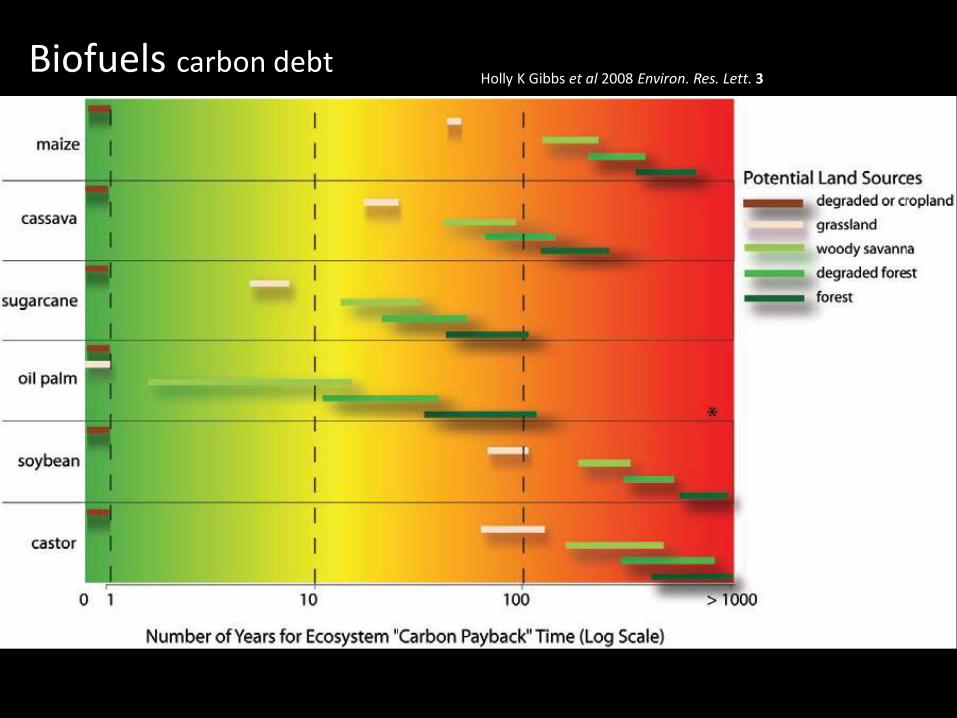
Biofuels carbon debtHolly K Gibbs et al 2008 Environ. Res. Lett. 3
Biofuels considerations
Induced land use change
The need to double food production until 2050 Tilman at al. 2001, Science 292
Dependency on non-renewable resources (fossil fuels, rock phosphate, Hall
and Hall 1993, Cordell et al. 2009)
Environmental changes• soil degradation• climate change
Importance of Waste Biomass Utilization!Biofuels, Carbon Sequestration and Soil Restoration
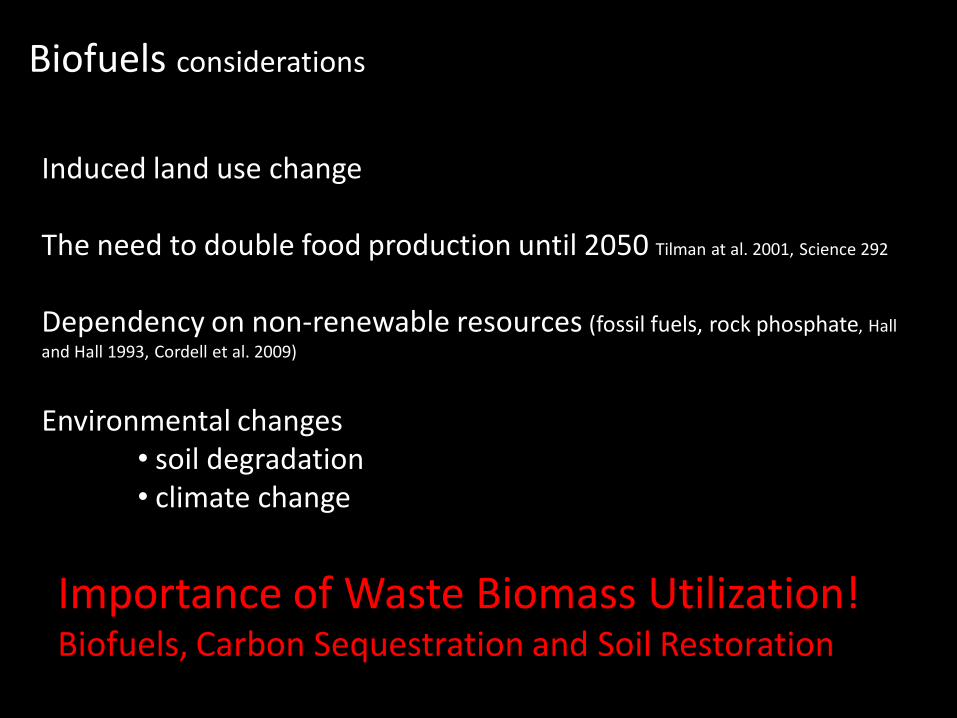
Waste biomass or wasted biomass
Fast growing biomass supply
Conditions for Biochar Carbon Sequestration
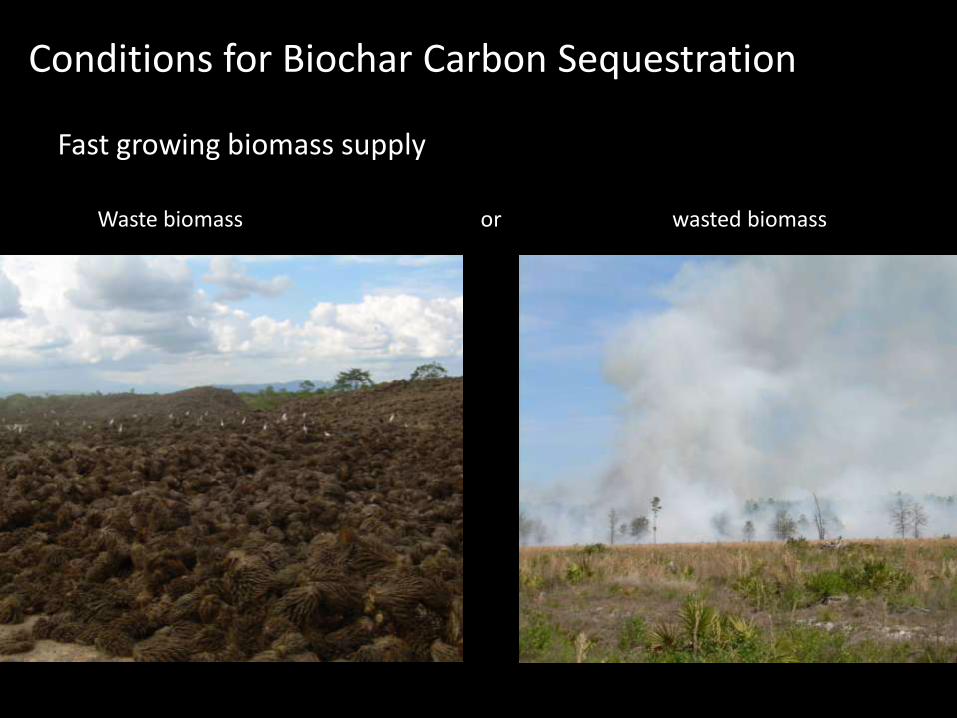
Conditions soils
• Low CEC and importance of SOC• Acidity• Fast decomposition of labile SOC
78 million ha of land is severely damaged in Indonesia (Ministry of
Forestry Indonesia (2009)
= completely depleted function of:• Water retention•Erosion control• Nutrient cycling• Climate regulation•Carbon accumulation
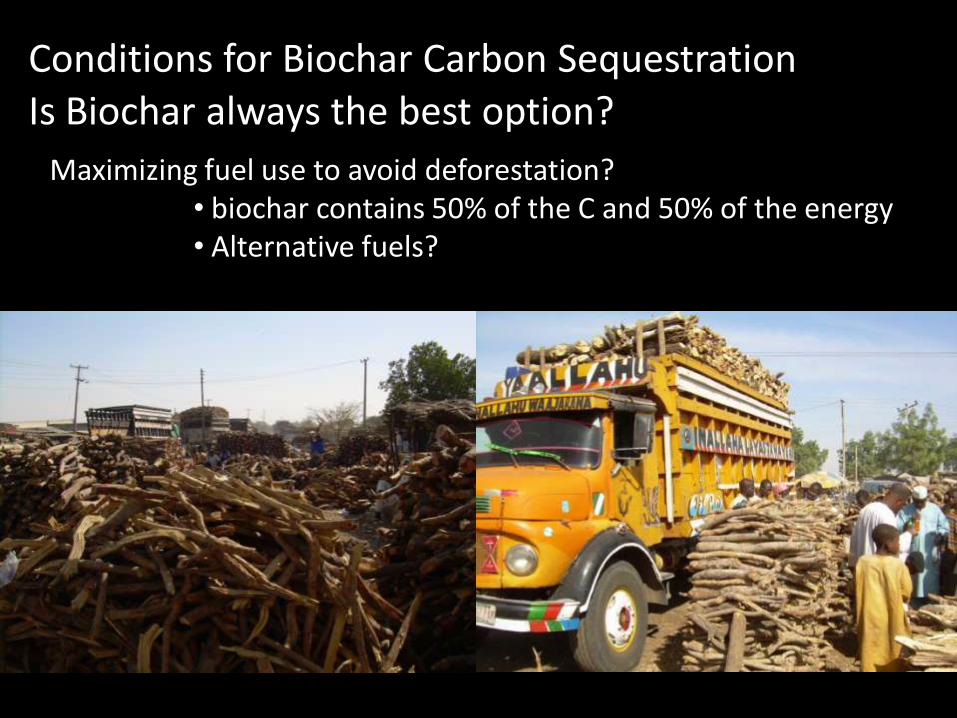
Conditions for Biochar Carbon Sequestration
Maximizing fuel use to avoid deforestation?• biochar contains 50% of the C and 50% of the energy• Alternative fuels?
Is Biochar always the best option?
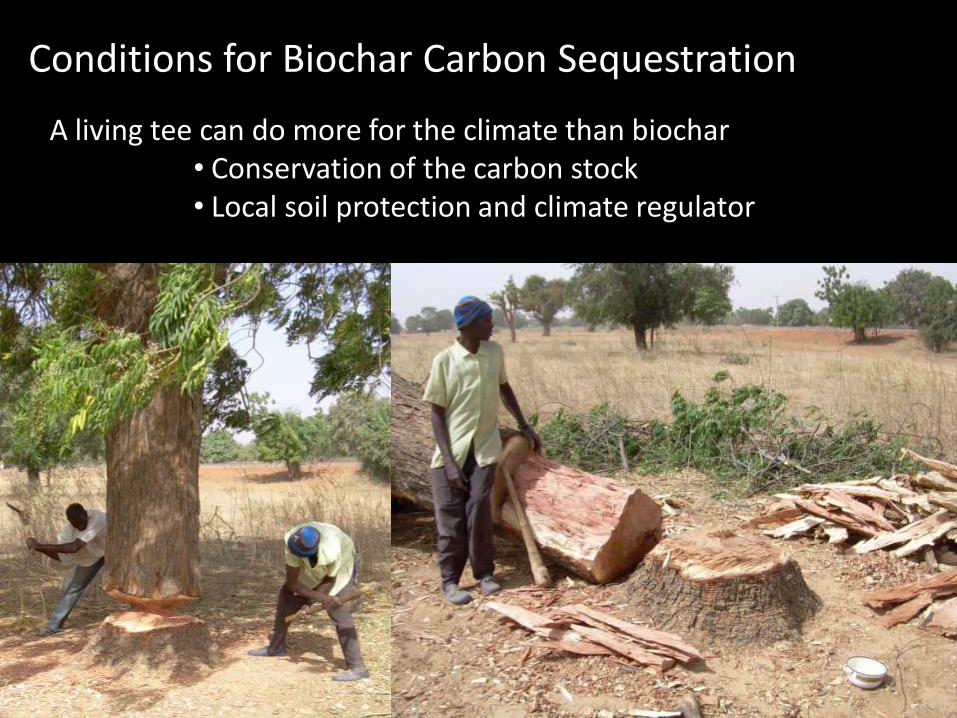
A living tee can do more for the climate than biochar• Conservation of the carbon stock• Local soil protection and climate regulator
Conditions for Biochar Carbon Sequestration
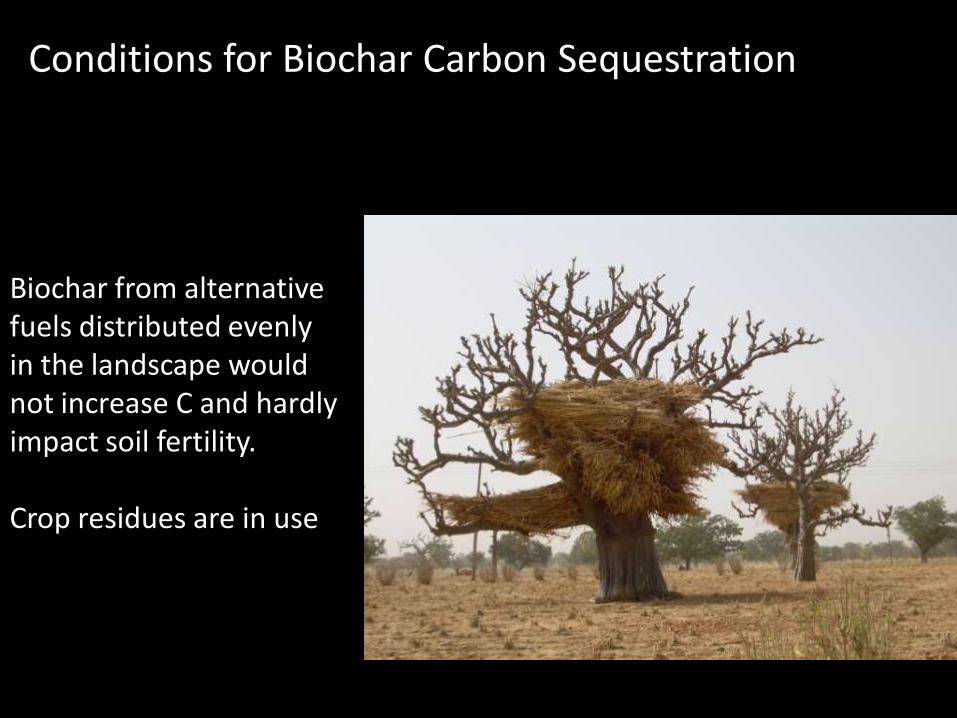
Conditions for Biochar Carbon Sequestration
Biochar from alternative fuels distributed evenly in the landscape would not increase C and hardly impact soil fertility.
Crop residues are in use
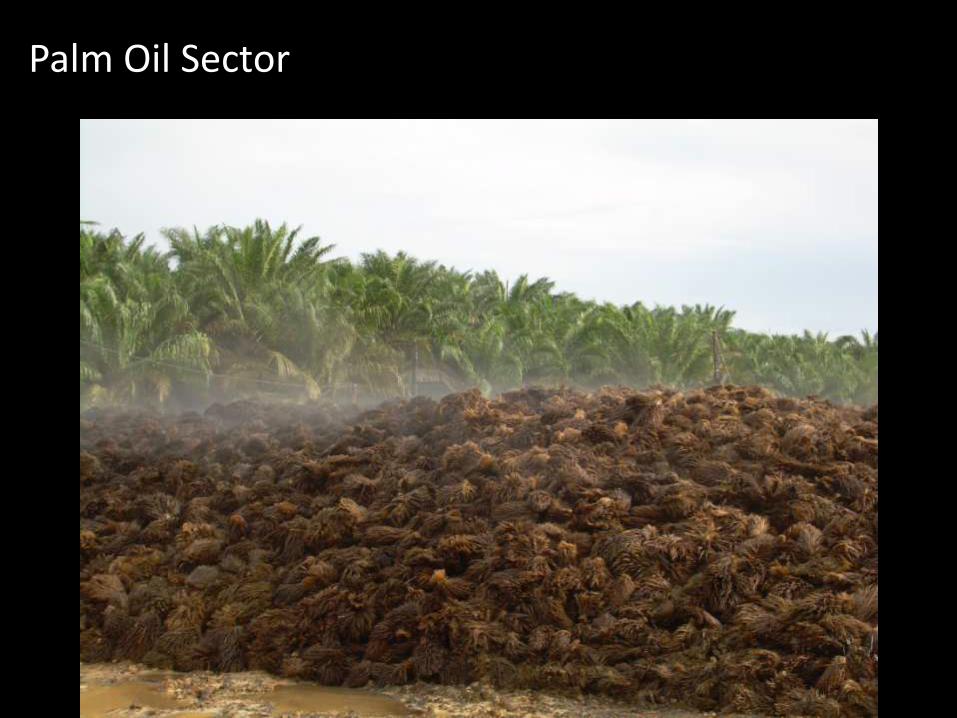
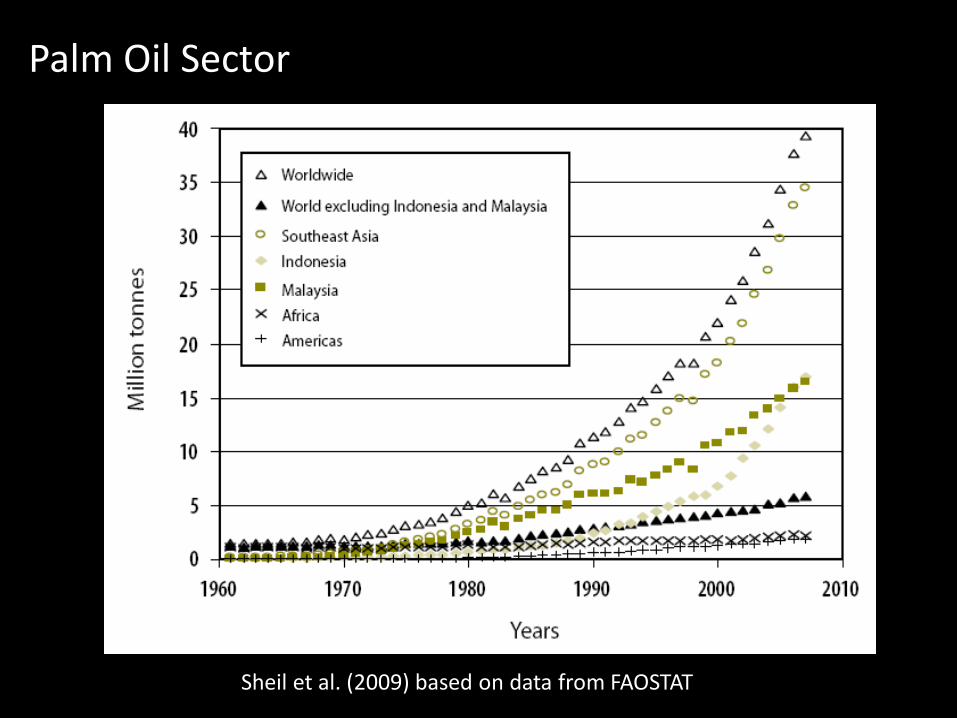
Palm Oil Sector
Palm Oil Sector
Sheil et al. (2009) based on data from FAOSTAT
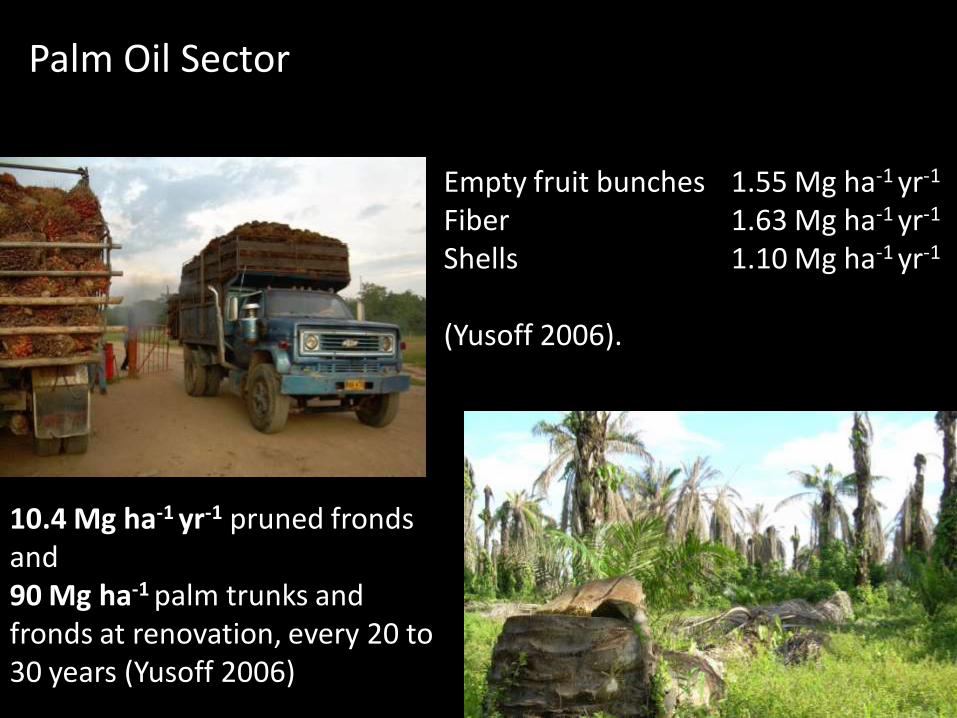
Empty fruit bunches 1.55 Mg ha-1 yr-1
Fiber 1.63 Mg ha-1 yr-1
Shells 1.10 Mg ha-1 yr-1
(Yusoff 2006).
10.4 Mg ha-1 yr-1 pruned fronds and90 Mg ha-1 palm trunks and fronds at renovation, every 20 to 30 years (Yusoff 2006)
Palm Oil Sector
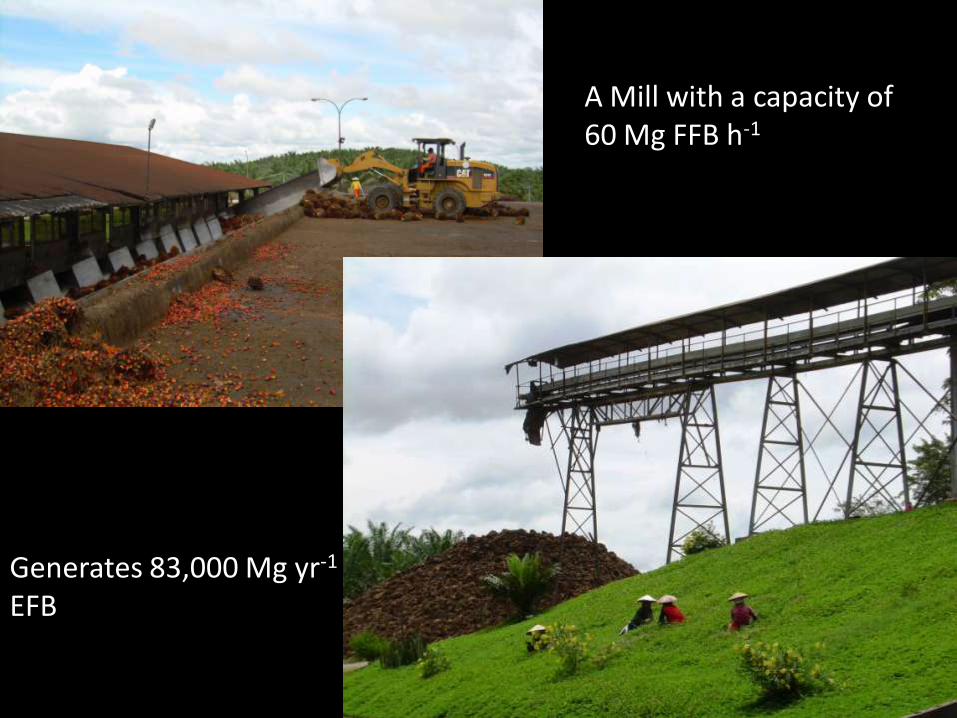
A Mill with a capacity of 60 Mg FFB h-1
Generates 83,000 Mg yr-1
EFB
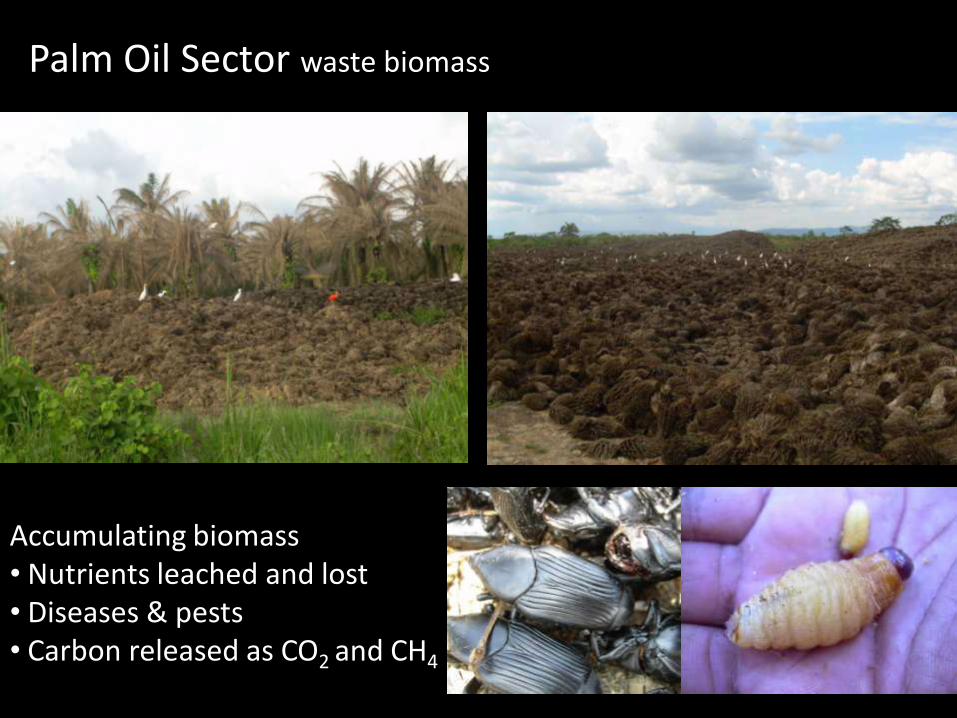
Accumulating biomass• Nutrients leached and lost• Diseases & pests• Carbon released as CO2 and CH4
Palm Oil Sector waste biomass
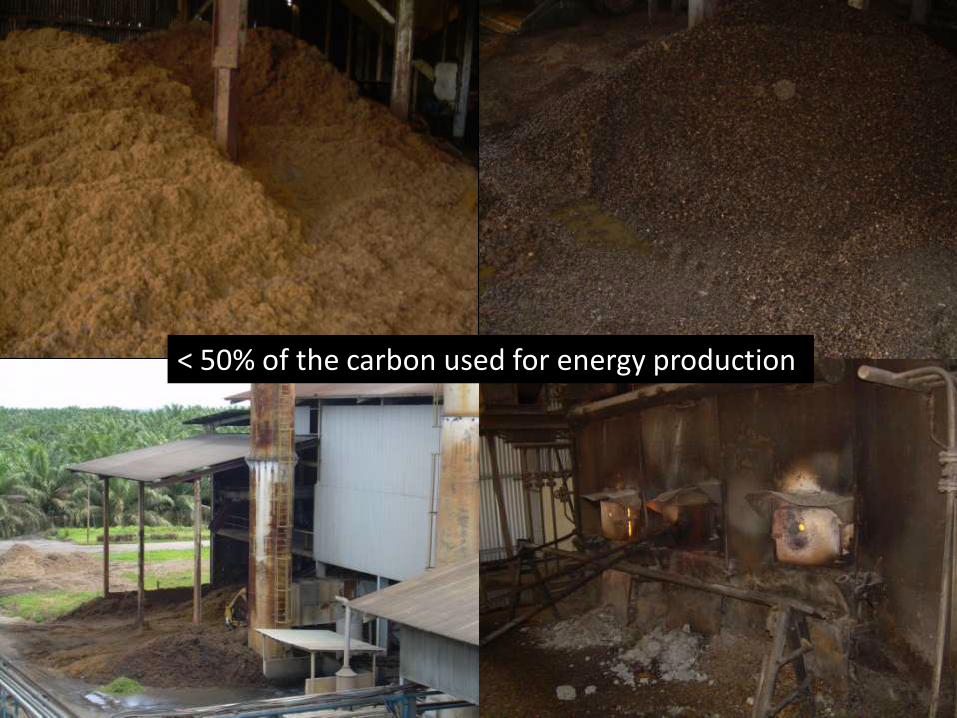
< 50% of the carbon used for energy production
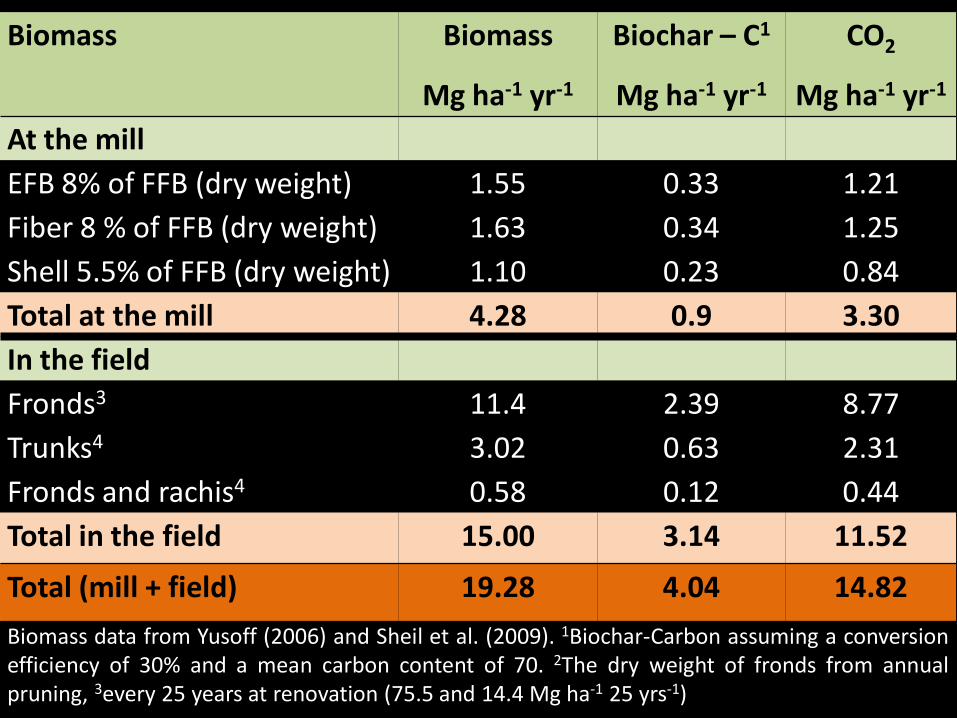
Biomass Biomass
Mg ha-1 yr-1
Biochar – C1
Mg ha-1 yr-1
CO2
Mg ha-1 yr-1
At the mill
EFB 8% of FFB (dry weight) 1.55 0.33 1.21
Fiber 8 % of FFB (dry weight) 1.63 0.34 1.25
Shell 5.5% of FFB (dry weight) 1.10 0.23 0.84
Total at the mill 4.28 0.9 3.30
In the field
Fronds3 11.4 2.39 8.77
Trunks4 3.02 0.63 2.31
Fronds and rachis4 0.58 0.12 0.44
Total in the field 15.00 3.14 11.52
Total (mill + field) 19.28 4.04 14.82
Biomass data from Yusoff (2006) and Sheil et al. (2009). 1Biochar-Carbon assuming a conversionefficiency of 30% and a mean carbon content of 70. 2The dry weight of fronds from annualpruning, 3every 25 years at renovation (75.5 and 14.4 Mg ha-1 25 yrs-1)

EFB1 EFB2
Carbonized
EFB
Compost1
N (%) 1.25 1.45 2.86
P (%) 0.11 0.31 0.34
K (%) 2.07 5.93 2.30
Ca (%) 0.42 0.54 1.27
Mg (%) 0.20 0.40 0.63
Table 2 Nutrient concentrations in EFB, carbonized EFB and EFB Compost
1Source (Salétes et al. 2004b) co-composted with nutrient rich POME, 2Carbonized at 500°C University of Georgia
Palm Oil Sector nutrient cycling
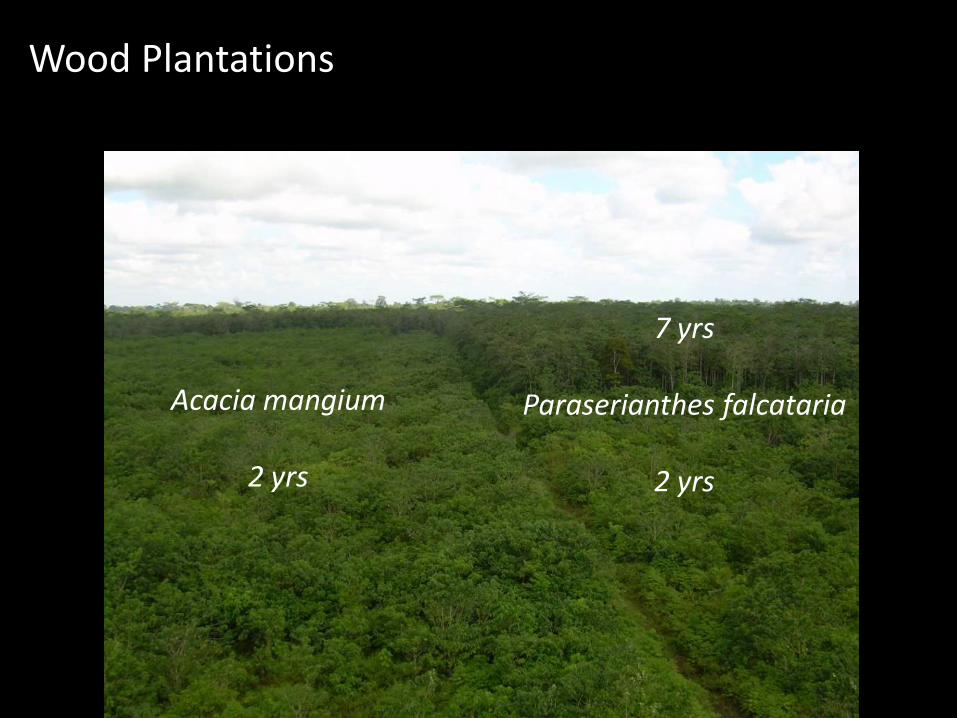
7 yrs
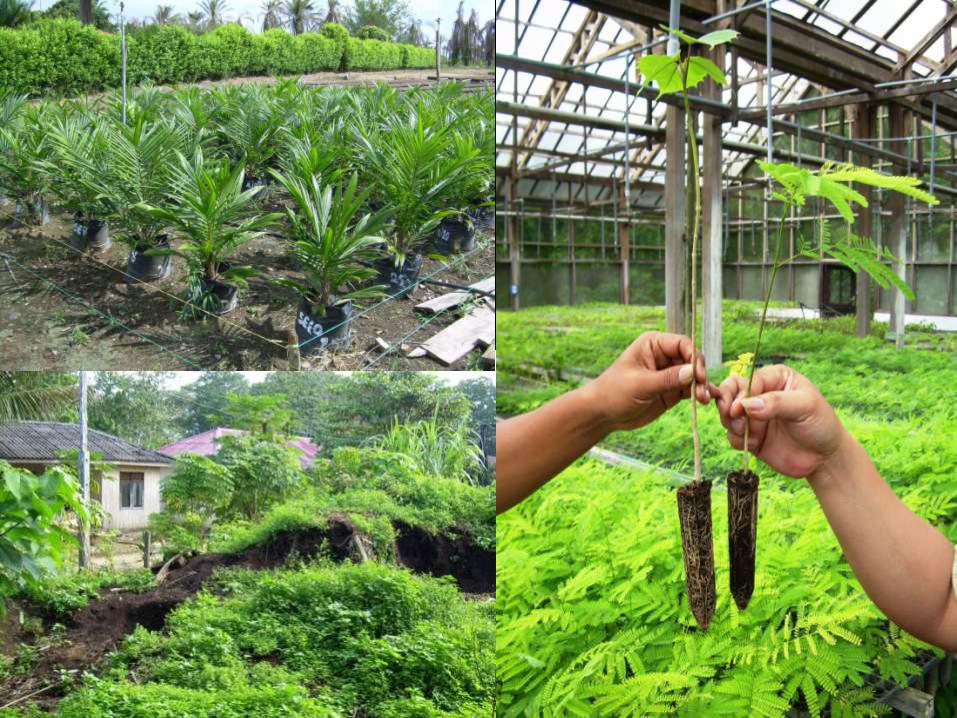
Paraserianthes falcataria
2 yrs
Acacia mangium
2 yrs
Wood Plantations
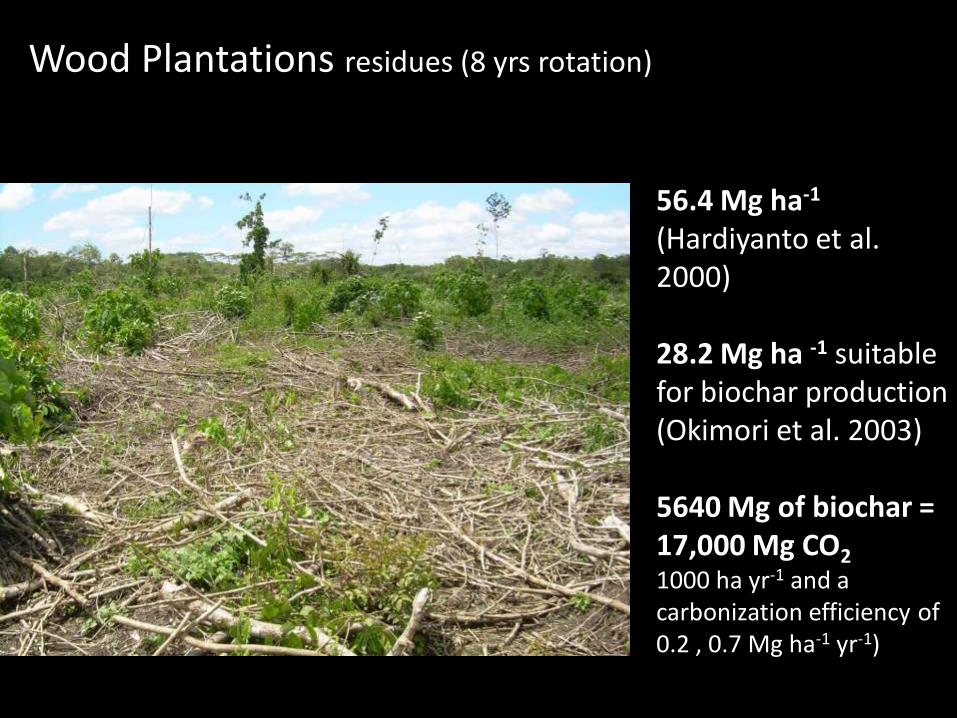
Wood Plantations residues (8 yrs rotation)
56.4 Mg ha-1
(Hardiyanto et al. 2000)
28.2 Mg ha -1 suitable for biochar production (Okimori et al. 2003)
5640 Mg of biochar = 17,000 Mg CO21000 ha yr-1 and a carbonization efficiency of 0.2 , 0.7 Mg ha-1 yr-1)

Logging Concessions
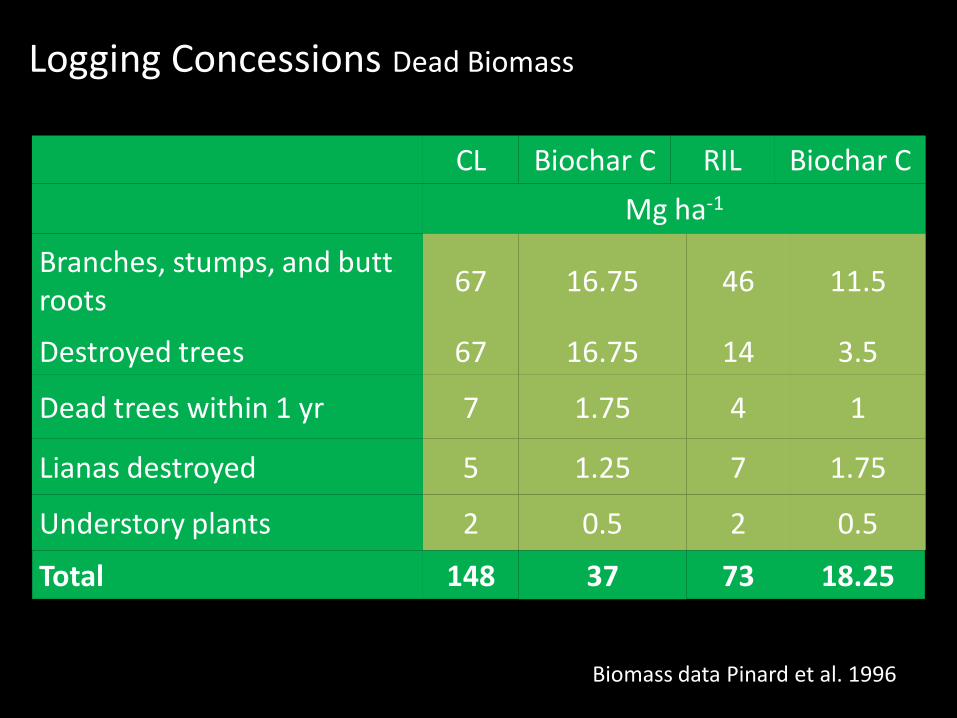
CL Biochar C RIL Biochar C
Mg ha-1
Branches, stumps, and butt roots
67 16.75 46 11.5
Destroyed trees 67 16.75 14 3.5
Dead trees within 1 yr 7 1.75 4 1
Lianas destroyed 5 1.25 7 1.75
Understory plants 2 0.5 2 0.5
Total 148 37 73 18.25
Biomass data Pinard et al. 1996
Logging Concessions Dead Biomass
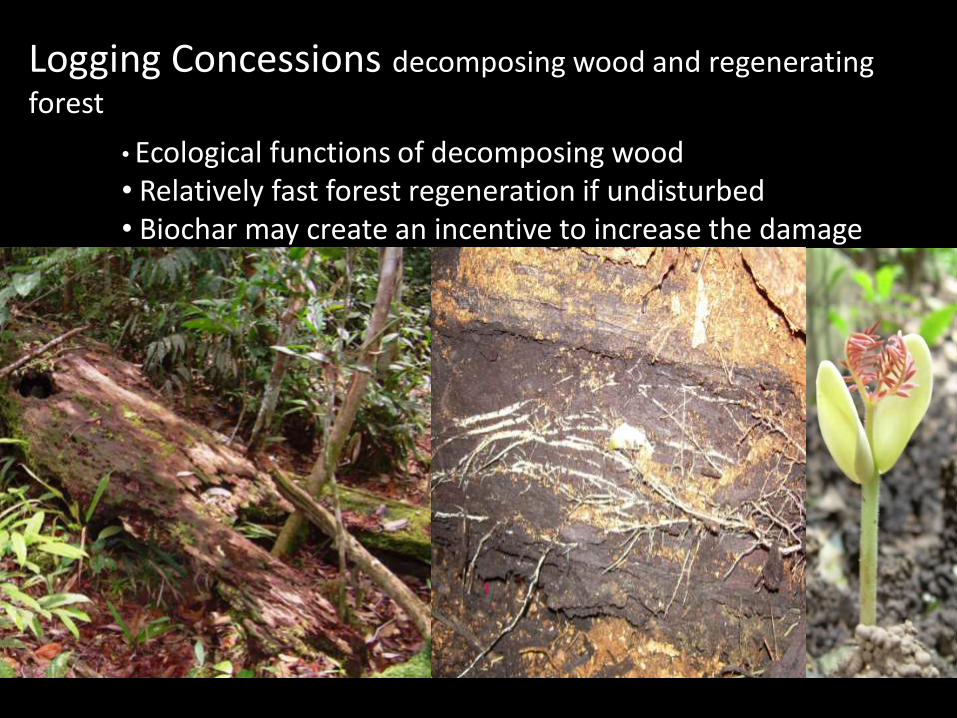
Logging Concessions decomposing wood and regenerating
forest
• Ecological functions of decomposing wood• Relatively fast forest regeneration if undisturbed• Biochar may create an incentive to increase the damage

Logging Concessions areas of degradation
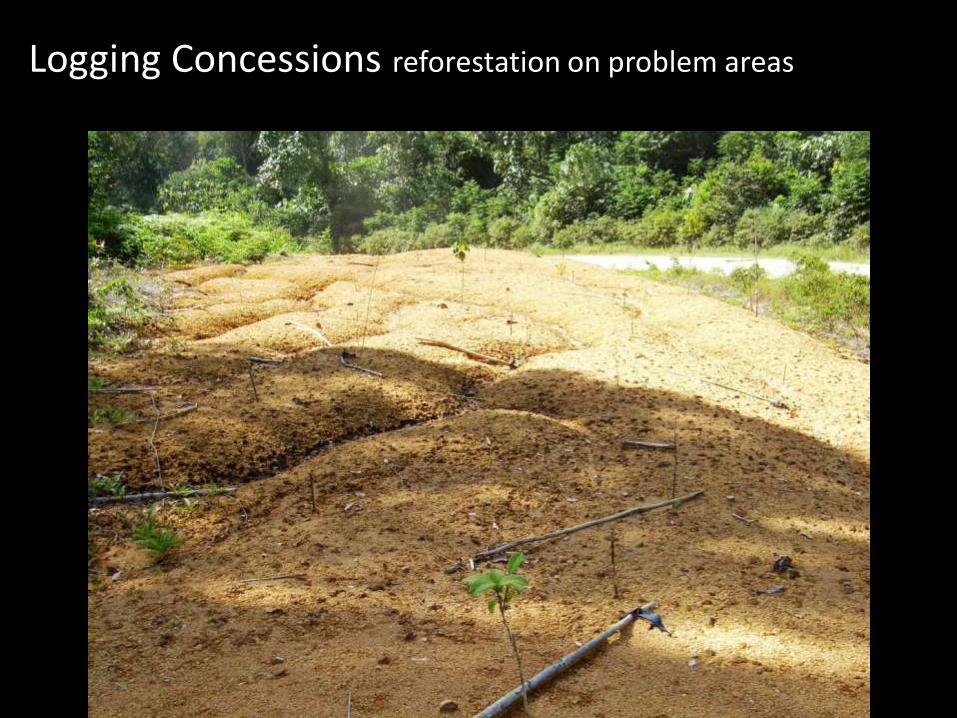
Logging Concessions reforestation on problem areas
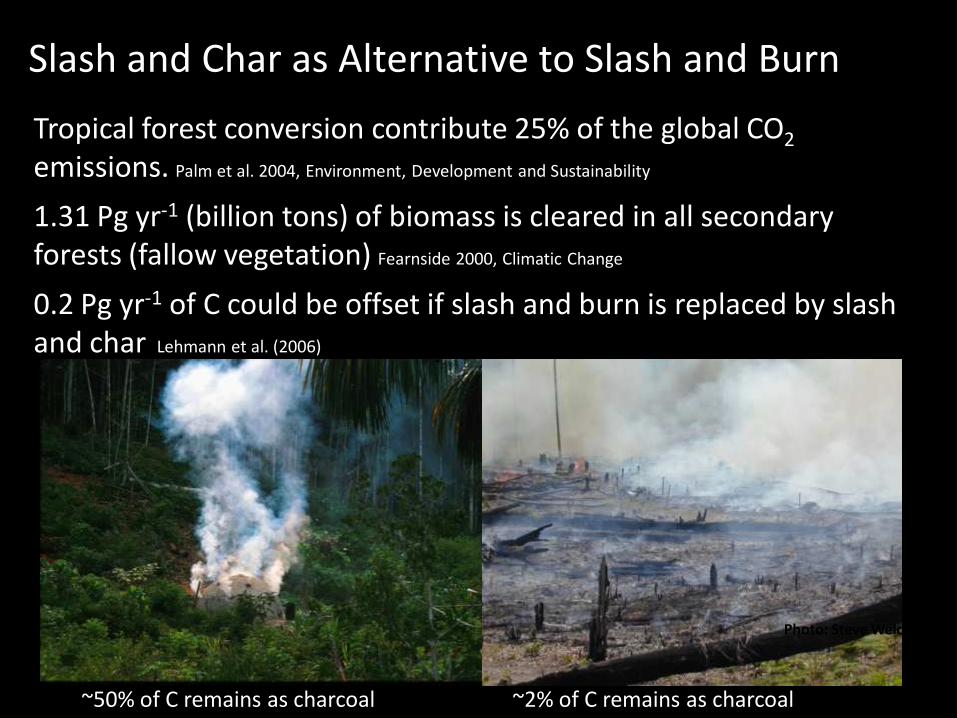
Tropical forest conversion contribute 25% of the global CO2
emissions. Palm et al. 2004, Environment, Development and Sustainability
1.31 Pg yr-1 (billion tons) of biomass is cleared in all secondary forests (fallow vegetation) Fearnside 2000, Climatic Change
~50% of C remains as charcoal ~2% of C remains as charcoal
Photo: Steve Welch
Slash and Char as Alternative to Slash and Burn
0.2 Pg yr-1 of C could be offset if slash and burn is replaced by slash and char Lehmann et al. (2006)
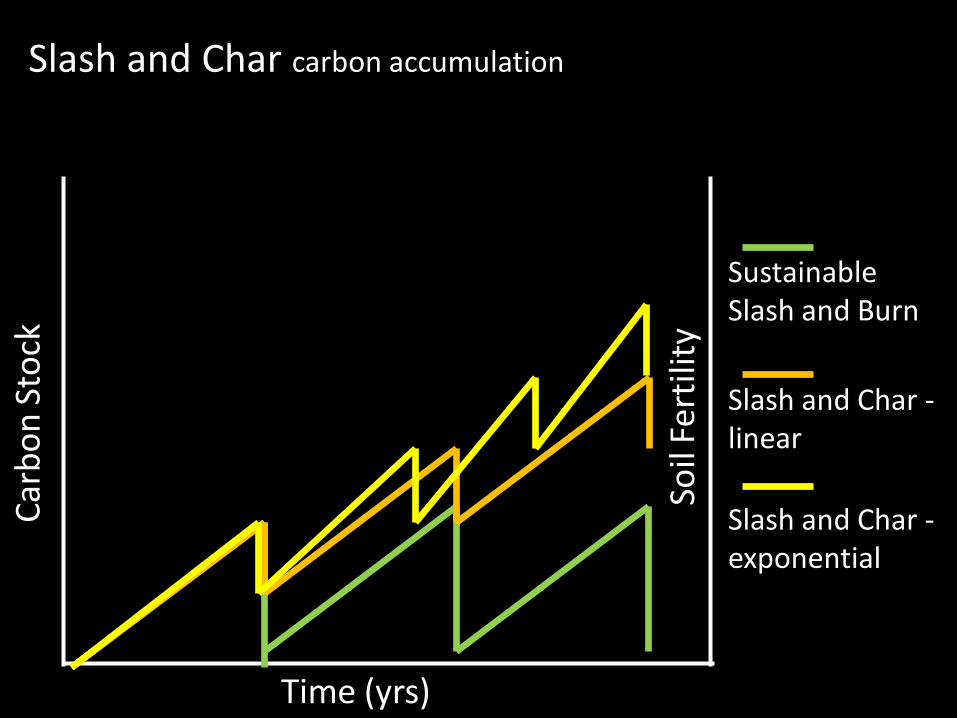
Car
bo
n S
tock
Soil
Fert
ility
Time (yrs)
Sustainable Slash and Burn
Slash and Char -linear
Slash and Char -exponential
Slash and Char carbon accumulation
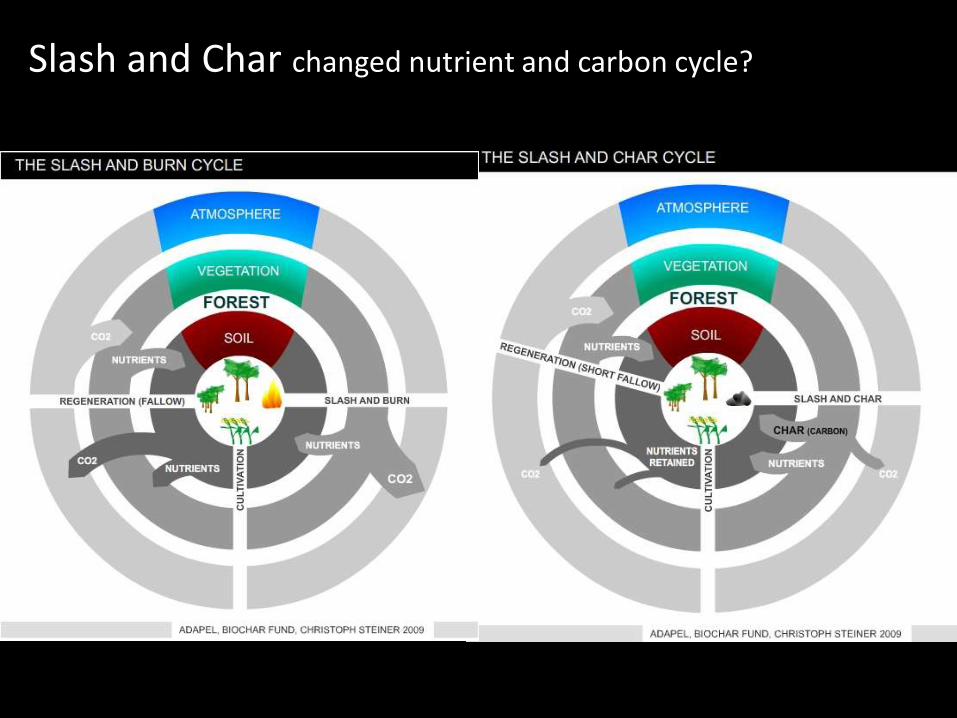
Slash and Char changed nutrient and carbon cycle?
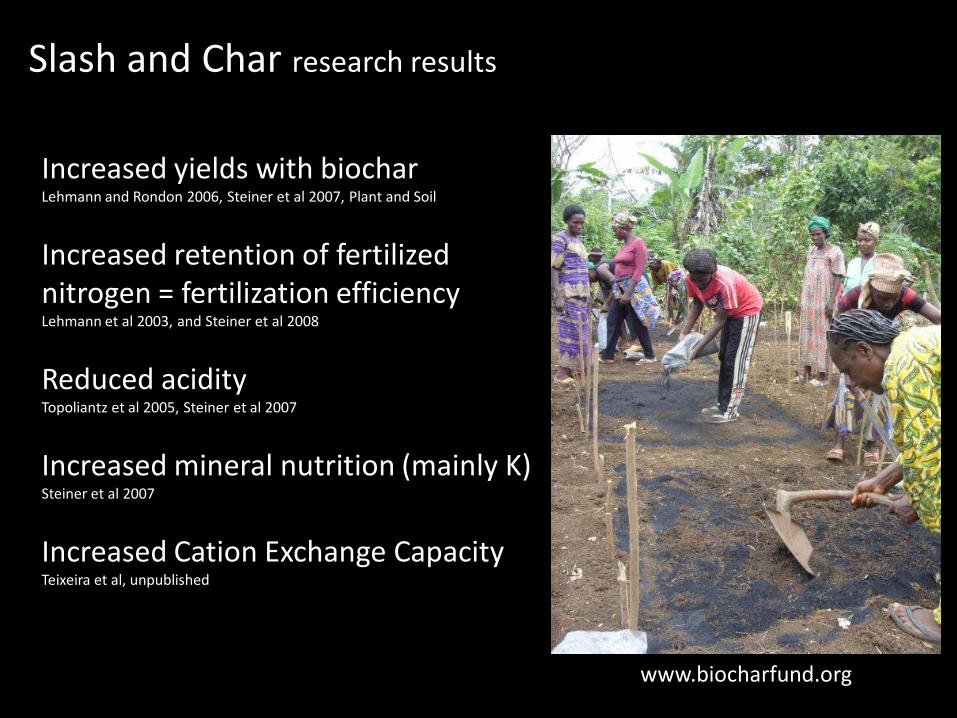
Increased yields with biochar Lehmann and Rondon 2006, Steiner et al 2007, Plant and Soil
Increased retention of fertilized nitrogen = fertilization efficiencyLehmann et al 2003, and Steiner et al 2008
Reduced acidityTopoliantz et al 2005, Steiner et al 2007
Increased mineral nutrition (mainly K) Steiner et al 2007
Increased Cation Exchange CapacityTeixeira et al, unpublished
www.biocharfund.org
Slash and Char research results
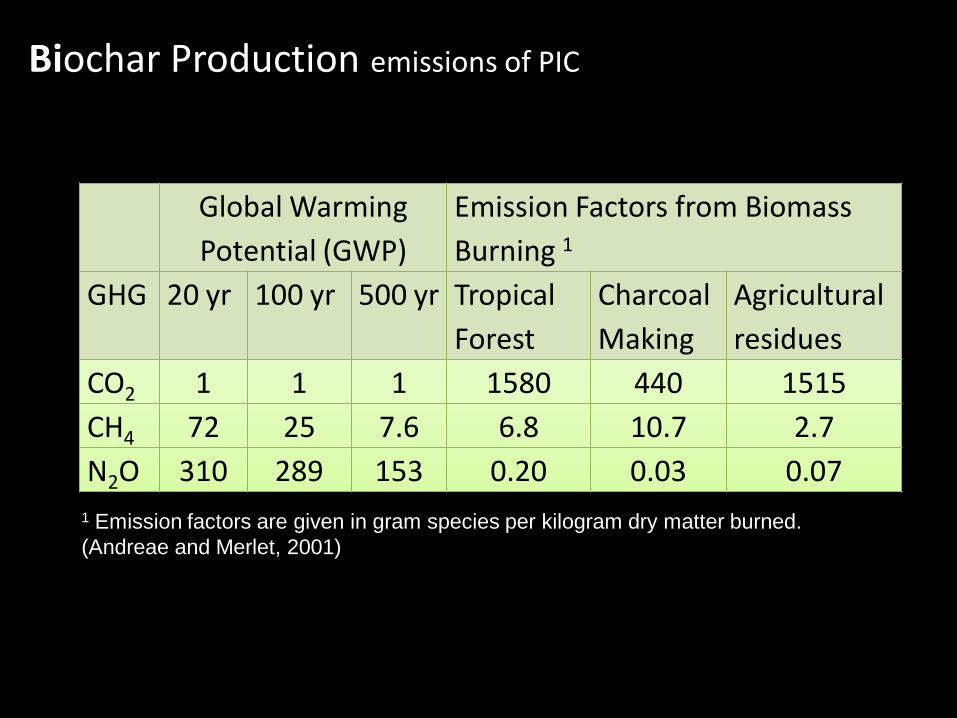
Biochar Production emissions of PIC
Global Warming
Potential (GWP)
Emission Factors from Biomass
Burning 1
GHG 20 yr 100 yr 500 yr Tropical
Forest
Charcoal
Making
Agricultural
residues
CO2 1 1 1 1580 440 1515
CH4 72 25 7.6 6.8 10.7 2.7
N2O 310 289 153 0.20 0.03 0.07
1 Emission factors are given in gram species per kilogram dry matter burned.
(Andreae and Merlet, 2001)
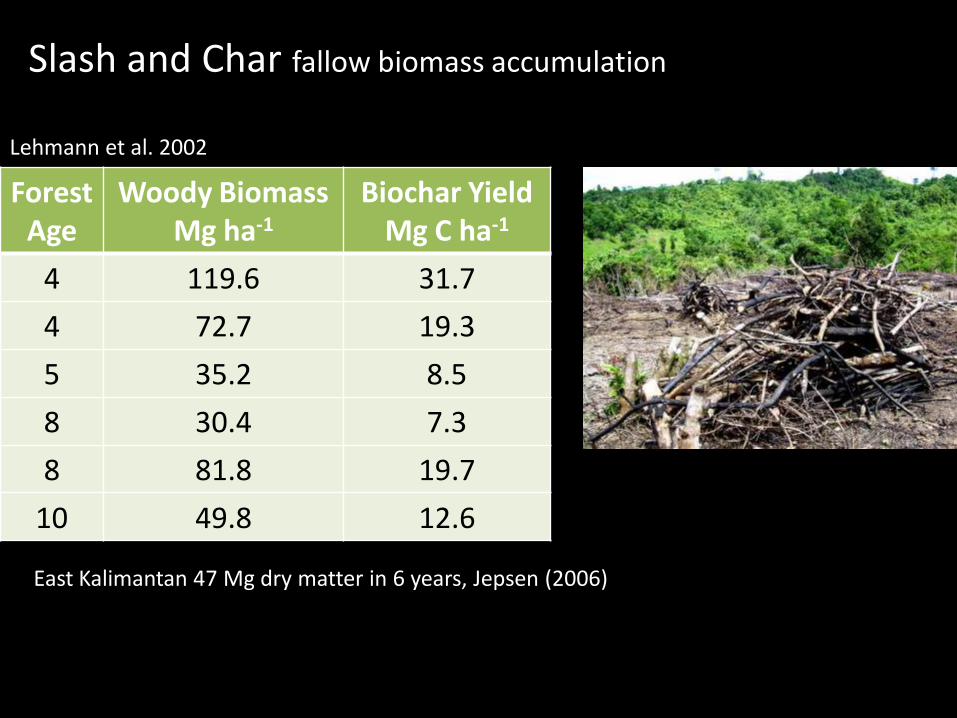
Slash and Char fallow biomass accumulation
Lehmann et al. 2002
ForestAge
Woody BiomassMg ha-1
Biochar YieldMg C ha-1
4 119.6 31.7
4 72.7 19.3
5 35.2 8.5
8 30.4 7.3
8 81.8 19.7
10 49.8 12.6
East Kalimantan 47 Mg dry matter in 6 years, Jepsen (2006)
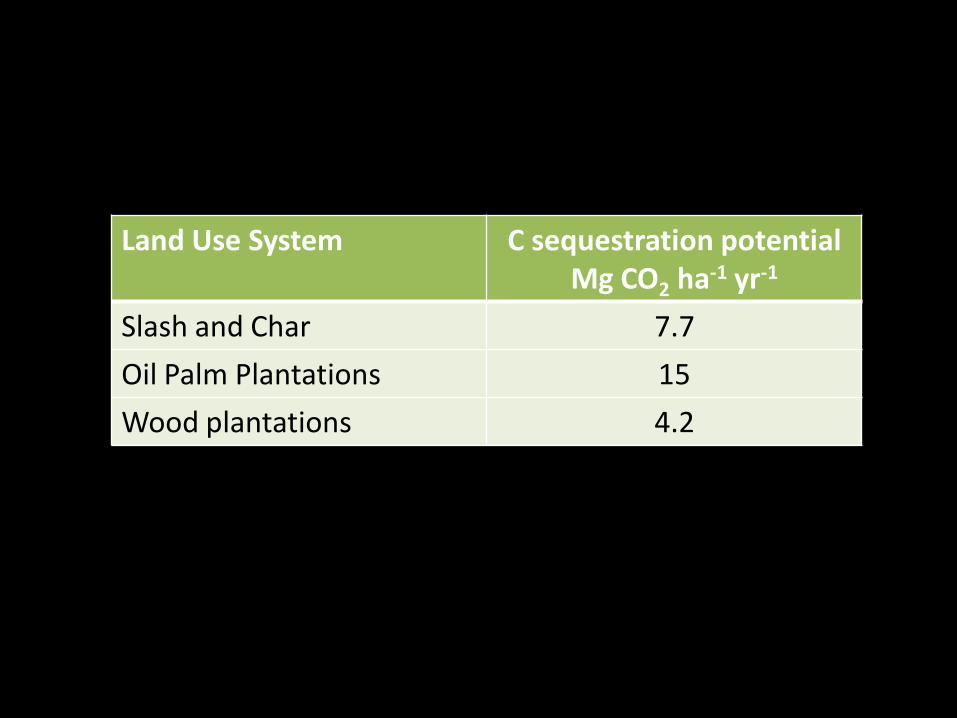
•7.7 Mg of CO2 ha-1 yr-1 if slash-and-burn is replaced by slash-and-char•15 Mg of CO2 ha-1 yr-1 if all available residues are carbonized in oil palm plantations•4.2 Mg of CO2 ha-1 yr-1 if all available residues are carbonized in wood plantations and,•Range from 66 to 136 Mg of CO2 ha-1 if all available residues are carbonized after logging operations.
Land Use System C sequestration potentialMg CO2 ha-1 yr-1
Slash and Char 7.7
Oil Palm Plantations 15
Wood plantations 4.2
Charcoal Carbon Sequestration & and Carbon Trade

Biochar Carbon Sequestration
Common LULUCF obstacles Biochar advantage
Additionality Biochar competes with charcoal
Permanence(in particular in a changing climate)
Biochar is recalcitrant independent from climate and management
Leakage Unlikely if only waste or wasted biomass is used
Land tenure(in particular for fallow plots)
Once in the soil it does not matter if ownership changes
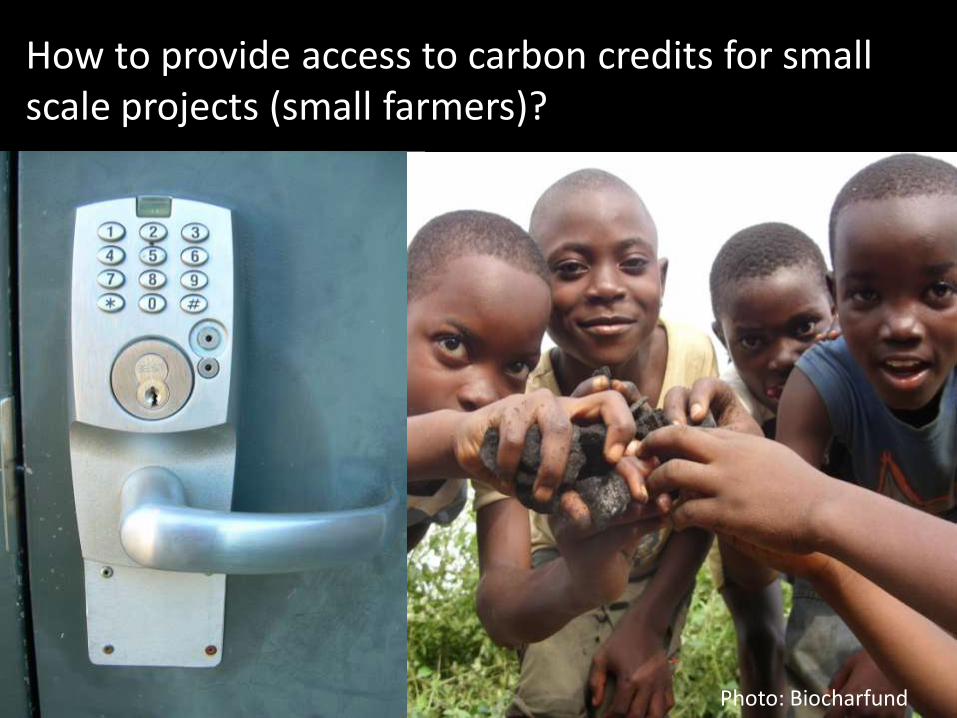
How to provide access to carbon credits for small scale projects (small farmers)?
Photo: Biocharfund
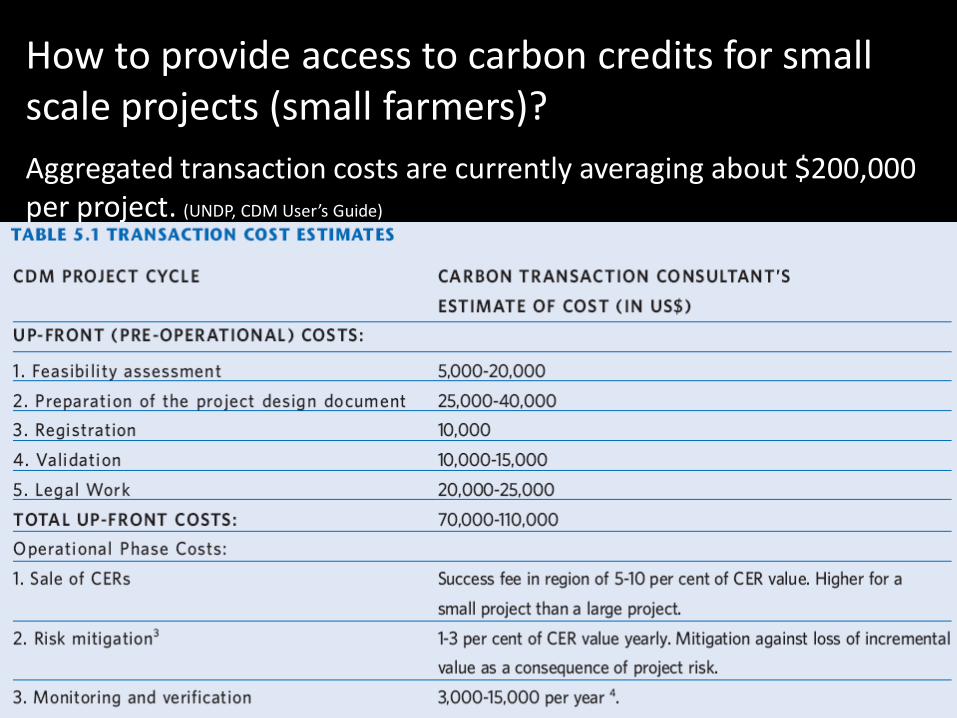
How to provide access to carbon credits for small scale projects (small farmers)?
Aggregated transaction costs are currently averaging about $200,000 per project. (UNDP, CDM User’s Guide)

Slash and Char obstacles
Monitoring
Reporting
Verification
Fertilizer in exchange for biochar? Income form agriculture not from carbon sequestration
Implementation costs – ex-ante-credits
Community monitoring as applied in REDD programs
Thanks to Supporters