Embed Size (px)
Citation preview

1
Biochar application rate affects biological nitrogen fixation in red clover conditional on
potassium availability.
2
S. Mia1, J.W. van Groenigen1, T.F.J. van de Voorde2, N.J. Oram1,2, T.M. Bezemer3, L.
Mommer2, S. Jeffery1
1Department of Soil Quality, Wageningen University, PO BOX 47, 6700 AA Wageningen,
The Netherlands
2Nature Conservation and Plant Ecology group, Wageningen University, PO Box 47,
Wageningen, 6700 AA, The Netherlands
3Department of Terrestrial Ecology, Netherlands Institute of Ecology (NIOO-KNAW), PO
Box 50, Wageningen, 6700 AB, The Netherlands
Corresponding author
Dr. Simon Jeffery, Department of Soil Quality, Wageningen University, P.O. Box 47, 6700
AA Wageningen, The Netherlands, Email:[email protected]
Phone: +31 317 85749
Keywords: Biochar; biological nitrogen fixation; soil; 15N; stable isotope probing; red clover
3
Abstract
Increased biological nitrogen fixation (BNF) by legumes has been reported following biochar
application to soils, but the mechanisms behind this phenomenon remain poorly elucidated.
We investigated the effects of different biochar application rates on BNF in red clover
(Trifolium pratense L.) Red clover was grown in mono or mixed cultures with red fescue
grass (Festuca rubra L.) and plantain (Plantago lanceolata L.) at a range of different biochar
application rates (0, 10, 50 and 120 t ha-1). In a separate experiment, nutrient effects of
biochar on BNF were investigated using nitrogen, phosphorous and potassium (N, P, K) and
micronutrient fertilisation using the same plant species.
Biochar addition increased BNF and biochar applied at a rate of 10 t ha-1 led to the highest
rate of BNF. Total biomass also showed the greatest increase at this application rate. An
application rate of 120 t ha-1 significantly decreased biomass production in both single and
mixed cultures when compared to the control, with the greatest reduction occurring in red
clover. Furthermore, BNF was significantly higher in pots in which red clover was grown in
mixed cultures compared to monocultures. In the absence of biochar, K fertilization caused a
significant increase in BNF. For N, P, and micronutrient fertilization, BNF did not
significantly differ between treatments with and without biochar addition.
We conclude that different biochar applications rates lead to different effects in terms of BNF
and biomass production. However, due to the high variety of biochar properties, different
application rates should be investigated on a case specific basis to determine the optimum
biochar application strategies.
4
1. Introduction
Biochar is charcoal which is made with the intention of applying it to soil. Biochar is
often claimed to have several potential benefits, including carbon sequestration (Laird, 2008;
Zimmermann et al., 2012); bioenergy generation (Laird, 2008; Lehmann, 2007); adsorbing
organic and inorganic pollutants (Hale et al., 2011; Jiang, 2012) as well as improving soil
fertility (Jeffery et al., 2011; Spokas et al., 2012).
Soil fertility effects have been explained in terms of inherent nutrient addition with
biochar (Parvage et al., 2013) as well as by biochar-induced changes in soil physical, chemical
or biological properties (Kookana et al., 2011; Oguntunde et al., 2008; Thies and Rilling,
2009). However, the mechanisms behind the observed yield effects remain unclear.
Hypotheses for these effects include improved fertilizer use efficiency by reducing loss of
nutrients through leaching (Blackwell et al., 2010; Laird et al., 2010) or increased nutrient
availability due to increased microbial activity, such as arbuscular mycorrhizal fungi (AMF)
(Warnock et al., 2007). Some studies also suggest that biochar addition to soil can enhance
soil fertility through increased biological nitrogen fixation (BNF) when legumes are present
(Nishio, 1996; Rondon et al., 2007). However, the mechanisms behind this effect also remain
unclear.
Biological nitrogen fixation is estimated to contribute approximately 17.2 × 10⁷ tonnes
of nitrogen to soils globally each year (Ishizuka, 1992). Leguminous crops have been
estimated to contribute approximately half of the global symbiotic BNF at an estimated 21.5 ×
106 tonnes (Herridge et al., 2008). This demonstrates that BNF is an important ecosystem
service for global agriculture and as such understanding the possible impacts of biochar
application on this service is vital.
Different mechanisms for the observed effect of biochar on symbiotic BNF have been
proposed. These include:
5
• Immobilisation of inorganic N, which is known to stimulate BNF (Rondon et al.,
2007), (Bruun et al., 2011; Nelissen et al., 2012).
• Increased nodulation, which has been observed in white clover (Trifolium repens)
(Rillig et al., 2010), soybean (Glycine max) (Ogawa and Okimori, 2010; Tagoe et al.,
2008) and alfalfa (Medicago sativa) (George et al., 2012).
• Increased P bioavailability (Brewer et al., 2012; Nelson et al., 2011) which has been
correlated with increased BNF in several legumes: soybean (Tagoe et al., 2008),
common bean (Phaseolus vulgaris) (Rondon et al., 2007) and alfalfa (Nishio and
Okano, 1991).
• Interactions between biochar and signalling for nodulation through adsorption of
flavonoids and Nod-factors (Thies and Rilling, 2009).
• Increased pH, as claimed for the case of soybean (Ogawa and Okimori (2010).
• Introduction of macro and micro nutrients (Brewer et al., 2012; Major et al., 2010;
Rondon et al. (2007), which may be beneficial to legumes. Further, as biochar
application generally raises soil pH (Hass et al., 2012) micronutrient availability (e.g.
Fe and Mn) can also be affected.
There is still a dearth of data on the effects of biochar application to soil on
BNF in temperate regions. Furthermore, different effects have been reported with different
application rates. For example, increasing biochar application rates has been found to increase
BNF (Ogawa and Okimori, 2010; Rondon et al., 2007; Tagoe et al., 2008). However, reduced
nodulation has also been reported with elevated application rates, even though nitrogenase
activity remained unchanged (Quilliam et al., 2013). The mechanisms behind these changes in
BNF remain largely hypothetical. Therefore, there is an urgent need to better understand the
mechanisms by which biochar application affects BNF in order to allow robust predictions to
6
be made. Natural abundance 15N analysis (Unkovich et al., 1994) provides an effective means
of quantifying BNF and as such is a useful tool for investigating such mechanisms.
We formulated five hypotheses regarding the mechanism behind the effects of biochar
on BNF in red clover (Trifolium pratense L.):
H1: Increasing application rates of biochar will increase BNF
H2: N application will negate the effect of biochar on BNF
H3, H4, H5: Fertilization with K (H3), P (H4), or micronutrient fertilizer (H5) will
increase BNF to the same level as with biochar.
Two separate microcosm experiments were conducted to test these hypotheses
by examining how biochar and fertilization affected plant growth of leguminous and non-
leguminous plants.
2. Materials and Methods
2.1 Soil and biochar
The biochar was produced from aboveground plant biomass collected from a species-
rich grassland in the nature reserve area De Mossel at Planken Wambuis, Ede, the Netherlands
(+52° 3' 34.03", +5° 45' 2.81") via pyrolysis at 400°C. Soil was collected from the same
location, air dried, homogenised by sieving through an 8 mm sieve and mixed thoroughly.
Selected soil and biochar properties are presented in Table 1 and Table 2.
The homogenised soil was split between two experiments, described below. Pots filled
with soil were incubated for 14 days under a polyethylene sheet to germinate weeds and to
allow equilibration of the biochar-soil mixture. All seedlings that emerged from the seed bank
were removed.
2.2 Experimental set-up
Two experiments were conducted to test the five hypotheses stated in the introduction
(H1-H5). Experiment I investigated the effects of increasing biochar application rate on BNF
7
to test H1. Experiment II investigated the effect of individual fertilizer (N, P, K and
micronutrients) in presence and absence of biochar on BNF to test H2-5. Both experiments
were set up in a randomized complete block design with five replicates for each treatment.
2.2.1 Experiment I
The experiment was carried out from 23rd May to 18th July, 2012 in a greenhouse at
Unifarm of Wageningen University, Wageningen, the Netherlands. The experiment included
two factors, biochar application rate and plant species composition.
Five biochar application rates were used: 0 (control), 1, 10, 50 and 120 t ha-1(w/w
equivalents) of biochar. The biochar was incorporated into the top 10 cm. The rates were
calculated as a soil: biochar ratio using an assumed bulk density of 1.3 g cm-3 and assuming
that the biochar would have been mixed homogenously through the top 10 cm of the soil. This
allowed the calculation of a soil: biochar ratio (w/w) comparable to biochar applied in the
field. A soil:biochar mixture of the appropriate ratio for each application rate was then used
for filling pots for each application rate. In order to maintain the same final potting volume for
all treatments, the volume of soil was adjusted as needed in order to keep the total volume of
the soil: biochar mixture and hence the potential rooting depth of the plants the same for all
treatments. An amount of 1.75 kg soil-biochar mixture for 0, 1, 10 t ha-1, 1.60 kg for 50 t ha-1
and 1.50 kg for 120 t ha-1 was loaded into pots of 15 cm diameter × 13 cm height.
Red clover (T. pratense) and red fescue grass (F. rubra), both being common
grassland species in Northern Europe, were planted in single and mixed stands. The seeding
densities were equivalent to 952 and 476 kg ha-1 for grass and clover in single stands, and
equivalent to 476 and 238 kg ha-1 for grass and clover in two species mixed stands. Previous
experiments have shown that these seedling densities produce fairly even biomass of the two
species when grown in mixed stands. Plants were harvested once after 45 days.
8
The pots were maintained at 60% water filled pore space throughout the experimental
period, and gravimetrically kept at constant moisture level on a daily basis. A germination
layer of 200 g soil (no biochar) was added to the surface of each pot to reduce the potentially
negative effect of biochar on germination of seeds (Rogovska et al., 2012).
2.2.2 Experiment II
Experiment II utilised the mesocosms described in Oram et al. (also published in this
special issue) This experiment included nine soil treatments in mixed stands of red fescue
grass (Festuca rubra L.), red clover (Trifolium pratense L.), and plantain (Plantago
lanceolata L.). The soil treatments were biochar, N, P, K, micronutrients fertilization, biochar
in combination with N, P, micronutrients and control (no amendment) (Table 1). The rate of
fertilizer applications were N- 50 kg ha-1; P- 30 kg ha-1; K- 50 kg ha-1 equivalents and for
micronutrients the rate was (B- 0.76 kg ha-1; Mn- 0.78 kg ha-1; Cu- 0.03 kg ha-1; Zn- 0.78 kg
ha-1; Mo- 0.016 kg ha-1). The rate of biochar was 10 t ha-1 assuming the top 10 cm as soil
depth and a bulk density of 1.3 g cm-3.
We used Mitscherlich pots (diameter: 19 cm, height: 22 cm; filled with 7.0 kg dry
soil). Each pot had three layers: a bottom layer with 4.5 kg of soil, a middle layer with 1.5 kg
of soil and a top layer (germination layer) with 1.0 kg of soil. Biochar was mixed thoroughly
in both top and middle layer, resulting in a 10 cm biochar/soil layer, while fertilizers were
mixed only with the middle layer consisting of 1.5 kg soil which was then covered with a top
layer consisting of 1.0 kg of soil to function as a germination layer.
Two plant species were then sown; red fescue grass (Festuca rubra L.) and red clover
(Trifolium pratense L.). The seeding densities were equivalent to 952 and 476 kg ha-1 for
grass and clover in single stands and 476 and 238 kg ha-1 for grass and clover in the two
species mixed stands, the same as for Exp. I. Pots were maintained at 60% water filled pore
9
space throughout the experimental period, by watering daily and reweighing. Every week,
pots were re-randomized within blocks.
The effects of biochar application and nutrients on plant biomass are reported in more
detail in Oram et al. (in this special issue). Here we report the effect of individual nutrients (N,
50 kg ha-1; P, 30 kg ha-1; K, 50 kg ha-1 equivalents) and micronutrients (B, 0.34 mg kg-1; Mn,
0.35 mg kg-1; Cu, 0.014 mg kg-1; Zn, 0.35 mg kg-1; Mo, 7.5 µg kg-1) on BNF in the presence
and absence of biochar using nine soil treatments in mixed stands of clover, grass and
plantain. The soil treatments were biochar, N, P, K, micronutrients fertilization, biochar in
combination with N, P, micronutrients and control (Table 1). Total aboveground biomass was
harvested twice; after 28 days and after 56 days of growth. Data of the summed biomass are
used.
2.3 Biomass measurements and nodule count
For both experiments, at harvest, aboveground biomass was sorted by hand to plant
species. Roots of each pot were cleaned with running water and manually sorted according to
species. Biomass was dried at 70°C for 72 hours and root and shoot dry weight was
determined for each species. For the roots of Experiment I, the total number of nodules per g
fresh weight of clover roots was determined for sub-samples of fresh root material. The
number of nodules g-1 dry root mass was subsequently calculated.
2.3 Plant analysis
Dry plant material from both harvests was sorted per species, ground, and combined at
a ratio based on percentage of total biomass harvested. Plant material was digested using a
sulphuric acid (H2SO4), hydrogen peroxide (H2O2) and Selenium (Se) digestion
(Temminghoff and Houba, 2004). N and P concentrations in the aboveground plant biomass
were quantified by segmented flow analysis (SFA) with a Skalar 6 channel SFA analyser.
2.4 Soil analysis
10
Before sowing (Experiment II) and at final harvest (Experiments I and II), five random
soil samples from each pot were collected using an auger (1.0 cm diameter). The soil samples
were combined to obtain a representative sample of each pot. The combined soil samples were
dried at 40°C for 72 hours and sieved to pass 5 mm before analysis. Soil pH (CaCl2) was
determined with a ratio of 1:10 (m/v) (ISO10390, 2005). Soil electrical conductivity (EC) was
measured with demineralized water 1:5(m/v) (Houba et al. 2000).
2.5 Stable isotopes
Use of natural abundance 15N analysis allows the identification of the source of
nitrogen present in legumes, and the proportion that it derived from the atmosphere (i.e.
through BNF) resp. from the soil N pool (Unkovich et al., 1994).
For 15N and 13C analysis (δ13C analysis was undertaken as an indicator of salinity
stress (Farquhar et al., 1989) which can occur due to salts in the ash which are added with the
biochar), whole samples of dried aboveground biomass of each species from each pot were
ground with a Cyclon Sample Mill. Subsamples (in case of Exp. II, samples from both the
first and final harvest combined proportionately; see Oram et al., in this special issue, for
further details) of the aboveground biomass were subsequently ball-milled. The milled
samples were then dried at 105°C for 24 hours. A subsample of 3-4 mg was placed in a tin
cup (8 mm × 5 mm) and the exact weight was recorded. The Stable Isotope Facility of UC-
Davis, Davis, California, USA determined the 14/15N and 12/13C ratios using a continuous flow
isotope ratio mass spectrometer (CF-IRMS, Europa Scientific, Crewe, UK).
The δ15N was calculated using the equation of Peoples et al. (1989). This allowed
calculation of the % of N derived from the atmosphere (%Ndfa; i.e. the portion of N obtained
through BNF). Grass was used as reference plant in the experiment with grass and clover
(Exp.-I), while the average δ15N value of grass and plantain was used in experiment with
11
grass, clover and plantain mixed stands (Exp. II). The lowest δ15N value (-1.958 for Exp. I and
-2.778 for Exp. II) in clover was approximated to be the B value in each of the experiments
(Eriksen and Høgh-jensen, 1998; Huss-Danell and Chaia, 2005). The amount of N fixed pot-1
was calculated using the equation of Handarson et al. (1987).
2.6 Statistical analysis
All statistical analyses were performed using SPSS (version 19: Scientific Graphing
Software, SPSS Inc. Chicago, IL). Both soil treatment and plant species combination were
included as fixed factors (two-way ANOVA) for Experiment I while soil treatment was used
as factor for Experiment II (one-way ANOVA). Blocking was included as a random factor
during analysis. Normality of data was checked with a Q-Q plot of residuals while Levene’s
test was used to check equal variance. Data of %Ndfa, number of nodules g-1 dry root, and EC
in Exp. I were log-transformed to achieve a normal distribution of residuals. Individual
comparisons were based on a Tukey HSD post-hoc test (P≤0.05).
3. Results
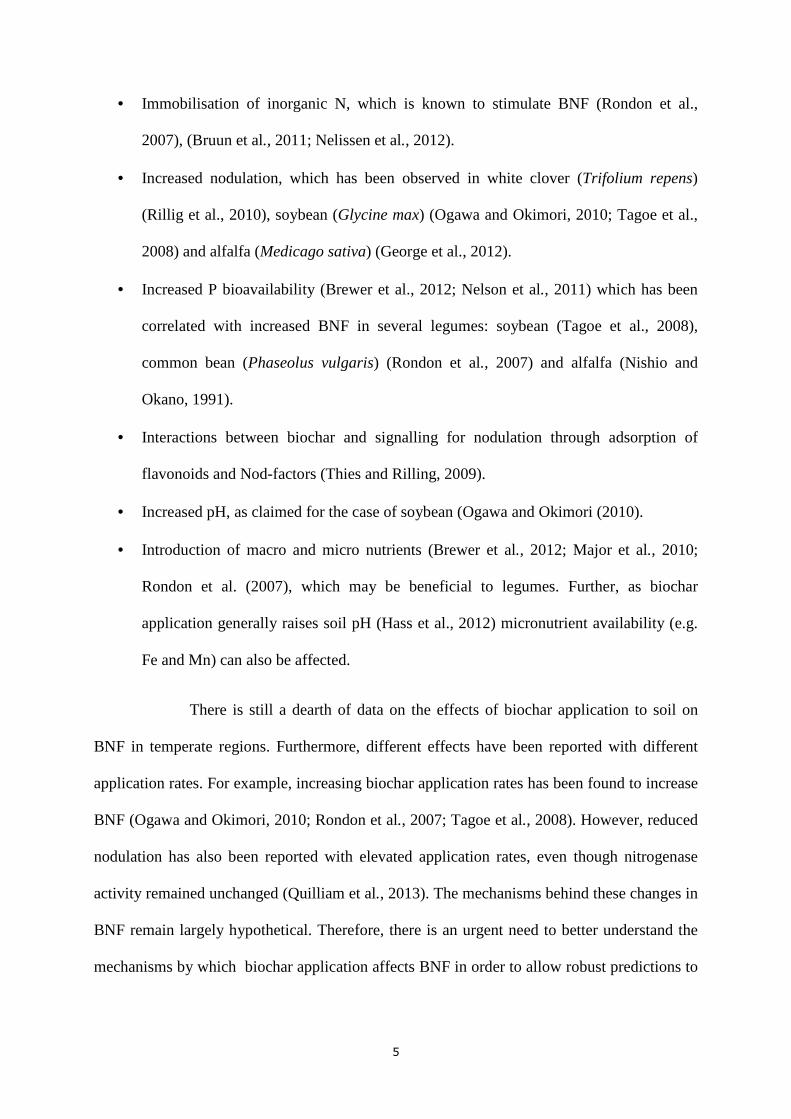
3.1 Experiment I: Biomass production at increasing biochar application rates
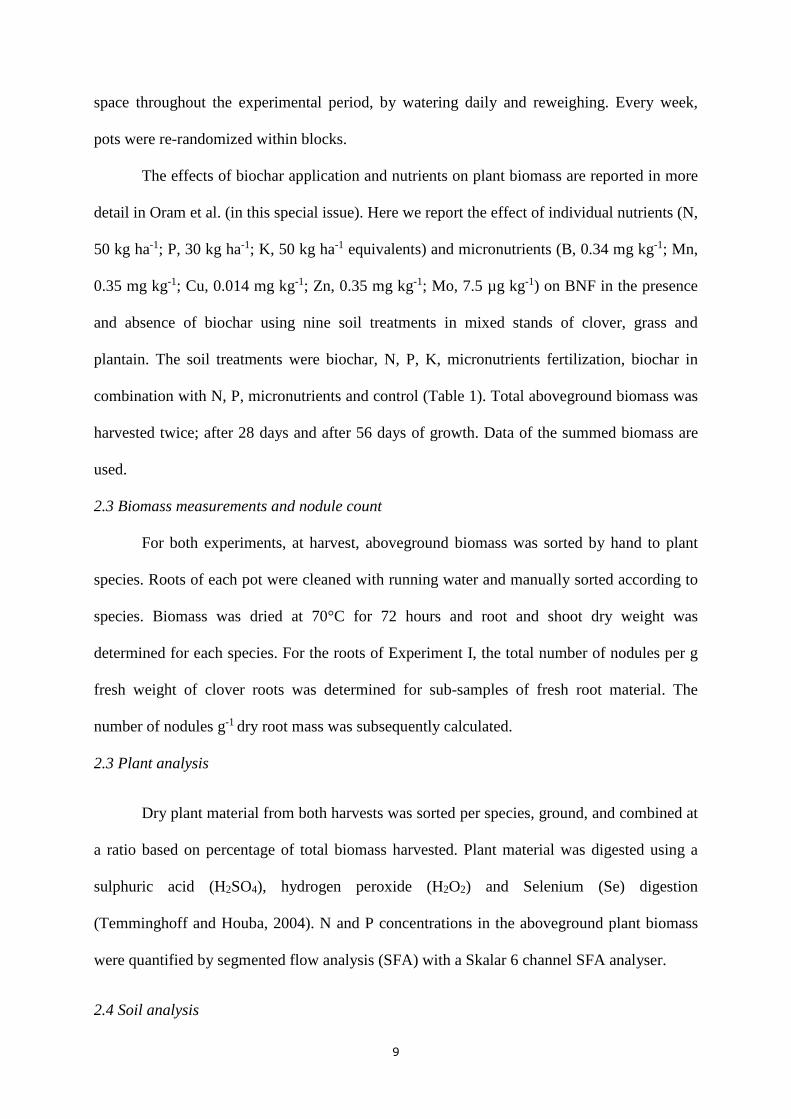
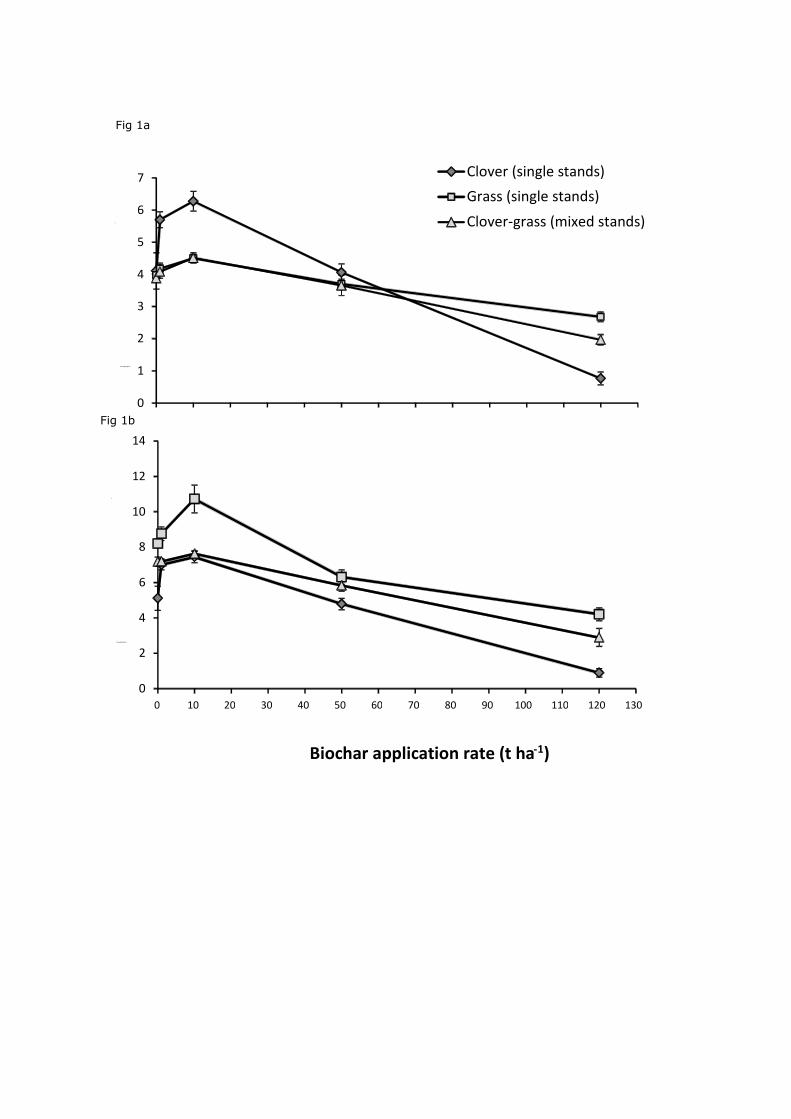
Both aboveground and total biomass production were significantly affected by biochar
application rate, plant species combination and their interaction (all P<0.01). In all instances
the largest increase in biomass in terms of both aboveground (Fig. 1a) and total biomass (Fig.
1b) occurred at 10 t ha-1 of biochar. At this rate, biomass was significantly higher than the
control (P<0.01 for aboveground biomass, P=0.02 for total biomass production). Furthermore,
the interaction between plant species and biochar application rate was significant (P<0.01)
indicating a differential response of plant species to different biochar application rates. This
can be seen in Fig. 1 where clover shows a stronger response to biochar application than
Festuca. At 50 t ha-1, none of the biomass results were significantly different from the control
(P>0.05). At 120 t ha-1, the biomass of clover, grass, and grass clover in mixed stands were
12
significantly reduced compared to the control (P<0.01). There were no significant differences
in the relative yield total (RYT) or the ratio of clover to grass in the mixed stands under
different biochar application rates (P=0.42 for RYT; P=0.12 for clover to grass ratio; data not
shown).
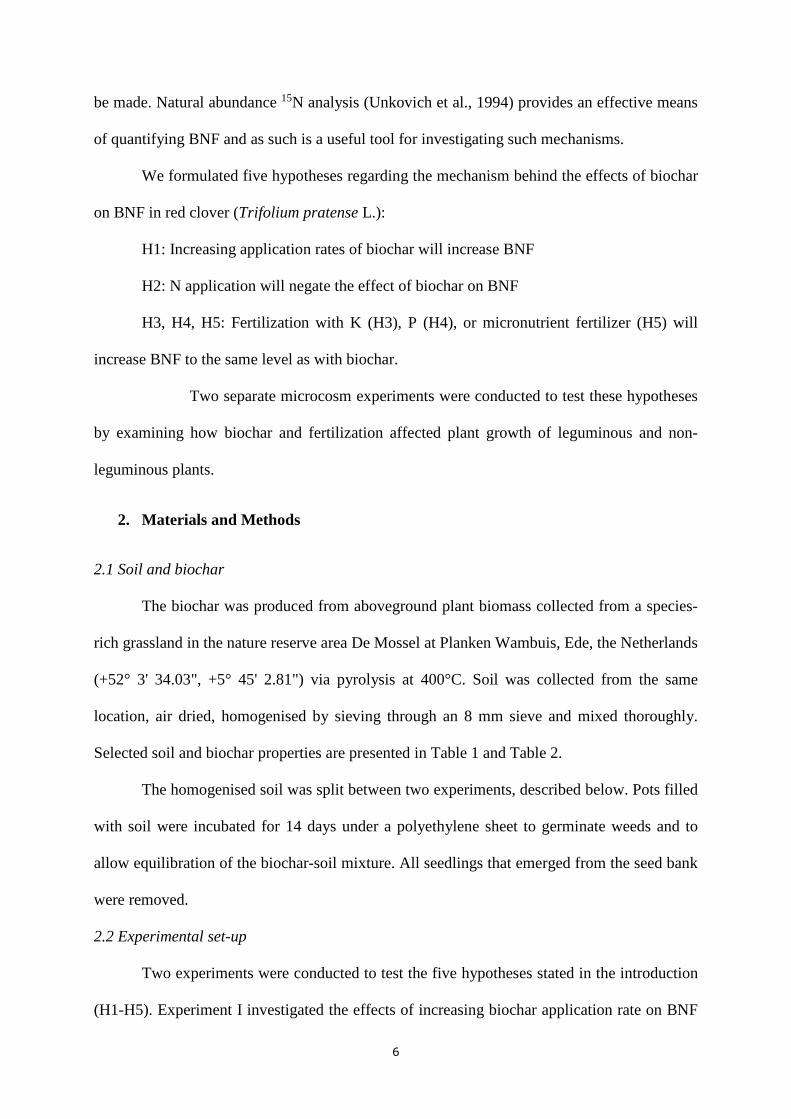
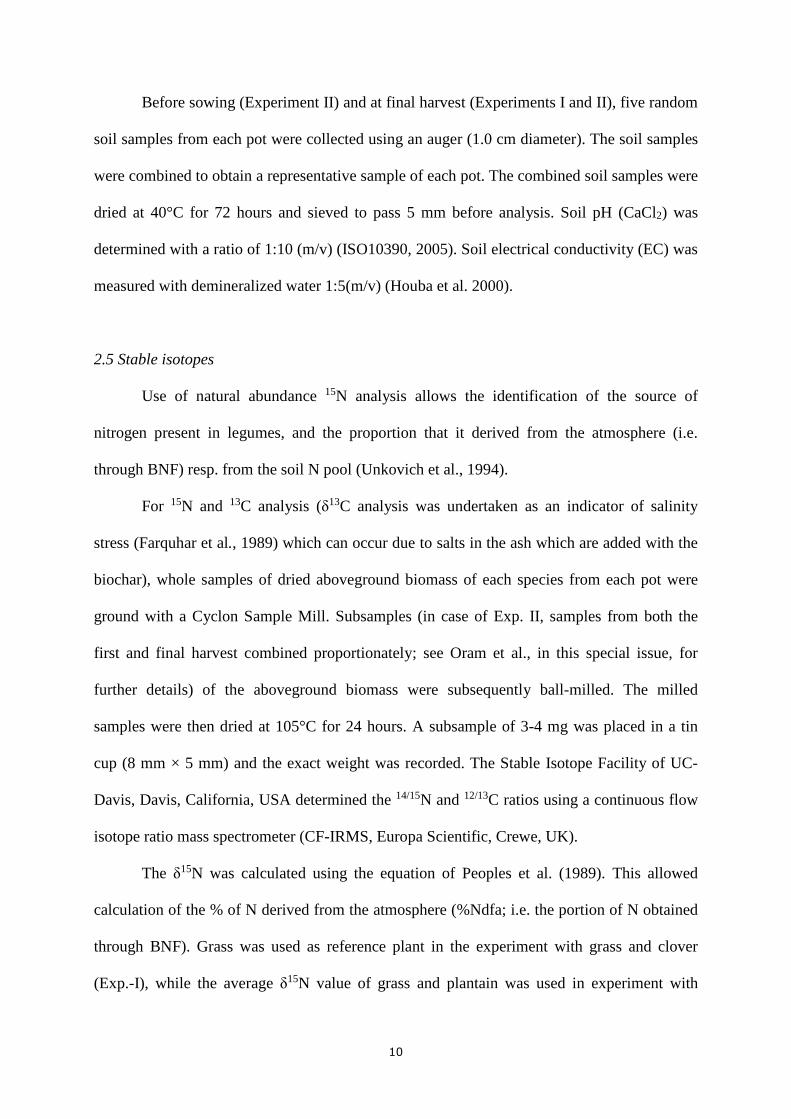
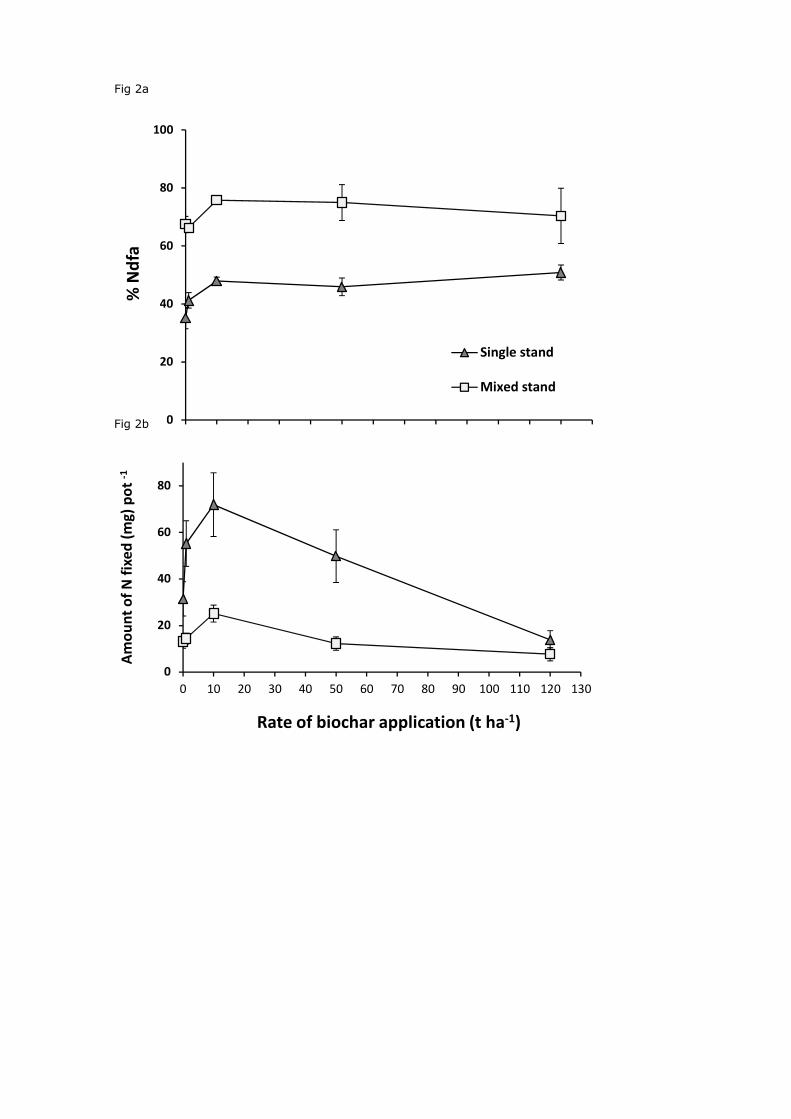
As with biomass, both %Ndfa and total amount N fixed per pot increased significantly
with applications of 10 t ha-1 (Fig. 2a and 2b; P=0.03 and P<0.01 respectively). The amount of
N fixed per pot was lowest at the application rate of 120 t ha-1. The %Ndfa did not change
significantly above 10 t ha-1 up to the rate of 120 t ha-1 (P>0.05), the maximum rate used in
this study. At 10 t ha-1, the amount of N fixed per pot (average of both single and mixed
stand) increased significantly by 117% (P<0.01), while %Ndfa increased significantly by16%
(Fig. 2a and 2b) when compared to controls (P<0.01). The %Ndfa increased significantly
when red clover was grown in mixed stands compared to the single stands (Fig 2a; P<0.01).
However, the total amount of N fixed per pot was reduced in the mixed stands at all
application rates when compared to red clover grown in single stands (Fig. 2b; P<0.01).
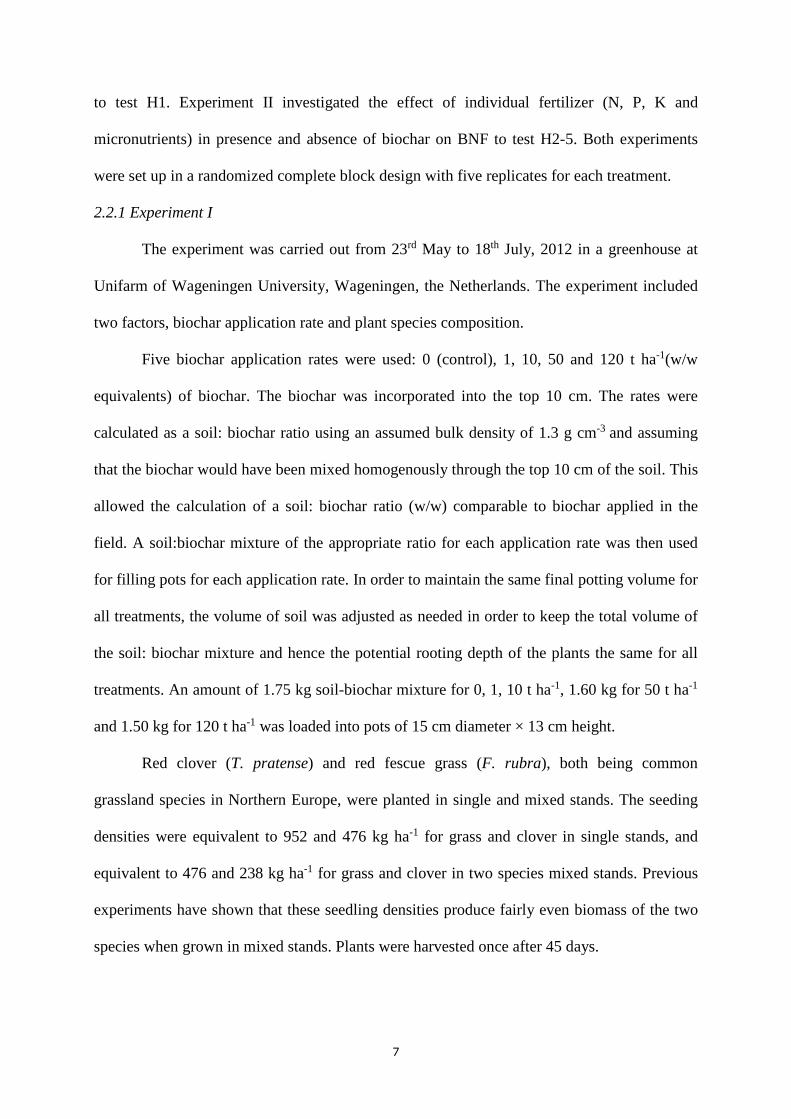
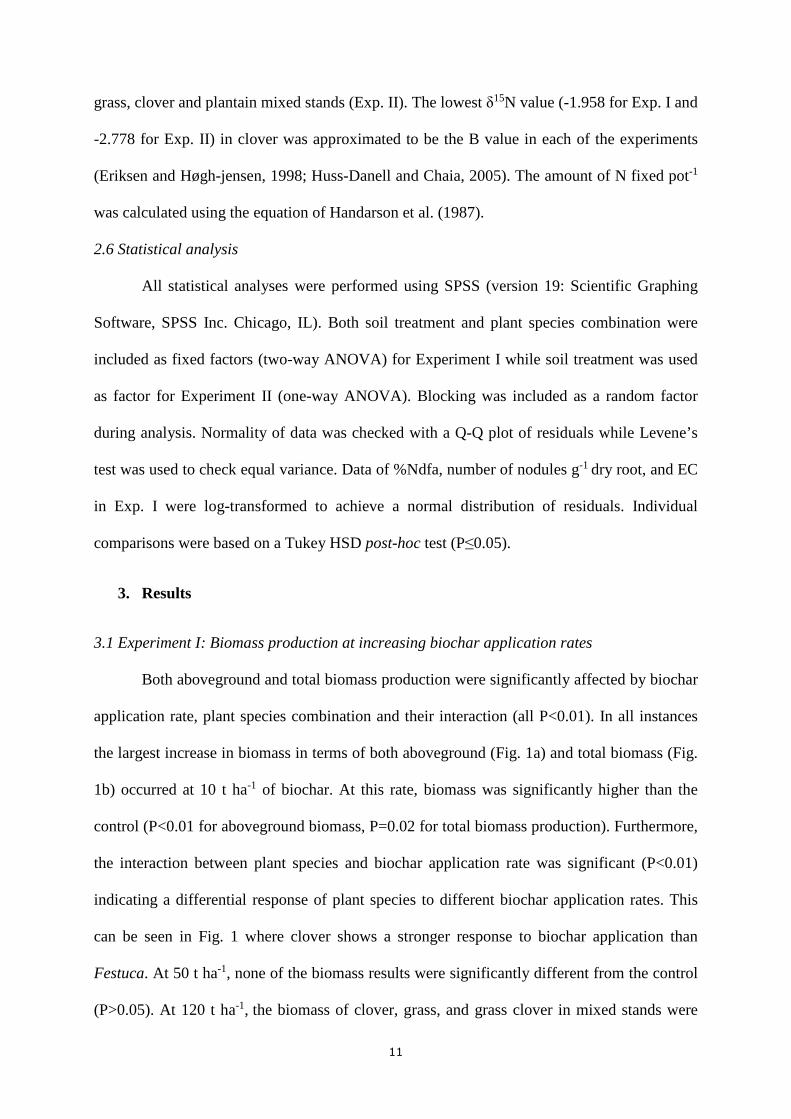
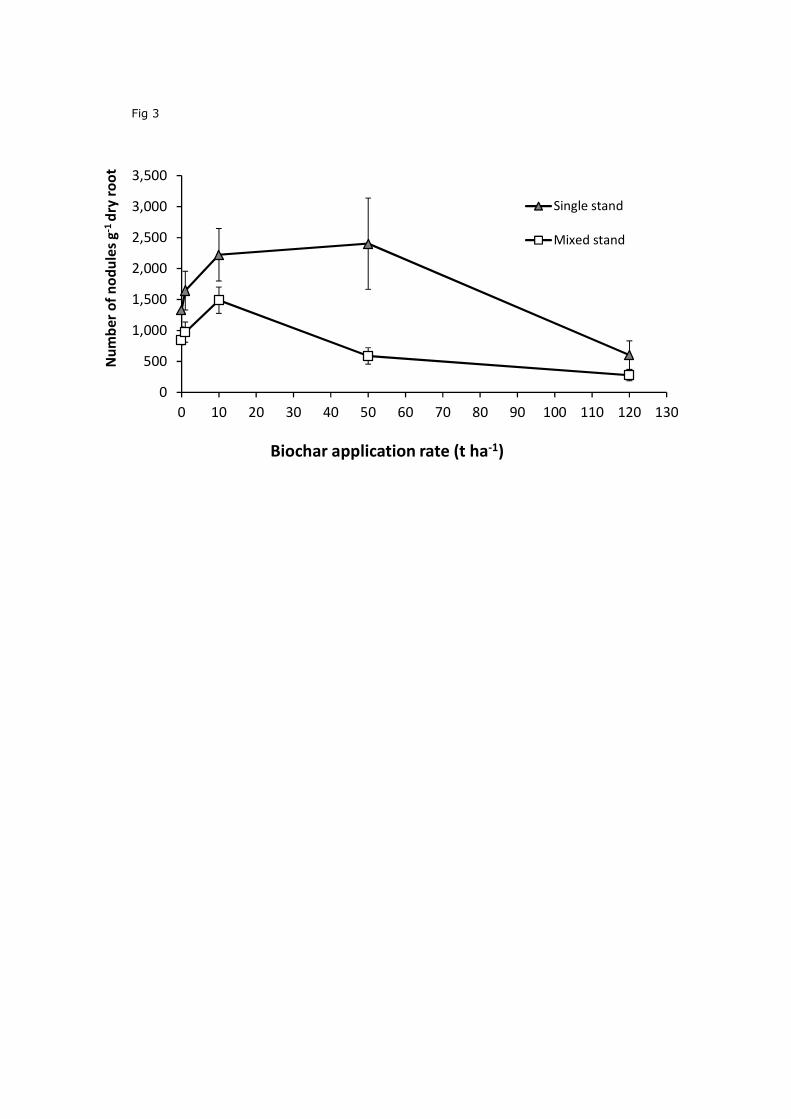
Nodule production per g dry weight of clover roots was significantly affected by both
rate of biochar application, and plant species combination (Fig. 3; P<0.01 in all cases). The
density of nodules in single stands increased by 72% at 10 t ha-1 and 80% at 50 t ha-1. The
density of nodules in the single stands (1641 g-1 root dry weight) was almost twice as high as
in the mixed stand (834 g-1 root dry weight) (P<0.01).
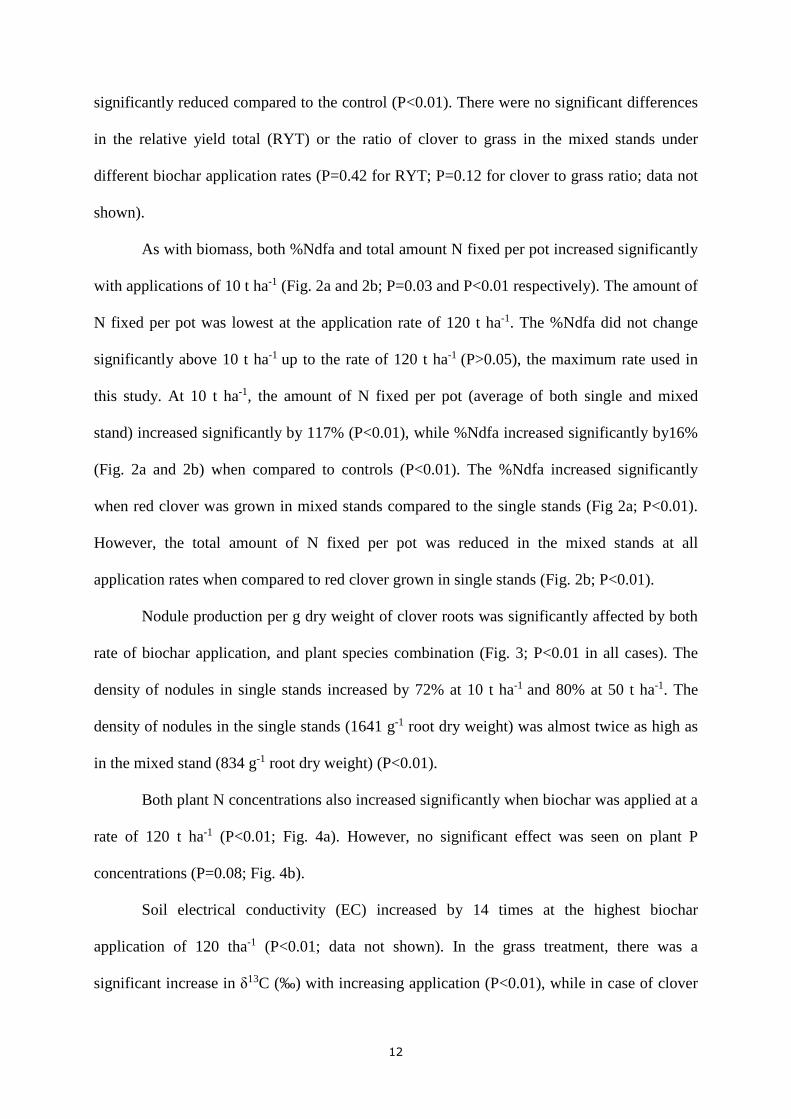
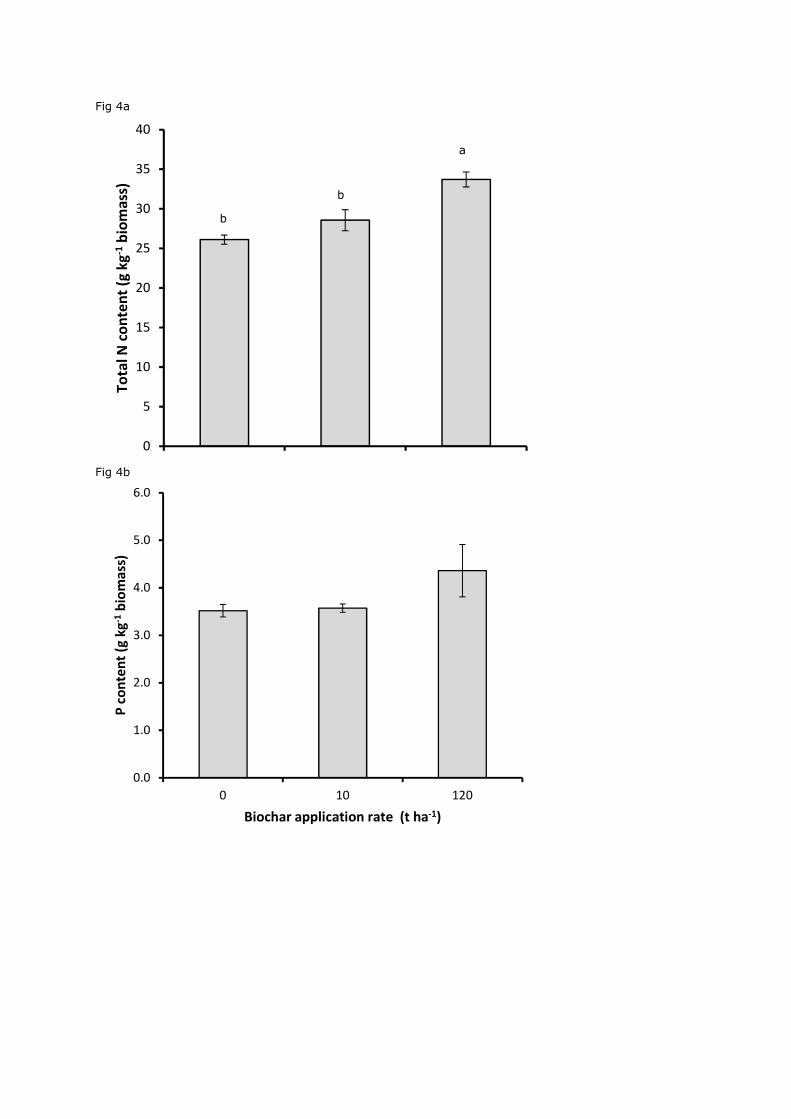
Both plant N concentrations also increased significantly when biochar was applied at a
rate of 120 t ha-1 (P<0.01; Fig. 4a). However, no significant effect was seen on plant P
concentrations (P=0.08; Fig. 4b).
Soil electrical conductivity (EC) increased by 14 times at the highest biochar
application of 120 tha-1 (P<0.01; data not shown). In the grass treatment, there was a
significant increase in δ13C (‰) with increasing application (P<0.01), while in case of clover
13
the δ13C (‰) was not significantly affected (P=0.44), with values ranging from -31.49 to -
31.45‰. Despite using a top layer of untreated soil, significantly fewer plants germinated in
the 120 t ha-1 pots than at the lower application rates (P<0.05; data not shown).
At the highest application rate of 120 t ha-1, we observed red colour development at
the edges of the lower leaves in clover.
3.2 Experiment II.
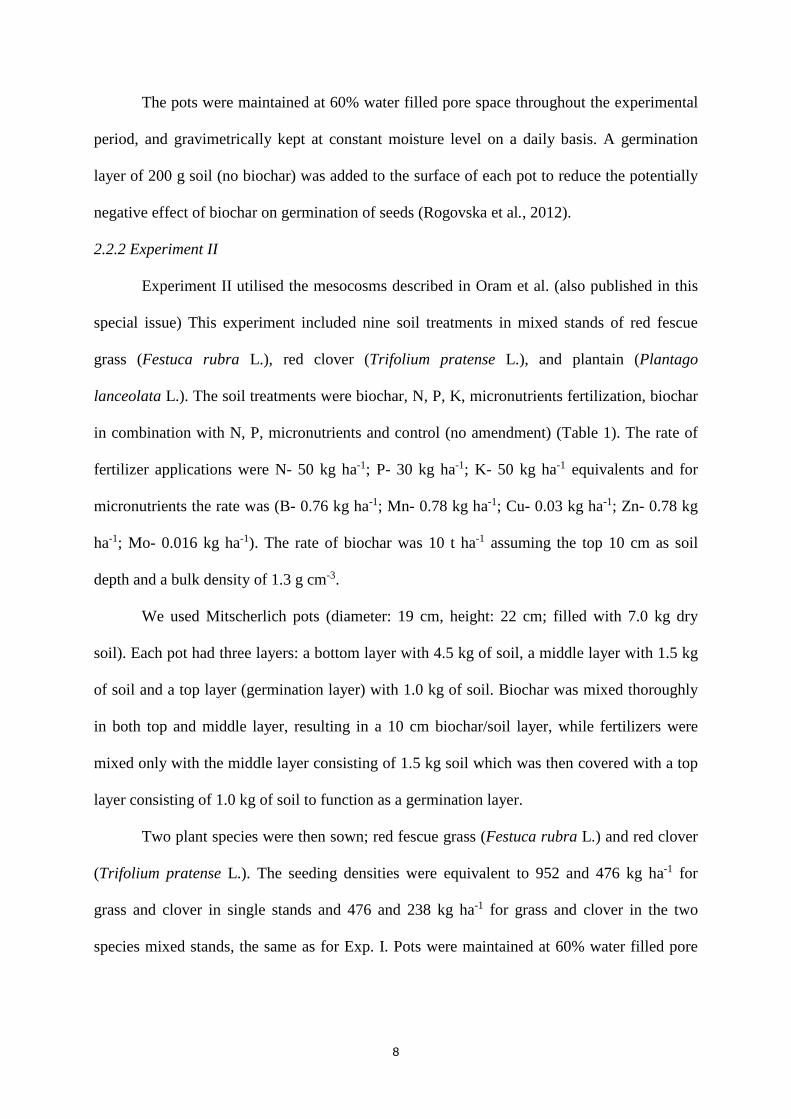
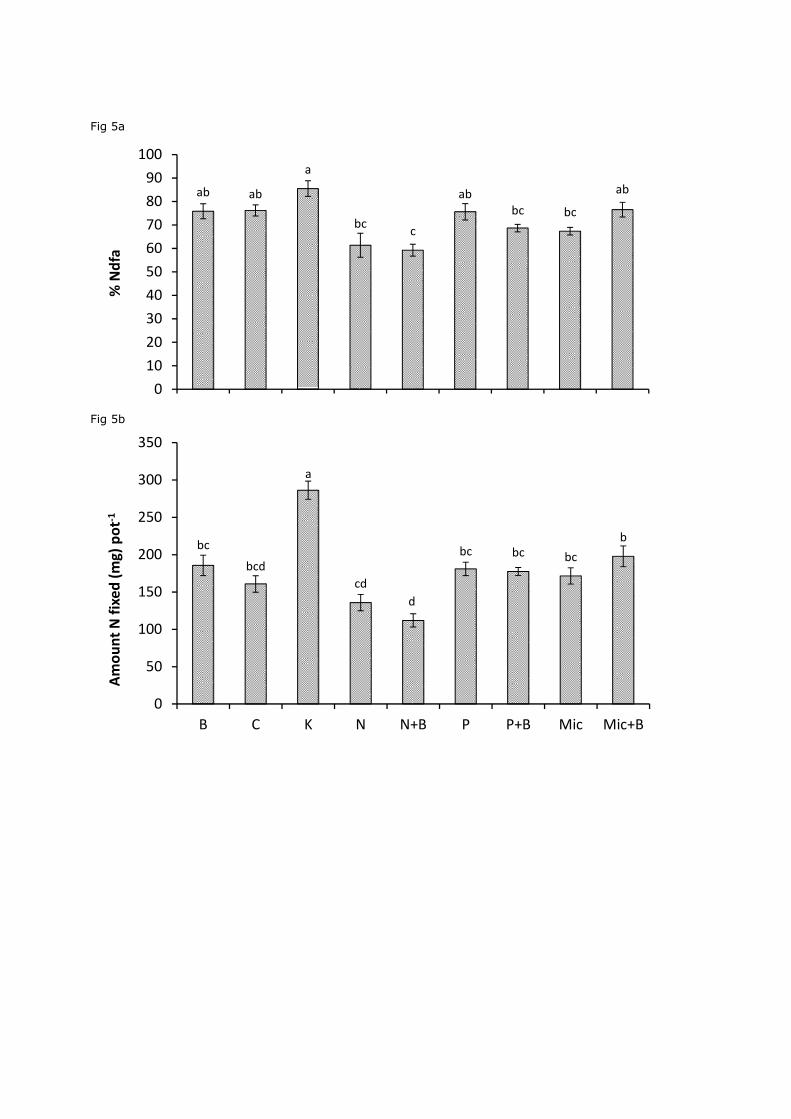
Both the amount of N fixed per pot and the %Ndfa were significantly affected by the
different fertilizer treatments in both the presence and absence of biochar (Fig. 5a and 5b;
P<0.01 for %Ndfa and P=0.03 for N fixed pot-1). Biochar addition at a rate of 10 t ha-1 did not
lead to an increase in the amount of N fixed per pot or %Ndfa when compared to the control,
phosphorus or micronutrient fertilization treatments (P>0.05).
K fertilization showed the strongest effect on the amount of N fixed per pot with an
average, statistically significant, increase of 78% compared to the control (P<0.01). However,
biochar in combination with N fertilizer reduced %Ndfa by 22% when compared to the
control. Neither %Ndfa nor the amount of N fixed per pot were significantly different when
the N, P, and micronutrient fertilization treatments were compared to respective biochar
treatment combined with N, P, or micronutrient fertilization treatments (Fig. 5a and 5b).
4. Discussion
4.1 The effects of biochar application rate
Compared to the control, %Ndfa increased significantly up to the biochar application
rate of 10 t ha-1and remained at the same level with increasing application rates up to 120 t ha-
1, the maximum application rate used in this experiment. Therefore H1 (Increasing application
rates of biochar will increase BNF) should be accepted but only up to a biochar application
14
rate of 10 t ha-1. Above the rate of 10 t ha-1 no significant effects were seen on BNF compared
to the control. This implies that the positive effect observed at 10 t ha-1 was negated by an as
yet unidentified negative effect at rates above 10 t ha-1. The lack of an increase in %Ndfa at a
biochar application rate of 10 t ha-1 observed in Exp. II is likely an artefact of the increased
rooting depth available for the plants owing to the larger pot size used which lead to an
approximate 3 fold increase in the soil volume. As a consequence in Exp 2, a higher total
amount of N was available in each pot and so N was less limiting. When N is not limiting
BNF is often down regulated as it is a more energy intensive way of obtaining N than taking it
up directly from the soil (Ingestad, 1980).
Increased BNF in the presence of biochar has been reported before by a number of
studies (Nishio, 1996; Quilliam et al., 2013; Rondon et al., 2007). In one study in which the
common bean was grown, an increase in BNF was observed until 60 g biochar kg-1 soil
(approximate equivalent to 78 t ha-1, assuming bulk density 1.3 g cm-3) (Rondon et al. 2007),
while Tagoe et al. (2008) found an increased BNF in soybean even at 100 t ha-1. This
variation in results between studies may be the result of differences in biochar properties and
soil nutrient status, or can be due to differential responses of plant species to biochar
application. In contrast, in our study, the amount of N fixed per pot decreased at application
rates above 10 t ha-1 and was not significantly different from the control at 50 t ha-1 and 120 t
ha-1. The amount of N fixed per pot (average of single and mixed stands) decreased by 52% at
the highest application rate compared to the maximum N fixed per pot (achieved at a biochar
application rate of 10 t ha-1) This reduction was likely due to decreased biomass at higher
application rates meaning less N fixed per plant as the plants were smaller.
Biochar application at increasing application rates led to an apparent optimum in both
aboveground and total biomass production at 10 t ha-1 and subsequently declined at 120 t ha-1
in clover, grass, and clover-grass mixed stands compared to controls. Van de Voorde et al.
15
(2013) also found increased clover biomass in a plots with biochar applied at 10 t ha-1 in a
field experiment. Other studies have also reported increased biomass production at higher
application rates. These include: the common bean (Phaseolus vulgaris L.) at an application
rate of 60 g kg-1 soil (approximate equivalent to 78 t ha-1); white clover at an application rate
of 50 t ha-1 (Quilliam et al., 2013) and lettuce (Lactuca sativa) at a biochar application rate of
up to 10% w/w (approximately equivalent to 130 tha-1 assuming bulk density 1.3 g cm-3 and
soil layer 10 cm) (Deenik et al., 2010). However, it is important to note that in these studies
different types of biochar were used which can have very different physical and chemical
properties (Jeffery et al. 2013).
4.2 Mechanisms
The decrease in biomass production that we observed at application rates of 120 t ha-1
can be attributed to reduced germination of plants as well as to a reduced growth of plants
that did germinate. Other studies, such as Revell et al. (2012a) also reported reduced
germination rates at the high application rates of biochar of 5% w/w (equivalent to
approximately 75 t ha-1).
Another factor which may be responsible for the reduced biomass and associated
reduction in N-fixation per pot is salinity stress. Increases in soil salinity have been reported
following biochar application to soil (Clay and Malo, 2012; Revell et al., 2012b). Further,
salinity has been shown to negatively affect BNF (Figueiredo et al., 1999; Serraj et al., 1998).
In our experiment, soil EC increased significantly by 14 times at application rates of 120 t ha-
1 compared to the control.. However, the EC values did not exceed 0.6 dSm-1, which is below
the threshold EC of 1.5 dSm-1 at which negative effects have been reported for red clover
(Maas, 1993). Therefore, salinity is unlikely to have affected growth or BNF in our
experiment. In addition, the δ13C (‰), an indicator of salinity stress (Farquhar et al., 1989;
16
van Groenigen and van Kessel, 2002), was not significantly higher at the high application
rates, providing further evidence that salinity stress is unlikely to have been responsible for
the observed result.
Biochar addition lead to increase in soil pH from 4.9 to 7.08 at the highest application
rate of 120 t ha-1 (data not shown). While this pH change is likely to have been sufficient to
affect nutrient availability in the soil, a pH of 7.08 is not usually detrimental to plant growth
and so does not explain the negative effects on plant growth observed at the higher application
rates.
Blackwell et al. (2010) reported that biochar application lead to reduced biomass
production in wheat as a result of N and P immobilisation.. Similarly, reduced biomass
production due to N immobilisation has been reported for sugar beet following applications of
biochar at a rate of 10 t ha-1 (Gajić and Koch, 2012). In clover, we found a significant increase
(9%) in shoot N concentration compared to the control following application of 120 t ha-1,
while P levels remained unchanged suggesting that immobilisation of N and P were not
responsible for the reduced biomass in our experiment.
Rondon et al. (2007) claimed toxicity of biochar as one of the possible mechanisms for
reduced biomass production in soils with biochar amendment. A phytotoxic effect of
compounds released from biochar was also demonstrated by Gell et al. (2011) who observed
immediate phytotoxicity in lettuce, radish (Raphanus sativus L.), and wheat (Triticum
aestivum L.) after the application of biochar produced as a rest product of biodiesel and
bioethanol production. Biochar contains compounds such as aliphatic and aromatic
hydrocarbons including phenols which can be toxic at sufficient concentrations. The
concentration of these chemicals may have been sufficiently high to cause phytotoxicity at the
higher application rates used in our experiment. However, further work is needed to
investigate this hypothesis.
17
We observed red colour development at the edges of the lower leaves in clover at the
application rate of 120 t ha-1 which suggests some nutritional toxicity or deficiency occurred.
In Exp. II the K concentration in the soil was significantly higher (192 mg kg-1 soil) at the
biochar application of 10 t ha-1 compared to the control (29.10 mg kg-1 soil) (See Oram et al.,
2013 for further details). Assuming linearity, the K concentration in Exp. 1 would have been
more than 2.0 g kg-1 soil at the highest application rate. Therefore, K toxicity seems to be a
potential mechanism which may have caused the growth reduction at the higher biochar
applications in Exp. 1. However, evidence for K toxicity affecting plants is very limited and
such a hypothesis requires further experiments to test it.
Fertilization with N did not significantly affect %Ndfa or the amount of N fixed per
pot compared to addition of biochar alone. However, N combined with biochar led to a
significant decrease in %Ndfa and N fixed per pot compared to the addition of biochar alone.
This leads us to accept H2 that N application will negate the effect of biochar on BNF.
Biochar in combination with N fertilizer decreased %Ndfa by 22% compared to the control
treatment. Total soil N concentration did not change with biochar in combination with N
fertilization compared to N fertilization alone although it was significantly different compared
to the control. This suggests that N was available in the biochar to a degree such that when
combined with N fertilizer there was sufficient N in the system leading to reduced BNF.
Furthermore, we found a significant increase in shoot N concentration following biochar
amendment of 120 t ha-1 in Exp. 1 suggesting that N availability increased in this treatment.
These results contrast with those of Rondon et al. (2007) who reported that the supply of N
from the soil decreased following biochar amendment, and these authors suggested that
biochar application led to N immobilization. This decrease resulted in a lower foliar N
concentration (in common bean), which was not completely compensated for by increased
BNF in their study. These differences demonstrate that biochar effects can differ greatly
18
between studies and depend on the type of biochar and characteristics of the soil and plant
species used.
We found in Exp. 2 that the highest amount of fixed N per pot occurred in the
treatments receiving K fertilization . Biochar addition has been found to increase soil K status
in other experiments (e.g. Parvage et al., 2013; Spokas et al., 2012). Furthermore, Sangakkara
et al. (1996) demonstrated that K availability can increase BNF. We also found that biochar
increased K concentrations in the soil (See Oram et al., 2013 in this special issue for further
details). However, a significant increase in both the amount of N fixed per pot and in %Ndfa
compared to the control were only observed in the K treatment and not in the other biochar
treatments even though biochar application also introduced large amounts of K to the soil
(Oram et al., 2013). This suggests that following K fertilization, in the absence of biochar,
clover gained a competitive advantage over the Festuca and Plantago. This is demonstrated
by the increase in the amount of N fixed per pot which occurred due to the increase in clover
biomass while the %ndfa did not significantly increase compared to the control. In contrast,
in pots where biochar was added, Festuca and Plantago gained a competitive advantage over
clover and this counteracted the advantage that clover gained from the increase in available K.
This increase in competition led to a reduction in total N fixed per pot and in %Ndfa in all of
the biochar treatments, so that N fixation and %Ndfa were not significantly different from the
control any more. This suggests that increased K availability through biochar addition to soil,
was the main factor affecting BNF and so we accept H3 that fertilization with K will increase
BNF. However, the data further suggest that biochar addition to the soil increased the
competitiveness of both Festuca and Plantago, or decreased the competitiveness of the clover
compared to the addition of K alone. Potential mechanisms for these differential effects of K
availability on competitiveness of plant species are discussed in more detail in Oram et al.
(2013).
19
Increased P availability has been suggested to be responsible for increased BNF
following biochar addition in some situations (Rondon et al., 2007; Tagoe et al., 2008). We
found no significant effect of P fertilization on BNF. BNF did not increase significantly with a
combination of biochar and P, although there was a significantly higher amount of P in soils
with biochar with P fertilization compared to P fertilization alone. Furthermore, shoot P-
concentrations of plants in our study were not significantly affected by biochar addition in our
study. This suggests that the effects of biochar on BNF cannot be explained in terms of
increased P availability in our study. Therefore we reject H4 that fertilization with P will
increase BNF.
Micronutrient application, either alone or in combination with biochar did not result in
an increase in BNF compared to the control. Therefore, it is unlikely that increased
micronutrient availability was the mechanism driving increased BNF in our study and as such
we reject H5 that micronutrient fertilizer will increase BNF. This contradicts the potential
mechanism reported by Rondon et al. (2007) who stated that micronutrient availability (in
particular B, and Mo) was the most likely factor leading to increased BNF following biochar
addition.
It has been reported that biochar can enhance BNF by stimulating signalling for
nodulation with adsorption of flavonoids and Nod factors (Thies and Rilling, 2009; Turner,
1955), although evidence for reduced nodulation has also been reported (Quilliam et al.,
2013). In our experiment, root nodulation increased with biochar application rates of 10 t ha-1
in single stands and remained stable until 50 t ha-1 before declining at 120 t ha-1. Similar
results have also been reported by a number of authors (Ogawa and Okimori, 2010; Tagoe et
al., 2008; Turner, 1955). Quilliam et al. (2013) reported a negative effect of biochar on
nodulation in white clover with biochar addition. If this is the main mechanism by which
biochar stimulates BNF, higher application rates should lead to increased nodulation, but this
20
was not observed in our study. This suggests that adsorption of flavonoids and Nod factors,
and the stimulating role of this on nodulation, are unlikely to be main mechanisms by which
biochar affects BNF.
5. Conclusions
Biochar application increased biomass of clover at a rate of 10 t ha-1 and reduced it at
120 t ha-1. Biochar application at a rate of 10 t ha-1 or higher lead to statistically significant
increases in BNF when compared to the control. This means that our study provides support
for Hypothesis 1, that increasing application rates of biochar will increase BNF, although with
the caveat that above 10 t ha-1 BNF did not further increase with increasing rates. Nodulation
and BNF also increased significantly at an application rate of 10 t ha-1 and reduced at an
application rate of 120 t ha-1. The observed increases appeared to occur due to increased
availability of K. Therefore, the results of our study lead us to accept the hypothesis that BNF
increases with K fertilization and reject our hypotheses regarding an increase in BNF with
biochar combined with P and micronutrients and a decrease in combination with N
fertilization. Our results imply that the effects of biochar application on BNF may be short
lived as K is very mobile in soil. Longer term experiments are needed to investigate the longer
term effects of increased K availability on BNF following biochar application as well as its
interaction with competition effects.
6. Acknowledgements
We would like to thank PE&RC for the funding. We would also like to thank Gert-Jan
Ouwehand for practical assistance, Gerlinde de Deyn for helpful suggestions during the
experiment and Gerlinde Vink, Jaap Nelemans, Diego Abalos, Md. Tauhid Islam, Md. Harun

21
Or Rashid, Md. Abdus Sattar, and Mst. Sayeda Mahsina Akter for their cordial cooperation
without which this work would not have been possible.
22
7. References
Blackwell, P., Krull, E., Butler, G., Herbert, A., Solaiman, Z., 2010. Effect of banded biochar
on dryland wheat production and fertiliser use in south-western Australia: an agronomic and
economic perspective. Australian Journal of Soil Research 48, 531-545.
Brewer, C.E., Hu, Y.-Y., Schmidt-Rohr, K., Loynachan, T.E., Laird, D.A., Brown, R.C.,
2012. Extent of Pyrolysis Impacts on Fast Pyrolysis Biochar Properties. Journal of
Environmental Quality 41, 1115-1122.
Bruun, E.W., Müller-Stöver, D., Ambus, P., Hauggaard-Nielsen, H., 2011. Application of
biochar to soil and N2O emissions: potential effects of blending fast-pyrolysis biochar with
anaerobically digested slurry. European Journal of Soil Science 62, 581-589.
Cardinale, B.J., Wright, J.P., Cadotte, M.W., Carroll, I.T., Hector, A., Srivastava, D.S.,
Loreau, M., Weis, J.J., 2007. Impacts of plant diversity on biomass production increase
through time because of species complementarity. Proceedings of the National Academy of
Sciences 104, 18123-18128.
Clay, S.A., Malo, D.D., 2012. The Influence of biochar production on herbicide sorption
characteristics. In: Hasaneen, M.N. (Ed.), Herbicides - Properties, Synthesis and Control of
Weeds. InTech, BY, pp. 59-75.
De Deyn, G.B., Quirk, H., Oakley, S., Ostle, N.J., Bardgett, R.D., 2012. Increased Plant
Carbon Translocation Linked to Overyielding in Grassland Species Mixtures. PLoS ONE 7,
e45926.
Deenik, J.L., McClellan, T., Uehara, G., Antal, M.J., Campbell, S., 2010. Charcoal volatile
matter content influences plant growth and soil nitrogen transformations Soil Science Society
of America Journal 74, 1259-1270.
23
Dunlop, J., Glass, A.D.M., Tomkins, B.D., 1979. The regulation of k+ uptake by ryegrass and
white clover roots in relation to their competition for potassium. New Phytologist 83, 365-
370.
Eriksen, J., Høgh-jensen, H., 1998. Variations in the natural abundance of 15N in
ryegrass/white clover shoot material as influenced by cattle grazing. Plant and Soil 205, 67-
76.
Farquhar, G.D., Ehleringer, J.R., Hubick, K.T., 1989. Carbon isotope discrimination and
photosynthesis. Annual Review of Plant Physiology and Plant Molecular Biology 40, 503-
537.
Figueiredo, M.V.B., Vilar, J.J., Burity, H.A., de França, F.P., 1999. Alleviation of water stress
effects in cowpea by Bradyrhizobium spp. inoculation. Plant and Soil 207, 67-75.
Gajić, A., Koch, H.-J., 2012. Sugar beet (Beta vulgaris L.) growth reduction caused by
hydrochar is related to nitrogen supply. Journal of Environmental Quality 41, 1067-1075.
Gell, K., van Groenigen, J., Cayuela, M.L., 2011. Residues of bioenergy production chains as
soil amendments: Immediate and temporal phytotoxicity. Journal of Hazardous Materials 186,
2017-2025.
George, C., Wagner, M., Kücke, M., Rillig, M.C., 2012. Divergent consequences of
hydrochar in the plant–soil system: Arbuscular mycorrhiza, nodulation, plant growth and soil
aggregation effects. Applied Soil Ecology 59, 68-72.
Hale, S., Hanley, K., Lehmann, J., Zimmerman, A., Cornelissen, G., 2011. Effects of
Chemical, Biological, and Physical Aging As Well As Soil Addition on the Sorption of
Pyrene to Activated Carbon and Biochar. Environmental Science & Technology 45, 10445-
10453.
24
Handarson, G., Danso, S., F, Z., 1987. Biological nitrogen fixation. In: Christie, B.R. (Ed.),
Handbook of plant science in agriculture. CRC Press Inc., pp. 165-192.
Hass, A., Gonzalez, J.M., Lima, I.M., Godwin, H.W., Halvorson, J.J., Boyer, D.G., 2012.
Chicken Manure Biochar as Liming and Nutrient Source for Acid Appalachian Soil. Jouranl
of environmental quality 41, 1096-1106.
Herridge, D., Peoples, M., Boddey, R., 2008. Global inputs of biological nitrogen fixation in
agricultural systems. Plant and Soil 311, 1-18.
Høgh-Jensen, H., Schjoerring, J.K., 1997. Interactions between white clover and ryegrass
under contrasting nitrogen availability: N2 fixation, N fertilizer recovery, N transfer and water
use efficiency. Plant and Soil 197, 187-199.
Hooper, D.U., Chapin, F.S., Ewel, J.J., Hector, A., Inchausti, P., Lavorel, S., Lawton, J.H.,
Lodge, D.M., Loreau, M., Naeem, S., Schmid, B., Setala, H., Symstad, A.J., Vandermeer, J.,
Wardle, D.A., 2005. Effects of biodiversity on ecosystem functioning: A consensus of current
knowledge. Ecol. Monogr. 75, 3-35.
Houba, V., Temminghoff, E., Gaikhorst, G., van Vark, W. 2000. Soil analysis procedures
using 0.01 M calcium chloride as extraction reagent. Commun Soil Sci Plant Anal 31:1299-
1396.
Huss-Danell, K., Chaia, E., 2005. Use of different plant parts to study N2 fixation with 15N
techniques in field-grown red clover (Trifolium pratense). Physiologia Plantarum 125, 21-30.
Ingestad, T., 1980. Growth, nutrition, and nitrogen fixation in grey alder at varied rate of
nitrogen addition. Physiologia Plantarum 50:353–364.
Ishizuka, J., 1992. Trends in biological nitrogen fixation research and application. Plant and
Soil 141, 197-209.
25
Jeffery, S., Verheijen, F.G.A., van der Velde, M., Bastos, A.C., 2011. A quantitative review of
the effects of biochar application to soils on crop productivity using meta-analysis.
Agriculture, Ecosystems & Environment 144, 175-187.
Jeffery, S., Bezemer, T.M. Cornelissen, G., Kuyper, T.H.W., Lehmann, J., Mommer, L., Sohi,
S., van de Voorde, T.F.J., Wardle, D.A. and van Groenigen, J.W., 2013. The way forward in
biochar research: targeting trade-offs between the potential wins. Global Change Biology:
Bioenergy. doi: 10.1111/gcbb.12132.
Jiang, T.-Y.J., Jun; Xu, Ren-Kou and Li Zhuo, 2012. Adsorption of Pb(II) on variable charge
soils amended with rice-straw derived biochar. Chemosphere 89, 259-256.
Kookana, R.S., Sarmah, A.K., Van Zwieten, L., Krull, E., Singh, B., 2011. Chapter three -
Biochar Application to Soil: Agronomic and Environmental Benefits and Unintended
Consequences. In: Donald, L.S. (Ed.), Advances in Agronomy. Academic Press, pp. 103-143.
Laird, D., Fleming, P., Wang, B., Horton, R., Karlen, D., 2010. Biochar impact on nutrient
leaching from a Midwestern agricultural soil. Geoderma 158, 436-442.
Laird, D.A., 2008. The charcoal vision: a win–win–win scenario for simultaneously producing
bioenergy, permanently sequestering carbon, while improving soil and water quality.
Agronomy Journal 100, 178-181.
Lehmann, J., 2007. A handful of carbon. Nature 447, 143-144.
Maas, E., 1993. Testing crops for salinity tolerance. In: Maranville, J.W., BaIigar, B.V.,
Duncan, R.R., Yohe, J.M. (Eds.), Workshop on adaptation of plants to soil stresses, Univ of
Ne, Lincoln,, pp. 234-247.
Major, J., Rondon, M., Molina, D., Riha, S., Lehmann, J., 2010. Maize yield and nutrition
during 4 years after biochar application to a Colombian savanna oxisol. Plant and Soil 333,
117-128.
26
Nelissen, V., Rütting, T., Huygens, D., Staelens, J., Ruysschaert, G., Boeckx, P., 2012. Maize
biochars accelerate short-term soil nitrogen dynamics in a loamy sand soil. Soil Biology and
Biochemistry 55, 20-27.
Nelson, N.O., Agudelo, S.C., Yuan, W., Gan, J., 2011. Nitrogen and Phosphorus Availability
in Biochar-Amended Soils. Soil Science 176, 218-226 210.1097/SS.1090b1013e3182171eac.
Nishio, M., 1996. Microbial fertilizers in Japan. FFTC Extension bulletin. Food and Fertilizer
Technology Center Taipei City.
Nishio, M., Okano, S., 1991. Stimulation of the growth of alfalfa and infection of mycorrhizal
fungi by the application of charcoal. Bulletin of the National Grassland Research Institute 45,
61-71.
Ogawa, M., Okimori, Y., 2010. Pioneering works in biochar research, Japan. Soil Research
48, 489-500.
Oguntunde, P.G., Abiodun, B.J., Ajayi, A.E., van de Giesen, N., 2008. Effects of charcoal
production on soil physical properties in Ghana. Journal of Plant Nutrition and Soil Science
171, 591-596.
Parvage, M., Ulén, B., Eriksson, J., Strock, J., Kirchmann, H., 2013. Phosphorus availability
in soils amended with wheat residue char. Biol Fertil Soils 49, 245-250.
Peoples, M.B., Faizah, A.W., Rerkasem, B., Herridge, D.F., 1989. Methods for evaluating
nitrogen fixation by nodulated legumes in the field. Australian Centre for International
Agricultural Research, Canbara.
Quilliam, R., DeLuca, T., Jones, D., 2013. Biochar application reduces nodulation but
increases nitrogenase activity in clover. Plant and Soil 366, 83-92.
27
Revell, K.T., Maguire, R.O., Agblevor, F.A., 2012a. Influence of Poultry Litter Biochar on
Soil Properties and Plant Growth. Soil Science 177, 402-408
410.1097/SS.1090b1013e3182564202.
Revell, K.T., Maguire, R.O., Agblevor, F.A., 2012b. Field Trials With Poultry Litter Biochar
and Its Effect on Forages, Green Peppers, and Soil Properties. Soil Science 177, 573-579.
Rillig, M.C., Wagner, M., Salem, M., Antunes, P.M., George, C., Ramke, H.-G., Titirici, M.-
M., Antonietti, M., 2010. Material derived from hydrothermal carbonization: Effects on plant
growth and arbuscular mycorrhiza. Applied Soil Ecology 45, 238-242.
Rogovska, N., Laird, D., Cruse, R.M., Trabue, S., Heaton, E., 2012. Germination tests for
assessing biochar quality. Jouranl of Environmental Quality 41, 1014-1022.
Rondon, M., Lehmann, J., Ramírez, J., Hurtado, M., 2007. Biological nitrogen fixation by
common beans (Phaseolus vulgaris L.) increases with bio-char additions. Biol Fertil Soils 43,
699-708.
Sangakkara, U.R., Hartwig, U., Nösberger, J., 1996. Soil moisture and potassium affect the
performance of symbiotic nitrogen fixation in faba bean and common bean. Plant and Soil
184, 123-130.
Serraj, R., Vasquez‐Diaz, H., Drevon, J.J., 1998. Effects of salt stress on nitrogen fixation,
oxygen diffusion, and ion distribution in soybean, common bean, and alfalfa. Journal of Plant
Nutrition 21, 475-488.
Sohi, S.P., Krull, E., Lopez-Capel, E., Bol, R., 2010. Chapter 2 - A Review of Biochar and Its
Use and Function in Soil. In: Donald, L.S. (Ed.), Advances in Agronomy. Academic Press,
pp. 47-82.
Spokas, K.A., Cantrell, K.B., Novak, J.M., Archer, D.W., Ippolito, J.A., Collins, H.P.,
Boateng, A.A., Lima, I.M., Lamb, M.C., McAloon, A.J., Lentz, R.D., Nichols, K.A., 2012.
28
Biochar: A Synthesis of Its Agronomic Impact beyond Carbon Sequestration. Jouranl of
Environmental Quality 41, 973-989.
Tagoe, S., Horiuchi, T., Matsui, T., 2008. Effects of carbonized and dried chicken manures on
the growth, yield, and N content of soybean. Plant and Soil 306, 211-220.
Thies, E.J., Rilling, M.C., 2009. Characteristics of biochar: Biological properties. In:
Lehmann and Joseph. (Ed.), Biochar for environmental Management: Science and
Technology. Earthscan, London, pp. 85-102.
Turner, E.R., 1955. The Effect of Certain Adsorbents on the Nodulation of Clover Plants.
Annals of Botany 19, 149-160.
Unkovich MJ, Pate JS, Sanfold P, Armstrong EL. 1994. Potential precision of the δ15N
natural abundance method in field estimates of nitrogen fixation by crop and pasture legumes
in South-West Australia. Australian Journal of Agricultural Research 45, 119–132.
van de Voorde, T.F.J., Bezemer, T.M., van Groenigen, J.W., Jeffery, S., Mommer, L., 2013.
Soil biochar amendment in a nature restoration area: effects on plant productivity and
community composition. Ecological Applications. In press.
van Groenigen, J.W., van Kessel, C., 2002. Salinity-induced Patterns of Natural Abundance
Carbon-13 and Nitrogen-15 in Plant and Soil. Soil Science Society of America Journal 66,
489-498.
Vitousek, P., Cassman, K., Cleveland, C., Crews, T., Field, C., Grimm, N., Howarth, R.,
Marino, R., Martinelli, L., Rastetter, E., Sprent, J., 2002. Towards an ecological
understanding of biological nitrogen fixation. Biogeochemistry 57-58, 1-45.
Warnock, D., Lehmann, J., Kuyper, T., Rillig, M., 2007. Mycorrhizal responses to biochar in
soil – concepts and mechanisms. Plant and Soil 300, 9-20.
29
Zimmermann, M., Bird, M.I., Wurster, C., Saiz, G., Goodrick, I., Barta, J., Capek, P.,
Santruckova, H., Smernik, R., 2012. Rapid degradation of pyrogenic carbon. Global Change
Biology 18, 3306-3316.
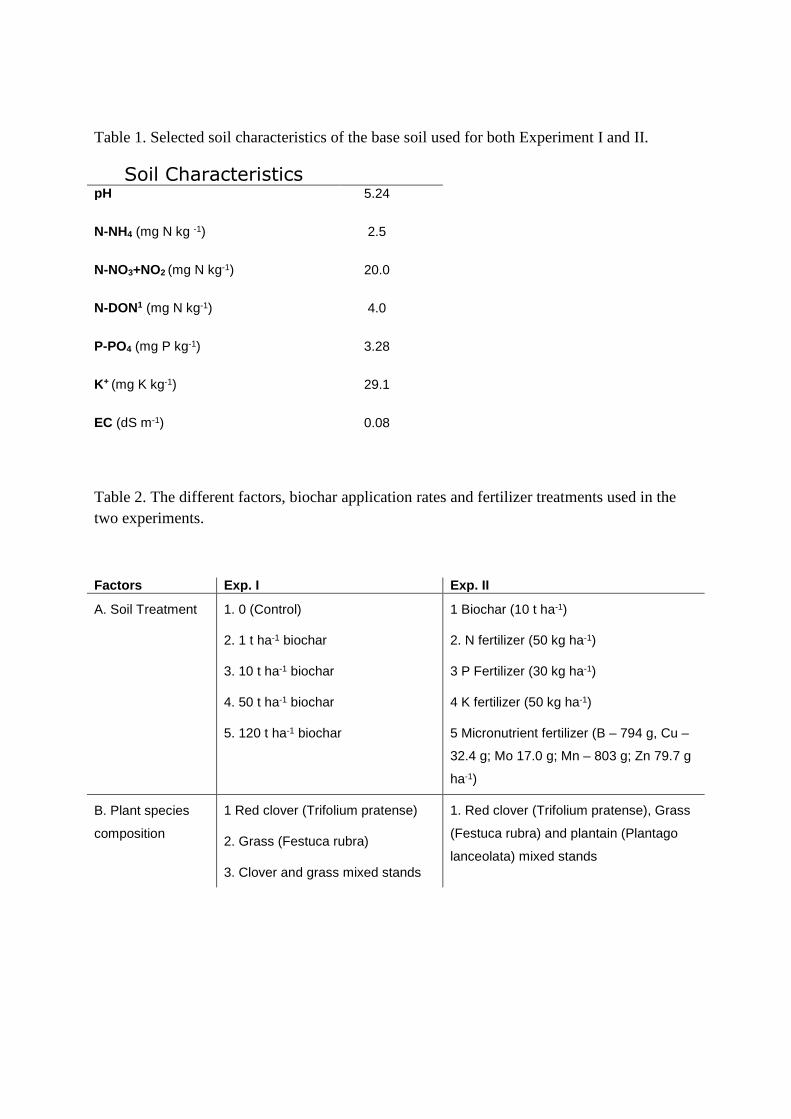
Table 1. Selected soil characteristics of the base soil used for both Experiment I and II.
Soil Characteristics
pH 5.24
N-NH4 (mg N kg -1) 2.5
N-NO3+NO2 (mg N kg-1) 20.0
N-DON1 (mg N kg-1) 4.0
P-PO4 (mg P kg-1) 3.28
K+ (mg K kg-1) 29.1
EC (dS m-1) 0.08
Table 2. The different factors, biochar application rates and fertilizer treatments used in the two experiments.
Factors Exp. I Exp. II
A. Soil Treatment 1. 0 (Control)
2. 1 t ha-1 biochar
3. 10 t ha-1 biochar
4. 50 t ha-1 biochar
5. 120 t ha-1 biochar
1 Biochar (10 t ha-1)
2. N fertilizer (50 kg ha-1)
3 P Fertilizer (30 kg ha-1)
4 K fertilizer (50 kg ha-1)
5 Micronutrient fertilizer (B – 794 g, Cu –
32.4 g; Mo 17.0 g; Mn – 803 g; Zn 79.7 g
ha-1)
B. Plant species
composition
1 Red clover (Trifolium pratense)
2. Grass (Festuca rubra)
3. Clover and grass mixed stands
1. Red clover (Trifolium pratense), Grass
(Festuca rubra) and plantain (Plantago
lanceolata) mixed stands
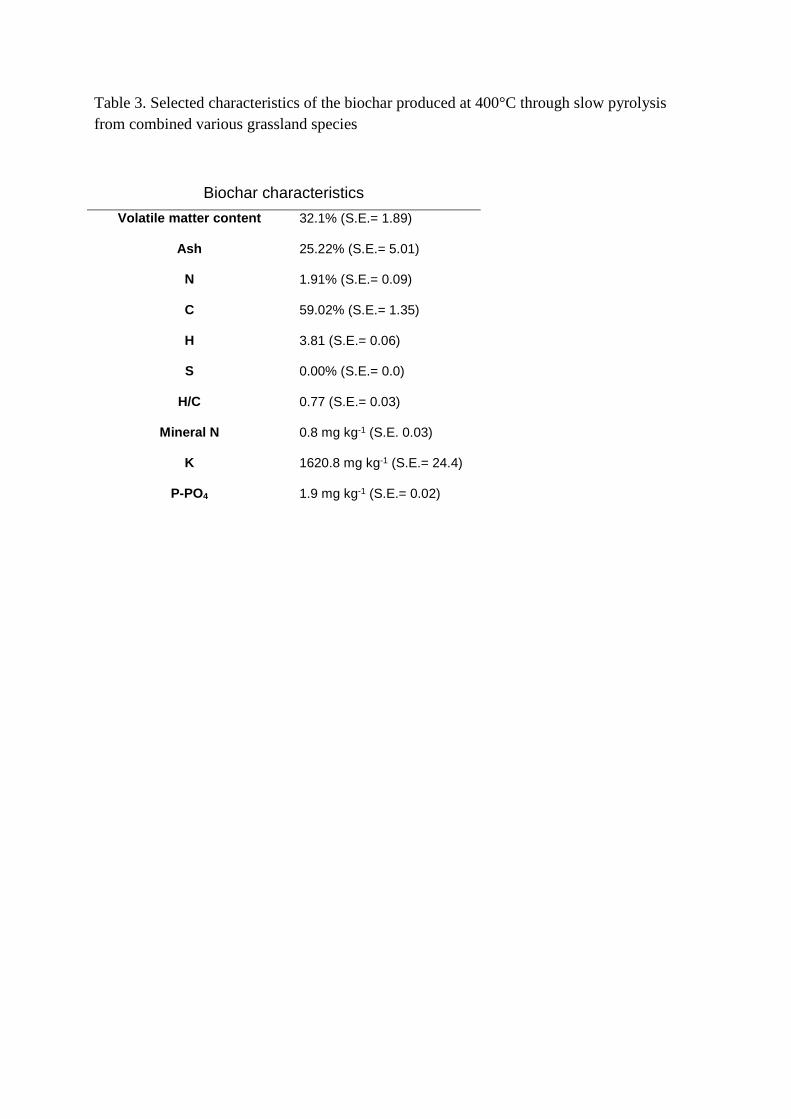
Table 3. Selected characteristics of the biochar produced at 400°C through slow pyrolysis from combined various grassland species
Biochar characteristics Volatile matter content 32.1% (S.E.= 1.89)
Ash 25.22% (S.E.= 5.01)
N 1.91% (S.E.= 0.09)
C 59.02% (S.E.= 1.35)
H 3.81 (S.E.= 0.06)
S 0.00% (S.E.= 0.0)
H/C
Mineral N
K
P-PO4
0.77 (S.E.= 0.03)
0.8 mg kg-1 (S.E. 0.03)
1620.8 mg kg-1 (S.E.= 24.4)
1.9 mg kg-1 (S.E.= 0.02)
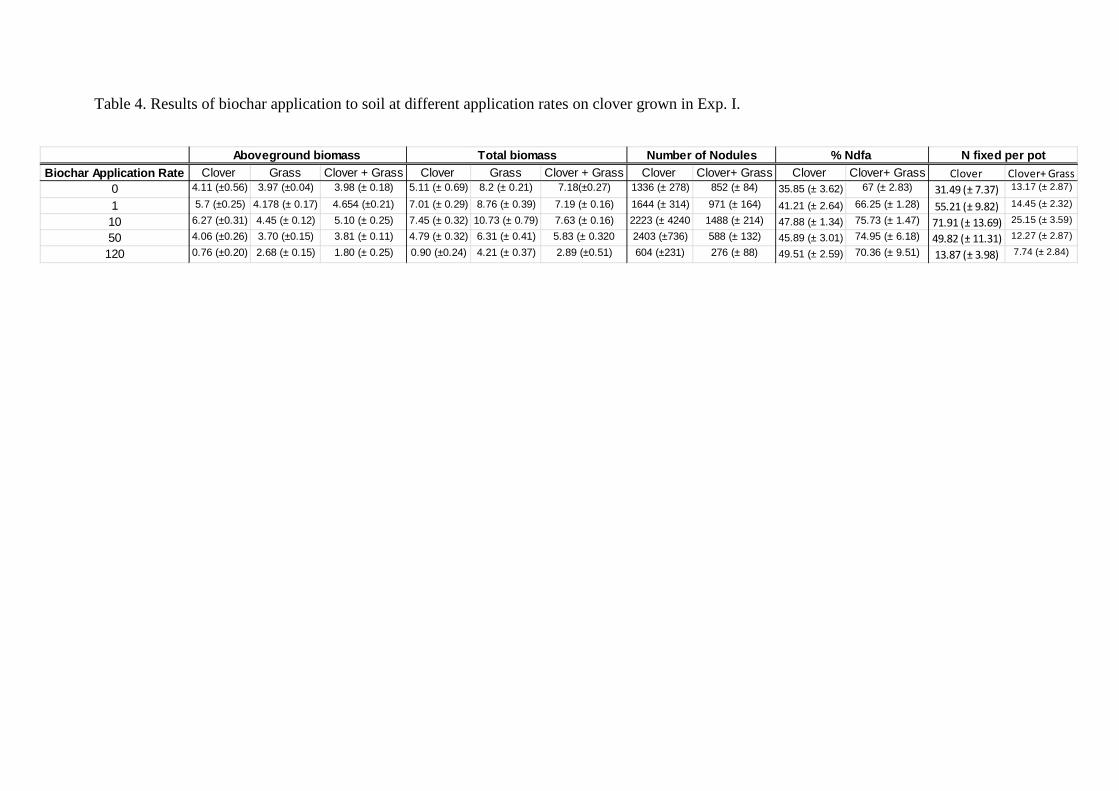
Table 4. Results of biochar application to soil at different application rates on clover grown in Exp. I.
Biochar Application Rate Clover Grass Clover + Grass Clover Grass Clover + Grass Clover Clover+ Grass Clover Clover+ Grass Clover Clover+ Grass
0 4.11 (±0.56) 3.97 (±0.04) 3.98 (± 0.18) 5.11 (± 0.69) 8 .2 (± 0.21) 7.18(±0.27) 1336 (± 278) 852 (± 84) 35.85 (± 3.62) 67 (± 2.83) 31.49 (± 7.37) 13.17 (± 2.87)
1 5.7 (±0.25) 4.178 (± 0.17) 4.654 (±0.21) 7.01 (± 0.29) 8.76 (± 0.39) 7.19 (± 0.16) 1644 (± 314) 971 (± 164) 41.21 (± 2.64) 66.25 (± 1.28) 55.21 (± 9.82) 14.45 (± 2.32)
10 6.27 (±0.31) 4.45 (± 0.12) 5.10 (± 0.25) 7.45 (± 0.32) 10.73 (± 0.79) 7.63 (± 0.16) 2223 (± 4240 1488 (± 214) 47.88 (± 1.34) 75.73 (± 1.47) 71.91 (± 13.69) 25.15 (± 3.59)
50 4.06 (±0.26) 3.70 (±0.15) 3.81 (± 0.11) 4.79 (± 0.32) 6 .31 (± 0.41) 5.83 (± 0.320 2403 (±736) 588 (± 132) 45.89 (± 3.01) 74.95 (± 6.18) 49.82 (± 11.31) 12.27 (± 2.87)
120 0.76 (±0.20) 2.68 (± 0.15) 1.80 (± 0.25) 0.90 (±0.24) 4 .21 (± 0.37) 2.89 (±0.51) 604 (±231) 276 (± 88) 49.51 (± 2.59) 70.36 (± 9.51) 13.87 (± 3.98) 7.74 (± 2.84)
Number of Nodules % Ndfa N fixed per potAboveground biomass Total biomass
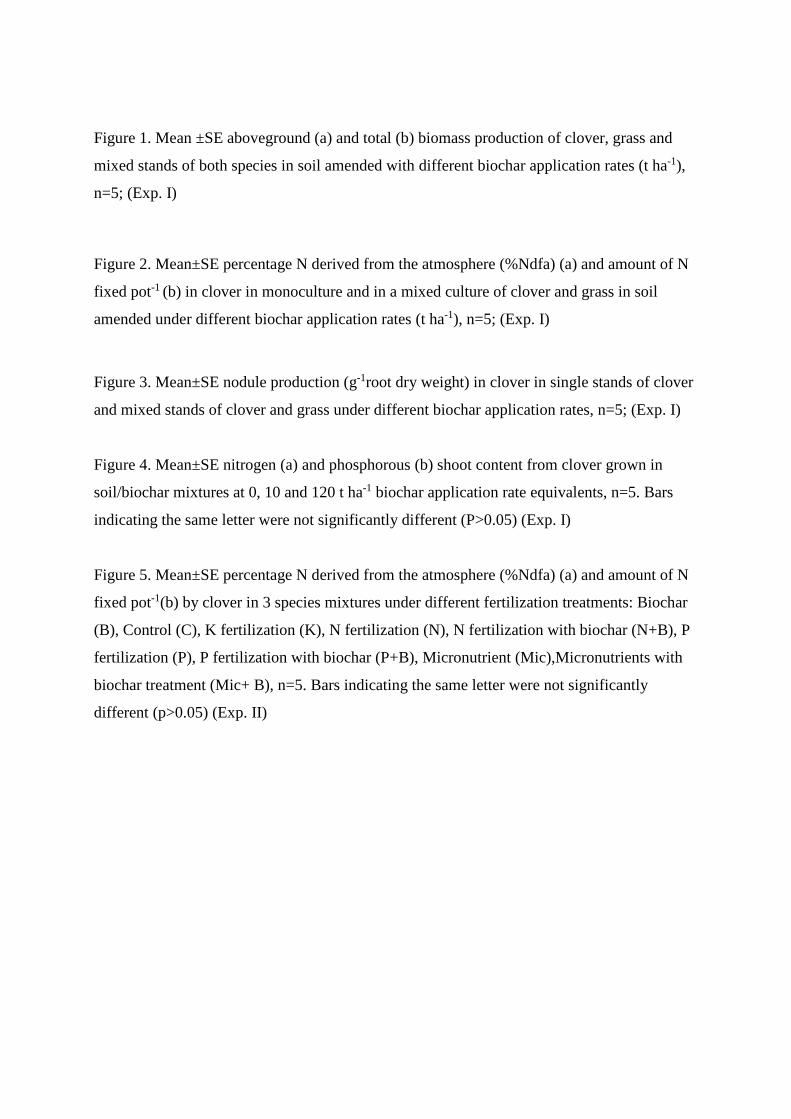
Figure 1. Mean ±SE aboveground (a) and total (b) biomass production of clover, grass and
mixed stands of both species in soil amended with different biochar application rates (t ha-1),
n=5; (Exp. I)
Figure 2. Mean±SE percentage N derived from the atmosphere (%Ndfa) (a) and amount of N
fixed pot-1 (b) in clover in monoculture and in a mixed culture of clover and grass in soil
amended under different biochar application rates (t ha-1), n=5; (Exp. I)
Figure 3. Mean±SE nodule production (g-1root dry weight) in clover in single stands of clover
and mixed stands of clover and grass under different biochar application rates, n=5; (Exp. I)
Figure 4. Mean±SE nitrogen (a) and phosphorous (b) shoot content from clover grown in
soil/biochar mixtures at 0, 10 and 120 t ha-1 biochar application rate equivalents, n=5. Bars
indicating the same letter were not significantly different (P>0.05) (Exp. I)
Figure 5. Mean±SE percentage N derived from the atmosphere (%Ndfa) (a) and amount of N
fixed pot-1(b) by clover in 3 species mixtures under different fertilization treatments: Biochar
(B), Control (C), K fertilization (K), N fertilization (N), N fertilization with biochar (N+B), P
fertilization (P), P fertilization with biochar (P+B), Micronutrient (Mic),Micronutrients with
biochar treatment (Mic+ B), n=5. Bars indicating the same letter were not significantly
different (p>0.05) (Exp. II)
0
1
2
3
4
5
6
7
Dry weight (g) pot
- 1
Clover (single stands)
Grass (single stands)
Clover-grass (mixed stands)
0
2
4
6
8
10
12
14
0 10 20 30 40 50 60 70 80 90 100 110 120 130
Dry weight (g) pot
-
1
Biochar application rate (t ha- 1)
Fig 1a
Fig 1b
0
20
40
60
80
0 10 20 30 40 50 60 70 80 90 100 110 120 130
Am
ou
nt
of
N f
ixe
d (
mg
) p
ot
-1
Rate of biochar application (t ha-1)
0
20
40
60
80
100%
Nd
fa
Single stand
Mixed stand
Fig 2a
Fig 2b
0
500
1,000
1,500
2,000
2,500
3,000
3,500
0 10 20 30 40 50 60 70 80 90 100 110 120 130
Nu
mb
er
of
no
du
les
g-1
dry
ro
ot
Biochar application rate (t ha-1)
Single stand
Mixed stand
Fig 3
0
5
10
15
20
25
30
35
40T
ota
l N
co
nte
nt
(g k
g-1
bio
ma
ss)
0.0
1.0
2.0
3.0
4.0
5.0
6.0
0 10 120
P c
on
ten
t (g
kg
-1b
iom
ass
)
Biochar application rate (t ha-1)
Fig 4a
Fig 4b
a
b
b
bc
bcd
a
cd
d
bc bc bc
b
0
50
100
150
200
250
300
350
B C K N N+B P P+B Mic Mic+B
Am
ou
nt
N f
ixe
d (
mg
) p
ot-1
ab ab
a
bcc
ab
bc bc
ab
0
10
20
30
40
50
60
70
80
90
100
% N
dfa
Fig 5a
Fig 5b