Embed Size (px)
Citation preview
BIOCATALYTIC PERFORMANCE OF CARBONIC
ANHYDRASE IMMOBILIZED WITHIN
POLYURETHANE FOAM IN WATER-MISCIBLE
ORGANIC SOLVENTS
A Thesis Submitted to
the Graduate School of Engineering and Sciences of
İzmir Institute of Technology
in Partial Fulfillment of the Requirements for the Degree of
MASTER OF SCIENCE
in Biotechnology
by
İlyas Umur AYAZ
December 2013
İZMİR
We approve the thesis of İlyas Umur AYAZ
Examining Committee Members:
________________________________
Assoc. Prof. Dr. Ekrem ÖZDEMİR
Department of Chemical Engineering, İzmir Institute of Technology
_____________________________________ Assoc. Prof. Dr. Devrim PESEN OKVUR Department of Molecular Biology and Genetics, İzmir Institute of Technology
_______________________________
Prof. Dr. Oğuz BAYRAKTAR
Department of Chemical Engineering, İzmir Institute of Technology
_______________________________
Assist. Prof. Dr. Aslı Yüksel ÖZŞEN
Department of Chemical Engineering, İzmir Institute of Technology
_____________________________
Assoc. Prof. Dr. Gülşah ŞANLI
Department of Chemistry, İzmir Institute of Technology
18 December 2013
_______________________________ ___________________________________
Assoc. Prof. Dr. Ekrem ÖZDEMİR Assoc. Prof. Dr. Devrim PESEN OKVUR Supervisor, Department of Co-Supervisor, Department of
Chemical Engineering Molecular Biology and Genetics
İzmir Institute of Technology İzmir Institute of Technology
____________________________ ____________________________
Prof. Dr. Volga BULMUŞ Prof. Dr. R. Tuğrul SENGER
Head of the Department of Dean of the Graduate School of
Biotechnology and Bioengineering Engineering and Sciences
ACKNOWLEDGEMENTS
Foremost, I would like to express my sincere gratitude to my supervisor Assoc.
Prof. Dr. Ekrem ÖZDEMİR for his valuable advice, help and support. I also thank to
my co-adviser Assoc. Prof. Dr. Devrim PESEN OKVUR for her valuable advice.
I also would like to thank to my labmates Eda ÜLKERYILDIZ, Derya KÖSE
and Sezen Duygu ALICI for their help and friendship.
I also owe a sincere debt of gratitude to my family and my love Seçil TUNALI
for their endless support and motivation during these difficult times.

iv
ABSTRACT
BIOCATALYTIC PERFORMANCE OF CARBONIC ANHYDRASE
IMMOBILIZED WITHIN POLYURETHANE FOAM IN WATER-
MISCIBLE ORGANIC SOLVENTS
The effects of water-miscible organic solvents such as acetonitrile and ethanol
on the activity of free and immobilized bovine carbonic anhydrase (CA) were
investigated. The CA was covalently immobilized within polyurethane (PU) foam by
cross-linking. Although PU foam holds water almost 12 times of its weight, it was
found that adsorption isotherm of moisture on PU foam was a Type III indicating that
water and PU foam were non-interacting to each other. The activities for the free and
immobilized CA were estimated using para-nitrophenyl acetate (p-NPA) as the
substrate. The enzyme activities were estimated in increasing volume percents of
organic solvent in Tris buffer (10-90%). p-NP, which is one of the products of the
hydrolysis reaction of p-NPA, was characterized in the presence of organic solvents and
it was observed that its aborptivities were decreased significantly as the organic solvent
percentages were increased indicating that p-NP and the water-miscible organic solvent
form a complex through mostly a hydrogen bonding. The free CA showed decreasing
activity up to critical percentages of organic solvent (40-60%), and then exhibited an
increasing activity. The immobilized CA showed decreasing activity in acetonitrile at
percentages up to 50%, and then lost its total activity at higher acetonitrile percentages,
however, the immobilized CA exhibited no activity in ethanol at percentages above
10%. Stability tests showed that the immobilized CA was dramatically inactivated in the
organic solvents at percentages above 30% in shorter times. It was concluded that the
water-miscible organic solvents severely perturbed the active site of the enzyme, thus
denaturating the enzyme.
v
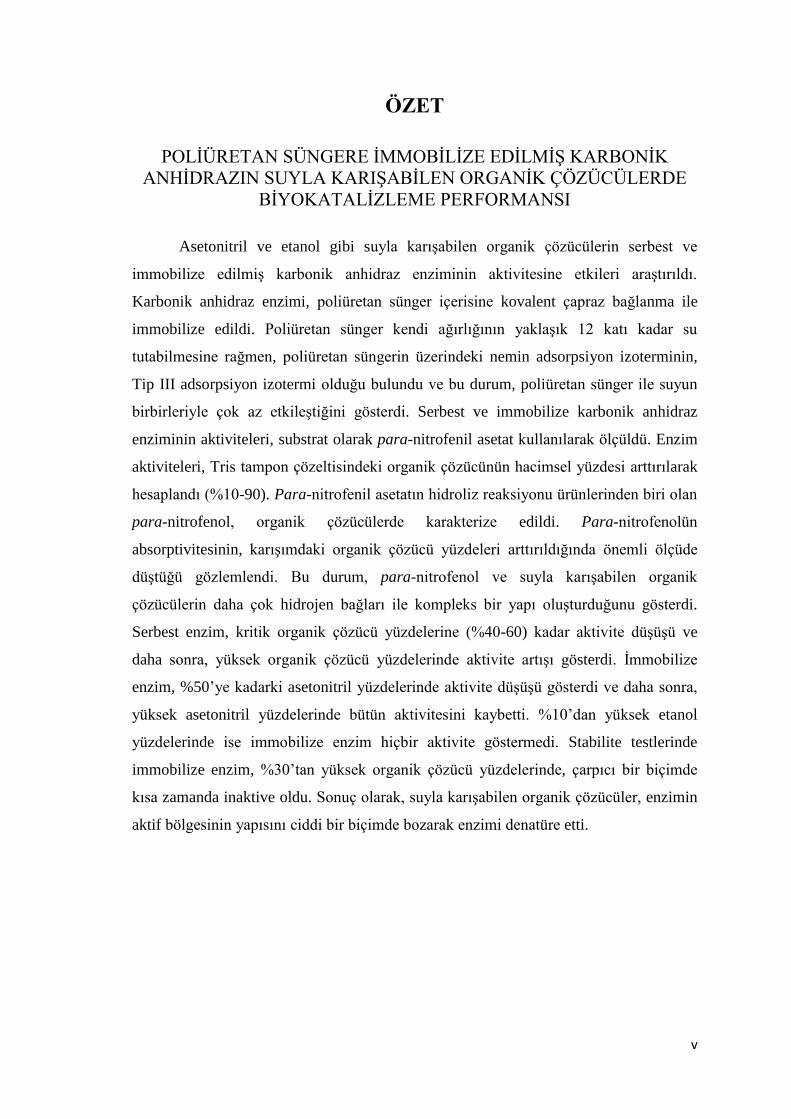
ÖZET
POLİÜRETAN SÜNGERE İMMOBİLİZE EDİLMİŞ KARBONİK
ANHİDRAZIN SUYLA KARIŞABİLEN ORGANİK ÇÖZÜCÜLERDE
BİYOKATALİZLEME PERFORMANSI
Asetonitril ve etanol gibi suyla karışabilen organik çözücülerin serbest ve
immobilize edilmiş karbonik anhidraz enziminin aktivitesine etkileri araştırıldı.
Karbonik anhidraz enzimi, poliüretan sünger içerisine kovalent çapraz bağlanma ile
immobilize edildi. Poliüretan sünger kendi ağırlığının yaklaşık 12 katı kadar su
tutabilmesine rağmen, poliüretan süngerin üzerindeki nemin adsorpsiyon izoterminin,
Tip III adsorpsiyon izotermi olduğu bulundu ve bu durum, poliüretan sünger ile suyun
birbirleriyle çok az etkileştiğini gösterdi. Serbest ve immobilize karbonik anhidraz
enziminin aktiviteleri, substrat olarak para-nitrofenil asetat kullanılarak ölçüldü. Enzim
aktiviteleri, Tris tampon çözeltisindeki organik çözücünün hacimsel yüzdesi arttırılarak
hesaplandı (%10-90). Para-nitrofenil asetatın hidroliz reaksiyonu ürünlerinden biri olan
para-nitrofenol, organik çözücülerde karakterize edildi. Para-nitrofenolün
absorptivitesinin, karışımdaki organik çözücü yüzdeleri arttırıldığında önemli ölçüde
düştüğü gözlemlendi. Bu durum, para-nitrofenol ve suyla karışabilen organik
çözücülerin daha çok hidrojen bağları ile kompleks bir yapı oluşturduğunu gösterdi.
Serbest enzim, kritik organik çözücü yüzdelerine (%40-60) kadar aktivite düşüşü ve
daha sonra, yüksek organik çözücü yüzdelerinde aktivite artışı gösterdi. İmmobilize
enzim, %50‘ye kadarki asetonitril yüzdelerinde aktivite düşüşü gösterdi ve daha sonra,
yüksek asetonitril yüzdelerinde bütün aktivitesini kaybetti. %10‘dan yüksek etanol
yüzdelerinde ise immobilize enzim hiçbir aktivite göstermedi. Stabilite testlerinde
immobilize enzim, %30‘tan yüksek organik çözücü yüzdelerinde, çarpıcı bir biçimde
kısa zamanda inaktive oldu. Sonuç olarak, suyla karışabilen organik çözücüler, enzimin
aktif bölgesinin yapısını ciddi bir biçimde bozarak enzimi denatüre etti.
vi
TABLE OF CONTENTS
LIST OF FIGURES ....................................................................................................... viii
LIST OF TABLES ........................................................................................................... xi
CHAPTER 1. INTRODUCTION ..................................................................................... 1
CHAPTER 2. LITERATURE SURVEY .......................................................................... 3
2.1. Enzymes .................................................................................................. 3
2.1.1. Structural Components of Enzymes .................................................. 3
2.1.2. Enzyme Nomenclature ...................................................................... 5
2.1.3. Basic Concepts of Enzyme Catalysis and Kinetics ........................... 6
2.2. Enzymatic Reactions in Organic Media ................................................. 8
2.2.1. Solvent Effects on Enzymes .............................................................. 8
2.2.2. Advantages and Disadvantages of Using Enzymes in Organic
Media ............................................................................................. 10
2.2.3. Organic Solvent Systems ................................................................. 11
2.2.3.1. Water + Water-Miscible Organic Solvent System ................ 11
2.2.3.2. Water + Water-Immiscible Organic Solvent System ............ 12
2.2.3.3. Nearly Dry Organic Solvent Systems.................................... 12
2.2.4. Stabilization of Enzymes in Non-Aqueous Media .......................... 13
2.3. Immobilization of Enzymes .................................................................. 13
2.4. Polyurethane Foam for Immobilization ................................................ 14
2.5. Carbonic Anhydrase and Esterase Activity .......................................... 16
2.6. Experimental Studies on Enzymes‘ Behaviour in Organic Solvents .... 18
2.7. Immobilized Enzymes in Water-Miscible Organic Solvents ................ 22
CHAPTER 3. MATERIALS AND METHODS ............................................................ 25
3.1. Materials ............................................................................................... 25
3.2. Determination of the Water Holding Capacity of PU Foam ................. 25
3.3. Moisture Adsorption on PU Foam ....................................................... 26
3.4. Characterization of p-NP ...................................................................... 26
vii
3.5. Determination of the Absorbance Profiles for p-NP in the Presence
of the Organic Solvents ......................................................................... 27
3.6. Determination of pH Values for Different Concentrations of the
Organic Solvent .................................................................................... 27
3.7. Self-Hydrolysis of p-NPA in the Presence of the Organic Solvents .... 27
3.8. Calibration Curves ................................................................................ 28
3.9. Immobilization of Carbonic Anhydrase within PU Foam .................... 28
3.10. Enzyme Activity Assays ..................................................................... 28
3.11. Stability Tests ...................................................................................... 30
CHAPTER 4. RESULTS AND DISCUSSIONS ........................................................... 31
4.1. Water Holding Capacity of the PU Foam ............................................. 31
4.2. Adsorption Isotherm of Moisture on the PU Foam .............................. 32
4.3. pH Effect on the Absorbance of p-NP .................................................. 35
4.4. The Absorbance Scanning of p-NP in Tris Buffer ................................ 37
4.5. Acetonitrile As Water-Miscible Organic Solvent in CA Activity ........ 39
4.5.1. The Absorbance Profile of p-NP in the Presence of Acetonitrile.... 39
4.5.2. Calibration Curves for p-NP in the Presence of Acetonitrile .......... 43
4.5.3. Self-Hydrolysis of p-NPA in the Presence of Acetonitrile ............. 46
4.5.4. Activitiy of Free CA in Acetonitrile ................................................ 48
4.5.5. Immobilization of CA within PU Foam .......................................... 51
4.5.6. Activitiy of Immobilized CA in Acetonitrile .................................. 51
4.5.7. Stability of Free and Immobilized CA in Acetonitrile .................... 53
4.6. Ethanol As Water-Miscible Organic Solvent in CA Activity ............... 55
4.6.1. The Absorbance Profile of p-NP in the Presence of Ethanol .......... 55
4.6.2. Calibration Curves for p-NP in the Presence of Ethanol ................. 58
4.6.3. Self-Hydrolysis of p-NPA in the Presence of Ethanol .................... 60
4.6.4. Activitiy of Free and Immobilized CA in Ethanol .......................... 61
4.6.5. Stability of Free and Immobilized CA in Ethanol ........................... 63
CHAPTER 5. CONCLUSION ………………………………………………………....67
REFERENCES ............................................................................................................... 69
viii
LIST OF FIGURES
Figure Page
Figure 2.1. The 3-D model of an amino acid…………………………………………….4
Figure 2.2. The folding of a polypeptide chain (the hierarchy of protein structure
from primary structure through secondary structure and tertiary
structure)........................................................................................................ 5
Figure 2.3. Schematic illustration of the lock and key model of enzyme—substrate
interactions…………………………………………………………………..7
Figure 2.4. Plot of a typical enzymatic reaction…………………………………………7
Figure 2.5. Molecular simulation of penetration of an organic solvent into an
enzyme‘s active site. The water molecules are shown in blue and an
organic solvent in red. In aqueous media (a), water molecules penetrate
into the active site of the enzyme easily. In the nonpolar solvent (b), few
solvent molecules penetrate into the active site, whereas, in the highly
polar solvent (c), there is a significant solvent penetration into the active
site as seen in the figure...........................................................................…...9
Figure 2.6. Enzyme immobilization by cross-linking within PU foam………………...15
Figure 2.7. The three-dimensional structure of bovine carbonic anhydrase...................17
Figure 2.8. Hydrolytic reaction of p-NPA in the presence of CA…………………….. 17
Figure 4.1. Water holding capacity of the PU foam........................................................31
Figure 4.2. Calibration curve for the relative humidities................................................32
Figure 4.3. Moisture adsorption on PU foam…………..………..……………………..33
Figure 4.4. Adsorption isotherm of the PU foam…………..………….……………….34
Figure 4.5. Schematic representation of a small jacketed reactor............………………35
Figure 4.6. Absorbance values for p-NP solutions with respect to wavelength with
different pHs.…............................................................................................36
Figure 4.7. Ratio of the p-NP absorbances for λ400/348 with respect to various pHs.......36
Figure 4.8. Change of the absorbance for different p-NP concentrations with
wavelength.........….....................................………………………………..37
Figure 4.9. Absorbance changes for p-NP at the peak and isosbestic wavelength..........38
Figure 4.10. The ratio of p-NP absorbances with respect to various p-NP
concentrations.............................................................................................38

ix
Figure 4.11. The spectrum profile for p-NP in various percent volume
acetonitrile/buffer mixtures........................................................................39
Figure 4.12. Ratio of the p-NP absorbances (λ400/343) with respect to various
percentages of acetonitrile in the mixture by volume................................40
Figure 4.13. pH values of different percent volume acetonitrile/buffer mixtures...........41
Figure 4.14. pH values with respect to various acetonitrile percentages in the
mixture by volume at constant Tris concentration....……..…….………..42
Figure 4.15. The spectrum profile of p-NP in the acetonitrile/buffer mixtures at
constant Tris concentration………………………………………………42
Figure 4.16. Calibration curves for p-NP in the presence of (A) 10%, (B) 20%,
(C) 30%, (D) 40%, (E) 50%, (F) 60%, (G) 70%, (H) 80%, and (I) 90%
acetonitrile v/v............................................................................................43
Figure 4.17. Change of the absorbance and absorptivity at 400 nm for p-NP in
various percent volume acetonitrile/buffer mixtures……………….….…45
Figure 4.18. Mechanism of electron migration for p-NP……………………………....46
Figure 4.19. pH effect on the self-hydrolysis of p-NPA……………...………………..47
Figure 4.20. The spectrum profile for self-hydrolysis of p-NPA at different
acetonitrile percentages by volume..……..…………..…………..…..…..47
Figure 4.21. p-NP absorbance at 400 nm with increasing acetonitrile
percentages by volume….………..…………...………………………….48
Figure 4.22. Effect of the substrate concentration on the free CA activity………….....49
Figure 4.23. The enzymatic rates for free CA in different percent volume
acetonitrile/buffer mixtures……………………...……………………….50
Figure 4.24. The activity of the immobilized CA in increasing percentages of
acetonitrile by volume……………………………………………..……..52
Figure 4.25. Stability of the free and immobilized CA in the presence of acetonitrile...53
Figure 4.26. The spectrum profile of p-NP in different percent volume
ethanol/buffer mixtures……………………………………………...…....56
Figure 4.27. Change of the ratio of the p-NP absorbances for λ404/343 with increasing
percentages of ethanol by volume………………………………………..57
Figure 4.28. pH values for various percent volume ethanol/buffer mixtures………......57
Figure 4.29. Calibration curves for p-NP in the presence of (A) 10%, (B) 20%,
(C) 30%, (D) 40%, (E) 50%, (F) 60%, (G) 70%, (H) 80%, and (I) 90%
ethanol v/v……………………....……………………………………......58
x
Figure 4.30. Change of the absorbance and absorptivity at 404 nm for p-NP with
increasing ethanol concentrations in the mixture (v/v)……………...…...59
Figure 4.31. The spectrum profile for self-hydrolysis of p-NPA in various percent
volume ethanol/buffer mixtures……………………..………..………….60
Figure 4.32. p-NP absorbance at 404 nm with increasing percentages of ethanol in
the mixture by volume...………………...………………………..………61
Figure 4.33. The enzymatic rates for free CA in different percent volume
ethanol/buffer mixtures………………..…………..…………………..…62
Figure 4.34. The activity of the immobilized CA in increasing percentages of
ethanol by volume…………………………………….…………...…..…63
Figure 4.35. Stability of the free and immobilized CA in the presence of ethanol…….64
xi
LIST OF TABLES
Table Page
Table 2.1. Six major classes of enzymes………………………………………………...6
Table 2.2. Biocatalysts in non-aqueous media…………………………………………10
Table 2.3. Immobilization methods…………………………………………………….14
1
CHAPTER 1
INTRODUCTION
According to traditional concept, enzymes are active only in water. Historically,
enzymatic catalysis has been performed mainly in aqueous systems. Water has the
unique specificity for the enzymes that drew the interest of biochemists who were
searching for highly selective catalytic agents.
At the end of the nineteenth century, scientists began to place enzymes in
systems other than aqueous media (Krishna 2002). It has proven that the use of organic
solvents as reaction media for biocatalytic reactions was an exceedingly useful approach
and this approach extended the range and efficiency of practical applications of
biocatalysis. Some advantages of using organic solvents can be listed as the increased
solubility of hydrophobic substrates and favourable shifts of reaction equilibrium.
Therefore, researchers increasingly turned their attention to the problems and potential
of non-aqueous biocatalysis all over the world, and thus, the research in nonaqueous
biocatalysis has made enormous progress in recent years. In particular, the main focus
in non-aqueous enzyme research are the clarification of the enzyme structure, their
properties in nonaqueous environments, improvement in the catalytic properties to use
in organic solvents, the design of new types of the reaction environment, and finally,
execution of these new developments for synthetic applications (Khmelnitsky and Rich
1999).
Native enzymes almost show low activities in organic solvents – often four or
five orders of magnitude lower than in aqueous media. This is not surprising because
enzymes naturally function in mainly aqueous environments (Serdakowski and Dordick
2008). Organic solvents, especially water-miscible organic solvents, may perturb
enzyme molecules or may become competitive inhibitors through specific interactions
with enzymes, which could alter the reaction kinetics and substrate specificity, thereby
denaturating the enzyme (Ogino and Ishikawa 2001). Denaturation due to solvent-
induced changes is expressed as the unfolding of the enzyme tertiary structure that leads
to a disordered polypeptide. Due to the unfolding, key residues in polypeptide are no
longer arrayed closely enough for functional or structure stabilizing interactions.
According to the Lumry–Eyring approach, enzyme inactivation involve two steps: a
2
reversible unfolding of the native enzyme and then kinetically irreversible steps, which
cause aggregation or covalent changes in the enzyme. The first step is due to the
responsibility of the interactions that retain the native structure of the enzyme. In the
second step, there is a natural evolution of the enzyme‘s native structure towards
thermodynamically stable protein macromolecules. Stability of an enzyme is also
regarded as being a crucial parameter for its industrial applications in non-aqueous
enzymology. It is important to comprehend the mechanism of enzyme inactivation and
the reversibility or irreversibility of the reactions thereby helping in enzyme stability
characterization in the presence of organic solvents. Stability characterization provide
better control over the deactivation process, stabilization approaches and catalytic
properties of enzymes (Iyer and Ananthanarayan 2008). Despite the inactivation process
in the presence of organic solvents, in many cases, enzymes can exhibit adequate
catalytic activity and unique selectivity to be used synthetically in the nonaqueous
environment. Besides, it is important to improve the enzyme function in the organic
media in large-scale for the economically viable biotransformations (Serdakowski and
Dordick 2008).
Today, different methods are utilized to improve the activity and/or stability of
the enzymes in the presence of organic solvents. These methods contain the chemical
modification of enzymes, the immobilization of enzymes on/in insoluble support
matrices, the physical modification of enzymes with lipids or surfactants, the
entrapment of enzymes in reversed micelles, and the molecular engineering of enzymes
(Doukyu and Ogino 2010). Among these, immobilization of the enzyme in a stabilizing
carrier is one of the most used method to protect enzymatic activity against denaturation
in organic solvents. Enzyme immobilization also improves accessibility by molecular
dispersion, i.e., preserve the enzymes against aggregation and gum formation (Odaly,
Crumbliss et al. 1990). In this study, carbonic anhydrase (CA) was selected as a model
enzyme and polyurethane (PU) foam was used as a carrier for the CA. Therefore, our
objectives for this study were to immobilize CA within PU foam and characterize its
enzymatic activity and stability in water-miscible organic solvents.
3
CHAPTER 2
LITERATURE SURVEY
2.1. Enzymes
Enzymes, also called biocatalysts, are striking molecular devices that determine
the patterns of chemical transformations. Enzymes mediate the transformation of one
form of energy into another and have two remarkable characteristics: catalytic power
and specificity.
Enzymes increase the rate of chemical reactions by a factor of as much as a
million or more. Reactions in biological systems do not occur at perceptible rates in the
absence of enzymes mostly. Enzymes are highly effective catalysts in a wide range of
chemical reactions because they specifically bind numerous molecules. Enzymes are
highly specific to reactants, which are called substrates (Berg, Tymoczko et al. 2006).
2.1.1. Structural Components of Enzymes
Nearly all known enzymes are proteins. Proteins as a class of macromolecules
have diverse biological functions in living organisms ranging from DNA replication,
providing mechanical support, immune protection, to converting one molecule to
another (Whitford 2005). Proteins typically have molecular weights of 6000 to several
hundred thousand daltons. They are polymers that consist of amino acid monomers
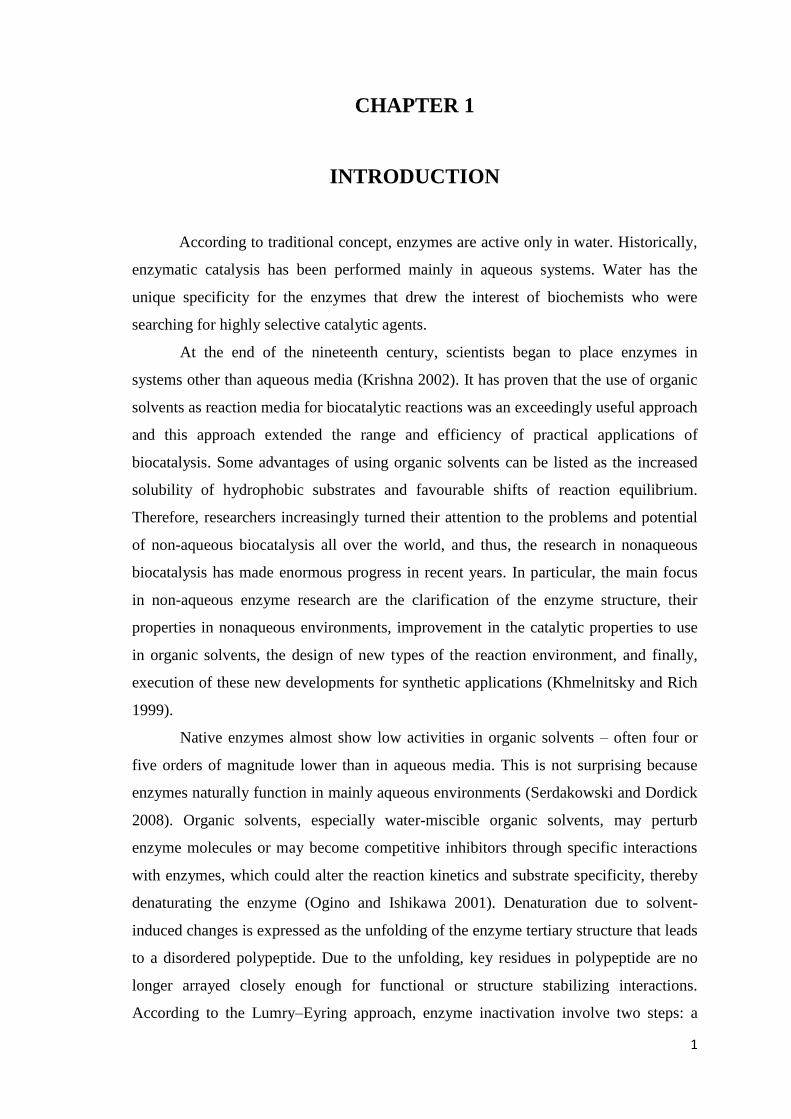
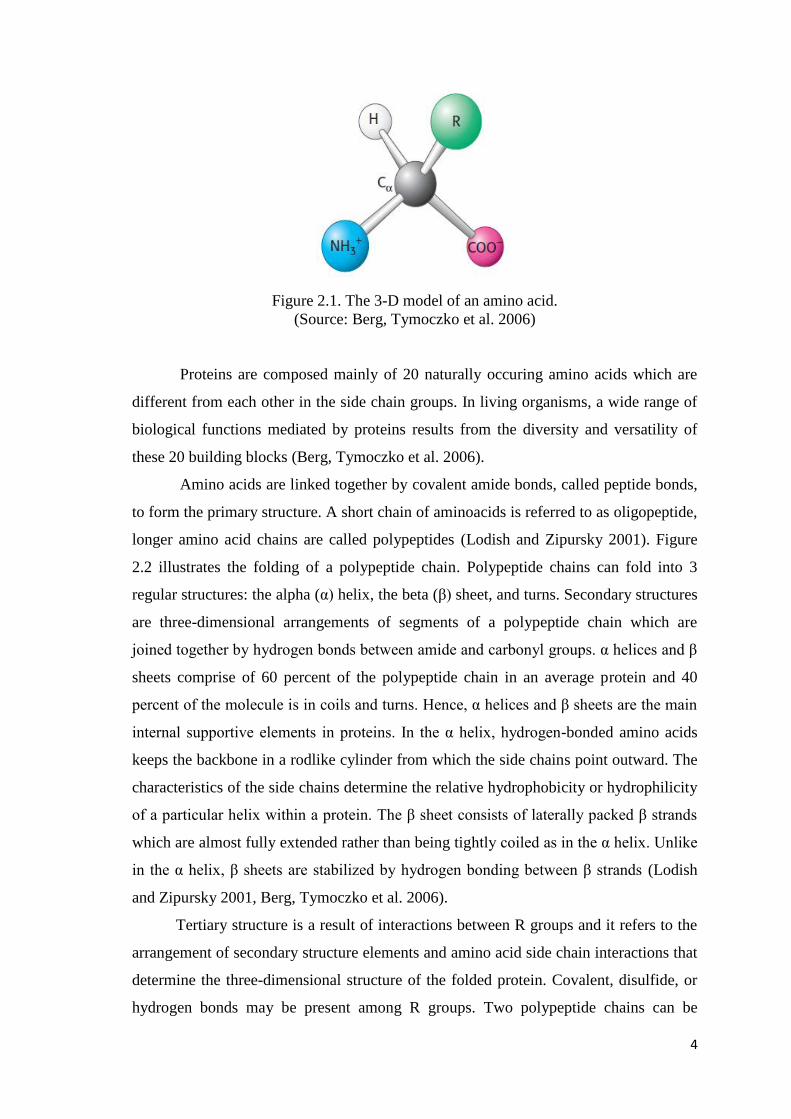
which are the building blocks of proteins (Shuler and Kargi 2002). As shown in Figure
2.1, an α-amino acid is composed of five different groups: amino (NH3+) and carboxyl
(COO‒
) groups attached to a central carbon atom, called the α carbon, a hydrogen atom,
and a distinctive R group. The R group is also called the side chain.
4
Figure 2.1. The 3-D model of an amino acid.
(Source: Berg, Tymoczko et al. 2006)
Proteins are composed mainly of 20 naturally occuring amino acids which are
different from each other in the side chain groups. In living organisms, a wide range of
biological functions mediated by proteins results from the diversity and versatility of
these 20 building blocks (Berg, Tymoczko et al. 2006).
Amino acids are linked together by covalent amide bonds, called peptide bonds,
to form the primary structure. A short chain of aminoacids is referred to as oligopeptide,
longer amino acid chains are called polypeptides (Lodish and Zipursky 2001). Figure
2.2 illustrates the folding of a polypeptide chain. Polypeptide chains can fold into 3
regular structures: the alpha (α) helix, the beta (β) sheet, and turns. Secondary structures
are three-dimensional arrangements of segments of a polypeptide chain which are
joined together by hydrogen bonds between amide and carbonyl groups. α helices and β
sheets comprise of 60 percent of the polypeptide chain in an average protein and 40
percent of the molecule is in coils and turns. Hence, α helices and β sheets are the main
internal supportive elements in proteins. In the α helix, hydrogen-bonded amino acids
keeps the backbone in a rodlike cylinder from which the side chains point outward. The
characteristics of the side chains determine the relative hydrophobicity or hydrophilicity
of a particular helix within a protein. The β sheet consists of laterally packed β strands
which are almost fully extended rather than being tightly coiled as in the α helix. Unlike
in the α helix, β sheets are stabilized by hydrogen bonding between β strands (Lodish
and Zipursky 2001, Berg, Tymoczko et al. 2006).
Tertiary structure is a result of interactions between R groups and it refers to the
arrangement of secondary structure elements and amino acid side chain interactions that
determine the three-dimensional structure of the folded protein. Covalent, disulfide, or
hydrogen bonds may be present among R groups. Two polypeptide chains can be
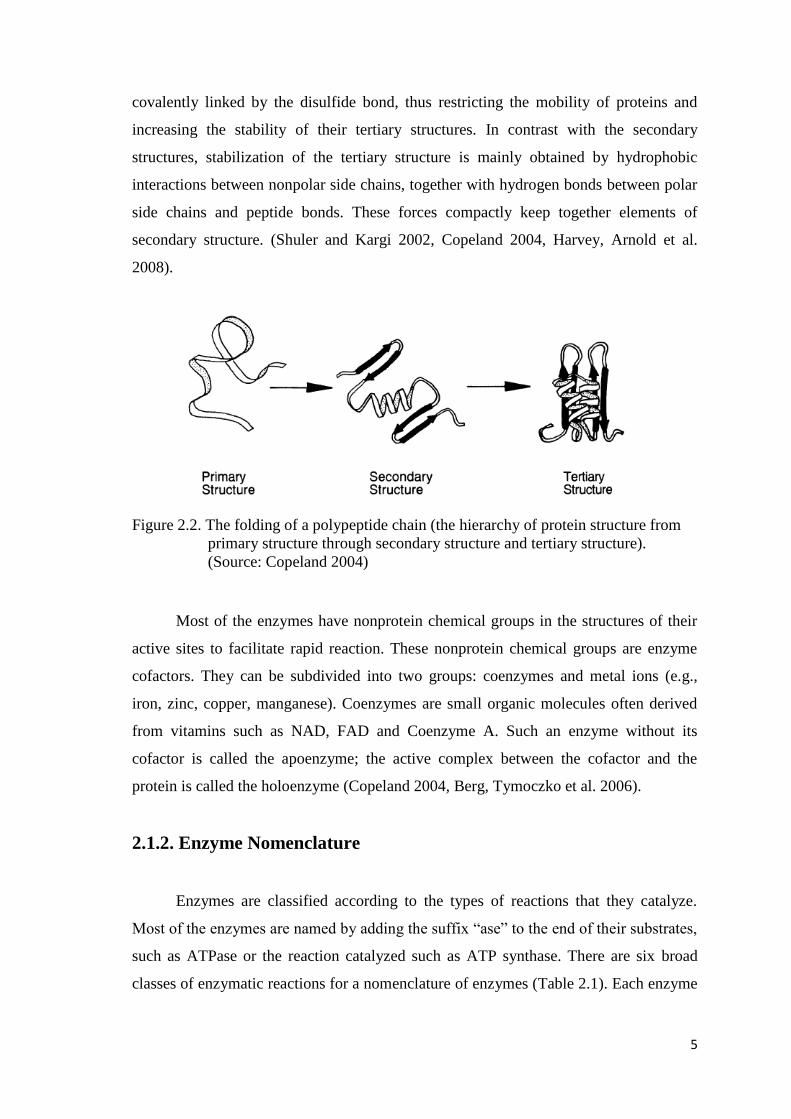
5
covalently linked by the disulfide bond, thus restricting the mobility of proteins and
increasing the stability of their tertiary structures. In contrast with the secondary
structures, stabilization of the tertiary structure is mainly obtained by hydrophobic
interactions between nonpolar side chains, together with hydrogen bonds between polar
side chains and peptide bonds. These forces compactly keep together elements of
secondary structure. (Shuler and Kargi 2002, Copeland 2004, Harvey, Arnold et al.
2008).
Figure 2.2. The folding of a polypeptide chain (the hierarchy of protein structure from
primary structure through secondary structure and tertiary structure).
(Source: Copeland 2004)
Most of the enzymes have nonprotein chemical groups in the structures of their
active sites to facilitate rapid reaction. These nonprotein chemical groups are enzyme
cofactors. They can be subdivided into two groups: coenzymes and metal ions (e.g.,
iron, zinc, copper, manganese). Coenzymes are small organic molecules often derived
from vitamins such as NAD, FAD and Coenzyme A. Such an enzyme without its
cofactor is called the apoenzyme; the active complex between the cofactor and the
protein is called the holoenzyme (Copeland 2004, Berg, Tymoczko et al. 2006).
2.1.2. Enzyme Nomenclature
Enzymes are classified according to the types of reactions that they catalyze.
Most of the enzymes are named by adding the suffix ―ase‖ to the end of their substrates,
such as ATPase or the reaction catalyzed such as ATP synthase. There are six broad
classes of enzymatic reactions for a nomenclature of enzymes (Table 2.1). Each enzyme
6
has a designation with a four-digit number, for example, as EC 2.2.1.1., so that it is easy
to identify all enzymes (Whitford 2005, Berg, Tymoczko et al. 2006).
Table 2.1. Six major classes of enzymes.
(Source: Berg, Tymoczko et al. 2006)
Class Type of reaction Example
1. Oxidoreductases Oxidation-reduction Lactate dehydrogenase
2. Transferases Group transfer
Nucleoside
monophosphate kinase
(NMP kinase)
3. Hydrolases
Hydrolysis reactions
(transfer of functional
groups to water)
Chymotrypsin
4. Lyases
Addition or removal of
groups to form double
bonds
Fumarase
5. Isomerases
Isomerization
(intramolecular group
transfer)
Triose phosphate
isomerase
6. Ligases
Ligation of two
substrates at the expense
of ATP hydrolysis
Aminoacyl-tRNA
synthetase
2.1.3. Basic Concepts of Enzyme Catalysis and Kinetics
Enzymes accelerate the rate of a reaction by decreasing the free energy of
activation without changing free energy change (ΔG), which is the difference in free
energy between the reactants and the transition state, of the reaction. Hence, enzymes
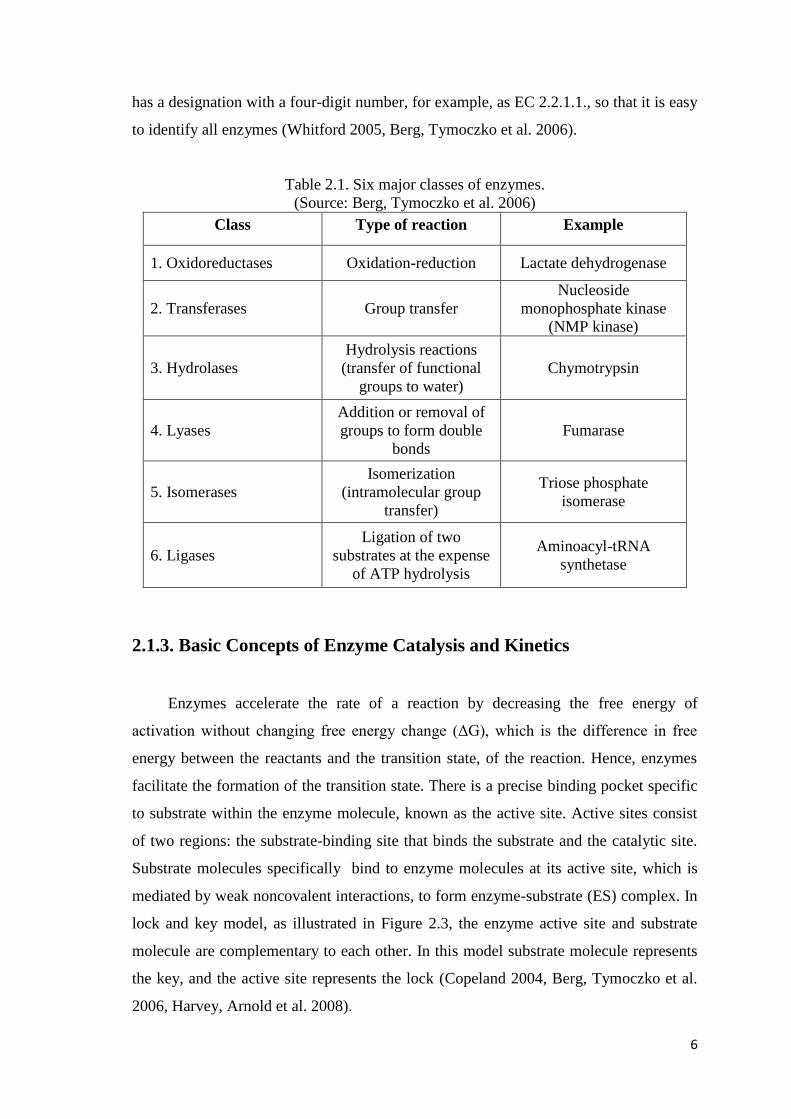
facilitate the formation of the transition state. There is a precise binding pocket specific
to substrate within the enzyme molecule, known as the active site. Active sites consist
of two regions: the substrate-binding site that binds the substrate and the catalytic site.
Substrate molecules specifically bind to enzyme molecules at its active site, which is
mediated by weak noncovalent interactions, to form enzyme-substrate (ES) complex. In
lock and key model, as illustrated in Figure 2.3, the enzyme active site and substrate
molecule are complementary to each other. In this model substrate molecule represents
the key, and the active site represents the lock (Copeland 2004, Berg, Tymoczko et al.
2006, Harvey, Arnold et al. 2008).
7
Figure 2.3. Schematic illustration of the lock and key model of enzyme—substrate
interactions. (Source: Copeland 2004)
In enzymatic reactions, in the first step enzyme (E) binds to its substrate (S) to
form an reversible enzyme-substrate (ES) complex with a rate constant k1 and then in
the second step ES complex irreversibly breaks down into free enzyme and product (P)
with a rate constant k2.
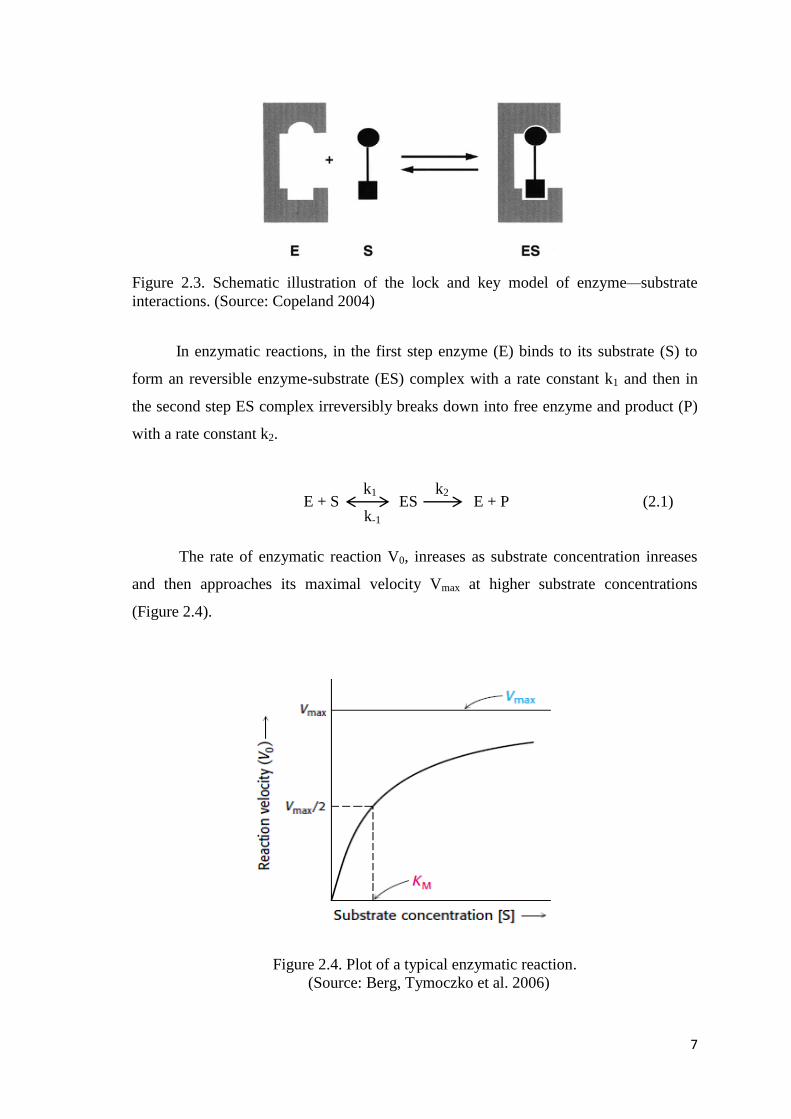
E + S ES E + P (2.1)
The rate of enzymatic reaction V0, inreases as substrate concentration inreases
and then approaches its maximal velocity Vmax at higher substrate concentrations
(Figure 2.4).
Figure 2.4. Plot of a typical enzymatic reaction.
(Source: Berg, Tymoczko et al. 2006)
k1
k-1
k2
8
Single-substrate enzyme-catalyzed reactions are represented by a Michealis-
Menten Equation (eq 2.2).
(2.2)
Here, Km is the Michealis-Menten constant and a measure of affinity for the substrate.
When [S] = Km, then V0 = Vmax/2. Hence, Km corresponds to substrate concentration at
which the reaction velocity is half its maximal value (Berg, Tymoczko et al. 2006).
2.2. Enzymatic Reactions in Organic Media
Over the last twenty years, biocatalysis in organic solvents has emerged as an area
of systematic research and industrial development due to chemical and pharmaceutical
interest (Torres and Castro 2004). Enzymes are known to be denatured in the presence
of organic solvents and their catalytic activity is significantly suppressed in comparison
with aqueous media (Plou, Iborra et al. 1998). However, to date, in numerous studies it
was well shown that enzymes could express catalytic activity in organic media. It is
often possible to obtain catalytic activities as in the same order of magnitude as in
aqueous media by selecting appropriate methods (Carrea and Riva 2008).
2.2.1. Solvent Effects on Enzymes
A hydration shell formed by water molecules which surrounds the protein
molecule is essential for enzyme activation. Water molecules participate either directly
or indirectly in noncovalent interactions, such as hydrogen bonding, hydrophobic and
van der Waals interactions, to form the active center of the enzyme, along with its native
conformation. Removal of bound water molecules from the hydration shell by organic
solvent causes the disruption of the whole protein structure and denaturation of the
enzyme (Gregory 1995, Plou, Iborra et al. 1998). Organic solvent can influence the
enzyme by direct interaction which causes inhibition of the enzyme or conformational
changes in the enzyme. Stability of the enzyme can be affected by direct interaction
between solvent and enzyme as well as activity. Organic solvents can also influence the
solvation of the substrates and products of the reaction catalyzed and the equilibrium
9
position of reactions. Another effect of organic solvents is lowering the free energy of
the substrate and thereby its reactivity.
Enzyme activity in organic solvents depends very much on the nature of the
solvent. Polarity of the solvent has a large influence on reaction rate, that is,
hydrophobic solvents often provide higher reaction rates than more polar, hydrophilic
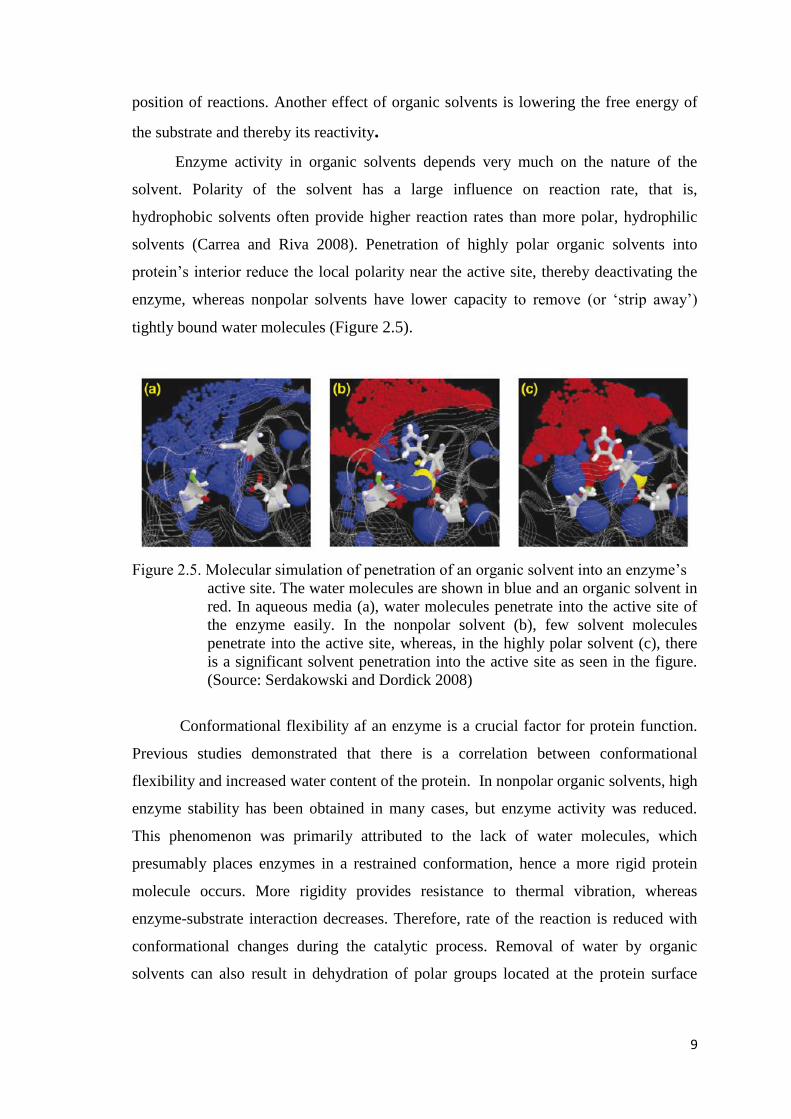
solvents (Carrea and Riva 2008). Penetration of highly polar organic solvents into
protein‘s interior reduce the local polarity near the active site, thereby deactivating the
enzyme, whereas nonpolar solvents have lower capacity to remove (or ‗strip away‘)
tightly bound water molecules (Figure 2.5).
Figure 2.5. Molecular simulation of penetration of an organic solvent into an enzyme‘s
active site. The water molecules are shown in blue and an organic solvent in
red. In aqueous media (a), water molecules penetrate into the active site of
the enzyme easily. In the nonpolar solvent (b), few solvent molecules
penetrate into the active site, whereas, in the highly polar solvent (c), there
is a significant solvent penetration into the active site as seen in the figure.
(Source: Serdakowski and Dordick 2008)
Conformational flexibility af an enzyme is a crucial factor for protein function.
Previous studies demonstrated that there is a correlation between conformational
flexibility and increased water content of the protein. In nonpolar organic solvents, high
enzyme stability has been obtained in many cases, but enzyme activity was reduced.
This phenomenon was primarily attributed to the lack of water molecules, which
presumably places enzymes in a restrained conformation, hence a more rigid protein
molecule occurs. More rigidity provides resistance to thermal vibration, whereas
enzyme-substrate interaction decreases. Therefore, rate of the reaction is reduced with
conformational changes during the catalytic process. Removal of water by organic
solvents can also result in dehydration of polar groups located at the protein surface
10
which reduces the ionic and charged form of these groups. (Torres and Castro 2004,
Serdakowski and Dordick 2008).
In enzymatic reactions, the energy of binding between enzyme and the substrate
is the main driving force. Binding occurs with desolvation of the substrate from the
reaction media to the active center of the enzyme. When water is removed from the
enzyme by an organic solvent, the substrate is no longer ‗squeezed out‘ of the medium
due to the hydrophobic effect. Hence the ground state of the substrate is stabilized in the
organic solvent as compared to that in water and the activation energy of the reaction is
increased. This results in lower reaction rates (Klibanov 1997).
2.2.2. Advantages and Disadvantages of Using Enzymes in Organic
Media
Biocatalysis in organic solvents provides unique processing advantages as
compared to that in aqueous media in some cases. There are also some disadvantages of
enzymes working in organic solvents. These are listed in Table 2.2.
Table 2.2. Biocatalysts in non-aqueous media.
(Source: Castro et al. 2003, Serdakowski et al. 2008)
Advantages Disadvantages
Increased solubility of nonpolar substrates
Ability to catalyze certain reactions in the
reverse direction as compared to that in
water
Altered enantioselectivity as compared to
that in aqueous media
Altered substrate specifity as compared to
that in aqueous media
Lack of side reaction of hydrolysis in
contrast to aqueous mileu
High efficieny of biocatalysts in water-
organic mixtures
Ease of enzyme recovery by filtration or
centrifugation
Problems with recycling
biocatalysts in non-covalently
modified systems
Labour and cost-intensive
preparation of biocatalysts in
covalently modified systems
Limited activity in most pure
organic solvents
Mass transfer limitations in the
case of heterogeneous systems or
viscous solvents
Mandatory low water content that
has to be controlled
(cont. on next page)
11
Thermodynamic equilibria favors
synthesis over hydrolysis
Often enhanced thermostability
Elimination of microbial contamination
Potential for enzymes to be used directly
in a chemical process
2.2.3. Organic Solvent Systems
There are three main types of organic solvent systems: (1) water + water-
miscible organic solvent systems (organic cosolvent systems), (2) water + water-
immiscible organic solvent systems (biphasic system), and (3) nearly dry organic
solvent systems (Doukyu and Ogino 2010).
2.2.3.1. Water + Water-Miscible Organic Solvent System
Organic cosolvent systems are monophasic and have no interface between
solvent and aqueous phase, thereby preventing high substrate and product
concentrations around the enzyme and controlling the concentrations in the system
easily. No diffusional resistance for substrates and products across the organic solvent-
water interface occurs in monophasic systems, hence it can be an advantage in catalytic
processes leading to high overall reaction rates. Water-miscible cosolvents are used to
increase the solubility of substrates which have low solubility in aqueous medium. In
this system mass-transfer limitations are substantially reduced, therefore more rapid
reaction rates can be obtained for hydrophobic substrates. The disadvantage of these
systems is direct contact of an organic solvent with an enzyme which causes
dramatically disruption of the enzyme structure, hence rapid denaturation and
inactivation. The decrease of enzyme activity in water/cosolvent mixtures can also be
explained by the simultaneous occurrence of dielectric changes and
competitive/noncompetitive inhibition.
Table 2.2 (cont.)
12
2.2.3.2. Water + Water-Immiscible Organic Solvent System
This system is also called biphasic system which consists of two phases: an
aqueous phase containing a dissolved enzyme and an immiscible (hydrophobic) organic
solvent phase. In this system, there is an interface layer seperating the aqueous media
and the solvent from each other. Enzymatic reactions occur in the aqueous phase
dissolving enzyme, whereas the hydrophobic substrate is mostly located in solvent layer
and partitioned in the aqueous media. The product formed in the reaction is extracted
into the solvent phase during the process. There are several advantages of using
enzymes in biphasic systems: shifting the reaction equilibria towards synthesis for the
production of peptides and esters due to the low overall water content in the system,
easy recovery of the enzyme, simple seperation of the products from the system and
promoting stability of the enzyme due to preventing direct contact of the solvent with
the enzyme. Enzymatic reaction rates in biphasic systems can be relatively low
beacause of limited mass-transfer of molecules in the medium. Another disadvantage in
these systems is denaturation and inactivation of the enzyme which sometimes occur at
the interface between organic and aqueous phases.
2.2.3.3. Nearly Dry Organic Solvent Systems
In these systems, enzymes are not soluble. They can be solubilized with different
methods such as lyophilization, immobilization or modification with amphipatic
compounds, lipids, or suspended solid particles, or surfactants. Lyophilized enzymes
often show high thermal stability, but more lower catalytic activity than in water, due to
reversible disruption of the enzyme structure. Using additives such as carbohydrates,
polymers, and salts in lyophilization can prevent this denaturation and activate the
enzymes. Water content of the enzyme in the system is crucial in order to perform
sufficient catalytic activity. Conformational flexibility of enzymes in these systems is
restricted at such low water content, hence the enzymes have more rigidity in the system
as compared to that in aqueous solution. This rigid structure results in unique substrate
specificities and therefore some techniques can be used such as molecular imprinting
(Ogino and Ishikawa 2001, Doukyu and Ogino 2010).
13
2.2.4. Stabilization of Enzymes in Non-Aqueous Media
It is important to understand the mechanism of enzyme inactivation for
characterization of enzyme stability in organic solvents. Therefore, it will be easier to
control over the deactivation process and stabilization approaches in solvent systems. In
order to prevent processes in enzyme inactivation and improve enzyme activity and
stability in non-aqueous media, different strategies were employed. These are: (a)
isolation of naturally stable enzymes from extremophiles; (b) genetic manipulation to
obtain stable enzymes; and (c) stabilizing existing enzymes by protein engineering (site-
-directed mutagenesis and directed evolution), covalent attachment of amphipathic
compounds (PEG, aldehydes and imidoesters), non-covalent interaction with lipids or
surfactants, entrapment in water-in-oil microemulsions or reverse micelles, utilization of
solid enzymes (lyophilized enzyme powders and cross-linked crystals suspended in
organic solvents), addition of additives and immobilization on appropriate insoluble
supports (synthetic polyhydroxylic matrices, porous inorganic carriers, polymers and
molecular sieves) (Torres and Castro 2004, Iyer and Ananthanarayan 2008).
Currently, immobilization of enzymes is one of the main industrial applications
of non-aqueous enzymology. Immobilized enzymes are heterogeneous biocatalytic
systems due to a visible seperation of phases. Immobilization is generally performed for
optimum activity in non-aqueous media. Confinement of enzymes by immobilization
method usually enhances accessibility by molecular dispersion and stability of the
enzymes against denaturation by the organic solvents (Krieger, Bhatnagar et al. 2004,
Torres and Castro 2004, Sheldon 2007).
2.3. Immobilization of Enzymes
Immobilization is a method of keeping the enzymes confined in a certain defined
region of space to preserve their catalytic activity (Romaškevič, Budrienė et al. 2006). It
is a useful technique to facilitate recovery and reuse of the biocatalysts. In industry, very
stable enzymes can be prepared via immobilization for multiple reuses of them in
catalytic reactions (Guisan 2006). Use of the immobilized enzymes also reduces
production costs by efficient recycling and control of the process (Cao 2006).
14
Enzyme immobilization methods can be mainly subdivided into two groups:
physical immobilization, where weak interactions between support and enzyme exist,
and chemical immobilization, where covalent bonds with enzyme are formed
(Krajewska 2004). Some immobilization techniques are listed in Table 2.3.
Table 2.3. Immobilization methods.
(Source: Krajewska 2004)
Physical Immobilization Chemical Immobilization
Entrapment of the enzyme molecules Enzyme attachment to the matrix by
covalent bonds
Micro-encapsulation with a solid or
liquid membrane
Cross-linking between enzyme and matrix
Adsorption on a water-insoluble matrix Enzyme cross-linking by multifunctional
substances
Enzyme attachment to the support material by covalent bonds is one of the most
widely used methods in immobilization of enzymes. The functionality of the carrier
and/or the enzyme must be activated before their use for an efficient binding. The
covalent bond is created through the reaction between electrophilic (electron deficient)
groups on the support and strong nucleophiles (electron donating) on the protein surface
(e.g., NH2 or OH groups). A strong interaction occurs between the enzyme and the
carrier via covalent attachment, therefore the stability of the enzyme is increased. In
some cases, this strong interaction may limit the conformational flexibility of the
enzyme, thereby reducing catalytic activity (Cao 2006, Guisan 2006, Romaškevič,
Budrienė et al. 2006).
2.4. Polyurethane Foam for Immobilization
Different structures can be used for enzyme immobilization and among these,
polyurethane (PU) could be one of the best carrier for this purpose. PU foams are
porous materials with microcellular structures. There are some advantages of using PU
foams in immobilization: easy control of the pore size, efficient stability of enzymes and
large-scale application at low price (Romaškevič, Budrienė et al. 2006). Wood et al.
developed a method of covalent attachment of enzymes into isocyanate-capped PU in
15
1982 (Wood, Hartdegen et al. 1982). Today, their technique is still used in enzyme
immobilization. In this method, a HYPOL prepolymer is mixed with the aqueous
enzyme solution to achieve the immobilization (Ozdemir 2009). The polymerization of
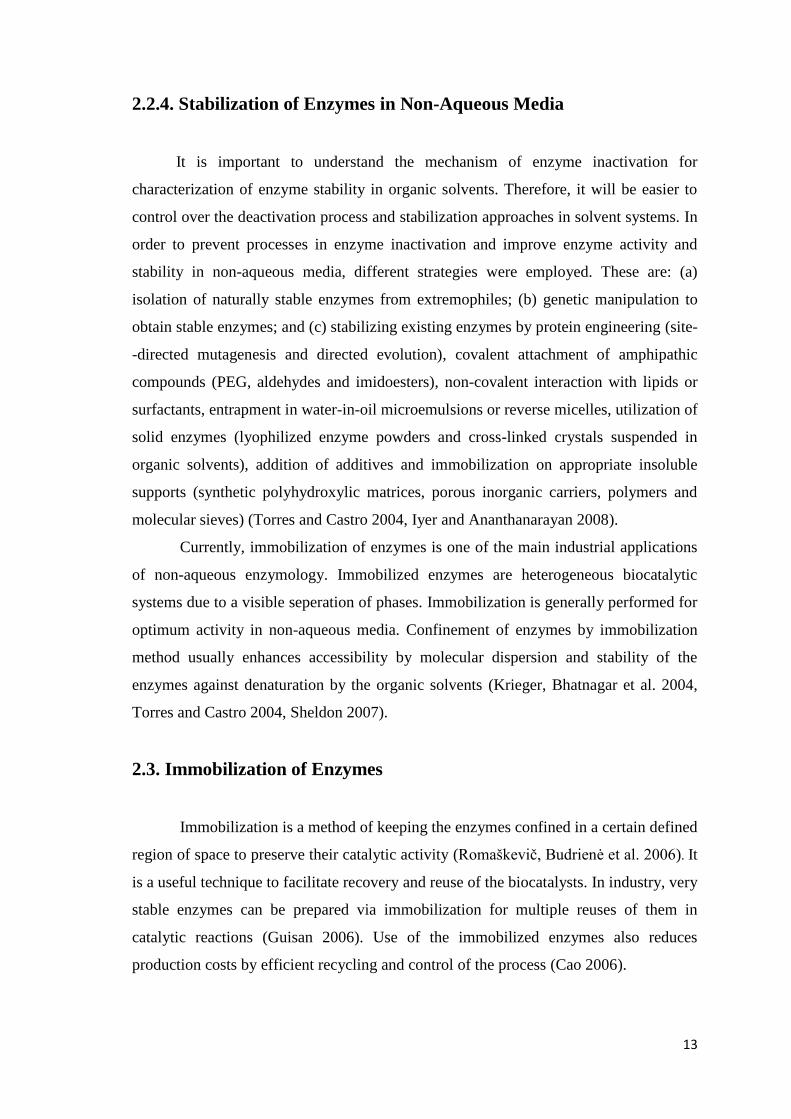
the HYPOL prepolymer in the presence of water and the mechanism of immobilization
of enzymes into PU foam are presented in Figure 2.6. The polymerization is initiated by
intimate contact of water, which is introduced with the enzyme solution, with isocyanate
groups present within the HYPOL prepolymer. In the first step, prepolymer is exposed
to a nucleophilic attack by an OH¯ at the carbonyl group following a protonation and
deprotonation to form the unstable intermediate. In the second step, the unstable
intermediate degrades to an amine group yielding CO2. The produced amine groups
readily react with isocyanate groups, resulting in cross-linked prepolymer chains.
Consequently, the produced CO2 causes a porous and sponge-like matrix of the PU
foam. Because an enzyme contains amine and/or hydroxyl groups, which can react with
isocyanates, the enzyme becomes an integral part of the foam during polymerization at
the same time. This process is relatively faster and higher activity retention could be
achieved (LeJeune and Russell 1996, Bakker, van de Velde et al. 2000, Romaškevič,
Budrienė et al. 2006, Ozdemir 2009).
Figure 2.6. Enzyme immobilization by cross-linking within PU foam.
(Source: Ozdemir 2009)
16
2.5. Carbonic Anhydrase and Esterase Activity
Carbonic anhydrase (CA) was selected as the model enzyme for this thesis.
Carbonic anhydrase is a zinc metalloenzyme that mainly catalyzes the reversible
hydration of CO2 to form bicarbonate (Zhang, Zhang et al. 2011). In living organisms,
CA catalyzes the reaction of the interconversion of the carbon dioxide and the
bicarbonate ion in physiological processes (Supuran, Scozzafava et al. 2004). However,
the CAs can catalyze hydrolysis of esters and dehydration of various aldehydes
(Whitney 1970).
There are at least five distinct classes of CA: α-CA, β-CA, γ-CA, Ɛ-CA and δ-
CA (Savile and Lalonde 2011). CAs exist in a wide range of isoforms in animals,
plants, bacteria and a variety of eukaryotic algae (Cox, McLendon et al. 2000). All
mamalian cells have α-CA and 16 different isozymes of α-CA have been identified in
mammals. At least ten of these isoenzymes belong to humans.
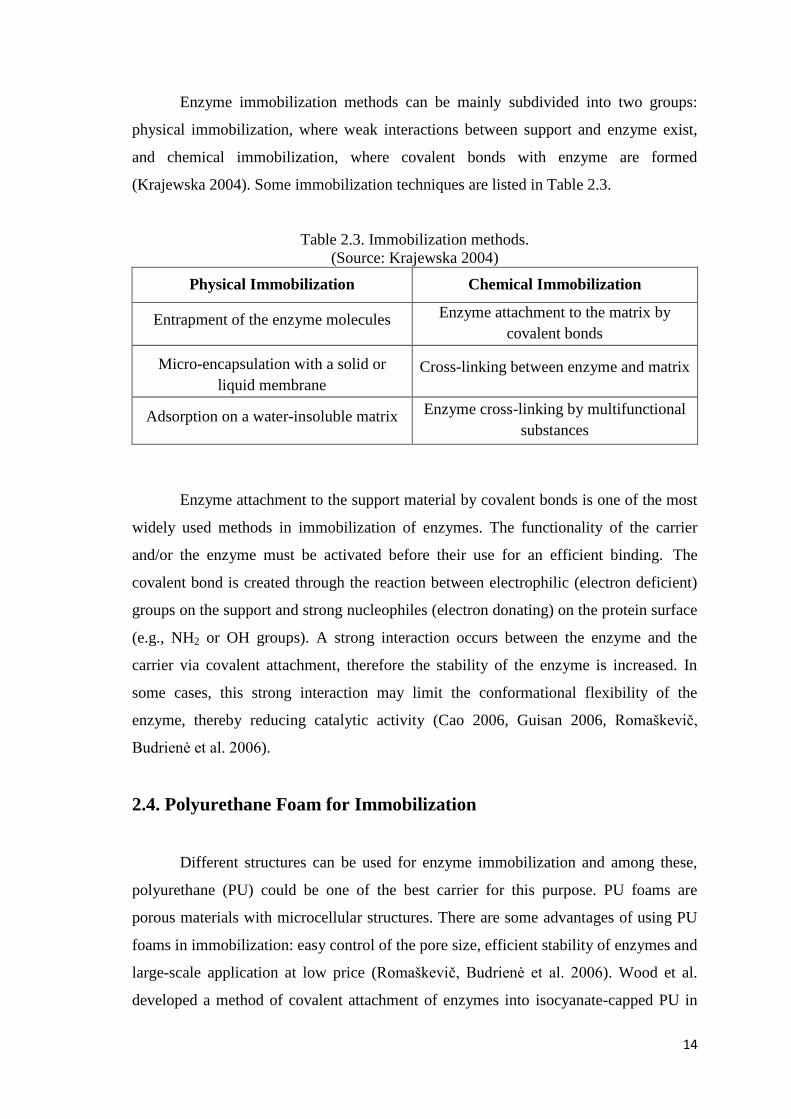
The three-dimensional structure of a bovine carbonic anhydrase (BCA), the
isozyme used in the work for this thesis, is represented in Figure 2.7. BCA contains 259
amino acid residues forming a single polypeptide chain with a molecular weight of
~29000. BCA has mainly two structural components: a central twisted β-sheet
consisting 13 β–strands and seven short α-helices surrounding β –sheets. The active site
is situated in a large conical cleft with a Zn2+
ion as the reaction center. Zn2+
ion is
coordinated by three histidine residues which are located in the middle of the β-sheet.
Finally, the tetrahedral coordination geometry is completed with a H2O molecule around
the zinc ion. The amino acid sequence of CA has 18 lysine groups, mostly bound to the
surface of the enzyme. Enzyme-efficient immobilization is achieved by these lysines
containing amine groups (Ohta, Alam et al. 2004, Höst 2007, Ozdemir 2009).
There are some limitations to estimate accurately the enzymatic activity of CA
in the hydration reaction of CO2 (Ozdemir 2009). CA catalyses the hydrolysis of
phenolic esters as well as reversible hydration of CO2 and this activity has been utilized
by several investigators in their studies. Phenolic esters offer some advantages as being
substrates: more easily handled than CO2 and the reaction rates can be measured by
simple spectrophotometric methods.
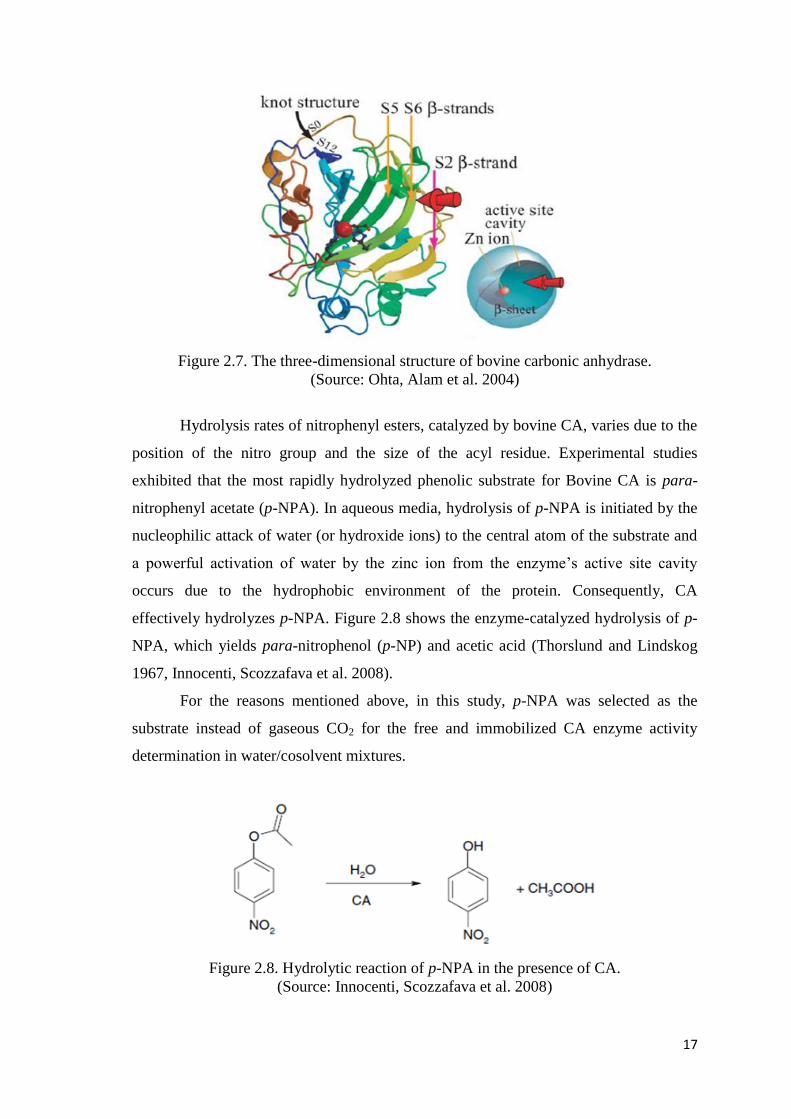
17
Figure 2.7. The three-dimensional structure of bovine carbonic anhydrase.
(Source: Ohta, Alam et al. 2004)
Hydrolysis rates of nitrophenyl esters, catalyzed by bovine CA, varies due to the
position of the nitro group and the size of the acyl residue. Experimental studies
exhibited that the most rapidly hydrolyzed phenolic substrate for Bovine CA is para-
nitrophenyl acetate (p-NPA). In aqueous media, hydrolysis of p-NPA is initiated by the
nucleophilic attack of water (or hydroxide ions) to the central atom of the substrate and
a powerful activation of water by the zinc ion from the enzyme‘s active site cavity
occurs due to the hydrophobic environment of the protein. Consequently, CA
effectively hydrolyzes p-NPA. Figure 2.8 shows the enzyme-catalyzed hydrolysis of p-
NPA, which yields para-nitrophenol (p-NP) and acetic acid (Thorslund and Lindskog
1967, Innocenti, Scozzafava et al. 2008).
For the reasons mentioned above, in this study, p-NPA was selected as the
substrate instead of gaseous CO2 for the free and immobilized CA enzyme activity
determination in water/cosolvent mixtures.
Figure 2.8. Hydrolytic reaction of p-NPA in the presence of CA.
(Source: Innocenti, Scozzafava et al. 2008)
18
2.6. Experimental Studies on Enzymes’ Behaviour in Organic Solvents
To date, many studies have been conducted to investigate the biocatalytic
behaviour and stability of different enzymes in organic solvents. Mozhaev et al. studied
the catalytic performance and denaturation mechanism of α-chymotrypsin and laccase
in different water/organic cosolvent mixtures (Mozhaev, Khmelnitsky et al. 1989). They
have suggested that abrupt fall in enzyme activity at a critical concentration of organic
solvent due to protein denaturation was a general phenomenon occuring in water-
cosolvent mixtures. They indicated that conformational changes (denaturation) of the
enzymes caused the inactivation. They also have shown that the loss of α-chymotrypsin
activity due to the organic cosolvent penetration was completely reversible and a
complete regeneration of the catalytic performance was achieved after dilution of a
70%, by vol. 1,4-butanediol solution with aqueous buffer to 60%, by vol. They reported
that there was a linear correlation between the critical water residues on the enzyme‘s
surface and the hydrophobicity of the organic cosolvents used in the system.
Verma and Ghosh studied the effects of different organic solvents (acetonitrile,
dimethylformamide, methanol, ethanol, dimethyl sulfoxied, ethlyene gycol, propan-2-ol
and tert-butanol) on the α-chymotrypsin catalyzed hydrolysis of p-nitrophenyl acetate
(p-NPA) and p-nitrophenyl benzoate (p-NBA) at pH 7.75 using a cationic surfactant
(Verma and Ghosh 2010). In their study, p-NPA and p-NBA were prepared in 14 %
(v/v) organic solvents and all reactions were conducted spectrophotometrically by
observing the appearance of p-nitrophenoxide ion at 400 nm. They indicated that
enzyme activity was sensitive to type of organic solvents used. The results have shown
that the enzymatic activity decreased dramatically as the polarity of the organic solvent
was increased. They noted that the hydration water content that was available for
solvation of an enzyme was an important factor in enzyme activity. It was suggested
that the solvation water could affect catalytic activity of the enzyme by changing its
conformational flexibility or by effecting its active site hydration. They also reported
that the hydration water was stripped from the enzyme surface to different extents by
organic solvents depending on the solvent polarity.
Yang et al. investigated the solvation of the enzyme subtilisin BPN´ in three
different organic solvents (n-octane, tetrahydrofuran, and acetonitrile) and hydration of
the enzyme and its active site (Yang, Dordick et al. 2004). They indicated that
19
acetonitrile molecules could penetrate the farthest into the enzyme, followed by
tetrahydrofuran, and then n-octane, depending on the polarity of the solvents. They also
noted the penetration of acetonitrile molecules was presumably aided by its relatively
smaller size. They reported that the enzyme surface and its active site region were well
hydrated in aqueous solution, however with increasing polarity of the organic solvent
(octane tetrahydrofuran acetonitrile) the hydration water was removed from
the enzyme surface by the penetration of the solvent molecules into the active site of the
enzyme.
Micaelo and Soares studied the hydration mechanism of the enzyme protease
cutinase in non-polar (hexane, di-isopropyl ether, 3-pentanone) and polar (ethanol,
acetonitrile) organic solvents using molecular dynamics simulations (Micaelo and
Soares 2007). In their study, it was clearly seen that in polar organic solvents, the
amount of water bound at the enzyme surface was very low as compared to that in
nonpolar solvents due to the nature of the organic solvent. They reported that nonpolar
solvents enhanced the formation of large clusters of water that were tightly bound to the
enzyme, whereas water in polar organic solvents was fragmented into single water
molecules and small clusters of water molecules around the protein.
Griebenow and Klibanov investigated the secondary structure of lysozyme in
various water-acetonitrile mixtures using Fourier-transform infrared (FTIR)
spectroscopy (Griebenow and Klibanov 1996). In order to quantify the α-helices of the
enzyme‘s secondary structure, amide I and amide III spectral regions were used in FTIR
analysis. It was found that the α-helice content decreased as the percentage of
acetonitrile in water increased up to 60% (v/v), but then increased at higher percentages
of acetonitrile (beyond 60%). At 0-60% (v/v) acetonitrile, the enzyme was prepared in
dissolved form, however, at higher acetonitrile contents in suspended form. It was
demonstrated that the α-helix content of the protein increased at 60-90% (v/v)
acetonitrile, because the fraction of the dissolved (and more denatured) protein
decreased. They indicated that dissolved protein was more prone to denaturation than
the suspended protein due to the loss of stabilizing protein-protein contacts. They finally
noted that enzymes could be more catalytically active in neat organic solvents than in
aqueous-organic mixtures due to their structural rigidity in such media (compared to
water), resulting in high kinetic barriers preventing unfolding of the enzyme.
Castillo et al. studied the activity loss of various hydrolases in a range of organic
solvents (Castillo, Pacheco et al. 2005). In their study, the results showed a roughly
20
exponential activity decrease for the enzymes which were used in different organic
solvents. The enzymes studied also exhibited similar low storage stability on organic
solvents. They suggested that there was only limited influence of the solvent, the nature
of the enzyme itself, and the enzyme preparation method in deactivation process. They
concluded that inactivation of enzymes in pure organic solvents was due to a breakdown
of the catalytic machinery or a change in the pronotation state of active site residues.
Simon et al. examined the effects of different water-miscible organic solvents
(ethanol, acetonitrile, 1,4-dioxane) on the conformational stabilities of various
hydrolytic enzymes (trypsin, carboxypeptidase A, chymotrypsin and lipase) in buffered
aqueous solution (Simon, Laszlo et al. 1998). These three organic solvents caused only
slight decreases in the activites of trypsin and CPA. However, the activities of
chymotrypsin and lipase decreased dramatically with increasing concentrations of
organic solvents up to 40-50%, but at higher concentrations the enzymes exhibited
increasing activity. They suggested that the ability of the water-miscible organic
solvents to strip away the water molecules from the enzyme caused a reduction in
activity at certain concentrations, but at higher solvent concentrations the properties and
interactions of the solvents might contribute significantly to the preservation of the
catalytic activities of the enzymes. They also noted that the alterations in stability of
enzymes in organic solvents were greatly affected by the individual structures of the
enzymes.
Partridge et al. studied the stability of α-chymotrypsin in aqueous-acetonitrile
mixtures in order to determine whether the native enzyme was thermodynamically or
kinetically stable under low water conditions (Partridge, Moore et al. 1999). In the
experiment, high catalytic activities were obtained at high water levels, but in 50%
acetonitrile, it lost all its activity after 10 minutes. However, at higher acetonitrile
percentages the enzyme exhibited significant catalytic activity. After this assay, they
investigated whether the denatured enzyme in 50% acetonitrile could be renatured by
adding water or more acetonitrile. They observed full regeneration of catalytic activity
of the fully denatured enzyme when a solution of α-chymotrypsin in 50% acetonitrile
was diluted with aqueous buffer to 5% by volume. However, recovery of the enzyme‘s
catalytic properties could not be attained on addition of acetonitrile (to 70% v/v) to the
fully denatured enzyme in 50% acetonitrile. These results demonstrated that
denaturation of α-chymotrypsin is thermodynamically reversible by addition of water.
In contrast, it was thermodynamically irreversible in the case of adding more
21
acetonitrile. They also investigated the stability of the enzyme in 70% acetonitrile. It
was found that 70% of the enzyme remained intact even after incubating for 3 h. They
concluded that α-chymotrypsin is kinetically stable at low water content in acetonitrile.
Zhu et al. investigated the effects of acetonitrile on γ-chymotrypsin with the
inclusion of crystal waters using combined molecular dynamics simulation with
quantum mechanics calculation (Zhu, Yang et al. 2012). The results showed that the
acetonitrile molecules penetrated into the enzyme‘s active site would give rise to a
weakness in the strength of the catalytic H-bond networks. They also reported that the
drop in the catalytic activity in the presence of acetonitrile might be associated with the
lower flexibility and the increased proton-transfer barrier.
Sirotkin and his co-workers studied solubility and secondary structure of bovine
pancreatic α-chymotrypsin in acetonitrile-water mixtures (Sirotkin, Zazybin et al. 2000).
In the light of the results, they suggested that the changes in α-chymotrypsin solubility
and secondary structure in water-acetonitrile mixtures could be explained as a result of
two main factors: disruption of three dimensional hydrogen bond network of water
molecules leading to weakening of hydrophobic interactions, and reduction of
conformational motility of the protein molecule in water-poor media.
Safarian et al. investigated the effects of acetonitrile on the structure and
function of bovine carbonic anhydrase II (Safarian, Saffarzadeh et al. 2006). The
potential structural alterations in carbonic anhydrase was determined in the presence of
different acetonitrile/buffer ratios . The results exhibited that the increase in acetonitrile
content in the mixture was followed by a decrease in enzymatic rate, especially at
47.5% acetonitrile. They suggested that this could be due to the tertiary structural
alterations of carbonic anhydrase and the reorientation of residues near the active site of
the protein, thus resulting in a decrease in enzyme activity. In order to evaluate the
possible structural changes of the enzyme, three critical points (0%, 17.5% and 47.5%
v/v), which represented the sharp decline in the enzyme velocity, were selected from
among the acetonitrile/buffer ratios. It was reported that the presence of acetonitrile in
the medium had minimum effect on the secondary structure of carbonic anhydrase.
However, thermal stability of the enzyme in the presence of acetonitrile was drastically
decreased due to a rigorous decline in the melting temperature of the enzyme, especially
at 47.5% acetonitrile, which was consistent with the results observed in the enzymatic
rate changes. They suggested that the existence of acetonitrile in the medium caused a
22
considerable lowering of the dielectric constant of water and weakening of hydrophobic
interactions, thus decreasing structural stability of the enzyme.
2.7. Immobilized Enzymes in Water-Miscible Organic Solvents
Costas et al. examined the effects of various water-miscible organic solvents on
free and immobilized lipase in pectin microspheres (Costas, Bosio et al. 2008). Lipase
was encapsulated into pectin hyrogel beads via cross-linking with calcium ions. Free
lipase was tested at 0% to 90% concentrations of water-miscible organic solvents
(diethylenglycol, glycerol, 1,2 propanediol and dimethylsulfoxide) for 1 to 12 h of
incubation. After 12 h of incubation, stability of the enzyme decreased about 20% in all
organic solvents, except DMF and DMSO. In the presence of these two solvents, the
stability was reduced drastically at higher percentages. On the other hand, immobilized
lipase was studied to test the water-miscible solvents at 50% concentration. It was
demonstrated that in the immobilized system, the lipase activity was significantly
enhanced or preserved even after 12 h of incubation.
Wan et al. studied the effects of organic solvents on the activity of free and
immobilized laccase (Wan, Lu et al. 2010). Laccase was covalently immobilized onto
chitosan by chemical derivatisation. Free and immobilized laccase activity was
measured in triplicate spectrophotometrically using 2,6-dimethoxyphenol as substrate.
In this study, the relative acitivities of free and immobilized laccase in a range of
water/water-miscible organic solvent mixtures were examined as a function of
increasing water content. It was demonstrated that with water-miscible organic solvents,
in general a water content of ~20-50% (v/v) was required to achieve activity using free
laccase, whereas with immobilized laccase less water was generally required to achieve
enzyme activity. Hence, substantially higher enzyme activity was exhibited for
immobilized laccase at lower water contents, compared with free laccase. They
suggested that microenvironment of the enzyme immobilized on chitosan provided
additional stability in preserving the active enzyme conformation.
Olofsson et al. examined the influence of a range of water-miscible organic
solvents (methanol, ethanol, 1-propanol, 2-propanol, acetonitrile, N,N´-
dimethylformamide and tetrahydrofuran) on the activity of α-chymotrypsin in solution
and immobilized on Eupergit CM (Olofsson, Soderberg et al. 2006). The covalent
attachment of the enzyme to solid matrice was achieved by mixing the enzyme in buffer
23
containing Eupergit CM (an epoxy-activated microporous acrylic microbead support).
After 24 h of incubation, an effective obliteration of activity for free α-chymotrypsin
was determined in all organic solvent/buffer mixtures (50%, v/v). However, in the case
of immobilized α-chymotrypsin, enzymatic activities after 24 h exposure were
significantly higher than for free enzyme in the corresponding solution, about 10- to 50-
fold. They also studied the effect of the concentration (0-95%, v/v) of three organic
solvents, acetonitrile, N,N´- dimethylformamide and ethanol, on both free and
immobilized α-chymotrypsin using 6 h pre-incubation periods. It was demonstrated that
in the case of free enzyme, activities diminished at 40-50% (v/v) concentrations of
solvents, whereas the immobilized α-chymotrypsin achieved measurable activities in up
to 90% (v/v) acetonitrile, 60% (v/v) N,N´- dimethylformamide and 60% (v/v) ethanol.
Azevedo et al. studied enzymatic activity and stability in aqueous–organic co-
solvent mixtures, using horseradish peroxsidase (HRP) both free in solution and
immobilised onto silica microparticles (Azevedo, Prazeres et al. 2001). Both free and
immobilised HRP was tested at 50ºC in aqueous mixtures of 3.5, 20, 35 and 50% (v/v)
DMSO. It was found that stability of free HRP was not affected by the presence of 3.5
and 20% DMSO, but a severe decrease in stability was observed for higher contents.
The half-life of immobilised HRP increased more than 300% when changing from
buffer to 20% DMSO, however, at higher organic solvent contents, the enzyme half-life
was decreased. It was also demonstrated that the stability of immobilised HRP was
higher than that of the free form in all aqueous mixtures of DMSO.
O‘Daly et al. investigated the effects of different organic solvents (ethanediol,
acetonitrile, and dichloromethane) on the activity and stability of free and immobilized
bovine carbonic anhydrase (BCA) (Odaly, Crumbliss et al. 1990). In their study, BCA
was immobilized on porous silica beads by covalent attachment via a spacer arm. The
catalytic activity of the enzyme was determined by measuring the rate of hydrolysis of
p-NPA. The results exhibited that catalytic activity of both free and immobilized BCA
decreased as the solvent was changed from 1.0-mol fraction aqueous buffer to 1.0-mol
fraction organic solution for all three organic solvents. It was shown that immobilized
BCA retained its activity in aqueous/organic solvent mixtures to a greater extent than
free BCA. In water/ethanediol mixtures, the immobilized enzyme maintained activity up
to nearly anhydrous conditions, whereas the free enzyme lost all of its activity. In
water/acetonitrile mixtures, free BCA had no activity in mole fractions above 0.34,
while immobilized BCA had significant activity up to 1.0-mole fraction acetonitrile. It
24
was also found that immobilization on silica beads significantly enhanced the storage
stability of BCA in organic solvents. After storage in ethanediol or acetonitrile for 24 h,
free BCA regained only 15% of its original activity in water, while immobilized BCA
showed 77% of its original activity. In the case of dichloromethane, immobilized BCA
retained 22% of its original activity in water, while free BCA was totally inactivated
after storage for 24 h.
In the present study, it was aimed to investigate the effects of water-miscible
organic solvents on the activity and stability of the free and immobilized CA enzyme
within PU foam.
25
CHAPTER 3
MATERIALS AND METHODS
3.1. Materials
Carbonic Anhydrase (CA) from bovine erythrocytes (MW, 29000; 89% pure in
protein as dialyzed and lyophilized powder), para-nitrophenyl acetate (p-NPA), para-
nitrophenol (p-NP) were all purchased from Sigma-Aldrich. Acetonitrile (99.9%, v/v),
ethanol (99.9%, v/v), and hydrochloric acid (35%, v/v) were purchased from Merck.
Polyurethane prepolymer, HYPOL-2060, was provided as a kind gift from Dow
Chemical Co., Turkey.
Equipments used were UV/vis spectrophotometer (Perkin Elmer Lambda 45),
humidity meter (COMET H3531P), magnetic stirrer (LABART SHT-5), and pH meter
(Thermo Electron Corporation, Orion 5 Star).
3.2. Determination of the Water Holding Capacity of PU Foam
Hydrophilicity of immobilizing carriers is an important factor for enzyme
immobilization and efficient enzymatic reactions in organic media. For this purpose,
water holding capacity of the PU foam was determined by a simple experimental study.
Firstly, PU foam was synthesized. Briefly, 3 mL of ultra pure water was poured onto
about 3 g of HYPOL-2060 prepolymer in a 50 mL falcon tube. The two-phase system
was mixed vigorously for 30 s by the help of a mixer drill to achieve a homogeneous
mixture. When the mixing was settled, the level of the white polymeric solution started
to rise as a result of CO2 release. After the polymerization, 10 min were allowed for
curing. After synthesis of the PU foam, different weights of foam pieces were cut from
the whole product. The foam pieces were soaked and squeezed several times in ultra
pure water and then the soaked foam pieces were weighed to determine their wet
weight. Finally, the soaked foams were dried in an oven at 105˚C overnight to
determine their dry weight.
26
3.3. Moisture Adsorption on PU Foam
In order to determine the adsorption isotherm of moisture on PU foam, different
saturated salt solutions were prepared in glass jars with respect to their equilibrium
relative humidities. Selected salts were: Potassium sulfate (97.6%), Potassium nitrate
(94.62%), Potassium chloride (85.11%), Sodium chloride (75.47%), Magnesium nitrate
hexahydrate (54.38%), Potassium carbonate (43.16%), Magnesium chloride
hexahydrate (33.07%), Potassium acetate (23.11%), and Lithium chloride (11.31%). PU
foam was synthesized and then five different weights of foam piece were cut from the
middle of the whole product and assayed for each incubation in the presence of the
saturated salt solution. Foam pieces were incubated in closed glass jars, which contain
the saturated salt solution, for 4-7 days at ambient temperature. Foams were weighed at
1 h intervals for the first 4 hours, then at 24 h intervals for 4-7 days until the weight of
foam pieces became constant. Finally, foams were dried in an oven at 105ºC overnight
to determine their dry weight. The relative humidity of each closed system containing
saturated salt solution was also measured with the humidity meter (COMET H3531P)
for the calibration.
3.4. Characterization of p-NP
p-NP is one of the hydrolysis products of p-NPA. A 0.0146 g sample of p-NP
was dissolved in 10 ml of Tris buffer (50 mM, pH 7.72) to establish a stock solution. p-
NP solutions with concentrations of 0.08, 0.06, 0.04, 0.02, and 0.01 mM were prepared
by dilution of the stock solution. Afterwards, these solutions were scanned between 200
nm and 600 nm in the UV/vis spectrophotometer to establish a plot of absorbance with
respect to wavelength. The absorbance scanning for p-NP in Tris buffer (50 mM) with
different pHs (8.86, 8.38, 7.82, 7.35, 6.84) was also performed in the UV/vis
spectrophotometer keeping the p-NP concentration in the solutions constant.
27
3.5. Determination of the Absorbance Profiles for p-NP in the Presence
of the Organic Solvents
Two water-miscible organic solvents, acetonitrile and ethanol, were used for the
enzyme activity assays in this study. The absorbance profiles of p-NP in
acetonitrile/buffer and ethanol/buffer mixtures were established, respectively, by
scanning the absorbance of p-NP between 200 nm and 800 nm in the UV/vis
spectrophotometer. The stock solution of p-NP was used for dilution. The final
concentrations of p-NP in the acetonitrile/buffer and ethanol/buffer mixtures were
104.95 µM and 42.55 µM, respectively. The volume percents of the organic solvents in
the mixtures ranged from 10% to 90%. These measurements were also carried out for
acetonitrile/buffer mixtures keeping the Tris concentration (50 mM) in the mixtures
constant.
3.6. Determination of pH Values for Different Concentrations of the
Organic Solvent
The pH values of organic solvent/buffer mixtures were measured in the pH
meter in order to determine whether pH changed with various organic solvent
concentrations. The mixtures were prepared by mixing the organic solvents with Tris
buffer (50 mM, pH 7.72) at various ratios ranging from 10% to 90% (v/v). These
measurements were also carried out keeping the Tris concentration constant at 50 mM.
3.7. Self-Hydrolysis of p-NPA in the Presence of the Organic Solvents
The absorbance scanning for self-hydrolysis of p-NPA was conducted between
200 nm and 600 nm in the UV/vis spectrophotometer at different concentrations of the
organic solvent while keeping the p-NPA concentration in the mixtures constant. A
0.0666 g of p-NPA was dissolved in 6 ml acetonitrile and a 0.0462 g of p-NPA was
dissolved in 10 ml of ethanol. The final concentrations of p-NPA were 2.677 mM and
2.55 mM in the acetonitrile/buffer and ethanol/buffer mixtures, respectively. The self-
hydrolysis of p-NPA was also estimated in Tris buffer containing 10% acetonitrile with
28
various pHs (8.86, 8.38, 7.82, 7.35, 6.84, 6.29, 5.78, 5.26) in order to determine the
effect of pH change on the self-hydrolysis rate.
3.8. Calibration Curves
Calibration curves for p-NP were prepared in the presence of the organic
solvents after the absorbance values of p-NP samples were measured in the UV/vis
spectrophotometer at 400 nm and 404 nm for acetonitrile/buffer and ethanol/buffer
mixtures, respectively. The absorbances were determined in various percent volume
organic solvent/buffer mixtures (10-90% v/v). The stock solution of p-NP was diluted to
five different concentrations for each organic solvent/buffer mixture. At the end of the
measurements, the calibration curves were established as concentration versus
absorbance.
3.9. Immobilization of Carbonic Anhydrase within PU Foam
A known amount of CA in powder was dissolved in 4 mL of ultra pure water
and poured onto about 4 g of HYPOL-2060 prepolymer in a 50 mL falcon tube. The
two-phase system was mixed vigorously for 30 s at room temperature by the help of a
mixer drill to achieve a homogeneous mixture. When the mixing was settled, the level
of the white polymeric solution started to rise as a result of CO2 release. After the
polymerization, 10 min were allowed for curing.
3.10. Enzyme Activity Assays
The activities of free and immobilized enzyme were measured at 25ºC by
monitoring the changes in the concentration of p-NP. Enzyme activities for both free and
immobilized enzyme were estimated in acetonitrile/buffer and ethanol/buffer mixtures
of varying compositions (10%, 20%, 30%, 40%, 50%, 60%, 70%, 80%, and 90%
organic solvent v/v). For the free enzyme, the activity assay was carried out in a 1 ml
UV quartz cuvette. A known amount of p-NPA was dissolved in the organic solvent
similarly, the powder enzyme was dissolved in Tris buffer (50 mM, pH 7.72). The
substrate (0.1 mL of p-NPA solution) and the enzyme concentration (0.1 mL of enzyme

29
solution) were kept constant in the reaction mixtures. Before the activity assays, blank
run was monitored to estimate the self-hydrolysis of p-NPA in each mixture. The
reaction mixture was mixed in the cuvette by the help of a micropipet. The enzyme
activity was measured in the UV/vis spectrophotometer at 400 nm and 404 nm for 2
minutes in the acetonitrile/buffer and ethanol/buffer mixtures, respectively. Effect of
substrate concentration on the enzymatic rate was also estimated in the presence of 10%
acetonitrile v/v. For this purpose, a 0.0603 g sample of p-NPA was dissolved in 4ml of
acetonitrile. Afterwards, a 0.0053 g sample of CA was dissolved in 3 ml of Tris buffer
(50 mM, pH 7.72). p-NPA solution was diluted to different concentrations. After the
solutions were prepared, the CA activity test was carried out. A 0.8 ml of tris buffer, 0.1
ml of CA solution, and 0.1 ml of p-NPA solution was mixed in the cuvette and
absorbance of the solution was measured in the UV/vis spectrophotometer at 400 nm for
2 minutes. Consequently, different concentrations of p-NPA (8.321, 5.547, 4.165,
2.774, 2.08, 1.664, 1.04, and 0.832 mM) were tested in the assays.
The activity assays for the immobilized CA enzyme were performed in a small
batch reactor containing 20 mL reaction mixture. Firstly, blank experiment was
conducted by mixing a 0.5 mL of substrate solution (p-NPA dissolved in the organic
solvent) with 19.5 mL of buffer/organic solvent mixture on a magnetic stirrer to
estimate the self-dissociation of p-NPA in each reaction mixture. Afterwards, the
reaction was initiated by adding the enzyme immobilized foam into the mixture. In
every minute, 1 mL of sample was withdrawn from the reaction mixture and its
absorbance was measured in the UV/vis spectrophotometer at 400 nm and 404 nm for
acetonitrile/buffer and ethanol/buffer mixtures, respectively, and the sample was
returned back into the reaction mixture in order to keep the reaction mixture‘s volume
constant. This procedure was repeated for each buffer/organic solvent mixture at 1 min
intervals for 20 min. At the end of the assays, the foam samples were dried in an oven at
105ºC over night to determine their dry weights. Seperate foam pieces were prepared
for each buffer/organic solvent mixture to determine the immobilized enzyme activity.
Before adding the foam into the substrate-containing mixture, the foam piece was
squeezed several times in the organic solvent/buffer mixture containing the same
concentration of the organic solvent in the reaction mixture in order to achieve an
efficient mass transfer within the foam. After an assay was performed, a fresh reaction
mixture was prepared for the next assay.
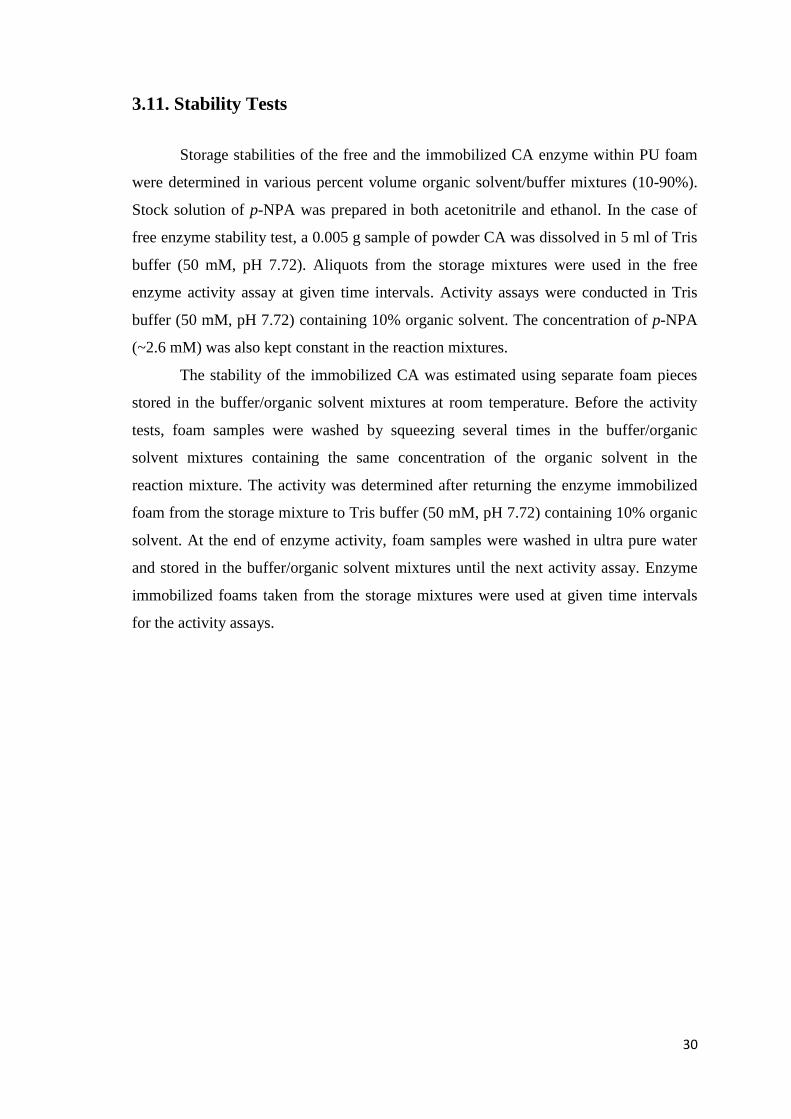
30
3.11. Stability Tests
Storage stabilities of the free and the immobilized CA enzyme within PU foam
were determined in various percent volume organic solvent/buffer mixtures (10-90%).
Stock solution of p-NPA was prepared in both acetonitrile and ethanol. In the case of
free enzyme stability test, a 0.005 g sample of powder CA was dissolved in 5 ml of Tris
buffer (50 mM, pH 7.72). Aliquots from the storage mixtures were used in the free
enzyme activity assay at given time intervals. Activity assays were conducted in Tris
buffer (50 mM, pH 7.72) containing 10% organic solvent. The concentration of p-NPA
(~2.6 mM) was also kept constant in the reaction mixtures.
The stability of the immobilized CA was estimated using separate foam pieces
stored in the buffer/organic solvent mixtures at room temperature. Before the activity
tests, foam samples were washed by squeezing several times in the buffer/organic
solvent mixtures containing the same concentration of the organic solvent in the
reaction mixture. The activity was determined after returning the enzyme immobilized
foam from the storage mixture to Tris buffer (50 mM, pH 7.72) containing 10% organic
solvent. At the end of enzyme activity, foam samples were washed in ultra pure water
and stored in the buffer/organic solvent mixtures until the next activity assay. Enzyme
immobilized foams taken from the storage mixtures were used at given time intervals
for the activity assays.
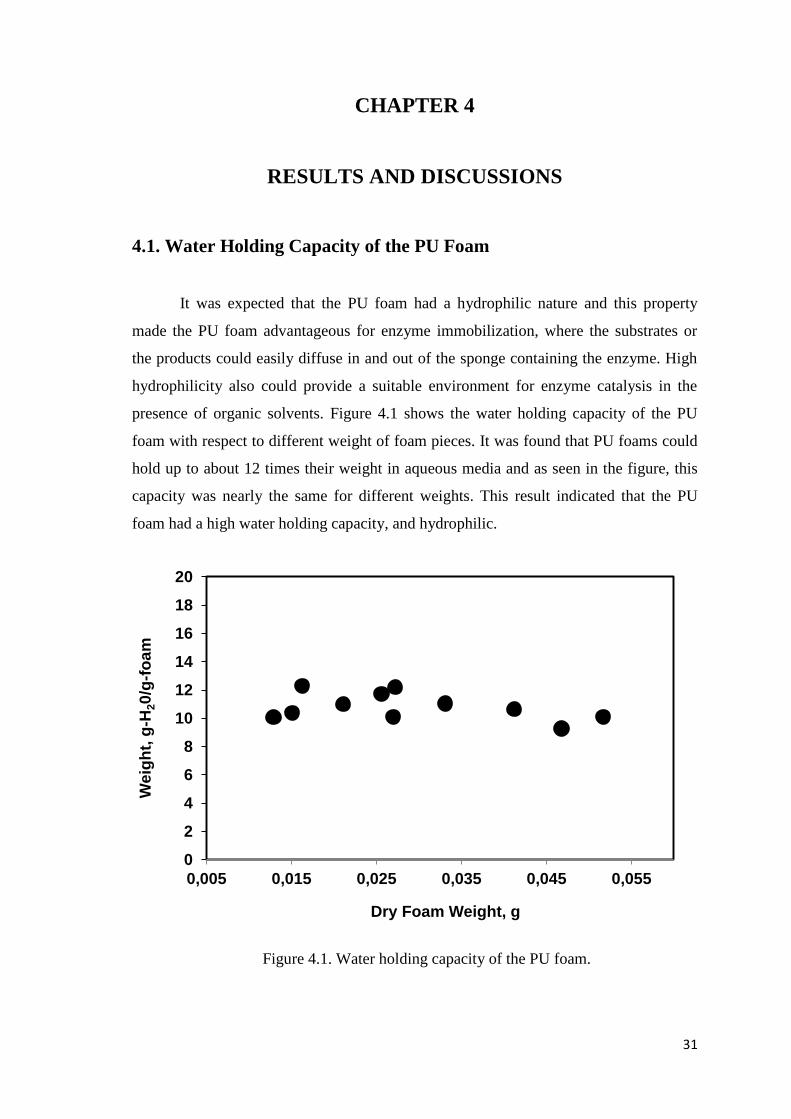
31
CHAPTER 4
RESULTS AND DISCUSSIONS
4.1. Water Holding Capacity of the PU Foam
It was expected that the PU foam had a hydrophilic nature and this property
made the PU foam advantageous for enzyme immobilization, where the substrates or
the products could easily diffuse in and out of the sponge containing the enzyme. High
hydrophilicity also could provide a suitable environment for enzyme catalysis in the
presence of organic solvents. Figure 4.1 shows the water holding capacity of the PU
foam with respect to different weight of foam pieces. It was found that PU foams could
hold up to about 12 times their weight in aqueous media and as seen in the figure, this
capacity was nearly the same for different weights. This result indicated that the PU
foam had a high water holding capacity, and hydrophilic.
Figure 4.1. Water holding capacity of the PU foam.
0
2
4
6
8
10
12
14
16
18
20
0,005 0,015 0,025 0,035 0,045 0,055
We
igh
t, g
-H20
/g-f
oa
m
Dry Foam Weight, g
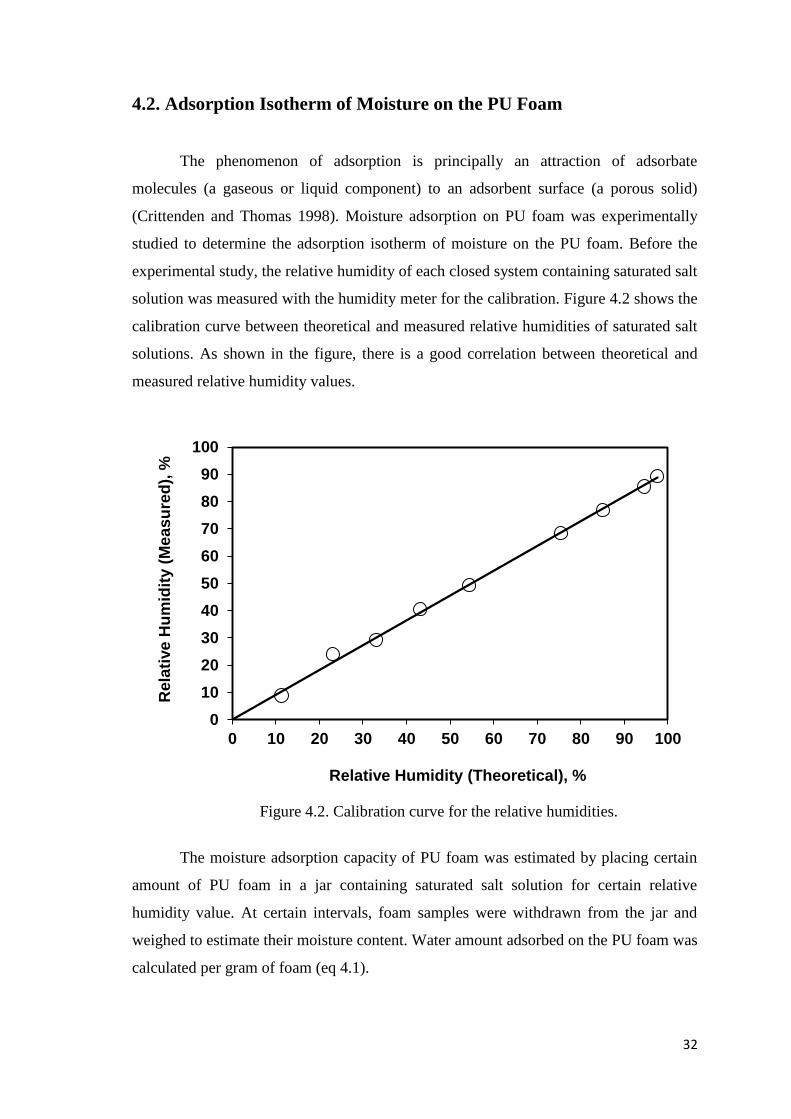
32
4.2. Adsorption Isotherm of Moisture on the PU Foam
The phenomenon of adsorption is principally an attraction of adsorbate
molecules (a gaseous or liquid component) to an adsorbent surface (a porous solid)
(Crittenden and Thomas 1998). Moisture adsorption on PU foam was experimentally
studied to determine the adsorption isotherm of moisture on the PU foam. Before the
experimental study, the relative humidity of each closed system containing saturated salt
solution was measured with the humidity meter for the calibration. Figure 4.2 shows the
calibration curve between theoretical and measured relative humidities of saturated salt
solutions. As shown in the figure, there is a good correlation between theoretical and
measured relative humidity values.
Figure 4.2. Calibration curve for the relative humidities.
The moisture adsorption capacity of PU foam was estimated by placing certain
amount of PU foam in a jar containing saturated salt solution for certain relative
humidity value. At certain intervals, foam samples were withdrawn from the jar and
weighed to estimate their moisture content. Water amount adsorbed on the PU foam was
calculated per gram of foam (eq 4.1).
0
10
20
30
40
50
60
70
80
90
100
0 10 20 30 40 50 60 70 80 90 100
Rela
tive
Hu
mid
ity (
Me
as
ure
d),
%
Relative Humidity (Theoretical), %
33
(4.1)
Figure 4.3 shows the moisture adsorption kinetics of different weights of foam
pieces in the presence of potassium chloride with a 85.11% relative humidity. Because
newly produced PU foam contained excess amount of water, the foam pieces lost their
weight until the system reached an equilibrium in the presence of saturated salt solution.
The equilibrium water amount was estimated at the very late stage of the kinetic data
and calculated according to eq 4.1.
Figure 4.3. Moisture adsorption on PU foam.
Figure 4.4 shows the adsorption of water on PU foam. As shown in the figure,
there is almost an exponential relationship between the water amount adsorbed on the
PU foam and the relative humidity of saturated salt solution, as shown in Figure 4.5.
This relationship corresponds to a Type III adsorption isotherm. Type III isotherm,
which was continuously convex with respect to the relative humidity axis, showed a
steady increase in adsorption capacity with increasing relative humidity (Crittenden and
Thomas 1998). Type III isotherm include capillary condensation in addition to the
multimolecular adsorption layer (Ng, El-Sharkawy et al. 2008). Therefore, the increase
0
0,2
0,4
0,6
0,8
1
1,2
0 20 40 60 80 100
We
igh
t, g
-H2O
/g-f
oa
m
Time, h
0.1583 g-foam
0.0727 g-foam
0.0409 g-foam
0.027 g-foam
34
in capacity at high relative humidities was due to capillary condensation occurring in
pores if any, and condensation on the surface of the PU foam as the saturated vapor
pressure was raised (Ruthven 1984). Type III also gives adsorption isotherms on
macroporous adsorbents with weak affinities. As a result, while expecting a high water
adsorption capacity, PU foam showed a type III adsorption isotherm, indicating that,
indeed, there were very weak water-PU foam interactions.
Figure 4.4. Adsorption isotherm of the PU foam.
At the beginning of our study, our objective was to use both water-miscible and
water-immiscible organic solvents, for the CA activity. Figure 4.5 illustrates a small
jacketed reactor system in which enzymatic reaction occured within the PU foam in the
presence of an immiscible organic solvent. We know that, especially in non-polar
organic solvent systems, a sufficient water content is crucial for the conformation of the
enzyme and the enzyme activity. If there were sufficient water molecules adsorbed on
the PU foam, these water molecules could provide a good microenvironment for the
enzyme catalysis in the presence of immiscible organic solvent. Therefore, a presence of
moisture was aimed in the PU foam containing the CA enzyme. However, when the
immobilized enzyme activity assay was performed in the presence of toluene, a water-
immiscible organic solvent, water was extracted by toluene creating droplets in the
mixture, therefore UV/vis spectrophotometer could not be accurately detected the p-NP
0
0,05
0,1
0,15
0,2
0,25
0,3
0,35
0,4
0 10 20 30 40 50 60 70 80 90 100
We
igh
t, g
-H2O
/g-f
oa
m
Relative Humidity, %
35
as the product in the cuvette. As a result, effect of water-immiscible solvents on the
immobilized CA activity could not be realised. Therefore, enzyme activity assays were
only conducted in the presence of water-miscible organic solvents.
Figure 4.5. Schematic representation of a small jacketed reactor.
4.3. pH Effect on the Absorbance of p-NP
p-NP was dissolved in Tris buffer with various pHs and its absorbance was
scanned in the UV/vis spectrophotometer. Figure 4.6 shows the change of absorbance
for p-NP solutions with different pHs. It was found that the absorbance of p-NP
increased as the pH value of the buffer solution was increased at constant p-NP
concentration. This indicates that pH of the medium is a parameter effecting the
absorbance of p-NP in buffer solution. Wavelengths of the solutions gave two peaks at
400 nm and 348 nm, as shown in the figure. These two peaks show the unprotonated
species of p-NP and the total p-NP concentration, respectively. The absorbance value
stayed unchanged at isosbestic point (348 nm) at constant p-NP concentration, at which
spectras cross each other.
immiscible organic solvent
Adsorbed H2O
Foam
p-NPA p-NP
36
Figure 4.6. Absorbance values for p-NP solutions with respect to wavelength with
different pHs.
Figure 4.7 shows the ratio of the absorbances at 400 nm to the absorbance at 348
nm. As can be seen in the figure, ratio of the p-NP absorbances (λ400/348) increased with
increasing pH value of the p-NP solutions. This indicated that the absorbance of p-NP is
pH-dependent.
Figure 4.7. Ratio of the p-NP absorbances for λ400/348 with respect to various pHs.
0
0,2
0,4
0,6
0,8
1
1,2
1,4
1,6
1,8
2
200 250 300 350 400 450 500 550
Ab
so
rba
nc
e, A
U
Wavelength, nm
pH 8.86
pH 8.38
pH 7.82
pH 7.35
pH 6.84
0
0,5
1
1,5
2
2,5
3
3,5
4
6,5 7 7,5 8 8,5 9
Rati
o (
P/I
)
pH
P
I
isosbestic point
protonated form
deprotonated form
37
4.4. The Absorbance Scanning of p-NP in Tris Buffer
Different concentrations of p-NP in Tris buffer (50 mM, pH 7.72) were scanned
between 200 nm and 600 nm in the UV/vis spectrophotometer at constant pH. It was
observed that wavelengths of the solutions gave the peak at 400 nm, as seen in Figure
4.8. Increase in the p-NP concentration resulted in a significant increase in the
absorbance value for the same wavelength.
Figure 4.8. Change of the absorbance for different p-NP concentrations with
wavelength.
Figure 4.9 shows the absorbance values for p-NP at 400 nm and at the isosbestic
wavelength (λ343) with p-NP concentration. This result demonstrated that the
absorbance of p-NP in Tris buffer was also concentration-dependent.
0
0,2
0,4
0,6
0,8
1
1,2
200 250 300 350 400 450 500 550
Ab
so
rban
ce
, A
U
Wavelength, nm
0.08 mM
0.06 mM
0.04 mM
0.02 mM
0.01 mMisosbestic point = λ343

38
Figure 4.9. Absorbance changes for p-NP at the peak and isosbestic wavelength.
The ratio of the absorbances at these two wavelengths stayed nearly unchanged
with respect to different p-NP concentrations, as seen in Figure 4.10. This result
indicated that the ratio of the absorbances was independent of concentration at constant
pH.
Figure 4.10. The ratio of p-NP absorbances with respect to various p-NP concentrations.
0
0,2
0,4
0,6
0,8
1
1,2
0 0,02 0,04 0,06 0,08
Ab
so
rban
ce
, A
U
Concentration, mM
λ400
λ343
0
0,9
1,8
2,7
3,6
4,5
0 0,02 0,04 0,06 0,08
Rati
o (
λ400/3
43)
Concentration, mM
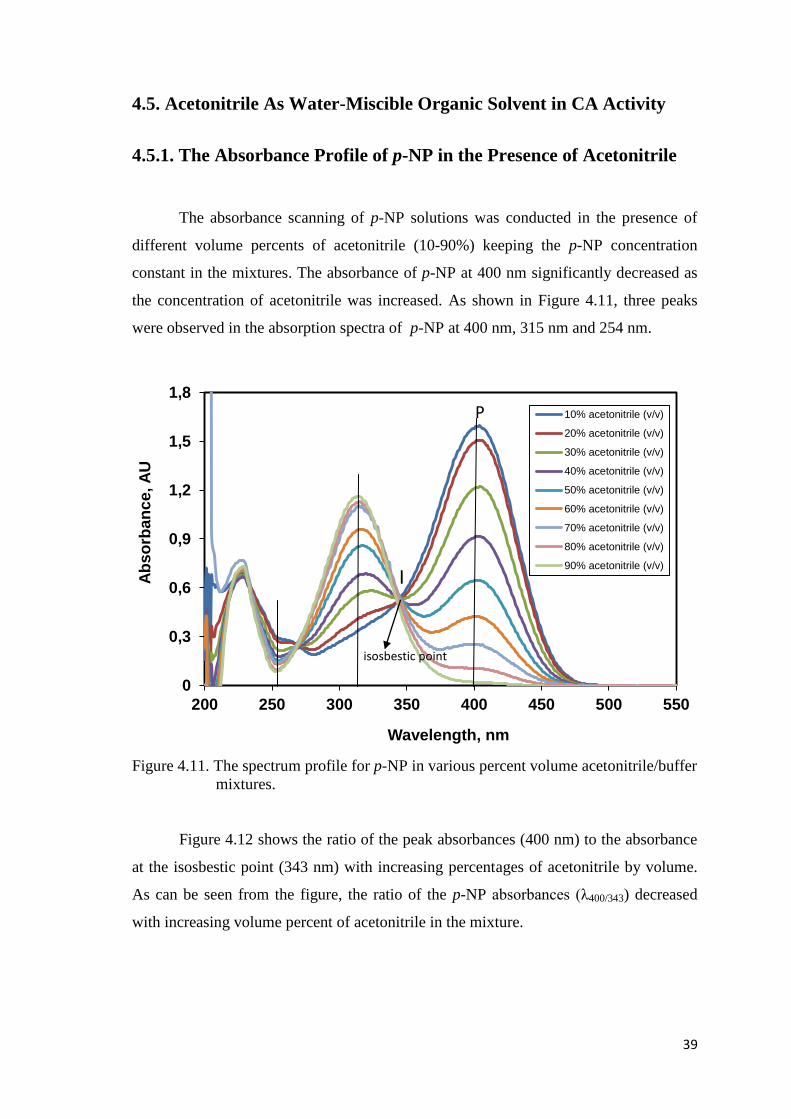
39
4.5. Acetonitrile As Water-Miscible Organic Solvent in CA Activity
4.5.1. The Absorbance Profile of p-NP in the Presence of Acetonitrile
The absorbance scanning of p-NP solutions was conducted in the presence of
different volume percents of acetonitrile (10-90%) keeping the p-NP concentration
constant in the mixtures. The absorbance of p-NP at 400 nm significantly decreased as
the concentration of acetonitrile was increased. As shown in Figure 4.11, three peaks
were observed in the absorption spectra of p-NP at 400 nm, 315 nm and 254 nm.
Figure 4.11. The spectrum profile for p-NP in various percent volume acetonitrile/buffer
mixtures.
Figure 4.12 shows the ratio of the peak absorbances (400 nm) to the absorbance
at the isosbestic point (343 nm) with increasing percentages of acetonitrile by volume.
As can be seen from the figure, the ratio of the p-NP absorbances (λ400/343) decreased
with increasing volume percent of acetonitrile in the mixture.
0
0,3
0,6
0,9
1,2
1,5
1,8
200 250 300 350 400 450 500 550
Ab
so
rban
ce
, A
U
Wavelength, nm
10% acetonitrile (v/v)
20% acetonitrile (v/v)
30% acetonitrile (v/v)
40% acetonitrile (v/v)
50% acetonitrile (v/v)
60% acetonitrile (v/v)
70% acetonitrile (v/v)
80% acetonitrile (v/v)
90% acetonitrile (v/v)
isosbestic point
P
I
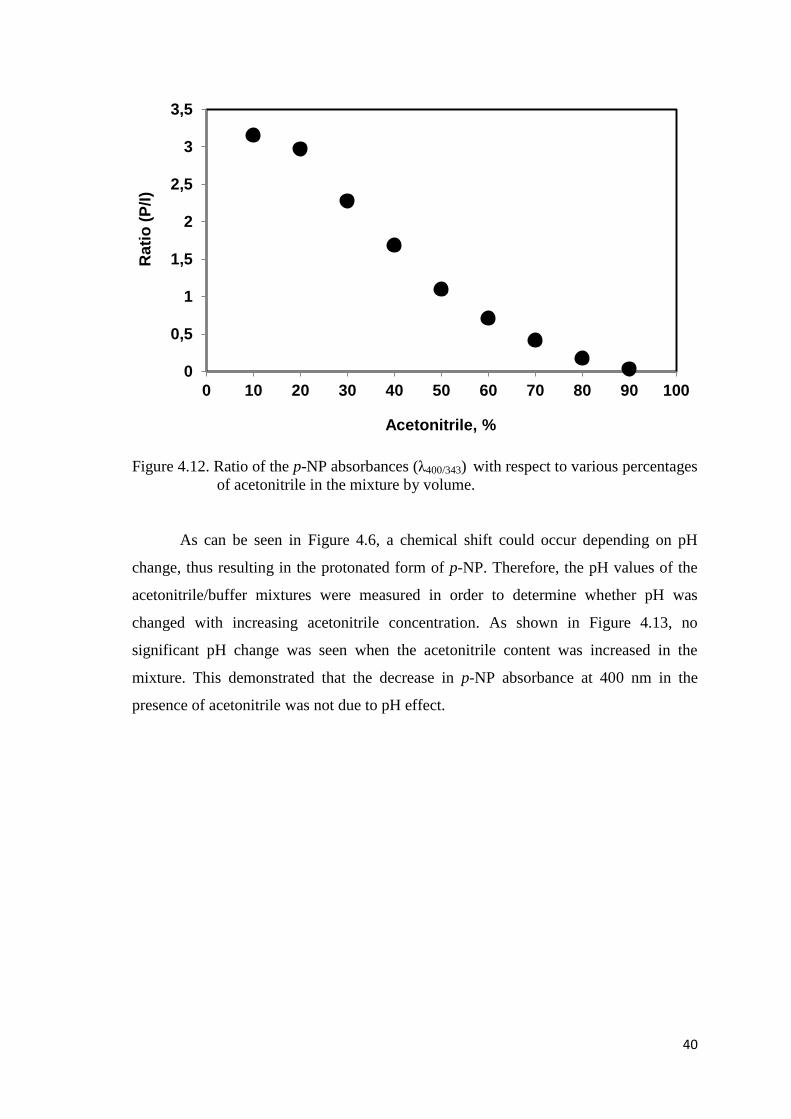
40
Figure 4.12. Ratio of the p-NP absorbances (λ400/343) with respect to various percentages
of acetonitrile in the mixture by volume.
As can be seen in Figure 4.6, a chemical shift could occur depending on pH
change, thus resulting in the protonated form of p-NP. Therefore, the pH values of the
acetonitrile/buffer mixtures were measured in order to determine whether pH was
changed with increasing acetonitrile concentration. As shown in Figure 4.13, no
significant pH change was seen when the acetonitrile content was increased in the
mixture. This demonstrated that the decrease in p-NP absorbance at 400 nm in the
presence of acetonitrile was not due to pH effect.
0
0,5
1
1,5
2
2,5
3
3,5
0 10 20 30 40 50 60 70 80 90 100
Rati
o (
P/I
)
Acetonitrile, %
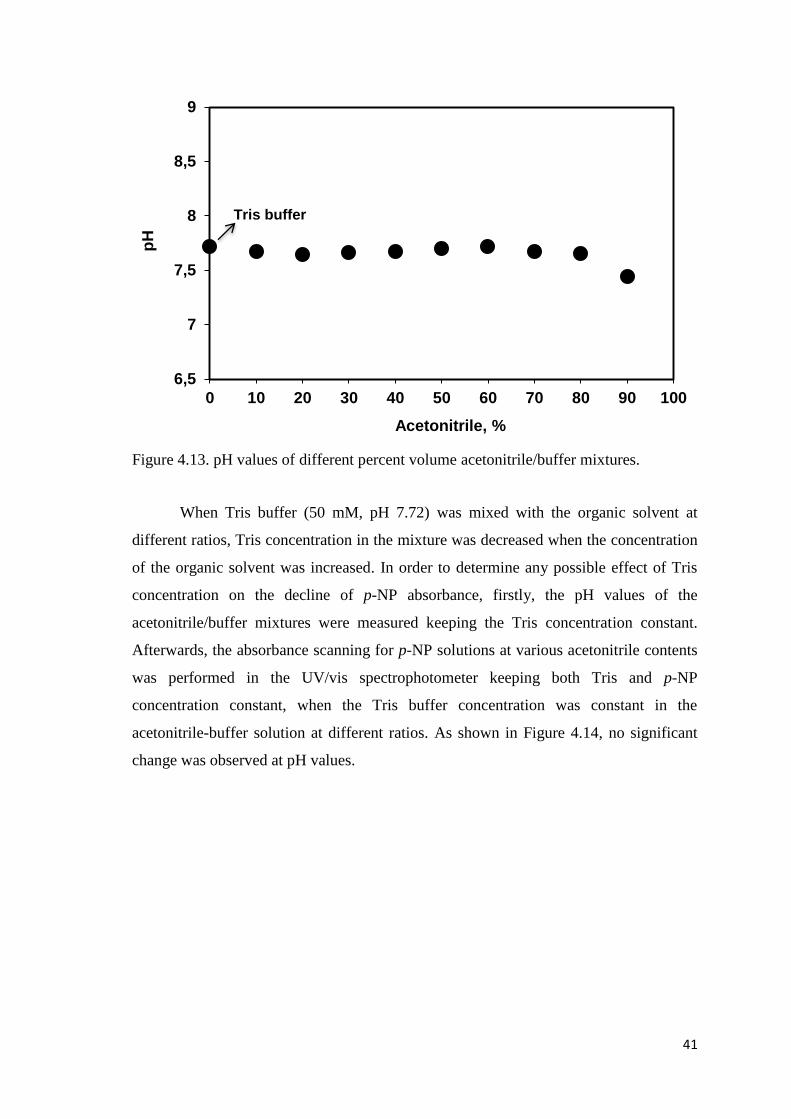
41
Figure 4.13. pH values of different percent volume acetonitrile/buffer mixtures.
When Tris buffer (50 mM, pH 7.72) was mixed with the organic solvent at
different ratios, Tris concentration in the mixture was decreased when the concentration
of the organic solvent was increased. In order to determine any possible effect of Tris
concentration on the decline of p-NP absorbance, firstly, the pH values of the
acetonitrile/buffer mixtures were measured keeping the Tris concentration constant.
Afterwards, the absorbance scanning for p-NP solutions at various acetonitrile contents
was performed in the UV/vis spectrophotometer keeping both Tris and p-NP
concentration constant, when the Tris buffer concentration was constant in the
acetonitrile-buffer solution at different ratios. As shown in Figure 4.14, no significant
change was observed at pH values.
6,5
7
7,5
8
8,5
9
0 10 20 30 40 50 60 70 80 90 100
pH
Acetonitrile, %
Tris buffer
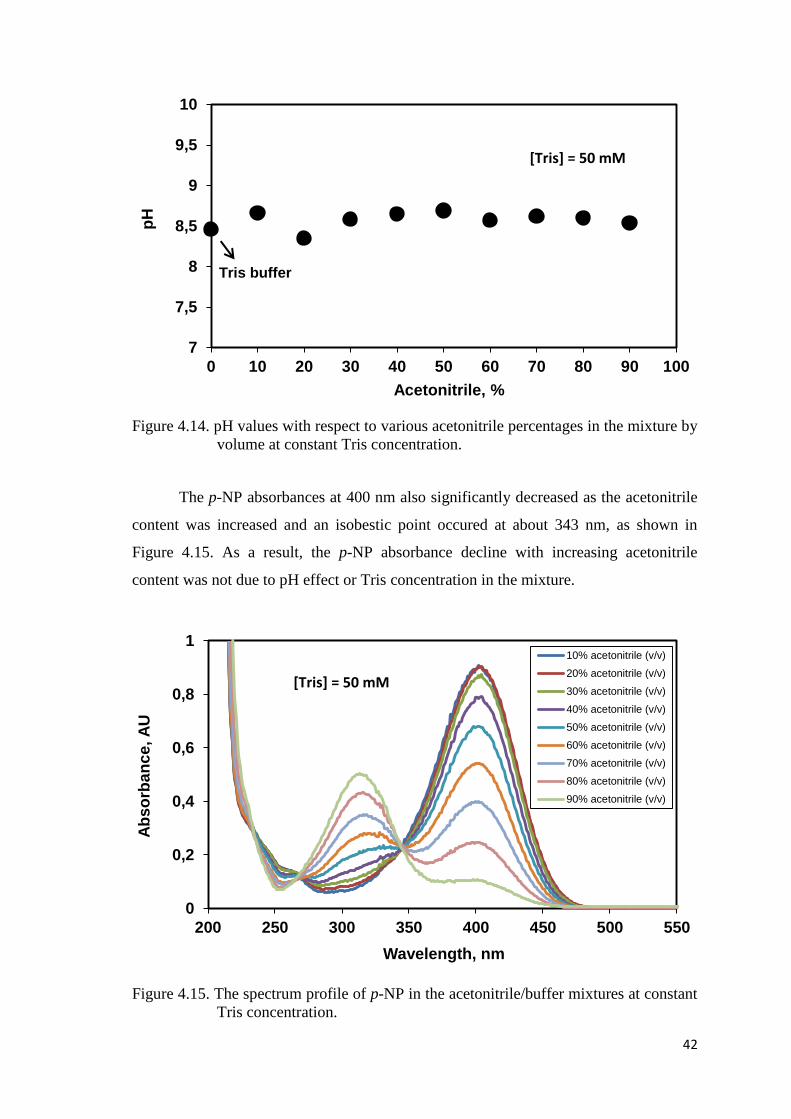
42
Figure 4.14. pH values with respect to various acetonitrile percentages in the mixture by
volume at constant Tris concentration.
The p-NP absorbances at 400 nm also significantly decreased as the acetonitrile
content was increased and an isobestic point occured at about 343 nm, as shown in
Figure 4.15. As a result, the p-NP absorbance decline with increasing acetonitrile
content was not due to pH effect or Tris concentration in the mixture.
Figure 4.15. The spectrum profile of p-NP in the acetonitrile/buffer mixtures at constant
Tris concentration.
7
7,5
8
8,5
9
9,5
10
0 10 20 30 40 50 60 70 80 90 100
pH
Acetonitrile, %
Tris buffer
0
0,2
0,4
0,6
0,8
1
200 250 300 350 400 450 500 550
Ab
so
rban
ce
, A
U
Wavelength, nm
10% acetonitrile (v/v)
20% acetonitrile (v/v)
30% acetonitrile (v/v)
40% acetonitrile (v/v)
50% acetonitrile (v/v)
60% acetonitrile (v/v)
70% acetonitrile (v/v)
80% acetonitrile (v/v)
90% acetonitrile (v/v)
[Tris] = 50 mM
[Tris] = 50 mM
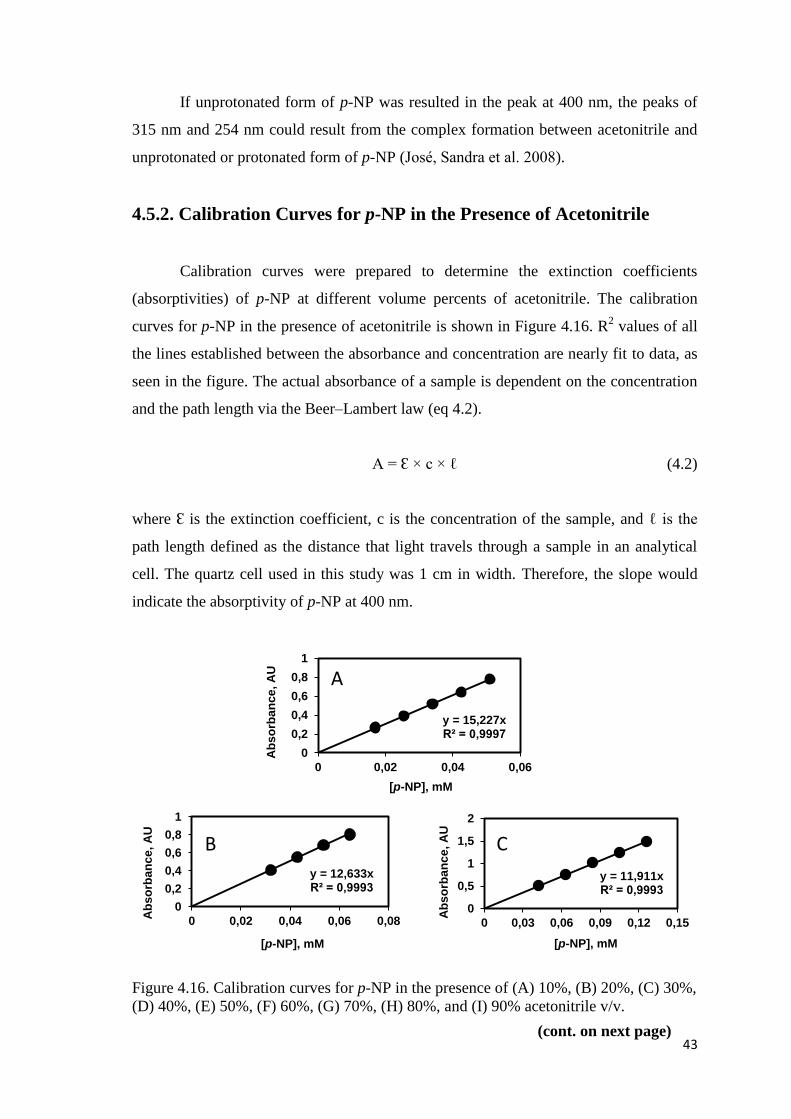
43
y = 12,633x R² = 0,9993
0
0,2
0,4
0,6
0,8
1
0 0,02 0,04 0,06 0,08Ab
so
rba
nc
e, A
U
[p-NP], mM
B
y = 11,911x R² = 0,9993
0
0,5
1
1,5
2
0 0,03 0,06 0,09 0,12 0,15
Ab
so
rba
nc
e, A
U
[p-NP], mM
C
If unprotonated form of p-NP was resulted in the peak at 400 nm, the peaks of
315 nm and 254 nm could result from the complex formation between acetonitrile and
unprotonated or protonated form of p-NP (José, Sandra et al. 2008).
4.5.2. Calibration Curves for p-NP in the Presence of Acetonitrile
Calibration curves were prepared to determine the extinction coefficients
(absorptivities) of p-NP at different volume percents of acetonitrile. The calibration
curves for p-NP in the presence of acetonitrile is shown in Figure 4.16. R2 values of all
the lines established between the absorbance and concentration are nearly fit to data, as
seen in the figure. The actual absorbance of a sample is dependent on the concentration
and the path length via the Beer–Lambert law (eq 4.2).
A = Ɛ × c × ℓ (4.2)
where Ɛ is the extinction coefficient, c is the concentration of the sample, and ℓ is the
path length defined as the distance that light travels through a sample in an analytical
cell. The quartz cell used in this study was 1 cm in width. Therefore, the slope would
indicate the absorptivity of p-NP at 400 nm.
Figure 4.16. Calibration curves for p-NP in the presence of (A) 10%, (B) 20%, (C) 30%,
(D) 40%, (E) 50%, (F) 60%, (G) 70%, (H) 80%, and (I) 90% acetonitrile v/v.
y = 15,227x R² = 0,9997
0
0,2
0,4
0,6
0,8
1
0 0,02 0,04 0,06
Ab
so
rba
nc
e, A
U
[p-NP], mM
A
(cont. on next page)
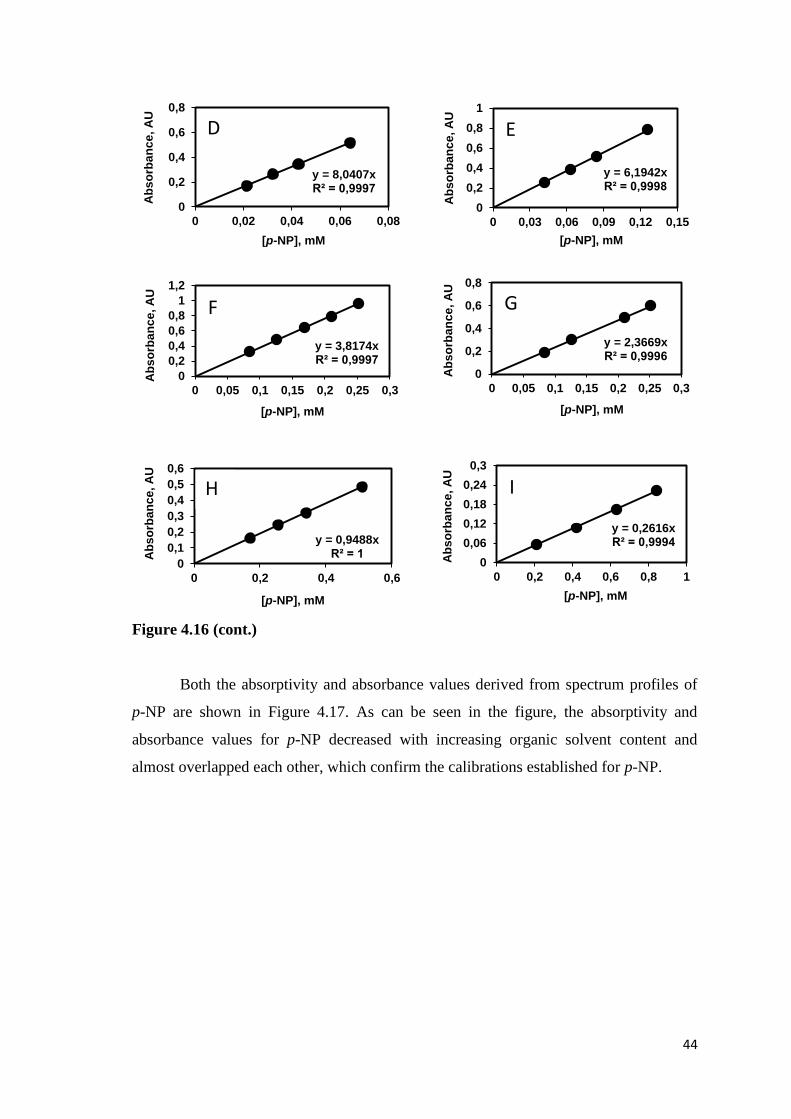
44
y = 8,0407x R² = 0,9997
0
0,2
0,4
0,6
0,8
0 0,02 0,04 0,06 0,08
Ab
so
rba
nc
e, A
U
[p-NP], mM
D
y = 6,1942x R² = 0,9998
0
0,2
0,4
0,6
0,8
1
0 0,03 0,06 0,09 0,12 0,15
Ab
so
rba
nc
e, A
U
[p-NP], mM
E
y = 3,8174x R² = 0,9997
0
0,2
0,4
0,6
0,8
1
1,2
0 0,05 0,1 0,15 0,2 0,25 0,3
Ab
so
rba
nc
e, A
U
[p-NP], mM
F
y = 0,2616x R² = 0,9994
0
0,06
0,12
0,18
0,24
0,3
0 0,2 0,4 0,6 0,8 1
Ab
so
rba
nc
e, A
U
[p-NP], mM
I
y = 2,3669x R² = 0,9996
0
0,2
0,4
0,6
0,8
0 0,05 0,1 0,15 0,2 0,25 0,3
Ab
so
rba
nc
e, A
U
[p-NP], mM
G
y = 0,9488x R² = 1
0
0,1
0,2
0,3
0,4
0,5
0,6
0 0,2 0,4 0,6
Ab
so
rba
nc
e, A
U
[p-NP], mM
H
Figure 4.16 (cont.)
Both the absorptivity and absorbance values derived from spectrum profiles of
p-NP are shown in Figure 4.17. As can be seen in the figure, the absorptivity and
absorbance values for p-NP decreased with increasing organic solvent content and
almost overlapped each other, which confirm the calibrations established for p-NP.
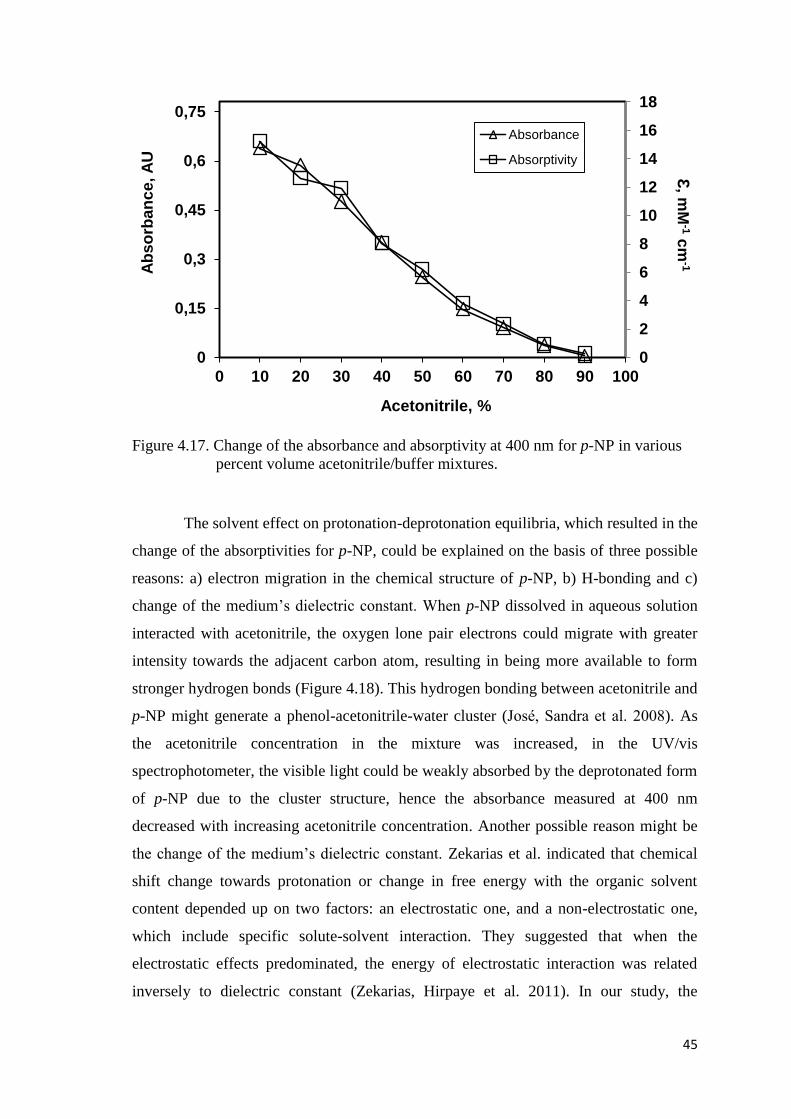
45
Figure 4.17. Change of the absorbance and absorptivity at 400 nm for p-NP in various
percent volume acetonitrile/buffer mixtures.
The solvent effect on protonation-deprotonation equilibria, which resulted in the
change of the absorptivities for p-NP, could be explained on the basis of three possible
reasons: a) electron migration in the chemical structure of p-NP, b) H-bonding and c)
change of the medium‘s dielectric constant. When p-NP dissolved in aqueous solution
interacted with acetonitrile, the oxygen lone pair electrons could migrate with greater
intensity towards the adjacent carbon atom, resulting in being more available to form
stronger hydrogen bonds (Figure 4.18). This hydrogen bonding between acetonitrile and
p-NP might generate a phenol-acetonitrile-water cluster (José, Sandra et al. 2008). As
the acetonitrile concentration in the mixture was increased, in the UV/vis
spectrophotometer, the visible light could be weakly absorbed by the deprotonated form
of p-NP due to the cluster structure, hence the absorbance measured at 400 nm
decreased with increasing acetonitrile concentration. Another possible reason might be
the change of the medium‘s dielectric constant. Zekarias et al. indicated that chemical
shift change towards protonation or change in free energy with the organic solvent
content depended up on two factors: an electrostatic one, and a non-electrostatic one,
which include specific solute-solvent interaction. They suggested that when the
electrostatic effects predominated, the energy of electrostatic interaction was related
inversely to dielectric constant (Zekarias, Hirpaye et al. 2011). In our study, the
0
2
4
6
8
10
12
14
16
18
0
0,15
0,3
0,45
0,6
0,75
0 10 20 30 40 50 60 70 80 90 100
Ab
so
rban
ce
, A
U
Acetonitrile, %
Absorbance
Absorptivity
Ɛ, m
M-1 c
m-1
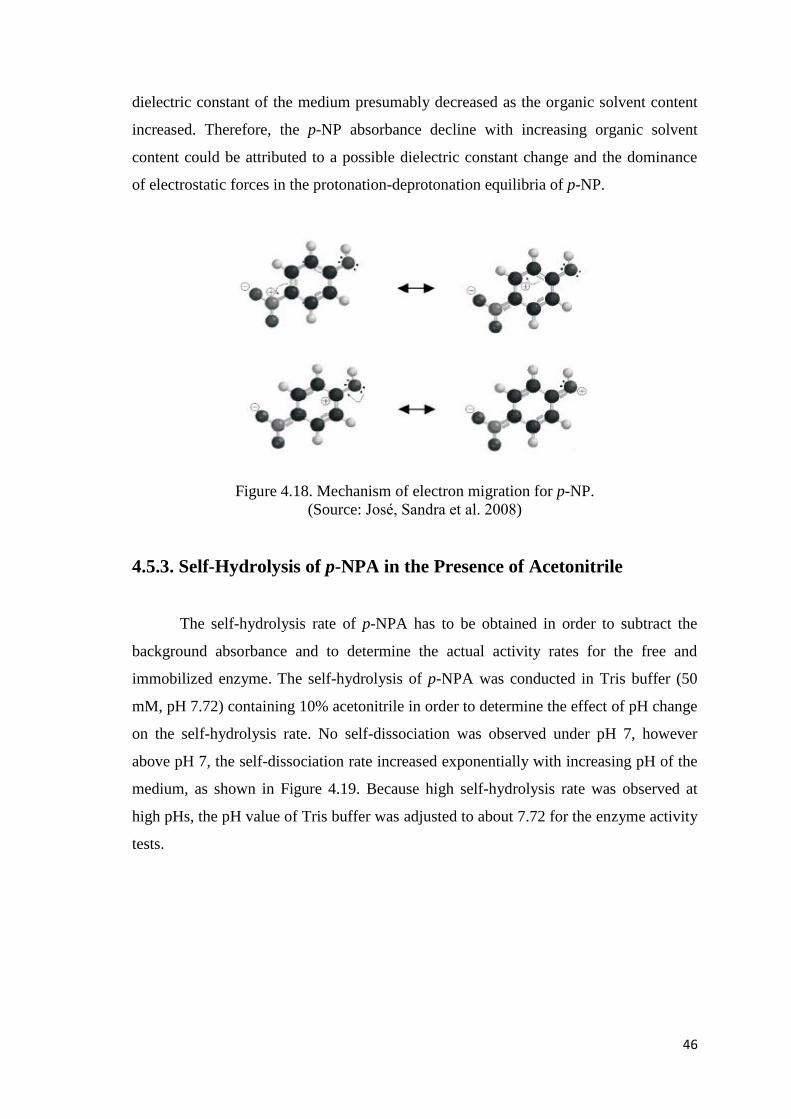
46
dielectric constant of the medium presumably decreased as the organic solvent content
increased. Therefore, the p-NP absorbance decline with increasing organic solvent
content could be attributed to a possible dielectric constant change and the dominance
of electrostatic forces in the protonation-deprotonation equilibria of p-NP.
Figure 4.18. Mechanism of electron migration for p-NP.
(Source: José, Sandra et al. 2008)
4.5.3. Self-Hydrolysis of p-NPA in the Presence of Acetonitrile
The self-hydrolysis rate of p-NPA has to be obtained in order to subtract the
background absorbance and to determine the actual activity rates for the free and
immobilized enzyme. The self-hydrolysis of p-NPA was conducted in Tris buffer (50
mM, pH 7.72) containing 10% acetonitrile in order to determine the effect of pH change
on the self-hydrolysis rate. No self-dissociation was observed under pH 7, however
above pH 7, the self-dissociation rate increased exponentially with increasing pH of the
medium, as shown in Figure 4.19. Because high self-hydrolysis rate was observed at
high pHs, the pH value of Tris buffer was adjusted to about 7.72 for the enzyme activity
tests.
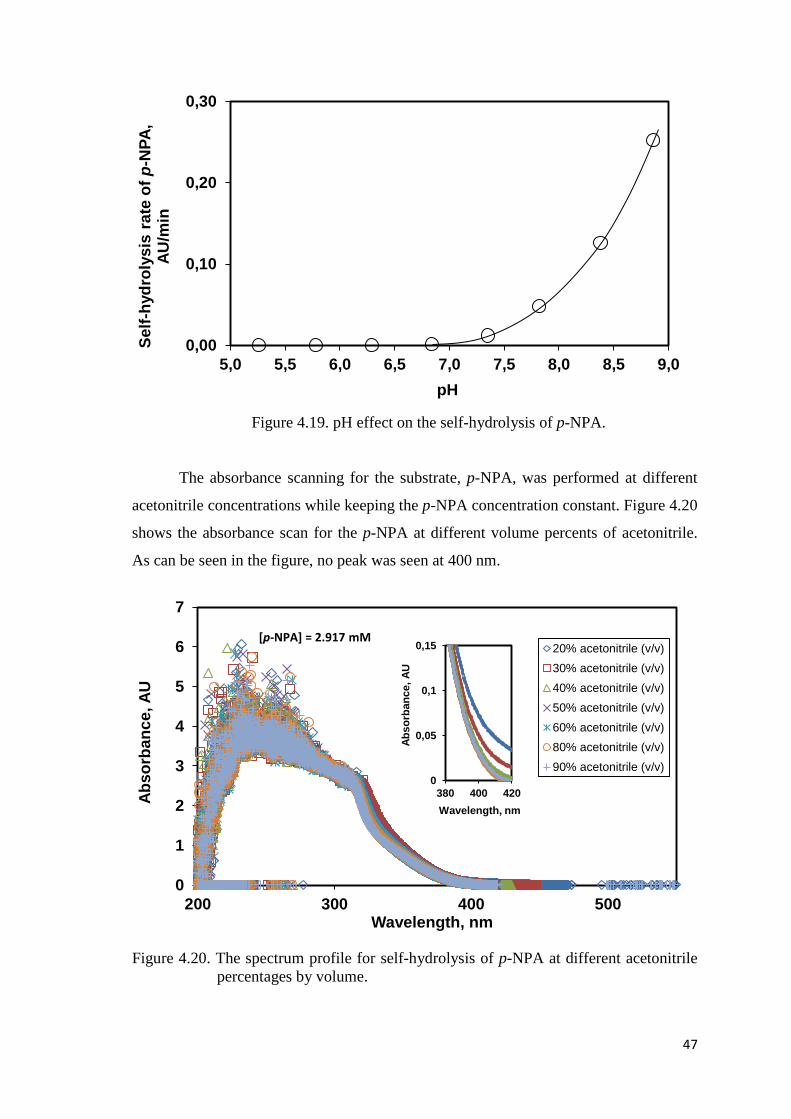
47
Figure 4.19. pH effect on the self-hydrolysis of p-NPA.
The absorbance scanning for the substrate, p-NPA, was performed at different
acetonitrile concentrations while keeping the p-NPA concentration constant. Figure 4.20
shows the absorbance scan for the p-NPA at different volume percents of acetonitrile.
As can be seen in the figure, no peak was seen at 400 nm.
Figure 4.20. The spectrum profile for self-hydrolysis of p-NPA at different acetonitrile
percentages by volume.
0,00
0,10
0,20
0,30
5,0 5,5 6,0 6,5 7,0 7,5 8,0 8,5 9,0
Se
lf-h
yd
roly
sis
ra
te o
f p
-NP
A,
AU
/min
pH
0
1
2
3
4
5
6
7
200 300 400 500
Ab
so
rban
ce
, A
U
Wavelength, nm
20% acetonitrile (v/v)
30% acetonitrile (v/v)
40% acetonitrile (v/v)
50% acetonitrile (v/v)
60% acetonitrile (v/v)
80% acetonitrile (v/v)
90% acetonitrile (v/v)
[p-NPA] = 2.917 mM
0
0,05
0,1
0,15
380 400 420
Ab
so
rban
ce,
AU
Wavelength, nm
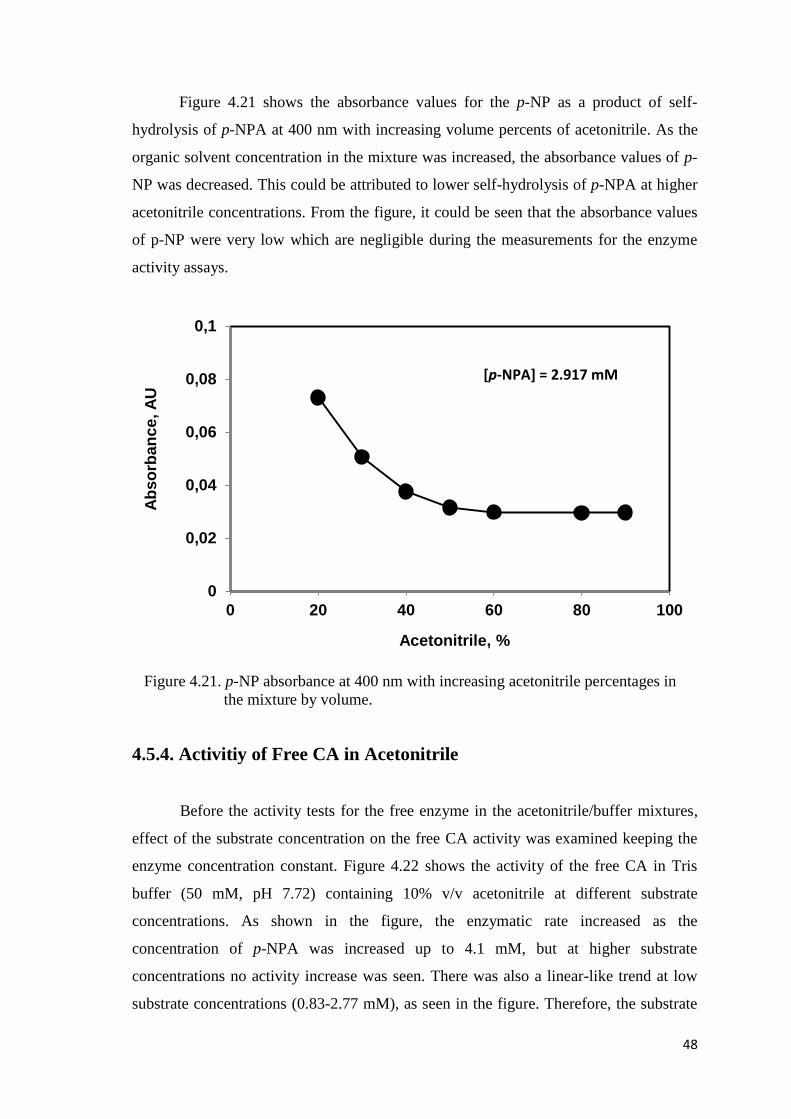
48
Figure 4.21 shows the absorbance values for the p-NP as a product of self-
hydrolysis of p-NPA at 400 nm with increasing volume percents of acetonitrile. As the
organic solvent concentration in the mixture was increased, the absorbance values of p-
NP was decreased. This could be attributed to lower self-hydrolysis of p-NPA at higher
acetonitrile concentrations. From the figure, it could be seen that the absorbance values
of p-NP were very low which are negligible during the measurements for the enzyme
activity assays.
Figure 4.21. p-NP absorbance at 400 nm with increasing acetonitrile percentages in
the mixture by volume.
4.5.4. Activitiy of Free CA in Acetonitrile
Before the activity tests for the free enzyme in the acetonitrile/buffer mixtures,
effect of the substrate concentration on the free CA activity was examined keeping the
enzyme concentration constant. Figure 4.22 shows the activity of the free CA in Tris
buffer (50 mM, pH 7.72) containing 10% v/v acetonitrile at different substrate
concentrations. As shown in the figure, the enzymatic rate increased as the
concentration of p-NPA was increased up to 4.1 mM, but at higher substrate
concentrations no activity increase was seen. There was also a linear-like trend at low
substrate concentrations (0.83-2.77 mM), as seen in the figure. Therefore, the substrate
0
0,02
0,04
0,06
0,08
0,1
0 20 40 60 80 100
Ab
so
rban
ce
, A
U
Acetonitrile, %
[p-NPA] = 2.917 mM
mM
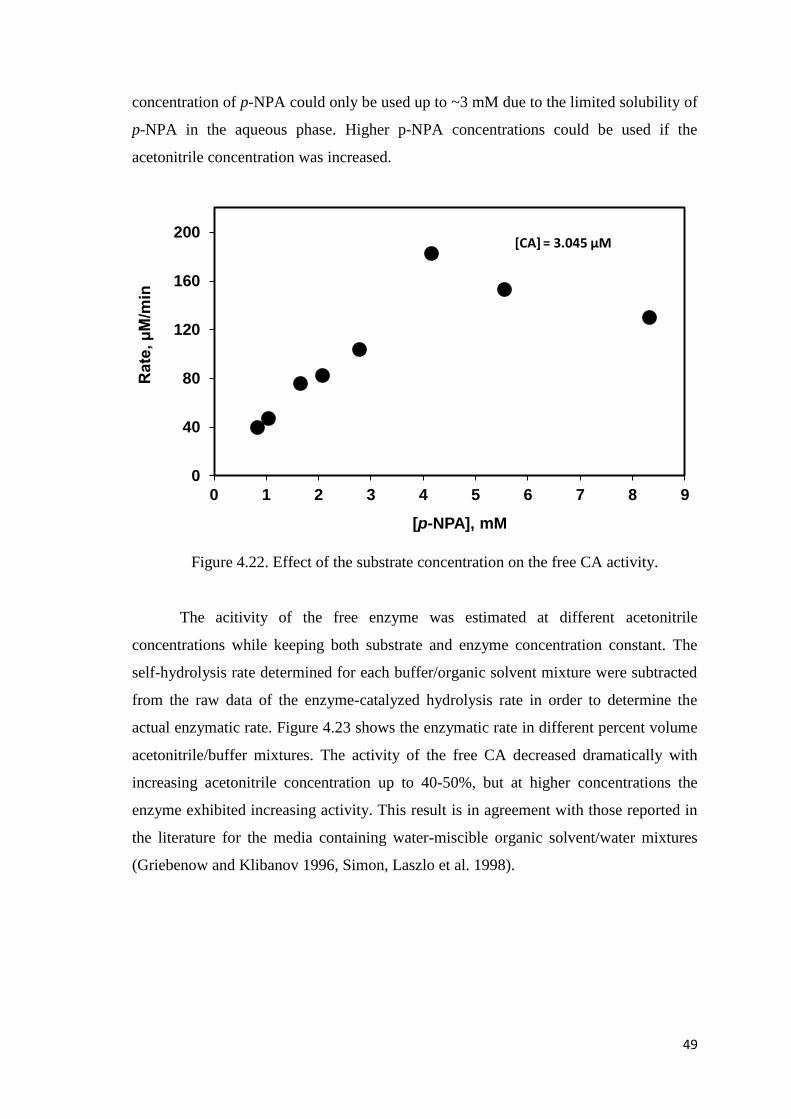
49
concentration of p-NPA could only be used up to ~3 mM due to the limited solubility of
p-NPA in the aqueous phase. Higher p-NPA concentrations could be used if the
acetonitrile concentration was increased.
Figure 4.22. Effect of the substrate concentration on the free CA activity.
The acitivity of the free enzyme was estimated at different acetonitrile
concentrations while keeping both substrate and enzyme concentration constant. The
self-hydrolysis rate determined for each buffer/organic solvent mixture were subtracted
from the raw data of the enzyme-catalyzed hydrolysis rate in order to determine the
actual enzymatic rate. Figure 4.23 shows the enzymatic rate in different percent volume
acetonitrile/buffer mixtures. The activity of the free CA decreased dramatically with
increasing acetonitrile concentration up to 40-50%, but at higher concentrations the
enzyme exhibited increasing activity. This result is in agreement with those reported in
the literature for the media containing water-miscible organic solvent/water mixtures
(Griebenow and Klibanov 1996, Simon, Laszlo et al. 1998).
0
40
80
120
160
200
0 1 2 3 4 5 6 7 8 9
Rate
, µ
M/m
in
[p-NPA], mM
[CA] = 3.045 µM
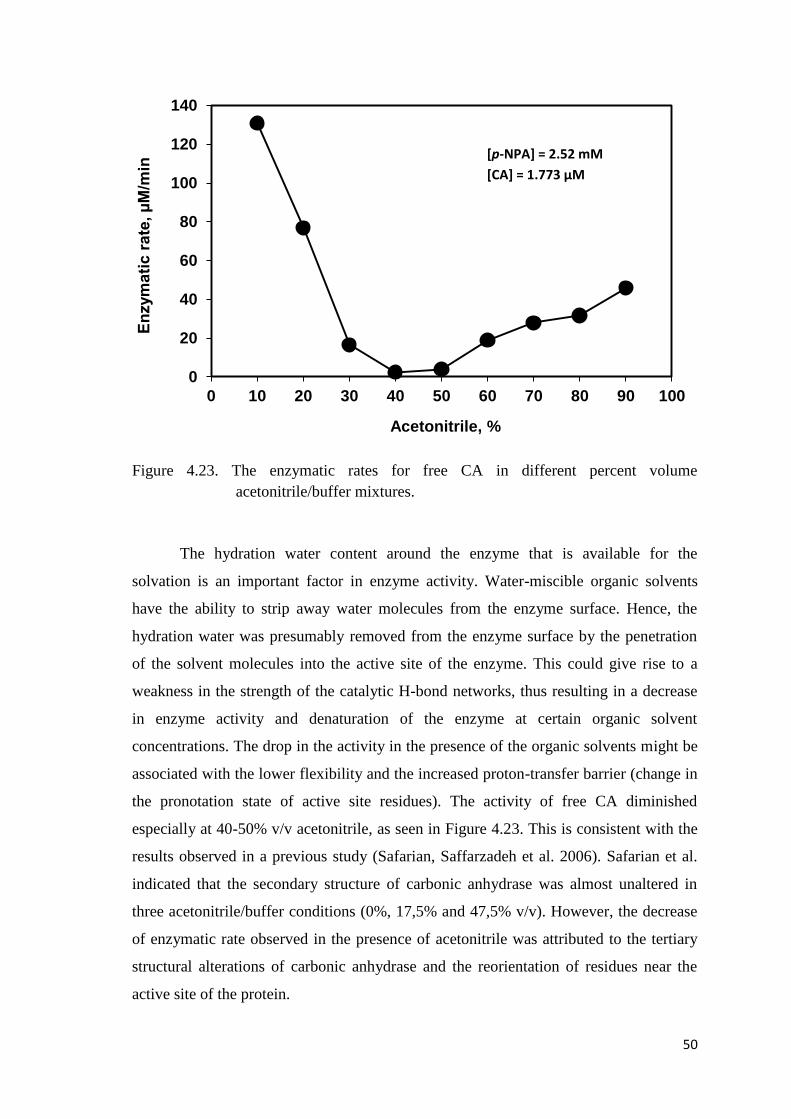
50
Figure 4.23. The enzymatic rates for free CA in different percent volume
acetonitrile/buffer mixtures.
The hydration water content around the enzyme that is available for the
solvation is an important factor in enzyme activity. Water-miscible organic solvents
have the ability to strip away water molecules from the enzyme surface. Hence, the
hydration water was presumably removed from the enzyme surface by the penetration
of the solvent molecules into the active site of the enzyme. This could give rise to a
weakness in the strength of the catalytic H-bond networks, thus resulting in a decrease
in enzyme activity and denaturation of the enzyme at certain organic solvent
concentrations. The drop in the activity in the presence of the organic solvents might be
associated with the lower flexibility and the increased proton-transfer barrier (change in
the pronotation state of active site residues). The activity of free CA diminished
especially at 40-50% v/v acetonitrile, as seen in Figure 4.23. This is consistent with the
results observed in a previous study (Safarian, Saffarzadeh et al. 2006). Safarian et al.
indicated that the secondary structure of carbonic anhydrase was almost unaltered in
three acetonitrile/buffer conditions (0%, 17,5% and 47,5% v/v). However, the decrease
of enzymatic rate observed in the presence of acetonitrile was attributed to the tertiary
structural alterations of carbonic anhydrase and the reorientation of residues near the
active site of the protein.
0
20
40
60
80
100
120
140
0 10 20 30 40 50 60 70 80 90 100
En
zym
ati
c r
ate
, µ
M/m
in
Acetonitrile, %
[p-NPA] = 2.52 mM
[CA] = 1.773 µM
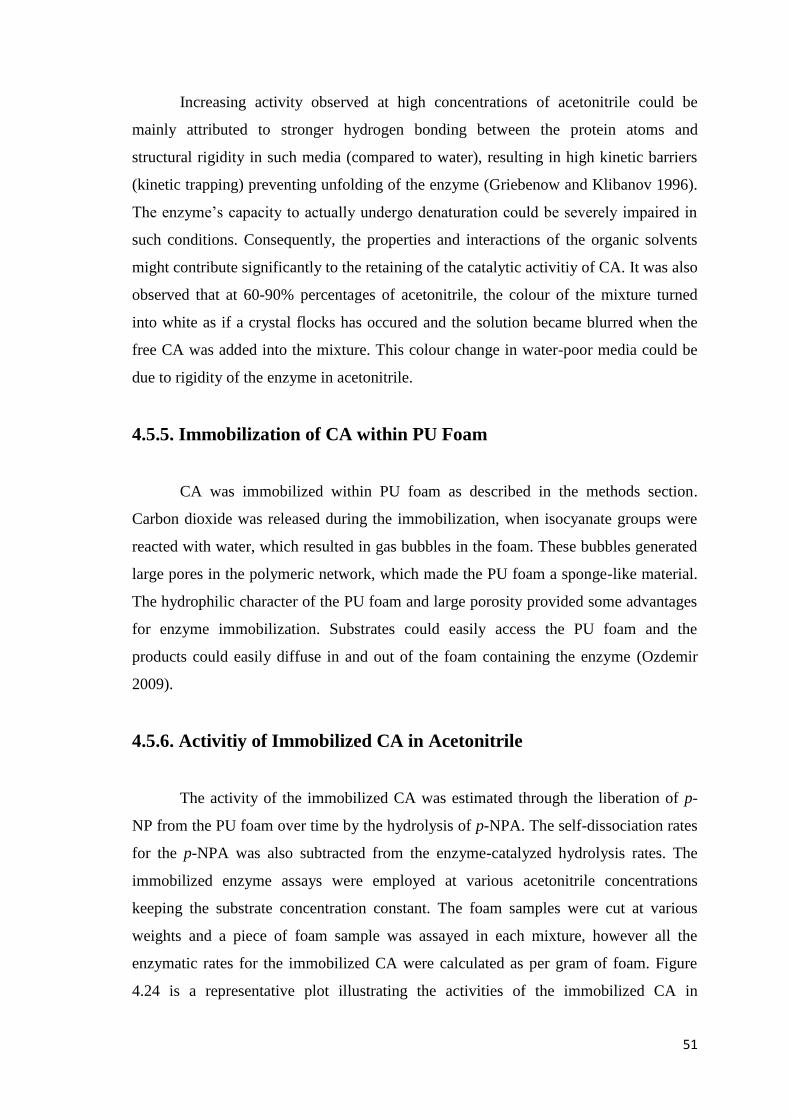
51
Increasing activity observed at high concentrations of acetonitrile could be
mainly attributed to stronger hydrogen bonding between the protein atoms and
structural rigidity in such media (compared to water), resulting in high kinetic barriers
(kinetic trapping) preventing unfolding of the enzyme (Griebenow and Klibanov 1996).
The enzyme‘s capacity to actually undergo denaturation could be severely impaired in
such conditions. Consequently, the properties and interactions of the organic solvents
might contribute significantly to the retaining of the catalytic activitiy of CA. It was also
observed that at 60-90% percentages of acetonitrile, the colour of the mixture turned
into white as if a crystal flocks has occured and the solution became blurred when the
free CA was added into the mixture. This colour change in water-poor media could be
due to rigidity of the enzyme in acetonitrile.
4.5.5. Immobilization of CA within PU Foam
CA was immobilized within PU foam as described in the methods section.
Carbon dioxide was released during the immobilization, when isocyanate groups were
reacted with water, which resulted in gas bubbles in the foam. These bubbles generated
large pores in the polymeric network, which made the PU foam a sponge-like material.
The hydrophilic character of the PU foam and large porosity provided some advantages
for enzyme immobilization. Substrates could easily access the PU foam and the
products could easily diffuse in and out of the foam containing the enzyme (Ozdemir
2009).
4.5.6. Activitiy of Immobilized CA in Acetonitrile
The activity of the immobilized CA was estimated through the liberation of p-
NP from the PU foam over time by the hydrolysis of p-NPA. The self-dissociation rates
for the p-NPA was also subtracted from the enzyme-catalyzed hydrolysis rates. The
immobilized enzyme assays were employed at various acetonitrile concentrations
keeping the substrate concentration constant. The foam samples were cut at various
weights and a piece of foam sample was assayed in each mixture, however all the
enzymatic rates for the immobilized CA were calculated as per gram of foam. Figure
4.24 is a representative plot illustrating the activities of the immobilized CA in
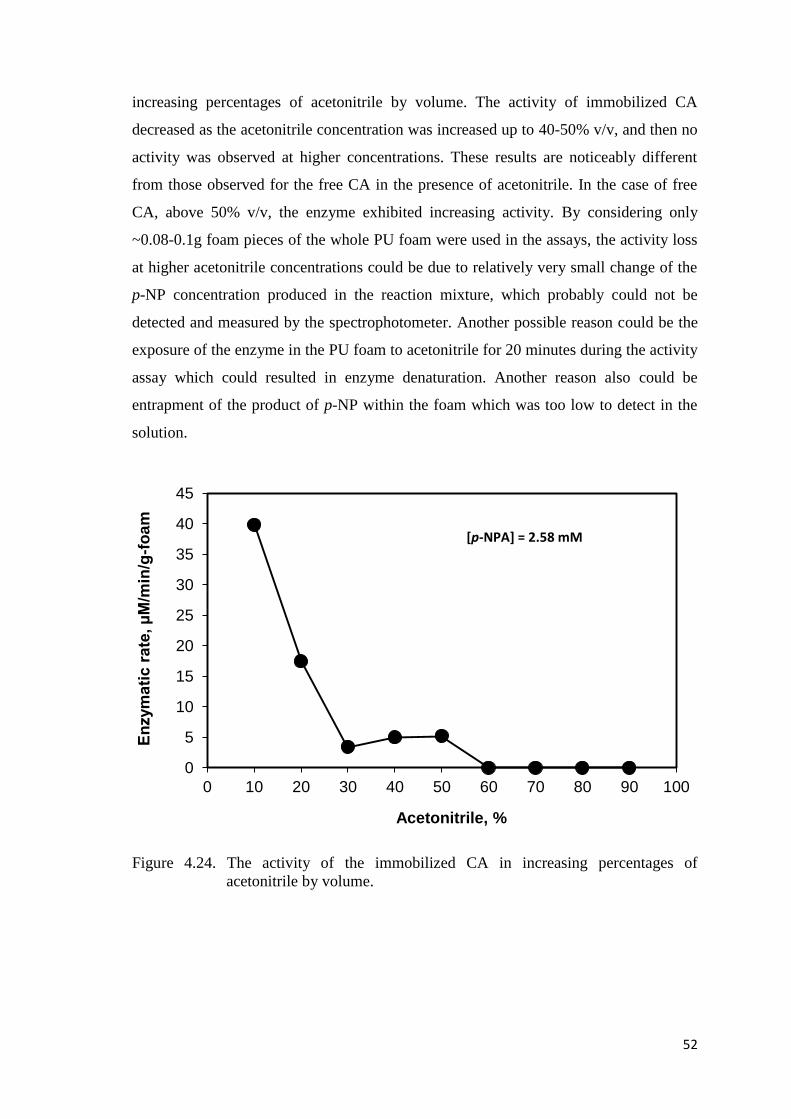
52
increasing percentages of acetonitrile by volume. The activity of immobilized CA
decreased as the acetonitrile concentration was increased up to 40-50% v/v, and then no
activity was observed at higher concentrations. These results are noticeably different
from those observed for the free CA in the presence of acetonitrile. In the case of free
CA, above 50% v/v, the enzyme exhibited increasing activity. By considering only
~0.08-0.1g foam pieces of the whole PU foam were used in the assays, the activity loss
at higher acetonitrile concentrations could be due to relatively very small change of the
p-NP concentration produced in the reaction mixture, which probably could not be
detected and measured by the spectrophotometer. Another possible reason could be the
exposure of the enzyme in the PU foam to acetonitrile for 20 minutes during the activity
assay which could resulted in enzyme denaturation. Another reason also could be
entrapment of the product of p-NP within the foam which was too low to detect in the
solution.
Figure 4.24. The activity of the immobilized CA in increasing percentages of
acetonitrile by volume.
0
5
10
15
20
25
30
35
40
45
0 10 20 30 40 50 60 70 80 90 100
En
zym
ati
c r
ate
, µ
M/m
in/g
-fo
am
Acetonitrile, %
[p-NPA] = 2.58 mM
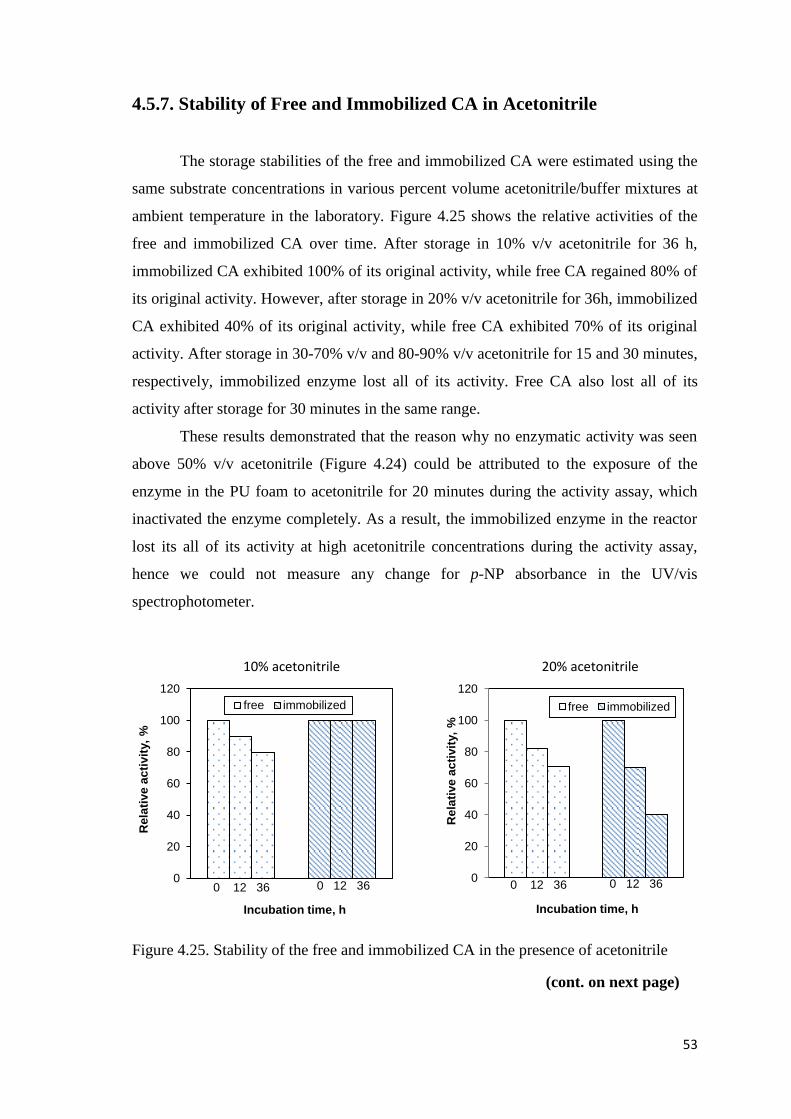
53
0
20
40
60
80
100
120
Rela
tive
ac
tivit
y,
%
Incubation time, h
free immobilized
0 12 36 0 12 36 0
20
40
60
80
100
120
Rela
tive
ac
tivit
y,
%
Incubation time, h
free immobilized
0 12 36 0 12 36
4.5.7. Stability of Free and Immobilized CA in Acetonitrile
The storage stabilities of the free and immobilized CA were estimated using the
same substrate concentrations in various percent volume acetonitrile/buffer mixtures at
ambient temperature in the laboratory. Figure 4.25 shows the relative activities of the
free and immobilized CA over time. After storage in 10% v/v acetonitrile for 36 h,
immobilized CA exhibited 100% of its original activity, while free CA regained 80% of
its original activity. However, after storage in 20% v/v acetonitrile for 36h, immobilized
CA exhibited 40% of its original activity, while free CA exhibited 70% of its original
activity. After storage in 30-70% v/v and 80-90% v/v acetonitrile for 15 and 30 minutes,
respectively, immobilized enzyme lost all of its activity. Free CA also lost all of its
activity after storage for 30 minutes in the same range.
These results demonstrated that the reason why no enzymatic activity was seen
above 50% v/v acetonitrile (Figure 4.24) could be attributed to the exposure of the
enzyme in the PU foam to acetonitrile for 20 minutes during the activity assay, which
inactivated the enzyme completely. As a result, the immobilized enzyme in the reactor
lost its all of its activity at high acetonitrile concentrations during the activity assay,
hence we could not measure any change for p-NP absorbance in the UV/vis
spectrophotometer.
Figure 4.25. Stability of the free and immobilized CA in the presence of acetonitrile
10% acetonitrile 20% acetonitrile
(cont. on next page)
54
0
20
40
60
80
100
120
Re
lati
ve
ac
tivit
y,
%
Incubation time, h
free immobilized
0 12 36 0 0.25 0
20
40
60
80
100
120
Re
lati
ve
ac
tivit
y,
%
Incubation time, min
free immobilized
0 15 0 15
0
20
40
60
80
100
120
Rela
tive
ac
tivit
y,
%
Incubation time, min
free immobilized
0 15 0 15 0
20
40
60
80
100
120
Rela
tive
ac
tivit
y,
%
Incubation time, min
free immobilized
0 15 0 15
0
20
40
60
80
100
120
Rela
tive
ac
tivit
y,
%
Incubation time, min
free immobilized
0 15 0 15 0
20
40
60
80
100
120
Rela
tive
ac
tivit
y,
%
Incubation time, min
free immobilized
0 15 30 0 15 30
.
Figure 4.25 (cont.)
30% acetonitrile 40% acetonitrile
50% acetonitrile 60% acetonitrile
70% acetonitrile 80% acetonitrile
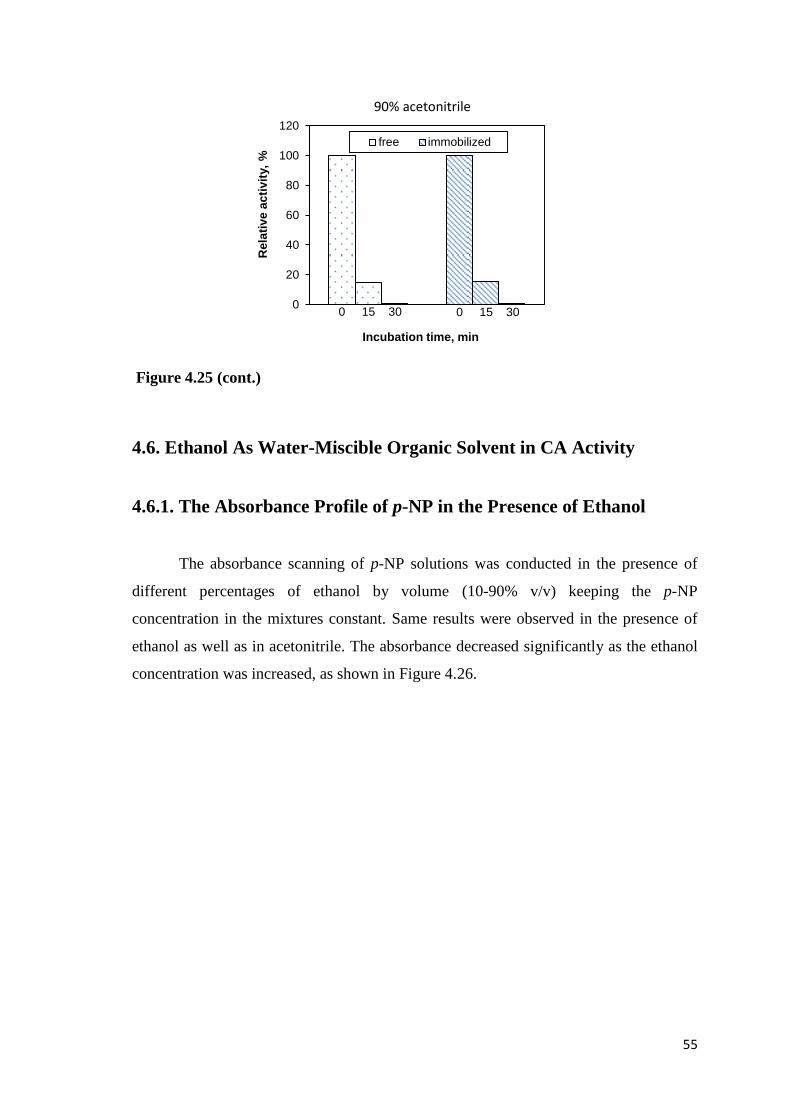
55
0
20
40
60
80
100
120
Re
lati
ve
ac
tivit
y,
%
Incubation time, min
free immobilized
0 15 30 0 15 30
Figure 4.25 (cont.)
4.6. Ethanol As Water-Miscible Organic Solvent in CA Activity
4.6.1. The Absorbance Profile of p-NP in the Presence of Ethanol
The absorbance scanning of p-NP solutions was conducted in the presence of
different percentages of ethanol by volume (10-90% v/v) keeping the p-NP
concentration in the mixtures constant. Same results were observed in the presence of
ethanol as well as in acetonitrile. The absorbance decreased significantly as the ethanol
concentration was increased, as shown in Figure 4.26.
90% acetonitrile
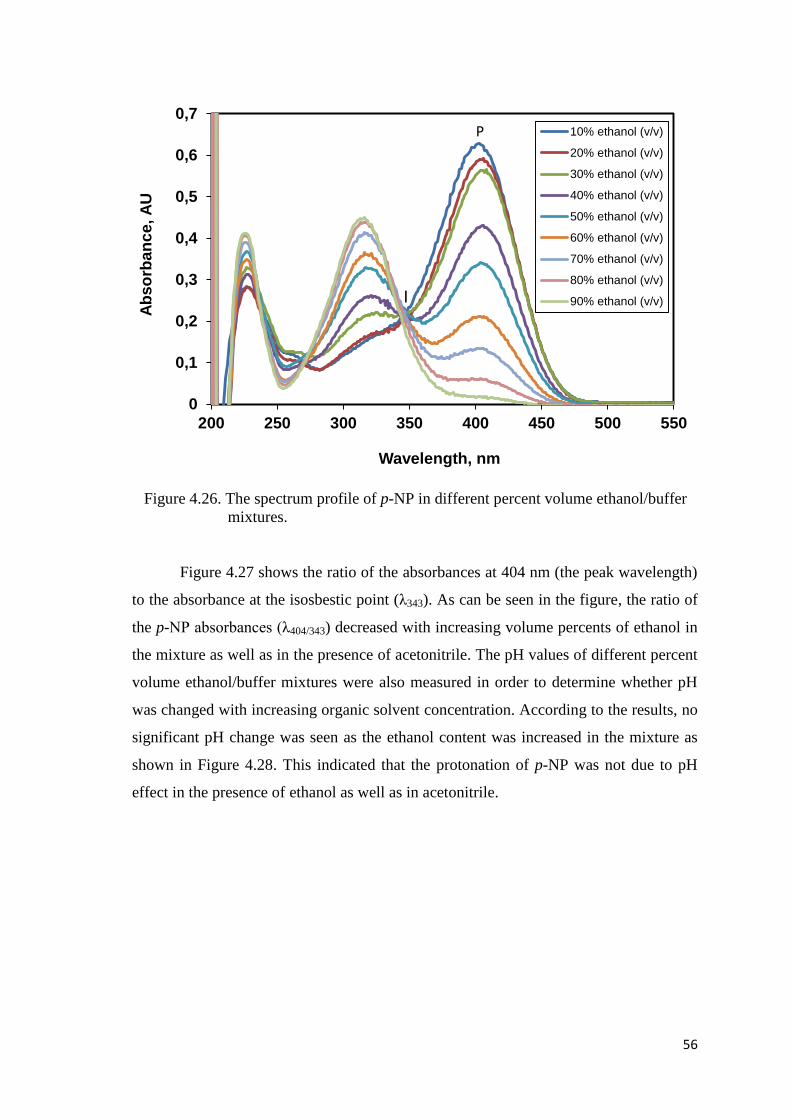
56
Figure 4.26. The spectrum profile of p-NP in different percent volume ethanol/buffer
mixtures.
Figure 4.27 shows the ratio of the absorbances at 404 nm (the peak wavelength)
to the absorbance at the isosbestic point (λ343). As can be seen in the figure, the ratio of
the p-NP absorbances (λ404/343) decreased with increasing volume percents of ethanol in
the mixture as well as in the presence of acetonitrile. The pH values of different percent
volume ethanol/buffer mixtures were also measured in order to determine whether pH
was changed with increasing organic solvent concentration. According to the results, no
significant pH change was seen as the ethanol content was increased in the mixture as
shown in Figure 4.28. This indicated that the protonation of p-NP was not due to pH
effect in the presence of ethanol as well as in acetonitrile.
0
0,1
0,2
0,3
0,4
0,5
0,6
0,7
200 250 300 350 400 450 500 550
Ab
so
rba
nc
e, A
U
Wavelength, nm
10% ethanol (v/v)
20% ethanol (v/v)
30% ethanol (v/v)
40% ethanol (v/v)
50% ethanol (v/v)
60% ethanol (v/v)
70% ethanol (v/v)
80% ethanol (v/v)
90% ethanol (v/v)
P
I
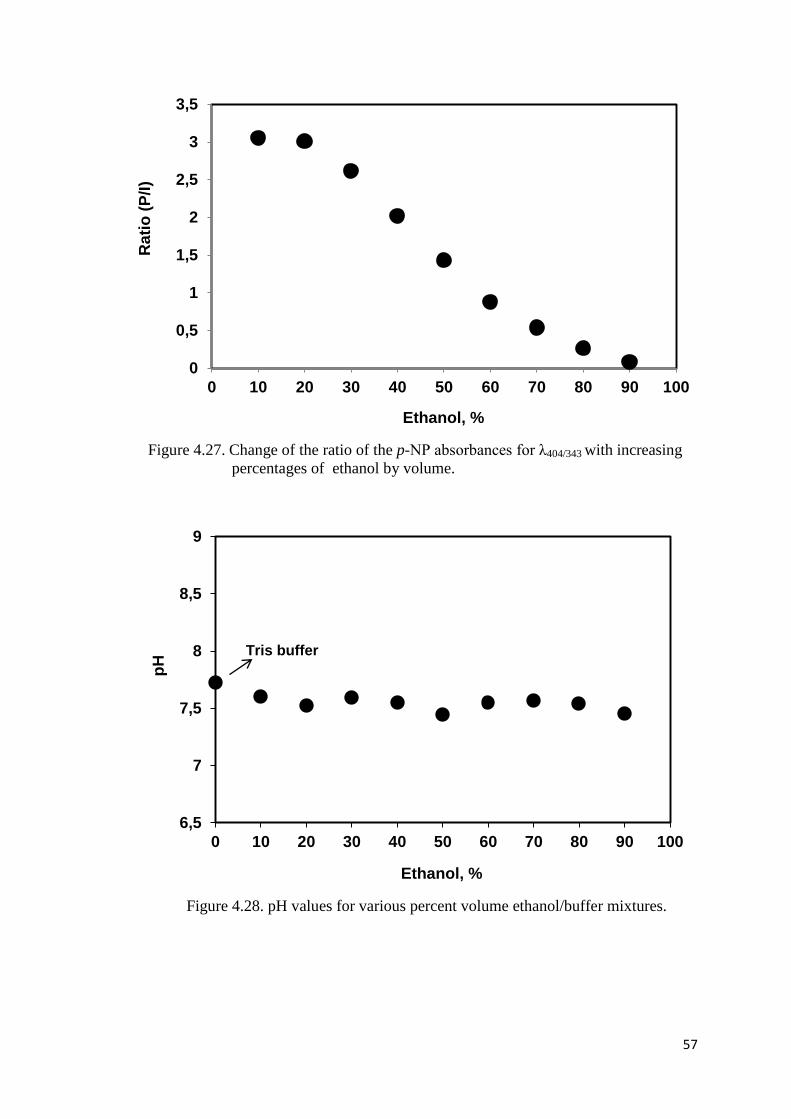
57
Figure 4.27. Change of the ratio of the p-NP absorbances for λ404/343 with increasing
percentages of ethanol by volume.
Figure 4.28. pH values for various percent volume ethanol/buffer mixtures.
0
0,5
1
1,5
2
2,5
3
3,5
0 10 20 30 40 50 60 70 80 90 100
Rati
o (
P/I
)
Ethanol, %
6,5
7
7,5
8
8,5
9
0 10 20 30 40 50 60 70 80 90 100
pH
Ethanol, %
Tris buffer
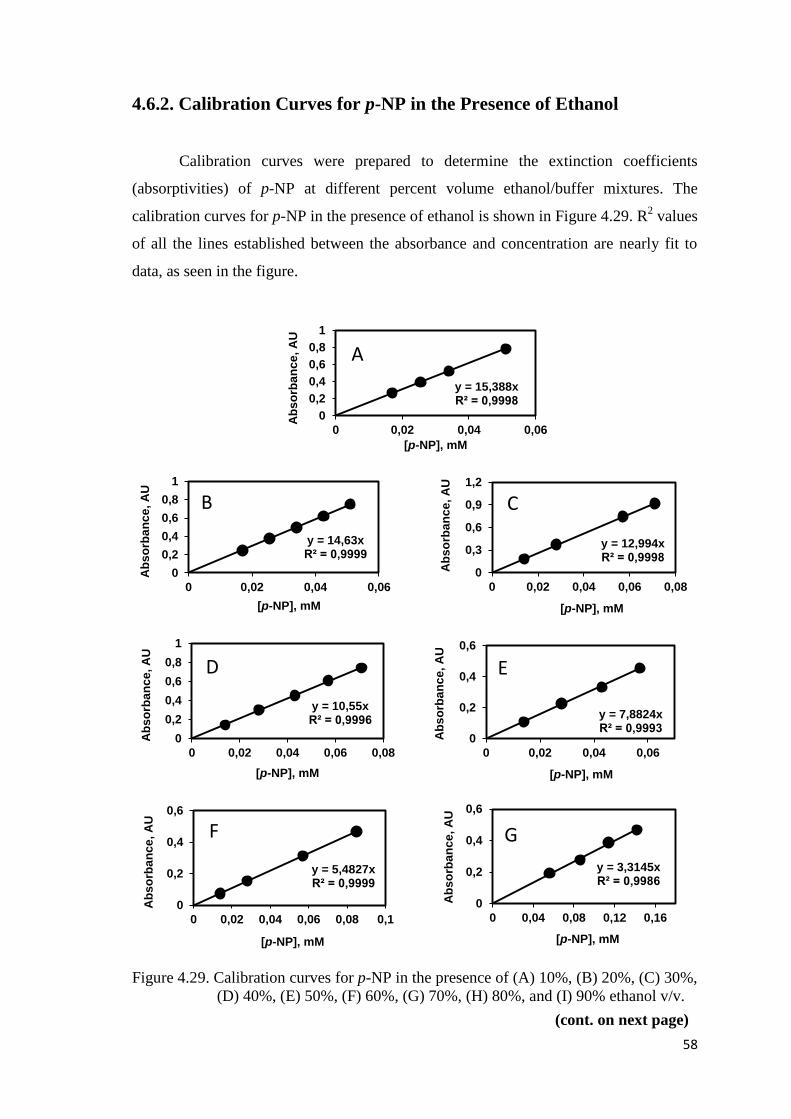
58
y = 14,63x R² = 0,9999
0
0,2
0,4
0,6
0,8
1
0 0,02 0,04 0,06
Ab
so
rba
nc
e, A
U
[p-NP], mM
B
y = 12,994x R² = 0,9998
0
0,3
0,6
0,9
1,2
0 0,02 0,04 0,06 0,08
Ab
so
rba
nc
e, A
U
[p-NP], mM
C
y = 10,55x R² = 0,9996
0
0,2
0,4
0,6
0,8
1
0 0,02 0,04 0,06 0,08
Ab
so
rba
nc
e, A
U
[p-NP], mM
D
y = 7,8824x R² = 0,9993
0
0,2
0,4
0,6
0 0,02 0,04 0,06
Ab
so
rba
nc
e, A
U
[p-NP], mM
E
y = 5,4827x R² = 0,9999
0
0,2
0,4
0,6
0 0,02 0,04 0,06 0,08 0,1
Ab
so
rba
nc
e, A
U
[p-NP], mM
F
y = 3,3145x R² = 0,9986
0
0,2
0,4
0,6
0 0,04 0,08 0,12 0,16
Ab
so
rba
nc
e, A
U
[p-NP], mM
G
4.6.2. Calibration Curves for p-NP in the Presence of Ethanol
Calibration curves were prepared to determine the extinction coefficients
(absorptivities) of p-NP at different percent volume ethanol/buffer mixtures. The
calibration curves for p-NP in the presence of ethanol is shown in Figure 4.29. R2 values
of all the lines established between the absorbance and concentration are nearly fit to
data, as seen in the figure.
Figure 4.29. Calibration curves for p-NP in the presence of (A) 10%, (B) 20%, (C) 30%,
(D) 40%, (E) 50%, (F) 60%, (G) 70%, (H) 80%, and (I) 90% ethanol v/v.
y = 15,388x R² = 0,9998
0
0,2
0,4
0,6
0,8
1
0 0,02 0,04 0,06
Ab
so
rba
nc
e, A
U
[p-NP], mM
A
(cont. on next page)
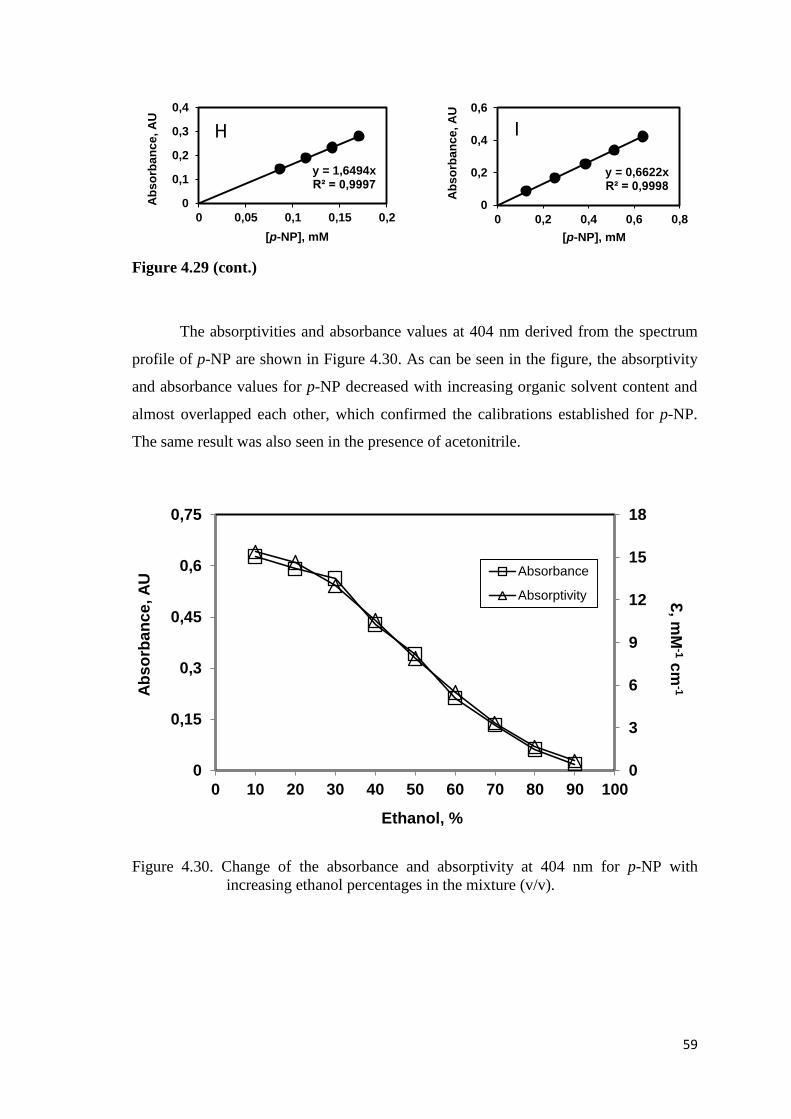
59
y = 1,6494x R² = 0,9997
0
0,1
0,2
0,3
0,4
0 0,05 0,1 0,15 0,2
Ab
so
rba
nc
e, A
U
[p-NP], mM
H
y = 0,6622x R² = 0,9998
0
0,2
0,4
0,6
0 0,2 0,4 0,6 0,8
Ab
so
rba
nc
e, A
U
[p-NP], mM
I
Figure 4.29 (cont.)
The absorptivities and absorbance values at 404 nm derived from the spectrum
profile of p-NP are shown in Figure 4.30. As can be seen in the figure, the absorptivity
and absorbance values for p-NP decreased with increasing organic solvent content and
almost overlapped each other, which confirmed the calibrations established for p-NP.
The same result was also seen in the presence of acetonitrile.
Figure 4.30. Change of the absorbance and absorptivity at 404 nm for p-NP with
increasing ethanol percentages in the mixture (v/v).
0
3
6
9
12
15
18
0 10 20 30 40 50 60 70 80 90 100
0
0,15
0,3
0,45
0,6
0,75
Ethanol, %
Ab
so
rban
ce
, A
U Absorbance
Absorptivity Ɛ, m
M-1 c
m-1

60
4.6.3. Self-Hydrolysis of p-NPA in the Presence of Ethanol
The absorbance scanning for self-hydrolysis of p-NPA was performed at
different ethanol concentrations while keeping the p-NPA concentration constant.
Figure 4.31 shows the absorbance values of p-NP as a product of self-dissociation of p-
NPA at different percentages of ethanol with respect to wavelength. No peak occurred
due to ongoing hydrolysis process while measuring the absorbance of the samples.
Figure 4.32 shows the absorbance values of p-NP as a product of the self-hydrolysis of
p-NPA at 404 nm. As seen in the figure, as the ethanol concentration in the mixture was
increased, the absorbance values of p-NP decreased. This could be attributed to the
lower self-hydrolysis rate at higher organic solvent concentrations. From the figure, it
could be seen that the absorbance values of p-NP were very low which could be
negligible during the enzyme activity assays.
Figure 4.31. The spectrum profile for self-hydrolysis of p-NPA in various percent
volume ethanol/buffer mixtures.
0
0,5
1
1,5
2
2,5
3
200 250 300 350 400 450 500 550
Ab
so
rban
ce
, A
U
Wavelength, nm
%10 ethanol (v/v)
%20 ethanol (v/v)
%30 ethanol (v/v)
%40 ethanol (v/v)
%50 ethanol (v/v)
%60 ethanol (v/v)
%70 ethanol (v/v)
%80 ethanol (v/v)
%90 ethanol (v/v)
0
0,2
0,4
380 404 428
Ab
so
rba
nc
e, A
.U.
Wavelength, nm
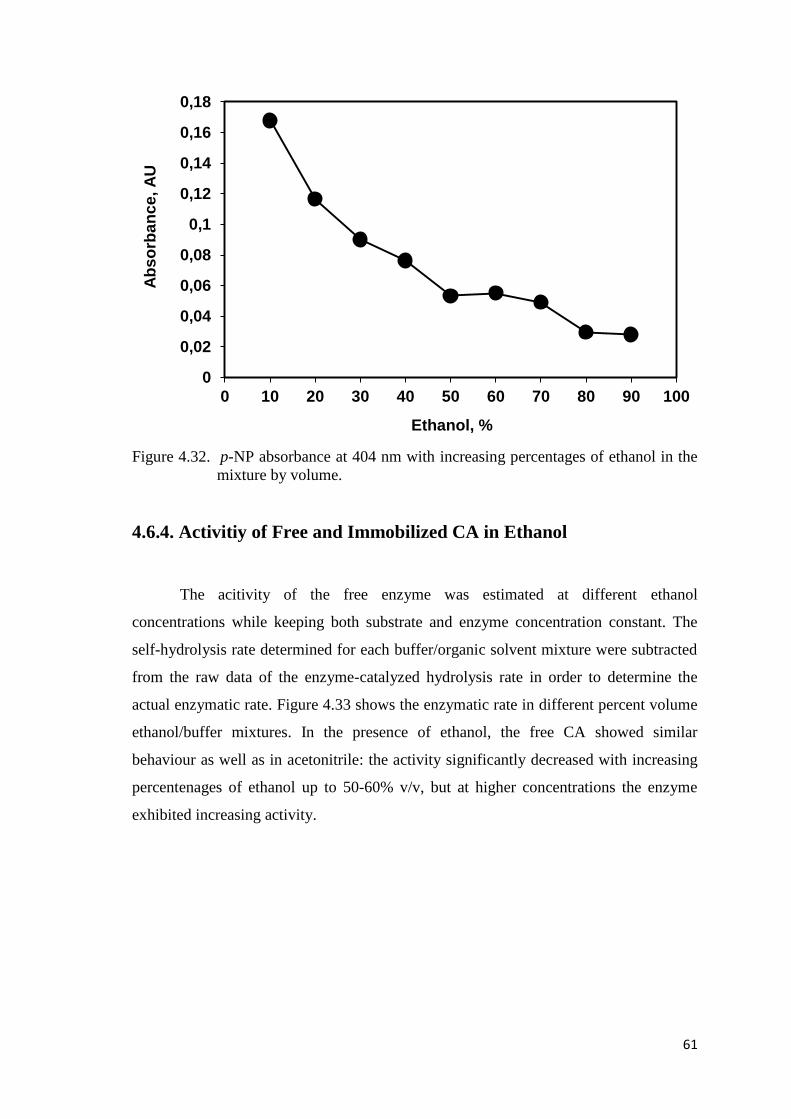
61
Figure 4.32. p-NP absorbance at 404 nm with increasing percentages of ethanol in the
mixture by volume.
4.6.4. Activitiy of Free and Immobilized CA in Ethanol
The acitivity of the free enzyme was estimated at different ethanol
concentrations while keeping both substrate and enzyme concentration constant. The
self-hydrolysis rate determined for each buffer/organic solvent mixture were subtracted
from the raw data of the enzyme-catalyzed hydrolysis rate in order to determine the
actual enzymatic rate. Figure 4.33 shows the enzymatic rate in different percent volume
ethanol/buffer mixtures. In the presence of ethanol, the free CA showed similar
behaviour as well as in acetonitrile: the activity significantly decreased with increasing
percentenages of ethanol up to 50-60% v/v, but at higher concentrations the enzyme
exhibited increasing activity.
0
0,02
0,04
0,06
0,08
0,1
0,12
0,14
0,16
0,18
0 10 20 30 40 50 60 70 80 90 100
Ab
so
rba
nc
e, A
U
Ethanol, %
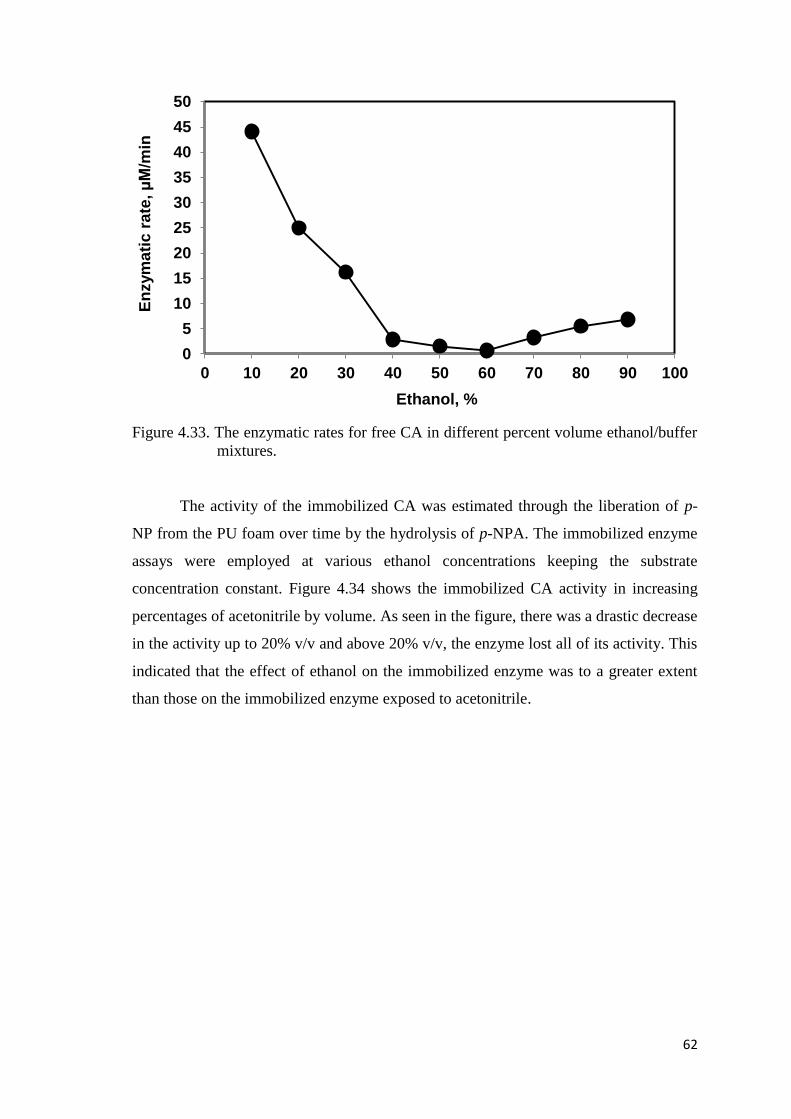
62
Figure 4.33. The enzymatic rates for free CA in different percent volume ethanol/buffer
mixtures.
The activity of the immobilized CA was estimated through the liberation of p-
NP from the PU foam over time by the hydrolysis of p-NPA. The immobilized enzyme
assays were employed at various ethanol concentrations keeping the substrate
concentration constant. Figure 4.34 shows the immobilized CA activity in increasing
percentages of acetonitrile by volume. As seen in the figure, there was a drastic decrease
in the activity up to 20% v/v and above 20% v/v, the enzyme lost all of its activity. This
indicated that the effect of ethanol on the immobilized enzyme was to a greater extent
than those on the immobilized enzyme exposed to acetonitrile.
0
5
10
15
20
25
30
35
40
45
50
0 10 20 30 40 50 60 70 80 90 100
En
zym
ati
c r
ate
, µ
M/m
in
Ethanol, %
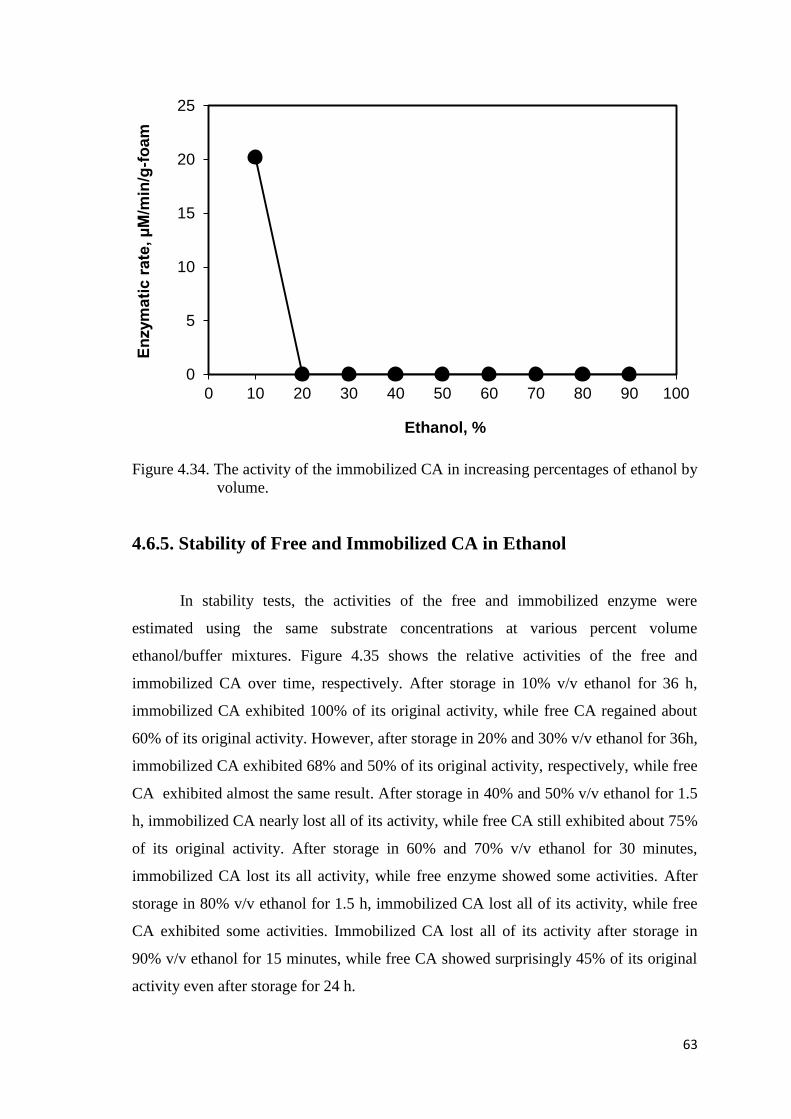
63
Figure 4.34. The activity of the immobilized CA in increasing percentages of ethanol by
volume.
4.6.5. Stability of Free and Immobilized CA in Ethanol
In stability tests, the activities of the free and immobilized enzyme were
estimated using the same substrate concentrations at various percent volume
ethanol/buffer mixtures. Figure 4.35 shows the relative activities of the free and
immobilized CA over time, respectively. After storage in 10% v/v ethanol for 36 h,
immobilized CA exhibited 100% of its original activity, while free CA regained about
60% of its original activity. However, after storage in 20% and 30% v/v ethanol for 36h,
immobilized CA exhibited 68% and 50% of its original activity, respectively, while free
CA exhibited almost the same result. After storage in 40% and 50% v/v ethanol for 1.5
h, immobilized CA nearly lost all of its activity, while free CA still exhibited about 75%
of its original activity. After storage in 60% and 70% v/v ethanol for 30 minutes,
immobilized CA lost its all activity, while free enzyme showed some activities. After
storage in 80% v/v ethanol for 1.5 h, immobilized CA lost all of its activity, while free
CA exhibited some activities. Immobilized CA lost all of its activity after storage in
90% v/v ethanol for 15 minutes, while free CA showed surprisingly 45% of its original
activity even after storage for 24 h.
0
5
10
15
20
25
0 10 20 30 40 50 60 70 80 90 100
En
zym
ati
c r
ate
, µ
M/m
in/g
-fo
am
Ethanol, %
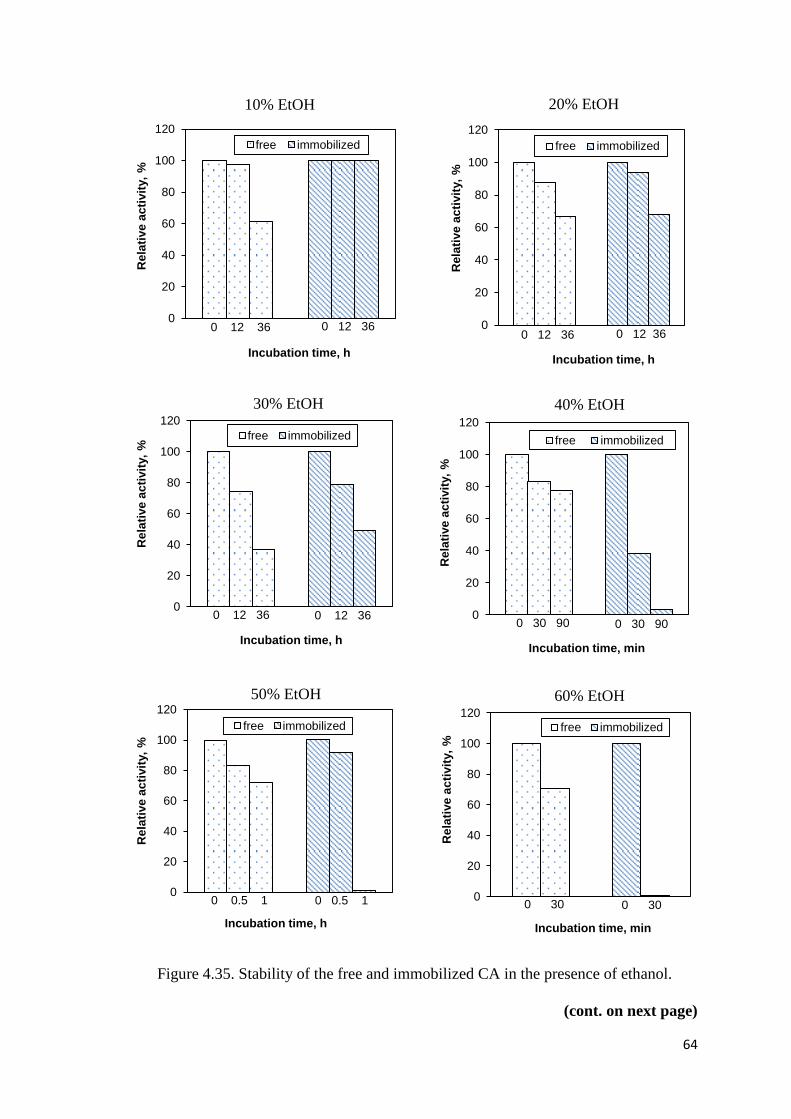
64
0
20
40
60
80
100
120
Rela
tive
ac
tivit
y,
%
Incubation time, h
free immobilized
0 12 36 0 12 36
0
20
40
60
80
100
120
Rela
tive
ac
tivit
y,
%
Incubation time, min
free immobilized
0 30 90 0 30 90
0
20
40
60
80
100
120
Rela
tive
ac
tivit
y,
%
Incubation time, h
free immobilized
0 0.5 1 0 0.5 1 0
20
40
60
80
100
120
Re
lati
ve
ac
tivit
y,
%
Incubation time, min
free immobilized
0 30 0 30
0
20
40
60
80
100
120
Re
lati
ve
ac
tivit
y,
%
Incubation time, h
free immobilized
0 12 36 0 12 36
0
20
40
60
80
100
120R
ela
tive
ac
tivit
y,
%
Incubation time, h
free immobilized
0 12 36 0 12 36
Figure 4.35. Stability of the free and immobilized CA in the presence of ethanol.
(cont. on next page)
10% EtOH 20% EtOH
30% EtOH 40% EtOH
50% EtOH 60% EtOH
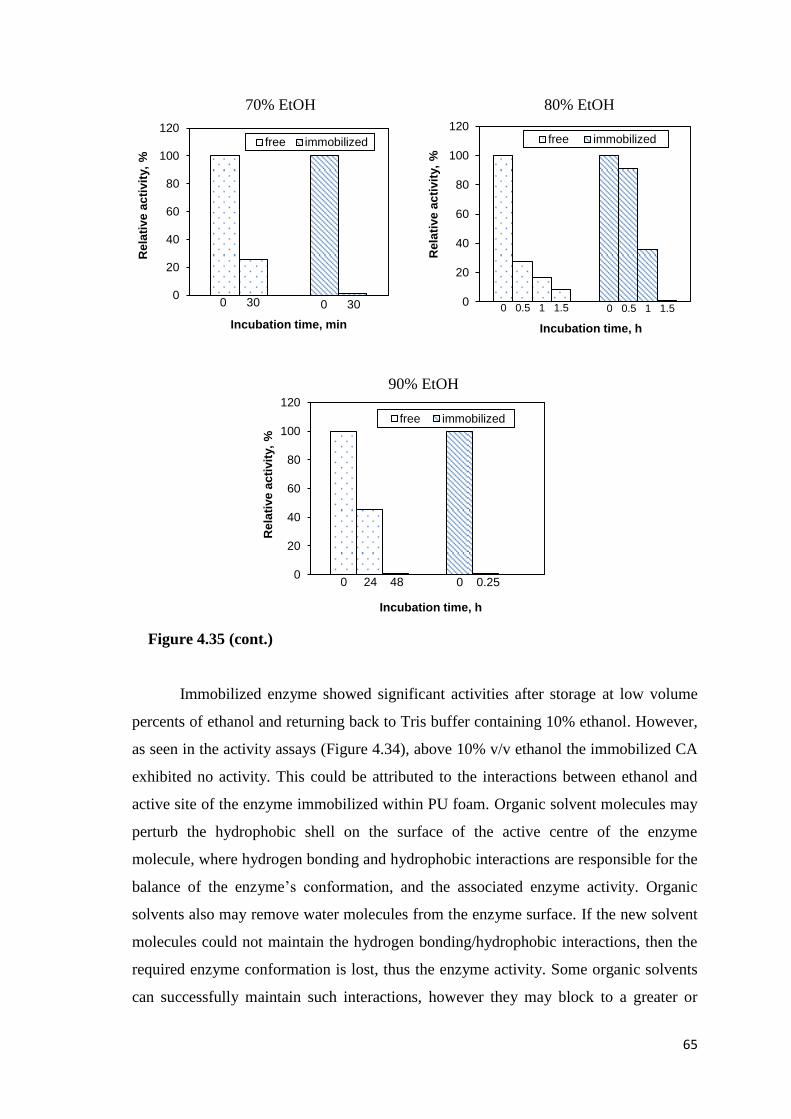
65
0
20
40
60
80
100
120R
ela
tive
ac
tivit
y,
%
Incubation time, min
free immobilized
0 30 0 30 0
20
40
60
80
100
120
Re
lati
ve
ac
tivit
y,
%
Incubation time, h
free immobilized
0 0.5 1 1.5 0 0.5 1 1.5
0
20
40
60
80
100
120
Rela
tive
ac
tivit
y,
%
Incubation time, h
free immobilized
0 24 48 0 0.25
Figure 4.35 (cont.)
Immobilized enzyme showed significant activities after storage at low volume
percents of ethanol and returning back to Tris buffer containing 10% ethanol. However,
as seen in the activity assays (Figure 4.34), above 10% v/v ethanol the immobilized CA
exhibited no activity. This could be attributed to the interactions between ethanol and
active site of the enzyme immobilized within PU foam. Organic solvent molecules may
perturb the hydrophobic shell on the surface of the active centre of the enzyme
molecule, where hydrogen bonding and hydrophobic interactions are responsible for the
balance of the enzyme‘s conformation, and the associated enzyme activity. Organic
solvents also may remove water molecules from the enzyme surface. If the new solvent
molecules could not maintain the hydrogen bonding/hydrophobic interactions, then the
required enzyme conformation is lost, thus the enzyme activity. Some organic solvents
can successfully maintain such interactions, however they may block to a greater or
70% EtOH 80% EtOH
90% EtOH
66
lesser extent the active site of the enzyme and prevent access to the substrate, thereby
decreasing enzyme activity (Wan, Lu et al. 2010). In our system, during the enzymatic
reaction within the PU foam, the substrate or the product presumably could not diffuse
in and out of the foam due to the blocking caused by ethanol, hence we could not detect
any change for p-NP absorbance in the UV/vis spectrophotometer. In the presence of
ethanol, free CA generally exhibited greater stability than the immobilized CA.
Hydroxyl groups of water-miscible organic solvents are incompatible with the
hydrophobic regions of enzymes, but can participate in hydrogen bonding to generate
rigid intermolecular frameworks, resulting in high kinetic barriers (kinetic trapping)
preventing unfolding of the enzyme (Wan, Lu et al. 2010). Thus, the free CA still
exhibited some of its original activity in Tris buffer after storage at high volume
percents of ethanol. On the contrary, immobilized enzyme was fixed by cross-linking
within PU foam, therefore the enzyme presumably lost its conformational flexibility,
and thus enzyme activity in the presence of the organic solvent.
67
CHAPTER 5
CONCLUSION
Biocatalytic performance of CA immobilized within PU foam was investigated
in the presence of water-miscible organic solvents. It was experimentally found that the
PU foam could hold up to 12 times of its weight in aqueous media. It was also
demonstrated that the adsorption isotherm of moisture on the PU foam corresponded to
a Type III adsorption isotherm indicating that water adsorbed on the PU foam either by
capillary condensation and/or adsorption with a multimolecular layer on the PU foam.
However, while expecting a high water adsorption capacity, PU foam showed a Type III
adsorption isotherm, indicating that, indeed, there were very weak water-PU foam
interactions. p-NP, one of the products of the hydrolysis reaction of p-NPA, was
characterized in the presence of the organic solvents, acetonitrile and ethanol. The
absorbance of p-NP in the UV/vis spectrophotometer decreased significantly as the
concentration of the organic solvent in buffer solution was increased, while keeping p-
NP concentration constant. During the absorbance scanning, it was observed that a
chemical shift occured towards the protonated form of p-NP with increasing organic
solvent content in the mixtures, resulting in a switching in absorption in the organic
solvent/buffer mixtures. The absorbance decline for p-NP could be attributed to the
possible interactions between the organic solvent and p-NP. The CA was successfully
immobilized within PU foam. Because the PU foam was a highly porous polymeric
material and immobilization of the enzyme was easy and fast, the PU foam was used as
a stabilizing carrier. The activity of the free and immobilized CA was estimated in
various percent volume organic solvent/buffer mixtures. In the case of acetonitrile, the
activity of the free CA diminished as the organic solvent concentration was increased up
to 50% v/v, and at higher acetonitrile concentrations the free CA exhibited increasing
activity as if a u-shape. Immobilized CA exhibited decreasing activity in acetonitrile at
percentages up to 50% v/v, and then no activity was seen at higher acetonitrile
percentages. In the presence of ethanol, the immobilized CA exhibited no activity at
organic solvent percentages above 10% v/v, while the free enzyme showed similar
behaviour in the presence of acetonitrile. In stability tests, it was observed that the
organic solvents at percentages above 30% v/v dramatically inactivate the immobilized

68
enzyme in shorter times. It was concluded that the water-miscible organic solvents
severely perturbed the active site of the enzyme by removing the bound water molecules
from its hydration shell, thus denaturating the enzyme.
69
REFERENCES
Azevedo, A. M., D. M. Prazeres, J. Cabral and L. s. P. Fonseca (2001). "Stability of free
and immobilised peroxidase in aqueous–organic solvents mixtures." Journal of
Molecular Catalysis B: Enzymatic 15(4): 147-153.
Bakker, M., F. van de Velde, F. van Ranwijk and R. A. Sheldon (2000). "Highly
efficient immobilization of glycosylated enzymes into polyurethane foams."
Biotechnology and Bioengineering 70(3): 342-348.
Berg, J. M., J. L. Tymoczko and L. Stryer (2006). Biochemistry, International Edition,
WH Freeman & Co. New York.
Cao, L. (2006). Carrier-bound immobilized enzymes: principles, application and design,
John Wiley & Sons.
Carrea, G. and S. Riva (2008). Organic synthesis with enzymes in non-aqueous media,
Wiley. com.
Castillo, B., Y. Pacheco, W. Al-Azzam, K. Griebenow, M. Devi, A. Ferrer and G.
Barletta (2005). "On the activity loss of hydrolases in organic solvents - I. Rapid
loss of activity of a variety of enzymes and formulations in a range of organic
solvents." Journal of Molecular Catalysis B-Enzymatic 35(4-6): 147-153.
Copeland, R. A. (2004). Enzymes: a practical introduction to structure, mechanism, and
data analysis, Wiley. com.
Costas, L., V. E. Bosio, A. Pandey and G. R. Castro (2008). "Effects of Organic
Solvents on Immobilized Lipase in Pectin Microspheres." Applied Biochemistry
and Biotechnology 151(2-3): 578-586.
Cox, E. H., G. L. McLendon, F. M. M. Morel, T. W. Lane, R. C. Prince, I. J. Pickering
and G. N. George (2000). "The active site structure of Thalassiosira weissflogii
carbonic anhydrase 1." Biochemistry 39(40): 12128-12130.
Crittenden, B. and W. J. Thomas (1998). Adsorption technology & design, Butterworth-
Heinemann.
Doukyu, N. and H. Ogino (2010). "Organic solvent-tolerant enzymes." Biochemical
Engineering Journal 48(3): 270-282.
Gregory, R. B. (1995). Protein-solvent interactions, CRC Press.
70
Griebenow, K. and A. M. Klibanov (1996). "On protein denaturation in aqueous-
organic mixtures but not in pure organic solvents." Journal of the American
Chemical Society 118(47): 11695-11700.
Guisan, J. M. (2006). Immobilization of enzymes and cells, Springer.
Harvey, L., B. Arnold, A. Kaiser Chris and K. Monty (2008). Molecular cell biology,
WH Freeman.
Höst, G. (2007). Engineering carbonic anhydrase for highly selective ester hydrolysis,
Södertörn University.
Innocenti, A., A. Scozzafava, S. Parkkila, L. Puccetti, G. De Simone and C. T. Supuran
(2008). "Investigations of the esterase, phosphatase, and sulfatase activities of
the cytosolic mammalian carbonic anhydrase isoforms I, II, and XIII with 4-
nitrophenyl esters as substrates." Bioorganic & medicinal chemistry letters
18(7): 2267-2271.
Iyer, P. V. and L. Ananthanarayan (2008). "Enzyme stability and stabilization—aqueous
and non-aqueous environment." Process Biochemistry 43(10): 1019-1032.
José, C. V., C. O. Sandra, C. G. Fernando, C. P. Pedro and M. L. Liadys (2008).
"Computational Study of Hydrogen Bonding in Substituted Phenol-Acetonitrile-
Water Clusters." Journal of the Chinese Chemical Society 55(3): 529-534.
Khmelnitsky, Y. L. and J. O. Rich (1999). "Biocatalysis in nonaqueous solvents."
Current Opinion in Chemical Biology 3(1): 47-53.
Klibanov, A. M. (1997). "Why are enzymes less active in organic solvents than in
water?" Trends in Biotechnology 15(3): 97-101.
Krajewska, B. (2004). "Application of chitin- and chitosan-based materials for enzyme
immobilizations: a review." Enzyme and Microbial Technology 35(2-3): 126-
139.
Krieger, N., T. Bhatnagar, J. C. Baratti, A. M. Baron, V. M. de Lima and D. Mitchell
(2004). "Non-aqueous biocatalysis in heterogeneous solvent systems." Food
Technology and Biotechnology 42(4): 279-286.
Krishna, S. H. (2002). "Developments and trends in enzyme catalysis in
nonconventional media." Biotechnology Advances 20(3-4): 239-267.
LeJeune, K. E. and A. J. Russell (1996). "Covalent binding of a nerve agent hydrolyzing
enzyme within polyurethane foams." Biotechnology and Bioengineering 51(4):
450-457.
71
Lodish, H. and S. L. Zipursky (2001). "Molecular cell biology." Biochemistry and
Molecular Biology Education 29: 126-133.
Micaelo, N. M. and C. M. Soares (2007). "Modeling hydration mechanisms of enzymes
in nonpolar and polar organic solvents." Febs Journal 274(9): 2424-2436.
Mozhaev, V. V., Y. L. Khmelnitsky, M. V. Sergeeva, A. B. Belova, N. L. Klyachko, A.
V. Levashov and K. Martinek (1989). "Catalytic Activity and Denaturation of
in Water Organic Cosolvent Mixtures - Alpha-Chymotrypsin and Laccase in
Mixed Water Alcohol, Water Glycol and Water Formamide Solvents." European
Journal of Biochemistry 184(3): 597-602.
Ng, K. C., I. I. El-Sharkawy, B. B. Saha and A. Chakraborty (2008). Adsorption
Desalination: A Novel Method. Membrane and Desalination Technologies,
Springer: 391-431.
Odaly, J. P., A. L. Crumbliss and R. W. Henkens (1990). "Activity of Carbonic-
Anhydrase Immobilized on Porous Silica Beads in Organic Media."
Biotechnology and Applied Biochemistry 12(1): 11-19.
Ogino, H. and H. Ishikawa (2001). "Enzymes which are stable in the presence of
organic solvents." Journal of Bioscience and Bioengineering 91(2): 109-116.
Ohta, S., M. T. Alam, H. Arakawa and A. Ikai (2004). "Origin of mechanical strength of
bovine carbonic anhydrase studied by molecular dynamics simulation."
Biophysical journal 87(6): 4007-4020.
Olofsson, L., P. Soderberg and I. A. Nicholls (2006). "Influence of water miscible
organic solvents on alpha-chymotrypsin in solution and immobilized on
Eupergit CM." Biotechnology Letters 28(12): 929-935.
Ozdemir, E. (2009). "Biomimetic CO2 Sequestration: 1. Immobilization of Carbonic
Anhydrase within Polyurethane Foam." Energy & Fuels 23: 5725-5730.
Partridge, J., B. D. Moore and P. J. Halling (1999). "alpha-Chymotrypsin stability in
aqueous-acetonitrile mixtures: is the native enzyme thermodynamically or
kinetically stable under low water conditions?" Journal of Molecular Catalysis
B-Enzymatic 6(1-2): 11-20.
Plou, F., J. Iborra and P. Halling (1998). Stability and stabilization of biocatalysts,
Access Online via Elsevier.
Romaškevič, T., S. Budrienė, K. Pielichowski and J. Pielichowski (2006). "Application
of polyurethane-based materials for immobilization of enzymes and cells: a
review." Chemija 17: 74-89.
Ruthven, D. M. (1984). "Principles of adsorption and adsorption processes."
72
Safarian, S., M. Saffarzadeh, S. J. Zargar and A. A. Moosavi-Movahedi (2006). "Molten
globule-like state of bovine carbonic anhydrase in the presence of acetonitrile."
Journal of Biochemistry 139(6): 1025-1033.
Savile, C. K. and J. J. Lalonde (2011). "Biotechnology for the acceleration of carbon
dioxide capture and sequestration." Current Opinion in Biotechnology 22(6):
818-823.
Serdakowski, A. L. and J. S. Dordick (2008). "Enzyme activation for organic solvents
made easy." Trends in Biotechnology 26(1): 48-54.
Sheldon, R. A. (2007). "Enzyme immobilization: the quest for optimum performance."
Advanced Synthesis & Catalysis 349(8‐9): 1289-1307.
Shuler, M. L. and F. Kargi (2002). Bioprocess engineering, Prentice Hall New York.
Simon, L. M., K. Laszlo, A. Vertesi, K. Bagi and B. Szajani (1998). "Stability of
hydrolytic enzymes in water-organic solvent systems." Journal of Molecular
Catalysis B-Enzymatic 4(1-2): 41-45.
Sirotkin, V., A. Zazybin, O. Osipova, B. Solomonov, D. Faizullin and V. Fedotov
(2000). "SOLUBILITY AND SECONDARY STRUCTURE OF BOVINE
PANCREATIC α-CHYMOTRYPSIN IN WATER–ACETONITRILE
MIXTURES." Vestn. Mosk. U. Khim 41(6): 114-117.
Supuran, C. T., A. Scozzafava and J. Conway (2004). Carbonic anhydrase: its inhibitors
and activators, CRC Press.
Thorslund, A. and S. Lindskog (1967). "Studies of the esterase activity and the anion
inhibition of bovine zinc and cobalt carbonic anhydrases." European journal of
biochemistry 3(1): 117-123.
Torres, S. and G. R. Castro (2004). "Non-aqueous biocatalysis in homogeneous solvent
systems." Food Technology and Biotechnology 42(4): 271-277.
Verma, S. K. and K. K. Ghosh (2010). "Catalytic activity of enzyme in water/organic
cosolvent mixtures for the hydrolysis of p-nitrophenyl acetate and p-nitrophenyl
benzoate." Indian Journal of Chemistry Section a-Inorganic Bio-Inorganic
Physical Theoretical & Analytical Chemistry 49(8): 1041-1046.
Wan, Y. Y., R. Lu, L. Xiao, Y. M. Du, T. Miyakoshi, C. L. Chen, C. J. Knill and J. F.
Kennedy (2010). "Effects of organic solvents on the activity of free and
immobilised laccase from Rhus vernicifera." International Journal of Biological
Macromolecules 47(4): 488-495.
Whitford, D. (2005). Proteins: structure and function, Wiley. com.
73
Whitney, P. L. (1970). "Inhibition and Modification of Human Carbonic Anhydrase-B
with Bromoacetate and Iodoacetamide." European Journal of Biochemistry
16(1): 126-&.
Wood, L. L., F. J. Hartdegen and P. A. Hahn (1982). Enzymes bound to polyurethane,
Google Patents.
Yang, L., J. S. Dordick and S. Garde (2004). "Hydration of enzyme in nonaqueous
media is consistent with solvent dependence of its activity." Biophysical Journal
87(2): 812-821.
Zekarias, M. T., B. Y. Hirpaye and G. Nageswara Rao (2011). "Effect of dielectric
constant on protonation equilibria of glycylglycine in aqueous solutions of
propylene glycol and dioxan." Der Pharma Chemica 3(4): 69-77.
Zhang, S. H., Z. H. Zhang, Y. Q. Lu, M. Rostam-Abadi and A. Jones (2011). "Activity
and stability of immobilized carbonic anhydrase for promoting CO2 absorption
into a carbonate solution for post-combustion CO2 capture." Bioresource
Technology 102(22): 10194-10201.
Zhu, L., W. Yang, Y. Y. Meng, X. Xiao, Y. Guo, X. Pu and M. Li (2012). "Effects of
organic solvent and crystal water on γ-chymotrypsin in acetonitrile media:
observations from molecular dynamics simulation and DFT calculation." The
Journal of Physical Chemistry B 116(10): 3292-3304.