Embed Size (px)
Citation preview
Biobased Products Value Chain- Feedstocks, Products & Markets -
RRM-Meeting
Brussels, 2nd April 2014
Rainer Busch, T+I Consulting
Dietrich Wittmeyer, ERRMA
1
2
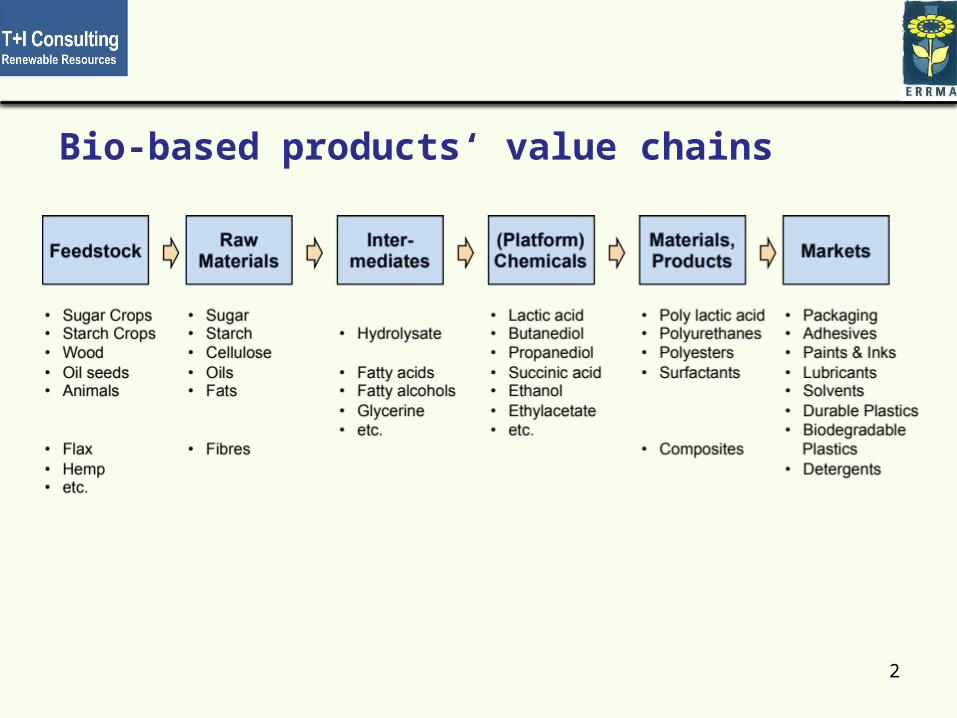
Bio-based products‘ value chains
3
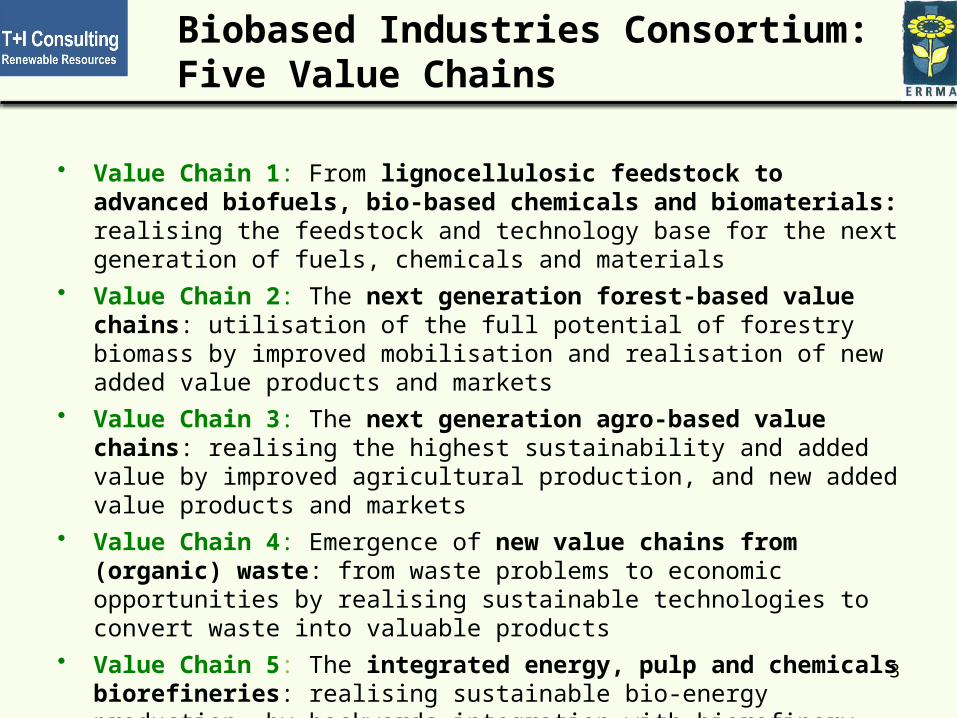
• Value Chain 1: From lignocellulosic feedstock to advanced biofuels, bio-based chemicals and biomaterials: realising the feedstock and technology base for the next generation of fuels, chemicals and materials
• Value Chain 2: The next generation forest-based value chains: utilisation of the full potential of forestry biomass by improved mobilisation and realisation of new added value products and markets
• Value Chain 3: The next generation agro-based value chains: realising the highest sustainability and added value by improved agricultural production, and new added value products and markets
• Value Chain 4: Emergence of new value chains from (organic) waste: from waste problems to economic opportunities by realising sustainable technologies to convert waste into valuable products
• Value Chain 5: The integrated energy, pulp and chemicals biorefineries: realising sustainable bio-energy production, by backwards integration with biorefinery operations isolating higher added value components
Biobased Industries Consortium: Five Value Chains
4
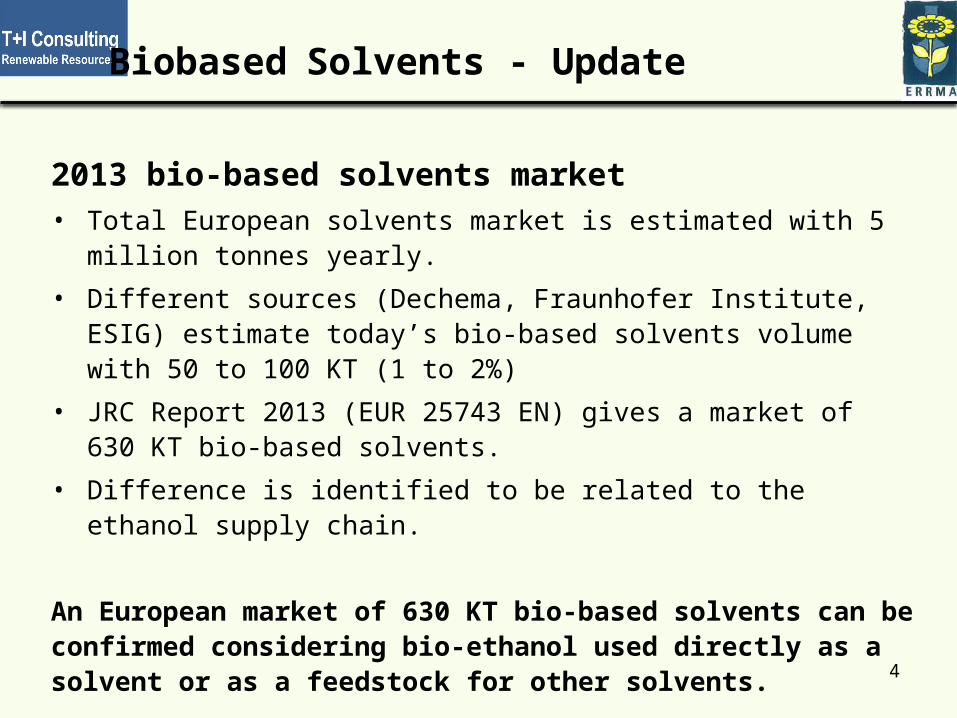
Biobased Solvents - Update
2013 bio-based solvents market• Total European solvents market is estimated with 5 million tonnes
yearly.
• Different sources (Dechema, Fraunhofer Institute, ESIG) estimate today’s bio-based solvents volume with 50 to 100 KT (1 to 2%)
• JRC Report 2013 (EUR 25743 EN) gives a market of 630 KT bio-based solvents.
• Difference is identified to be related to the ethanol supply chain.
An European market of 630 KT bio-based solvents can be confirmed considering bio-ethanol used directly as a solvent or as a feedstock for other solvents.
5
Biobased Solvents - Update
Solvents and the Ethanol case (source NNFCC and industry):
• Ethanol global production 2008: 61 million tonnes (> 90% bio-based)
• Most applications in fuels and food & beverages
• Ca. 6 million tonnes for the industry
• Part of ethanol is used directly as a solvent, part blended with other solvents (e.g. ETOH/ETAC blend for inks), part used for downstream products (solvents like ETAC or non-solvents like ethylene, acetic acid…)
• Applications may switch back and forward considering market conditions
• The solvents application of ETOH, being bio-based or not, is very low compared with biofuel but as well industrial applications considering for example the chain ethanol ethylene polyethylene
• Bio-ethanol from biomass is a mature market being highly impacted by policies and incentives.
6
Biobased Solvents - Update
Prediction (what can we reasonably say today)• Main solvents application are ethanol and downstream products or
blends
• Development of ethanol will remain highly affected by regional and local policies
• Other bio-based solvents (alcohols, acetates) are mainly oxygenated solvents and have very low volumes representing no more than 1% of the market
• Their development will depend on competitive production conditions
• Today, it is not possible for the solvents industry to give serious fact based prediction of bio-based solvents market.
7
Biobased Solvents - Update
Some additional considerations in the bio-based solvents context
• Feedstock availability at competitive conditions
• Competitive production process
• Pull from downstream users
• Long term predictability of legal and incentives conditions
• Standardization will give the frame for companies and downstream users to develop their own bio-based strategies
8
Surfactants - Update
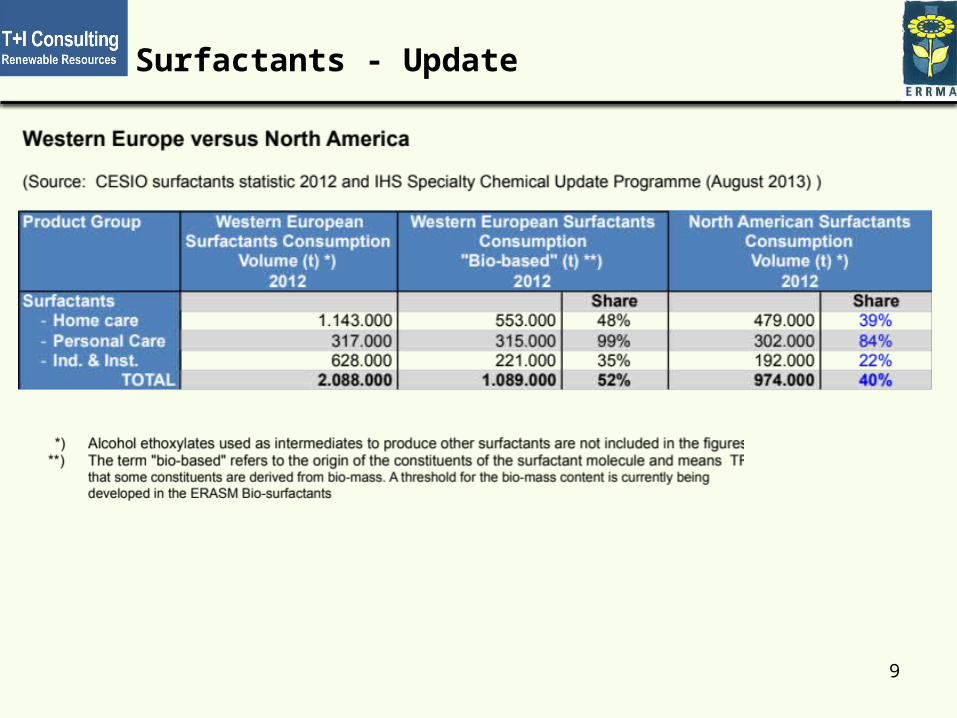
9
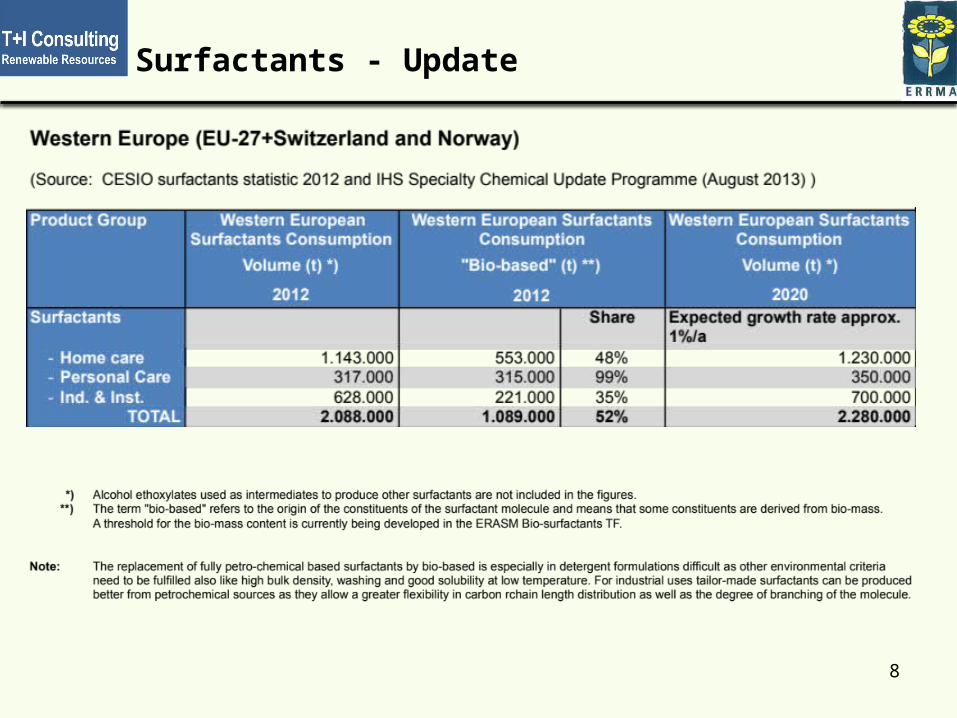
Surfactants - Update
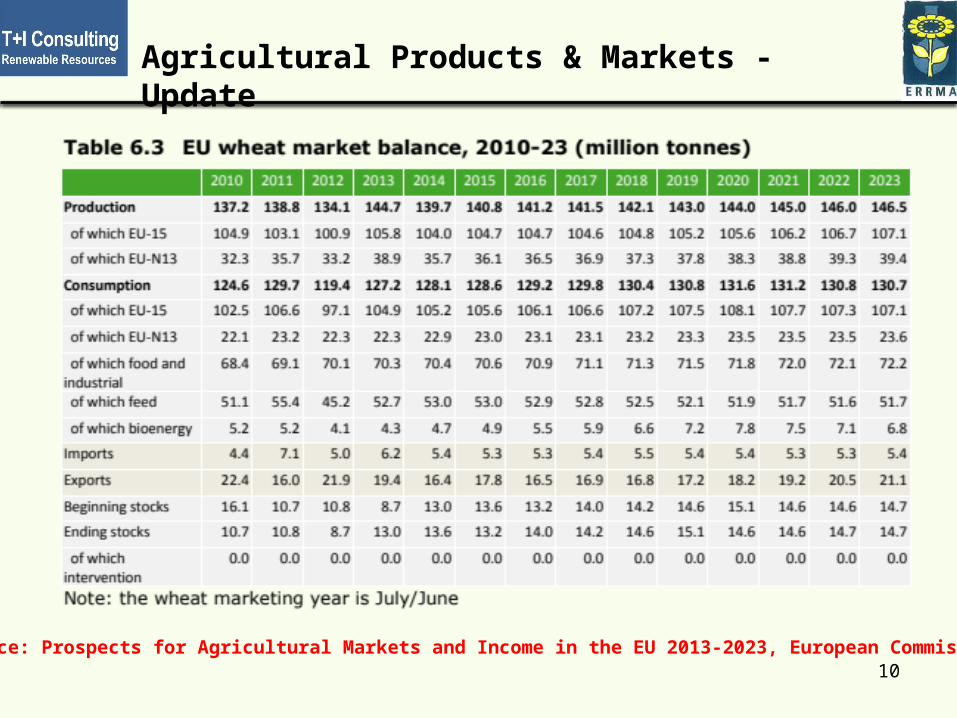
10Source: Prospects for Agricultural Markets and Income in the EU 2013-2023, European Commission
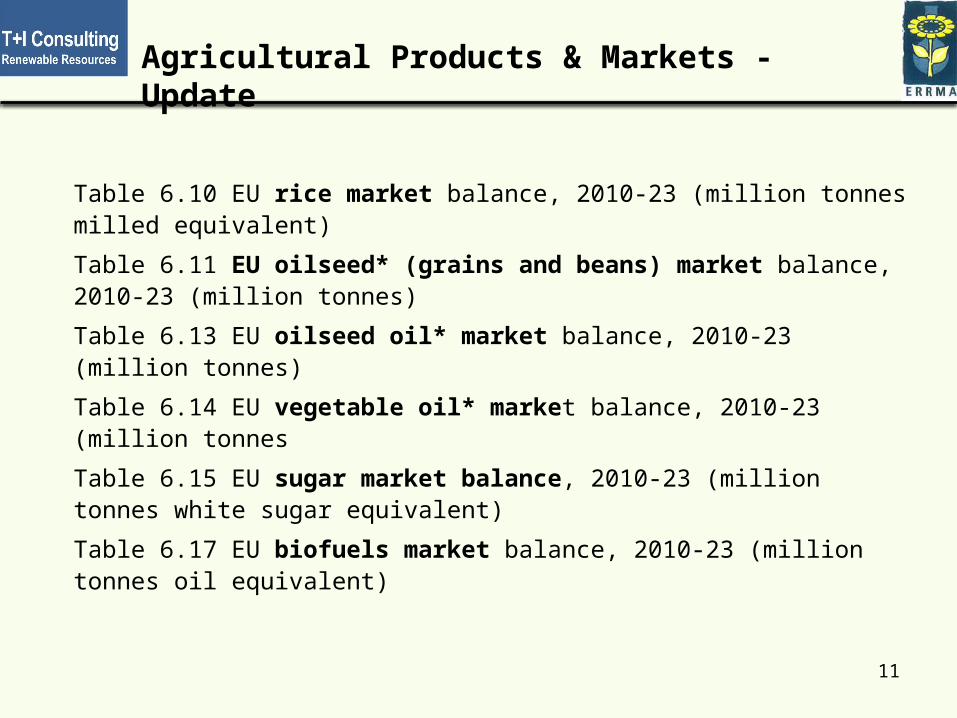
Agricultural Products & Markets - Update
11
Table 6.10 EU rice market balance, 2010-23 (million tonnes milled equivalent)
Table 6.11 EU oilseed* (grains and beans) market balance, 2010-23 (million tonnes)
Table 6.13 EU oilseed oil* market balance, 2010-23 (million tonnes)
Table 6.14 EU vegetable oil* market balance, 2010-23 (million tonnes
Table 6.15 EU sugar market balance, 2010-23 (million tonnes white sugar equivalent)
Table 6.17 EU biofuels market balance, 2010-23 (million tonnes oil equivalent)
Agricultural Products & Markets - Update

12
Source: nova-institute
Starch: European Starch Production & TradeEU-27
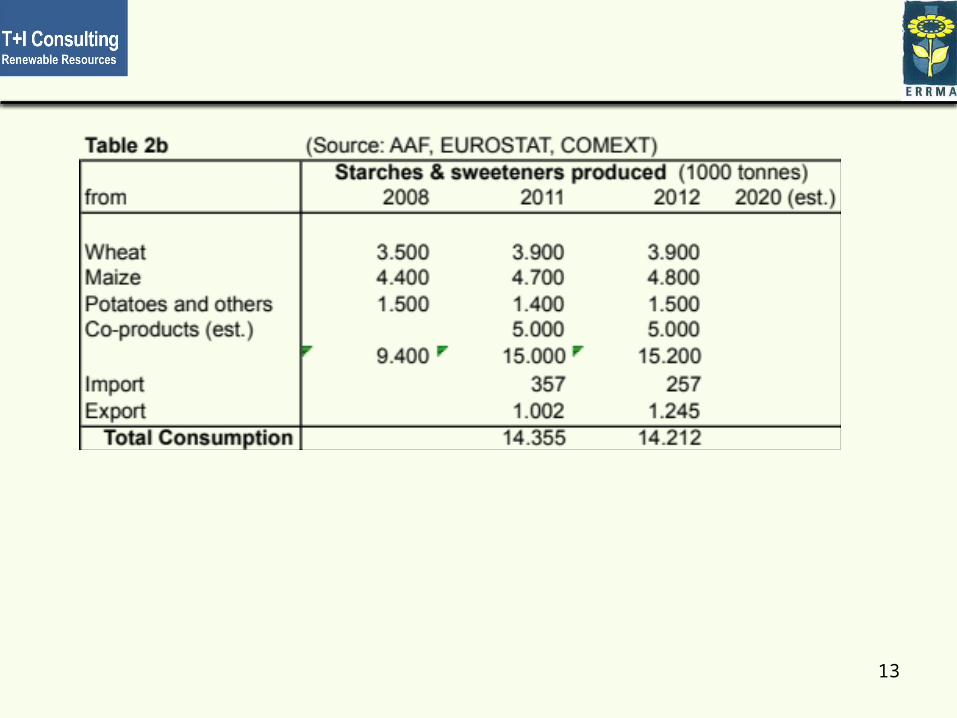
13

14

15

16

17

18
19
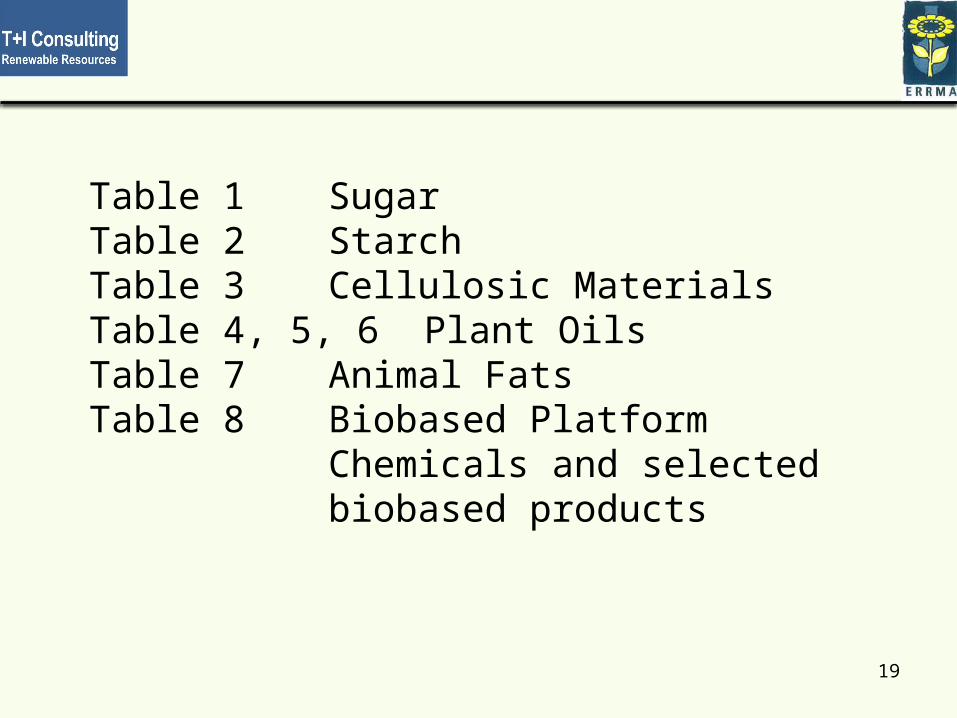
Table 1 SugarTable 2 StarchTable 3 Cellulosic MaterialsTable 4, 5, 6 Plant OilsTable 7 Animal FatsTable 8 Biobased Platform
Chemicals and selected biobased products
OIL SEEDS & VEGETABLE OILS
20
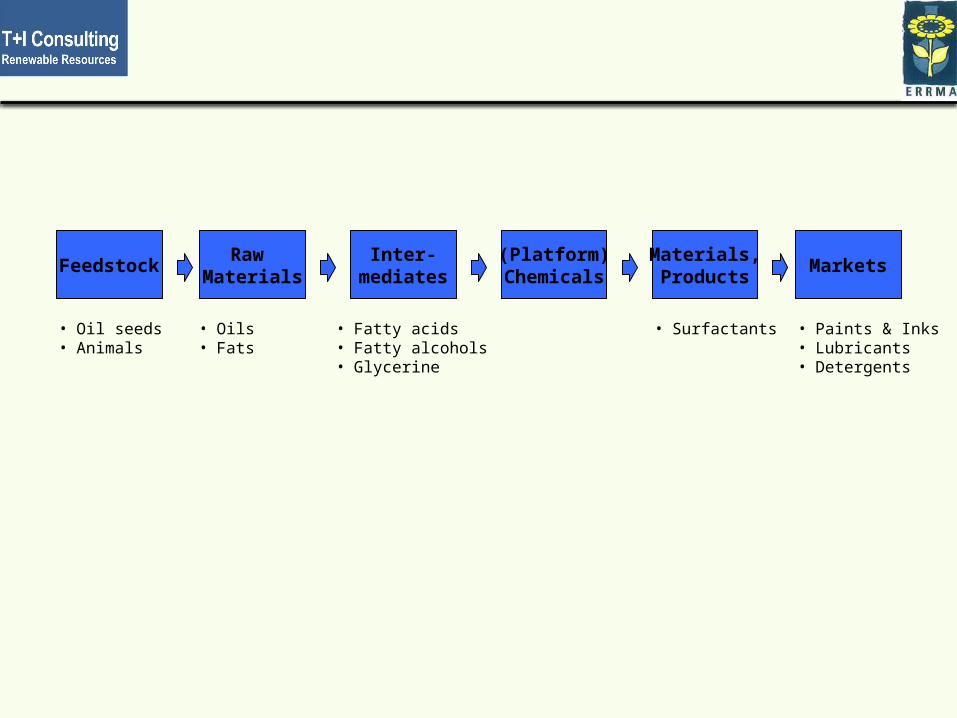
FeedstockInter-
mediatesRaw
Materials(Platform)Chemicals
Materials,Products
• Oil seeds• Animals
• Oils• Fats
• Surfactants• Fatty acids• Fatty alcohols• Glycerine
Markets
• Paints & Inks• Lubricants• Detergents
22
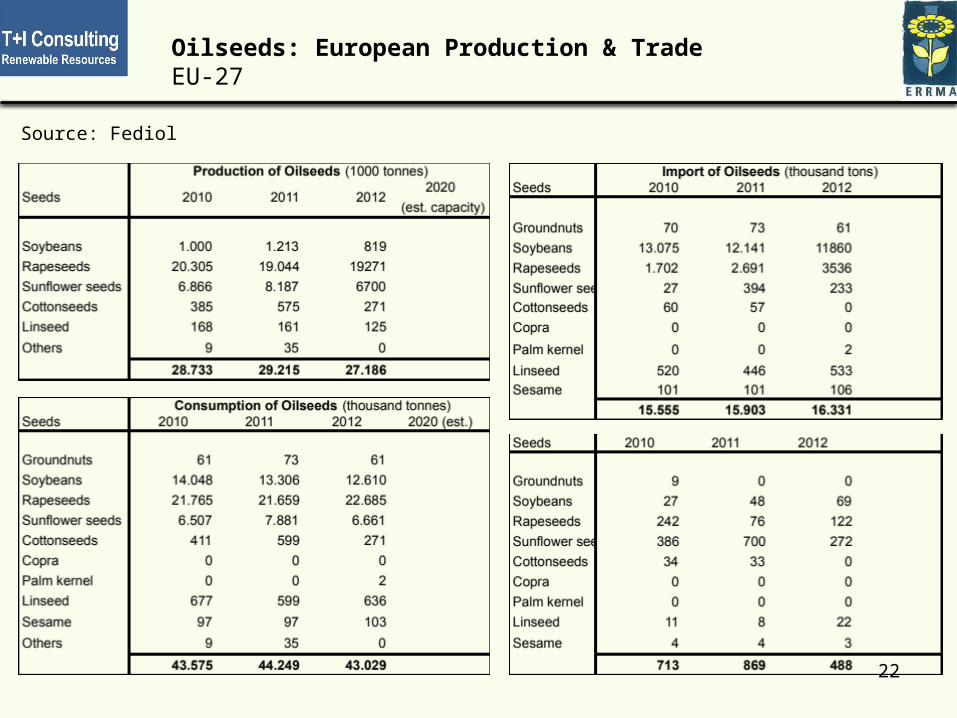
Oilseeds: European Production & TradeEU-27
Source: Fediol
23
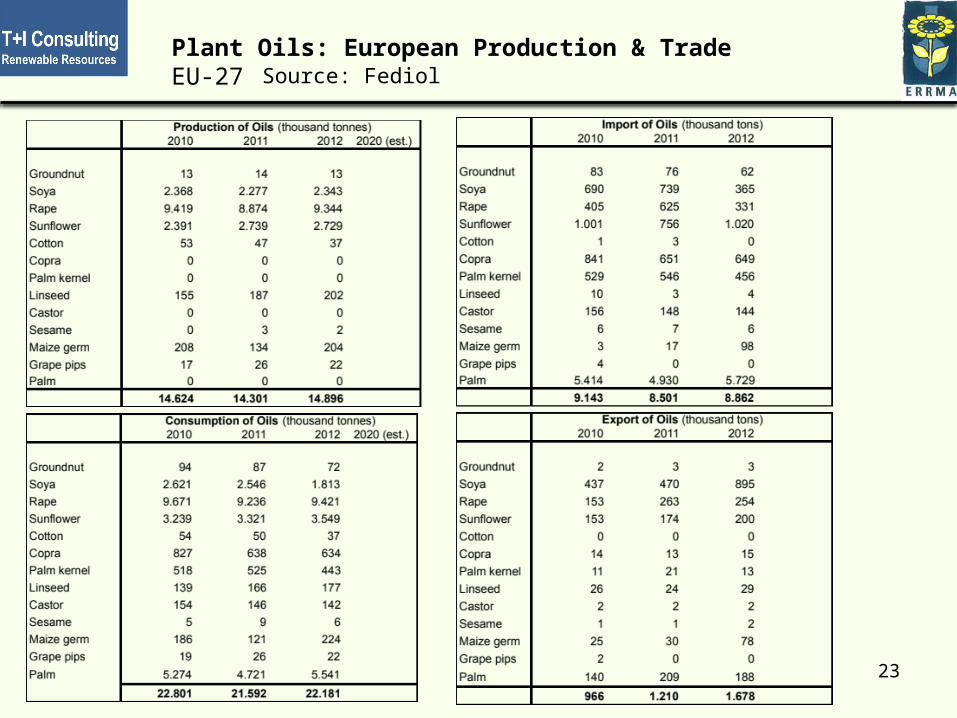
Plant Oils: European Production & TradeEU-27 Source: Fediol
24
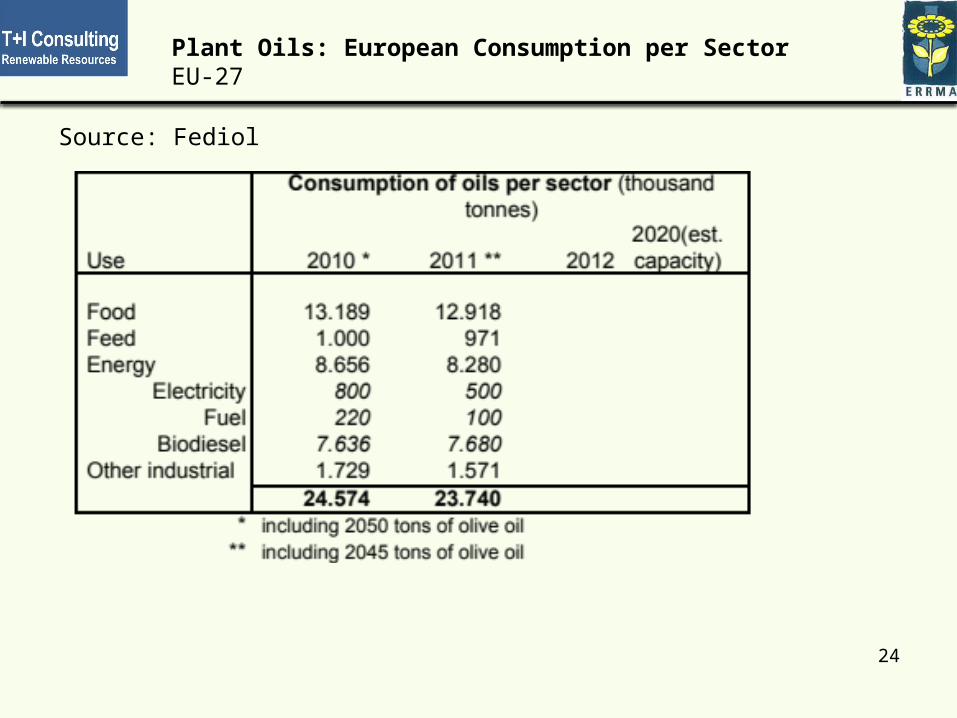
Plant Oils: European Consumption per SectorEU-27
Source: Fediol
25
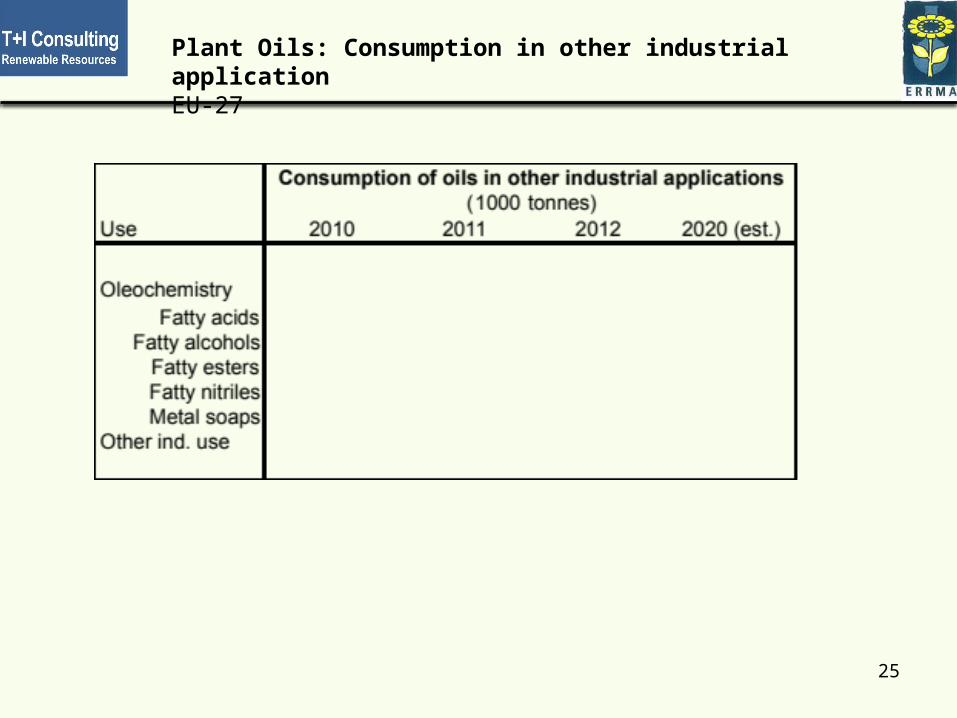
Plant Oils: Consumption in other industrial applicationEU-27
26
Also available:
• Global production of Palm & Palm Kernel oil• Global production of Soybean oil• Global production of Rapeseed oil• Global production of sunflower oil
Source: FAO
27
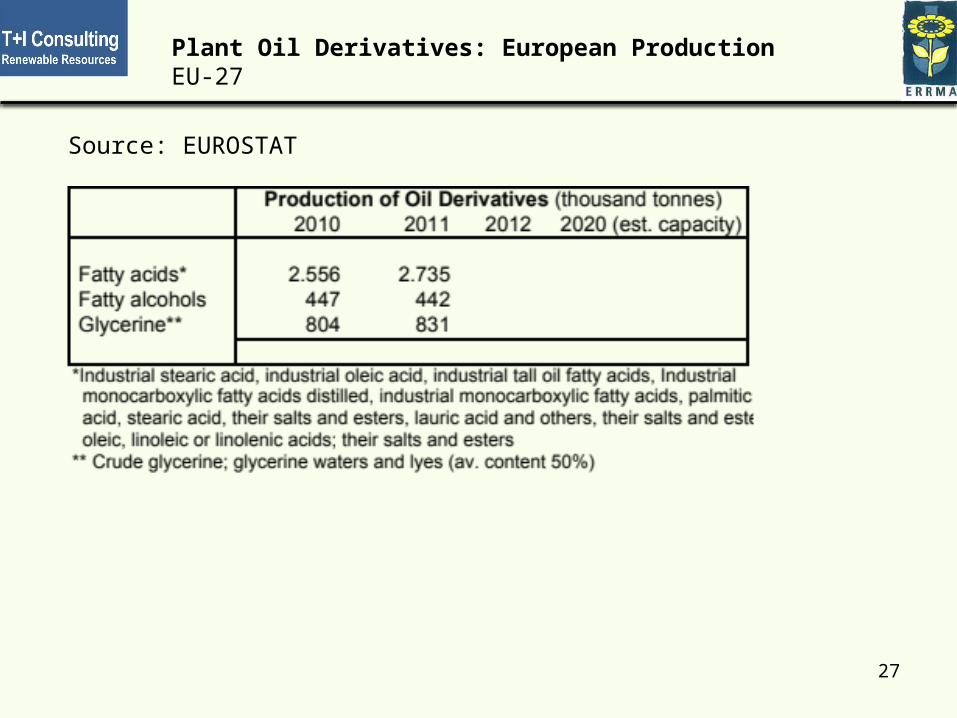
Plant Oil Derivatives: European ProductionEU-27
Source: EUROSTAT
28
Plant Oil Derivatives: European TradeEU-27
Source: EUROSTAT
29
Plant Oil Derivatives: European ConsumptionEU-27
30
Plant Oil Derivatives: Consumption per SectorEU-27
SUGAR
31
32
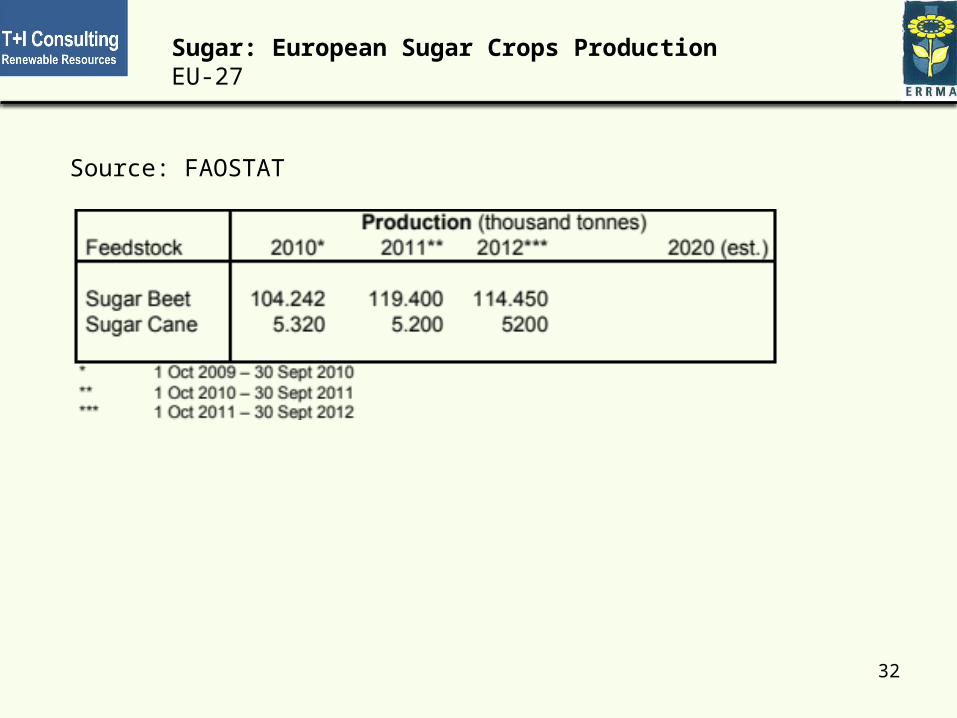
Sugar: European Sugar Crops ProductionEU-27
Source: FAOSTAT
33
Sugar: European Sugar Crops TradeEU-27
34
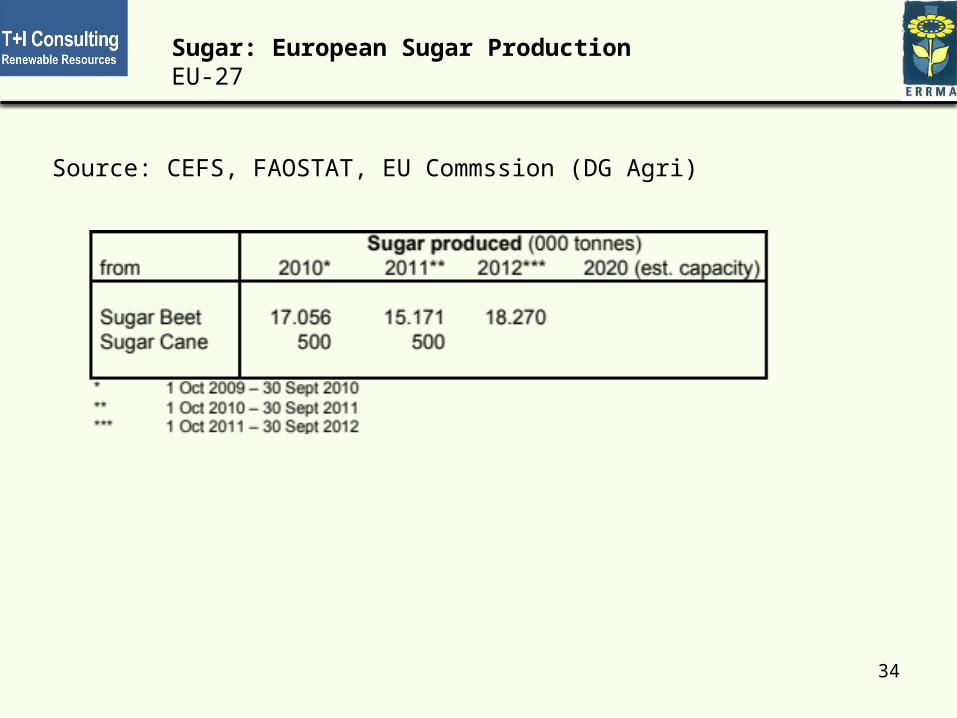
Sugar: European Sugar ProductionEU-27
Source: CEFS, FAOSTAT, EU Commssion (DG Agri)
35
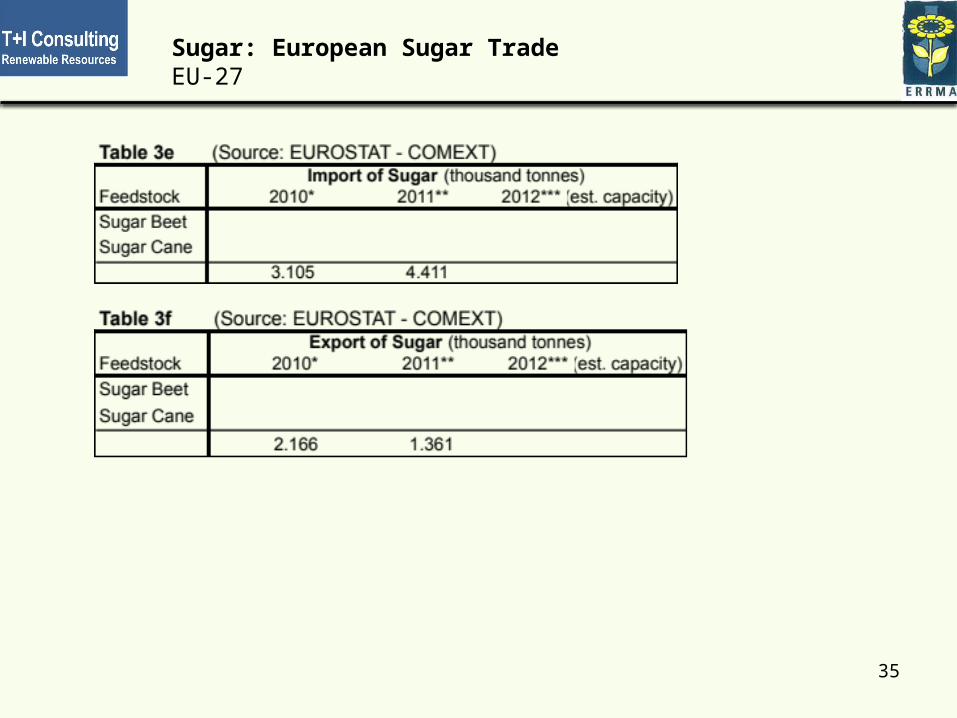
Sugar: European Sugar TradeEU-27
36
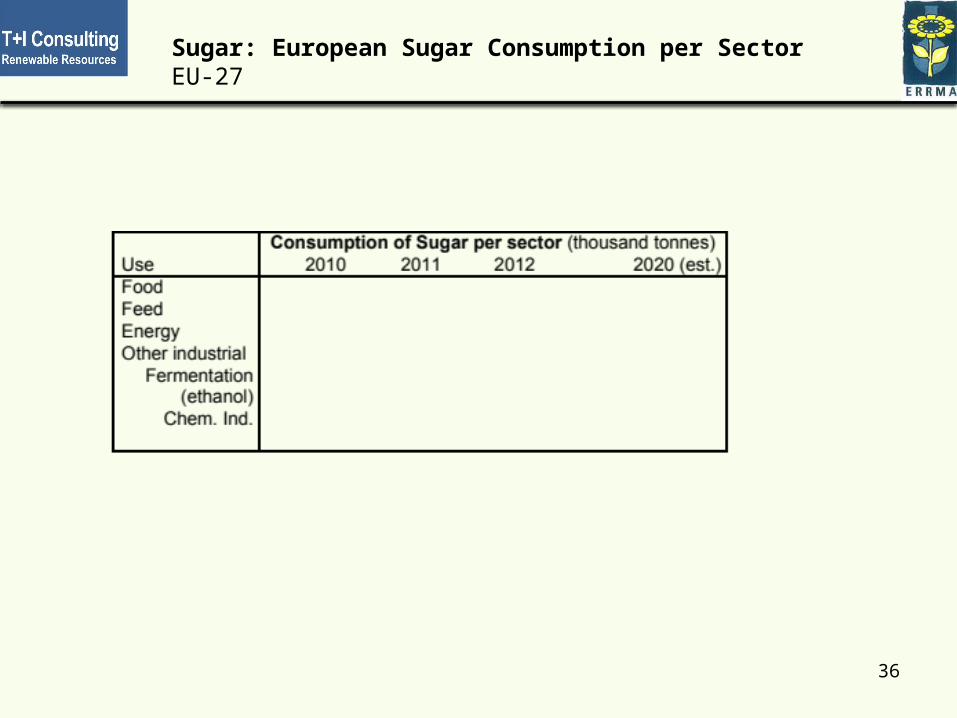
Sugar: European Sugar Consumption per SectorEU-27
STARCH
37
38
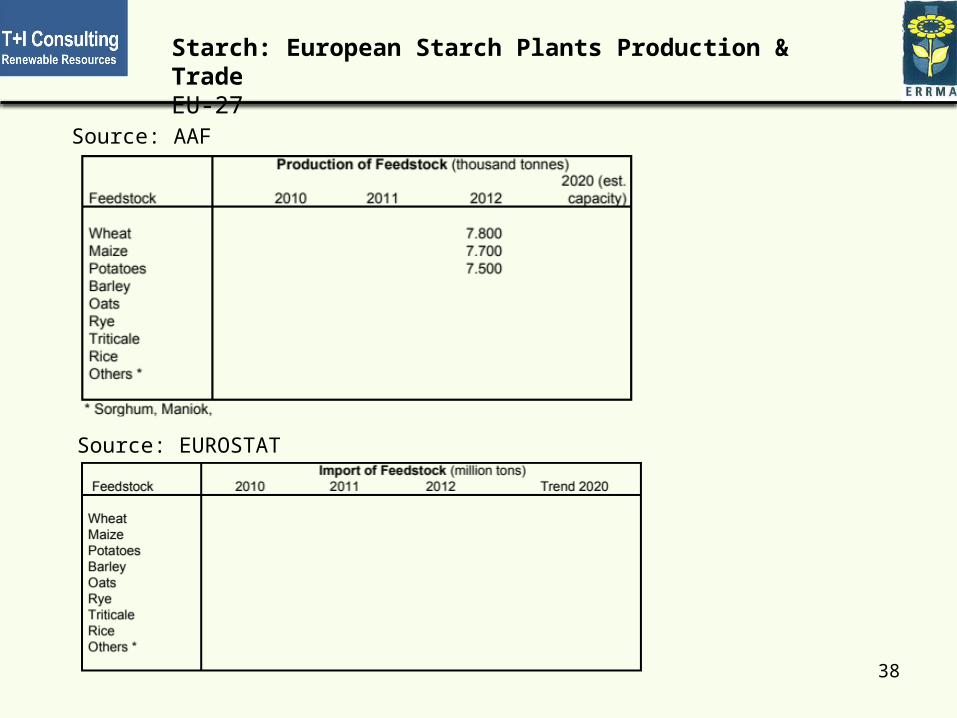
Starch: European Starch Plants Production & TradeEU-27
Source: AAF
Source: EUROSTAT
39
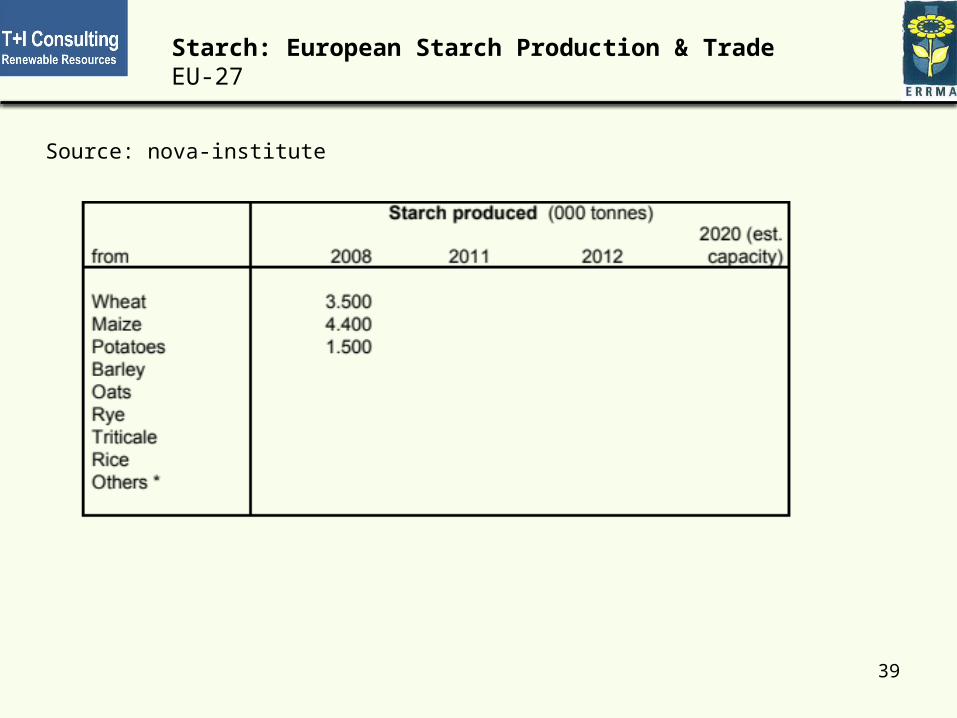
Source: nova-institute
Starch: European Starch Production & TradeEU-27
40
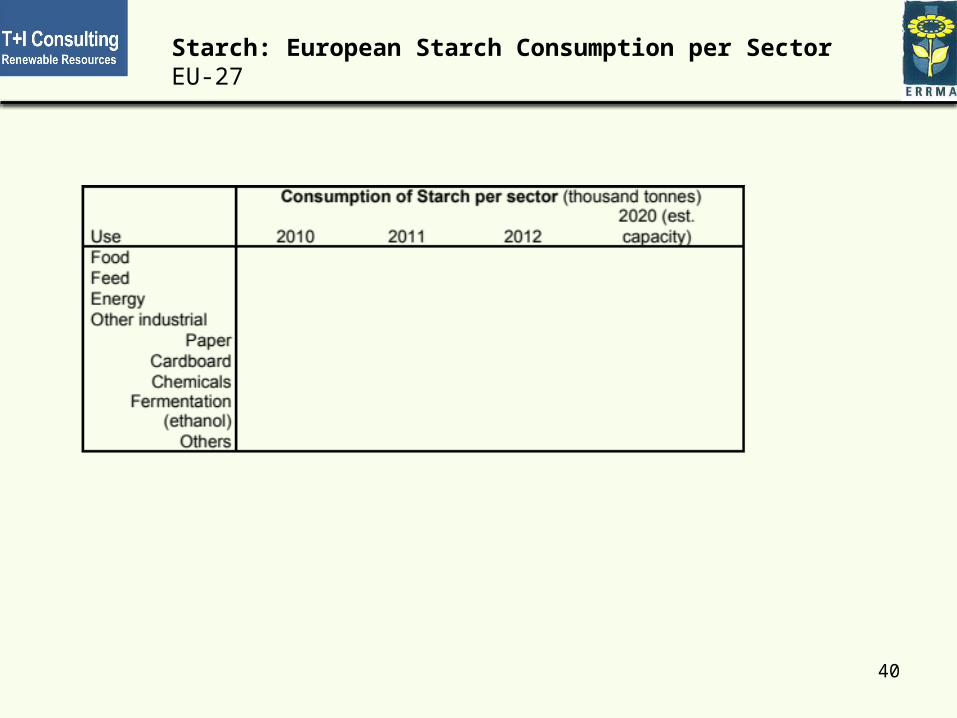
Starch: European Starch Consumption per SectorEU-27
CELLULOSE
41
42
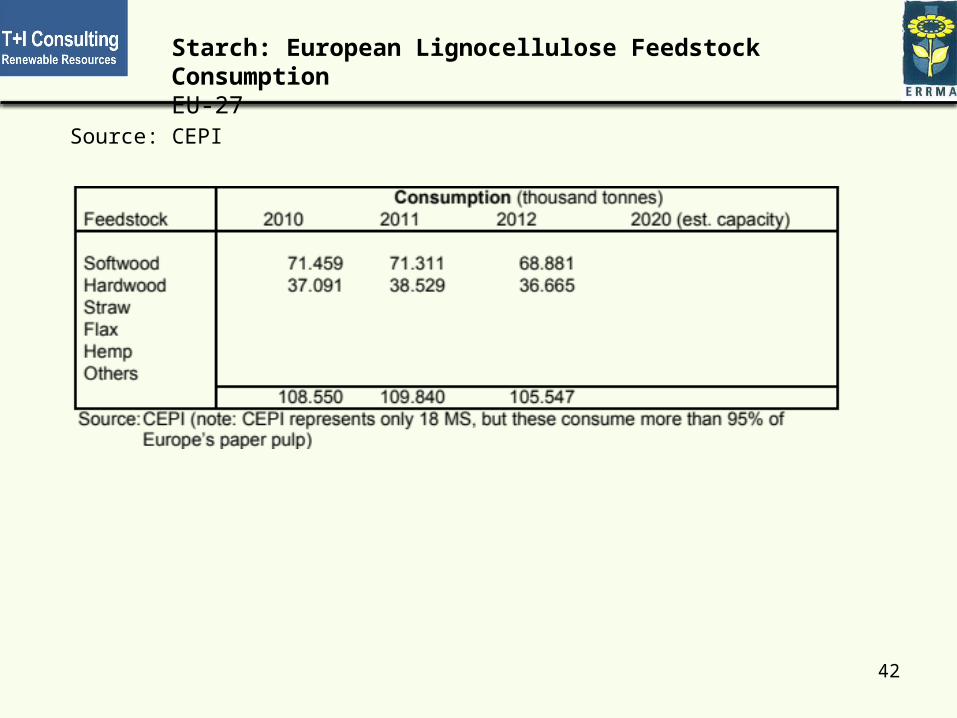
Starch: European Lignocellulose Feedstock ConsumptionEU-27
Source: CEPI
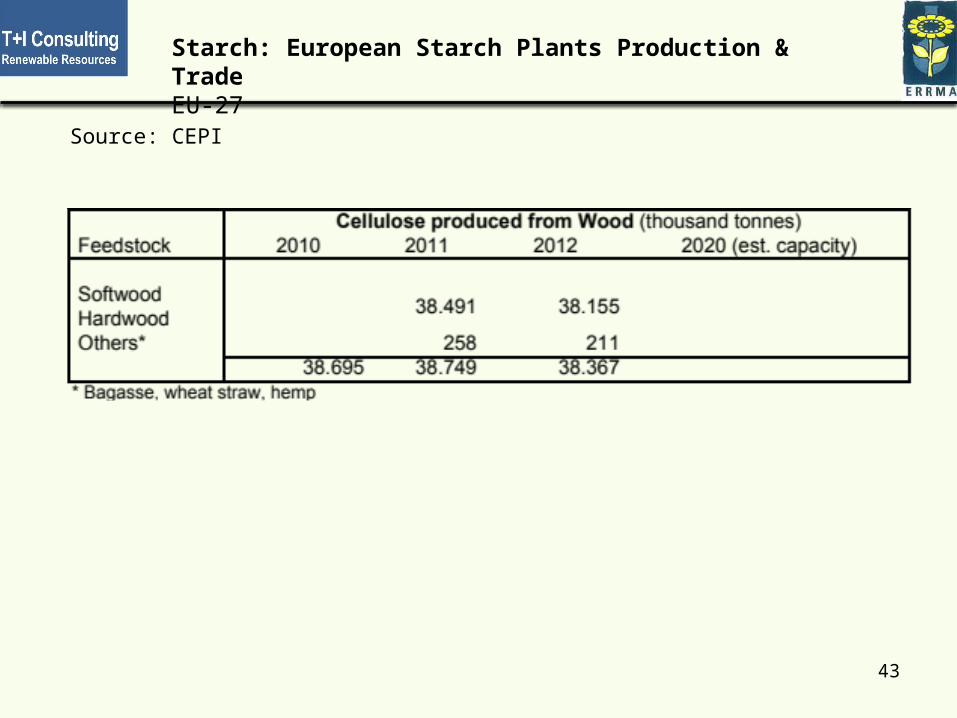
43
Starch: European Starch Plants Production & TradeEU-27
Source: CEPI
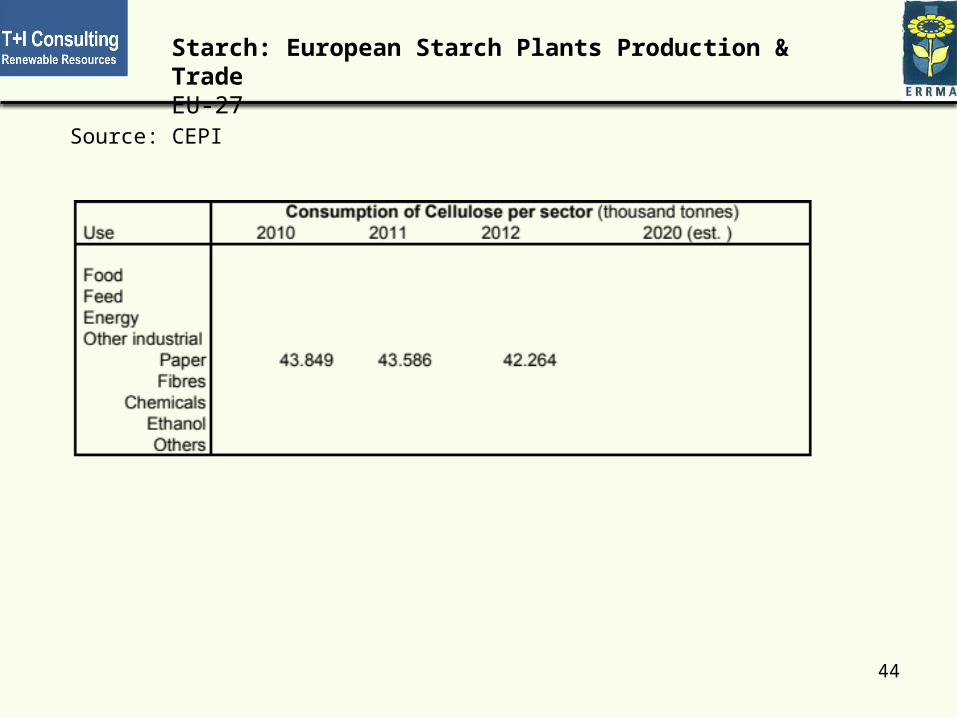
44
Starch: European Starch Plants Production & TradeEU-27
Source: CEPI
PRODUCTS & MARKETS
45
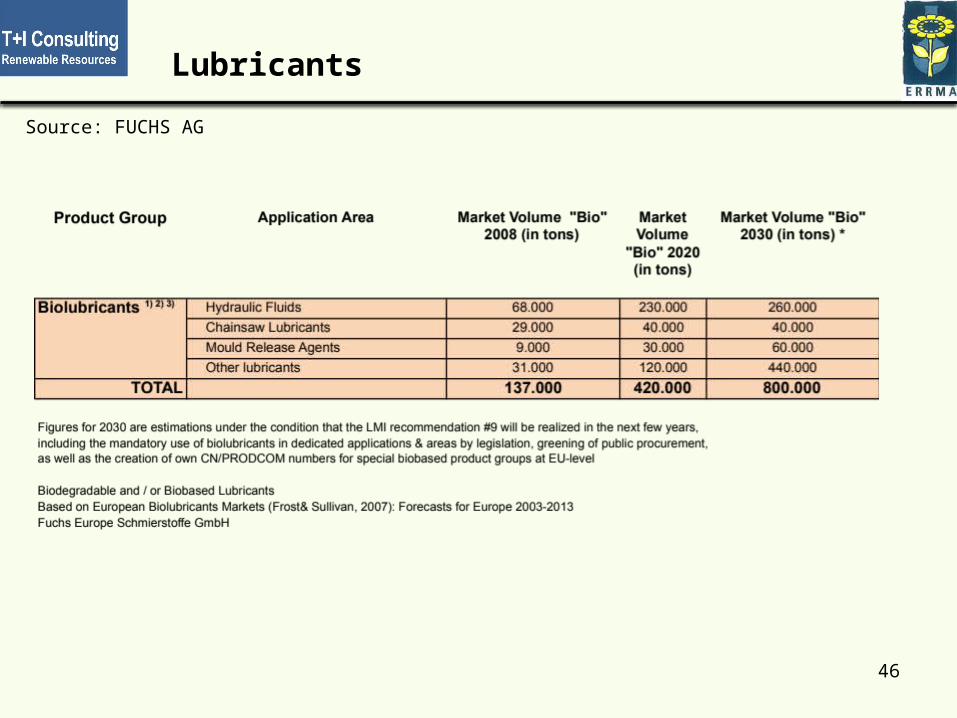
46
Source: FUCHS AG
Lubricants
47
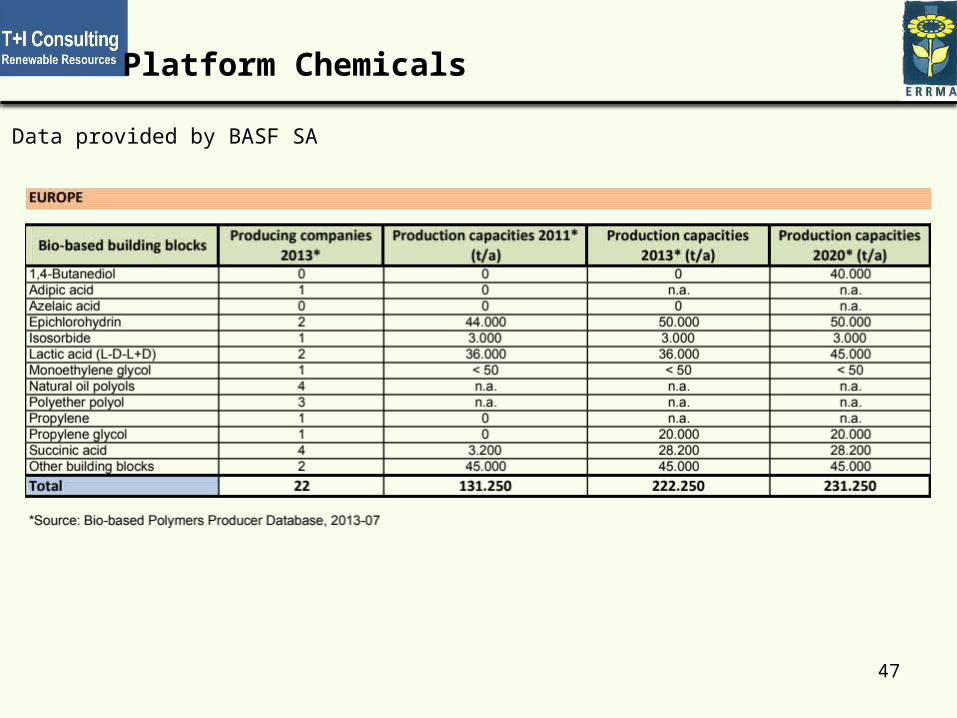
Data provided by BASF SA
Platform Chemicals
48
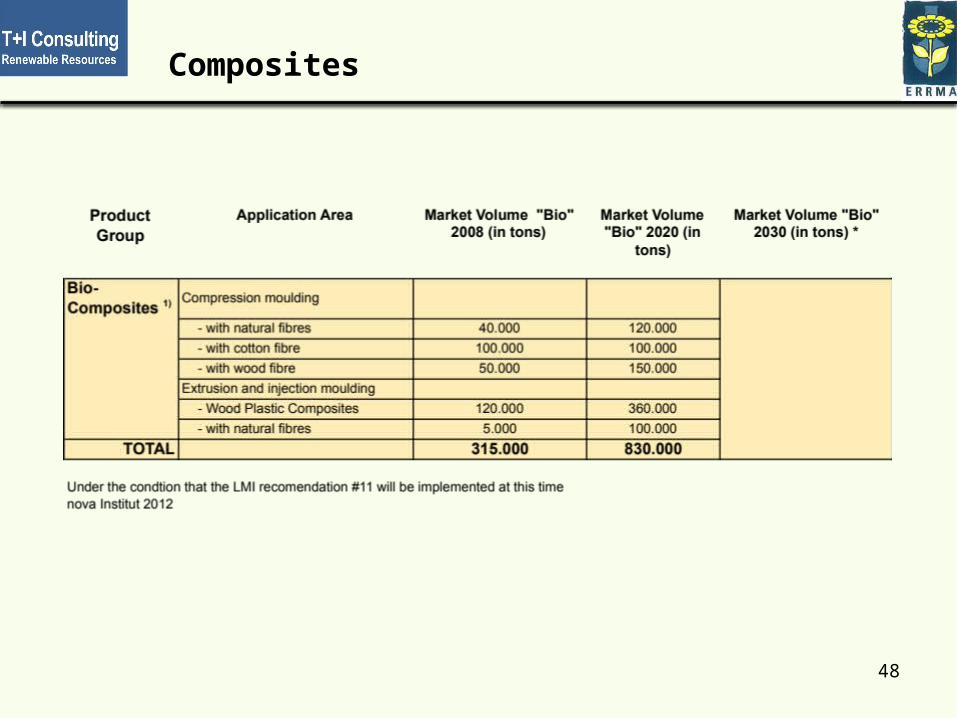
Composites
49
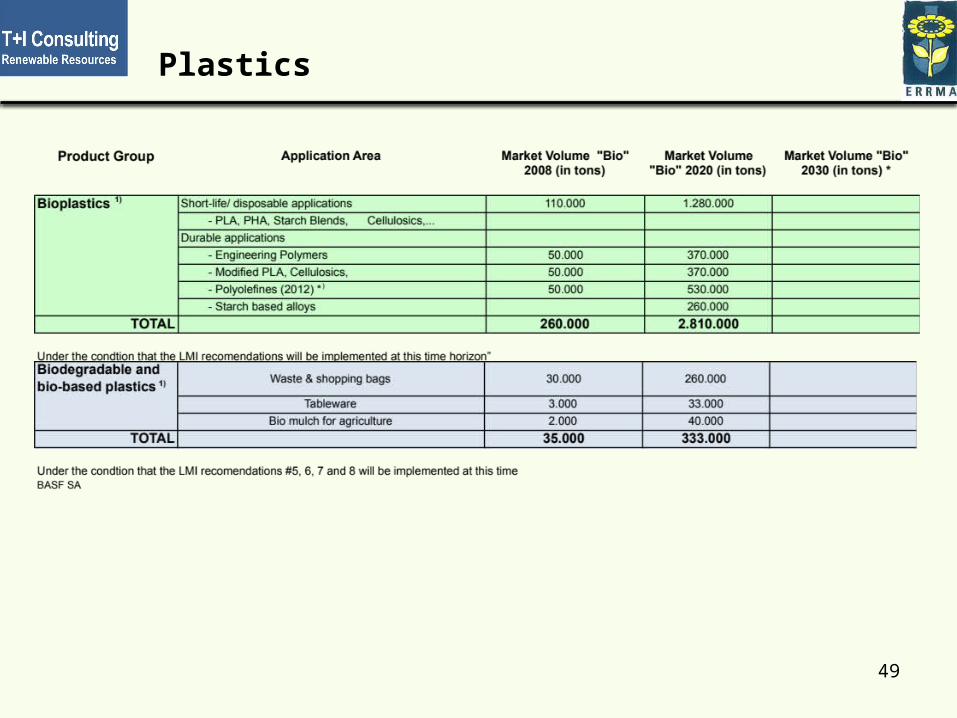
Plastics
50
Solvents
• Consolidated data from ESIG and IAR will be provided by ESIG in December 2013