Embed Size (px)
Citation preview

1979
National Cancer Institute
CARCINOGENESIS Technical Report Series No. 149
BIOASSAY OF N,N'-DIETHYLTHIOUREA
FOR POSSIBLE CARCINOGENICITY
CAS No. 105-55-5
NCI-CG-TR-149
U.S. DEPARTMENT OF HEALTH, EDUCATION, AND WELFARE Public Health Service National Institutes of Health


BIOASSAY OF
N,N'-DIETHYLTHIOUREA
FOR POSSIBLE CARCINOGENICITY
Carcinogenesis Testing Program Division of Cancer Cause and Prevention
National Cancer Institute National Institutes of Health
Bethesda, Maryland 20014
U.S. DEPARTMENT OF HEALTH, EDUCATION, AND WELFARE Public Health Service
National Institutes of Health
DHEW Publication No. (NIH) 79-1705

REPORT ON THE BIOASSAY OF N.N'-DIETHYLTHIOUREA FOR POSSIBLE CARCINOGENICITY
CARCINOGENESIS TESTING PROGRAM DIVISION OF CANCER CAUSE AND PREVENTION
NATIONAL CANCER INSTITUTE, NATIONAL INSTITUTES OF HEALTH
FOREWORD: This report presents the results of the bioassay of N,N'-diethylthiourea conducted for the Carcinogenesis Testing Program, Division of Cancer Cause and Prevention, National Cancer Institute (NCI), National Institutes of Health, Bethesda, Maryland. This is one of a series of experiments designed to determine whether selected chemicals have the capacity to produce cancer in animals. Negative results, in which the test animals do not have a significantly greater incidence of cancer than control animals, do not necessarily mean the test chemical is not a carcinogen because the experiments are conducted under a limited set of circumstances. Positive results demonstrate that the test chemical is carcinogenic for animals under the conditions of the test and indicate a potential risk to man. The actual determination of the risk to man from animal carcinogens requires a wider analysis.
CONTRIBUTORS: This bioassay of N,N'-diethylthiourea was conducted by Litton Bionetics, Inc., Bethesda, Maryland, initially under direct contract to the NCI and currently under a subcontract to Tracor Jitco, prime contractor for the NCI Carcinogenesis Testing Program.
The experimental design was determined by the NCI Project Officers, Dr. N. P. Page (1,2), Dr. E. K. Weisburger (1) and Dr. J. H. Weisburger (1,3). The principal investigators for the contract were Dr. F. M. Garner (4,5) and Dr. B. M. Ulland (4,5). Mr. S. Johnson (4) was the coprincipal investigator for the contract. Animal treatment and observation were supervised by Mr. R. Cypher (4), Mr. D. S. Howard (4) and Mr. H. D. Thornett (4); Mr. H. Paulin (4) analyzed dosed feed mixtures. Ms. J. Blalock (4) was responsible for data collection and assembly. Chemical analysis was performed by Midwest Research Institute (6) and the analytical results were reviewed by Dr. N. Zimmerman (7).
Histopathologic examinations were performed by Dr. N. J. Wosu (4) at Litton Bionetics, Inc., the pathology narratives were written by Dr. N. J. Wosu (4), and the diagnoses included in this report represent the interpretation of this pathologist. Histopathology findings and reports were reviewed by Dr. R. L. Schueler (8).
ill

Compilation of individual animal survival, pathology, and summary tables was performed by EG&G Mason Research Institute (9); the statistical analysis was performed by Mr. W. W. Belew (7,10) and Mr. R. M. Helfand (7), using methods selected for the Carcinogenesis Testing Program by Dr. J. J. Gart (11).
This report was prepared at METREK, a Division of The MITRE Corporation (7) under the direction of the NCI. Those responsible for this report at METREK are the project coordinator, Dr. L. W. Thomas (7), task leader Ms. P. Walker (7), senior biologist Mr. M. Morse (7), biochemist Mr. S. C. Drill (7), and technical editor Ms. P. A. Miller (7). The final report was reviewed by members of the participating organizations.
The following other scientists at the National Cancer Institute were responsible for evaluating the bioassay experiment, interpreting the result's, and reporting the findings: Dr. K. C. Chu (1), Dr. C. Cueto, Jr. (1), Dr. J. F. Douglas (1), Dr. D. G. Goodman (1,12), Dr. R. A. Griesemer (1), Dr. M. H. Levitt (1), Dr. H. A. Milman (1), Dr. T. W. Orme (1), Dr. R. A. Squire (1,13), Dr. S. F. Stinson (1), Dr. J. M. Ward (1), and Dr. C. E. Whitmire (1).
1. Carcinogenesis Testing Program, Division of Cancer Cause and Prevention, National Cancer Institute, National Institutes of Health, Bethesda, Maryland.
2. Now with the U.S. Environmental Protection Agency, 401 M Street S.W., Washington, D.C.
3. Now with the Naylor Dana Institute for Disease Prevention, American Health Foundation, Hammon House Road, Valhalla, New York.
4. Litton Bionetics, Inc., 5516 Nicholson Lane, Kensington, Maryland .
5. Now with Hazleton Laboratories America, Inc., 9200 Leesburg Turnpike, Vienna, Virginia.
6. Midwest Research Institute, 425 Volker Boulevard, Kansas City, Missouri.
7. The MITRE Corporation, METREK Division, 1820 Dolley Madison Boulevard, McLean, Virginia.
8. Tracor Jitco, Inc., 1776 East Jefferson Street, Rockville, Maryland.
iv

9. EG&G Mason Research Institute, 1530 East Jefferson Street, Rockville, Maryland.
10. Now with the Solar Energy Research Institute, Cole Boulevard, Golden, Colorado.
11. Mathematical Statistics and Applied Mathematics Section, Biometry Branch, Field Studies and Statistics Program, Division of Cancer Cause and Prevention, National Cancer Institute, National Institutes of Health, Bethesda, Maryland.
12. Now with Clement Associates, Inc., 1010 Wisconsin Avenue, N.W., Washington, B.C.
13. Now with the Division of Comparative Medicine, Johns Hopkins University, School of Medicine, Traylor Building, Baltimore, Maryland.
v


SUMMARY
A bioassay for the possible carcinogenicity of N,N'-diethylthiourea was conducted using Fischer 344 rats and B6C3F1 mice. N,N'-Diethylthiourea was administered in the feed, at either of two concentrations, to groups of 50 males and 50 females of each species. Twenty animals of each sex and species, except for 19 male mice, were placed on test as controls. The high and low dietary concentrations of N,N'-diethylthiourea were, respectively, 250 and 125 ppm for rats and 500 and 250 ppm for mice. The compound was administered in the diet for 103 weeks, followed by an observation period of 1 week for all dosed groups.
There were no significant positive associations between the dosages of N,N'-diethylthiourea administered and mortality in rats or mice of either sex. Adequate numbers of animals in all groups survived sufficiently long to be at risk from late-developing tumors. Compound-related mean body weight depression was apparent among dosed male and female mice when compared to their respective controls, indicating that the concentrations of N,N'-diethylthiourea administered to mice may have approximated the maximum tolerated dosages.
There were statistically significant elevated incidences of follicular-cell carcinomas of the thyroid in high dose male rats. In addition, there were statistically significant elevated incidences of a combination of thyroid follicular-cell carcinomas and follicularcell adenomas in high dose male and female rats. '
Under the conditions of this bioassay, N,N'-diethylthiourea was carcinogenic to Fischer 344 rats, causing follicular-cell carcinomas of the thyroid in males and follicular-cell neoplasms of the thyroid in females. There was no evidence for the carcinogenicity of the compound in B6C3F1 mice.
vii

TABLE OF CONTENTS
Page
I. INTRODUCTION 1
II. MATERIALS AND METHODS 3
A. Chemicals 3 B. Dietary Preparation 4 C. Animals 5 D. Animal Maintenance 6 E. Selection of Initial Concentrations 7 F. Experimental Design 9 G. Clinical and Histopathologic Examinations 12 H. Data Recording and Statistical Analyses 13
III. CHRONIC TESTING RESULTS: RATS 18
A. Body Weights and Clinical Observations 18 B. Survival 18 C. Pathology 18 D. Statistical Analyses of Results 23
IV. CHRONIC TESTING RESULTS: MICE 32
A. Body Weights and Clinical Observations 32 B. Survival 32 C. Pathology 36 D. Statistical Analyses of Results 36
V. DISCUSSION 41
VI. BIBLIOGRAPHY 43
APPENDIX A SUMMARY OF THE INCIDENCE OF NEOPLASMS IN RATS TREATED WITH N,N'-DIETHYLTHIOUREA A-l
APPENDIX B SUMMARY OF THE INCIDENCE OF NEOPLASMS IN MICE TREATED WITH N,N'-DIETHYLTHIOUREA B-l
APPENDIX C SUMMARY OF THE INCIDENCE OF NONNEOPLASTIC LESIONS IN RATS TREATED WITH N,N'-DIETHYLTHIOUREA C-l
APPENDIX D SUMMARY OF THE INCIDENCE OF NONNEOPLASTIC LESIONS IN MICE TREATED WITH N,N'-DIETHYLTHIOUREA D-l
IX
LIST OF ILLUSTRATIONS
Figure Number Page
1 CHEMICAL STRUCTURE OF N,N'-DIETHYLTHIOUREA 2
2 GROWTH CURVES FOR N.N1-DIETHYLTHIOUREA CHRONIC STUDY RATS 19
SURVIVAL COMPARISONS OF N,N'-DIETHYLTHIOUREA CHRONIC STUDY RATS 20
GROWTH CURVES FOR N,N'-DIETHYLTHIOUREA CHRONIC STUDY MICE 33
SURVIVAL PROBABILITY COMPARISONS OF N,N'DIETHYLTHIOUREA CHRONIC STUDY MICE 34
PERCENT SURVIVAL OF N,N'-DIETHYLTHIOUREA CHRONIC STUDY MICE 35
LIST OF TABLES
Table Number Page
DESIGN SUMMARY FOR FISCHER 344 RATS— N,N'-DIETHYLTHIOUREA FEEDING EXPERIMENT 10
DESIGN SUMMARY FOR B6C3F1 MICE—N,N'-DIETHYLTHIOUREA FEEDING EXPERIMENT H
ANALYSES OF THE INCIDENCE OF PRIMARY TUMORS AT SPECIFIC SITES IN MALE RATS TREATED WITH N,N'-DIETHYLTHIOUREA 24
ANALYSES OF THE INCIDENCE OF PRIMARY TUMORS AT SPECIFIC SITES IN FEMALE RATS TREATED WITH N,N'-DIETHYLTHIOUREA 28
ANALYSES OF THE INCIDENCE OF PRIMARY TUMORS AT SPECIFIC SITES IN MALE MICE TREATED WITH N,N'-DIETHYLTHIOUREA 37
ANALYSES OF THE INCIDENCE OF PRIMARY TUMORS AT SPECIFIC SITES IN FEMALE MICE TREATED WITH N,N'-DIETHYLTHIOUREA 39
LIST OF TABLES (Concluded)
Table Number
Al SUMMARY OF THE INCIDENCE OF NEOPLASMS IN MALE RATS TREATED WITH N.N'-DIETHYLTHIOUREA A-3
A2 SUMMARY OF THE INCIDENCE OF NEOPLASMS IN FEMALE RATS TREATED WITH N,N'-DIETHYLTHIOUREA A-7
Bl SUMMARY OF THE INCIDENCE OF NEOPLASMS IN MALE MICE TREATED WITH N,N'-DIETHYLTHIOUREA B-3
B2 SUMMARY OF THE INCIDENCE OF NEOPLASMS IN FEMALE MICE TREATED WITH N,N'-DIETHYLTHIOUREA B-6
Cl SUMMARY OF THE INCIDENCE OF NONNEOPLASTIC LESIONS IN MALE RATS TREATED WITH N,N'DIETHYLTHIOUREA C-3
C2 SUMMARY OF THE INCIDENCE OF NONNEOPLASTIC LESIONS IN FEMALE RATS TREATED WITH N,N'DIETHYLTHIOUREA C-8
Dl SUMMARY OF THE INCIDENCE OF NONNEOPLASTIC LESIONS IN MALE MICE TREATED WITH N.N1 -DIETHYLTHIOUREA D-3
D2 SUMMARY OF THE INCIDENCE OF NONNEOPLASTIC LESIONS IN FEMALE MICE TREATED WITH N.N1 -DIETHYLTHIOUREA D-6
XI


I. INTRODUCTION
N,N'-Diethylthiourea (Figure 1) (NCI No. C03816), a corrosion
inhibitor and accelerator in elastomer manufacture, was selected for
bioassay by the National Cancer Institute because of the structural
similarity of this compound to ethylene thiourea, a tumorigen in hy
brid mice (C57BL/6 x C3H/Anf and C57BL/6 x AKR) (Innes et al., 1969).
The Chemical Abstracts Service (CAS) Ninth Collective Index
* (1977) name for this compound is N,N'-diethylthiourea. It is also
called 1,3-diethyl-2-thiourea, and 1,3-diethylthiourea.
N,N1-Diethylthiourea is used as a corrosion inhibitor in solu
tions of hydrochloric acid or sulfuric acid for the pickling of
iron or steel, and for reducing the corrosion of ferrous metals and
aluminum alloys in brine (Hawley, 1971; Rose and Rose, 1966).
N,N'-Diethylthiourea is also used as a vulcanization accelerator in
the manufacture of elastomers (Hawley, 1971).
Specific production data for N,N'-diethylthiourea are not
available; however, this compound is produced annually in quantities
greater than 1000 pounds or $1000 in value by two U.S. companies
(Stanford Research Institute, 1977).
The potential for exposure to N,N'-diethylthiourea is greatest
for workers involved in the production of this compound and the for
mulation and use of corrosion inhibitive solutions containing N,N'
diethylthiourea, and those in the elastomer manufacturing industry.
*The CAS registry number is 105-55-5.

CH3CH2—NH—C—NH—CH2CH3
FIGURE 1 CHEMICAL STRUCTURE OF N, N'-DIETHYLTHIOUREA

II. MATERIALS AND METHODS
A. Chemicals
* Practical-grade N,N"-diethylthiourea was purchased from Pfaltz
and Bauer Chemical Company, Stamford, Connecticut. Chemical analysis
was performed by Midwest Research Institute, Kansas City, Missouri.
The experimentally determined range in melting point, 74° to 76°C,
was close to that reported in the literature (77°C [Beilstein's Hand
buch der Organischen Chemie, 1973]). Thin-layer chromatography (TLC)
was performed utilizing two solvent systems (i.e., ethyl acetate and
acetonerchloroform) and visualized by ultraviolet light, dichromate
and heat. The plate developed with ethyl acetate revealed the pres
ence of two spots, one of which was an impurity, remaining at the
origin. Development with the second solvent system resulted in detec
tion of no impurities. Elemental analysis was within the acceptable
limits (5 percent) of experimental variation expected for C^Ei2^2^'
the molecular formula for N,N'-diethylthiourea. Titration of the
thiourea function provided results greater than 99 percent of theo
retical. High pressure liquid chromatography indicated the presence
of two impurities. The results of infrared (IR) and nuclear magnetic
resonance (NMR) analyses were consistent with those reported in the
literature (Sadtler Standard Spectra). Ultraviolet/visible (UV/VIS)
analysis revealed X at 252 nm with a molar extinction coefficient max
* Similar to technical-grade (i.e., may contain minor impurities).

(O of 13.8 x 10 . The reported literature \ was at 250 ran and « max
3 was 15.8 x 10 (Gosaier and Rao, 1967).
A second batch of the compound was purchased nine months later
from the same supplier. The experimentally determined range in melt
ing point for this batch was 76° to 78°C. Elemental analysis was, as
previously, within acceptable limits (5 percent) of experimental varia
tion. TLC, performed as for the first batch, indicated no impurities.
Titration of the thiourea function again provided results greater than
99 percent of theoretical. High speed liquid chromotography showed
the presence of one impurity (0.1 percent of the total) of high
motility. IR and NMR analyses were consistent with those reported in
the literature (Sadtler Standard Spectra). UV/VIS analysis revealed
3 3 \ at 215 and 240 nm withe of 11 x 10 and 14 x 10 , respectively, max
Throughout this report the term N,N'-diethylthiourea is used to
represent these batches of this practical-grade chemical.
B. Dietary Preparation
The basal laboratory diet for both dosed and control animals
consisted of Wayne Lab-Blox^ (Allied Mills, Inc., Chicago, Illinois).
N,N"-Diethylthiourea was administered to the dosed animals as a com
ponent of the diet.
The chemical was removed from its container and a proper amount
was blended with an aliquot of the ground feed using a mortar and
pestle. Once visual homogeneity was attained, the mixture was
placed in a 6 kg capacity Patterson-Kelley standard model twin-shell

stainless steel V-blender along with the remainder of the feed to be
prepared. After 20 minutes of blending, the mixtures were placed in
double plastic bags and stored in the dark at 4°C. The mixture was
prepared once weekly.
Dosed feed preparations containing 250 and 500 ppm of N,N'-die
thylthiourea were analyzed spectrophotometrically. The mean result
immediately after preparation was 73.6 percent of theoretical (ranging
from 62.8 to 83.2 percent) including correction for the analytical
method of recovery used.
C. Animals
Two animal species, rats and mice, were used in the carcinogeni
city bioassay. Fischer 344 rats and B6C3F1 mice were obtained through
contracts of the Division of Cancer Treatment, National Cancer Insti
tute. All rats were supplied by the Frederick Cancer Research Center,
Frederick, Maryland. All mice were supplied by Charles River Breeding
Laboratories, Inc., Wilmington, Massachusetts.
Rats and mice were approximately 4 weeks old when received. Upon
receipt, animals were examined for visible signs of disease or para
sites. Obviously ill or runted animals were culled. The remaining
animals were quarantined for 2 weeks prior to initiation of test.
Animals which did not manifest clinical signs of disease were placed
on test at this time. Animals were assigned to groups and distributed
among cages so that the average body weight per cage was approximately
equal for a given species and sex.

D. Animal Maintenance
All animals were housed by species in temperature- and humidity-
controlled rooms. The temperature range was 22° to 26°C and the
relative humidity was maintained between 45 and 55 percent. Incoming
air was filtered through HEPA filters (Flanders Filters, McLean, Vir
ginia) at a rate of 12 to 15 complete changes of room air per hour.
Fluorescent lighting was provided 8 hours per day (9:00 a.m. to 5:00
p.m.).
All rats were housed four per cage by sex and all mice were
housed five per cage by sex. Throughout the study dosed and control
animals of both species were housed in polycarbonate cages (Lab Pro
ducts, Inc., Garfield, New Jersey) suspended from aluminum racks.
Racks were fitted with a continuous piece of stainless steel mesh over
which a sheet of filter paper was firmly secured. Filter paper was
changed at 2-week intervals, when the racks were sanitized. Clean
® cages and bedding were provided twice weekly. Ab-sorb-dri hardwood
chip bedding (Wilner Wood Products Company, Norway, Maine) was used
in polycarbonate cages for the entire bioassay.
Acidulated water (pH 2.5) was supplied to animals in water
bottles filled by an automated metering device that was checked daily
for diluting accuracy. Water bottles were changed and washed twice
weekly, and sipper tubes were washed at weekly intervals. During the
period of chemical administration, dosed and control animals received
treated or untreated Wayne Lab-Blox meal as appropriate. The feed

was supplied in hanging stainless steel hoppers which were refilled
three times per week and sanitized weekly. Food and water were
available ad libitum for both species.
All dosed and control rats were housed in a room with other rats
receiving diets containing 4-nitro-o-phenylenediamine (99-56-9); and
l-phenyl-3-methyl-5-pyrazolone (89-25-8); and other rats intubated
with 3-(chloromethyl)pyridine hydrochloride (3099-31-8).
All dosed and control mice were housed in a room with mice re
ceiving diets containing EDTA trisodium salt (150-38-9); 3,3'-dime
thoxybenzidine-4,41-diisocyanate (91-93-0); triphenyltin hydroxide
(76-87-9); diaminozide (1596-84-5); carbromal (75-65-6); p-quinone
dioxime (105-11-3); 4-amino-2-nitrophenol (119-34-6); other mice
intubated with lithocholic acid (434-13-9); and other mice receiving
I.P. injections of methiodol sodium (126-31-8).
E. Selection of Initial Concentrations
In order to establish the maximum tolerated concentrations
of N,N'-diethylthiourea for administration to dosed animals in the
chronic studies, subchronic toxicity tests were conducted with both
rats and mice. Rats were distributed among five groups, each con
sisting of five males and five females. N,N'-Diethylthiourea was
incorporated into the basal laboratory diet and supplied ad libitum
to four of the five rat groups in concentrations of 147, 215, 316 and
* CAS registry numbers are given in parentheses.
464 ppm. The remaining rat group served as a control group, receiving
only the basal laboratory diet.
Mice were distributed among six groups, each consisting of five
males and five females. N,N'-Diethylthiourea was incorporated into
the basal laboratory diet and supplied ad libitum to five of the six
mouse groups in concentrations of 680, 1000, 1470, 2160 and 3150 ppm.
The sixth mouse group served as a control group, receiving only the
basal laboratory diet.
The dosed dietary preparations were administered for a period
of 7 weeks, followed by a 1-week observation period during which all
animals were fed the basal laboratory diet. Individual body weights
and food consumption data were recorded twice weekly throughout the
study. Upon termination of the study all survivors were sacrificed
and necropsied.
At the end of the subchronic test, mean body weight gain among
male rats dosed with 316 ppm was 3 percent greater than the mean body
weight gain of their controls, while female rats receiving the same
concentration had a mean body weight gain 11 percent less than that
of their controls. Mean body weight gain among male rats dosed with
215 ppm was 10 percent less than the mean body weight gain of their
controls, while female rats receiving the same concentration had a
mean body weight gain 1 percent less than that of their controls.
One female rat receiving a concentration of 316 ppm died while

another had an arched back and rough coat. The high concentration
selected for administration to dosed rats in the chronic bioassay was
250 ppm.
At the end of the subchronic test, mean body weight gain among
male mice dosed with 680 ppm was 10 percent less than the mean body
weight gain of their controls, while female mice receiving the same
concentration had a mean body weight gain 8 percent less than that
of their controls. The high concentration selected for administra
tion to dosed mice in the chronic bioassay was 500 ppm.
F. Experimental Design
The experimental design parameters for the chronic study (spe
cies, sex, group size, concentrations administered, and duration of
treated and untreated observation periods) are summarized in Tables
1 and 2.
All rats were approximately 6 weeks old at the time the test was
initiated and were placed on test simultaneously. The dietary con
centrations of N,N'-diethylthiourea utilized were 250 and 125 ppm.
Throughout this report those rats receiving the former concentration
are referred to as the high dose groups and those receiving the lat
ter concentration are referred to as the low dose groups. Dosed rats
were supplied with feed containing N,N*-diethylthiourea for 103 weeks
followed by a 1-week observation period.
All mice were approximately 6 weeks old at the time the test
was initiated and were placed on test simultaneously. The dietary
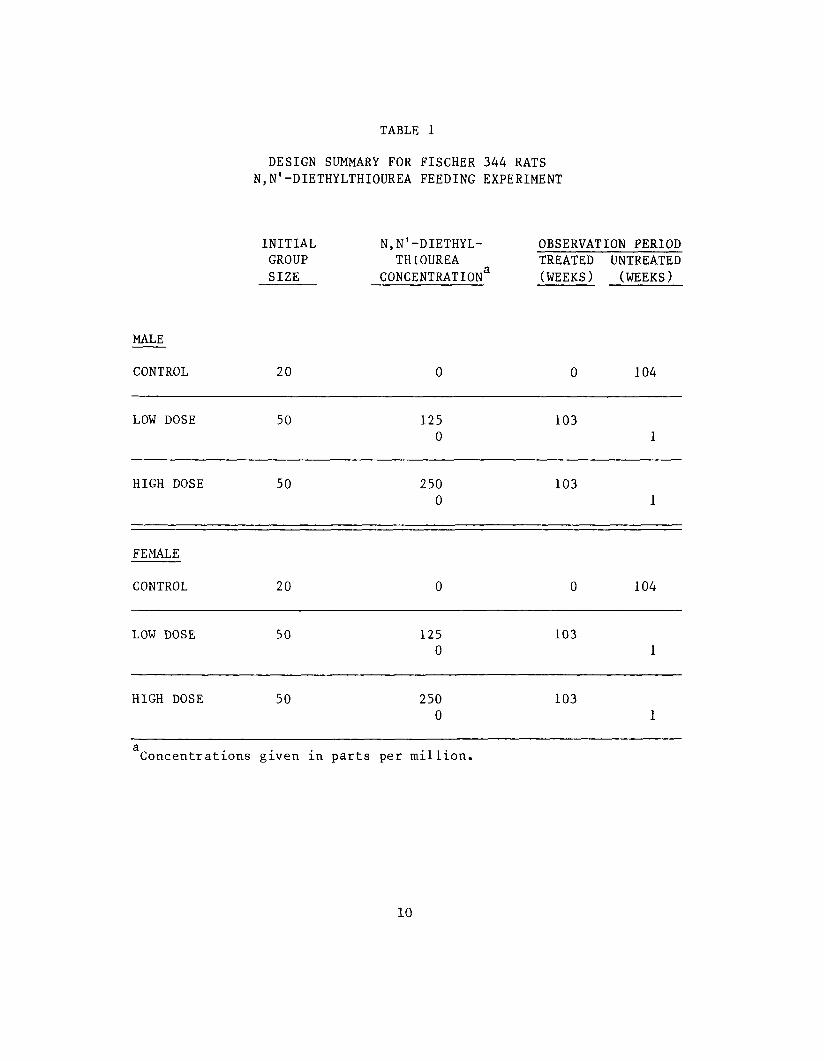
TABLE 1
DESIGN SUMMARY FOR FISCHER 344 RATS N,N'-DIETHYLTHIOUREA FEEDING EXPERIMENT
INITIAL GROUP SIZE
N,N' -DIETHYLTHIOUREA
CONCENTRATION3
OBSERVATION PERIOD TREATED UNTREATED (WEEKS) (WEEKS)
MALE
CONTROL 20 0 0 104
LOW DOSE 50 125 0
103 1
HIGH DOSE 50 250 0
103 1
FEMALE
CONTROL 20 0 0 104
LOW DOSE 50 125 0
103 1
HIGH DOSE 50 250 0
103 1
Concentrations given in parts per million.
10

TABLE 2
DESIGN SUMMARY FOR B6C3F1 MICE N,N'-DIETHYLTHIOUREA FEEDING EXPERIMENT
INITIAL GROUP SIZE
N,N' -DIETHYLTHIOUREA
CONCENTRATION3
OBSERVATION PERIOD TREATED UNTREATED (WEEKS) (WEEKS)
MALE
CONTROL 19 0 0 104
LOW DOSE 50 250 0
103 1
HIGH DOSE 50 500 0
103 1
FEMALE
CONTROL 20 0 0 104
LOW DOSE 50 250 0
103 1
HIGH DOSE 50 500 0
103 1
Concentrations given in parts per million.
11

concentrations of N,N'-diethylthiourea utilized were 500 and 250 ppm.
Throughout this report those mice receiving the former concentration
are referred to as the high dose groups and those receiving the
latter concentration are referred to as the low dose groups. Dosed
mice were supplied with feed containing N,N'-diethylthiourea for 103
weeks followed by a 1-week observation period.
G. Clinical and Histopathologic Examinations
Animals were weighed immediately prior to initiation of the ex
periment. From the first day, all animals were inspected twice daily
for mortality. Food consumption data were collected at monthly in
tervals from 20 percent of the animals in each group. Body weights
of rats were recorded once monthly throughout the bioassay. Body
weights of mice were recorded once a week for the first 5 weeks and
at monthly intervals thereafter.
All moribund animals or animals that developed large, palpable
masses that jeopardized their health were sacrificed. A necropsy
was performed on each animal regardless of whether it died, was sac
rificed when moribund, or was sacrificed at the end of the bioassay.
The animals were euthanized by carbon dioxide asphyxiation, and were
immediately necropsied. The histopathologic examination consisted of
gross and microscopic examination of all major tissues, organs, and
gross lesions taken from sacrificed animals and, whenever possible,
from animals found dead.
12
Tissues were preserved in a 10 percent neutral buffered formalin
solution, embedded in paraffin, sectioned, and stained with hematox
ylin and eosin prior to microscopic examination.
Slides were prepared from the following tissues: skin, subcuta
neous tissue, lungs and bronchi, trachea, bone marrow, spleen, lymph
nodes, thymus, heart, salivary gland, liver, gallbladder (mice), pan
creas, e&ophagus, stomach, small intestine, large intestine, kidney,
urinary bladder, pituitary, adrenal, thyroid, parathyroid, testis,
prostate, brain, tunica vaginalis, uterus, mammary gland, and ovary.
A few tissues were not examined for some animals, particularly
for those that died early. Also, some animals were missing, canni
balized, or judged to be in such an advanced state of autolysis as to
preclude histopathologic interpretation. Thus, the number of animals
for which particular organs, tissues, or lesions were examined micro
scopically varies and does not necessarily represent the number of
animals that were recorded in each group at the time that the test
was initiated.
H. Data Recording and Statistical Analyses
Pertinent data on this experiment have been recorded in an auto
matic data processing system, the Carcinogenesis Bioassay Data System
(Linhart et al., 1974). The data elements include descriptive infor
mation on the chemicals, animals, experimental design, clinical ob
servations, survival, body weight, and individual pathologic results,
as recommended by the International Union Against Cancer (Berenblum,
13
1969). Data tables were generated for verification of data transcrip
tion and for statistical review.
These data were analyzed using the statistical techniques de
scribed in this section. Those analyses of the experimental results
that bear on the possibility of carcinogenicity are discussed in the
statistical narrative sections.
Probabilities of survival were estimated by the product-limit
procedure of Kaplan and Meier (1958) and are presented in this report
in the form of graphs. Animals were statistically censored as of the
time that they died of other than natural causes or were found to be
missing; animals dying from natural causes were not statistically
censored. Statistical analyses for a possible dose-related effect
on survival used the method of Cox (1972) when testing two groups for
equality and used Tarone's (1975) extensions of Cox's methods when
testing a dose-related trend. One-tailed P-values have been reported
for all tests except the departure from linearity test, which is only
reported when its two-tailed P-value is less than 0.05.
The incidence of neoplastic or nonneoplastic lesions has been
given as the ratio of the number of animals bearing such lesions at a
specific anatomic site (numerator) to the number of animals in which
that site was examined (denominator). In most instances, the denomi
nators included only those animals for which that site was examined
histologically. However, when macroscopic examination was required
to detect lesions prior to histologic sampling (e.g., skin or mammary
14

tumors), or when lesions could have appeared at multiple sites (e.g.,
lymphomas), the denominators consist of the numbers of animals necrop
sied .
The purpose of the statistical analyses of tumor incidence is to
determine whether animals receiving the test chemical developed a sig
nificantly higher proportion of tumors than did the control animals.
As a part of these analyses, the one-tailed Fisher exact test (Cox,
1970, pp. 48-52) was used to compare the tumor incidence of a control
group to that of a group of treated animals at each dose level. When
results for a number of treated groups, k, are compared simultaneously
with those for a control group, a correction to ensure an overall
significance level of 0.05 may be made. The Bonferroni inequality
(Miller, 1966, pp. 6-10) requires that the P-value for any comparison
be less than or equal to 0.05/k. In cases where this correction was
used, it is discussed in the narrative section. It is not, however,
presented in the tables, where the Fisher exact P-values are shown.
The Cochran-Armitage test for linear trend in proportions, with
continuity correction (Armitage, 1971, pp. 362-365), was also used
when appropriate. Under the assumption of a linear trend, this test
determined if the slope of the dose-response curve is different from
zero at the one-tailed 0.05 level of significance. Unless otherwise
noted, the direction of the significant trend was a positive dose re
lationship. This method also provides a two-tailed test of departure
from linear trend.
15

A time-adjusted analysis was applied when numerous early deaths
resulted from causes that were not associated with the formation of
tumors. In this analysis, deaths that occurred before the first
tumor was observed were excluded by basing the statistical tests on
animals that survived at least 52 weeks, unless a tumor was found at
the anatomic site of interest before week 52. When such an early
tumor was found, comparisons were based exclusively on animals that
survived at least as long as the animal in which the first tumor was
found. Once this reduced set of data was obtained, the standard pro
cedures for analyses of the incidence of tumors (Fisher exact tests,
Cochran-Armitage tests, etc.) were followed.
When appropriate, life-table methods were used to analyze the
incidence of tumors. Curves of the proportions surviving without an
observed tumor were computed as in Saffiotti et al. (1972). The week
during which animals died naturally or were sacrificed was entered
as the time point of tumor observation. Cox1s methods of comparing
these curves were used for two groups; Tarone1s extension to testing
for linear trend was used for three groups. The statistical tests
for the incidence of tumors which used life-table methods were one-
tailed and, unless otherwise noted, in the direction of a positive
dose relationship. Significant departures from linearity (P < 0.05,
two-tailed test) were also noted.
The approximate 95 percent confidence interval for the relative
risk of each dosed group compared to its control was calculated from
16

the exact interval on the odds ratio (Gart, 1971). The relative risk
is defined as p /p where p is the true binomial probability of the
incidence of a specific type of tumor in a treated group of animals
and p is the true probability of the spontaneous incidence of the
same type of tumor in a control group. The hypothesis of equality
between the true proportion of a specific tumor in a treated group
and the proportion in a control group corresponds to a relative risk
of unity. Values in excess of unity represent the condition of a
larger proportion in the treated group than in the control.
The lower and upper limits of the confidence interval of the
relative risk have been included in the tables of statistical analy
ses. The interpretation of the limits is that in approximately 95
percent of a large number of identical experiments, the true ratio
of the risk in a treated group of animals to that in a control group
would be within the interval calculated from the experiment. When
the lower limit of the confidence interval is greater than one, it
can be inferred that a statistically significant result (a P < 0.025
one-tailed test when the control incidence is not zero, P < 0.050
when the control incidence is zero) has occurred. When the lower
limit is less than unity but the upper limit is greater than unity,
the lower limit indicates the absence of a significant result while
the upper limit indicates that there is a theoretical possibility
of the induction of tumors by the test chemical which could not be
detected under the conditions of this test.
17

III. CHRONIC TESTING RESULTS: RATS
A. Body Weights and Clinical Observations
No evidence of mean body weight depression was associated with
compound administration in either male or female rats (Figure 2).
No abnormal clinical signs were recorded. if
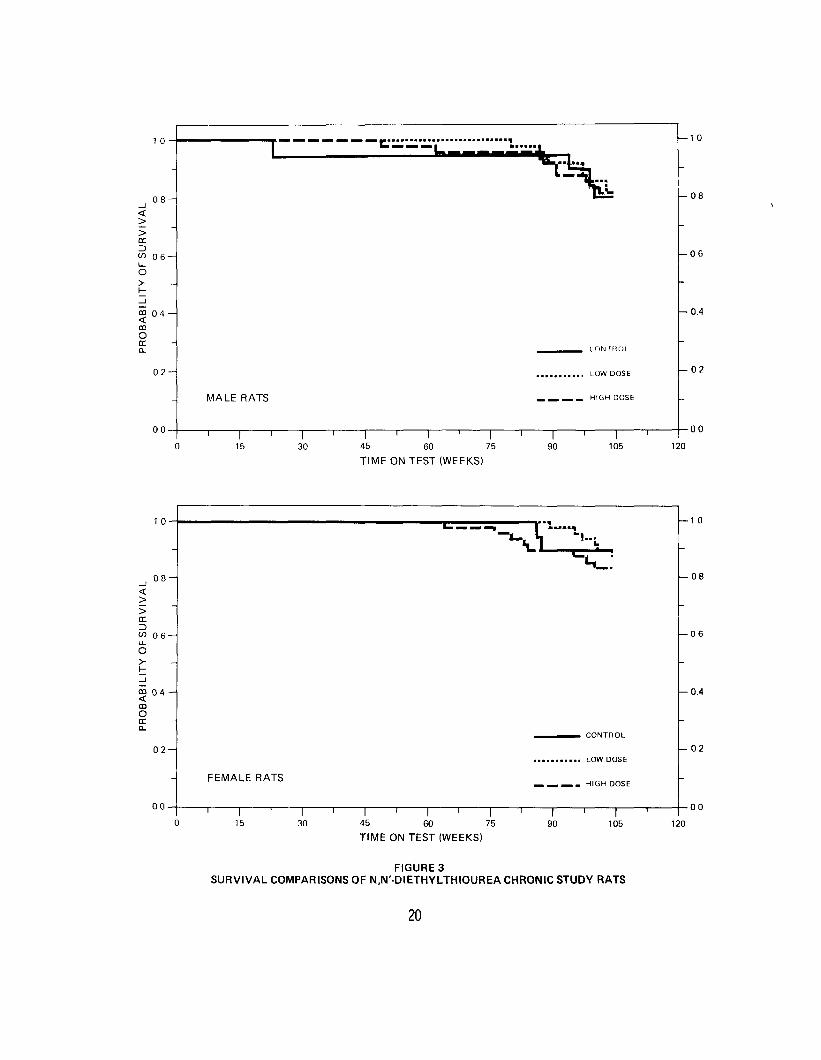
B. Survival
The estimated probabilities of survival for male and female rats
in the control and N,N'-diethylthiourea-dosed groups are shown in
Figure 3. The Tarone test for association between increased dosage
and mortality was not significant for either males or females.
There were adequate numbers of male rats at risk from late-
developing tumors as 82 percent (41/50) of the high dose, 82 percent
(41/50) of the low dose, and 80 percent (16/20) of the controls sur
vived on test until the termination of the study.
For females 84 percent (42/50) of the high dose, 88 percent
(44/50) of the low dose, and 90 percent (18/20) of the controls
survived on test until the termination of the study. Thus, there
were adequate numbers of female rats at risk from late-developing
tumors.
C. Pathology
Histopathologic findings on neoplasms in rats are summarized in
Appendix A (Tables Al and A2); findings on nonneoplastic lesions are
summarized in Appendix C (Tables Cl and C2).
18

ME
AN
BO
DY
WE
IGH
T (
GR
AM
S)
ME
AN
BO
DY
WE
IGH
T (
GR
AM
S)
O
Ol
CS
O
O
(
I I
I I
I I
H
8
m
O
m
en 5
m
m
7;
c D c 21 ~n
CO
c
533
<
5-
^
<m ^
•£
33
oH
co
0
3
CO
>
o
33
CO
O
CO
O
z
i"
Z
m
6 3
1
§
m
C5
_j
X
33
CO
01
•< m
H
O
r- c
o -^
1
%
0
%
C.
r 33 5
—
a
-o
X
33
O
0
g_
\ io
PR
OB
AB
ILIT
Y O
F S
UR
VIV
AL
PR
OB
AB
ILIT
Y O
F S
UR
VIV
AL
O
*-
* O
O
fo
-t^
O}
CO
C
1
1
1 1
1 1
D
>
H
co
O
s-
r I j • I
r f
i-5
33
i ! I
f?
H
o —
CO
<"
m
§ 8
S
' J
S
""
1 1
1 1
1 I
1 1
10
I
c 3
O
O
O
o
o
c 3
ro
Ibi
oi
oo
D

A relatively high incidence of thyroid tumors was observed and
appeared to be related to the dietary administration of N,N'-diethyl
thiourea. The summary of thyroid tumor incidence is as follow:
Contro
MalesLow High
l Dose Dose
Females Low Control Dose
High Dose
Thyroid Number of Animals with Tissues Examined Histopathologically (18) (45) (48) (18) (46) (46)
C-Cell Adenoma 0 0 2 O i l
C-Cell Carcinoma 1 0 1 0 0 1
Follicular-Cell Adenoma(All Types)
0 0 6 0 4 9
Follicular-Cell Carcinoma(All types)
0 1 1 1 0 1 8
Nearly all of these neoplasms were recognized and described dur
ing gross examination. Microscopically they were of follicular-cell
as well as C-cell origin and included benign-appearing as well as
malignant types. C-cell adenomas were discrete, well-delineated and
generally consisted of a solid arrangement of monomorphous well-
differentiated cells. The malignant C-cell neoplasms were more pleo
morphic and showed a less organized cellular arrangement, but remained
well-differentiated and had moderate to low mitotic activity. Although
generally less well-delineated than the adenomas, there was no extra
glandular invasion or metastasis. The follicular adenomas were gener
ally nodular, well-differentiated and in many cases cystic. They were
21

mostly papillary in arrangement. The malignant follicular-cell neo
plasms were generally large and showed variable histologic appearance
even within the same neoplasm. Follicular, solid and papillary
patterns, as well as combinations of these were recognized. Most of
these were markedly cystic as well. The degree of differentiation
was variable. Many of these destroyed adjacent parenchyma by inva
sion as well as by comparison. Three of these tumors invaded local
tissue, the most frequent sites being the trachea and lungs. None
was observed to metastasize to distant sites. Occasionally the same
animal had more than one type of thyroid tumor (e.g., C-cell and
follicular-cell types within the same lobe or benign and malignant
tumors within contralateral lobes). Such neoplasms were listed
individually. Thus, the number of neoplasms may be found to exceed
the number of animals bearing them.
There were a few neoplasms found in other organs. These were
similar in type, incidence, and distribution in dosed and control
groups and were, therefore, not considered to be associated with
compound administration.
Thyroid hyperplasia (cystic and follicular-cell) was commonly
recognized and appeared to be related to dietary administration and
dosage of the compound. Other nonneoplastic lesions were of the
frequency and severity expected in aged Fischer 344 rats.
It was concluded from this pathologic examination that
under the conditions of this bioassay N,N'-diethylthiourea was
22
carcinogenic in Fischer 344 rats, inducing thyroid neoplasms and
hyperplasia.
D. Statistical Analyses of Results
The results of the statistical analyses of tumor incidence in
rats are summarized in Tables 3 and 4. The analysis is included for
every type of malignant tumor in either sex where at least two such
tumors were observed in at least one of the control or N,N'-diethyl
thiourea-dosed groups and where such tumors were observed in at least
5 percent of the group.
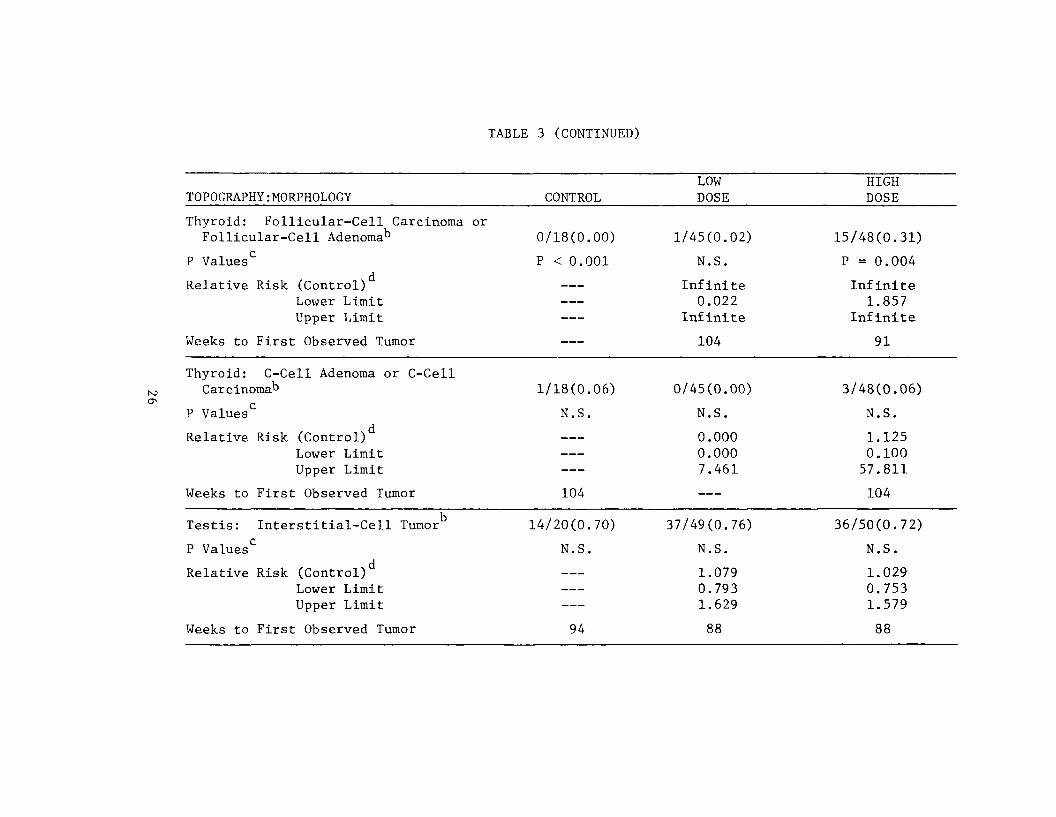
For male rats, the incidence of follicular-cell carcinomas of
the thyroid was significant (P = 0.001) using the Cochran-Armitage
test when comparing the dosed groups to the control. The Cochran-
Armitage test was supported by a significant (P = 0.021) Fisher exact
test comparing the high dose group to the control. Furthermore, the
combined incidences of follicular-cell carcinomas or follicular-cell
adenomas of the thyroid in male rats resulted in a significant (P <
0.001) Cochran-Armitage test and a significant (P = 0.004) high dose
Fisher exact test.
For female rats, the Cochran-Armitage test indicated a signifi
cant (P < 0.001) positive association between dose and the combined
incidence of follicular-cell carcinomas or follicular-cell adenomas
of the thyroid. This result was supported by a significant (P =
0.001) high dose Fisher exact test comparison.
23

TABLE 3
ANALYSES OF THE INCIDENCE OF PRIMARY TUMORS AT SPECIFIC SITES IN MALE RATS TREATED WITH N.N'-DIETHYLTHIOUREA*
TOPOGRAPHY: MORPHOLOGY
Subcutaneous Tissue: Fibrosarcoma
P Values0
Relative Risk (Control) Lower Limit Upper Limit
Weeks to First Observed Tumor
Skin and Subcutaneous Tissue: Fibrosarcoma or Neurof ibrosarcoma"
P Values0
Relative Risk (Control) Lower Limit Upper Limit
Weeks to First Observed Tumor
Hematopoietic System: Leukemia or Malignant Lymphoma^1
P Values0
Relative Risk (Control) Lower Limit Upper Limit
Weeks to First Observed Tumor
LOW CONTROL DOSE
0/20(0.00) 3/50(0.06)
N.S. N.S.
Infinite 0.250
Infinite
87
0/20(0.00) 3/50(0.06)
N.S. N.S.
Infinite 0.250
Infinite
87
2/20(0.10) 8/50(0.16)
N.S. N.S.
1.600 0.364 14.699
99 89
HIGH DOSE
1/50(0.02)
N.S.
Infinite 0.022
Infinite
104
2/50(0.04)
N.S.
Infinite 0.123
Infinite
104
2/50(0.04)
N.S.
0.400 0.032 5.277
88

TOPOGRAPHY: MORPHOLOGY
Pituitary: Chromophobe Adenoma or Chromophobe Carcinoma"3
P Values0
Relative Risk (Control) Lower Limit Upper Limit
Weeks to First Observed Tumor
Adrenal: Pheochromocytoma
P Values0
Relative Risk (Control) Lower Limit Upper Limit
Weeks to First Observed Tumor
Thyroid: Follicular-Cell Carcinoma
P Values
Relative Risk (Control) Lower Limit Upper Limit
Weeks to First Observed Tumor
TABLE 3 (CONTINUED)
CONTROL
0/17(0.00)
N.S.
1/18(0.06)
N.S.
104
0/18(0.00)
P = 0.001
LOW DOSE
6/46(0.13)
N.S.
Infinite 0.624
Infinite
87
4/50(0.08)
N.S.
1.440 0.159 69.469
104
1/45(0.02)
N.S.
Infinite 0.022
Infinite
104
HIGH DOSE
6/48(0.13)
N.S.
Infinite 0.598
Infinite
101
3/50(0.06)
N.S.
1.080 0.096 55.565
104
11/48(0.23)
P = 0.021
Infinite 1.309
Infinite
91
TOPOGRAPHY: MORPHOLOGY
Thyroid: Follicular-Cell Carcinoma or Follicular-Cell Adenoma^3
P Values0
Relative Risk (Control) Lower Limit Upper Limit
Weeks to First Observed Tumor
Thyroid: C-Cell Adenoma or C-Cell Carcinoma^
P Values0
Relative Risk (Control) Lower Limit Upper Limit
Weeks to First Observed Tumor
Testis: Interstitial-Cell Tumor
P Values0
Relative Risk (Control) Lower Limit Upper Limit
Weeks to First Observed Tumor
TABLE 3 (CONTINUED)
CONTROL
0/18(0.00)
P < 0.001
1/18(0.06)
N.S.
104
14/20(0.70)
N.S.
94
LOW DOSE
1/45(0.02)
N.S.
Infinite 0.022
Infinite
104
0/45(0.00)
N.S.
0.000 0.000 7.461
37/49(0.76)
N.S.
1.079 0.793 1.629
88
HIGH DOSE
15/48(0.31)
P = 0.004
Infinite 1.857
Infinite
91
3/48(0.06)
N.S.
1.125 0.100 57.811
104
36/50(0.72)
N.S.
1.029 0.753 1.579
88
TABLE 3 (CONCLUDED)
o
Treated groups received doses of 125 or 250 ppm in feed.
Number of tumor-bearing animals/number of animals examined at site (proportion).
The probability level for the Cochran-Armitage test is given beneath the incidence of tumors in the control group when P < 0.05; otherwise, not significant (N.S.) is indicated. The probability level for the Fisher exact test for the comparison of a treated group with the control group is given beneath the incidence of tumors in the treated group when P < 0.05; otherwise, not significant (N.S.) is indicated. For both Cochran-Armitage and Fisher exact tests a negative designation (N) indicates a lower incidence in the treated group(s) than in the control group.
The 95% confidence interval on the relative risk of the treated group to the control group.
NJ
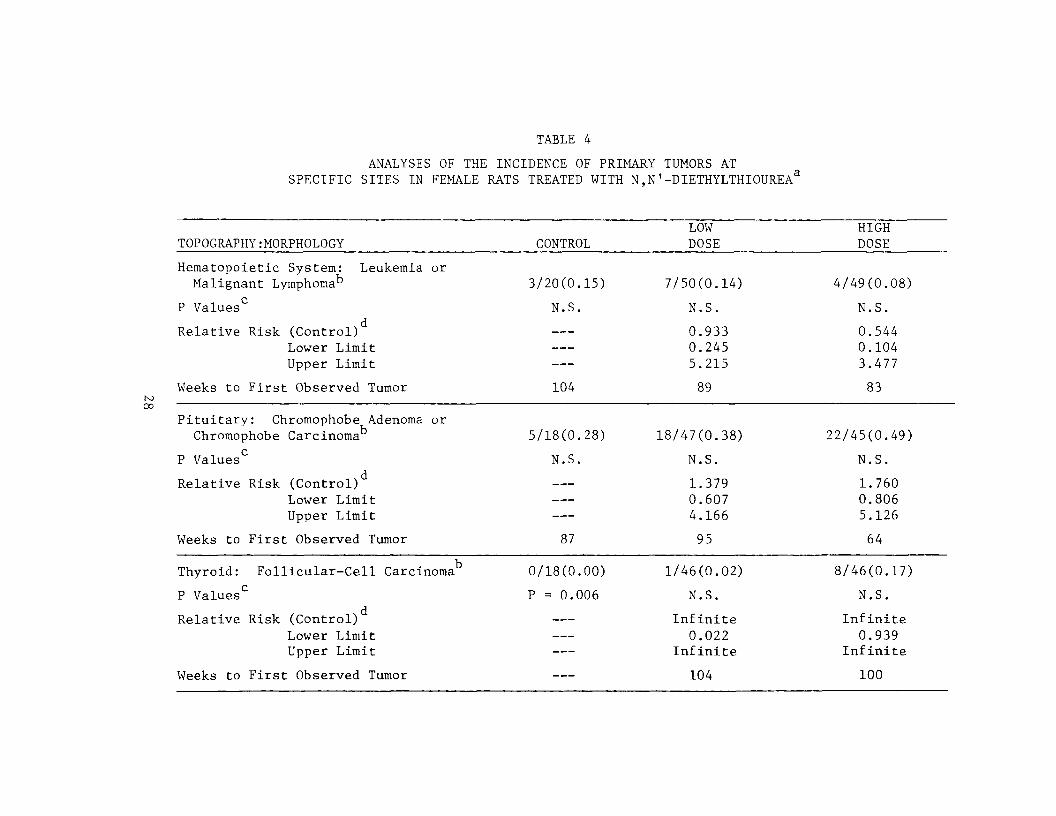
TABLE 4
ANALYSES OF THE INCIDENCE OF PRIMARY TUMORS AT SPECIFIC SITES IN FEMALE RATS TREATED WITH N,N'-DIETHYLTHIOUREA^
TOPOGRAPHY : MORPHOLOGY
Hematopoietic System: Leukemia or Malignant Lymphoma
•t 0
P Values0
Relative Risk (Control) Lower Limit Upper Limit
Weeks to First Observed Tumor oo
Pituitary: Chromophobe Adenoma or Chromophobe Carcinoma
P Values0
Relative Risk (Control) Lower Limit Upper Limit
Weeks to First Observed Tumor
Thyroid: Follicular-Cell Carcinoma
P Values0
Relative Risk (Control) Lower Limit Upper Limit
Weeks to First Observed Tumor
CONTROL
3/20(0.15)
N.S.
104
5/18(0.28)
N.S.
87
0/18(0.00)
P = 0.006
LOW DOSE
7/50(0.14)
N.S.
0.933 0.245 5.215
89
18/47(0.38)
N.S.
1.379 0.607 4.166
95
1/46(0.02)
N.S.
Infinite 0.022
Infinite
104
HIGH DOSE
4/49(0.08)
N.S.
0.544 0.104 3.477
83
22/45(0.49)
N.S.
1.760 0.806 5.126
64
8/46(0.17)
N.S.
Infinite 0.939
Infinite
100
TOPOGRAPHY : MORPHOLOGY
Thyroid: Follicular-Cell Carcinoma or Follicular-Cell Adenoma^
P Values0
Relative Risk (Control) Lower Limit Upper Limit
Weeks to First Observed Tumor
Mammary Gland: Fibroadenoma
P Values0
Relative Risk (Control) Lower Limit Upper Limit
Weeks to First Observed Tumor
Uterus: Endometrial Stromal Polyp
P Values0
Relative Risk (Control) Lower Limit Upper Limit
Weeks to First Observed Tumor
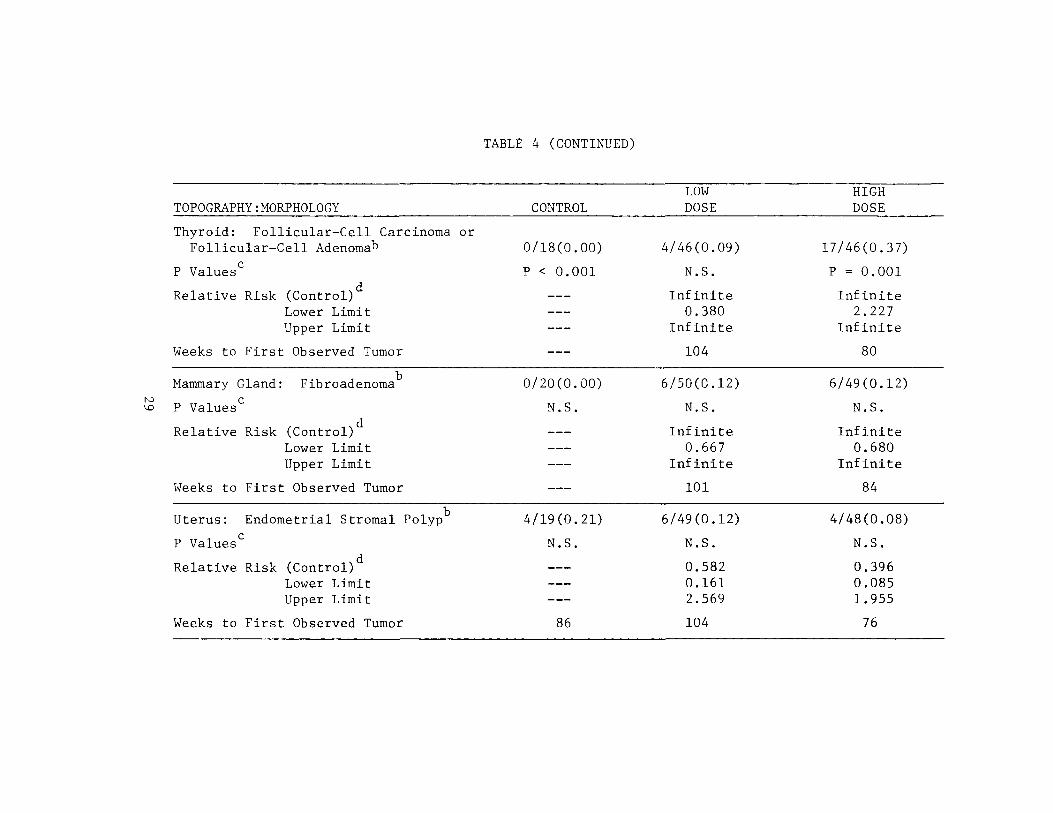
TABLE 4 (CONTINUED)
CONTROL
0/18(0.00)
P < 0.001
0/20(0.00)
N.S.
4/19(0.21)
N.S.
86
LOW DOSE
4/46(0.09)
N.S.
Infinite 0.380
Infinite
104
6/50(0.12)
N.S.
Infinite 0.667
Infinite
101
6/49(0.12)
N.S.
0.582 0.161 2.569
104
HIGH DOSE
17/46(0.37)
P = 0.001
Infinite 2.227
Infinite
80
6/49(0.12)
N.S.
Infinite 0.680
Infinite
84
4/48(0.08)
N.S.
0.396 0.085 1.955
76

TABLE 4 (CONCLUDED)
o
Treated groups received doses of 125 or 250 ppm in feed.
Number of tumor-bearing animals/number of animals examined at site (proportion). f*
The probability level for the Cochran-Armitage test is given beneath the incidence of tumors in the control group when P < 0.05; otherwise, not significant (N.S.) is indicated. The probability level for the Fisher exact test for the comparison of a treated group with the control group is given beneath the incidence of tumors in the treated group when P < 0.05; otherwise, not significant (N.S.) is indicated. For both Cochran-Armitage and Fisher exact tests a negative designation (N) indicates a lower incidence in the treated group(s) than in the control group.
The 95% confidence interval on the relative risk of the treated group to the control group.
CO o

There were no other significant positive associations between
administration of the compound and an increased incidence of tumors
at any site in either male or female rats.
Based upon these statistical results, the administration of
N,N'-diethylthiourea was associated with the increased incidence of
follicular-cell carcinomas of the thyroid in male and follicular-cell
neoplasms of the thyroid in female Fischer 344 rats.
31

IV. CHRONIC TESTING RESULTS: MICE
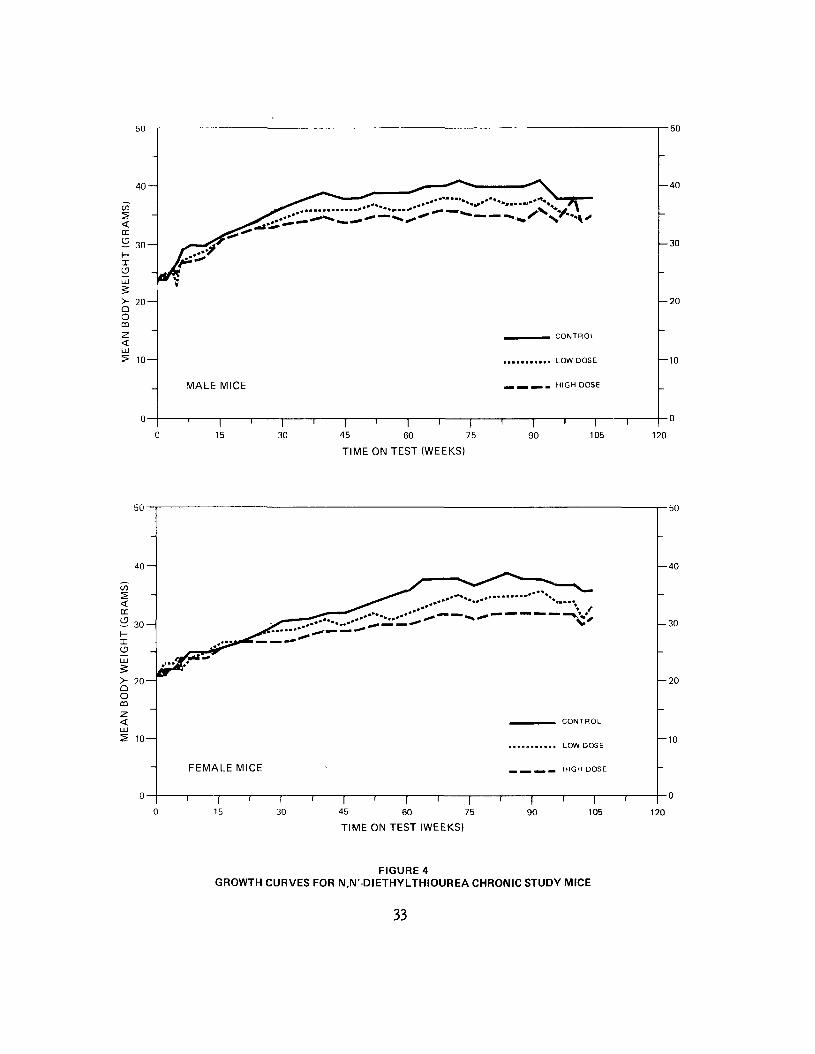
A. Body Weights and Clinical Observations
Dose-related mean body weight depression was apparent in both
male and female mice after week 30 (Figure 4).
No abnormal clinical signs were recorded.
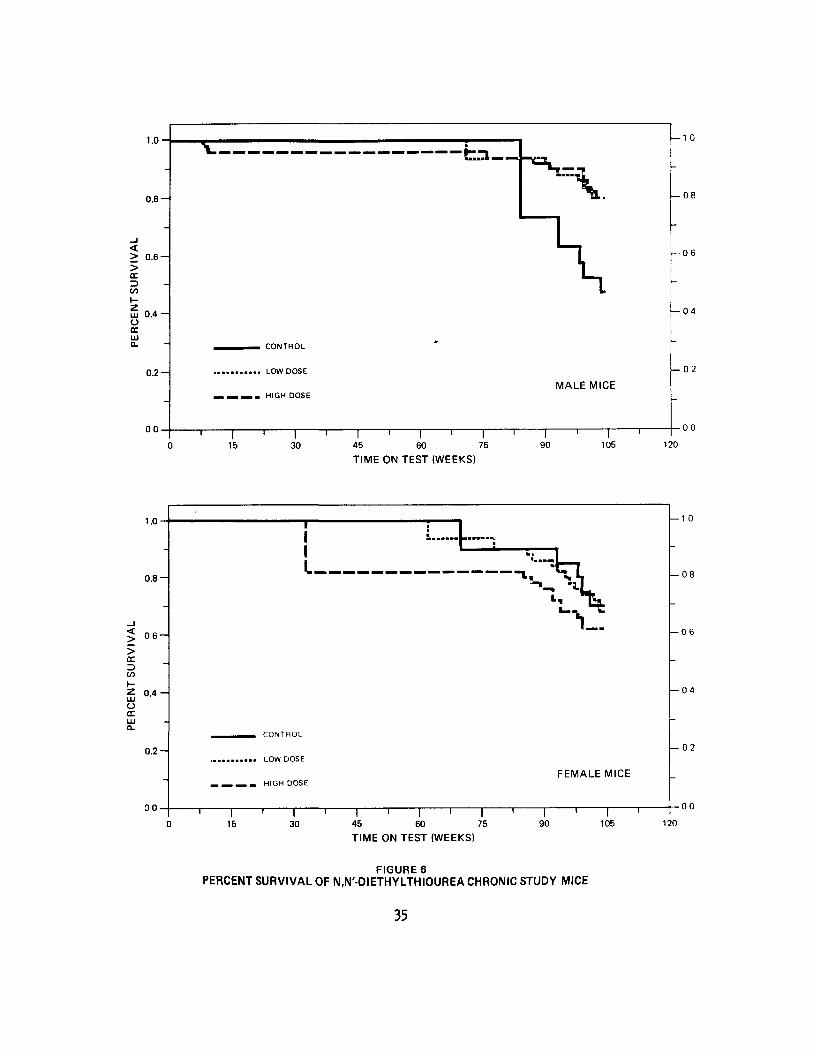
B. Survival
The estimated probabilities of survival for male and female mice
in the control and N,N'-diethylthiourea-dosed groups are shown in
Figure 5. The Tarone test for association between dosage and mortal
ity was not significant for either male or female mice.
The actual percentage of male and female mice surviving on test
in the dosed and control groups are shown in Figure 6. There were
adequate numbers of male mice at risk from late-developing tumors.
Despite 2 low dose and 4 control males missing by week 18, 94 percent
(47/50) of the high dose, 94 percent (47/50) of the low dose and
79 percent (15/19) of the controls survived on test for at least 80
weeks.
Eight females from the high dose group, 2 from the low dose
group and 1 control were missing by week 22. There were, however,
adequate numbers of female mice at risk from late-developing tumors
as 60 percent (30/50) of the high dose, 66 percent (33/50) of the low
dose and 70 percent (14/20) of the controls survived on test until
the termination of the study.
32
50- -50
40 -40
< DC
-30
I (J
> 2 0 -
O CD
CONTROL
— 20
ID LOW DOSE — 10
MALE MICE HIGH DOSE
I 15
T 30
I 45
I 60
I 75
TIME ON TEST (WEEKS)
T 90
I 105 120
50 -50
40 -40
< DC
I O LU
g
> 20D O CQ
TO
CONTROL
LOW DOSE
-30
-20
-10
FEMALE MICE HIGH DOSE
I 15 30 45
I 60
I 75
TIME ON TEST (WEEKS)
90 I
105 120
FIGURE 4 GROWTH CURVES FOR N,N'-DIETHYLTHIOUREA CHRONIC STUDY MICE

PR
OB
AB
ILIT
Y O
F S
UR
VIV
AL
PR
OB
AB
ILIT
Y O
F S
UR
VIV
AL
oo
o
o
o
a>
0000
II
I s 30
•o
30
g
OO
m
00 I
8
•o i
v>
O -
n
Z 3
0 .-m
m
^
en
I
O
30
m
O
30
O
O
w
2
O
I
\ r
o
oo
PE
RC
EN
T S
UR
VIV
AL
PE
RC
EN
T S
UR
VIV
AL
o
po
o
P
pk>
bo
o
io
*
01
I
j I
i I
I I
-O
m
30
O
o
zo I
H
o
O
-n
Z
6
^ $
m
m
O
|Lj3
> :
30
m
m
m
>
O
3D
O
O
1
r f
o
m
os
0
m
T
0
o

C. Pathology
Histopathologic findings on neoplasms in mice are summarized in
Appendix B (Tables Bl and B2); findings on nonneoplastic lesions are
summarized in Appendix D (Tables Dl and D2).
In both sexes, the neoplasms observed were similar in type and
distribution in dosed and control mice, and were well within the
incidence expected to occur spontaneously in aged B6C3F1 mice. The
severity and incidence of nonneoplastic lesions were also not unusual.
Based on the results of this pathologic examination, N,N"-diethyl
thiourea was not carcinogenic in B6C3F1 mice under the conditions of
this bioassay.
D. Statistical Analyses of Results
The results of the statistical analyses of tumor incidence in
mice are summarized in Tables 5 and 6. The analysis is included for
every type of malignant tumor in either sex where at least two such
tumors were observed in at least one of the control or N,N*-diethyl
thiourea-dosed groups and where such tumors were observed in at least
5 percent of the group.
None of the statistical tests for any site in mice of either sex
indicated a positive association between the administration of N,N'
diethylthiourea and an increased tumor incidence. Thus, under the
conditions of this bioassay, there was no statistical evidence that
N,N'-diethylthiourea was a carcinogen in B6C3F1 mice.
36
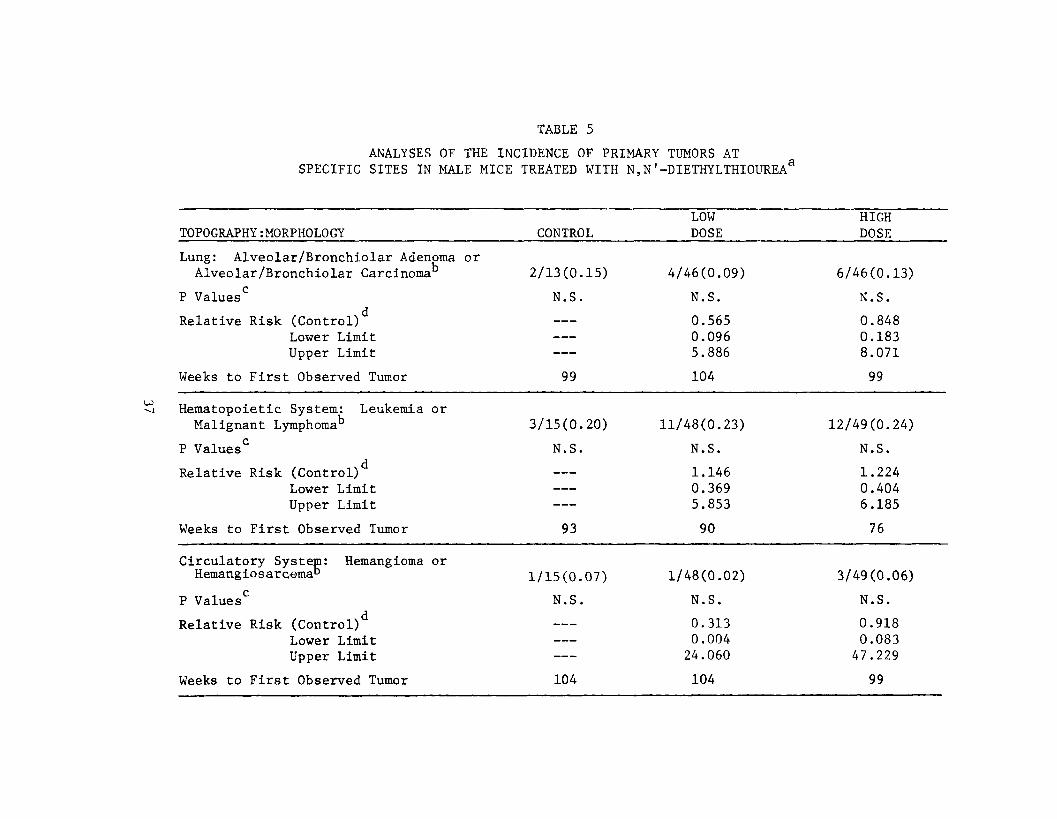
TABLE 5
ANALYSES OF THE INCIDENCE OF PRIMARY TUMORS AT SPECIFIC SITES IN MALE MICE TREATED WITH N,N'-DIETHYLTHIOUREA£
TOPOGRAPHY: MORPHOLOGY
Lung: Alveolar/Bronchiolar Adenoma or Alveolar/Bronchiolar Carcinoma
P Values0
Relative Risk (Control) Lower Limit Upper Limit
Weeks to First Observed Tumor
Hematopoietic System: Leukemia or Malignant Lymphoma
P Values0
Relative Risk (Control) Lower Limit Upper Limit
Weeks to First Observed Tumor
Circulatory System: Hemangioma or Hemangiosarcema"
P Values0
Relative Risk (Control) Lower Limit Upper Limit
Weeks to First Observed Tumor
CONTROL
2/13(0.15)
N.S.
99
3/15(0.20)
N.S.
93
1/15(0.07)
N.S.
104
LOW DOSE
4/46(0.09)
N.S.
0.565 0.096 5.886
104
11/48(0.23)
N.S.
1.146 0.369 5.853
90
1/48(0.02)
N.S.
0.313 0.004 24.060
104
HIGH DOSE
6/46(0.13)
N.S.
0.848 0.183 8.071
99
12/49(0.24)
N.S.
1.224 0.404 6.185
76
3/49(0.06)
N.S.
0.918 0.083 47.229
99

TABLE 5 (CONCLUDED)
LOW HIGH TOPOGRAPHY: MORPHOLOGY CONTROL DOSE DOSE
Liver: Hepatocellular Carcinoma 2/14(0.14) 5/48(0.10) 2/49(0.04)
P Values0 N.S. N.S. N.S.
Relative Risk (Control) _— 0.729 0.286 Lower Limit 0.141 0.023 Upper Limit 7.229 3.739
Weeks to First Observed Tumor 104 71 104
Liver: Hepatocellular Carcinoma or Hepatocellular Adenoma^ 5/14(0.36) 7/48(0.15) 3/49(0.06)
LO P Values0 P = 0.006(N) N.S. P = O.OIO(N) 00
Relative Risk (Control) 0.408 0.171 Lower Limit 0.143 0.033 Upper Limit 1.439 0.788
Weeks to First Observed Tumor 93 71 104
Treated groups received doses of 250 or 500 ppm in feed.
Number of tumor-bearing animals/number of animals examined at site (proportion).
"The probability level for the Cochran-Armitage test is given beneath the incidence of tumors in the control group when P < 0.05; otherwise, not significant (N.S.) is indicated. The probability level for the Fisher exact test for the comparison of a treated group with the control group is given beneath the incidence of tumors in the treated group when P < 0 .05; otherwise, not significant (N.S.) is indicated. For both Cochran-Armitage and Fisher exact tests a negative designation (N) indicates a lower incidence in the treated group(s) than in the control group.
The 95% confidence interval on the relative risk of the treated group to the control group.
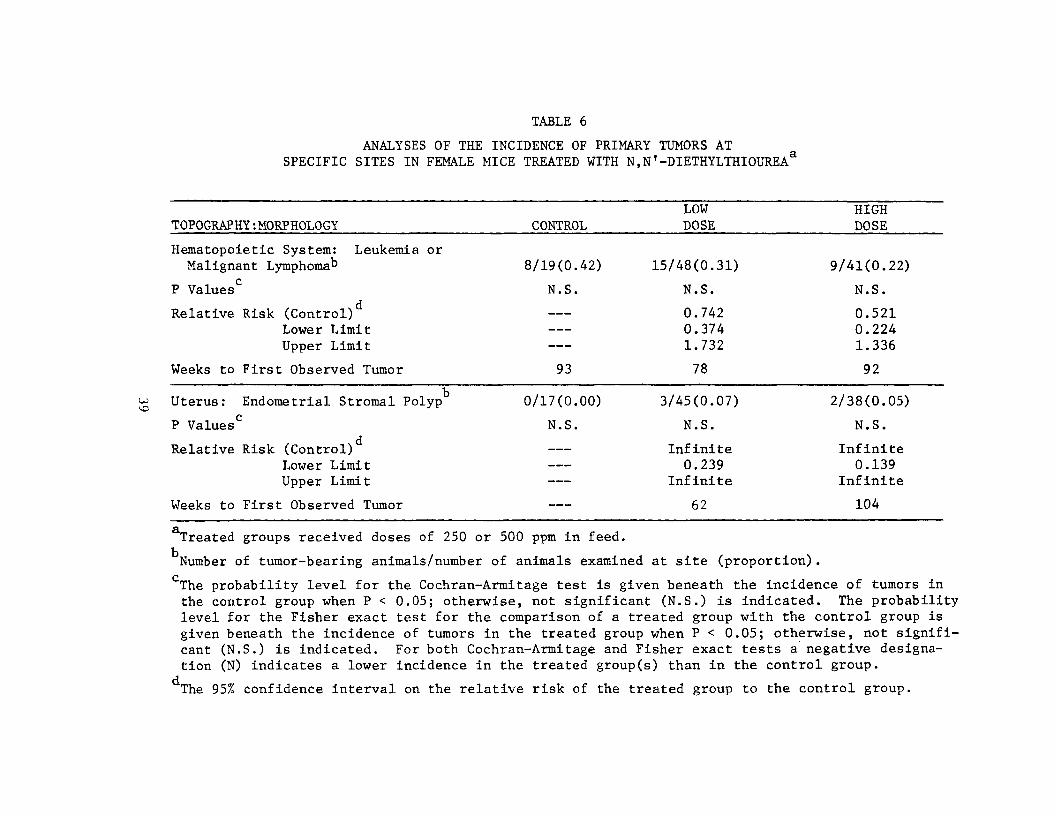
TABLE 6
ANALYSES OF THE INCIDENCE OF PRIMARY TUMORS AT SPECIFIC SITES IN FEMALE MICE TREATED WITH N,N'-DIETHYLTHIOUREA2
TOPOGRAPHY: MORPHOLOGY CONTROL LOW DOSE
HIGH DOSE
Hematopoietic System:Malignant Lymphoma^5
Leukemia or 8/19(0.42) 15/48(0.31) 9/41(0.22)
P Values N.S. N.S. N.S.
Relative Risk (Control) Lower Limit Upper Limit
0.742 0.374 1.732
0.521 0.224 1.336
Weeks to First Observed Tumor 93 78 92
Uterus: Endometrial Stromal Polyp
P Values0 0/17(0.00)
N.S.
3/45(0.07)
N.S.
2/38(0.05)
N.S.
Relative Risk (Control) Lower Limit Upper Limit
Infinite 0.239
Infinite
Infinite 0.139
Infinite
Weeks to First Observed Tumor 62 104
Treated groups received doses of 250 or 500 ppm in feed.
Number of tumor-bearing animals/number of animals examined at site (proportion).
°The probability level for the Cochran-Armitage test is given beneath the incidence of tumors in the control group when P < 0.05; otherwise, not significant (N.S.) is indicated. The probability level for the Fisher exact test for the comparison of a treated group with the control group is given beneath the incidence of tumors in the treated group when P < 0.05; otherwise, not significant (N.S.) is indicated. For both Cochran-Armitage and Fisher exact tests a negative designation (N) indicates a lower incidence in the treated group(s) than in the control group.
The 95% confidence interval on the relative risk of the treated group to the control group.

In male mice a possible negative association between dose and
the combined incidence of hepatocellular carcinomas or hepatocellular
adenomas was noted.
To provide additional insight into the possible carcinogenicity
of this compound, 95 percent confidence intervals on the relative
risk have been estimated and entered in the tables based upon the
observed tumor incidence rates. In many of the intervals shown in
Tables 5 and 6, the value one is included; this indicates the absence
of statistically significant results. It should also be noted that
many of the confidence intervals have an upper limit greater than one,
indicating the theoretical possibility of tumor induction in mice by
N,N'-diethylthiourea that could not be established under the condi
tions of this test.
40

V. DISCUSSION
There were no significant positive associations between the dos
ages of N,N'-diethylthiourea administered and mortality in rats or
mice of either sex. Adequate numbers of animals in all groups sur
vived sufficiently long to be at risk from late-developing tumors.
Compound-related mean body weight depression was apparent among
dosed male and female mice when compared to their respective controls,
indicating that the concentrations of N,N'-diethylthiourea adminis
tered to mice may have approximated the maximum tolerated dosages.
Neoplasms and hyperplasia of the thyroid were observed with
greater frequency among dosed rats than among controls. When the
incidences of follicular-cell carcinomas of the thyroid in male rats
(i.e., 0/18, 1/45 [2 percent], and 11/48 [23 percent] in the control,
low dose, and high dose, respectively) were analyzed, there was a
statistically significant positive association between dosage and
increased incidence. This finding was supported by the high dose
to control Fisher exact comparison. In both sexes of rats, statis
tical analysis of the incidences of a combination of follicular-cell
carcinomas and follicular-cell adenomas of the thyroid resulted in
significant positive Cochran-Armitage tests. For males and females,
the high dose to control Fisher exact comparisons were also signifi
cant.
41

For mice, none of the statistical tests for any site revealed
a significant positive association between administration of the
compound and increased tumor incidence.
Under the conditions of this bioassay, N,N'-diethylthiourea was
carcinogenic to Fischer 344 rats, causing follicular-cell carcinomas
of the thyroid in males and follicular-cell neoplasms of the thyroid
in females. There was no evidence for the carcinogenicity of the
compound in B6C3F1 mice.
42
VI. BIBLIOGRAPHY
Armitage, P., Statistical Methods in Medical Research, Chapter 14. J. Wiley & Sons, New York, 1971.
Beilstein's Handbuch der Organischen Chemie, 4th edition. Springer Verlag, Berlin, p. 118, 1973.
Berenblum, I., editor, Carcinogenicity Testing. International Union Against Cancer, Technical Report Series, Vol. 2. International Union Against Cancer, Geneva, 1969.
Chemical Abstracts Service, The Chemical Abstracts Service (CAS) Ninth Collective Index, Volumes 76-85, 1972-1976. American Chemical Society, Washington, B.C., 1977.
Cox, D.R., Analysis of Binary Data, Chapters 4 and 5. Methuen and Co., Ltd., London, 1970.
Cox, D.R., "Regression Models and Life-Tables." Journal of the Royal Statistical Society, Series "B" 34:187-220, 1972.
Gart, J.J., "The Comparison of Proportions: A Review of Significance Tests, Confidence Limits, and Adjustments for Stratification." International Statistical Institute Review 39:148-169, 1971.
Gosaier, R.K. and C.N.R. Rao, "Electronic Absorption Spectra of Thiourea Derivatives." Can. J. Chem. 45(16):1897, 1967.
Hawley, G.G., editor, The Condensed Chemical Dictionary, 8th edition. Van Nostrand Reinhold Company, New York, 1971.
Innes, J.R.M., B.M. Ulland, M.G. Valerio, L. Petrucelli, L. Fishbein, E.R. Hart, A.J. Pallotta, R.R. Bates, H.L. Falk, J.J. Gart, M. Klein, I. Mitchell, and J. Peters, "Bioassay of Pesticides and Industrial Chemicals for Tumorigenicity in Mice: A Preliminary Note." Journal of the National Cancer Institute 42(6):1101-1114, 1969.
Kaplan, E.L. , and P. Meier, "Nonparametric Estimation from Incomplete Observations." Journal of the American Statistical Association 53_:457-481, 1958.
Linhart, M.S., J.A. Cooper, R.L. Martin, N.P. Page, and J.A. Peters, "Carcinogenesis Bioassay Data System." Computers and Biomedical Research 7:230-248, 1974.
43

Miller, R.G., Simultaneous Statistical Inference. McGraw-Hill Book Co., New York, 1966.
Rose, A. and E. Rose, editors, The Condensed Chemical Dictionary, 7th edition. Van Nostrand Reinhold Company, New York, 1966.
Sadtler Standard Spectra. Sadtler Research Laboratories, Philadelphia, Pennsylvania, NMR No. 190, IR No. 11236.
Saffiotti, U., R. Montesano, A.R. Sellakumar, F. Cefis, and D.G. Kaufman, "Respiratory Tract Carcinogenesis in Hamsters Induced by Different Numbers of Administration of Benzo (a) Pyrene and Ferric Oxide." Cancer Research 32:1073-1079, 1972.
Stanford Research Institute, 1977 Directory of Chemical Producers, U.S.A. Menlo Park, California, 1977.
Tarone, R.E., "Tests for Trend in Life-Table Analysis." Biometrika 62:679-682, 1975.
44

APPENDIX A
SUMMARY OF THE INCIDENCE OF NEOPLASMS IN RATS TREATED WITH N,N'-DIETHYLTHIOUREA


TABLE Al SUMMARY OF THE INCIDENCE OF NEOPLASMS IN MALE RATS TREATED WITH N.N'-DIETHYLTHIOUREA
A N I M A L S INITIALLY IN STUDYA N I M A L S NECROPSIEDA N I M A L S E X A M I N E D HISTOPAT HOLOGICA LLY**
I N T E G U M E N T A R Y S Y S T E M
* S K I NN E U R O F I B R O S A R C O M A
• SUBCUT TISSUEF I B R O S A R C O M A
R E S P I R A T O R Y S Y S T E M
t ^ R A C H E AFOL1ICULAR-CELL C A R C I N O M A . I N V A S
* L U N GA L V E O L A R / B R O N C H I O L A P A D E N O M A A L V E O L A R / B R O N C H I O L A R C A R C I N O M A"OLLICULAR-CELL C A R C I N O M A ,O S T E O S A R C O M A , M E T A S T A T I C
H E M A T O P O I E T I C S Y S T E M
* M U L T I P L E O R G A N SL E U K E M I A , NOSU N D I F F E R E N T I A T E D L E U K E M I AL Y M P H O C Y T I C L E U K E M I AG R A N U L O C Y T I C L E U K E M I AM O N O C Y T I C L E U K E M I A
* M E S E N T E P I C L . N O D EO S T E O S A R C O M A
C I R C U L A T O R Y S Y S T E M
F O L L T C t l L A P - C E L L C A R C I N O M A .
I N V A S
I N V A S
CONTROL ( U N T R )11-1365
20 20
20
( 2 0 )
(20)
( 19 )
(20)
( 2 0 )
1 ( 5 % ) 1 (5!!)
( 17 )
L O W DOSE 11-1363
50 50 50
(50)
(50) 3 ( 6 X )
(144)
("48)
1 ( 2 % )
1 ( 2 X )
(50) 4 ( 8 X ) 1 ( 2 X )
2 ( < 4 X ) 1 ( 2 X )
(149) 1 ( 2 % )
* N U M B E " OF A N I M A L S W I T H TISSUE E X A M I N E D M I C R O S C O P I C A L L Y * N U M B E R O F A N I M A L S N E C R O P S I E D **EXCLUDES PARTIALLY AUTOLYZED ANIMALS
A-3
HIGH DDSE 11-1 1361
50 50 50
(50)1 ( 2 X )
(50) 1 (2J )
(16)1 ( 2 X )
(49)1 (2*) 1 (2*) 2 (1*)
(50)
1 ( 2 X ) 1 (2*)
,iu,
(19)1 J2XI
D I G E S T I V E S Y S T E M
• S M A L L I N T E S T T N F N E O P 1 A S M , NOS A D E N O C A R C I N O M A , N O S
• S M A L L !NTESTT N 4 L SES
O S T E O S A P C O M A
U R I N A R Y S Y S T E M
• K I D N E Y L I P O S A R C O M A OSTEO S A R C O M A
E M D O C 3 I N E S Y S T E M
• P I T U I T A F Y C H R O K O P H O B E A D E N O M A C H 8 0 M O P H O B E C A R C I N O M A
• A D R E N A L P H E O C H R O M O C Y T O M A H E M A N G I O M A O S T E O S A R C O M A
• T H Y R O I D F O L L I C U L A R - C E L L A D E N O M A F O L L I C U L A R - C E L L C A R C I N O M A C-CEIL A D E N O M A C-CELL C A R C I N O M A
• P A R A T H Y R O I D A D E N O M A , N O S
• P A N C F E A T I C I S L E T S T S L F ^ - C E L L A D E N O M A I S L E T - C E L L C A R C I N O M A
R E P R O D U C T I V E S Y S T E M
• P R E P M T I A L G L A N D C A R C I N O M A ^ N O S
* M J M B F R O F A N I M A L S WITH TISSUE* N U M B E R O F A N I M A L S N E C R O P S I E D
TABLE Al (CONTINUED)
C O N T R O L ( U N T R ) L C H ECSE 11-1365 11-1363
(19) (49)
1 (2X)
(19) (49) 1 (2X)
(20) (50) 1 < 2 X ) 1 (2X)
(17) (46) 6 (13X)
( 1 8 ) (50) 1 (6%) 4 (8X) 1 < 6 X )
1 ( 2 X )
(18) (45)
1 ( 2 X )
1 ( 6 X )
(13 ) (29) 1 ( 3 X )
(19 ) (49) 2 ( 4 % )
1 (5%}
( 2 0 ) ( 5 0 )
E X A M I N E D M I C R O S C O P I C A L L Y
HIGH DOSE 11-1361
(48) 1 < 2 X )
(48)
(50)
(48) 5 (10X) 1 (2X)
(50) 3 < 6 X )
(48) 6 ( 1 3 X )
11 (23X) 2 (4*) 1 ( 2 X )
(21 )
(48)
(50) 1 (2X1
A-4
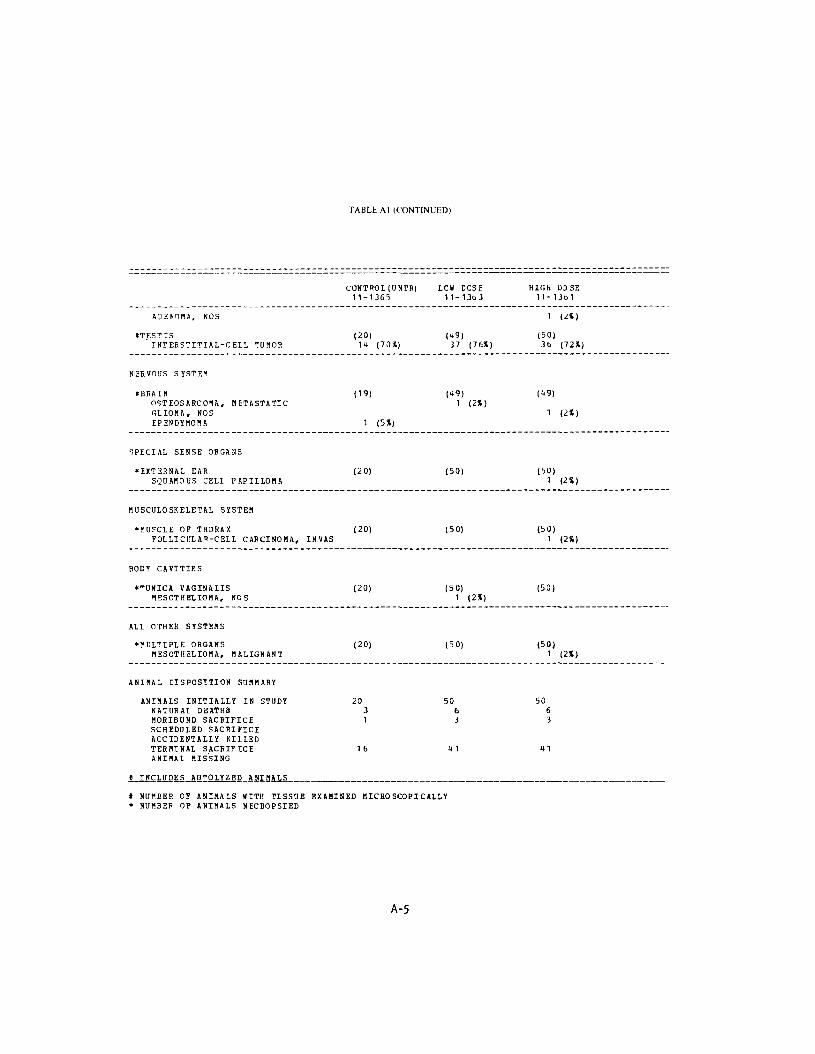
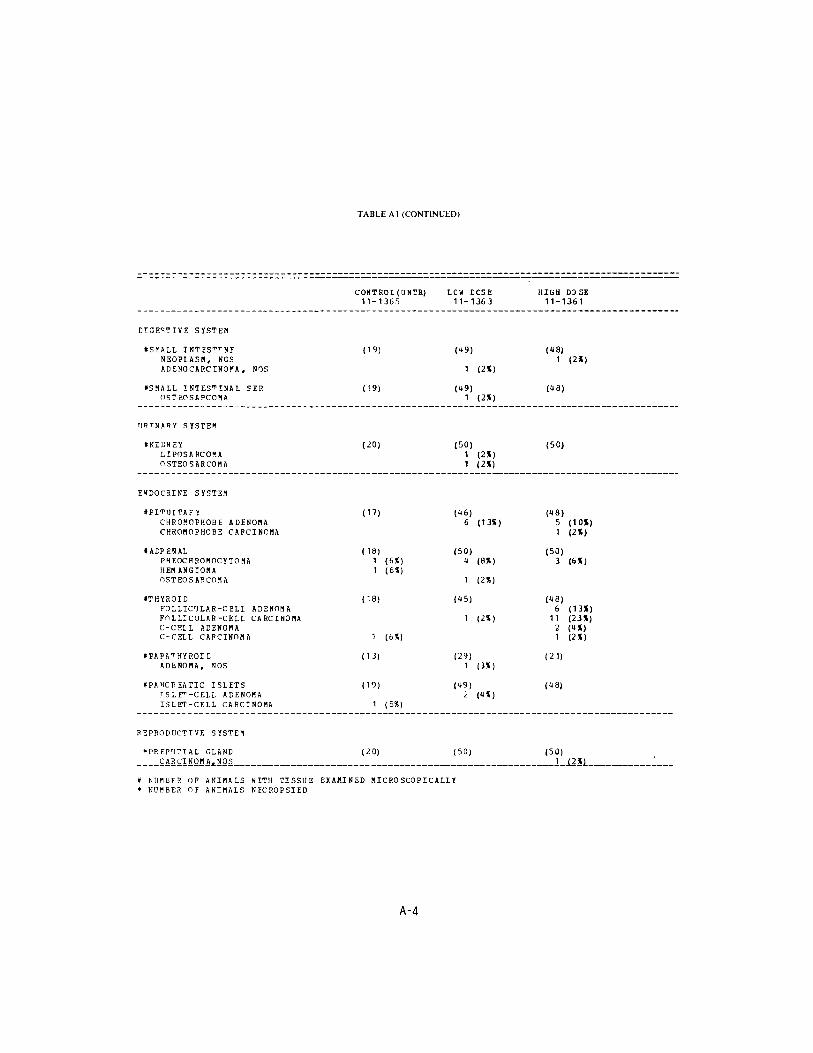
TABLE A1 (CONTINUED)
C O N T R O L ( U N T R ) L C W DCSE H I G H D3 SE 11-1365 11-1363 11-1361
A D E N O M A , NOS 1 (2i)
• TEST IS (20) (1491 (5°) I N T E R S T I T I A L - C E L L T U M O R 14 (70*) 37 (76X) 3b (72*)
N E R V O U S S Y S T E M
» B R A I N (19) (49) ( U 9 ) O S T E O S A R C O M A , M E T A S T A T I C 1 ( 2 X ) G L I O M A , NOS 1 ( 2 X ) E P E N D Y M O H A 1 (5*)
S P E C I A L SENSE O R G A N S
• E X T E R N A L EAR (20) (50) (50) S Q U A H O U S CELI P A P I L L O M S 1 (2*)
M U S C U L O S K E L E T A L S Y S T E M
* B U ? C L E OF T H O R A X ( 2 0 ) (50) (50) F O I L I C U L A P - C E L L C A R C I N O M A , I N V A S 1 (2*)
BODY C A V I T I E S
*"UNICA V A G I N A L I S (20) (50) (50) M E S O T H E L I O M A , NOS 1 ( 2 X )
ALL O T H E R SYSTEMS
*«DLTIPLE O R G A N S ( 2 0 ) ( 5 0 ) (50) M E S O T H E L I O M A , M A L I G N A N T 1 (2X)
A N I M A L EISPOSTTION S B M M A R Y
A N I M A L S I N I T I A L L Y IN STUDY 20 50 50 N A T U R A L DEATHS 3 6 6 M O R I B U N D SACRIFICE 1 3 3 S C H E D U L E D SACRIFICE A C C I D E N T A L L Y K I L L E D T E R M I N A L SACRIFICE 16 41 41 A N I M A L MISSING
8 I N C L U D E S A U T Q L Y Z E D A N I M A L S
I N U M B E R O F A N I M A L S WITH TISSUE E X A M I N E D MICROSCOPICALLY * N U M B E R OF A N I M A L S N E C R O P S I E D
A-5
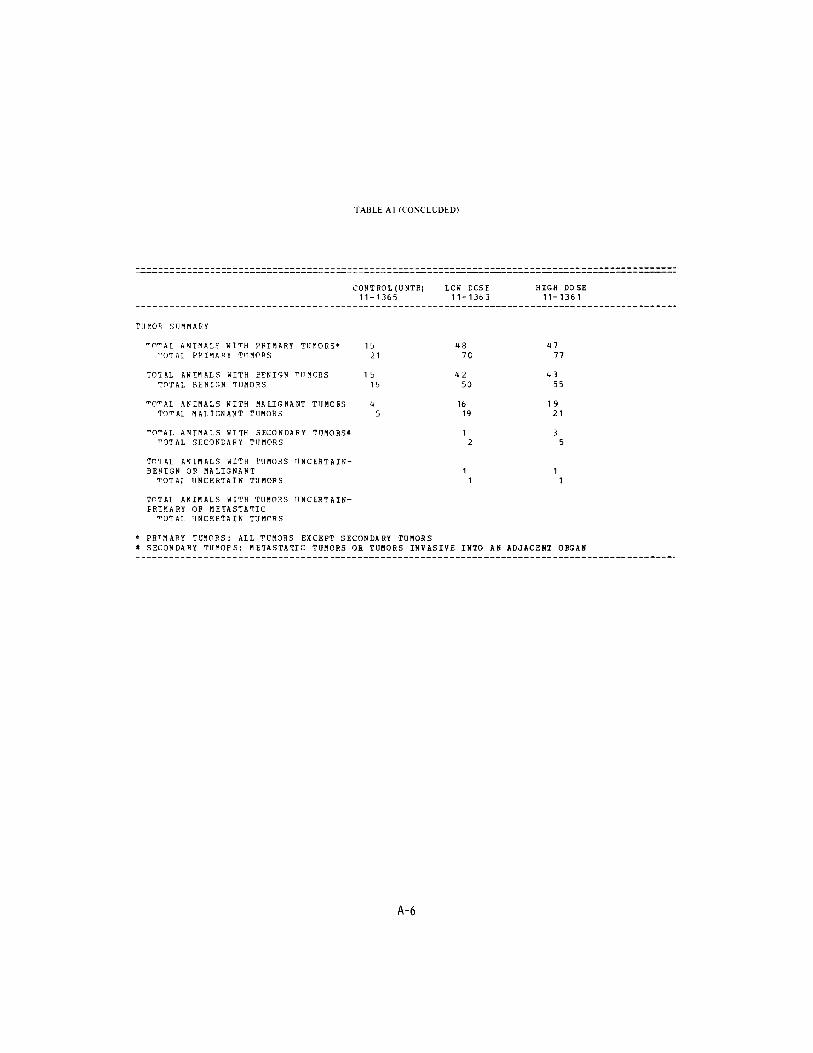
TABLE A1 (CONCLUDED)
C O N T R O L ( U N T R ) L C H CCSE H I G H DOSE 11-1365 11-1363 11-1361
T U M O R S U M M A R Y
m O " A L A N I M A L S W I T H P R I M A R Y T U M O R S * 15 18 47 "OTAI P R I M A R Y T U M O R S 21 7C 77
T O T A L A N I M A L S W I T H E S N I G N T U M O R S 1 5 4 2 43 T O T A L B E N I G N T U M O R S 1b 50 55
TO"-AL A N I M A L S W I T H M A L I G N A N T T U M O E S 4 16 19 T O T A L M A L I G N A N T T U M O R S 5 19 21
TO^AL A N I M A L S WITH SECONDARY TUMOHSt 1 3 TOTAL SECONDARY TUMORS 2 5
TOTAL A1INALS WITH TUMORS UNCERTAINBENIGN OR MALIGNANT 1 1
TOTAL UNCERTAIN TUMOPS 1 1
TOTAL ANIMALS WITH TUMOSS UNCERTAINPRIMARY OR ME1ASTATIC
"-OTAL UNCERTAIN TUMORS
* PRTMAPY TUMORS: ALL TUMORS EXCEPT SECONDARY TUMORS # SECONDARY TUMOPS: ME1ASTATIC TUMORS OR TUMORS INVASIVE INTO AN ADJACENT OEGAH
A-6

TABLE A2 SUMMARY OF THE INCIDENCE OF NEOPLASMS IN FEMALE RATS TREATED WITH N,N'-DIETHYLTHIOUREA
CONTROL ( U K T R ) 11-1366
A N I M A L S I N I T I A L L Y IN STUDY 20 A M I H A L S H I S S I N G A N I M A L S NECROPSIED 20 A N I M A L S E X A M I N E D HISTOPATHOLOGICALLY** 20
I N T E G U M E N T A R Y SYSTEM
NONE
R E S P I R A T O R Y SYSTE1
*LUNG (20) A L V E O L A R / B R O N C H I OLAF A D E N O M A A L V E O L A R / B R O N C H I O L A R C A R C I N O M A
HEMATOPOIETIC SYSTEM
•MULTIPLE ORGANS LEUKEMIA.NOS GRANULOCYTIC LEUKEMIA MONOCYTIC LEUKEMIA
• SPLEEN HEMANGIOSARCONA
• LIVES GRANU10CY"IC LEUKSf l lA
C I R C U L A T O R Y SYSTEM
NONE
DIGESTIVE SYSTEM
• P A R O T I D G L A N D ____ CISTADENQMAA.NQS
I N U M B E R OF A N I M A L S KITH TISSUE* N U M B E R OF A N I M A L S N E C R O P S I E D **EXCLUDES PARTIALLY AUTOLYZED ANIMALS
(20) 1 <5X) 1 (5*) 1 (5X)
(20)
(20)
(19)
EXAMINED MICROSCOPICALLY
10R EOS I HIGH DOSE 11-136U 11-1362
50 50 1
50 (49 50 49
(49) 1 (2X) 1 (2%)
1 (2*)
(50) (49) 4 (8*) 3 (6%) 1 (2X) 1 ( 2 X ) 1 <2X)
(49) (48) < 2 X >
(49) (49) 1 (2%)
(49) (46)
A-7
I I I V E R H E H A N G I O H A
[ T R I N A P Y S Y S T E M
N O N E
E N D O C R I N E S Y S T E M
• P I T U I T A R Y C H B O M O P H O B E A D E N 0 1 A C H R O M O P H O B E C A R C I N O M A
• A D R E N A L A D E N O M A , N O S C O R T I C A L A D E N O M A P H E O C H P O M O C Y T O M A
• • " H Y R O I D " O L L T C U L A R - C E L L A D E N O M A " T L L I C U L A R - C E L L C A R C I N O M A C - C E L L A D E N O M A C-CEL1 C A P C I N O M A
R E P R O D U C T I V E S Y S T E M
' M A M M A R Y G L A N D A D E N O C A R C I N O M A , N O S P A P U I A R Y A D E N O C A R C I N O M A C Y S T f t D E N O M A , N O S F I B R O A D E N O M A
» U T " R ' J S A D E N O C A R C T N O M A , NOS F N D O M E T K I A L ^ " O M A L P O L Y P
• U T E R U S / IN DO MET PHI" J D h N O C A R C I N O M A , N O S
N E F V O t J S S Y S T F M
• B P P T N N E O P L A S M , NO*", M E T A S T A T I C
* N U r B E P O F A N I M A L S VI^H T I S S U E« N U M B E R OF A N I M A L S NECPOPSIED
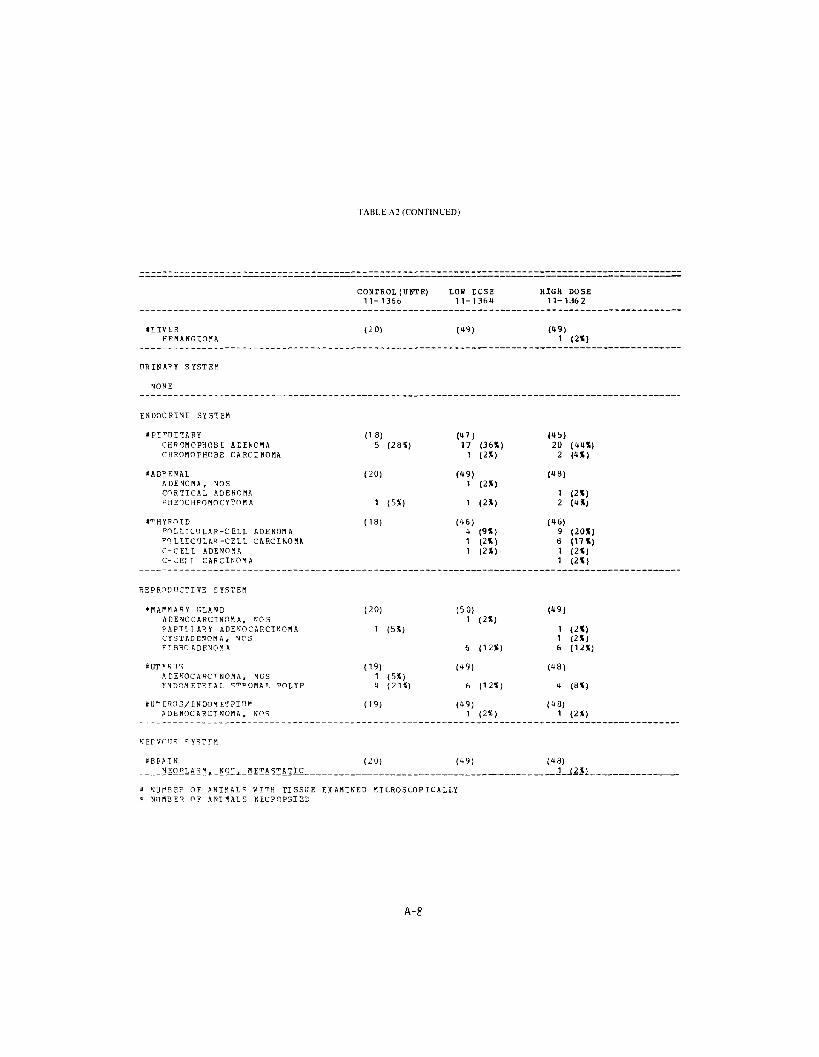
TABLE A2 (CONTINUED)
C O N T R O L ( U N T F ) LOW ECS!1 1 - 1 3 6 6 1 1 - 1 3 6 4
( 2 0 ) (49)
(18) (47 ) 5 (28%} 17 (36X)
1 ( 2 X )
(20) (49) 1 (2X)
1 ( 5 % ) 1 ( 2 X )
( 1 8 ) (46) 4 (9X) 1 <2X) 1 ( 2 X )
( 2 0 ) (50) 1 ( 2 X )
1 ( 5 % )
6 ( 1 2 X )
(19) (49) 1 ( 5 X ) It ( 2 1 % ) 6 (12*)
( 1 9 ) (49) 1 ( 2 X )
( 2 0 ) ( 4 9 )
E X A M I N E D M I C R O S C O P I C A L L Y
HIGH DOSE 11-1362
(49) 1 < 2 X )
(45) 20 ( 4 4 X )
2 ( 4 X )
(48)
1 (2X) 2 ( 4 X )
(46) 9 (20X) 8 (17X) 1 (2*) 1 ( 2%)
(49)
1 ( 2 X ) 1 ( 2 X ) 6 ( 1 2 X )
(48)
4 (8X)
(48) 1 (2*)
(48) 1 ( 2 X 1
A-g

TABLE A2 (CONTINUED)
C H R O N O P H O B E C A P C I N O B A , I N V A S I V E
C O N T R O L ( U N T R )11-136b
L C W D O S E 11-136U
HIGH DOSn 11-1362
1 (2*)
S P E C T A L
N O N E
S E N S E O R G A N S
M U S C U L O S K E L E T A L
N O N E
S Y S T E M
B O D Y C A V I T I E S
* M E S E N T E 6 YL T P O B A
( 2 0 ) (50) ( U 9 ) 1 ( 2 X )
A L L O T H E R
N O N E
S Y S T E M S
A N I M A L DISPOSITION S U r M A E Y
A N I M A L S I N I T I A L L Y IN S T U D YN A T U R A L D E A T H SM O R I B U N D S A C R I F I C ES C H E D U L E D SACRIFICE ACCIDENTALLY KILLED T E P M I N A L S A C R I F I C EA N I M A L M I S S I N G
S _ I S C L U D E S _ A U T g L Y Z E D _ A N I M A L S
t N U M B E R O F A N I M A L S WITH T I S S U E* N U M B E R OF A N I M A L S N E C R O P S I E D
20 50 2 5
1
18 f t
E X A M I N E D M I C R O S C O P I C A L L Y
50 U
U
U 1 1
A-9

TABLE A2 (CONCLUDED)
C O N T R O L ( U N T R ) L O U DCSE H I G H DOSE I1 -13b6 11-1364 11-1362
™\]*0*> S U M M A R Y
"OTAL A N I M A L S W I T H P R I M A P Y T U M O P S * 13 33 41 T O T A L P R T M A P Y "•HMOHS 15 66
"OTAL A » ' I M A T S W I T H B E N I G N -"UN01S 10 28 31 TOTJIL 3 E N I G N T U M O P S 10 38 47
TO"AL A N I M A L S KIT M A L I G N A N T T U M O R S 11 17 N A M T " U M O P S ^ 5 11 19
T O T A L A N I M A L S W I T H S E C O N D A R Y HUMORS* "•OTAL S E C O N D A P Y ^ 'JIO^S
TO^AL A N I M A L S W I T H T U r O I S U N C E R T A I N D E N I G N O B 1 A L I G N A N T
T O T A L U N C E R T f t j o " U M O R S
TO"AL AN I" AT s W I T H T U M O R S U N C E 1 T A I N F P I M A B Y O R M E T A S T A T T C
T O T A L U N C E ^ T J T N T U M O R S
* P R I M A R Y T U M O R S : A I L " ( IMnoS E X C E P T S E C O N D A F Y T U H O H S t S E C O N D A R Y T ' l M O P S : M E T A S T A T I C TIIHORS OR T U M O R S I N V A S I V E INTO AM A D J A C E N T OBGAN
A-10

APPENDIX B
SUMMARY OF THE INCIDENCE OF NEOPLASMS IN MICE TREATED WITH N,N'-DIETHYLTHIOUREA

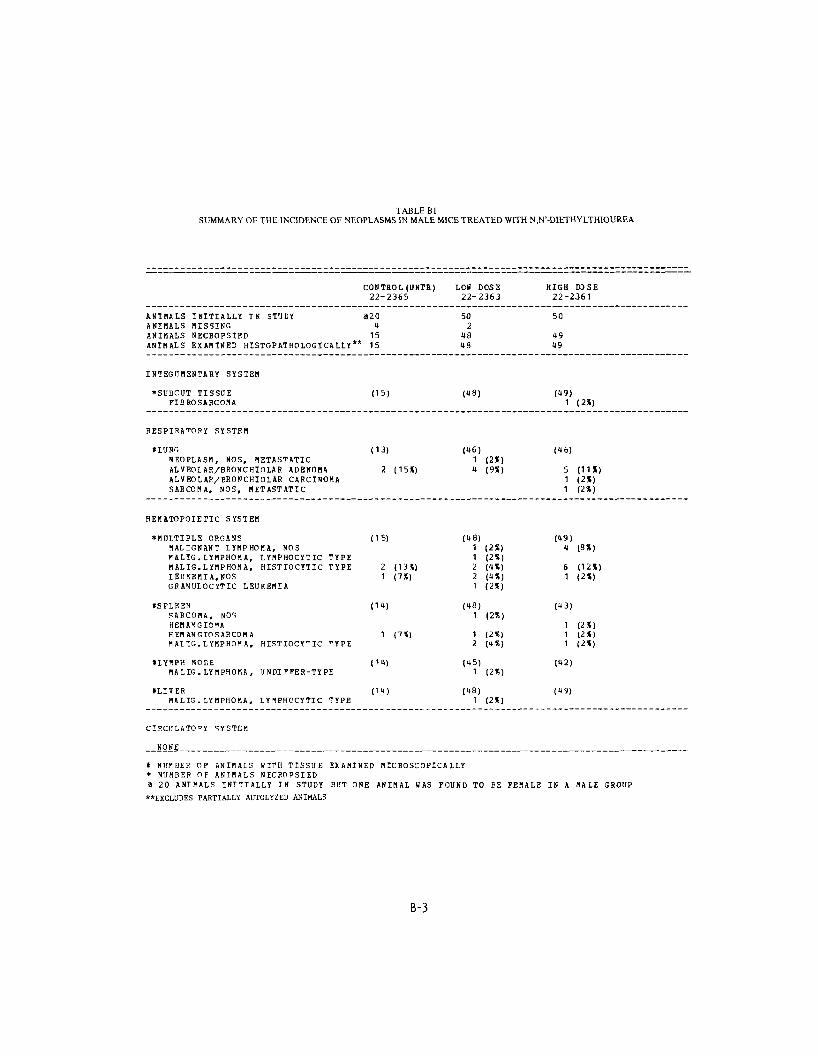
TABLE Bl SUMMARY OF THE INCIDENCE OF NEOPLASMS IN MALE MICE TREATED WITH N,N'-DIETHYLTHIOUREA
CONTROL ( U N T R ) LOW DOSE HIGH D3SE 22-2365 22-2363 22-2361
ANIMALS INITIALLY IN STUDY 820 50 50 A N I M A L S M I S S I N G 1 2 A N I M A L S NECROPSIED 15 18 19 A N I M A L S E X A M I N E D H I S T O P A T H O L O G I C A L L Y ** 15 18 49
I N T E G U M E N T A R Y S Y S T E M
*SHBCUT TISSUE (15) (18) (19) F I B R O S A R C O M A 1 (2X)
R E S P I R A T O R Y S Y S T E M
ILUNS (13) (16) (16) NEOPLASM, NOS, METASTATIC 1 (2%) ALVEOIAR/BRONCHIOL&R ADENOMA 2 (15*) 1 (9%) 5 (11%) ALVEOLAP/BRONCHIOLAR CARCINOMA 1 (2X) SARCOMA, NOS, METASTATIC 1 (2X)
H E M A T O P O I E T I C S Y S T E M
*MDLTIPLE O R G A N S (15) (18) (19) M A L I G N A N T L Y M P H O M A , N O S 1 ( 2 X ) 1 (8X) P4LIG. L Y M P H O M A , L Y M P H O C Y T I C T Y P E 1 ( 2 X ) M A L I G . L Y M P H O M A , HISTIOCYTIC T Y P E 2 (13%) 2 (IX) 6 (12X) I E U K E M T A . N O S 1 ( 7 X ) 2 ( IX) 1 < 2 X ) G R A N U L O C Y T I C L E U K E M I A 1 < 2 X )
f S P L E E N (11) (18) (13) S A R C O M A , NOS 1 (2X) H E M A « J G I O * A 1 ( 2 X ) H E M A N G I O S A R C O M A 1 (7*) 1 (2*) 1 (2*) M A I I G . L Y N P H O N A , HISTIOCY^IC T Y P E 2 ( IX) 1 ( 2 X )
tLYMPH NODE (11) (15) (12) M A L I G . L Y M P H O K A , U N D I PPER-TY P E 1 ( 2 X )
t L I V E R (11) (18) (19) M A L I G . L Y M P H O M A , L Y M P H O C Y T I C T Y P E 1 ( 2 X )
C I R C U L A T O R Y S Y S T E M
NONE
* N U M B E R O F A N I M A L S W I T H T I S S U E E X A M I N E D M I C R O S C O P I C A L L Y * N U M B E R O F A N I M A L S N E C R O P S I E D 9 20 A N I M A L S I N I T I A L L Y IN STUDY BUT ONE A N I M A L WAS F O U N D TO BE F E M A L E IN A M A L E G R O U P
**EXCLUDES PARTIALLY AUTOLYZED ANIMALS
B-3
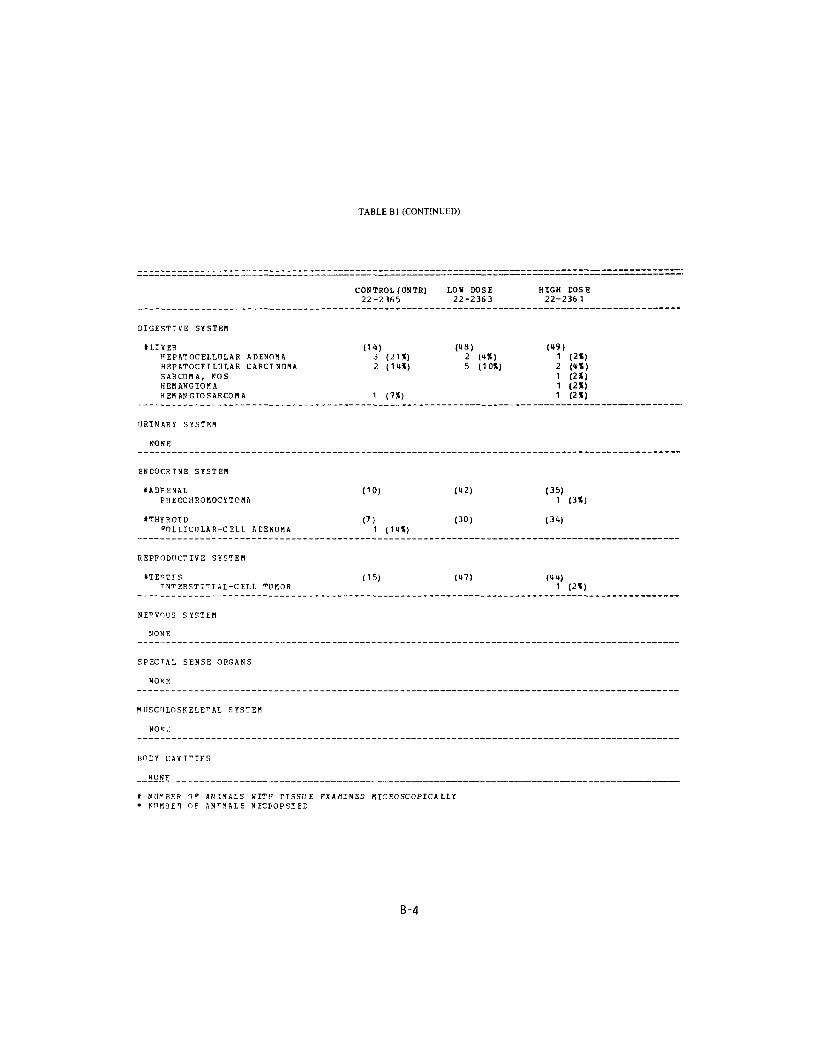
TABLE Bl (CONTINUED)
CONTROL! ON TR)22-2365
LOB DOSE 22-2363
HIGH DOSE 22-2361
D I G E S T I V E S Y S T E M
t L I V E R (14) (18) («9) H E P A T O C E L L U L A R A D E N O M A 3 (21*) 2 ( IX) 1 (2*) H E P A T O C E L L I I L A R C A R C I N O M A 2 (1<4*) 5 (1 OX) 2 ( H I ) S A R C O M A , N O S 1 (2*) H E M A N G I O M A 1 (2X) H E M A N G I O S A R C O M A 1 ( 7 X ) 1 (2X)
URINARY SYSTEM
NONE
E N D O C R I N E S Y S T E M
I A D P E N A L (10) ( U 2 ) (35) P H E O C H R O M O C Y T O N A 1 (3X)
• T H Y R O I D (7) (30) (31) POI .LICOLAP-CELL A D E N O M A 1 ( 1 U X )
R E P P O D C C 7 I V E S Y S T E M
• T E ^ T I ST N T E R S T I T I A L - C E L L T U M O S
(15) («7) (Hit) 1 ( 2 X )
NERVOUS SYSTEM
NONE
SPECTAL SENSE ORGANS
NONE
HUSCI1LOSKELETAL SYSTEM
NONZ
BODY C A V I T I E S
N O N E
t N U f B E R OF A N I M A L S WITH TISSUE E X A M I N E D MICROSCOPICALLY * K I ' H B E t O F A N T . 1 A L S N E C f O P S I E D
B-4
TABLEBl (CONCLUDED)
C O N T R O L ( n N T R ) L C W DCSE H I G H DOSE 22-2365 22-2363 22-2361
A L L (VHEP S Y S T E M S
H O N E
ANIMAL DISPOSITION SUMMARY
ANTMALS INITIALLY IN STUDY 50 50 NATURAL DEATHS 10 MORIBUND SACRIFICE SCHEDULED SACRIFICE ACCIDENTALLY KILLED TERMINAL SACRIFICE 40 ANIMAL MISSING 2 AMIMAL DELETED (WRONG SEX)
9 INCLUDES AOTOLYZEB ANIMALS
T U M O R S U M M A R Y
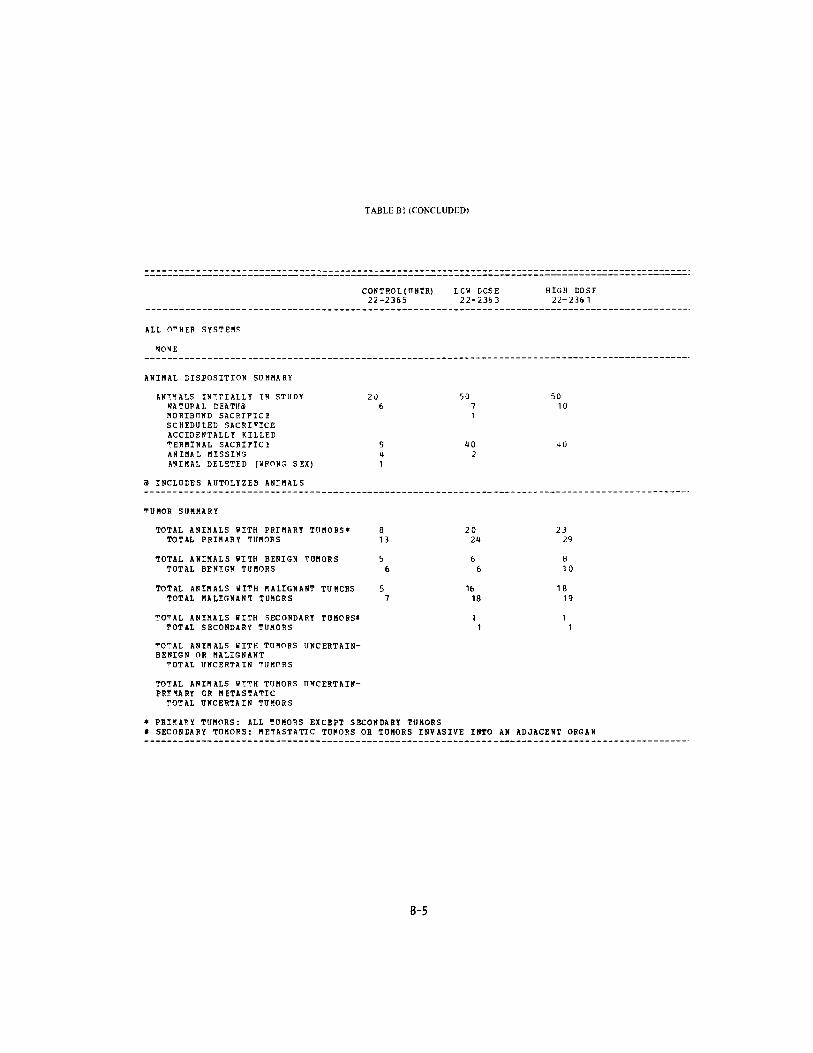
TOTAL A N I M A L S HITH P R I M A R Y T U M O R S * 8 20 23 TOTAL P R I M A R Y T U M O R S 13 21 29
TOTAL A N I M A L S HITH BENIGN T U M O R S 5 6 8 TOTAL B E N I G N T U M O R S 6 6 10
TOTAL A N I M A L S H I T H M A L I G N A N T T U H C R S 5 16 18 TOTAL M A L I G N A N T T U M O R S 7 18 19
TO^AL A N I M A L S H I T H SECONDARY TUMORS* 1 1 TOTAL S E C O N D A R Y T U M O R S 1 1
TOTAL A N I M A L S H I T H T U M O R S U N C E R T A I N B E N I G N O R M A L I G N A N T
TOTAL U N C E R T A I N T U M O R S
TOTAL A N I M A L S W I T H TUMORS U N C E R T A I N P R I M A R Y OR M E T A S T A T I C
TOTAL U N C E R T A I N T U M O R S
* P R I M A R Y T U M O R S : ALL T U M O R S EXCEPT S E C O N D A R Y TOMORS * S E C O N D A R Y T U M O R S : METASTATIC T U H O R S OR TUMORS I N V A S I V E INTO AN ADJACENT O R G A N
B-5
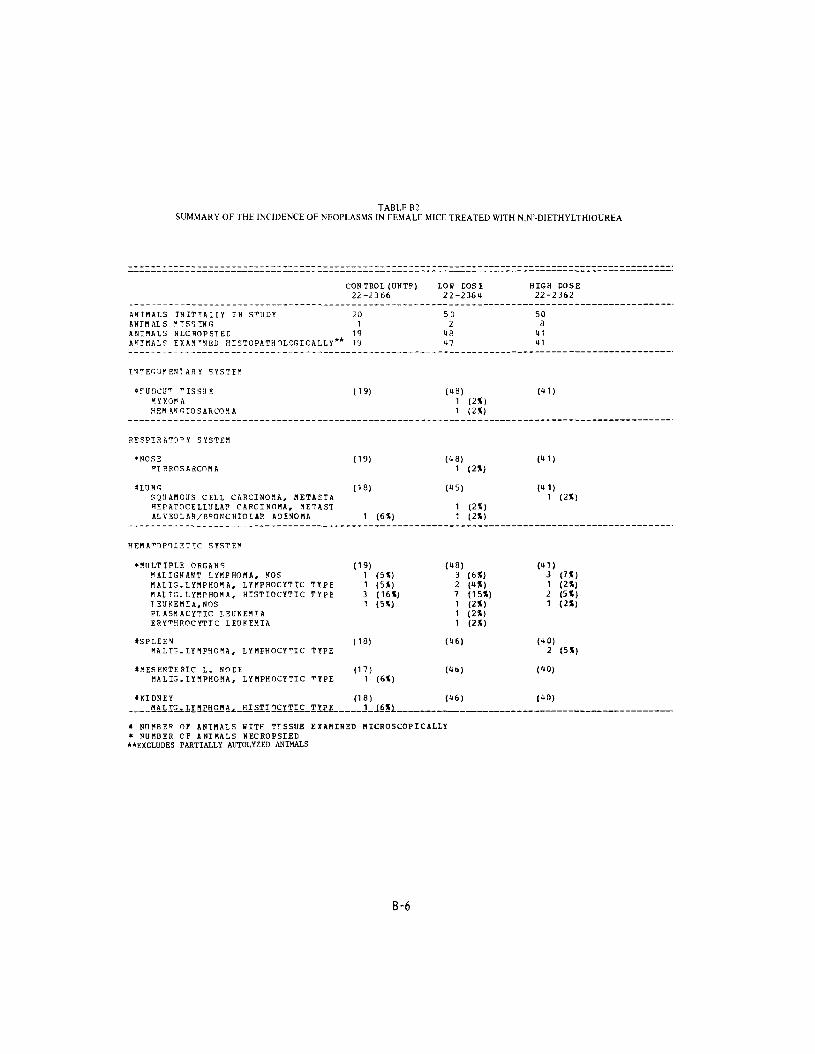
TABLE B2 SUMMARY OF THE INCIDENCE OF NEOPLASMS IN FEMALE MICE TREATED WITH N,N'-DIETHYLTHIOUREA
1:ONTROL ( U N T P ) L O U EOSI H I G H DOSE 22-2366 22-2364 22-2362
A N I M A L S I N I T I A L L Y I N S T U D Y 20 50 50 A N I M A L S P I S S I N G 1 2 8 A N I M A L S N E C R O P S T E E 19 48 U 1 A N I M A L ? E X A M I N E D H I S T O P A T H ^ L O G I C A L L Y * * V) 47 U 1
I N T E G U M E N T A R Y S Y S T E M
» ? U B C U T T I S S U E ( 1 9 ) (48) ( 4 1 ) 1 Y X O P A 1 (2*) H E M A N G I O S A R C O M A 1 ( 2 X )
R E S P I R A T O R Y S Y S T E M
*NOSE (19) ( U 8 ) (11) " I B R O S A 8 C O M A 1 (2%)
« LOU'S (18) (45) ( U 1 ) S Q U A M O U S C E L L C A R C I N O M A , M E T A S T A 1 ( 2 X ) H E P A T O C E L L U L A P C A R C I N O M A , M E T A S T 1 ( 2 % ) A L V E O L A R / B " O N C H I O L A R A D E N O M A 1 (6*) 1 ( 2 X )
H E M A ^ O P O I S T T C S Y S T E M
* M U L T I P L E O R G A N S (19) ( U S ) (11) M A L I G N A N T L Y M P H O M A , NOS 1 (5X) 3 (6X) 3 (7%) M A L I G . L Y M P H 0 1 A , L Y M P H O C Y T I C T Y P E 1 ( 5 X ) 2 (4X) 1 (2X) M A L I G . L Y M P H O M A , HISTIOCYTIC T Y P E 3 (16X) 7 (15*) 2 (5X) T E U K E K I A . N O S 1 (5*) 1 ( 2%) 1 ( 2 X ) P L A S M A C Y T I C L E U K E M I A 1 ( 2 X ) E R Y T H R O C Y T I C L E U K E M I A 1 ( 2 X )
I S P L E E N ( 1 8 ) ((16) ( 4 0 ) M A L T G . L Y M P H O M A , L Y M P H O C Y T I C T Y P E 2 ( 5 X )
* M E S E N T E R I C L . N O D E (17) (46) (40) M A L I G . L Y P I P H O H A , L Y M P H O C Y T I C T Y P E 1 (6*)
• KIDNEY (18) (46) (40) M A L I G . L Y M P H O M A . HISTIOCYTIC_TTPE J_J6?1
* N U M B E R O F A N I M A L S W I T H TISSUE E X A M I N E D MICROSCOPICALLY * N U M B E R O F A N I M A L S NECROPSIED **EXCLUDES PARTIALLY AUTOLYZED ANIMALS
B-6
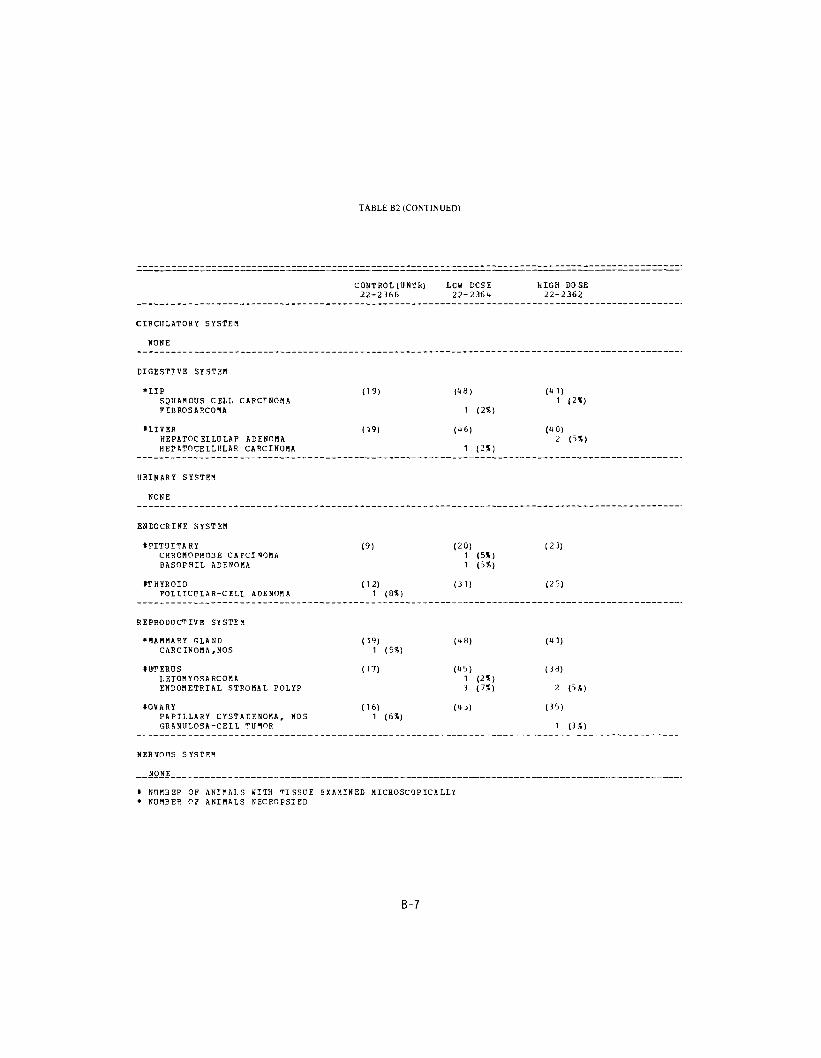
TABLE B2 (CONTINUED)
CONTROL ( U N T R )22-2366
LCH ECSE 22-2361
HIGH DOSE 22-2362
CIRCULATORY SYSTEM
NONE
DIGESTIVE SYSTEM
*IIP (19) (U8) (11) SQUAMOUS CELL CARCINOMA 1 (2X) FIBROSARCOMA 1 (2%)
• LIVER (19) (16) (1C) H E P A T O C E L L U L A P A D E N O M A 2 ( 5 X ) H E P A T O C E L L O L A R C A R C I N O M A 1 ( 2 X )
U R I N A R Y S Y S T E M
N O N E
E N D O C R I N E S Y S T E M
t P I T U I T A R Y (9 ) ( 2 0 ) (23) C H R O M O P H O B E C A P C I N O M A 1 (5X) B A S O P H I L A D E N O M A 1 (5X)
I T H Y R O I D (12 ) (31) (25) FOUICtJLAR-CELL A D E N O M A 1 (8*)
R E P R O D U C T I V E S Y S T E M
" M A M M A R Y G L A N D (19) ( U 8 ) (11) C A R C I N O M A , N O S 1 (5%)
*UTERUS (17) (15) (38) LEIOMYOSARCOMA 1 (2*) ENDOMETRIAL STROMAL POLYP 3 (7%) 2 (5*)
IOVARY ( 1 6 ) (13) (35) PAPILLARY CYSTADENOMA. NOS 1 (6*) GRANULOSA-CELL TUMOR 1 (3* )
N E R V O U S S Y S T E M
N O N E
* N U M B E R O F A N I M A L S W I T H T I S S U E E X A M I N E D M I C R O S C O P I C A L L Y * N U M B E R O F A N I M A L S N E C R O P S I E D

TABLE B2 (CONTINUED)
CONTROL ( O N T R ) LCW DCSE HIGH 00 SE 22-2366 22-2364 22-2362
S P E C I A L S E N S E O R G A N S
N O N E
M I J S C U L O S K E L E T A L SYSTEM
NONE
BODY CAVITIES
* A B D O M I N A L H A L L (19) (U8) (41) F I B H O S A R C O M A 1 (2%)
ALL OTHER S Y S T E M S
N O N E
A N I M A L DISPOSITION S U M M A R Y
A N I M A L S I N I T I A L L Y IN STUDY 20 50 50 N A T U R A L DEATHS U 12 6 M O R I B U N D SACRIFICE 1 3 6 S C H E D U L E D SACRIFICE A C C I D E N T A L L Y K I L L E D T E R M I N A L S A C R I F I C E 11 33 30 A N I M A L MISSING 1 2 8
l_If iCLUDES_AUTQLYZED_ANI«&.LS_
t N U M B E R OF A N I M A L S W I T H TISSUE E X A M I N E D MICROSCOPICALLY * N U M B E R OF A N I M A L S NECROPSIED
B-8

TABLb B2 (CONCLUDtD)
C O N T R O L ( U M T S ) L O W D O S E H I G H DOSE 22-2366 2 2 - 2 3 6 U 22-2362
T U M O R S U B B A R Y
TOTAL A N I M A L S W I T H P B T B A S Y T U M O R S ' 1 1 23 15 T O T A L P R I B A R Y TU10BS 12 28 15
TOTAL A N I M A L S W I T H B E N I G N T U M O R S 3 6 14 TOTAL B E N T G N T U M O B S 3 6 U
T O T A L A N I B A L S W I T H M A L I G N A N T T U M O R S 9 19 10 T O T A L B A L T G N A N T T U M O O S 9 22 10
TOTAL ANIMALS WITH SECONDARY TUMORS* 1 1 TOTAL SECONDARY TUMORS . 1 1
TOTAL ANIBALS WITH TdBORS UNCEFTAINBENTGN OR MALIGNANT 1 TOTAL UNCERTAIN TUMORS 1
TOTAL ANIBALS WITH TUMORS UNCERTAINPRIMARY OR BITASTATIC "OTAL UNCERTAIN TUBORS
* PRIMARY TUTORS: AIL TUHORS EXCEPT SECONDARY TUMORS * SECONDARY TUMORS: BETASTATIC TUMORS OR TUMORS INVASIVE INTO AN ADJACENT ORGAN
B-9


APPENDIX C
•-SUMMARY OF THE INCIDENCE OF NONNEOPLASTIC LESIONS IN RATS TREATED WITH N,N'-DIETHYLTHIOUREA


TABLE Cl SUMMARY OF THE INCIDENCE OF NONNEOPLASTIC LESIONS IN MALE RATS
TREATED WITH N, N'-DIETHYLTHIOUREA
CONTROL (UNTE) LOU COS! HIGH DOSE 11-1365 11-1363 11-1361
A N I M A L S I N I T I A L L Y I N S T U D Y 2 0 50 50 A N I M A L S N E C R O P S I E E 2 0 50 50 A N I M A L S E X A M I N E D H I S ^ O P A T H O L O G I C A L L Y * * 2 0 50 50
SYSTEM
POKE
" E S P I R A T O H Y S Y S T E M
«TRACHEA (19) (44) (46) TNFLAMNATION, CHRONIC SUPPURATIV 1 (5%)
*L1IKT (20) (W8) (49) MINERALIZATION 1 (2%) ATELECTASIS 5 (10%) 3 (6%) CONGESTION, DOS 2 (10%) 8 (17%) 5 (10J) HEMORRHAGE 3 (15%) 7 (15%) 2 (4%) BROVCHOPNEUHONIA. ACUTE 1 (2%) PNEUMONIA, CHRONIC NURINE 4 (20%) 7 (15%) 10 (20%) GRANULOMA, FOREIGN BODY 1 (2%) PERIVASCULAR CUFFING 1 (2%) HYPERPLASIA, ADENOMATOUS 1 (5%) 2 (<•*)
HRHATOPOIETIC SYSTEM
I S P L E E N (19) (50) (48) HEHOSIEEROSIS 2 (4%) HEMATOPOIESIS 1 (5%) 1 (2*) MYEIOPOIESIS 1 (5%)
tMANDIBULAB L. NODS (17) (49) (44) HYPERPLASIA, LYMPHOID 1 (2%)
IMESENTEPIC L. NODI (17) (49) (44 ) INFLAMMATION, CHRONIC 1 (2%) DEPLETION
* N U M B E R OF A N I M A L S UITH TISSUE E X A M I N E D MICROSCOPICALLY * N U M B E R OF A N I H A L S NECROPSIED "EXCLUDES PARTIALLY AUTOLYZED ANIMALS
C-3

HYPERPLASIA, LYMPHOID
C I R C U L A T O R Y SYSTEM
• H E A R T T H R O M B U S , M U R A L
• M Y O C A R D I U M INFLAMMATION. ACU^E/CHRONIC I N F L A M M A T I O N , CHRONIC I N F L A M M A T I O N , C H R O N I C F O C A L FIBPOSIS FIBROSIS, FOCAL
* C O R O N A E Y A R T E R Y I N F L A M M A T I O N , C H R O N I C
D IGESTIVE S Y S T E M
tLIVEF CONGESTION, NOS I N F L A M M A T I O N , FOCAL I N F L A M M A T I O N , C H R O N I C F O C A L C H O L A N G I O F I B R O S I S D E G E N E R A T I O N , N O S D E G E N E R A T I O N , G R A N U L A R D E G E N E B A T I O N , H Y D R O P I C NECROSIS, NOS M E T A M O R P H O S I S FATTY CYTOPLASMIC VACUOLIZATION C L E A R - C E L L C H A N G E A N G I E C T A S I S
* E I L E DUCT H Y P E R P L A S I A , N O S
• P A N C R E A S A T R O P H Y . N O S ATROPHY, "OCAL
• P A N C R E A T I C A C I N U S A T R O P H Y , N O S
• S M A L L I N T E S T I N E I N F L A M M A T I O N . N O S
• N U M B E R O P A N I M A L S W I T H TISSUE* N U M B E R OF A N I M A L S NECROPSIED
TABLE Cl (CONTINUED)
CONTROL f U N T R ) LOU DOSE 11-1365 11-1363
1 (6X) 1 (2X)
(19) («7) 1 ( 2X)
(19) ( U 7 )
6 ( 3 2 X ) 8 (17%) 14 ( 2 1 % ) 12 (26%)
1 (2%)
(20) (50) 1 ( 2 X )
(20) (50) 1 (2X)
1 (5X) 1 < 2 X ) 1 ( 2 X ) 1 ( 2 X )
1 ( 2 % )
1 (5S) 3 (6X) 1 (2X)
(20) (50) 6 (30X) 7 (1UX)
(19) ( U 9 ) 1 (5%) 1 (5X) 1 (2X)
(19) ( U 9 ) 2 (11*) 1 ( 2 X )
(19) (49) 1 J5X1
E X A M I N E D M I C R O S C O P I C A L L Y
H I G H 11-1
1
(«9)
( U 9 ) 1 1 7
1 1
(50)
(50)
2 1
1 2
1 1
(50) 2U
( U S )
( U 8 )
( U S )
DOSE ,361
< 2 X )
(2X) ( 2 X ) ( 1 4 X ) U 2 X )
(»«) ( 2 X )
( 2 X ) C»X)
< 2 X ) (2*)
(48X)
C-4

TABLE Cl (CONTINUED)
CONTROL (ONTB) LCH ECSE 11-1365 11-1363
IPEYERS P A T C H (19) ,«, H Y P E R P L A S I A , L Y M P H O I D 1 (5X)
•COLON (20) (48) " A R A S I T I S M 7 (15X)
U R I N A R Y S Y S T E M
• K I D N E Y (20) (50) H Y D R O N E P H R O S I S CONGESTION, ACUTE 1 (5X) I N F L A M M A T I O N , N O S 1 (2X) I N F L A M M A T I O N , C H R O N I C 2 (1 OX) 8 (16X) N E P H P O P A T H Y N E P H P O P A T H Y , TOXIC 4 (2 OX) 9 (18X) H Y P E R P L A S I A , T U B U L A R CELL
• K I D N E Y / C O R T E X (20) (50) CYST, NOS 1 (2X)
• U E I H A P Y B L A D D E R (18) (41) C A L C U L U S , NOS 1 (6X)
ENDOCRINE SYSTEM
• P I T U I T A R Y (17) (46) C O N G E S T I O N , NOS 2 ( 4 X ) H E M O R P H A G I C CYST
• A D R E N A L (18) (50) C O N G E S T I O N , NOS H E n O P S H J G I C C Y S T 1 (2%) C Y T O P L A S M I C V A C U O L I Z A T I O N
• A D R E N A L CORTEX (18) (50) M E T A M O R P H O S I S FATTY 1 < 2 X )
• T H Y R O I D (18) (45) F O L L I C U L A R C Y S T , N O S 1 ( 2 X ) A " R O P h Y , N O S H Y P E P P L A S I A , C-CELL 2 (4X) H Y P E P P L A S I A , F O L L I C U L A R - C E L L
* NUMBER OF ANIMALS WI"H TISSUE EXAMINED MICROSCOPICALLY * NUMBER OF ANIMAL^ NECPOPSIED
HIGH D3SE 11-1361
(48) 1 < 2 X )
(49) 12 (24X)
(50) 1 (2X)
15 (JOX) 1 (2X) 3 (6X) 1 (2X)
(50)
(.0)
(48)
1 ( 2 X )
(50)
2 (4X)
(50)
(48) 4 (8X) 1 (2X) 1 <2X)
C-5

»™HYROID FOLLICLEATROPHY, NOSHYPERPLASIA, CYSTIC
PEPRODUCTTVE SYSTEM
t P R O S T A T E .I N F L A M M A T I O N , G R A N U L O M A T O I J SH Y P E R P L A S I A , NOS
tTESTISA T R O P H Y , NOS
N E P V O I I S S Y S T E M
* B R A I NH E M A T O M A , NOS
SPECIAL SENSE ORGANS
NONE
BUSCtJLOSKELETAL SYSTEM
NONE
BODY CAVITIES
*ABDOBINAL CAVITYINFLAMMATION, MO S
ALL OTHER SYSTEMS
*MULTIPLE ORGANSL E U K O C Y T O S I S , NOS
ADIPOSE TISSUE I N F L A M M A T I O N I . _ G R i N D L g M A T p U S J
* N D K B E R OF A N I M A L S W I T H TISSUE* N U M B E R OF A N I M A L S NECEOPSIED
TABLECl (CONTINUED)
C O N T R O L ( U N T R ) L C H CCSI HIGH DOSE 11-1365 11-1363 11-1361
(18) (45)6 (13JS)1 (2%)
(US) 6 (13*) 5 (1 OX)
( 1 7 ) ( 4 4 ) (50) 1 (2*)
1 ( 2 X )
(20) (49) (50) 2 ( 1 0 % ) 7 ( 1 4 X )
(19) (49 ) (49) 1 (2%)
(20) (50) (50) 1 (5S)
(20) (50) (50) 1 ( 2 X )
1
E X A M I N E D M I C R O S C O P I C A L L Y
C-6

TABLE Cl (CONCLUDED)
CONTROL ( U N T R ) L C H DCSE H I G H DOSE 11-1365 11-1363 11-1361
SPECTAl MORPHOLOGY S U M M A R Y
N O L E S I O N R E P O P T E D
» N U M B E R O F A N I M A L S W I T H TISSUE E X A M I N E D MIC80SCOPICALLY * N U M B E R O F A N I M A L S N E C E O P S I E D
C-7

TABLE C2 SUMMARY OF THE INCIDENCE OF NONNEOPLASTIC LESIONS IN FEMALE RATS
TREATED WITH N,N'-DIETHYLTHIOUREA
A N I M A L S I N I T I A L L Y I N STUDY ANIMALS MISSING A N I M A L S N E C R O P S I E D A N I M A L S E X A M I N E D HISTOPATHOLOGICA LLY **
I N T E G U M E N T A R Y SYSTEM
• SKIN D E R H A I INCLUSION CYST
R E S P I R A T O F Y S Y S T E M
f " P A C H E A I N F L A M M A T I O N , N O S I N F L A M M A T I O N , S U P P U R A T I V E I N F L A M M A T I O N , C H R O N I C S U P P O R A T I V
*LUNG A T E L E C T A S I S T H R O M B O S I S , NOS CONGESTION, NOS E D E M A , NOS H E M O R R H A G E B R O N C H O P N E U M O N I A , NOS I N F L A M M A T I O N , I N T E R S T I T I A L P N E U M O N I A , C H P O N I C MUP.INE B ^ O N C H O P N E U M O N I A , C H R O N I C P Y P E B P L A S I A , A D E N O M A T O U S
H E M A T O P O I E T I C S Y S T E M
*EPT.EEN P I G M E N T A T I O N , N O S HEMOSIDE"OSTS H E N A T O P O I E S I S
* M E ? E N T E R I C L . N O D E H Y P E R P L A S I A , DIFFUSE
CONTROL ( U N T R ) 11-1366
20
20 20
(20)
(19) 3 (16X)
(20) 3 ( 1 5 % )
5 (25%)
2 ( 1 0 X )
6 (30*)
1 (5%)
(20)
2 (10*) 3 ( 1 5 % )
(18)
LOW DOSI 1 1 - 1 36 4
50
50 50
(50)
(45) 1 (2%) 1 ( 2 X ) 1 ( 2 X )
(49) 4 (8X) 1 < 2 X ) 6 (12X) 1 ( 2 X ) 3 ( 6 X )
7 (14*)
1 ( 2 X )
(49 )
5 (10*) 4 (8*)
(50)
I N U M B E P O F A N I M A L S W I T H TISSUE E X A M I N E D M I C R O S C O P I C A L L Y * N U M B E R OF A N I M A L S N E C R O P S I E D
**EXCLUDES PARTIALLY AUTOLYZED ANIMALS
HIGH DOSE 11-1362
50 1
49 49
(49) 1 (2X)
(46)
1 ( 2 X )
(49) 2 (4X)
1 (2*)
1 ( 2 X ) 1 ( 2 X ) 1 < 2 X )
13 ( 2 7 X ) 1 < 2 X ) 2 < 4 X )
(48) 1 ( 2 X ) 4 (8X) 2 ( 4 X )
(47) 1 [2*1
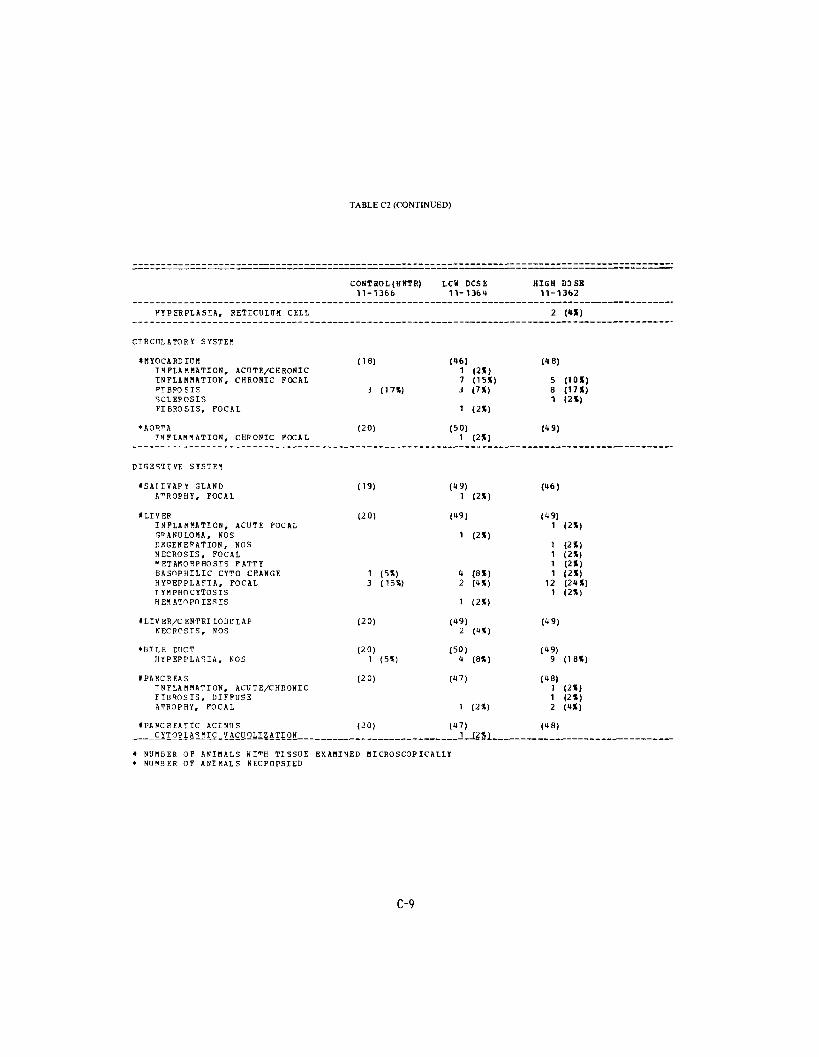
TABLE C2 (CONTINUED)
P Y P E R P L A S I A , R E T I C U L U H CELL
C I R C U L A T O R Y SYSTEM
* M Y O C A R D I U N I N F L A M M A T I O N , ACUTE/CHRONIC I N F L A M M A T I O N , C H R O M I C FOCAL TBPOSIS SCLEPOSIS FIBROSIS, F O C A L
"AOTA I N F L A M M A T I O N , C H R O N I C FOCAL
D I G E S T I V E S Y S T E M
* S A I I V A P Y G L A N D A " R O P H Y , FOCAL
# L I V E P I N F L A M M A T I O N , A C U T E FOCAL G » A N U L O N A , N O S D E G E N E R A T I O N , N O S N E C R O S I S , FOCAL M E T A M O R P H O S I S F A T T Y B A S n P H I L I C CYTO C H A N G E H Y O E P P L A S I A , FOCAL I Y M P H O C Y T O S I S H E M A T O P O I E S I S
I L I V E R / C E N T R I L O B U L A P N E C R O S I S , NOS
*BIT,E EUCT H Y P E P P L A S I A , N O S
t P A N C R E A S T N F L A M M A T I O N . A C U T E / C H R O N I C F I B R O S I S , D I F F U S E A T R O P H Y , F O C A L
I P A N C R Z A T I C A C I N U S C Y T O P L A S M I C V A C U O L I Z A T I ON
t N U M B E R O F A N I M A L S U I ^ H TISSUE* N U M B E R O F A N I M A L S NECPOPSIED
HIGH DDSE 11-1362
2 (»X)
(48)
5 (10X) 8 (17X) 1 <2X)
(49)
(46)
(49) 1 <2X)
1 (2X) 1 (2X) 1 < 2 X ) 1 (2X)
12 (24X) 1 ( 2 % )
(49)
(49) 9 ( 1 8 % )
(48) 1 (2X) 1 (2 X) 2 (4X)
(48)
CONTBOL(OHTR) 11-1366
(18)
3 (17X)
(20)
(19)
(20)
1 ( 5X) 3 (15*)
(20)
(20 ) 1 (5%)
(20)
(20)
E X A M I N E D M I C R O S C O P I C A L L Y
LCD DOSE 11-1364
(46) 1 < 2 X ) 7 (15X) 3 (7X)
' < 2 X )
(50) 1 (2X)
(19) 1 < 2 X )
(49)
1 ( 2 X )
4 (8%) 2 ( 4 X )
1 (2X)
(49) 2 ( 4 X )
(50) 4 (8X)
(47)
1 ( 2 X )
(47) 1 ( 2 X )
C-9

•PEYEPS PATCH HYPERPLASIA,
tlLEUH HYPEPPLASIA,
•COLON PARASITISM HYPERPLASIA,
U R I N A R Y SYSTEt l
• K I D N E Y I N F L A M M A T I O N ,I N F L A M M A T I O N ,I N F L A M M A T I O N ,N E P H R O P A T H Y ,
LYMPHOID
LYPPHOID
LYMPHOID
CHRONIC C H P O N I C FOCAL G P A N U L O P I A T O U S
T O X I C N E P H R O S I S , C H O L E M I C T N F A R C T , NOS
E K D O C H I N E SYSTEB
t P I T U I T A P Y CYST. NOS H E M O P P H A G I C CYST H Y P E R P L A S I A , C H F O M O P H O B E - C E L L
*ADPENAL HEMORRHAGIC CYST LIPOIDOSIS CYTOPLASHIC VACOOIIZATION ANGIECTASIS
• A D R E N A L CORTEX METAMORPHOSIS FATTY
•THYROID FOLLICIJLAP CYST, SOS I N F L A M M A T I O N , ACDTE FOCAL A T R O P H Y , NOS H Y P E R P L A S I A , CYSTIC
__ H Y P E R P L A S I A . C-CELL
TABLE C2 (CONTINUED)
CONTROL (U NT R) 11-1366
(19)
(19)
(19) 5 (26*)
(20) 5 (25*)
(18) 3 (17X) 1 (6X)
(20) 1 (5X) 1 (5X)
(20)
(18)
1 (6*)
LCK ECSE 11-1364
(49)
(49)
(19) It <8X)
(50) 5 (10X)
4 (8X)
1 ( 2 X )
(47) 1 <2X) 1 <2X) 1 (2X)
(49)
2 (4X) 4 (8X) 2 (4*)
(49) 1 (2X)
(46) 3 (7X)
HIGH DOSE 11 -1362
(48) 1 (2X)
(48) 1 <2X)
(47) 5 (11X) 1 (2X)
(49) 17 (35X)
1 ( 2 X ) 1 ( 2 X ) 3 ( 6X) 1 ( 2 X )
(45)
1 (2X)
(48)
2 (4X)
(48)
(46) 1 <2X)
1 (2*) 1 <2X) 6 113X)
* NUMBER OF ANIMALS WITH TISSUE EXAMINED MICROSCOPICALLY * NUMBER OF ANIMALS NECPOPSIED
C-10

TABLE C2 (CONTINUED)
C O N T R O L ( U N T R ) L O U DCSE 11-1366 11-136U
H Y O O I D F O L L I C L E (18) ( 4 6 ) A T R O P H Y , N O S 3 (7X) H Y P E R P L A S I A , CYSTIC 1 (2X) H Y P E P P L A S I A , & D E N O H A T O U S
R E P R O D U C T I V E S Y S T E M
* M A r » ! A R Y G L A N D (20) (50) D I L A T A T I O N / D U C T S 1 (2X) C Y S T I C DUCTS 2 (4X) H Y P E S P L A S I A , N O S 1 (2X)
* N A M P 1 A R Y DUCT (20) (50) D I L A T A T I O N , N O S 1 <2X)
• U T E R U S (19) (U9) D I L A T A T I O N , HOS H E K O H P H A S E 2 («X) HEMAT0.1A, NOS 1 (5*) I N F L A M M A T I O N , NOS 1 (5%) N E C R O S I S , NOS 1 (5X) P O L Y P O I D H Y P E P P L A S I A 1 (5X)
H r E R U S / I N D O M I T R I U M (19) I N F L A M M A T I O N , NOS 2 (1 I X ) 2 («X) T N F L A M A T I O N . FOCAL I N F L A M M A T I O N , S U P P H P A T I V E 3 (1611) I N F L A M M A T I O N , C H R O N I C S U P P D R A T I V 2 (11X) " IBROSIS, D I F F U S E 1 (2X) H Y P E P P L A S I A , NOS 1 (5X) HYPERPLASIA, CYSTIC 2 (11%)
KUTEPUS/MYOMETRTUM (19) ABSCESS, NOS 1 (5X)
IOVARY (19) (09) CYST, NOS 1 (2X)
NEPVOUS SYSTEM
NONE
SPECIAL SENSE ORGANS
NONE
t NUMBER OF ANIMALS HITH TISSUE EXAMINED MICROSCOPICALLY * NUMBEP OF ANIMALS NECEOPSIED
HIGH DOSE 11-1362
(16)11 (21X)
<t (9*) 1 ( 2 X )
(19)
(18) 1 (2X)
1 (2X)
(18)
1 (2X) 1 (2X)
2 (IX)
(<t 8) 1 <2X)
(17)
C-ll

TABLE C2 (CONCLUDED)
CONTROL ( U N T R ) LOM BCSE H I G H DOSE U-1366 11-1364 11-1362
B U S C D L O S K E L E T A L S Y S T E M
NONE
BODY C A V I T I E S
NONE
ALL OTHEB S Y S T E M S
NONE
SPECIAL M O R P H O L O G Y S U M M A R Y
N O L E S I O N REPORTED 2 9 2 A N I H A L MISSING/NO NECROPSY 1
» N U M B E R O F A N I M A L S W I T H TISSUE E X A M I N E D M I C R O S C O P I C A L L Y * N O H B E P OF A N I M A L S NECROPSIED
C-12

APPENDIX D
SUMMARY OF THE INCIDENCE OF NONNEOPLASTIC LESIONS IN MICE TREATED WITH N,N'-DIETHYLTHIOUREA

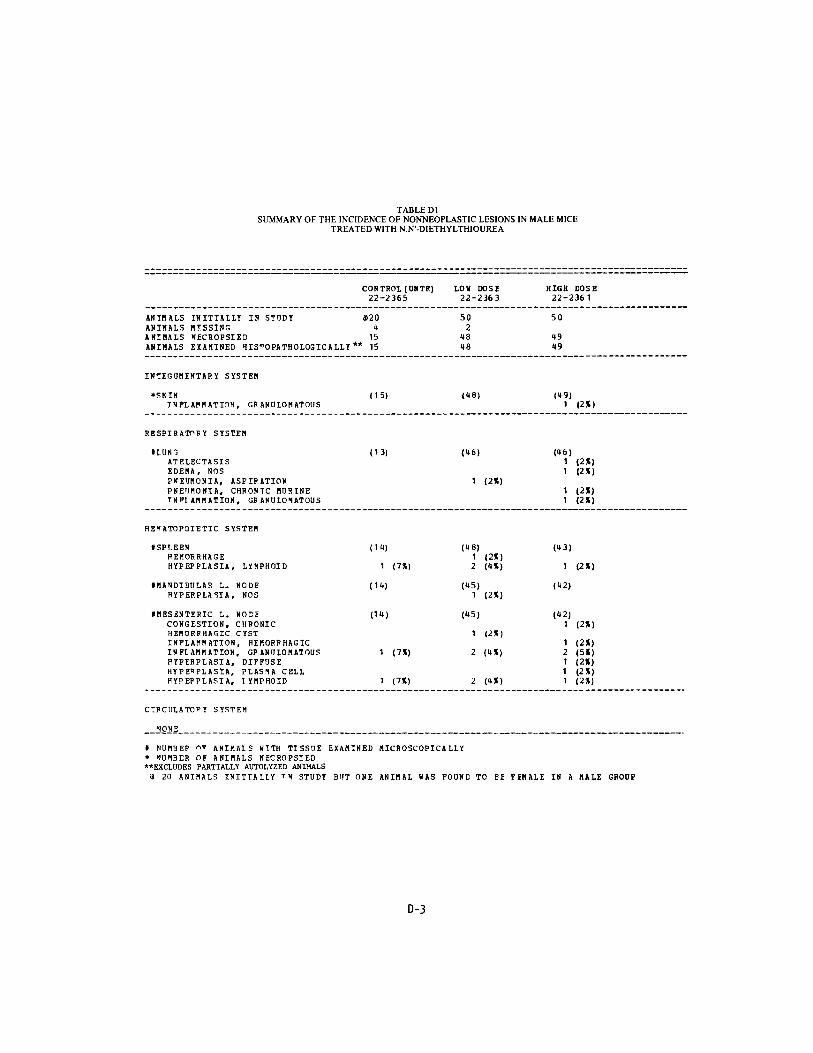
TABLE Dl SUMMARY OF THE INCIDENCE OF NONNEOPLASTIC LESIONS IN MALE MICE
TREATED WITH N,N'-DIETHYLTHIOUREA
CONTROL ( U N T R ) LOW DOS! HIGH DOSE 22-2365 22-2363 22-2361
A N I M A L S I N I T I A L L Y IN STUDY 820 50 50 A N I M A L S MISSING It 2 A N I M A L S N E C R O P S I E D 15 48 49 A N I M A L S E X A M I N E D H I S T O P A T H O L O S I C A L L Y * * 15 <48 49
INTEGUMENTARY SYSTEM
*SKIN (15 ) (48) (49) I N F L A M M A T I O N , GR A N t J L O M ATOUS < 2 X )
R E S P I R A T O R Y SYSTEM
* L U N G (13) (46) (46) ATELECTASIS 1 (2X) EDEMA, NOS 1 (2%) PNEUMONIA, ASPIRATION < 2 X ) PNEUMONIA. CHRONIC MUSINE TNPIAMNATION, GRANULOIATOUS 1 (2X)
HEMATOPOIETIC SYSTEM
tSPLEEN (14) (48) (43) H E M O R R H A G E 1 (2X> H Y P E P P L A S I A , L Y M P H O I D 1 (7%) 2 (4X) 1 (2»)
I M A N D I B U L A R L . N O D E ( 14 ) (45) (42) H Y P E R P L A S I A , N O S 1 (2%)
I M E S 2 N T E R I C L . N O E Z (14) (45) (42) CONGESTION, C H R O N I C 1 (2X) H E M O F S H A S I C CYST 1 ( 2 X ) I N F L A M M A T I O N , H E M O R R H A G I C 1 (2X) I N F L A M M A T I O N , GP A N U L O M A T O U S 1 (7%) 2 (4%) 2 (5*) H Y P E R P L A S I A , DIFFUSE 1 (2X) H Y P E ' P L A S I A , P L A S M A CELL 1 (2X) H Y P E P P L A S I A , I Y M P H O I D 1 (7X) 2 ( 4 % ) 1 (2X)
C I P C D L A T O I ' Y S Y S T E M
N O N E
« N U M B E R 0" A N I M A I S W I T H TISSUE E X A M I N E D M I C R O S C O P I C A L L Y * N U M B E R OF A N I M A L S N E C R O P S I E D "EXCLUDES PARTIALLY AUTOLYZED ANIMALS
« 20 A N I M A L S I N I T I A L L Y T N STUDY BUT ONE A N I M A L WAS F O U N D TO BI F E M A L E IN A M A L E GROUP
0-3

TABLE Dl (CONTINUED)
CONTROL ( O N T R ) LOU DOSE H I G H D O S E 22-2365 22-2J63 22-2361
DIGESTIVE S Y S T E M
tUVEP (<48) («9) C Y S T , NOS H S M O P R H A G I C CYST I N F L A M M A T I O N , N O S D E G E N E R A T I O N , G R A N t l L A R DEGENERATION, HYDROPIC
1 1111
(2%) ( 2 X ) (2%) ( 2 X ) (2*) (2%)
TNFARCT, NOS A M Y L O I D O S I S
i (7X) 1 ( 2 X )
M E T A M O R P H O S I S F A T T Y 2 ( I X ) N U C L E A R E N L A R G E M E N T 1 ( 2 X > H Y P E R P L A S I A , N O S 1 ( 2 X ) H Y P E P P L A S I A , DIFFUSE 1 (2S) H Y P E P P L A S I A , PETICULU1 CELL 1 ( 2 X )
I L I V E R / H E P A T O C Y T E S (11) (18) (19) BASOPHILIC CYTO C H A N G E 1 ( 2 X ) H Y P E R P L A S I A , D I F F U S E 2 ( I X )
I E U O D E N U M (15) (16) (17) A M Y L O I E O S I S 1 ( 2 % )
I ILEUM (15) (16) (17) FIBROSIS 1 ( 2 X )
ICOLON (15) (17) (16) N E M A T O D I A S I S 1 ( 2 7 X ) 3 ( 6 X )
URINARY SYSTEM
«KIDNEY (11) (U8) (47) H Y D R O N E P H R O S I S 1 (2X) 1 (2X) P Y E L O N E P H R I T I S , CHRONIC 1 (2X) FIBROSIS, FOCAL 1 (2X)
ENDOCRINE SYSTEM
NONE
REPRODUCTIVE SYSTEM
NONE
* N U M B E R OF A N I M A L S W I T H TISSUE E X A M I N E D M I C R O S C O P I C A L L Y * N U M B E R OF A N I M A L S NECROPSIED
D-4

TABLE Dl (CONCLUDED)
C O N T R O L ( U N T S )22-2365
L C U D O S E 22-2363
H I G H DOSE 22-2361
NEPVO'lS S Y S T E M
* B P A T NC Y T 9 P L A S M T C V A C t l O L T Z A T I O N
(15) ( U 7 ) (46) 1 (2*)
SPECTAL 'ENSE ORGANS
NONE
HUSCHLOSKLLETAL SYSTEM
* l A " Y N f i E A L M U S C L EO A P A S I T I S M
( 1 5 ) (18) 1 (2X)
(1*9)
B O D Y C A V I T I E S
N O N E
ALL OTHER SYSTEMS
* MULTIPLE ORGANSAMYLOIDOSIS
(15)1 (7)5) (18) (49)
SOECTAL MORPHOLOGY SUMMARY
NO LESION REPOFTED 3 15ANIMAL MISSING/NO NECROPSY 4 2 AUTO/NECPOPSY/HISTO PERF 1AUTOLYSIS/NO NECROPSY
» NUMBER OF ANIMALS WITH TISSUE EXAMINED MICROSCOPICALLY * NUMBER OF ANIMALS NECPOPSIED
15
1 1
D-5

TABLE D2 SUMMARY OF THE INCIDENCE OF NONNEOPLASTIC LESIONS IN FEMALE MICE
TREATED WITH N,N'-DIETHYLTHIOUREA
CONTROL (UNTR)22-2366
LOU EOS I 22-2364
HIGH DOSE 22-2362
A N I M A L S I N I T I A L L Y IN S T U D YA N I M A L S H I S S I N GANIBALS NECEOPSIEDA N I B A L S E X A H I N E D H I S T O P A T H O L O G I C A L L Y
20 1
19 19
50 2 48 47
50 8
1*1 41
I N T E G U M E N T A R Y S Y S T E M
NONE
R E S P I B A T O P Y SYSTEM
I L U N GA ^ E L E C T A S I SC O N G E S T I O N , NOSP N E U M O N I A , CHRONIC M U R I N ET I F L A M M A T I O N , C H R O N I CI N F L A M M A T I O N , G E A N O L O M A T O U S
(18)
2 (1 1X)
(45)2 (4*)1 ( 2 X )2 ( 4 X )1 (2*) 2 ( 4 X )
(41) 2 (5*) 2 (5*) 2 (5*)
HEMATOPOIETIC SYSTEM
IBONE M A B P O WHYPERPLASIA. GRANULOCYTIC
(19) (44) (39) 2 (5X)
ISPLEENCONGESTION, CHPONICINFARCT, NOSH Y P E R P L A S I A , NOSHYPERPLASIA, RETICULUMH Y P E R P L A S I A , L Y M P H O I DH E M A T O P O I E S I S
CELL
(18)
1 (6X) 1 (6*)
1 ( 6 X )
(46)
1 (2X) 1 (2*) 1 (2») 2 (4%)
1 ( 2 X )
(40) 1 (3%)
3 (8X)
f S P L E N T C FOLLICLESH Y P E P P L A S I A , P E T I C U L U M CELL
(18) (46) 1 (2%)
(40)
* M A N D I B O L A H L . N O D EH Y P E P P L A S I A , RETICULU1H Y P E F P L A S I A , L Y M P H O I D
CELL (17)
1 ( 6 % ) ( 4 6 )
3 ( 7 X )
(40)
*MESENTERIC L. NODEC O N G E STIONi_CH£ONIC
(17) (46) (40) J_JJJl_
» N U M B E R O F A N I M A L S WITH TISSUE E X A M I N E D* N U M B E H OF A N I M A L S NECROPSIED "EXCLUDES PARTIALLY AUTOLYZED ANIMALS
M I C R O S C O P I C A L L Y
D-6

INFLAMMATION, CHRONICINFLAMMATION, GRANOLONATOUSPIGMENTATION, NOSHYPERPLASIA, EETICULUM CELLHYPERPLASIA, LYMPHOID
CIRCULATORY SYSTEM
NONE
DIGESTIVE SYSTEM
tLIVERINFLAMMATION, DIFFUSEINFLAMMATION, SUPPUEATIVEFIBEOSIS, FOCALDEGENEPATION, GRANULARDEGENERATION, HYDROPICMETAMORPHOSIS FATTYHYPEPPLASIA, DIFFUSE
tLIVER/PERIPORTAII N F L A M M A T I O N , G R A N U L O M A T O U S"IBPOSIS
* L I V E P / H E P A T O C Y T E SH Y P E R P L A S I A , NOS
• P A N C R E A SA T R O P H Y , NOS
* E M A L L I N T E S T I N EH Y P E R P L A S I A , L Y M P H O I D
tPEYESS PATCHH Y P E R P L A S I A , R E T I C U L U M CELL
• COLONN EM A1* 0 C I A SISP A R A S I T I S M
U R I N A P Y S Y S T E M
* NIJ13ER OF A N I M A L S W I^H TISSUE» N U M B E R 0 " A N I M A L S N E C E O P S I E D
TABLE D2 (CONTINUED)
CONTROL ( U H T R )22-2366
LCH DCSE 22-2361
HIGH DOSE 22-2362
1 (3X) 1 (2X) 1 (3X)
1 (3X) 2 (12X) 1 (3X)
1 (2X) 2 (5X)
(19) (46) (40) 1 (2X)
1 (3X) 1 (3X)
1 (5X) 1 (5%) 1 (2X) 1 (3X)
2 (4X) 1 (3X) 1 (3X)
(19) (46) (40) 1 (3X)
1 (5X)
(19) (46) (40) 2 ( 4 X )
(18) (44) (40) 1 ( 6 X )
( 1 7 ) (43) (J9) 1 ( 2 X )
(17) (43) (39) 1 ( 6 X )
( 1 8 ) (42 ) (39) 1 ( 2 X ) 1 (3X) 1 ( 2 X )
(40)
E X A M I N E D M I C R O S C O P I C A L L Y
D-7
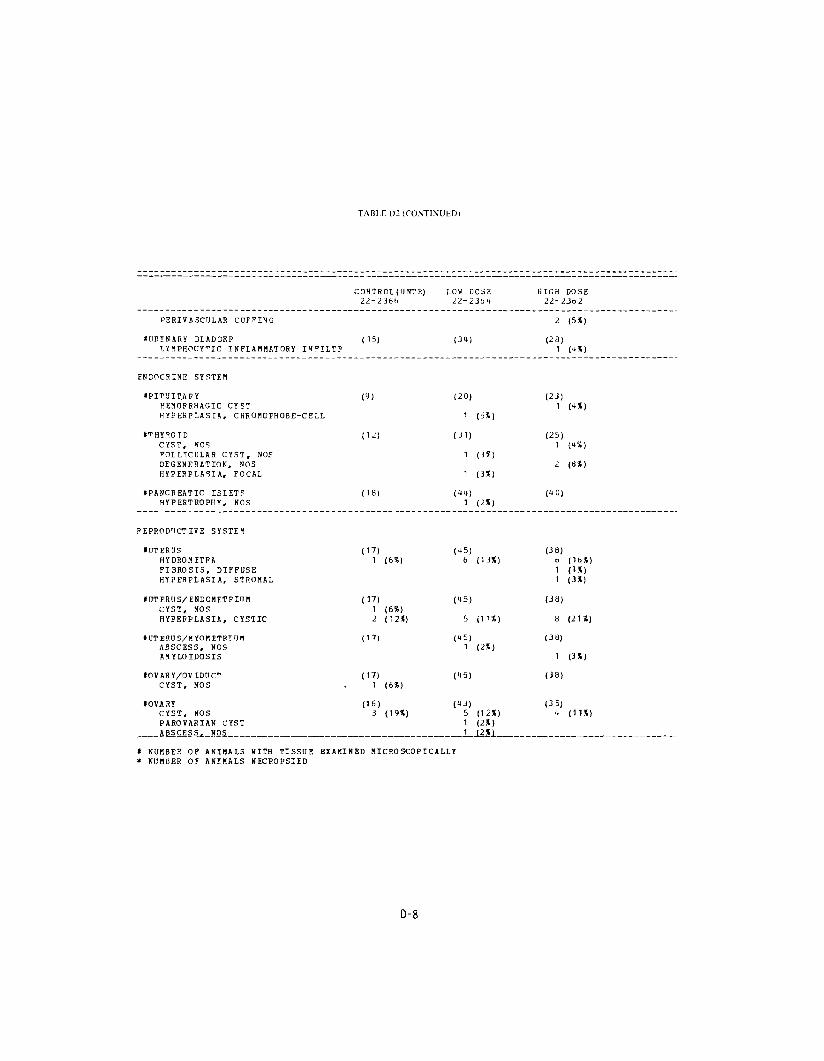
TABLE D2 (CONTINUED)
H I G H DOSE 22-23D2
2 ( 5 % )
(28)
(23) 1 < K % )
(25) 1 ( K % )
2 ( 8 % )
(10)
(38)
1 (3%)
(38)
8 (2 I X )
(38)
1 ( 3 % )
(38)
(35) 1 ( 1 1 % )
P E R I V A S C U L A R C U P P I N G
I U F I M A R Y B L A D D E PL Y B P H O C Y T I C I N F L A B B A T O R Y I V P I L T P
E N D O C R I N E S Y S T E M
• P I T U I T . A P YH E P I O P R H A G I C C Y S T H Y P E E P L A S I A , C H R O M O P H O B E - C E L L
C Y S T , NOS P O L L T C U L A R C Y S T , N O E D E G E N E R A T I O N , NOS H Y P E S P L A S I A , F O C A L
• P A N C R E A T I C ISLETSH Y P E R T R O P H Y , N O S
R E P R O D U C T I V E SYSTE1
f U T E R U SH Y D R O N E T P AF IBROSIS , D I F F U S E H Y P E R P L A S I A , S T R O M A L
t U T E R U S / E N D O M E T P I U MCYST, NOSH Y P E F P L A S I A , CYSTIC
( H J T E R U S / H Y O M E T R I U NA B S C E S S , NOS A H Y L O I D O S I S
• O V A R Y / O V I D U C TC Y S T , NOS
t O V A H YC Y S T , NOSP A R O V A R I A N CYST ABSCESS. NOS
C O N T R C L ( U N T R ) 22-236b
(15)
(9)
( 1 8 )
(17) 1 ( 6 % )
(17) 1 (6X) 2 ( 1 2 K )
( 1 7 )
(17) , 1 (6%)
( 1 6 ) 3 ( 1 9 % )
L O U D O S E 22-236U
(31)
(20)
1 ( 5%)
1 ( 3 % )
1 (3%)
( K K ) 1 ( 2 % )
( K 5 ) 6 (13%)
(15)
5 (11*1
(45) 1 (2*)
(15,
( K J ) 5 ( 1 2 % ) 1 (2*)
» NUMBER OF ANIMALS WITH TISSDE EXAHINED MICROSCOPICALLY * NOBBER 01 ANIMALS NECFOPSIED
0-8

TABLh D2 (CONCLUDED)
C O N T R O L ( U N T R ) L O W DOSE H I G H DOSE 22-2366 22-2J64 22-2362
N E R V O U S S Y S T E 1
• B R A I N (19 ) (UU) (38) C O R O O P A A M Y L A C E A 1 < 5 X )
S P E C T A L S E N S E O R G A N S
N O N E
M U S C U L O S K E L E T A L S Y S T E M
N O N E
BODY CAVITIES
•MESENTERY (19) (18) (t 1) STEATITIS 1 (2%)
ALL nTHEP SYSTEMS
NONE
SPECIAL HOPPHOLOGY SUMMARY
NO LESION REPORTED 1 5 5 ANIMAL MISSING/NO NECROPSY 1 2 8 A'JTO/NECROPSY/HISTO PERP 1 1 1 AIITO/NECROPSY/NO HISTO 1 AUTOLYSIS/NO NECROPSY 1
# NUMBER OF ANIMALS WI"-H TISSUE EXAMINED MICROSCOPICALLY * NUMBER OF ANIMALS NECEOPSIED
D-9


Review of the Bioassay of N,N'-Diethylthiourea* for Carcinogenicity by the Data Evaluation/Risk Assessment Subgroup of the
Clearinghouse on Environmental Carcinogens
August 31, 1978
The Clearinghouse on Environmental Carcinogens was established in May, 1976, in compliance with DREW Committee Regulations and the Provisions of the Federal Advisory Committee Act. The purpose of the Clearinghouse is to advise the Director of the National Cancer Institute (NCI) on its bioassay program to identify and to evaluate chemical carcinogens in the environment to which humans may be exposed. The members of the Clearinghouse have been drawn from academia, industry, organized labor, public interest groups, State health officials, and quasi-public health and research organizations. Members have been selected on the basis of their experience in carcinogenesis or related fields and, collectively, provide expertise in chemistry, biochemistry, biostatistics, toxicology, pathology, and epidemiology. Representatives of various Governmental agencies participate as ad hoc members. The Data Evaluation/Risk Assessment Subgroup of the Clearinghouse is charged with the responsibility of providing a peer review of reports prepared on NCI-sponsored bioassays of chemicals studied for carcinogenicity. It is in this context that the below critique is given on the bioassay of N,N'-Diethylthiourea for carcinogenicity.
The primary reviewer agreed with the conclusion in the report that N,N'-Diethylthiourea was carcinogenic in both sexes of treated rats. After a brief description of the experimental design, she noted as shortcomings of the study: 1) the small number of matched controls; 2) the fact that other chemicals were under test in the same room in which this study was conducted; and 3) the treated animals may not have received a maximum tolerated dose, since a noticeable weight effect was not observed. Despite the shortcomings, she said that the study was still valid, although she questioned if the thyroid effect was sufficient evidence to regard N,N'-Diethylthiourea to be a carcinogen. The primary reviewer felt no statement could be made concerning the human risk posed by N,N'-Diethylthiourea.
A Program staff pathologist commented that C-cell tumors are the most common type of thyroid neoplasms in Fischer rats, occurring about three or four times more frequently than follicular-cell tumors.
A motion was approved unanimously that the report on the bioassay of N,N'-Diethylthiourea be accepted as written.
45

Members present were:
Arnold Brown (Chairman), University of Wisconsin Medical School Joseph Highland, Environmental Defense Fund Michael Shimkin, University of California at San Diego Louise Strong, University of Texas Health Sciences Center
Subsequent to this review, changes may have been made in the bioassay report either as a result of the review or other reasons. Thus, certain comments and criticisms reflected in the review may no longer be appropriate.
46 4 U S GOVERNMENT PRINTING OFFICE 1978— 2B1-217/326J


DHEW Publication No. (NIH) 79-1705