Embed Size (px)
Citation preview
BIOANALYTICAL APPLICATIONS OF AFFINITY-BASED NANOTUBE MEMBRANES FOR SENSING AND SEPARATIONS
By
HECTOR MARIO CAICEDO
A DISSERTATION PRESENTED TO THE GRADUATE SCHOOL OF THE UNIVERSITY OF FLORIDA IN PARTIAL FULFILLMENT
OF THE REQUIREMENTS FOR THE DEGREE OF DOCTOR OF PHILOSOPHY
UNIVERSITY OF FLORIDA
2008
1

© 2008 Héctor Mario Caicedo
2

To my parents Herlinda and Luis, my wife Jessica, and my daughter Isabela
3

ACKNOWLEDGMENTS
I would like to thank my Ph.D. advisor, Dr. Charles R. Martin for supporting my work, and
for all his lessons on becoming a more effective scientist.
I would like to express a very special gratitude to Dr. Jim Deyrup for his tremendous help
and encouragement when I started pursuing my Ph.D.
I would also like to thank Dr. Nicolo Omenetto for being part of my committee, for his
invaluable time and discussions about my research work, and for his contagious enthusiasm for
science.
I would like to thank Dr. Amelia Dempere, Dr. David Powell, and Dr. Thomas Lyons for
serving on my graduate committee and for their time, feedback, and willingness to proofread this
dissertation.
I am very grateful to Dr. Myungchan Kang, former postdoc in the Martin group, with who
I had the opportunity to work with for two years, during which he always provided many helpful
insights about my research work.
I would like to thank my lovely wife Jessica and my beautiful daughter Isabela for their
love, patience, and continuous support during the last years of my graduate studies.
Finally, my greatest gratitude goes to my family, for their encouragement in pursuit of my
educational goals.
4
TABLE OF CONTENTS page
ACKNOWLEDGMENTS ...............................................................................................................4
LIST OF TABLES...........................................................................................................................9
LIST OF FIGURES .......................................................................................................................10
ABSTRACT...................................................................................................................................17
CHAPTER
1 INTRODUCTION AND BACKGROUND ...........................................................................19
Introduction.............................................................................................................................19 Background.............................................................................................................................20
The Concept of the Template Synthesis ..........................................................................20 Description of the Nanoporous Alumina Membrane Template ......................................25
Two-step anodization method ..................................................................................27 Pore growth mechanism ...........................................................................................30
Sol-Gel Chemistry at a Glance ........................................................................................32 Silane Chemistry a Versatile Tool for Surface Functionalization...................................35 Nature’s Transport across Membranes: An Inspiration for Membrane-Based
Separations...................................................................................................................36 Fundamentals about Proteins...........................................................................................41
Antibodies ................................................................................................................42 Recombinant proteins...............................................................................................44
Synopsis and Analytical Visualization of the Instrumental Techniques .........................46 Fluorescence spectroscopy.......................................................................................46 Fluorescence quenching ...........................................................................................48 FTIR-ATR spectroscopy ..........................................................................................49 X-ray Photoelectron Spectroscopy (XPS)................................................................51 Scanning Electron Microscopy (SEM) ....................................................................52 Impedance spectroscopy ..........................................................................................53
2 TRANSPORT AND FUNCTIONAL BEHAVIOR OF ANTIBODY-FUNCTIONALIZED NANOTUBE MEMBRANES ............................................................55
Introduction.............................................................................................................................55 Experimental...........................................................................................................................57
Materials ..........................................................................................................................57 Preparation of the Silica Nanotube Membranes ..............................................................58 Antibody Immobilization ................................................................................................58 Transport Experiments ....................................................................................................59 Competitive Binding Assays ...........................................................................................60
5
Determination of Static Protein Binding Capacity and Binding Constants through Adsorption Isotherms...................................................................................................61
Effect of Equilibration Time on Flux and Selectivity via Dynamic Binding Capacity .......................................................................................................................62
Results and Discussion ...........................................................................................................62 Electron Microscopy and Calibration Data .....................................................................63 Transport Properties of the anti-IgGs through PEG-Si-modified Control
Membranes...................................................................................................................64 Competitive Binding Studies...........................................................................................65 Functional Behavior of the M-IgG- and H-IgG-modified Membranes...........................67 Observed Functional Behavior is not a Transient Phenomenon .....................................68 Flux vs. Feed Concentration............................................................................................70 Effect of the Pore Size on the Flux and Selectivity Coefficient......................................71 Effect of the Immobilized-Antibody Orientation on the Flux.........................................73 Separation Based on a Simultaneous Combination of Size and Affinity Selectivity......74 Binding Capacities and Binding Constants .....................................................................77 Effect of the Temperature on the Flux and Binding Constant.........................................78 Effect of the Low Ionic Strength on the Selectivity ........................................................83
Conclusions.............................................................................................................................85
3 MODELING AND CHARACTERIZATION OF THE TRANSPORT PROPERTIES OF PROTEINS ACROSS ANTIBODY-FUNCTIONALIZED NANOTUBE MEMBRANES BY USING THE DUAL-MODE MODEL..................................................87
Introduction.............................................................................................................................87 Definition of Dual-Mode Model.............................................................................................89 Results and Discussion ...........................................................................................................95
Simulations of Permeability vs. Feed Concentration Based on the Dual-Mode Model ...........................................................................................................................95
Experimental Description of the Dual-Mode Model.....................................................100 Effect of feed concentration on the flux.................................................................100 Experimental permeabilities as function of the feed concentration .......................101 Experimental evaluation of the dual-mode model parameters...............................102 Experimental evaluation of Csites and b ..................................................................103 Experimental evaluation of the partition coefficients kp ........................................107 Experimental evaluation of the diffusion coefficients and solubility ....................110
Fitting Experimental Data with the Theoretical Dual-Mode Model .............................114 Validation of the Dual-Mode Model .............................................................................119
Conclusions...........................................................................................................................121
4 METAL ION AFFINITY NANOTUBE MEMBRANES: PREPARATION, CHARACTERIZATION, AND CONTROLLED TRANSPORT OF SIX-HISTIDINE-TAGGED RECOMBINANT PROTEIN..............................................................................122
Introduction...........................................................................................................................122 Experimental.........................................................................................................................124
Materials ........................................................................................................................124
6
Preparation of the Silica Nanotube Membranes ............................................................125 Preparation of Imidazole Functionalized Membranes...................................................125 Divalent Metal Ions Complexation ...............................................................................126 Instrumental Characterization of the Imidazole Functionalized Membranes................127 Transport Experiments ..................................................................................................128
Results and Discussion .........................................................................................................129 Imidazole Surface Modification and Characterization..................................................129
Fluorescence microscopy characterization.............................................................130 Characterization by FTIR-ATR spectroscopy........................................................135 Surface chemical composition by XPS ..................................................................141
Transport Properties of Imidazole Membranes .............................................................146 Conclusions...........................................................................................................................149
5 TRANSPORT ANALYSIS OF PROTEINS ACROSS SILICA NANOTUBE MEMBRANES THROUGH A FLUORESCENCE QUENCHING-BASED SENSING APPROACH.........................................................................................................................151
Introduction...........................................................................................................................151 Experimental.........................................................................................................................152
Materials ........................................................................................................................152 Preparation of the Silica Nanotube Membranes ............................................................154 Antibody Immobilization ..............................................................................................154 Labeling of anti-H-IgG with QSY-7 .............................................................................155 Transport Experiments ..................................................................................................156
Results and Discussion .........................................................................................................157 Experimental Principle Used for the Fluorescence Quenching Detection ....................157 Verification of the Fluorescence Quenching System via H-IgG-FITC and anti-H-
IgG-QSY Reaction in Solid State ..............................................................................159 Control Transport Studies..............................................................................................160 Effect of the Feed Solution Concentration on the Rate of Quenching ..........................162 Data Analysis Based on the Stern-Volmer Plots ...........................................................164 Data Analysis Based on log-log Plots of Fluorescence vs. Time..................................167 Transport across Antibody-Modified Silica Nanotube Membranes..............................169
Conclusions...........................................................................................................................170
6 HYBRIDIZATION STUDIES OF DNA IN A PNA-MODIFIED NANOTUBE MEMBRANE PLATFORM.................................................................................................171
Introduction...........................................................................................................................171 Experimental.........................................................................................................................173
Materials ........................................................................................................................173 Preparation of the Silica Nanotube Membranes ............................................................174 Preparation of PNA-Modified Nanotube Membranes...................................................174 Nanotube Membrane Assembly ....................................................................................176 Impedance Measurement for Membrane Characterization ...........................................177 Impedance Data Analysis ..............................................................................................177
Results and Discussion .........................................................................................................178
7

Impedance Characterization of the Unmodified Membranes........................................179 Functionalization of the Silica nanotube Membranes ...................................................180 Impedance Sensing of DNA-PNA Hybridization .........................................................182 Effect of the Pore Size on Rm.........................................................................................183 Stability and Reproducibility of the PNA-modified Membranes..................................185
Conclusions...........................................................................................................................187
7 CONCLUSIONS ..................................................................................................................189
LIST OF REFERENCES.............................................................................................................194
BIOGRAPHICAL SKETCH .......................................................................................................212
8

LIST OF TABLES
Table page 2-1. Fluxes and selectivity coefficients α for anti-M-IgG and anti-H-IgG across the M-
IgG and H-IgG-modified membranes................................................................................67
2-2. Thermodynamic parameters of ∆G0 associated with the affinity interaction of anti-M-IgG and M-IgG-modified membranes as a function of the temperature.......................82
3-1. Dual-mode model parameters used for the permeability plot simulations ........................97
3-2. Thermodynamic parameters from adsorption isotherms of anti-M-IgG and anti-H-IgG on M-IgG modified membranes, according to the Langmuir monolayer model......107
3-3. The kp determined by various approaches .......................................................................108
3-4. Validation of the dual-mode model parameters...............................................................121
4-1. FTIR-ATR characteristic bands of imidazole functionalized nanotube membranes.......138
4-2. XPS surface composition and binding energies for bare alumina, chlorosilane modified, and imidazole functionalized membranes .......................................................143
4-3. Fluxes and selectivity coefficients α for 6His-UHRP across imidazole functionalized metal ion affinity nanotube membranes...........................................................................149
5-1. Relationship between the Stern-Volmer quenching constant (KSV) with the feed solution concentration of anti-H-IgG-QSY .....................................................................167
5-2. Relationship between slope of the log-log plots for the fluorescence signal vs. time with the feed solution concentration of anti-H-IgG-QSY................................................168
5-3. Data for the Stern-Volmer quenching constant (KSV) and slope of the log-log plots for antibody-modified membranes...................................................................................169
6-1. Variations of Rm at the different steps of modification on a 100 nm pore diameter alumina template..............................................................................................................182
9
LIST OF FIGURES
Figure page 1-1. Scanning electron micrograph pointing up the honeycomb structure of nanoporous
alumina...............................................................................................................................25
1-2. Structure of nanoporous alumina. ......................................................................................26
1-3. Electrochemical cell setup for nanoporous alumina growth..............................................28
1-4. Scanning electron micrographs of a nanoporous alumina membrane anodized at 50 V in 5% oxalic acid, (A) before and (B) after elimination of the barrier layer. ....................29
1-5. Scanning electron micrograph of a highly-ordered nanoporous alumina membrane obtained at 50 V in 5% oxalic acid. ...................................................................................30
1-6. Outline of the steps involved in the sol-gel synthesis........................................................32
1-7. Fluorescence spectra obtained from the biofunctionalized (a) alumina template and (b) templated silica nanotube membranes with anti-Human IgG labeled with Alexa 488......................................................................................................................................34
1.8. Reactions involved in the alkoxysilane functionalization. Scheme obtained at http://www.dowcorning.com/content/publishedlit/SILANE-GUIDE.pdf .........................35
1-9. Types of specialized transport in living membranes (A) carriers, and (B) channels. ........37
1-10. Flux concentration dependence for passive and facilitated transport. ...............................38
1-11. Concentration gradients formed across the membrane during passive and facilitated transport. ............................................................................................................................39
1-12. Basic structure of the immunoglobulin molecule. .............................................................42
1-13. Intermolecular attractive forces involves in the antibody-antigen binding. Scheme obtained from www.fleshandbones.com/readingroom/pdf/291.pdf. .................................44
1-14. Jablonski diagram of the electronic states during the fluorescence process......................47
2-1. Immobilization of antibodies on the template synthesized silica nanotube membranes. ........................................................................................................................56
2-2. Flow-through fluorescence system used to measure the flux of the permeating proteins...............................................................................................................................59
2-3. Electron micrographs of (A) branch side, (B) solution anodization side, and (C) cross-section of the alumina template membranes, and (D) silica nanotubes after removal from the membrane..............................................................................................63
10
2-4. Typical plots of (A) calibration data, and (B) calibration curve for Alexa-488 labeled anti-H-IgG..........................................................................................................................64
2-5. Flux plots for anti-M-IgG () and anti-H-IgG () through PEG-Si-modified control membranes. The feed concentration was 2.65 nM (lower curves) and 21.2 nM (upper curves). ...................................................................................................................65
2-6. Fluorescence spectra of (A) M-IgG- and (B) H-IgG-modified membranes after equilibration with a solution that was 21.2 nM in both (a) anti-H-IgG, and (b) anti-M-IgG. ...............................................................................................................................66
2-7. Flux plots for anti-M-IgG () and anti-H-IgG () in (A) M-IgG-modified membrane, and (B) H-IgG-modified membrane. The feed solution concentration was 21.2 nM in both of the permeating proteins.......................................................................68
2-8. Dynamic binding capacity study using M-IgG-modified membranes. The flux and selectivity coefficient vs. days of equilibration are shown for the transport of anti-M-IgG and anti-H-IgG. The feed solution concentration was 21.2 nM in both of the permeating proteins............................................................................................................69
2-9. Flux versus feed concentration for anti-M-IgG () and anti-H-IgG () across M-IgG modified membrane. The feed solution concentrations were equimolar in both of the permeating proteins............................................................................................................70
2-10. Typical plot of flux versus feed concentration for anti-M-IgG or anti-H-IgG across PEG-Si modified membrane. The data plotted is an average of the fluxes for anti-M-IgG and anti-H-IgG for each specific feed concentration..................................................71
2-11. Effect of the pore size on (A) the flux, and (B) selectivity coefficients for M-IgG modified membranes. The feed solution concentrations was 2.65 nM both in anti-H-IgG and anti-M-IgG. ..........................................................................................................72
2-12. Flux plots for anti-M-IgG () and anti-H-IgG () in well-oriented M-IgG-modified membrane. The feed solution concentration was 21.2 nM in both of the permeating proteins...............................................................................................................................73
2-13. Scanning electron micrograph of (A) the surface, and (B) cross section of a highly-ordered nanoporous alumina membrane obtained at 30 V in 5% oxalic acid. ..................75
2-14. Flux plots for anti-M-IgG () and anti-H-IgG () in (A) PEG-Si-modified membrane, and (B) well-oriented M-IgG -modified membrane. The feed solution concentration was 21.2 nM in both of the permeating proteins.........................................75
2-15. Flux plots for anti-M-IgG () and F(ab)2-anti-H-IgG () in well-oriented M-IgG -modified membrane. The feed solution concentration was 21.2 nM in both of the permeating proteins............................................................................................................76
11
2-16. Dissociation constants and binding capacities from adsorption isotherms of anti-M-IgG and anti-H-IgG on H-IgG- and M-IgG-modified membranes, according to the Langmuir monolayer model...............................................................................................78
2-17. Flux plots for anti-M-IgG () and anti-H-IgG () in well-oriented M-IgG -modified membranes showing the effect of temperature. The feed solution concentration was 21.2 nM in both of the permeating proteins.......................................................................79
2-18. Effect of temperature on the flux and selectivity coefficients. ..........................................79
2-19. Adsortion isotherms carried out with well-oriented M-IgG-modified membranes for anti-M-IgG at three different temperatures: 23, 32, and 42 °C..........................................80
2-20. Affinity temperature dependence of anti-M-IgG in well-oriented M-IgG-modified membranes .........................................................................................................................81
2-21. Flux plots for anti-M-IgG (∆) and anti-H-IgG () across M-IgG -modified membranes, (A) without equilibration, and (B) after equilibration. The feed solution concentration was 2.65 nM in both of the permeating proteins.........................................84
3-1. Dual-mode transport model. ..............................................................................................88
3-2. Permeability plot simulations for the transport of (a) BM and (b) NBM across carrier-modified membranes. The parameters are summarized in Table 3-1. ...................96
3-3. Permeability plot simulations for the transport of BM across carrier-modified membranes illustrating the effect of the term F on the dual-mode model. (a) F = 1, (b) F = 0.5, and (c) F = 0. The other parameters are summarized in Table 3-1. ...............97
3-4. Permeability plot simulations for the transport of BM across carrier-modified membranes showing the effect of the binding affinity on the permeability. (a) b = 1 x 1011 cm3/moles, and (b) b = 3 x 1010 cm3/moles. The other parameters are summarized in Table 3-1. ................................................................................................100
3-5. Flux versus feed concentration for anti-M-IgG () and anti-H-IgG () across M-IgG modified membrane. The feed solution concentration was equimolar in both of the permeating proteins..........................................................................................................101
3-6. Experimental obtained permeability versus feed concentration for anti-M-IgG () and anti-H-IgG () across M-IgG modified membrane. .................................................102
3-7. Curve of adsorption dynamics for anti-M-IgG () in a M-IgG modified membrane. Inset shows the changes of fluorescence signal with time...............................................103
3-8. Adsorption isotherms for anti-M-IgG (), and anti-H-IgG () binding on M-IgG modified membranes. Also the adsorption isotherm for anti-M-IgG ( ) using a control membrane is shown. ............................................................................................104
12
3-9. Adsorption isotherm for anti-M-IgG () binding on M-IgG-PG modified membranes. ......................................................................................................................106
3-10. Extrapolations of the adsorption isotherms at infinite dilute concentration for anti-M-IgG (), and anti-H-IgG () in M-IgG modified membranes. .......................................108
3-11. Permeability plot simulations illustrating the effect of the partition coefficient on the dual-mode model. Simulation parameters: D = 5 x 10⁻⁸ cm2/sec, b = 9 x 1010 cm3/moles, Csites = 3.5 x 10⁻⁸ moles/cm3, and kp were respectively, 1 (), 0.1 (), 0.01 (), and 0.001( )....................................................................................................109
3-12. Concentration-dependence of the solubility in term of the dual-mode model for anti-M-IgG (), and anti-H-IgG () across M-IgG modified membranes. ...........................111
3-13. Correlation plots between permeability and solubility based on the concentration dependence for (A) anti-H-IgG and (B) anti-M-IgG across M-IgG modified membranes. ......................................................................................................................112
3-14. Experimental and calculated obtained permeability versus feed concentration for anti-M-IgG () and anti-H-IgG () across M-IgG modified membrane. ......................114
3-15. Experimental obtained diffusion coefficients versus feed concentration for (A) anti-H-IgG and (B) anti-M-IgG across M-IgG modified membrane. .....................................117
3-16. Plots for experimental and calculated obtained permeability against (1 + bCfeed)-1 for (A) anti-H-IgG, and (B) anti-M-IgG across M-IgG modified membrane. ......................120
4-1. Reaction mechanism of imidazole functionalized nanotube membranes. .......................126
4-2. Flow-through UV-Vis detection system used to measure the flux of six-histidine-tagged ubiquitin human recombinant protein. .................................................................129
4-3. Fluorescence spectra of (a) silica nanotube and (b) imidazole functionalized membranes. ......................................................................................................................130
4-4. Fluorescence spectra of imidazole functionalized membranes before (upper) and after (lower) metal ion immobilization: (A) Co+2, (B) Cu+2, (C) Ni+2, and (D) Zn+2. .....131
4-5. Fluorescence quenching (F/F0) for imidazole functionalized membranes in the presence of nitrate solutions prepared in ethanol that were 1 mM of the respective divalent metal ion.............................................................................................................132
4-6. Fluorescence spectra of imidazole functionalized membranes (a) before and (b) after metal ion immobilization using an ethanol solution that was 1 mM in CuCl2. ...............133
4-7. Copper concentration dependence on fluorescence enhancement for imidazole functionalized membranes. ..............................................................................................134
13
4-8. (A) FTIR-ATR spectra of bare alumina and imidazole functionalized membranes. (B) FTIR-ATR spectra of imidazole functionalized membranes in a narrow spectral region illustrating the effect of using two different backgrounds for the spectrum subtraction: (a) air, and (b) 3-chloropropyl silica nanotube membrane...........................136
4-9. Transmission FTIR spectrum of pure 2-mercaptoimidazole in KBr. ..............................136
4-10. FTIR-ATR spectra of imidazole functionalized membranes showing the effect of the metal ion immobilized on the thioamide bands: (a) Zn+2, (b) Co+2, and (c) Cu+2. ..........137
4-11. Transmission FTIR spectra of the alumina template film for each of the modification steps illustrated in Figure 4-1: (a) bare alumina template, (b) silica, (c) 3-chloropropyl silane modified and (d) imidazole functionalized nanotube membranes, respectively. .....................................................................................................................139
4-12. XPS survey spectrum for the bare alumina template.......................................................141
4-13. XPS survey spectra for (a) chlorosilane and (b) imidazole modified membranes. .........142
4-14. XPS multiplexes analysis at high resolution for the imidazole functionalized membrane.........................................................................................................................144
4-15. High-resolution XPS data of the C1s peak for (a) bare alumina template, (b) chlorosilane modified, and (c) imidazole functionalized membranes. ............................144
4-16. XPS survey spectra for imidazole modified membranes after immobilization of (a) Cu+2, and (b) Zn+2. ...........................................................................................................145
4-17. UV-Vis spectrum for 50 µM of 6His-UHRP measured in 50 mM phosphate-buffered saline solution pH 8.0 that also contained 300 mM sodium chloride and 2 mM imidazole..........................................................................................................................146
4-18. Typical plots of (A) calibration data and (B) calibration curve for 6His-UHRP.............147
4-19. Flux plots for 6His-UHRP in imidazole functionalized metal ion affinity nanotube membranes that had immobilized different metal ions: (a) Cu+2, (b) Ni+2, (c) Co+2, and (d) Zn+2. The feed solution concentration was 1.87 µM for all permeation experiments. .....................................................................................................................147
4-20. Effect of the divalent metal ion immobilized on the flux of 6His-UHRP across imidazole functionalized metal ion affinity nanotube membranes. .................................148
5-1. Flow-through fluorescence system used to measure the changes of fluorescence intensity in the receiver solution. .....................................................................................157
5-2. Structures of (a) QSY-7 and (b) FITC .............................................................................158
5-3. Spectra for FITC and QSY-7 ...........................................................................................158
14
5-4. Molecular recognition reaction used to promote the fluorescence quenching. ...............159
5-5. Fluorescence image and spectra respectively for a H-IgG-FITC-modified membrane, (A-C) before exposure, and (B-D) after exposure to a sample solution of anti-H-IgG-QSY..................................................................................................................................160
5-6. Typical plots for (A) changes of fluorescence signal, and (B) concentration of unquenched protein in function of time for two different control transport/detection systems: (a) anti-H-IgG/H-IgG-FITC, and (b) anti-H-IgG-QSY/R-IgG-FITC. ..............161
5-7. Typical plots for (A) changes of fluorescence signal and (B) concentration of unquenched protein in function of time for three different feed solution concentrations: (a) 16.6 nM, (b) 33.3 nM, (c) 66.6 nM, and (d) 33.3 nM (control). .......163
5-8. Stern-Volmer plots of I0 /I against concentration of anti-H-IgG-QSY in the receiver solution transported across silica nanotube membranes. The effect of the feed solution concentrations of anti-H-IgG-QSY is shown: (a) 16.6 nM, (b) 33.3 nM, (c) 66.6 nM, and (d) 33.3 nM (control). ................................................................................165
5-9. Effect of the feed concentration on the Stern-Volmer quenching constant KSV. .............166
5-10. log-log plots of the of fluorescence signal vs. time showing the effect of feed solution concentration of anti-H-IgG-QSY: (a) 16.6 nM, (b) 33.3 nM, (c) 66.6 nM, and (d) 33.3 nM (control)................................................................................................167
5-11. Linear relationship between slopes obtained from the log-log plots with the feed concentration of anti-H-IgG-QSY. ..................................................................................168
5-12. Typical plots for (A) changes of fluorescence signal and (B) concentration of unquenched protein in function of time illustrating the transport of anti-H-IgG-QSY across (a) H-IgG-, and (b) M-IgG-modified membranes. The feed solution concentration was 33.3 nM for both experiments............................................................169
6-1. Structures of (a) PNA, and (b) DNA. ..............................................................................172
6-2. Immobilization of biotinylated-PNA on templated synthesized silica nanotube membranes. ......................................................................................................................175
6-3. Nanotube membrane assembly. .......................................................................................176
6-4. General equivalent circuit model used for impedance data analysis. ..............................178
6-5. Nyquist plots (Zim vs. Zre) for impedance measurement of (a) alumina and (b) silica-nanotube assembled membranes in highly purified water. ..............................................179
6-7. Effect of the wetting time on the resistance impedance measurement for an assembled unmodified alumina membrane 200 nm pore diameter. ................................180
15
6-8. Nyquist plots (Zim vs. Zre) of impedance measurement in highly purified water: (a) alumina, (b) after synthesis of silica-nanotube, (c) after silanization, (d) after biotinylation, (e) after streptavidin immobilization, (f) after PNA immobilization, and (g) after DNA hybridization. The plots were recorded applying 5 mV alternative voltage in the frequency range from 1 MHz to 0.05 Hz. .................................................181
6-9. Nyquist plots (Zim vs. Zre) of impedance measurement in highly purified water for a PNA-modified nanotube membrane: (a) before, and (b) after 10 minutes of DNA hybridization. The plots were recorded applying 5 mV alternative voltage in the frequency range from 1 MHz to 0.05 Hz.........................................................................183
6-10. Effect of the membrane pore size on the membrane resistance: (A) 200 nm, and (B) 100 nm. The resistance values were obtained from the impedance data recorded by applying 5 mV alternative voltage in the frequency range from 1 MHz to 0.05 Hz. ......184
6-11. Study of the hybridization process stability with time: (A) unmodified control alumina membrane, and (B) PNA-modified membrane. The resistance values were obtained from the impedance data recorded by applying 5 mV alternative voltage in the frequency range from 1 MHz to 0.05 Hz after the addition of 3 nmoles of complementary DNA. ......................................................................................................185
6-12. Nyquist plots (Zim vs. Zre) of impedance measurement in highly purified water for a PNA-modified nanotube membrane: (a) before, (b) after adding 3 nmoles of DNA, and (c) after 6 nmoles of DNA. The plots were recorded applying 5 mV alternative voltage in the frequency range from 1 MHz to 0.05 Hz. .................................................186
6-13. Reproducibility study of the PNA-modified nanotube membranes, before and after the hybridization process. The resistance values were obtained from the impedance data recorded by applying 5 mV alternative voltage in the frequency range from 1 MHz to 0.05 Hz after the addition of 3 nmoles of complementary DNA. ......................187
16
Abstract of Dissertation Presented to the Graduate School of the University of Florida in Partial Fulfillment of the Requirements for the Degree of Doctor of Philosophy
BIOANALYTICAL APPLICATIONS OF AFFINITY-BASED NANOTUBE MEMBRANES FOR SENSING AND SEPARATIONS
By
Héctor Mario Caicedo
August 2008
Chair: Charles R. Martin Major: Chemistry
Nanotechnology has played an important role in the development of research and
technology during the last two decades. The contribution of nanotechnology in different fields,
along with the versatility of the constructed nanoscale materials, have made nanotechnology one
of the most suitable tools to develop particular nanostructures to realize a desired function and
application. A nanostructure is simply an entity at the nanometer scale with one, two or three
dimensional features. Since nanotechnology covers a broad range of nanoscale materials, to
simplify nanotechnology, it can be classified into two categories based on how the
nanostructures are prepared: top-down and bottom-up. In the top-down methods, the
nanostructures are constructed by chiseling larger bulk materials into entities of smaller size.
Conversely, in the bottom-up case, small units are grown or assembled into their desired size and
shape. The nanoporous materials specifically have attracted a lot of attention because they can be
used for the synthesis of a variety of functional nanostructures of great usefulness in technology.
These porous nanostructures usually combine many of the advantages of the top-down and
bottom-up methodologies such as flexibility, size controllability, and cost. The research
presented in this work utilizes nanoporous membranes to develop porous nanostructured
platforms with potential applications in sensing and separations. In particular, this work is
17
centered in fundamental studies for bioanalytical applications of affinity-based nanotube
membranes for sensing and separations. A bottom-up methodology like the template synthesis
was used to produce silica nanotubes inside of the pores of alumina membrane. The
functionalization of the inside walls of these silica nanotube membranes allowed control of the
functional behavior and properties of the nanostructured membrane during membrane-based
separations and sensing. The general scheme of the work presented here, is distributed in seven
chapters. The first chapter consists of a general description of the theory and fundamentals as
background supporting evidence for the work presented here. The template synthesis method, the
fabrication of the porous alumina membranes and the possibilities that silane chemistry offers in
order to functionalize the nanostructured membranes is discussed. In addition, a brief overview
of the fundamentals of biological production of proteins, antibodies, and recombinant proteins is
described. After this introduction, the studies presented herein are centered in potential
bioanalytical applications of the silica nanotube membranes.
18
CHAPTER 1 INTRODUCTION AND BACKGROUND
Introduction
The use of membranes in industrial separations, substituting the traditional methods of
separation, has become a more accepted procedure every day. Features such as compactness,
simple and efficient operation, and low energy consumption have made membrane-based
separations a fine alternative procedure.1, 2 Membrane-based separations have found an extensive
range of applications in technology, such as water and wastewater treatment, electrodialysis, gas
separations, and fuel cell development.2 The most important property of membranes is their
ability to control the rate of permeation of different species. Traditionally, membranes have been
used for size- and charge-based separations with great success by using relatively low-resolution
requirements.3-7 However, some applications require the development of new membranes,
because these rudimentary forms of selectivity are insufficient to allow membranes to compete
with the traditional chromatographic methods. Current research and development efforts in
membrane-based separations are directed toward drastic improvements in selectivity keeping the
inherent characteristics of membranes.8 In the search of new advanced membrane materials, the
development of functionalized-membranes with a selective transport function executed through a
specific molecule “carrier” has become in an interesting alternative to modulate the transport
during membrane-based separations.9, 10 This concept has been inspired in analogy by the
strategies that biological membranes use to accomplish transport. Thus, the combined use of
synthetic membranes with biological molecules such as antibodies and nucleotides has become
important in the development of applications both in the biomedical and biotechnological field.11
By using this combination, membranes have also acquired an important role in the design and
development of biosensors.12 In particular, nanotube membranes prepared by the general method
19
called template synthesis to prepare nanomaterials have been extensively investigated.4-6, 9, 10, 13-24
This method entails synthesis of the desired material within the cylindrical and monodisperse
pores of a nanopore membrane or other solid.25, 26 Both silica and gold nanotube membranes
prepared by this method have demonstrated the capacity of being a novel platform for
membrane-base separations and sensors.14, 18 One of the most important features of the nanotube
membranes prepared by the template synthesis when they are used in membrane-base
separations, is that the deposited nanotubes are embedded within a mechanical strong support
membrane, making it possible that they can act as conduits during the transport of permeating
species between the solutions placed on either side of the membrane. Previous studies have
shown that, by controlling the inside diameter of the nanotubes and the chemical functionalities
present in the tube walls, highly-selective membranes for chemical and biochemical separations
and sensors can be prepared.4- 6, 9,10, 13-24 This chapter provides a general description of the theory
and fundamentals as background supporting evidence for the work presented here. The template
synthesis method, the fabrication of the porous alumina membranes and the possibilities that
silane chemistry offers in order to functionalize the nanostructured membranes it is discussed. In
addition, a brief overview of the fundamentals of biological production of proteins, antibodies
and recombinant proteins is described. At the end of the chapter, a brief summary of some of the
instrumental analytical techniques used during the development and characterization of the
applications described in this work is provided.
Background
The Concept of the Template Synthesis
Our group has been pioneered in investigating a method called template synthesis for the
fabrication of a variety of nanomaterials.27 This template method is a general approach for
preparing nanomaterials that involves the synthesis or deposition of the desired material within
20
the pores or cavities of a nanopore membrane or other solid surface. Therefore, depending on the
template structure and synthetic method used, a diverse array of nanostructured materials can be
prepared.28-31 Thus for example, from porous membranes is possible to prepare hollow nanotubes
or solid nanowires, and by using solid spheres or porous spheres respectively, capsules or
nanoporous particles can also be fashioned.
Martin et al. have prepared nanotubes and nanowires composed of many types of
materials, including conductive polymers,32-34 metals,35-37 oxides,38 semiconductors,39 carbon,29,
31 and DNA.40, 41 The variety of synthetic methodologies used for these nanofabrication include
electroless plating of metals; electrodeposition of insulating polymers, conductive polymers,
semiconducting oxides and metals; chemical vapor deposition; sol-gel chemistry; chemical
polymerization; carbonization; and layer-by-layer template synthesis.
Using either electrochemical33, 34 or chemical42, 43 oxidative polymerization of a equivalent
monomer, Martin et al. have prepared nanowires and nanotubes out of conductive polymers such
as polypyrrole, poly(3-methylthiophene) and polyaniline.
Metals having nanoscopic dimensions with attractive optical properties have also been
prepared by template synthesis.44-45 For example, a macroscopic sample of pure gold has only
one color, but nanoparticles of gold can show essentially all the colors in the visible region of the
electromagnetic spectrum, depending on the size and the shape of the nanoparticles.25 Hornyak et
al. explored the optical properties of nanoscopic gold particles prepared by electrochemical
deposition of gold within the pores of nanoporous alumina membranes.44-45 They found that
these particles achieve a plasmon resonance absorption limit that depended on the gold
nanoparticle diameter.
21
In the Martin group there is a commonplace methodology for the electroless deposition of
gold within the pores of polycarbonate (PC) 10, 37 and polyethylene terephthalate (PET) 16, 46
template membranes. Depending on the plating time, it is possible to generate gold nanowires or
nanotubes. Thus, in the nanotube situation, by controlling the plating time, the inside diameter
can be varied. The electroless deposition of gold on the pore wall of these polymeric membranes
is currently the best known method to precisely control the inside diameter of the template-
synthesized nanotubes.47
Martin et al. have shown that because the inside diameter of these gold nanotube
membranes can be small relative to molecular dimensions, the nanotube membrane can be used
to cleanly separate small molecules on the basis of molecular size.47 By varying the rate of the
plating reaction the diameter of the nanotubes was smaller in the faces of the template
membrane. Thus, the flux and selectivity were determined for the bottleneck of the nanotubes.
Together with size-based selectivity, they also demonstrated that generic chemical transport
selectivity can be introduced into this membranes.48, 49
More recently, Martin et al. have investigated gold nanotube membranes where the inner
pore surfaces were systematically modified for biochemical functionalization to accomplish
selective permeation of DNA.10 They demonstrated a DNA-functionalized nanotube membrane
for the separation of DNA by single-base mismatches selectivity via facilitated transport.10 These
DNA-functionalized nanotube membranes selectively recognize and transport the DNA strand
that was complementary to the immobilized hairpin-DNA (carrier) within the pores, relative to
DNA strands that are not complementary to the immobilized DNA.
Another synthetic method used for the manufacture of nanotubes is the sol-gel chemistry to
produce nanotubes of silica and other inorganic materials. The silica nanotubes have been used
22
as paradigm to show the power of the template method for preparing nanotubes for
biotechnological applications.50 Silica nanotubes are easy to make, and they can be derivatized
with an enormous variety of different chemical functional groups using simple silane chemistry
with commercially available reagents.
Mitchell et al. developed the concept of smart nanotubes that can be used for biological
extraction and biocatalysis.38 Nanotubes removed from the template and differentially
functionalized both in the inner and outer nanotube surfaces were used for this application. Such
differentially functionalized nanotube was used as smart nanophase extractor to remove specific
molecules from solution. Thus, hydrophobic functionalized nanotube on the inside, with a
hydrophilic nanotube exterior was used to extract lipophilic compounds from aqueous solutions.
In the same work, Mitchell et al. showed that nanotube functionalized with an enantioselective
antibody selectively extracts the enantiomer of a drug molecule that binds to the antibody from
the racemic mixture.38
Lee et al. demonstrated the use of silica nanotube membranes for enantioseparations.9 They
found that nanotubes embedded within the pores of the alumina template and functionalized with
a Fab fragment antibody that binds the RS isomer of a drug molecule over the SR isomer,
facilitated the transport of the RS enantiomer. They also found that the transport selectivity and
binding affinity of RS over SR could be tuned by controlling the inside diameter of the
membrane containing silica nanotube, and by addition of DMSO to the protein buffer solution,
respectively.
Gasparac et al. explored the template synthesized nano test tubes as an alternative payload-
release strategy by using the template synthesis within the pores of nanopore alumina films.51
These hollow nanotubes were closed on one end and open on the other. Therefore, if these nano
23
test tubes could be filled with a payload and then the open end corked with a chemically labile
cap, they might function as a universal delivery vehicle. More recently, Hillebrenner et al.
demonstrated nano test tubes corked by chemical self-assembly.52, 53
Buyukserin et al. have also prepared silica nano test tubes by using nanopore photoresist
films as templates.54 They used a plasma etch method, by using a nanopore alumina film as a
mask, to etch a replica of the alumina pore structure into the surface of a photoresist polymer
film. They found that the length of the test tubes is determined by the thickness of the porous
part of the photoresist film.
It is very important to control the inside diameter of the fashioned nanotubes, when the
alumina membranes are used as template. In order to control the nanotube inside diameter a
substitute template synthetic methodology has been considered, where the deposition of the film-
forming material is based on layer-by-layer deposition. In this case, the wall thickness, and
equally the inside diameter of the nanotubes would be determined by the number of layers of the
material deposited along the pore wall. Using this approach, Ai et al. attempted to deposited
layers of polyelectrolyte in the pores of a nanopore alumina membrane.55 Kovtyukhova et al.
have developed a method based on alternate SiCl4/H2O deposition/reaction cycles to make and
control the thickness of silica nanotubes.56 Hou et al. used Mallouk’s alternating α,ω-
diorganophosphonate Zr(IV) chemistry to deposit layered nanotubes along the pore walls of an
alumina template membrane.40-41 For these nanotubes, the layers were held together by bonds
between the phosphonate groups and the Zr(IV) ions, and the polyvalence of this interaction
provided cross-linking that imparts the structural integrity of the layered nanotubes.40 Hou et al.
also used this synthetic strategy for the synthesis of DNA nanotubes where the bulk of the tube
24
was composed of DNA, and the layers were held together by hybridization of complementary
DNA strands.40-41
The remarkable versatility offered by the material fabricated using template synthesis such
as: size, shape, chemistry methodology applied, and systematic functionalization, make those
nanostructured-template materials practical for particular applications.
Description of the Nanoporous Alumina Membrane Template
Nanoporous alumina films, which are produced by the electrochemical anodization of
aluminum in suitable acidic or basic electrolytic solution,44, 57 - 63 have been investigated and used
as starting material for the fabrication several kinds of nanostructures, due to its very well
ordered porous structure with high aspect ratio (thickness divided by the diameter). In recent
years, simultaneously with the improvements in degree of ordering, these nanoporous alumina
membranes have become a popular template system for the synthesis of various functional
nanostructures.9, 64 - 70
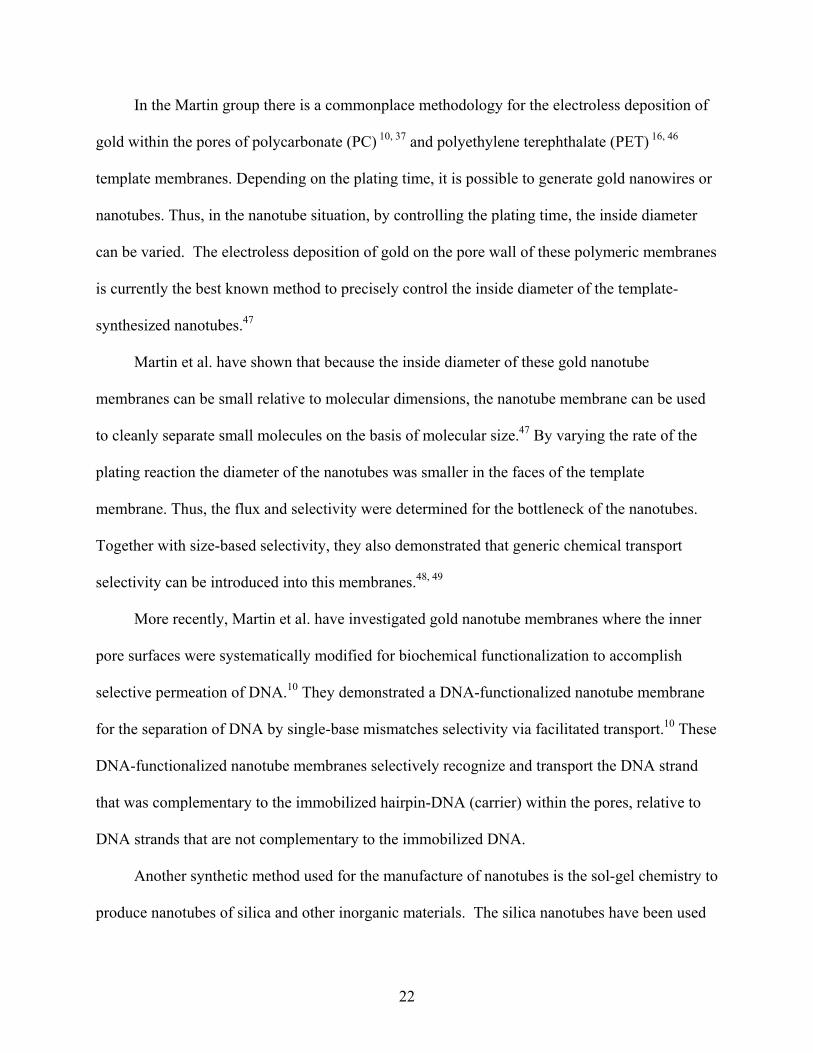
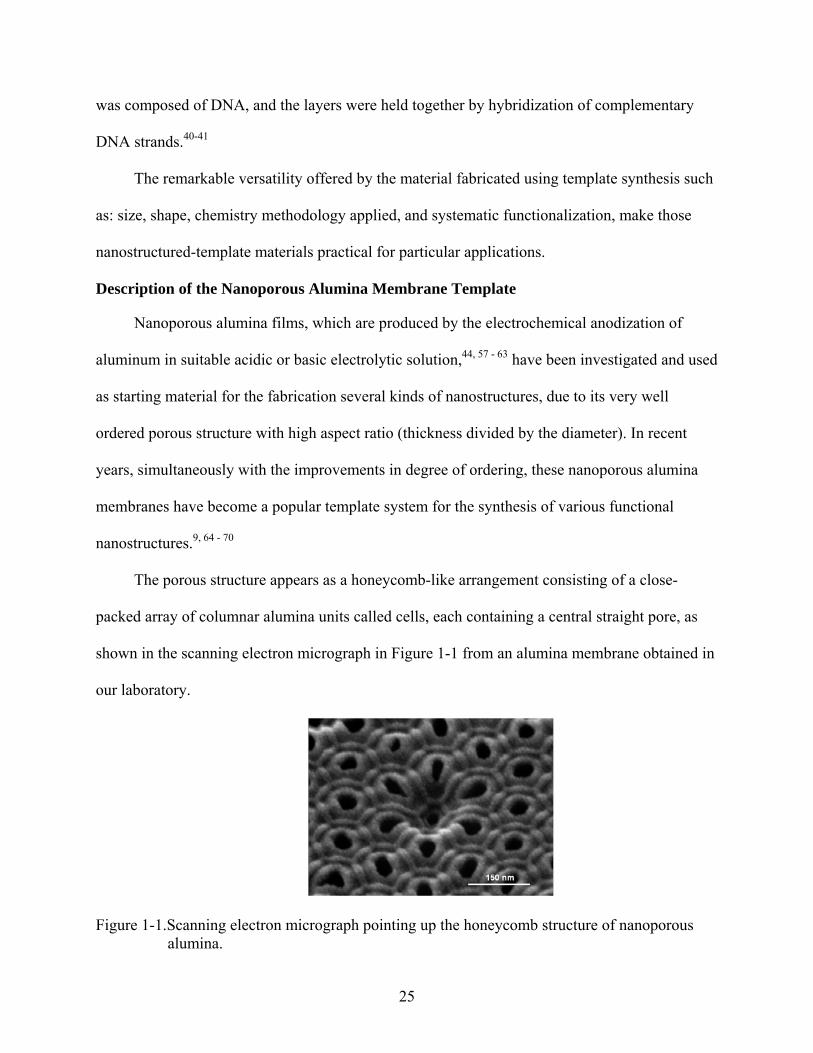
The porous structure appears as a honeycomb-like arrangement consisting of a close-
packed array of columnar alumina units called cells, each containing a central straight pore, as
shown in the scanning electron micrograph in Figure 1-1 from an alumina membrane obtained in
our laboratory.
Figure 1-1.Scanning electron micrograph pointing up the honeycomb structure of nanoporous alumina.
25
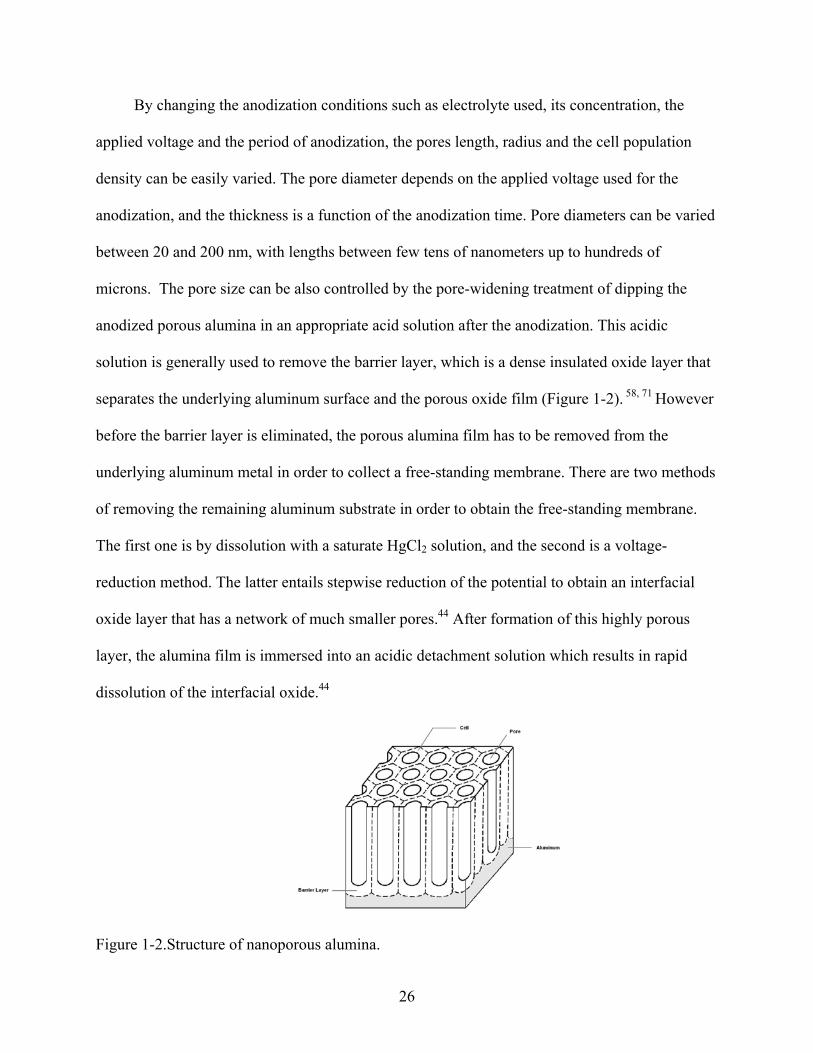
By changing the anodization conditions such as electrolyte used, its concentration, the
applied voltage and the period of anodization, the pores length, radius and the cell population
density can be easily varied. The pore diameter depends on the applied voltage used for the
anodization, and the thickness is a function of the anodization time. Pore diameters can be varied
between 20 and 200 nm, with lengths between few tens of nanometers up to hundreds of
microns. The pore size can be also controlled by the pore-widening treatment of dipping the
anodized porous alumina in an appropriate acid solution after the anodization. This acidic
solution is generally used to remove the barrier layer, which is a dense insulated oxide layer that
separates the underlying aluminum surface and the porous oxide film (Figure 1-2). 58, 71 However
before the barrier layer is eliminated, the porous alumina film has to be removed from the
underlying aluminum metal in order to collect a free-standing membrane. There are two methods
of removing the remaining aluminum substrate in order to obtain the free-standing membrane.
The first one is by dissolution with a saturate HgCl2 solution, and the second is a voltage-
reduction method. The latter entails stepwise reduction of the potential to obtain an interfacial
oxide layer that has a network of much smaller pores.44 After formation of this highly porous
layer, the alumina film is immersed into an acidic detachment solution which results in rapid
dissolution of the interfacial oxide.44
Figure 1-2.Structure of nanoporous alumina.
26

There are two reported methods for the fabrication of highly ordered anodic nanoporous
alumina membranes. One is the two-steps anodization method, which is the commonplace
method used in our laboratory to produce the alumina membranes. Since the ordering of the pore
configuration (self-organization) depends on the anodization time in the acidic electrolyte
solution, two steps of anodization are required to obtain a highly ordered pore structure.61, 62, 72
This method will be discussed in more detail in the next section.
The second method is based on pretexturing of the aluminum substrate by using
nanoindentation with a master mold.73, 74 Masuda et al. used a SiC mold with a hexagonal array
structure prepared by conventional electron beam lithography.73, 74 In this pretexturing method,
the depressions formed in the aluminum serve as initiation sites for the pore creation at the initial
stage of the anodization. An ideally ordered nanoporous alumina membrane is formed after
anodization of the aluminum substrate with the transferred textured pattern.
Two-step anodization method
The degree of the ordering of the pore initiation at the surface of the anodic porous alumina
is low because the pores develop randomly at the initial stage of the anodization. To improve the
ordering of the surface side of the anodic porous alumina, two-steps anodization is effectively
adopted.61, 62, 72 Two separated anodization processes are required for this procedure. The first
anodization process consists of a long-period anodization to form the highly ordered concave
nano-array of nucleation sites at the alumina/aluminum interface. The second anodization is
performed after the removal of the oxide formed in the first anodization step. Thus, after the
removal of the oxide, an array of highly ordered dimples is formed on the underlying aluminum
substrate. These dimples act as initiation sites for the pore development during the second
anodization. This process generates an ordered pore structure through the entire oxide layer. In
the following paragraphs, the methodology used in our laboratory for the fabrication of alumina
27
membranes will be discussed, which consists of three stages: polishing of the aluminum
substrate, the two anodization steps, and the detaching step in order to have a free-standing
membrane.
Polishing of aluminum foils: In order to obtain a high quality alumina film, the starting
aluminum material, must be very smooth. Initially, the high purity aluminum foils (99.999%) are
mechanically polished with slurry of aluminum particles. If, to the naked eye, the aluminum foil
shows severe scratches a mechanical polishing with fine sand paper is applied until the scratches
disappear. The mechanical polishing is then followed by an electrochemical polishing. In this
process, a potential difference of 15 V is applied between the anode aluminum foil and a lead
plate which serve as cathode, by using a polishing electrolyte solution (95% concentrated
phosphoric acid, 5% concentrated sulfuric acid and 20 g/L chromic oxide) heated to 70 °C.
Electropolishing steps of 5 minutes are successively repeated as many times as it is necessary,
until the aluminum foil has a mirror-like surface.
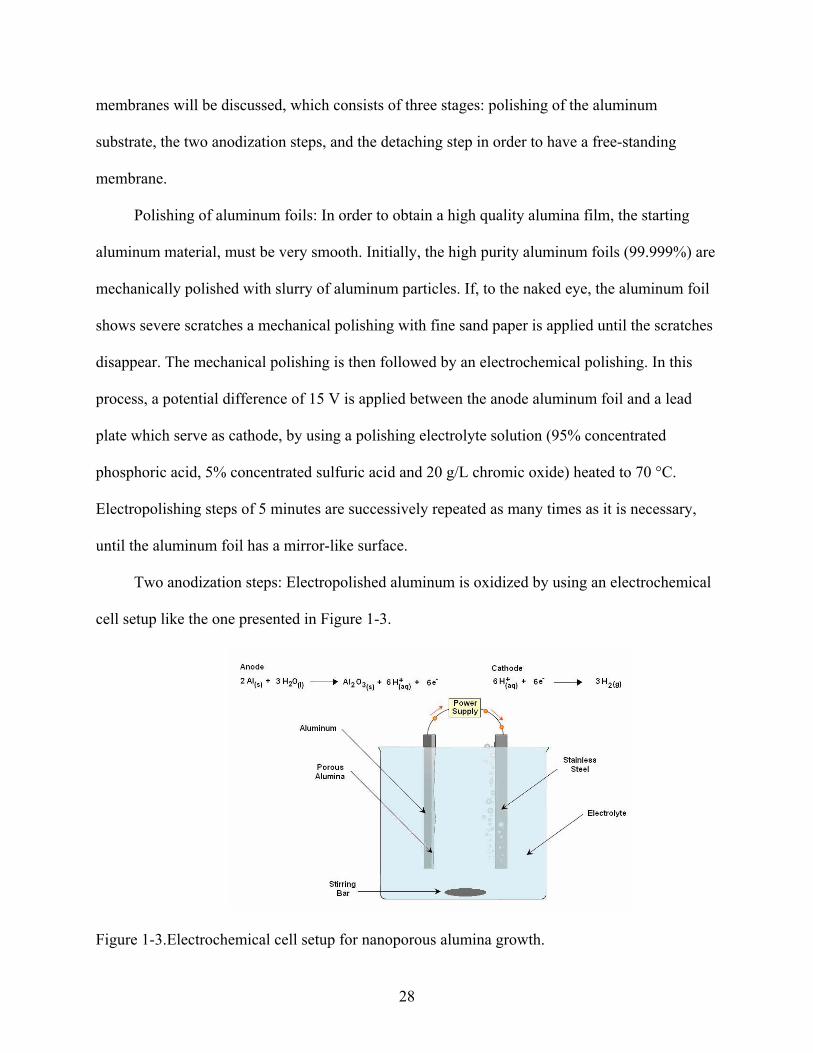
Two anodization steps: Electropolished aluminum is oxidized by using an electrochemical
cell setup like the one presented in Figure 1-3.
Figure 1-3.Electrochemical cell setup for nanoporous alumina growth.
28
The first anodization step is performed in 5% oxalic acid as electrolyte for 12 hours, at 2
°C, under a constant voltage. It should be pointed out that the pore diameter is controlled via
anodization voltage. Thus, smaller pores require lower applied voltage and more conducted
electrolytes such as sulfuric acid.75 Large pores need larger voltages, which causes a high rate of
dissolution in highly conductive electrolytes.76 For this reason, the fabrication of larger pores
requires lower conductive electrolytes, such as oxalic acid.76
After the first anodization, the formed alumina film is removed in an etching solution that
contains 0.4 M in phosphoric acid and 0.2 M in chromic oxide at 60 °C. This anodization
removal step leaves a uniform concave nano-array of nucleation sites in the underlying
aluminum metal that correspond to each pore.
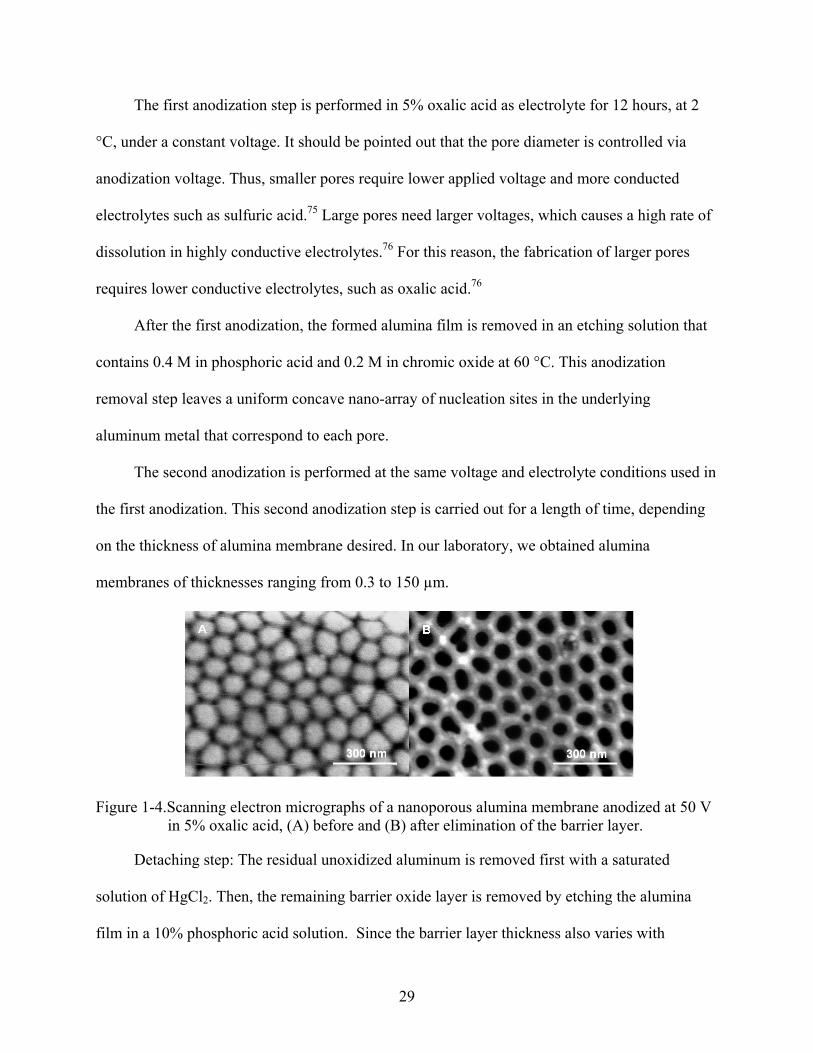
The second anodization is performed at the same voltage and electrolyte conditions used in
the first anodization. This second anodization step is carried out for a length of time, depending
on the thickness of alumina membrane desired. In our laboratory, we obtained alumina
membranes of thicknesses ranging from 0.3 to 150 µm.
Figure 1-4.Scanning electron micrographs of a nanoporous alumina membrane anodized at 50 V in 5% oxalic acid, (A) before and (B) after elimination of the barrier layer.
Detaching step: The residual unoxidized aluminum is removed first with a saturated
solution of HgCl2. Then, the remaining barrier oxide layer is removed by etching the alumina
film in a 10% phosphoric acid solution. Since the barrier layer thickness also varies with
29
increasing voltage the etching step requires longer times for anodized membranes with bigger
pores. Figure 1-4 shows the scanning electron micrographs of an alumina membrane obtained in
our laboratory before and after elimination of the barrier layer.
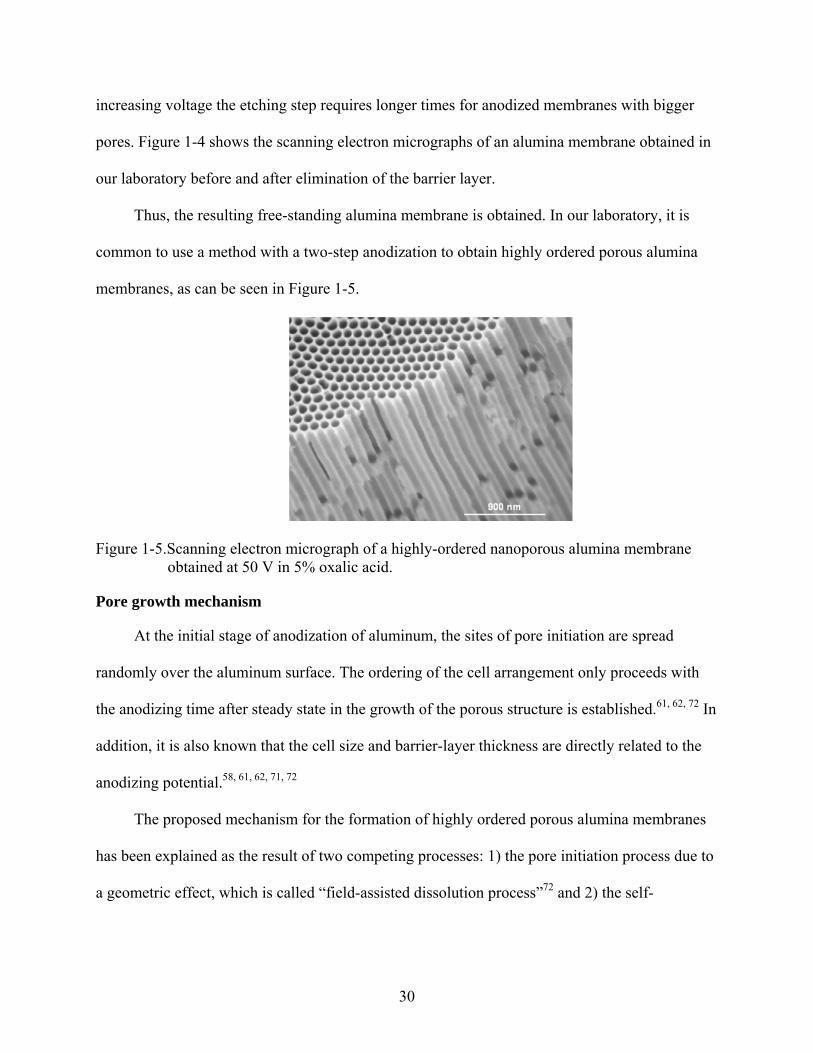
Thus, the resulting free-standing alumina membrane is obtained. In our laboratory, it is
common to use a method with a two-step anodization to obtain highly ordered porous alumina
membranes, as can be seen in Figure 1-5.
Figure 1-5.Scanning electron micrograph of a highly-ordered nanoporous alumina membrane obtained at 50 V in 5% oxalic acid.
Pore growth mechanism
At the initial stage of anodization of aluminum, the sites of pore initiation are spread
randomly over the aluminum surface. The ordering of the cell arrangement only proceeds with
the anodizing time after steady state in the growth of the porous structure is established.61, 62, 72 In
addition, it is also known that the cell size and barrier-layer thickness are directly related to the
anodizing potential.58, 61, 62, 71, 72
The proposed mechanism for the formation of highly ordered porous alumina membranes
has been explained as the result of two competing processes: 1) the pore initiation process due to
a geometric effect, which is called “field-assisted dissolution process”72 and 2) the self-
30
organization of the pores which is considered to be triggered by mechanical stress at the
alumina/aluminum interface.76
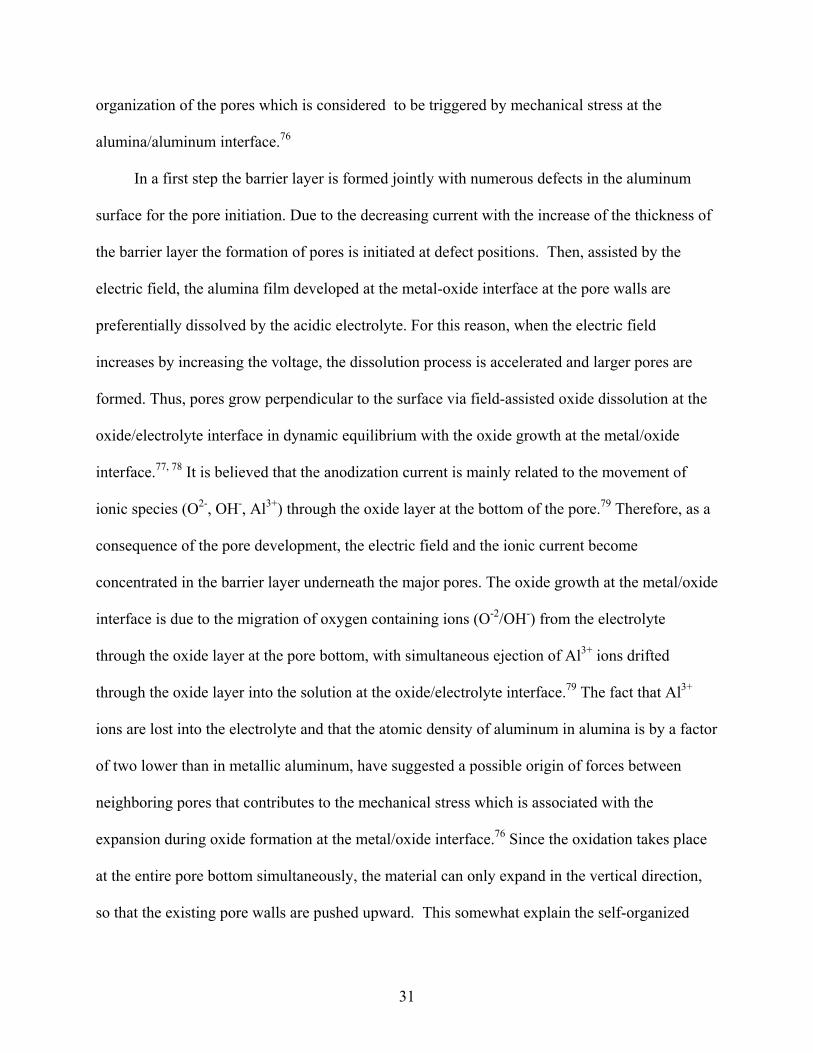
In a first step the barrier layer is formed jointly with numerous defects in the aluminum
surface for the pore initiation. Due to the decreasing current with the increase of the thickness of
the barrier layer the formation of pores is initiated at defect positions. Then, assisted by the
electric field, the alumina film developed at the metal-oxide interface at the pore walls are
preferentially dissolved by the acidic electrolyte. For this reason, when the electric field
increases by increasing the voltage, the dissolution process is accelerated and larger pores are
formed. Thus, pores grow perpendicular to the surface via field-assisted oxide dissolution at the
oxide/electrolyte interface in dynamic equilibrium with the oxide growth at the metal/oxide
interface.77, 78 It is believed that the anodization current is mainly related to the movement of
ionic species (O2-, OH-, Al3+) through the oxide layer at the bottom of the pore.79 Therefore, as a
consequence of the pore development, the electric field and the ionic current become
concentrated in the barrier layer underneath the major pores. The oxide growth at the metal/oxide
interface is due to the migration of oxygen containing ions (O-2/OH-) from the electrolyte
through the oxide layer at the pore bottom, with simultaneous ejection of Al3+ ions drifted
through the oxide layer into the solution at the oxide/electrolyte interface.79 The fact that Al3+
ions are lost into the electrolyte and that the atomic density of aluminum in alumina is by a factor
of two lower than in metallic aluminum, have suggested a possible origin of forces between
neighboring pores that contributes to the mechanical stress which is associated with the
expansion during oxide formation at the metal/oxide interface.76 Since the oxidation takes place
at the entire pore bottom simultaneously, the material can only expand in the vertical direction,
so that the existing pore walls are pushed upward. This somewhat explain the self-organized
31
arrangement of neighboring pores in hexagonal arrays by repulsive interactions between the
pores during the steady-state film formation after the pore initiation process.
Sol-Gel Chemistry at a Glance
The sol-gel processing of inorganic ceramic and glass materials has been known for a long
time but it has been commonly used since the mid-1900s, and comprehensively studied during
the past 30 years.80, 81 In recent years, the sol-gel chemistry has evolved as a powerful approach
for preparing micro- and nano-structured materials.82-85 Sol-gel materials display attractive
properties such as ease of preparation, low temperature synthesis, multiple structures with large
open spaces of tunable porosity, controllable hydrophobicity, capacity for chemical modification
of entrapment of various components, mechanical stability, and optical transparency.86-89
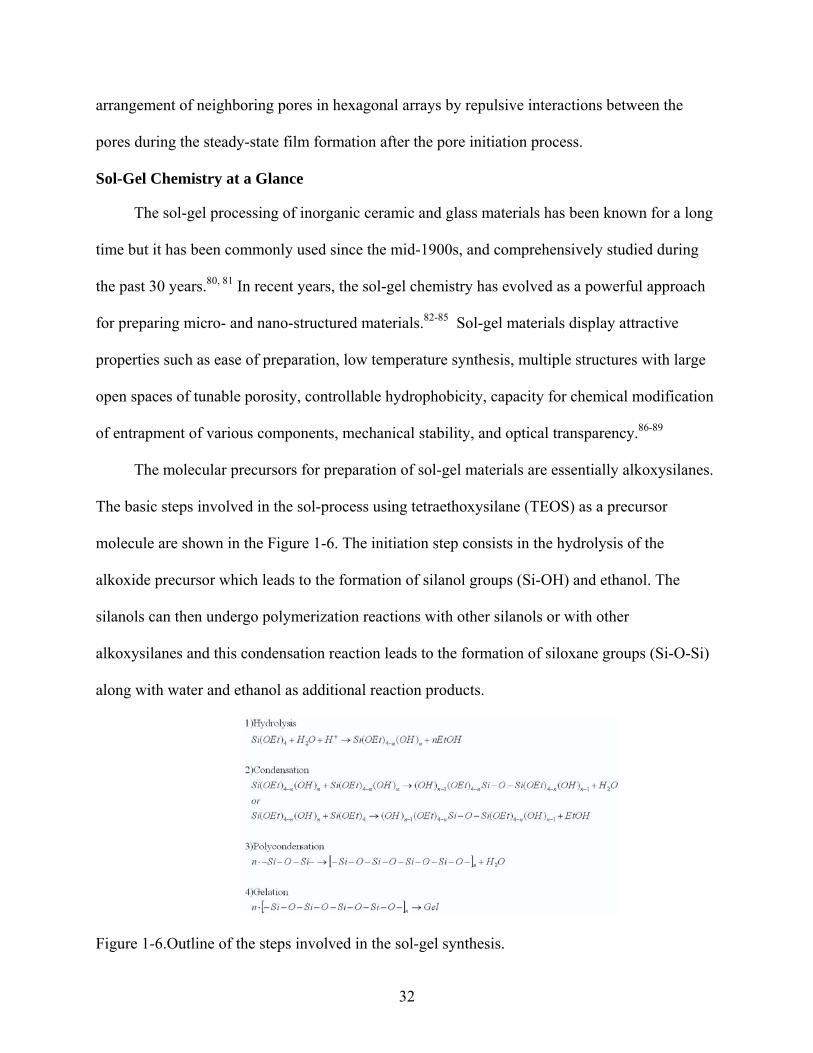
The molecular precursors for preparation of sol-gel materials are essentially alkoxysilanes.
The basic steps involved in the sol-process using tetraethoxysilane (TEOS) as a precursor
molecule are shown in the Figure 1-6. The initiation step consists in the hydrolysis of the
alkoxide precursor which leads to the formation of silanol groups (Si-OH) and ethanol. The
silanols can then undergo polymerization reactions with other silanols or with other
alkoxysilanes and this condensation reaction leads to the formation of siloxane groups (Si-O-Si)
along with water and ethanol as additional reaction products.
Figure 1-6.Outline of the steps involved in the sol-gel synthesis.
32
These reactions lead initially to the formation of molecular clusters, which then grow upon
polycondensation to produce a sol. This sol stage is produced when the particles formed are well
dispersed in the liquid phase to form colloids. In addition, depending on the experimental
conditions; this sol can be transformed in different ways. The usual case is gelation which occurs
when the colloidal particles link together to become a three-dimensional network. Upon solvent
extraction the gel is transformed into aerogel,90, 91 while solvent evaporation results in the
formation of xerogel.92, 93 Those are the two most common processes of converting gels into
silica. The maximum temperature for both processes can be kept under 100 °C.
The active silica surface with large specific surface area is of enormous utility to produce a
variety of modified silica via covalent bond by using silane reagents.94 By the insertion of
organic functional groups to silica surface there is a partial conversion of surface silanol to a new
organofunctional surface that acquires organophilic properties. Thus, the silane chemistry gives a
set of properties to the silica surface, which differs considerably from the original matrix.95
At the silica surface, the structure is composed of both siloxane groups (Si-O-Si) with the
oxygen atom on the surface, and one of the three forms of silanol groups (Si-OH).96 One of the
types of silanol groups found in silica surface is the isolated free silanol groups, where the
surface silicon atom has three bonds into the bulk structure and the fourth to the OH group. The
second type corresponds to the occurrence of two vicinal free silanol groups where the OH
groups are bridged by a H-bond. A third type of silanols called geminal silanol consists of two
hydroxyl groups attached to one silicon atom.97
Since the discovery of silanol groups on silica surfaces in 1936 by Kiselev,98 studies based
on theoretical calculations, physical methods and chemical methods have been explored in order
to quantify the number of silanol groups on the surface. At present, it is accepted that the
33
estimated number of OH groups accessible on porous silica surface is between 4 and 5 OH
groups per nm2 with an average surface area of 20.4-21.7 Ǻ2 per silanol group.94, 99 -101 In the
research reported here, we took advantage of this special attribute of the higher silanol groups on
silica surface for further silane functionalization, because when compared with alumina, the
number of estimated hydroxyl groups accessible on alumina surface is only 0.1-2.5 OH groups
per nm square.30, 102
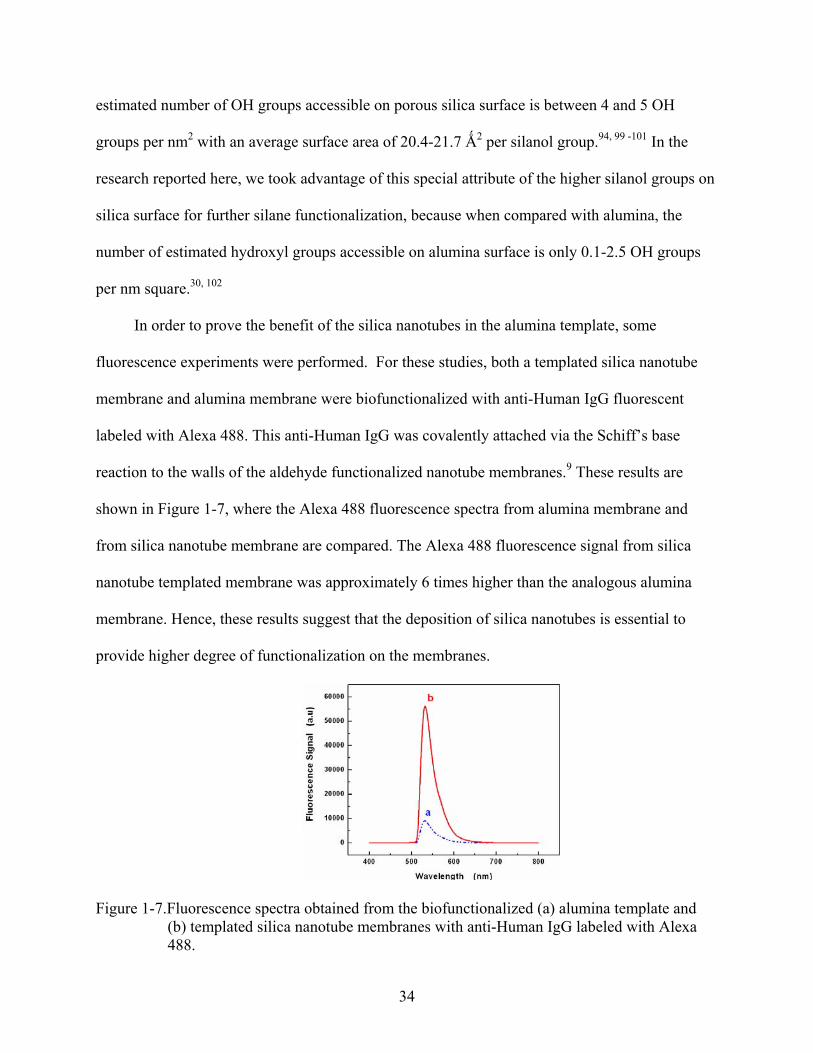
In order to prove the benefit of the silica nanotubes in the alumina template, some
fluorescence experiments were performed. For these studies, both a templated silica nanotube
membrane and alumina membrane were biofunctionalized with anti-Human IgG fluorescent
labeled with Alexa 488. This anti-Human IgG was covalently attached via the Schiff’s base
reaction to the walls of the aldehyde functionalized nanotube membranes.9 These results are
shown in Figure 1-7, where the Alexa 488 fluorescence spectra from alumina membrane and
from silica nanotube membrane are compared. The Alexa 488 fluorescence signal from silica
nanotube templated membrane was approximately 6 times higher than the analogous alumina
membrane. Hence, these results suggest that the deposition of silica nanotubes is essential to
provide higher degree of functionalization on the membranes.
Figure 1-7.Fluorescence spectra obtained from the biofunctionalized (a) alumina template and (b) templated silica nanotube membranes with anti-Human IgG labeled with Alexa 488.
34
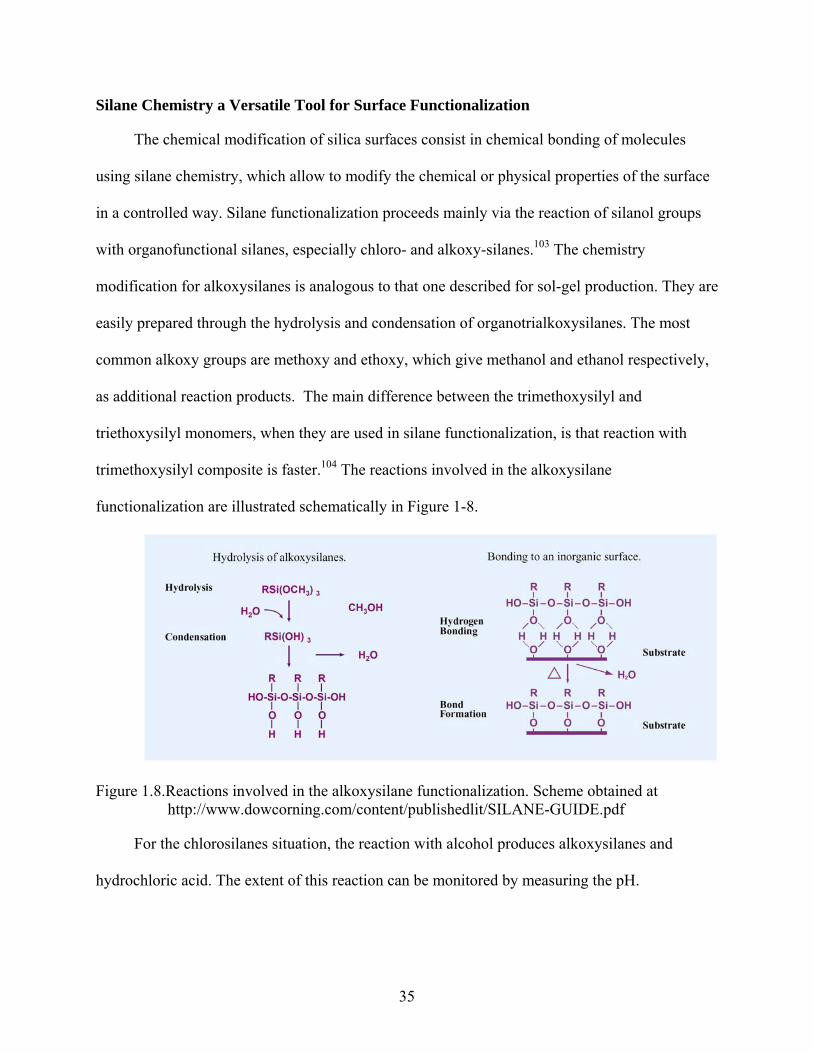
Silane Chemistry a Versatile Tool for Surface Functionalization
The chemical modification of silica surfaces consist in chemical bonding of molecules
using silane chemistry, which allow to modify the chemical or physical properties of the surface
in a controlled way. Silane functionalization proceeds mainly via the reaction of silanol groups
with organofunctional silanes, especially chloro- and alkoxy-silanes.103 The chemistry
modification for alkoxysilanes is analogous to that one described for sol-gel production. They are
easily prepared through the hydrolysis and condensation of organotrialkoxysilanes. The most
common alkoxy groups are methoxy and ethoxy, which give methanol and ethanol respectively,
as additional reaction products. The main difference between the trimethoxysilyl and
triethoxysilyl monomers, when they are used in silane functionalization, is that reaction with
trimethoxysilyl composite is faster.104 The reactions involved in the alkoxysilane
functionalization are illustrated schematically in Figure 1-8.
Figure 1.8.Reactions involved in the alkoxysilane functionalization. Scheme obtained at http://www.dowcorning.com/content/publishedlit/SILANE-GUIDE.pdf
For the chlorosilanes situation, the reaction with alcohol produces alkoxysilanes and
hydrochloric acid. The extent of this reaction can be monitored by measuring the pH.
35
The decision of using organosilanes with one or more than one hydrolyzable groups for
silane functionalization depends on the particular set of properties desired in the new
functionalized surface. Thus, when a hydrophobic surface is preferred, organosilanes with one
hydrolyzable group are used.103 If surfaces with higher degree of surface modification are
desired, organosilanes with two or three hydrolyzable groups are used.103
An alternative way of generating one monolayer of the desired silane monomer on silica
substrates is by conducting silane chemistry of chlorosilanes in aprotic solvents.105, 106 In
conditions where the aprotic solvent and surface are water free, no alkoxysilane is produced, and
no polymerization of the chlorosilane can take place. Therefore, the reaction must be promoted
by nucleophilic substitution; where the nucleophile hydroxyl groups in the surface attack the
primary halide carbon in the chlorosilane moiety. Surface modification in those cases takes
longer time, usually 12-24 hours.
Thereby, surface modification via silane functionalization provides a unique opportunity to
regulate the interfacial properties of silica substrates while their basic structure and mechanical
strength are preserved.
Nature’s Transport across Membranes: An Inspiration for Membrane-Based Separations
Biological membranes are vital components of all living systems, forming the external
boundary of the living cells and the internal organelles into the cytoplasm.107 They are
constituted mainly of various lipids arranged in a bilayer that imparts a fluid character. Thus,
both lipids and proteins are free to move within a bilayer. The proteins embedded in the bilayer
and the carbohydrates attached to its surface, facilitate communication and transport across the
membrane. In the living membranes, there are two types of membrane proteins which are
involved in transport and signaling activities. Those are the peripheral and integral (or intrinsic)
36
proteins. Peripheral proteins interact through electrostatic forces and hydrogen bonds with the
surface of bilayers. While integral proteins are strongly associated with the bilayer itself.
These functional characteristics described above, enable membranes to act as essential
filters in different living processes that depend on membrane transport systems, such as the
acquisition of nutrients, the elimination of waste materials, the transport of metabolites, the
generation of concentration gradients vital for nerve impulse transmission and for the normal
function of brain, heart, kidneys and other organs.107
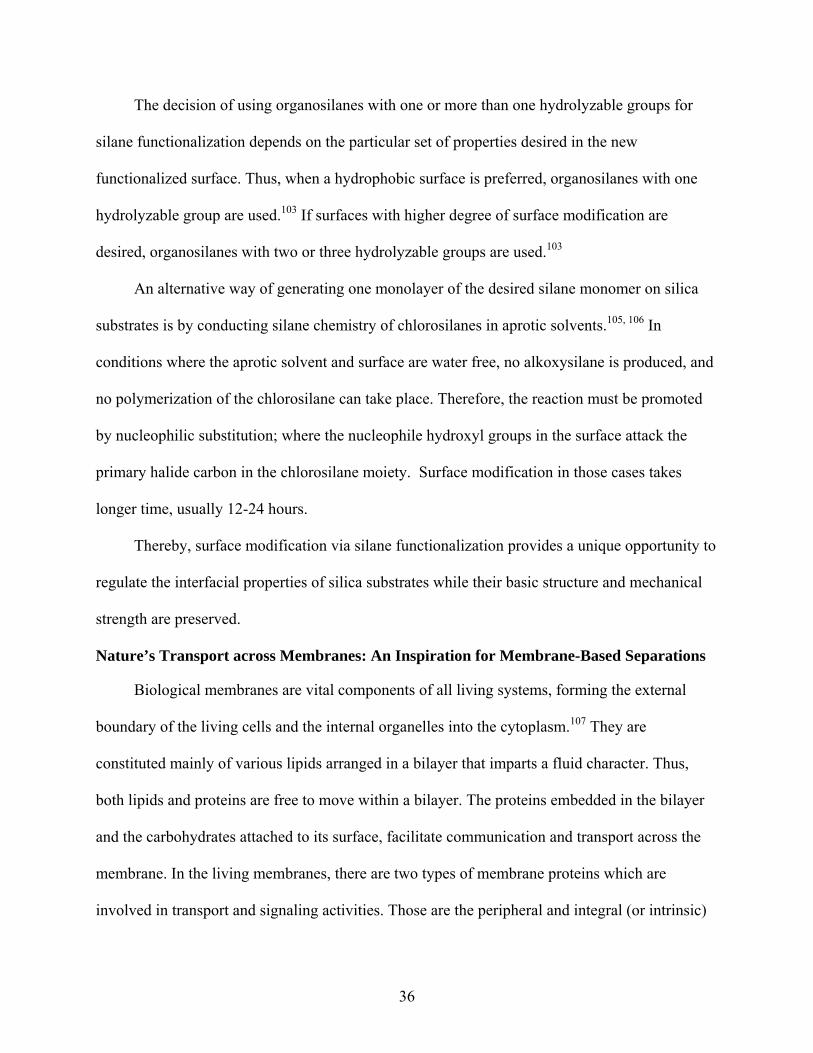
All transport processes in living membranes are mediated by the transport proteins which
may function either as channels or carriers. In transport mediated by carrier proteins, only the
specific binding molecule is transported. Carrier proteins cycle between conformations that
allow molecules to pass to the other side of the membrane. There is never an open conduit all the
way through the membrane with carrier proteins. Channels on the other hand, form open pores
through the membrane that permits the free diffusion of molecules of appropriated size and
charge. These two types of specialized transport systems are illustrated schematically in Figure
1-9.
Figure 1-9.Types of specialized transport in living membranes (A) carriers, and (B) channels.
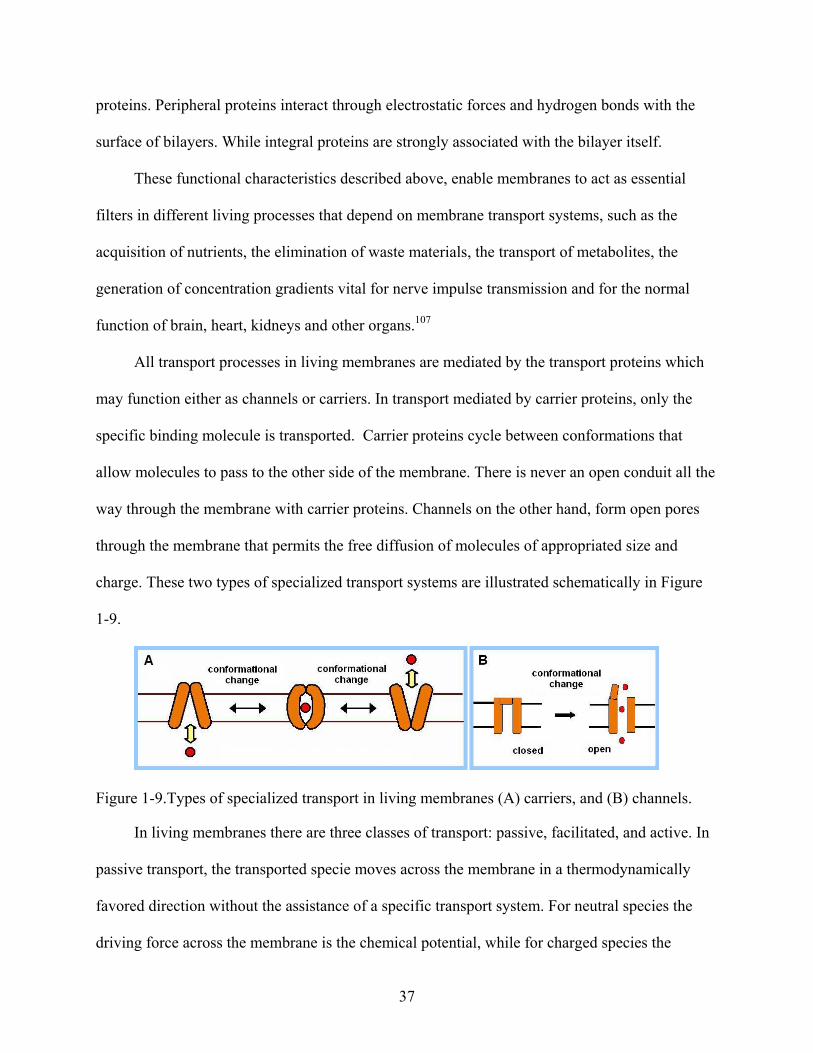
In living membranes there are three classes of transport: passive, facilitated, and active. In
passive transport, the transported specie moves across the membrane in a thermodynamically
favored direction without the assistance of a specific transport system. For neutral species the
driving force across the membrane is the chemical potential, while for charged species the
37
driving force is the electrochemical potential. In addition, the flux of uncharged molecules across
the membrane is linearly dependent on concentration.
In facilitated transport, the transported species moves also according to a
thermodynamically favored direction, but with the collaboration of a specific transport system
“the carrier”. Facilitated transport systems display saturation behavior, where the flux is still
dependent on concentration, but at high concentration the dependence is no longer linear. This
behavior is due to the saturation of the binding carrier sites as the concentration of the
transported species increases. Figure 1-10 compares the dependence on concentration of the flux
for the passive and facilitated transport systems.
Figure 1-10.Flux concentration dependence for passive and facilitated transport.
The third class of transport in living membranes corresponds to the active transport
systems. These use energy in order to transport the species against their thermodynamic
potential. The most usual energy supplier is the ATP hydrolysis, but light energy and the energy
stored in ion gradients are also used.107
Thus, inspired in the strategies that biological membranes use to accomplish transport,
scientists have explored the use of analog synthetic membranes with specific functionalization to
selectively conduce transport. Likewise, these systems function on the base of facilitated
38
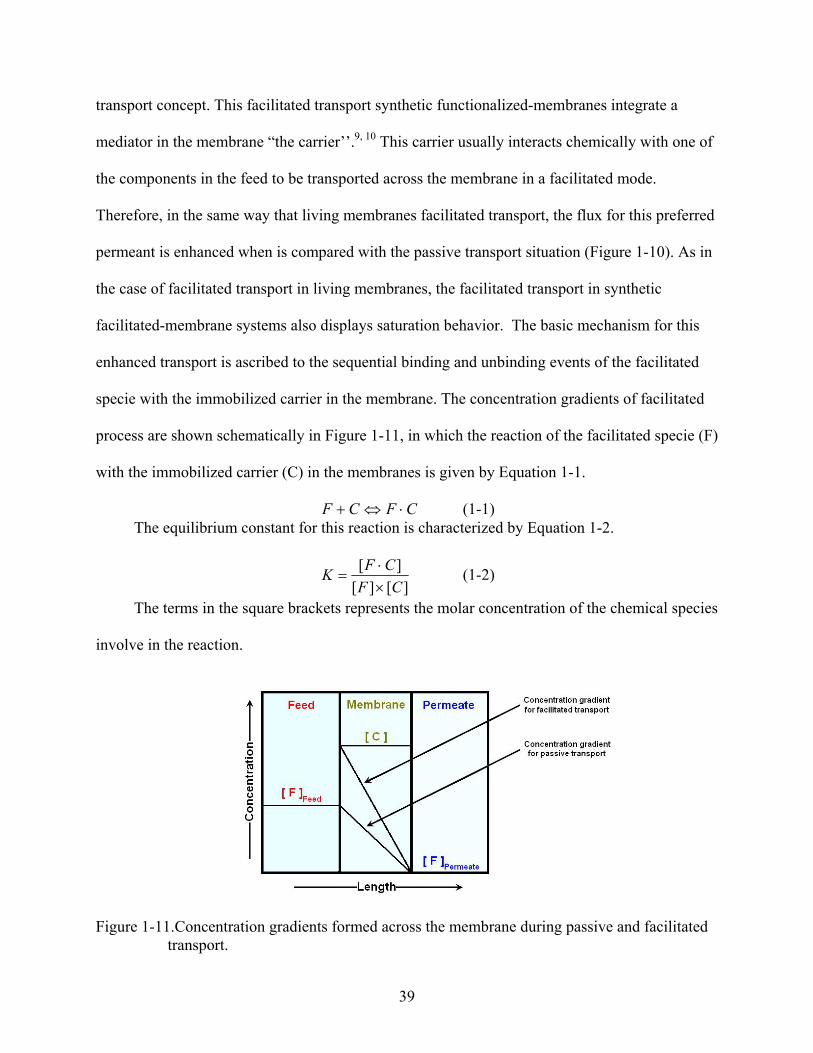
transport concept. This facilitated transport synthetic functionalized-membranes integrate a
mediator in the membrane “the carrier’’.9, 10 This carrier usually interacts chemically with one of
the components in the feed to be transported across the membrane in a facilitated mode.
Therefore, in the same way that living membranes facilitated transport, the flux for this preferred
permeant is enhanced when is compared with the passive transport situation (Figure 1-10). As in
the case of facilitated transport in living membranes, the facilitated transport in synthetic
facilitated-membrane systems also displays saturation behavior. The basic mechanism for this
enhanced transport is ascribed to the sequential binding and unbinding events of the facilitated
specie with the immobilized carrier in the membrane. The concentration gradients of facilitated
process are shown schematically in Figure 1-11, in which the reaction of the facilitated specie (F)
with the immobilized carrier (C) in the membranes is given by Equation 1-1.
CFCF ⋅⇔+ (1-1) The equilibrium constant for this reaction is characterized by Equation 1-2.
][][][
CFCFK×⋅
= (1-2)
The terms in the square brackets represents the molar concentration of the chemical species
involve in the reaction.
Figure 1-11.Concentration gradients formed across the membrane during passive and facilitated transport.
39
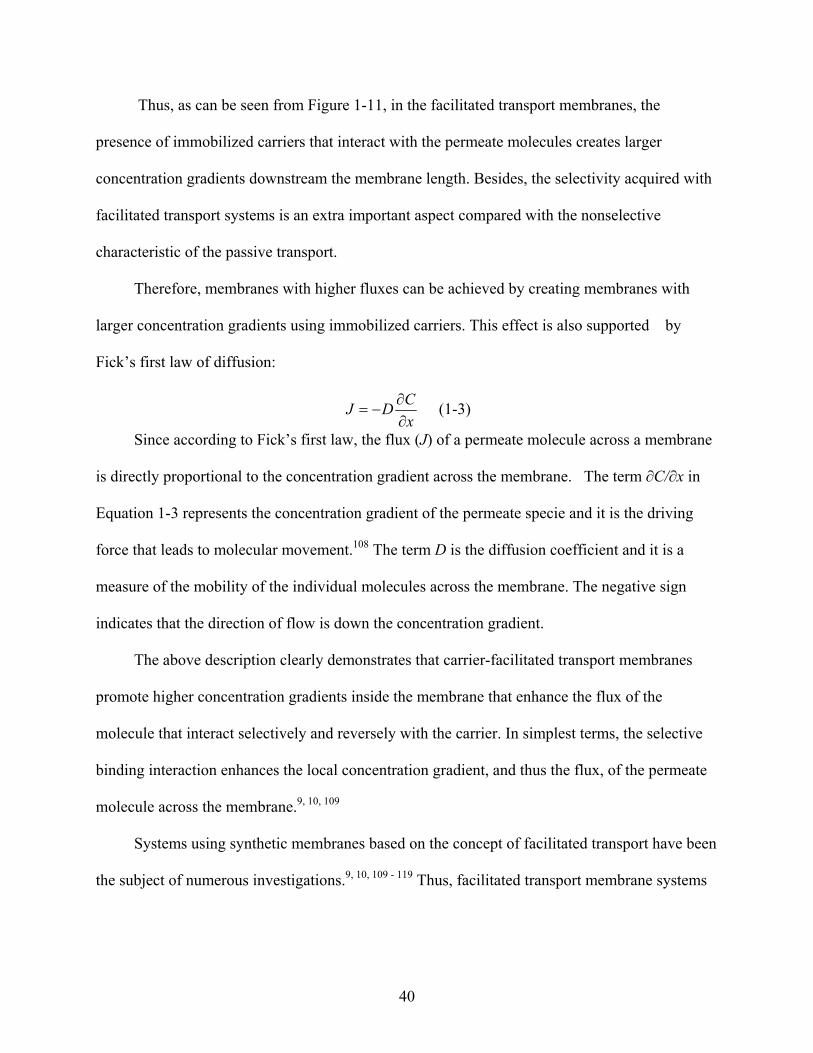
Thus, as can be seen from Figure 1-11, in the facilitated transport membranes, the
presence of immobilized carriers that interact with the permeate molecules creates larger
concentration gradients downstream the membrane length. Besides, the selectivity acquired with
facilitated transport systems is an extra important aspect compared with the nonselective
characteristic of the passive transport.
Therefore, membranes with higher fluxes can be achieved by creating membranes with
larger concentration gradients using immobilized carriers. This effect is also supported by
Fick’s first law of diffusion:
xCDJ∂∂
−= (1-3)
Since according to Fick’s first law, the flux (J) of a permeate molecule across a membrane
is directly proportional to the concentration gradient across the membrane. The term ∂C/∂x in
Equation 1-3 represents the concentration gradient of the permeate specie and it is the driving
force that leads to molecular movement.108 The term D is the diffusion coefficient and it is a
measure of the mobility of the individual molecules across the membrane. The negative sign
indicates that the direction of flow is down the concentration gradient.
The above description clearly demonstrates that carrier-facilitated transport membranes
promote higher concentration gradients inside the membrane that enhance the flux of the
molecule that interact selectively and reversely with the carrier. In simplest terms, the selective
binding interaction enhances the local concentration gradient, and thus the flux, of the permeate
molecule across the membrane.9, 10, 109
Systems using synthetic membranes based on the concept of facilitated transport have been
the subject of numerous investigations.9, 10, 109 - 119 Thus, facilitated transport membrane systems
40
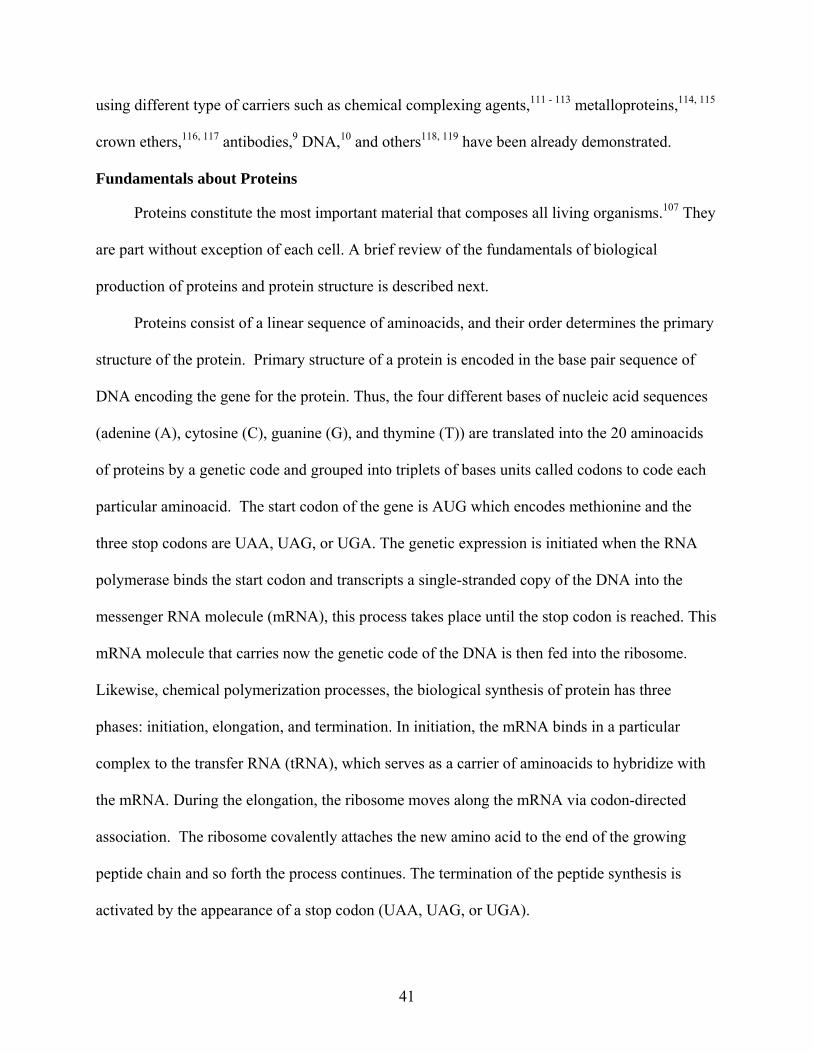
using different type of carriers such as chemical complexing agents,111 - 113 metalloproteins,114, 115
crown ethers,116, 117 antibodies,9 DNA,10 and others118, 119 have been already demonstrated.
Fundamentals about Proteins
Proteins constitute the most important material that composes all living organisms.107 They
are part without exception of each cell. A brief review of the fundamentals of biological
production of proteins and protein structure is described next.
Proteins consist of a linear sequence of aminoacids, and their order determines the primary
structure of the protein. Primary structure of a protein is encoded in the base pair sequence of
DNA encoding the gene for the protein. Thus, the four different bases of nucleic acid sequences
(adenine (A), cytosine (C), guanine (G), and thymine (T)) are translated into the 20 aminoacids
of proteins by a genetic code and grouped into triplets of bases units called codons to code each
particular aminoacid. The start codon of the gene is AUG which encodes methionine and the
three stop codons are UAA, UAG, or UGA. The genetic expression is initiated when the RNA
polymerase binds the start codon and transcripts a single-stranded copy of the DNA into the
messenger RNA molecule (mRNA), this process takes place until the stop codon is reached. This
mRNA molecule that carries now the genetic code of the DNA is then fed into the ribosome.
Likewise, chemical polymerization processes, the biological synthesis of protein has three
phases: initiation, elongation, and termination. In initiation, the mRNA binds in a particular
complex to the transfer RNA (tRNA), which serves as a carrier of aminoacids to hybridize with
the mRNA. During the elongation, the ribosome moves along the mRNA via codon-directed
association. The ribosome covalently attaches the new amino acid to the end of the growing
peptide chain and so forth the process continues. The termination of the peptide synthesis is
activated by the appearance of a stop codon (UAA, UAG, or UGA).
41
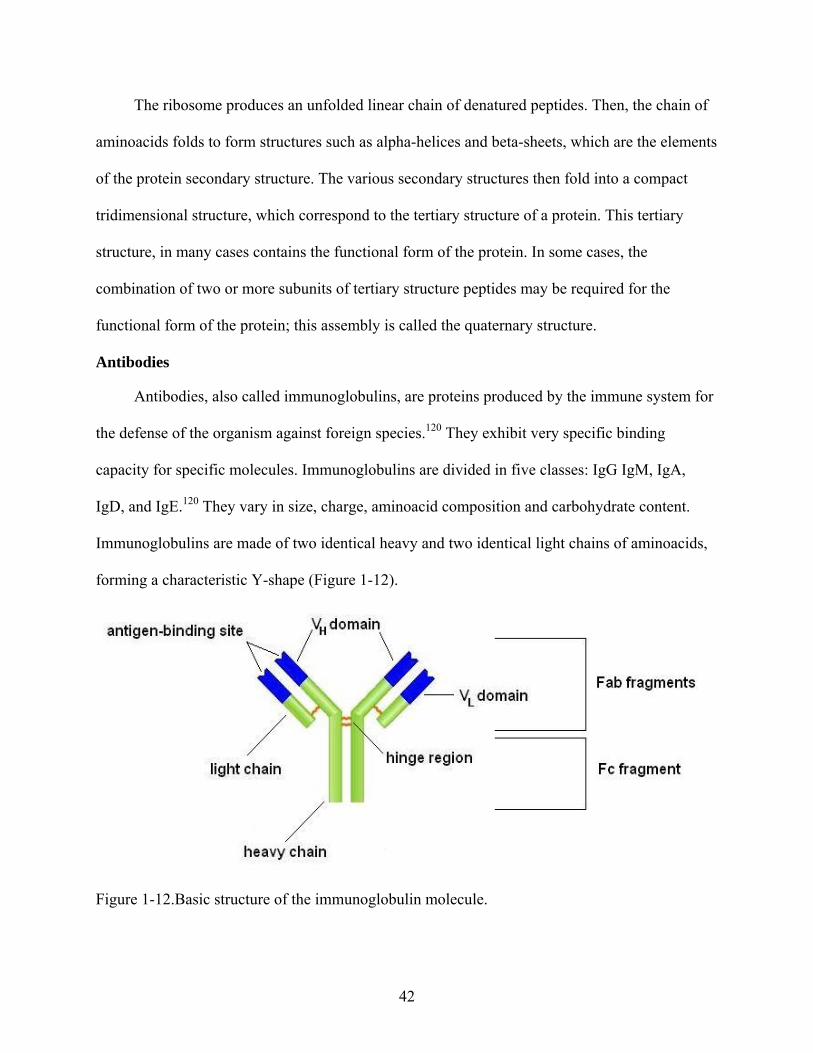
The ribosome produces an unfolded linear chain of denatured peptides. Then, the chain of
aminoacids folds to form structures such as alpha-helices and beta-sheets, which are the elements
of the protein secondary structure. The various secondary structures then fold into a compact
tridimensional structure, which correspond to the tertiary structure of a protein. This tertiary
structure, in many cases contains the functional form of the protein. In some cases, the
combination of two or more subunits of tertiary structure peptides may be required for the
functional form of the protein; this assembly is called the quaternary structure.
Antibodies
Antibodies, also called immunoglobulins, are proteins produced by the immune system for
the defense of the organism against foreign species.120 They exhibit very specific binding
capacity for specific molecules. Immunoglobulins are divided in five classes: IgG IgM, IgA,
IgD, and IgE.120 They vary in size, charge, aminoacid composition and carbohydrate content.
Immunoglobulins are made of two identical heavy and two identical light chains of aminoacids,
forming a characteristic Y-shape (Figure 1-12).
Figure 1-12.Basic structure of the immunoglobulin molecule.
42
The molecular weight of the heavy chains varies with the class of antibody. They are called
gamma, mu, alpha, delta and epsilon for IgG, IgM, IgA, IgD, and IgE, respectively. Based on
small polypeptide structural differences, there are two types of light chains classified as kappa
and lambda. This means that the polypeptides chains of immunoglobulins are encoded by three
different clusters of genes. One cluster encodes the heavy chains for all the classes and
subclasses of antibodies, a second one encode the kappa light chains and a third one the lambda
light chains. The four glycoprotein chains are connected to one another by disulfide (S-S) bonds
and noncovalent interactions. The variations in the number of disulfides bonds and the length of
the hinge region determine the subclasses of antibodies. This hinge region is a flexible structure
composed of aminoacids that enables the antibody to bind a couple of epitopes separated apart
on an antigen.
Immunoglobulins are bifunctional molecules. They have one region involved with the
antigen binding which is called the Fab portions of the antibody, and a second region called the
Fc portion which is involved in several biological activities. This Fc region is also used as a
binding site for manipulating the orientation of the antibody during many immunochemical
procedures, due to its capability to bind proteins G and A.121
The Fab portions have a well-defined tridimensional shape specifically designed to bind
the antigen, by a lock-and-key mechanism type. The binding between antigen-antibody entails
the formation of multiple intermolecular noncovalent forces in the pocket of the binding site as is
schematically shown in Figure 1-13.
There must be appropriate atomic groups on opposite sites of the antigen and antibody to
facilitate the binding between both proteins. Besides, the shape of the combining site must fit the
epitope in order to hold the simultaneous formation of noncovalent bonds. Thus, the formation
43
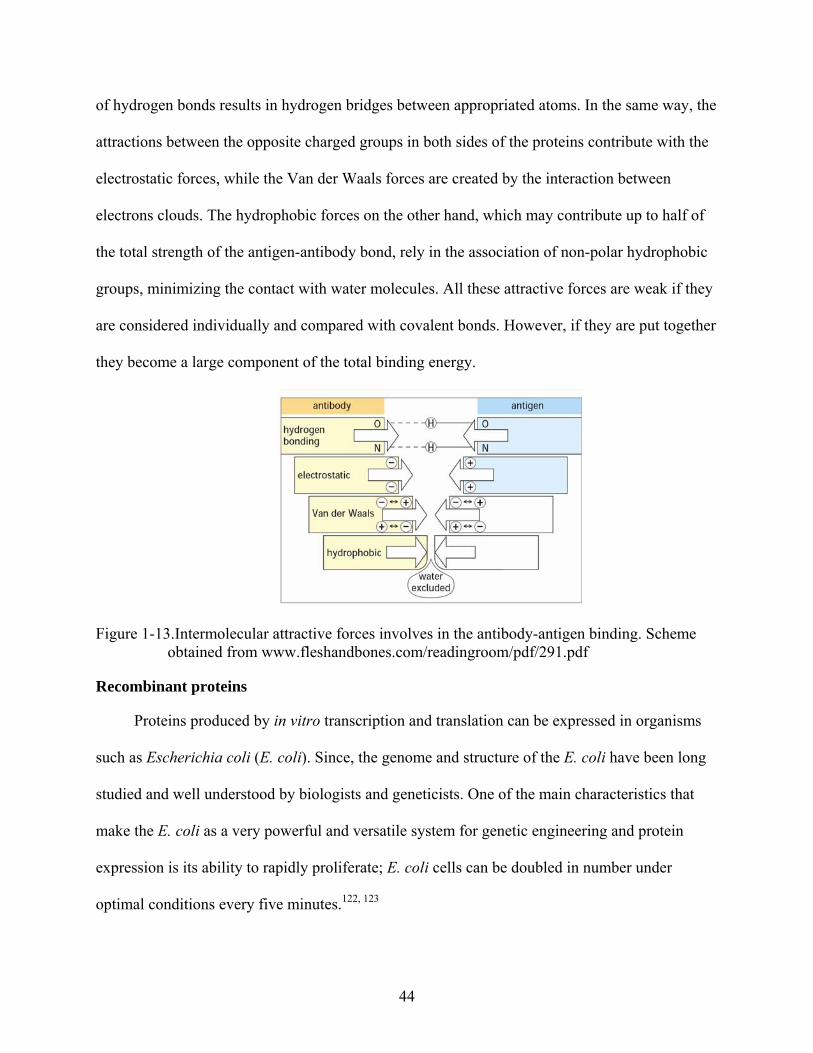
of hydrogen bonds results in hydrogen bridges between appropriated atoms. In the same way, the
attractions between the opposite charged groups in both sides of the proteins contribute with the
electrostatic forces, while the Van der Waals forces are created by the interaction between
electrons clouds. The hydrophobic forces on the other hand, which may contribute up to half of
the total strength of the antigen-antibody bond, rely in the association of non-polar hydrophobic
groups, minimizing the contact with water molecules. All these attractive forces are weak if they
are considered individually and compared with covalent bonds. However, if they are put together
they become a large component of the total binding energy.
Figure 1-13.Intermolecular attractive forces involves in the antibody-antigen binding. Scheme obtained from www.fleshandbones.com/readingroom/pdf/291.pdf
Recombinant proteins
Proteins produced by in vitro transcription and translation can be expressed in organisms
such as Escherichia coli (E. coli). Since, the genome and structure of the E. coli have been long
studied and well understood by biologists and geneticists. One of the main characteristics that
make the E. coli as a very powerful and versatile system for genetic engineering and protein
expression is its ability to rapidly proliferate; E. coli cells can be doubled in number under
optimal conditions every five minutes.122, 123
44
Recombinant proteins are produced from clone DNA (cDNA) sequences which usually
encode an enzyme or protein with a specific known function. Therefore, the process of genetic
engineering begins with the isolation and extraction of the gene of interest from the clone DNA.
This corresponds to the isolated DNA that is complementary to the mRNA that encodes the
protein of interest. The next step is inserting the gene of interest by cloning techniques into a
vector. The vector is just a small piece of DNA where foreign fragments of DNA may be
inserted. Thus, a vector functions like a "molecular carrier", which will carry fragments of the
gene of interest into a host cell. Those vectors are usually derived from plasmids, which are
small, circular, double-stranded DNA molecules occurring naturally in the cytoplasm of bacteria.
The vector thus incorporates an origin of DNA replication for the gene of interest into a host cell
like E. coli.122, 123 The production of the protein starts when these special engineered vectors are
inserted into E. coli where the recombinant protein of interest is expressed. Because this E. coli
duplicates rapidly, large amounts of E. coli cells containing the foreign gene can be grown in a
matter of short time.
In order to purify the expressed protein from the complex cell culture, it is a common
practice to tag on the vector, a sequence of DNA that introduces a specific functionality into the
expressed peptide to be used during protein purification. This tag or purification tool is placed in
the vector to create a small extension of aminoacids added to the N-terminal of the target protein.
This aminoacid sequence is usually designed to be a point of attack for a specific protease during
purification. Thus, after the recombinant protein is expressed and extracted from E. coli, the N-
terminal extension can be used to purify the protein and then cleavage it with a specific protease
to generate an almost natural N-terminus sequence of the target peptide.122, 123
45
Frequently, the introduction of a metal binding site in the expressed recombinant peptide is
placed for further purification. It has been demonstrated that an aminoacid sequence consisting
of 6 or more histidine residues in a row operate as a metal binding site for recombinant
proteins.124, 125 This hexa-His sequence is called a His-Tag. By using commercially available
vectors, the His-Tag sequence can be placed on the N-terminal of a target protein. This expressed
His-Tag recombinant protein can be simply purified by using immobilized-metal affinity
chromatography (IMAC).126, 127
Synopsis and Analytical Visualization of the Instrumental Techniques
Fluorescence spectroscopy
The transport performance in membrane-based separation is normally investigated by
permeation experiments of the systems in buffered-aqueous solutions of the permeant solutes to
separate. One of the analytical methods used in this investigation to characterize the fluxes of the
transported proteins across the membranes is fluorescence spectroscopy. This was achieved
through the use of simple photophysical probes such as fluorescent-labeled antibodies. The use
of fluorescence techniques for the study of proteins in solution is widespread. Fluorescence
spectroscopy is a very sensitive technique, making it possible to perform experiments on protein
solutions at very low concentration, minimizing the amount of molecules required for the
analysis and eliminating problems associated with aggregation and low solubility.128 - 130
Fluorescence is a characteristic process that occurs in certain type of molecules called
fluorophores that have the property of absorbing energy and then immediately releasing this
energy in the form of light.131 The fluorescence process basically consists of three stages:
excitation, lifetime of the excited state, and fluorescence emission.
46
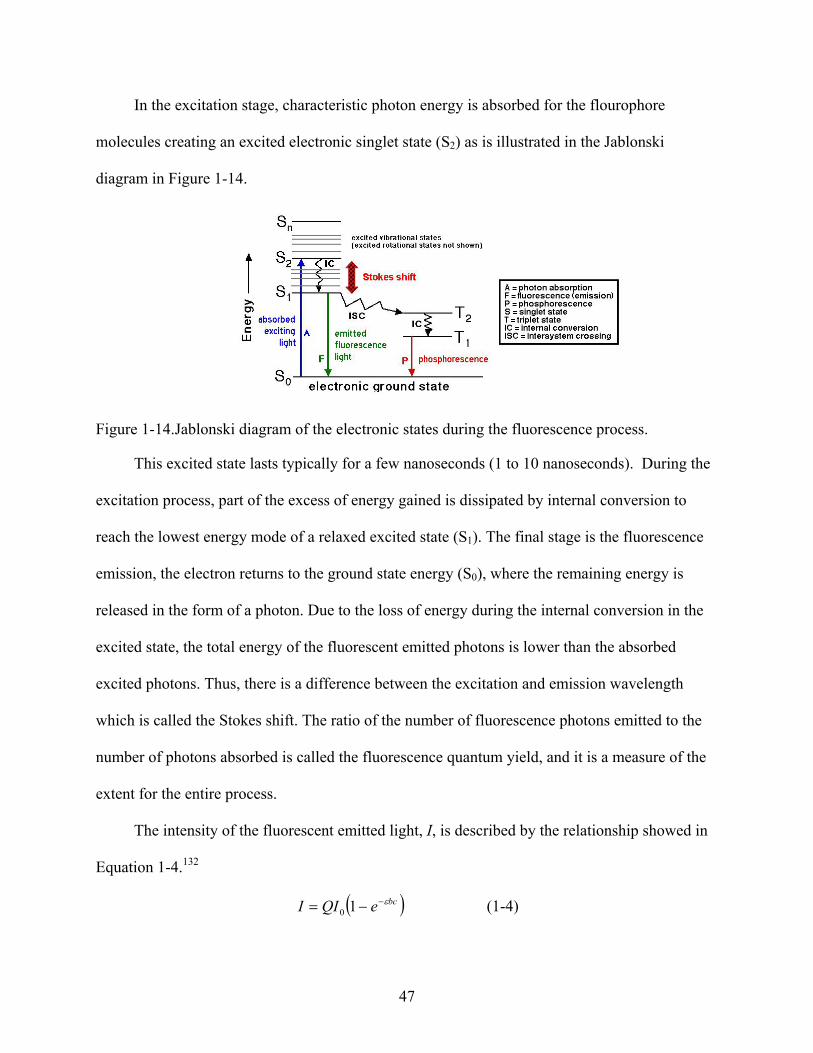
In the excitation stage, characteristic photon energy is absorbed for the flourophore
molecules creating an excited electronic singlet state (S2) as is illustrated in the Jablonski
diagram in Figure 1-14.
Figure 1-14.Jablonski diagram of the electronic states during the fluorescence process.
This excited state lasts typically for a few nanoseconds (1 to 10 nanoseconds). During the
excitation process, part of the excess of energy gained is dissipated by internal conversion to
reach the lowest energy mode of a relaxed excited state (S1). The final stage is the fluorescence
emission, the electron returns to the ground state energy (S0), where the remaining energy is
released in the form of a photon. Due to the loss of energy during the internal conversion in the
excited state, the total energy of the fluorescent emitted photons is lower than the absorbed
excited photons. Thus, there is a difference between the excitation and emission wavelength
which is called the Stokes shift. The ratio of the number of fluorescence photons emitted to the
number of photons absorbed is called the fluorescence quantum yield, and it is a measure of the
extent for the entire process.
The intensity of the fluorescent emitted light, I, is described by the relationship showed in
Equation 1-4.132
( )bceQII ε−−= 10 (1-4)
47
Where Q is the quantum yield, I0 is the incident radiant power, ε is the molar absorptive
coefficient, b is the path length of the cell, and c is the molar concentration of the fluorophore.
However, for dilute concentration (εbc < 0.05), the Equation 1-4 reduces to the form:
bcQII ε0= (1-5) Therefore, at dilute concentration of the fluorophore, the relationship between fluorescent
signal and concentration should be linear, if Q, I0, and ε are keeping constant.132
Fluorescence quenching
The fluorescence quenching phenomena refers to any process that decreases the
fluorescence intensity of the fluorophore molecules.131 The two general types of quenching
processes encountered are the collisional and static quenching. The collisional quenching is a
process that occurs during the excited state lifetime. In this case, the excited fluorophore
experience contact with an atom or molecule (the quencher) that facilitate non-radiant transitions
to the ground state. In the case of static quenching, the deactivation of the fluorescence intensity
is due to the reaction between fluorophore and quencher that leads to formation of a stable
complex in the ground state.
The role of fluorescence quenching can be experimentally studied by determining the
quenching rate parameters using the Stern-Volmer plots that are drawn in accordance with the
Stern-Volmer equation (Equation 1-6).131
[ ]QKII
SV+= 10 (1-6)
Where [Q] is the concentration of the quencher, I0 and I are respectively, the fluorescence
intensity in the absence and presence of quencher concentration, and KSV is the Stern-Volmer
quenching constant.
In the cases where the relationship of Io/I with [Q] is linear the quenching process can be
either collisional or static. However, those processes can be distinguished experimentally by
48
carrying out fluorescence measurements at diverse temperatures. Thus, the quenching
mechanism is mainly ascribed to a collisional process when at higher temperatures the system
present larger values of KSV. Conversely, for the cases of quenching via complex formation,
higher temperatures show smaller KSV; in this case KSV is related to the association constant of
the complex (Ka). In situations, where the fluorescence ratio as a function of the quencher
concentration reveals a positive deviation of the linear Stern-Volmer plot, it corresponds to a
combined process of both collisional and static quenching. For such a case a modified Stern-
Volmer equation is given by Equation 1-7.
( )( ][1][10 QKQKII
aSV ++= ) (1-7)
Therefore, the upward curvature in the Stern-Volmer plot is due to the contribution of the
square term (second power) of [Q] in the Equation 1-7.
FTIR-ATR spectroscopy
Fourier Transform Infrared - Attenuated Total Reflection spectroscopy is an appropriate
technique for the characterization of the surface of materials. This technique combines the
capabilities of chemical structure identification offered by the infrared spectroscopy mutually
with the fundamental properties of the total internal reflection techniques. The origin of the
internal reflection techniques is involved with the fact that radiation propagating in an optical
medium having higher refractive index (n1) experiences total internal reflection at the interface
of a contiguous sample medium with lower refractive index (n2). This formed propagated wave,
which penetrates a small portion of the sample medium, is called evanescent.133 This
phenomenon takes place only when the angle of incidence of the radiant wave exceeds a critical
angle, θc, which can be determined by using Snell’s law (Equation 1-8).
1
2
2
1
sin sin
nn
=θθ (1-8)
49
It is known that in the position of the critical angle, the angle of refraction, θ2, is 90°.
Consequently, the angle of incidence is the critical angle and the Snell’s equation is reduced to
Equation 1-9:
1
2sinnn
c =θ (1-9)
The critical angle, θc, can therefore be found simply by knowing the refractive indexes of
the two mediums.
It is worth mentioning that the evanescent wave is nontransverse, which allows all its
vector components to interact with the dipoles in all directions, thus this wave is a very
informative probe of the sample material.134
During FTIR-ATR analysis, the infrared radiation is passed through an infrared
transmitting crystal characterized by having a high refractive index, allowing the radiation to
reflect within the crystal several times. Along with each reflection in the transmitting crystal, at
the top surface, the evanescent wave penetrates the sample in order to explore the surface
material. It should be pointed out that the depth of penetration and the total number of
reflections along the crystal can be controlled either by varying the angle of incidence or by
selection of crystals. According to Equation 1-10, the penetration depth of the evanescent wave
in the sample material can be controlled by the selection of transmitting crystal, since each
crystal posses its own refractive index.
2/12
1
221 sin2 ⎥
⎦
⎤⎢⎣
⎡⎟⎠⎞⎜
⎝⎛−
=
nnn
d
θπ
λ (1-10)
Where λ is the wavelength of the IR radiation, n2 and n1 are the refractive index of the
sample and the refractive index of the crystal respectively, and θ is the angle of incidence.
Therefore, crystals with higher refractive index allow lower penetration depths. The depth of
50
penetration of the evanescent wave, d, is defined as the distance generated at the crystal-sample
interface where the intensity of the evanescent decays exponentially to 37% of its original
value.135
X-ray Photoelectron Spectroscopy (XPS)
XPS also known as ESCA (Electron Spectroscopy for Chemical Analysis) alike to FTIR-
ATR is a surface analysis technique, which defer in the depth of sample analysis and obviously
in the incident source of excitation. For example, XPS probes only 5 to 10 nm depth whereas
FTIR-ATR allows the detection of chemical species found in the first few microns of the sample
material.136 The XPS analysis is based upon the principles of the photoelectric effect, where the
surface material is irradiated with monochromatic X-rays creating photoelectrons that are
emitted from the sample surface. These ejected electrons come from the core level electrons of
the atoms dispose on the surface material.137 The emitted energy from the photoelectrons is then
analyzed by an electron analyzer spectrometer to determine the binding energy of the electrons.
From the binding energy and intensity of a photoelectron signal, it is possible to determine the
elemental identity, chemical state, and quantity of an element. It should be pointed out that
experimentally the kinetic energy (Ek) of the electrons is the physical parameter measured by the
electron analyzer spectrometer and not its binding energy (Eb). However, it is really Eb that
provides the specific properties of an electron, because Ek is not an intrinsic property of the
analyzed material since this also depends on the photon energy of the X-rays employed during
the analysis. The Equation 1-11 includes all the parameters involved in the XPS analysis and
combines the relationship between Eb and Ek.
WEhE kb −−= υ (1-11)
51
Where hυ is the photon energy and W is the spectrometer work function. Thus, the binding
energy of the electron is simply measured by the other three quantifiable parameters included in
Equation 1-11.
The XPS spectrum is composed only for the peaks of those electrons that escape the
surface without energy loss. The electrons that suffer inelastic scattering and undergo energy loss
contribute to the background of the spectrum.137
As any other energy excitation process, the excess of energy in the excited state must be
released or transformed in some way of energy. Thus in XPS, the ionized atom formed after the
emission of a photoelectron must have some type of relaxation mechanism. This might be
accomplished by X-ray fluorescence emission or by ejection of an Auger electron. This
relaxation mechanism explains why during the XPS process, peaks for Auger electrons are also
observed.
Scanning Electron Microscopy (SEM)
SEM is a microscope that uses electrons rather than light to form an image. It is created by
focusing a high energy beam of electrons onto the surface. Once the focused electrons hit the
surface, secondary and backscattered electrons are ejected from the specimen.138 Those are
collected in specific detectors and converted into a signal that is sent to a TV scanner where the
image is processed and viewed as a digital image.
It is worth mentioning that secondary electrons are low energy electrons (< 50 eV) that are
originated within a few nanometers depth of the specimen. Whereas backscattered electrons are
those electrons generated after incident electrons are scattered within the specimen volume and
they are reflected or backscattered out of the specimen interaction volume keeping high energy.
Backscattered electrons are useful to distinguish contrast between areas with different chemical
composition because the image created with them depends on the mean atomic number of the
52
substances that constitute the specimen.138 Usually the SEM instruments are equipped with a set
of two detectors to allow separate observations of topography (TOPO) image and composition
(COMPO) image.
Impedance spectroscopy
Impedance spectroscopy is an effective method to probe interface properties of surface-
modified electrodes. Generally there are two categories in impedance measurements: non-
faradaic and faradaic impedance. Non-faradaic impedance is performed in the absence of any
redox probe, which has been a method used for measuring changes in the electrical properties of
synthetic membranes.139, 140 Instead, electrochemical impedance is a faradaic impedance
technique that is performed in the presence of a redox probe. Impedance is usually measured
applying an AC potential to an electrochemical cell or electrical circuit and measuring the
current going trough these.141, 142
Impedance is expressed as a complex number. The complex impedance can be represented
as the sum of real, Zre (ω), and imaginary, Zim (ω), components originated mainly from the
resistance and capacitance of the system, respectively. The general electronic circuit, includes
the ohmic resistance of the electrolyte, Rs, the Warburg impedance, ZW, resulting from the
diffusion of ions from the bulk electrolyte to the electrode, the double layer capacitance, Cdl, and
the interfacial electron transfer resistance, Ret, present when a redox probe exist in the
electrolyte. In the cases of non-faradic impedance, as measuring the electrical properties of
synthetic membranes, this resistance can be associated with the changes in resistance across the
membrane, Rm. The components Rs and RW represent bulk properties of the electrolyte solution
and diffusion features of the probe in solution. The other two components in the circuit, Cdl and
Ret, represent interfacial properties of the electrode and they are affected by immobilization of
bio-organic material onto electrode surfaces.141 Thus, analysis of Cdl and Ret can give important
53

information about the extent of changes of the surfaces properties resulting from coupling of
biomaterial to the studied interface.142
A typical impedance data is represented in the form of Nyquist plot. The shape of this plot
includes a semicircle region lying on the Zre-axis followed by an incline line. The semicircle
region observed at higher frequencies corresponds to the kinetic limited process. Whereas the
linear part characteristic of the lower frequency range represents diffusional limited process. In
the Nyquist plot Rs can be found by reading the real axis value at the high frequency intercept.
While the sum of Rm and Rs can be found by fitting the semicircle until the real axis value at the
lower frequency intercept.
Nyquist plot present one shortcoming, when looking at any point on the plot, it cannot tell
what frequency was used to record that point. There is another popular representation of the
impedance data called the Bode plot. For this, the impedance is plotted with log frequency on the
x-axis, and both the absolute value of impedance and the phase-shift on the y-axis.141
54

CHAPTER 2 TRANSPORT AND FUNCTIONAL BEHAVIOR OF ANTIBODY-FUNCTIONALIZED
NANOTUBE MEMBRANES
Introduction
Today separation and analyses of proteins present important challenges for modern
bioanalytical chemistry. It is clear that the most important frontier in the biomedical sciences
and in the disease diagnostic is proteomics. The fact that mainly proteins execute and control
cellular phenomena opens up the use of proteins as important molecular targets for drugs, and
biomarkers for diseases.143 Proteomics aims to understand complex biological systems by
analyzing protein expression, protein function, protein modifications, and protein interactions.144
Within the proteome-analysis strategies, separation techniques play an important role.145 The 2D
gel electrophoresis in combination with mass spectrometry is the most widely used
separation/identification technology in proteomics.145 - 147 However, there are a number of
approaches to separate proteins based on their biochemical and biophysical features such as
molecular weight, hydrophobicity, surface charge, isoelectric point, etc. that have also been
developed and employed.148 - 151 In addition to these chromatographic methods, synthetic
membranes have been used for protein separations.3 - 7, 152 - 164 Nevertheless, the membranes used
to date typically separate proteins on the basis of size and charge, and these rudimentary forms of
selectivity are insufficient to allow membranes to compete with chromatographic methods for
protein separations.
The use of affinity chromatography, however, has the advantage of offering a process that
is specific for the protein of interest, overcoming the lack of selectivity and simplicity that many
of the common methods of analysis undergo. We report here systems that exploit the advantages
of affinity chromatography in a nanometer-scale membrane-based platform. In that search for
new advanced membrane materials, our group has conducted fundamental studies in the
55
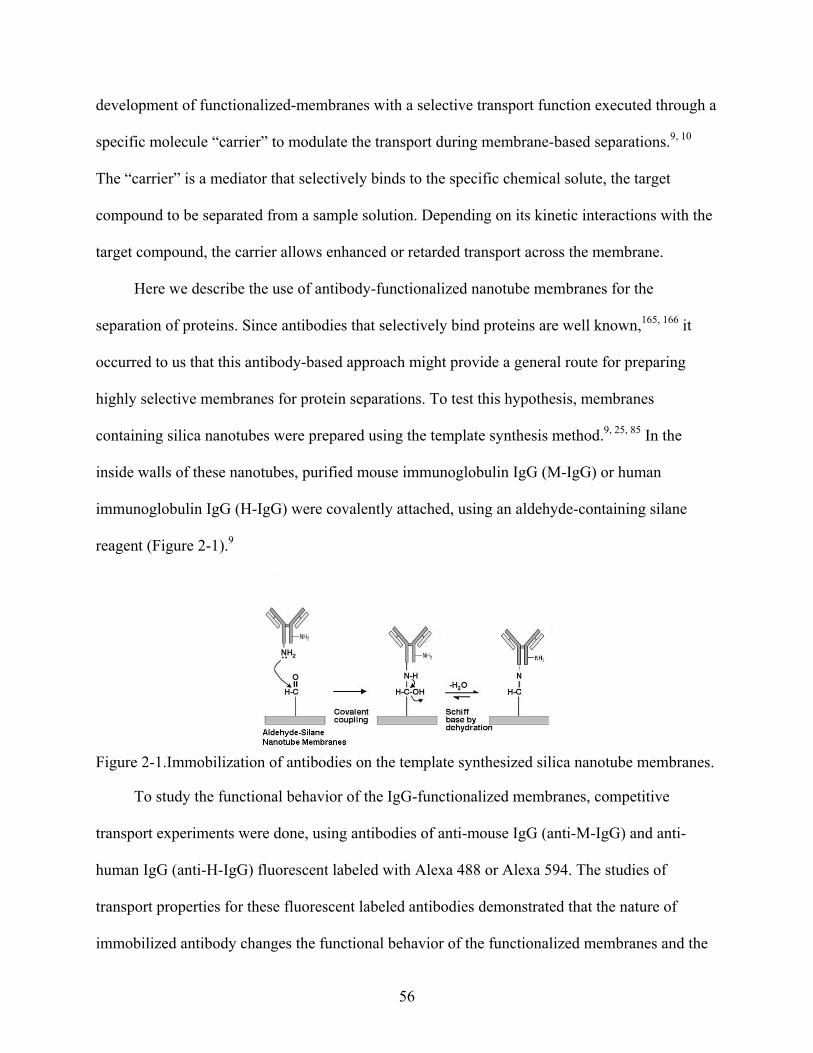
development of functionalized-membranes with a selective transport function executed through a
specific molecule “carrier” to modulate the transport during membrane-based separations.9, 10
The “carrier” is a mediator that selectively binds to the specific chemical solute, the target
compound to be separated from a sample solution. Depending on its kinetic interactions with the
target compound, the carrier allows enhanced or retarded transport across the membrane.
Here we describe the use of antibody-functionalized nanotube membranes for the
separation of proteins. Since antibodies that selectively bind proteins are well known,165, 166 it
occurred to us that this antibody-based approach might provide a general route for preparing
highly selective membranes for protein separations. To test this hypothesis, membranes
containing silica nanotubes were prepared using the template synthesis method.9, 25, 85 In the
inside walls of these nanotubes, purified mouse immunoglobulin IgG (M-IgG) or human
immunoglobulin IgG (H-IgG) were covalently attached, using an aldehyde-containing silane
reagent (Figure 2-1).9
Figure 2-1.Immobilization of antibodies on the template synthesized silica nanotube membranes.
To study the functional behavior of the IgG-functionalized membranes, competitive
transport experiments were done, using antibodies of anti-mouse IgG (anti-M-IgG) and anti-
human IgG (anti-H-IgG) fluorescent labeled with Alexa 488 or Alexa 594. The studies of
transport properties for these fluorescent labeled antibodies demonstrated that the nature of
immobilized antibody changes the functional behavior of the functionalized membranes and the
56
transport properties of the permeant proteins across them. Additional characterization of these
antibody-based membranes showed a Langmuirian shape plot characteristic of a typical
facilitated transport membrane when the effect of feed solution concentration on the fluxes of
these fluorescent-labeled antibodies was investigated.
Experimental
Materials
Commercially available nanopore alumina membranes (60 µm thick, nominal pore
diameter 100 nm) were obtained from Whatman. Tetraethyl orthosilicate 99.999% (TEOS)
(Sigma Aldrich) was used to deposit the silica nanotubes within the pores of these membranes.
The purified mouse immunoglobulin (M-IgG) immobilized within the silica nanotube
membranes was obtained from Sigma Aldrich. Membranes modified with purified human
immunoglobulin (H-IgG) obtained from Sigma Aldrich were also prepared. A recombinant
protein G obtained from Sigma Aldrich was used for well oriented antibody-immobilization
membranes. A trimethoxysilyl poly(ethylene glycol) (PEG-Si, MW 460-590 Da) obtained from
Gelest (Morrisville, PA) was used to modify the silica nanotubes control membranes. A
trimethoxysilyl propyl aldehyde (United Chemical Technologies) was used to attach the M-IgG
or H-IgG to the nanotubes. Two whole antibodies raised in goat against M-IgG were used to
investigate the transport properties of the M-IgG-modified membranes. These anti-M-IgGs were
obtained from Molecular Probes (Eugene, OR) conjugated with either the dye Alexa 488 or the
dye Alexa 594.
The transport properties of two control IgGs, raised in goat against human IgG (H-IgG),
were also investigated. These anti-H-IgGs were also obtained from Molecular Probes
conjugated with either Alexa 488 or Alexa 594. It is worthy to mention that these four
conjugated antibodies were also used to investigate the transport properties of the H-IgG
57
modified membranes. In this case the two control IgGs were the anti-M-IgG. A F(ab)2 fragment
antibody raised in goat against human IgG (F(ab)2-anti-H-IgG) and labeled with FITC
fluorophore was also used for transport experiments. This F(ab)2-anti-H-IgG antibody was
obtained from Molecular Probes. SuperBlock® blocking buffer solution in phosphate-buffered
saline was obtained from Pierce. SuperBlock® solution contains a proprietary protein for
blocking binding sites for non-specific protein adsorption. Tween 20 was obtained from Sigma
Aldrich. All other chemicals were of reagent grade and used as received. Purified water,
obtained by passing house-distilled water through a Barnstead, E-pure water-purification system,
was used to prepare all solutions.
Preparation of the Silica Nanotube Membranes
Silica nanotubes were deposited in the pores of the alumina membrane using the sol-gel-
based template-synthesis method.9, 25, 85 Briefly, a sol-gel precursor solution was prepared by
mixing absolute ethanol, TEOS and 1 M HCl (50:5:1 by volume), and this solution was allowed
to hydrolyze for 30 minutes. The alumina membrane was then immersed into this solution for
two minutes under sonication. The membrane was then removed and the surfaces swabbed with
ethanol to remove precursor from the alumina surface. The membrane was then air dry for ten
minutes at room temperature and cured in an oven for 12 hours at 150 ºC. This yields silica
nanotubes, with wall thickness of ~3 nm, embedded within the pores of the alumina membrane.9
Antibody Immobilization
The trimethoxy aldehyde silane was first attached to the inside walls of the silica
nanotubes to introduce aldehyde terminal groups onto the pores of the membrane.9 The
membrane was then immersed into a solution that was 1.0 mg per mL in either M-IgG or H-IgG
dissolved in 10 mM phosphate-buffered saline with pH = 7.4 that also contained 150 mM
sodium chloride and 5 mM sodium azide. The membrane was incubated overnight at 4 ºC,
58
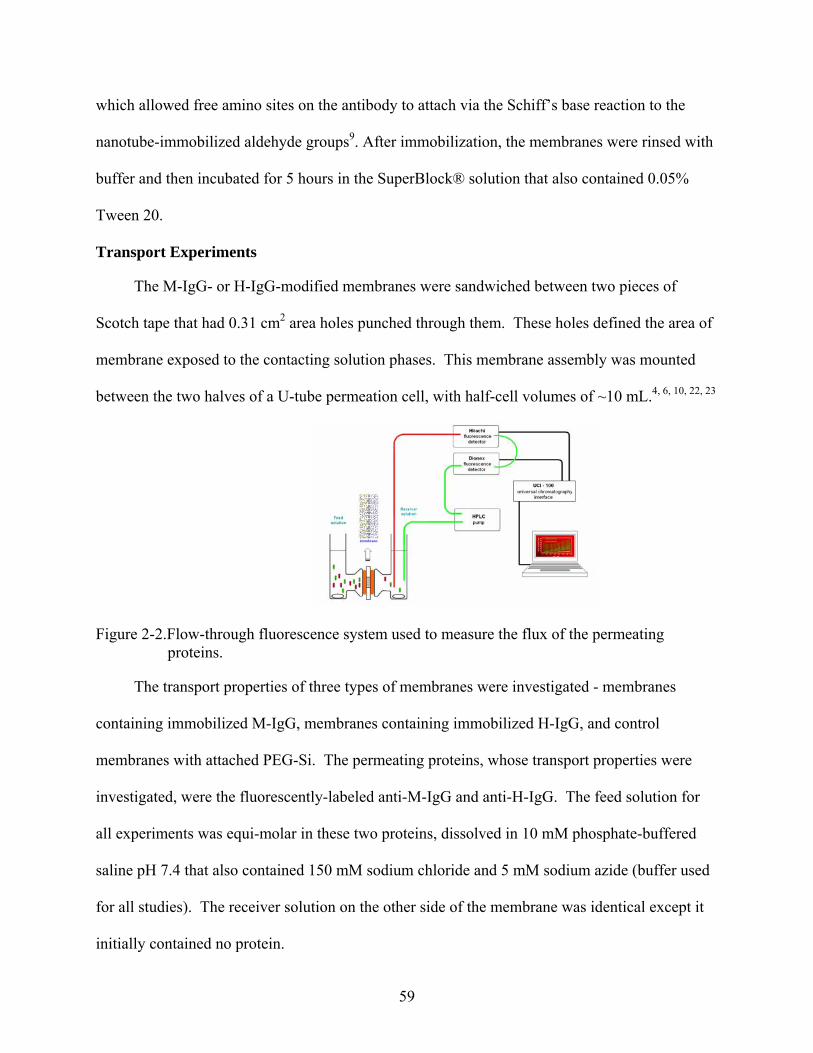
which allowed free amino sites on the antibody to attach via the Schiff’s base reaction to the
nanotube-immobilized aldehyde groups9. After immobilization, the membranes were rinsed with
buffer and then incubated for 5 hours in the SuperBlock® solution that also contained 0.05%
Tween 20.
Transport Experiments
The M-IgG- or H-IgG-modified membranes were sandwiched between two pieces of
Scotch tape that had 0.31 cm2 area holes punched through them. These holes defined the area of
membrane exposed to the contacting solution phases. This membrane assembly was mounted
between the two halves of a U-tube permeation cell, with half-cell volumes of ~10 mL.4, 6, 10, 22, 23
Figure 2-2.Flow-through fluorescence system used to measure the flux of the permeating proteins.
The transport properties of three types of membranes were investigated - membranes
containing immobilized M-IgG, membranes containing immobilized H-IgG, and control
membranes with attached PEG-Si. The permeating proteins, whose transport properties were
investigated, were the fluorescently-labeled anti-M-IgG and anti-H-IgG. The feed solution for
all experiments was equi-molar in these two proteins, dissolved in 10 mM phosphate-buffered
saline pH 7.4 that also contained 150 mM sodium chloride and 5 mM sodium azide (buffer used
for all studies). The receiver solution on the other side of the membrane was identical except it
initially contained no protein.
59

The fluorescence intensity of the receiver solution was periodically measured using two
flow-through fluorescence detectors connected in series (Figure 2-2).
This system consisted of an L-7485 fluorescence detector (Hitachi) and an RF-2000
fluorescence detector (Dionex). The flow stream was delivered using an L-7100 HPLC pump
(Hitachi). We discovered that if the receiver solution was sent continuously through the
fluorescence detectors during the entire course of a transport experiment, significant photo
bleaching of the Alexa dyes occurred. To prevent this, we turned the pump on to deliver receiver
solution to the detectors for only 3 minutes per hour of transport experiment. That is, we used a
duty cycle of 57 minutes with pump off followed by 3 minutes with pump on (flow rate = 3 mL
per min) to collect fluorescence data. The whole system was controlled using Chromeleon 6.50
chromatography management software (Dionex) through a UCI-100 universal chromatography
interface (Dionex).
The Hitachi detector was used exclusively to detect the Alexa-594-labeled anti-M-IgG and
the Dionex detector was used for the Alexa-488-labeled anti-H-IgG. Alexa 488 was excited at
495 nm, and the emission was detected at 515 nm. Alexa 594 was excited at 590 nm and
detected at 617 nm. Calibration curves were obtained with the same flow through system on
solutions containing known concentrations of both of the flourophore-labeled antibodies. These
calibration curves were used to obtain the concentrations of the transport proteins in the receiver
solution.
Competitive Binding Assays
Our experimental design assumes that the permeating protein anti-M-IgG binds strongly to
the carrier M-IgG and that the permeating protein anti-H-IgG binds weakly to this carrier.
Likewise we assume that anti-H-IgG binds strongly to the carrier H-IgG and that anti-M-IgG
binds weakly to this carrier. We proved these assumptions to be true by conducting competitive
60
binding assays. This was accomplished by equilibrating H-IgG- and M-IgG-modified
membranes to solutions that were 21.2 nM in both anti-M-IgG and anti-H-IgG, and then
measuring the fluorescence intensities from the membranes.
Calibration data were used to convert these fluorescence intensities to pmoles of anti-M-
IgG and anti-H-IgG bound to the membrane. The standards used to obtain the calibration curves
were 0.31 cm2 membrane samples to which were applied known quantities of the desired protein.
The fluorescence intensities from these standards were measured using a fluorescence
microscope that was equipped with both a fluorescence detector and a CCD camera. This system
combines an Axioplan 2 imaging microscope (Zeiss) with a J&M-PMT photometry system
detector (SpectrAlliance), for measuring the fluorescence intensity using a BP450-490 filter for
excitation and a LP515 filter for green emission of light, and a BP546/12 filter for excitation and
a LP590 filter for red emission of light.
Determination of Static Protein Binding Capacity and Binding Constants through Adsorption Isotherms
The adsorption isotherms were carried out with M-IgG modified, H-IgG modified, and
unmodified control membranes at 23 °C in stirred U-tube permeation cells using the same buffer
conditions used for the permeation studies, via solutions containing single concentrations of anti-
M-IgG or anti-H-IgG fluorescent labeled with Alexa 488. In the case of M-IgG-modified but
immobilized via protein G, the adsorption isotherms were carried out at three different
temperatures: 23, 32, and 42 °C. The fluorescence intensity of all the membranes was measured
under the fluorescence microscope. Calibration curves were used to obtain the concentration of
the Alexa 488-labeled proteins adsorbed to the membrane sample from the measured
fluorescence intensity. The data were analyzed according to the monolayer Langmuir model.167
61
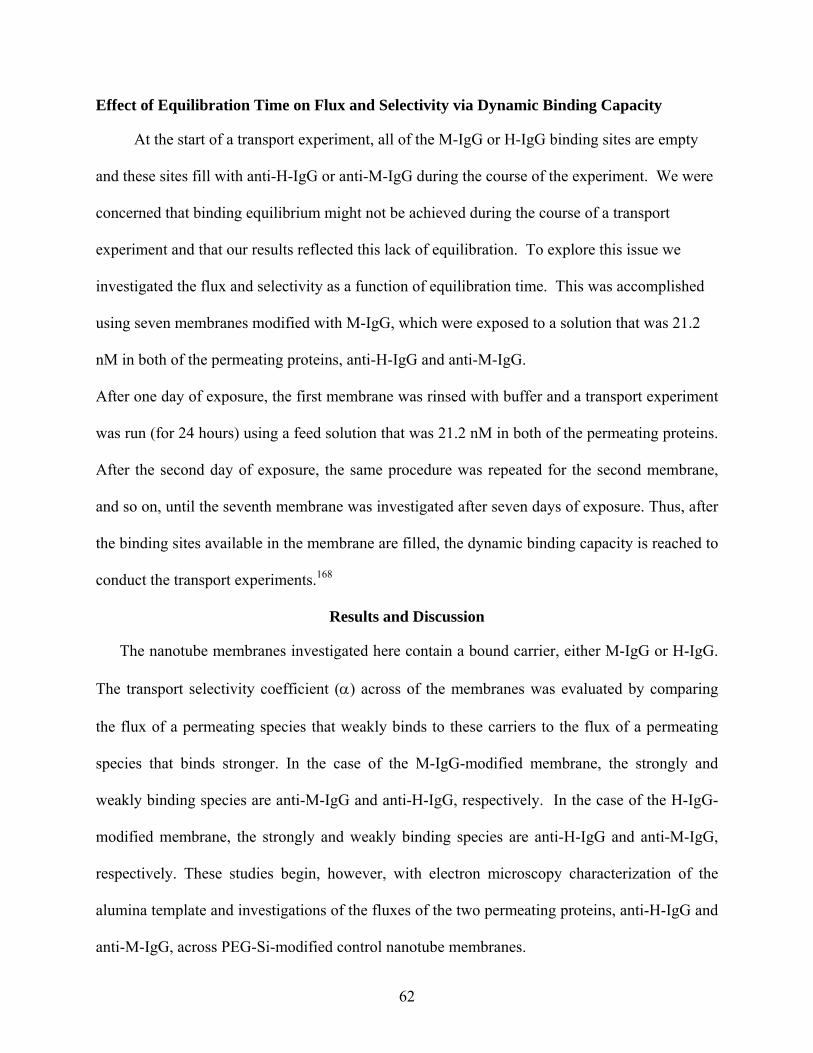
Effect of Equilibration Time on Flux and Selectivity via Dynamic Binding Capacity
At the start of a transport experiment, all of the M-IgG or H-IgG binding sites are empty
and these sites fill with anti-H-IgG or anti-M-IgG during the course of the experiment. We were
concerned that binding equilibrium might not be achieved during the course of a transport
experiment and that our results reflected this lack of equilibration. To explore this issue we
investigated the flux and selectivity as a function of equilibration time. This was accomplished
using seven membranes modified with M-IgG, which were exposed to a solution that was 21.2
nM in both of the permeating proteins, anti-H-IgG and anti-M-IgG.
After one day of exposure, the first membrane was rinsed with buffer and a transport experiment
was run (for 24 hours) using a feed solution that was 21.2 nM in both of the permeating proteins.
After the second day of exposure, the same procedure was repeated for the second membrane,
and so on, until the seventh membrane was investigated after seven days of exposure. Thus, after
the binding sites available in the membrane are filled, the dynamic binding capacity is reached to
conduct the transport experiments.168
Results and Discussion
The nanotube membranes investigated here contain a bound carrier, either M-IgG or H-IgG.
The transport selectivity coefficient (α) across of the membranes was evaluated by comparing
the flux of a permeating species that weakly binds to these carriers to the flux of a permeating
species that binds stronger. In the case of the M-IgG-modified membrane, the strongly and
weakly binding species are anti-M-IgG and anti-H-IgG, respectively. In the case of the H-IgG-
modified membrane, the strongly and weakly binding species are anti-H-IgG and anti-M-IgG,
respectively. These studies begin, however, with electron microscopy characterization of the
alumina template and investigations of the fluxes of the two permeating proteins, anti-H-IgG and
anti-M-IgG, across PEG-Si-modified control nanotube membranes.
62
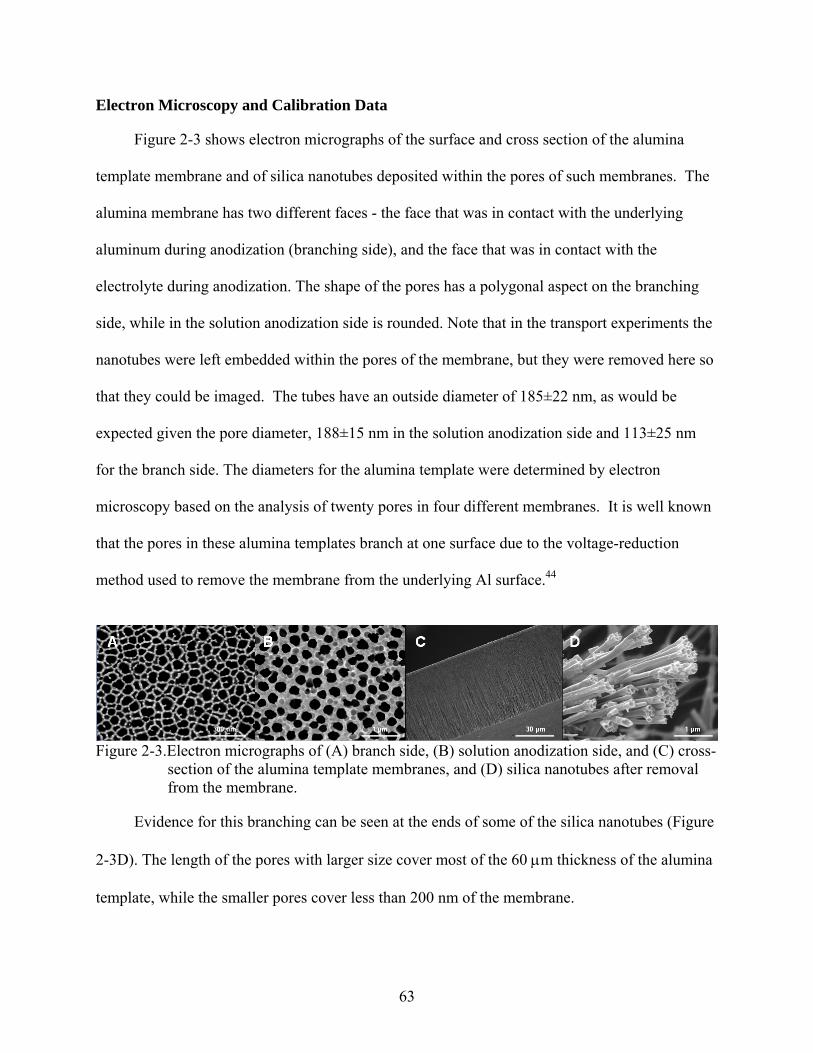
Electron Microscopy and Calibration Data
Figure 2-3 shows electron micrographs of the surface and cross section of the alumina
template membrane and of silica nanotubes deposited within the pores of such membranes. The
alumina membrane has two different faces - the face that was in contact with the underlying
aluminum during anodization (branching side), and the face that was in contact with the
electrolyte during anodization. The shape of the pores has a polygonal aspect on the branching
side, while in the solution anodization side is rounded. Note that in the transport experiments the
nanotubes were left embedded within the pores of the membrane, but they were removed here so
that they could be imaged. The tubes have an outside diameter of 185±22 nm, as would be
expected given the pore diameter, 188±15 nm in the solution anodization side and 113±25 nm
for the branch side. The diameters for the alumina template were determined by electron
microscopy based on the analysis of twenty pores in four different membranes. It is well known
that the pores in these alumina templates branch at one surface due to the voltage-reduction
method used to remove the membrane from the underlying Al surface.44
Figure 2-3.Electron micrographs of (A) branch side, (B) solution anodization side, and (C) cross-
section of the alumina template membranes, and (D) silica nanotubes after removal from the membrane.
Evidence for this branching can be seen at the ends of some of the silica nanotubes (Figure
2-3D). The length of the pores with larger size cover most of the 60 µm thickness of the alumina
template, while the smaller pores cover less than 200 nm of the membrane.
63
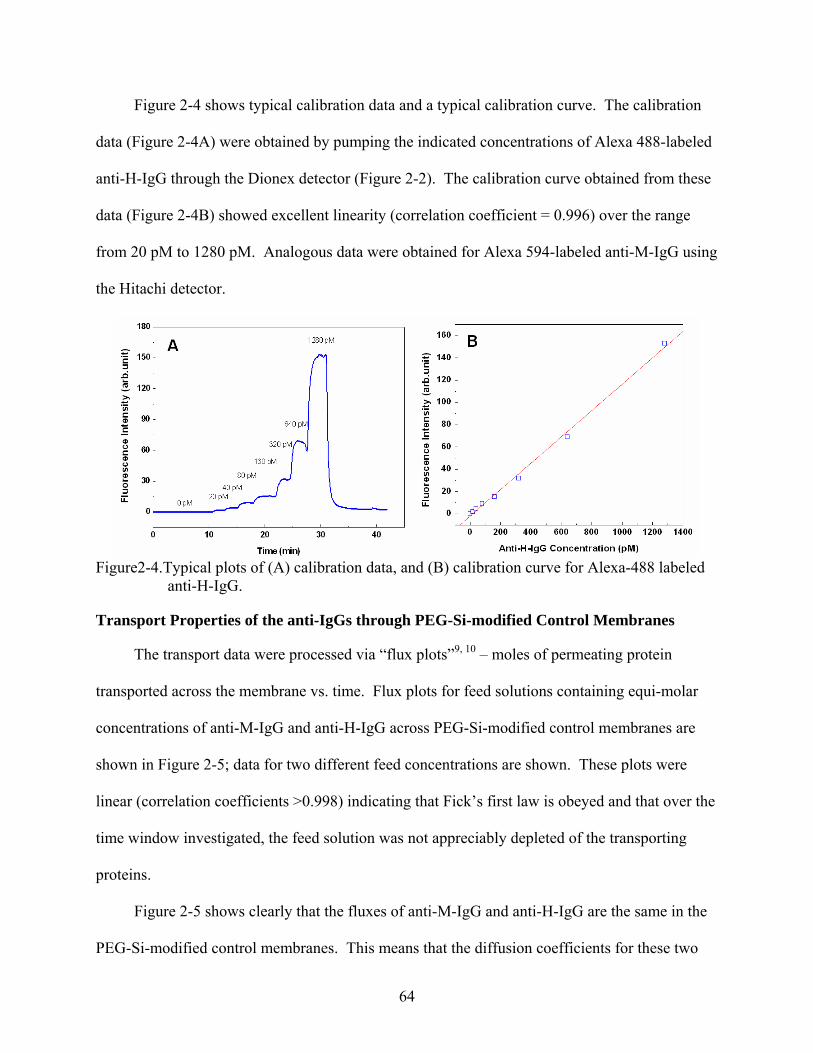
Figure 2-4 shows typical calibration data and a typical calibration curve. The calibration
data (Figure 2-4A) were obtained by pumping the indicated concentrations of Alexa 488-labeled
anti-H-IgG through the Dionex detector (Figure 2-2). The calibration curve obtained from these
data (Figure 2-4B) showed excellent linearity (correlation coefficient = 0.996) over the range
from 20 pM to 1280 pM. Analogous data were obtained for Alexa 594-labeled anti-M-IgG using
the Hitachi detector.
Figure2-4.Typical plots of (A) calibration data, and (B) calibration curve for Alexa-488 labeled
anti-H-IgG.
Transport Properties of the anti-IgGs through PEG-Si-modified Control Membranes
The transport data were processed via “flux plots”9, 10 – moles of permeating protein
transported across the membrane vs. time. Flux plots for feed solutions containing equi-molar
concentrations of anti-M-IgG and anti-H-IgG across PEG-Si-modified control membranes are
shown in Figure 2-5; data for two different feed concentrations are shown. These plots were
linear (correlation coefficients >0.998) indicating that Fick’s first law is obeyed and that over the
time window investigated, the feed solution was not appreciably depleted of the transporting
proteins.
Figure 2-5 shows clearly that the fluxes of anti-M-IgG and anti-H-IgG are the same in the
PEG-Si-modified control membranes. This means that the diffusion coefficients for these two
64
proteins are the same, which in turn means that the proteins are identical in size, as would be
expected for two IgG molecules. Therefore, the transport properties across these control
membranes are the same for these two antibodies. These points are further reinforced by the
concentration dependence of the flux. The concentration used for the lower two curves was
eight-times lower than the concentration used for the upper two curves. Correspondingly, the
flux at the high concentration (1.45 pmoles h-1 cm-2) is eight times higher than the flux at the low
concentration (0.18 pmoles h-1 cm-2). After the permeation experiments, the membranes were
observed under the fluorescence microscope, but no fluorescence was detected. This indicates
PEG-Si-modification suppresses non-specific protein adsorption to the silica nanotubes.
Figure 2-5. Flux plots for anti-M-IgG () and anti-H-IgG () through PEG-Si-modified control
membranes. The feed concentration was 2.65 nM (lower curves) and 21.2 nM (upper curves).
Competitive Binding Studies
As noted above, our experimental design assumes that the permeating protein anti-M-IgG
binds strongly to the carrier M-IgG and that the permeating protein anti-H-IgG binds weakly to
this carrier. Likewise we assume that anti-H-IgG binds strongly to the carrier H-IgG and that
65
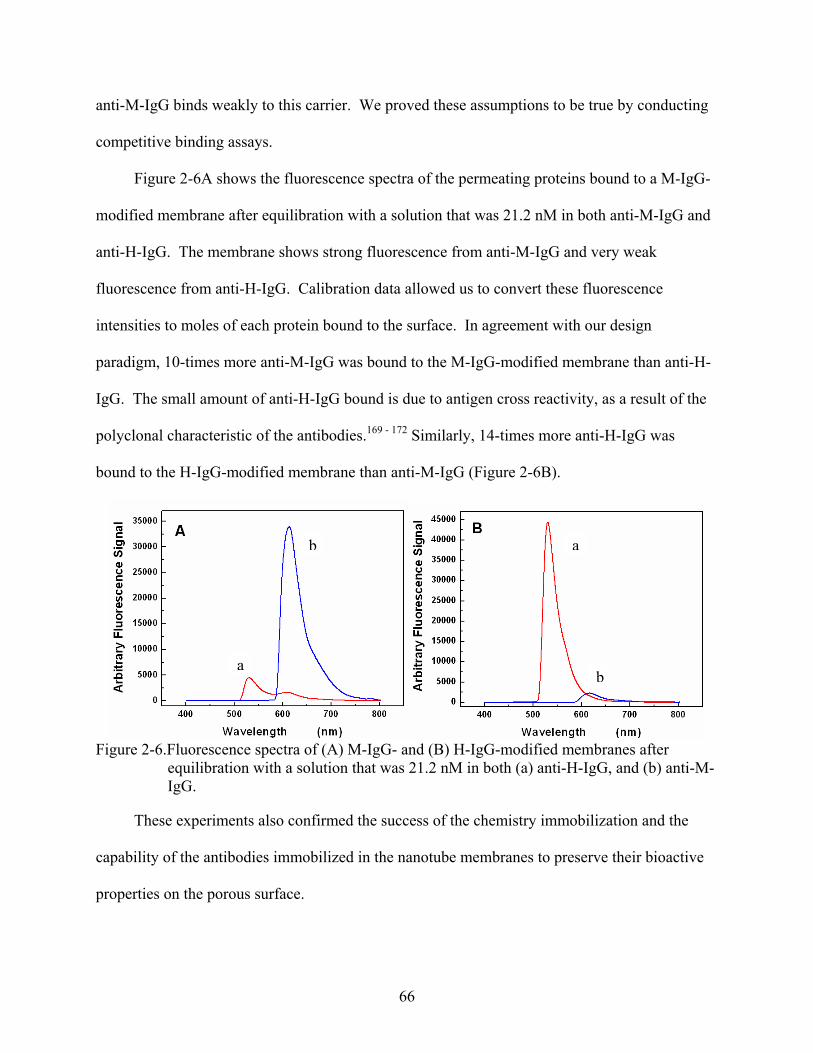
anti-M-IgG binds weakly to this carrier. We proved these assumptions to be true by conducting
competitive binding assays.
Figure 2-6A shows the fluorescence spectra of the permeating proteins bound to a M-IgG-
modified membrane after equilibration with a solution that was 21.2 nM in both anti-M-IgG and
anti-H-IgG. The membrane shows strong fluorescence from anti-M-IgG and very weak
fluorescence from anti-H-IgG. Calibration data allowed us to convert these fluorescence
intensities to moles of each protein bound to the surface. In agreement with our design
paradigm, 10-times more anti-M-IgG was bound to the M-IgG-modified membrane than anti-H-
IgG. The small amount of anti-H-IgG bound is due to antigen cross reactivity, as a result of the
polyclonal characteristic of the antibodies.169 - 172 Similarly, 14-times more anti-H-IgG was
bound to the H-IgG-modified membrane than anti-M-IgG (Figure 2-6B).
b
a
b
a
Figure 2-6.Fluorescence spectra of (A) M-IgG- and (B) H-IgG-modified membranes after equilibration with a solution that was 21.2 nM in both (a) anti-H-IgG, and (b) anti-M-IgG.
These experiments also confirmed the success of the chemistry immobilization and the
capability of the antibodies immobilized in the nanotube membranes to preserve their bioactive
properties on the porous surface.
66
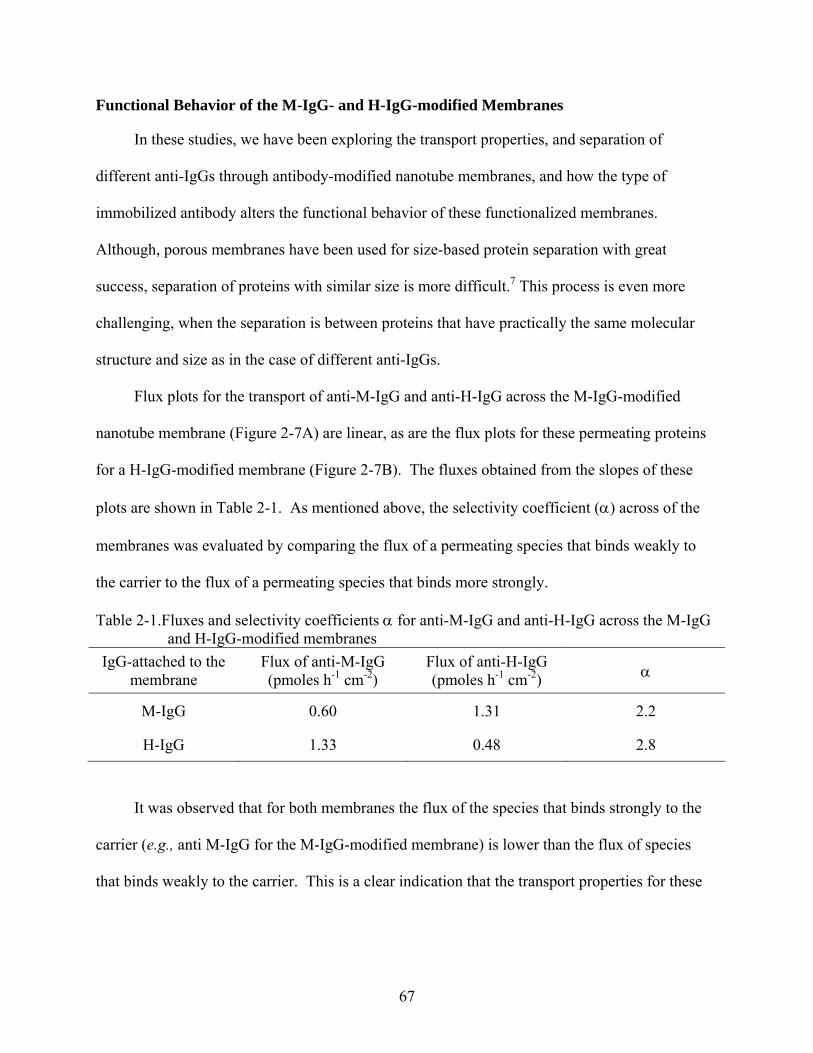
Functional Behavior of the M-IgG- and H-IgG-modified Membranes
In these studies, we have been exploring the transport properties, and separation of
different anti-IgGs through antibody-modified nanotube membranes, and how the type of
immobilized antibody alters the functional behavior of these functionalized membranes.
Although, porous membranes have been used for size-based protein separation with great
success, separation of proteins with similar size is more difficult.7 This process is even more
challenging, when the separation is between proteins that have practically the same molecular
structure and size as in the case of different anti-IgGs.
Flux plots for the transport of anti-M-IgG and anti-H-IgG across the M-IgG-modified
nanotube membrane (Figure 2-7A) are linear, as are the flux plots for these permeating proteins
for a H-IgG-modified membrane (Figure 2-7B). The fluxes obtained from the slopes of these
plots are shown in Table 2-1. As mentioned above, the selectivity coefficient (α) across of the
membranes was evaluated by comparing the flux of a permeating species that binds weakly to
the carrier to the flux of a permeating species that binds more strongly.
Table 2-1.Fluxes and selectivity coefficients α for anti-M-IgG and anti-H-IgG across the M-IgG and H-IgG-modified membranes
IgG-attached to the membrane
Flux of anti-M-IgG (pmoles h-1 cm-2)
Flux of anti-H-IgG (pmoles h-1 cm-2) α
M-IgG 0.60 1.31 2.2
H-IgG 1.33 0.48 2.8
It was observed that for both membranes the flux of the species that binds strongly to the
carrier (e.g., anti M-IgG for the M-IgG-modified membrane) is lower than the flux of species
that binds weakly to the carrier. This is a clear indication that the transport properties for these
67

two permeating proteins are different, which in this situation, depends on the functional behavior
of the IgG-functionalized nanotube membrane.
It is worth mentioning that under steady state conditions observed in all the transport
experiments, only an averaged transport rate can be determined because proteins being
transported do not enter membrane pores at the same time so that the measured signal is a
spatially and temporally averaged one.
Figure 2-7.Flux plots for anti-M-IgG () and anti-H-IgG () in (A) M-IgG-modified membrane,
and (B) H-IgG-modified membrane. The feed solution concentration was 21.2 nM in both of the permeating proteins.
Observed Functional Behavior is not a Transient Phenomenon
One way to interpret the results in Figure 2-7 and Table 2-1 is that they might reflect a
transient phenomenon. That is, one could hypothesize that during the permeation experiments
summarized in Figure 2-7, the flux of the species that bound strongly to the carrier were
suppressed because all the sites for binding were initially empty. According to this hypothesis
the flux for the strongly binding species would remain low until all sites were filled and
breakthrough occurred.
It is difficult to reconcile this hypothesis with the constant flux observed for the strongly
binding species over these nearly one-daylong transport experiments (Figure 2-7). One would
68
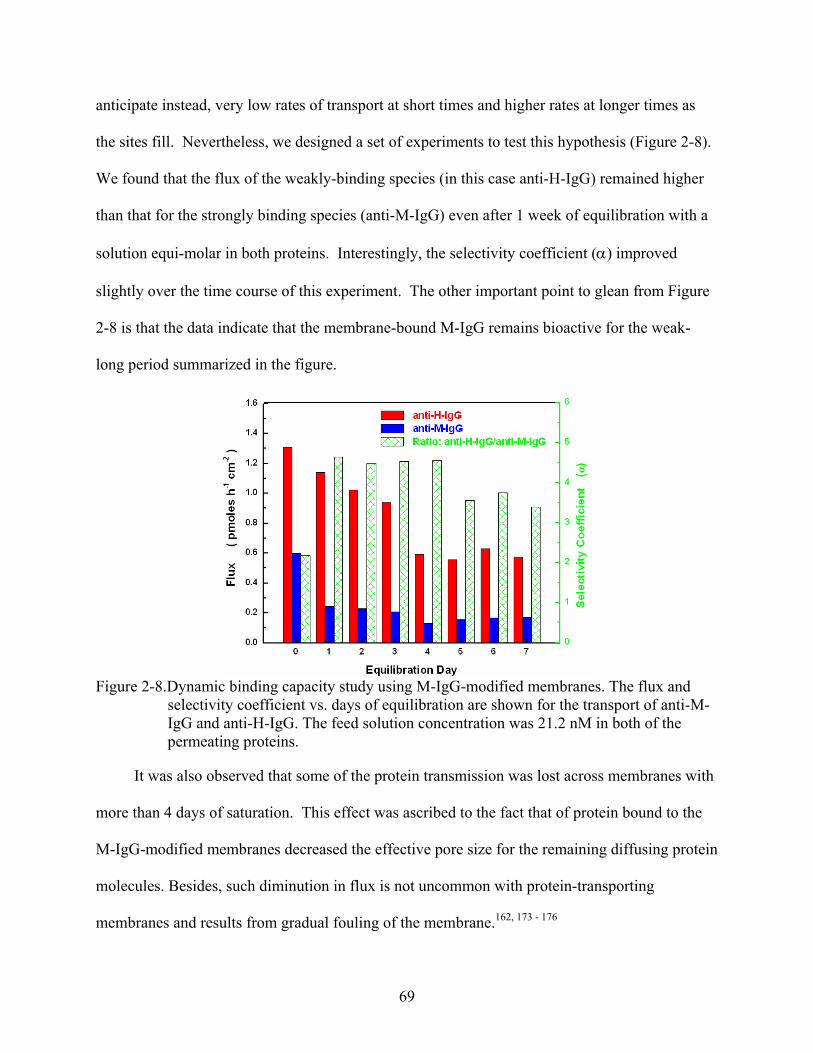
anticipate instead, very low rates of transport at short times and higher rates at longer times as
the sites fill. Nevertheless, we designed a set of experiments to test this hypothesis (Figure 2-8).
We found that the flux of the weakly-binding species (in this case anti-H-IgG) remained higher
than that for the strongly binding species (anti-M-IgG) even after 1 week of equilibration with a
solution equi-molar in both proteins. Interestingly, the selectivity coefficient (α) improved
slightly over the time course of this experiment. The other important point to glean from Figure
2-8 is that the data indicate that the membrane-bound M-IgG remains bioactive for the weak-
long period summarized in the figure.
Figure 2-8.Dynamic binding capacity study using M-IgG-modified membranes. The flux and
selectivity coefficient vs. days of equilibration are shown for the transport of anti-M-IgG and anti-H-IgG. The feed solution concentration was 21.2 nM in both of the permeating proteins.
It was also observed that some of the protein transmission was lost across membranes with
more than 4 days of saturation. This effect was ascribed to the fact that of protein bound to the
M-IgG-modified membranes decreased the effective pore size for the remaining diffusing protein
molecules. Besides, such diminution in flux is not uncommon with protein-transporting
membranes and results from gradual fouling of the membrane.162, 173 - 176
69
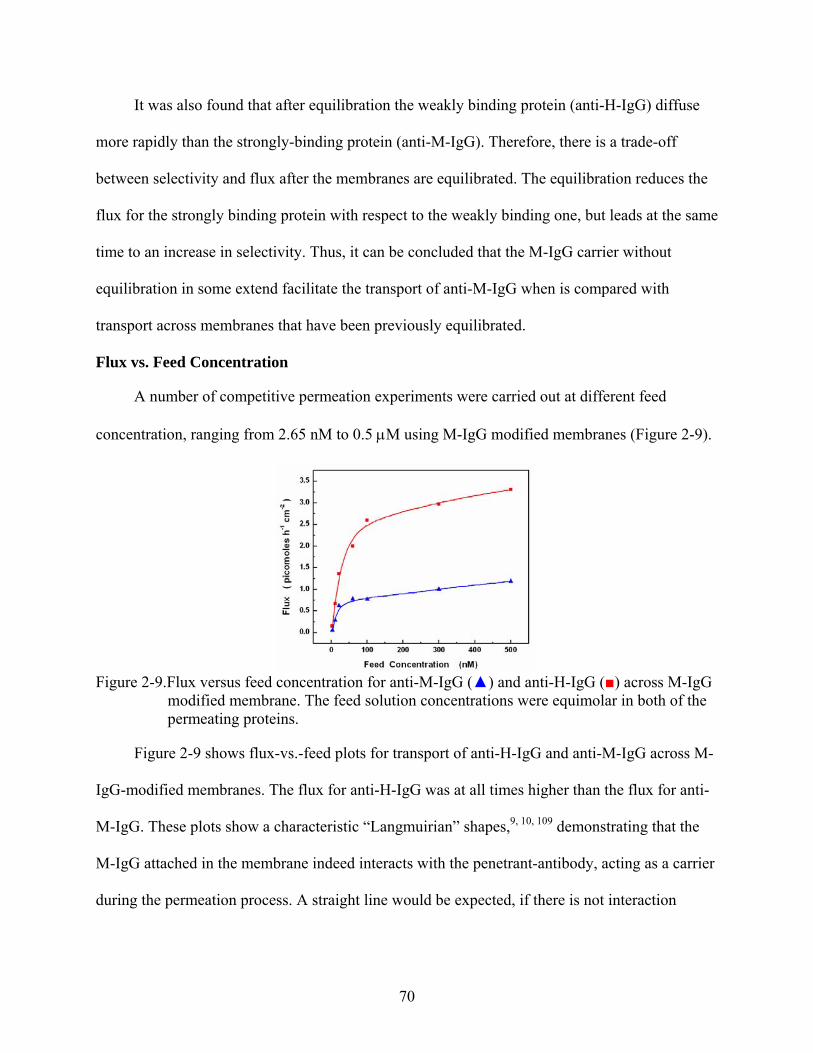
It was also found that after equilibration the weakly binding protein (anti-H-IgG) diffuse
more rapidly than the strongly-binding protein (anti-M-IgG). Therefore, there is a trade-off
between selectivity and flux after the membranes are equilibrated. The equilibration reduces the
flux for the strongly binding protein with respect to the weakly binding one, but leads at the same
time to an increase in selectivity. Thus, it can be concluded that the M-IgG carrier without
equilibration in some extend facilitate the transport of anti-M-IgG when is compared with
transport across membranes that have been previously equilibrated.
Flux vs. Feed Concentration
A number of competitive permeation experiments were carried out at different feed
concentration, ranging from 2.65 nM to 0.5 µM using M-IgG modified membranes (Figure 2-9).
Figure 2-9.Flux versus feed concentration for anti-M-IgG () and anti-H-IgG () across M-IgG
modified membrane. The feed solution concentrations were equimolar in both of the permeating proteins.
Figure 2-9 shows flux-vs.-feed plots for transport of anti-H-IgG and anti-M-IgG across M-
IgG-modified membranes. The flux for anti-H-IgG was at all times higher than the flux for anti-
M-IgG. These plots show a characteristic “Langmuirian” shapes,9, 10, 109 demonstrating that the
M-IgG attached in the membrane indeed interacts with the penetrant-antibody, acting as a carrier
during the permeation process. A straight line would be expected, if there is not interaction
70
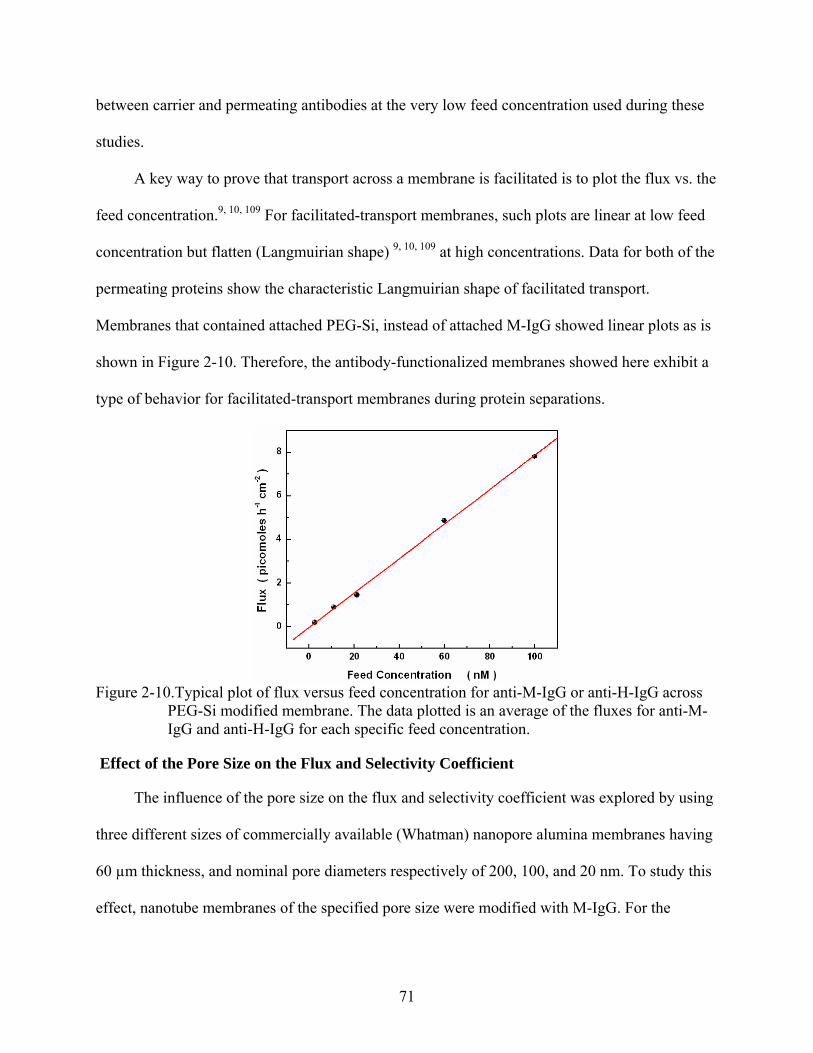
between carrier and permeating antibodies at the very low feed concentration used during these
studies.
A key way to prove that transport across a membrane is facilitated is to plot the flux vs. the
feed concentration.9, 10, 109 For facilitated-transport membranes, such plots are linear at low feed
concentration but flatten (Langmuirian shape) 9, 10, 109 at high concentrations. Data for both of the
permeating proteins show the characteristic Langmuirian shape of facilitated transport.
Membranes that contained attached PEG-Si, instead of attached M-IgG showed linear plots as is
shown in Figure 2-10. Therefore, the antibody-functionalized membranes showed here exhibit a
type of behavior for facilitated-transport membranes during protein separations.
Figure 2-10.Typical plot of flux versus feed concentration for anti-M-IgG or anti-H-IgG across
PEG-Si modified membrane. The data plotted is an average of the fluxes for anti-M-IgG and anti-H-IgG for each specific feed concentration.
Effect of the Pore Size on the Flux and Selectivity Coefficient
The influence of the pore size on the flux and selectivity coefficient was explored by using
three different sizes of commercially available (Whatman) nanopore alumina membranes having
60 µm thickness, and nominal pore diameters respectively of 200, 100, and 20 nm. To study this
effect, nanotube membranes of the specified pore size were modified with M-IgG. For the
71
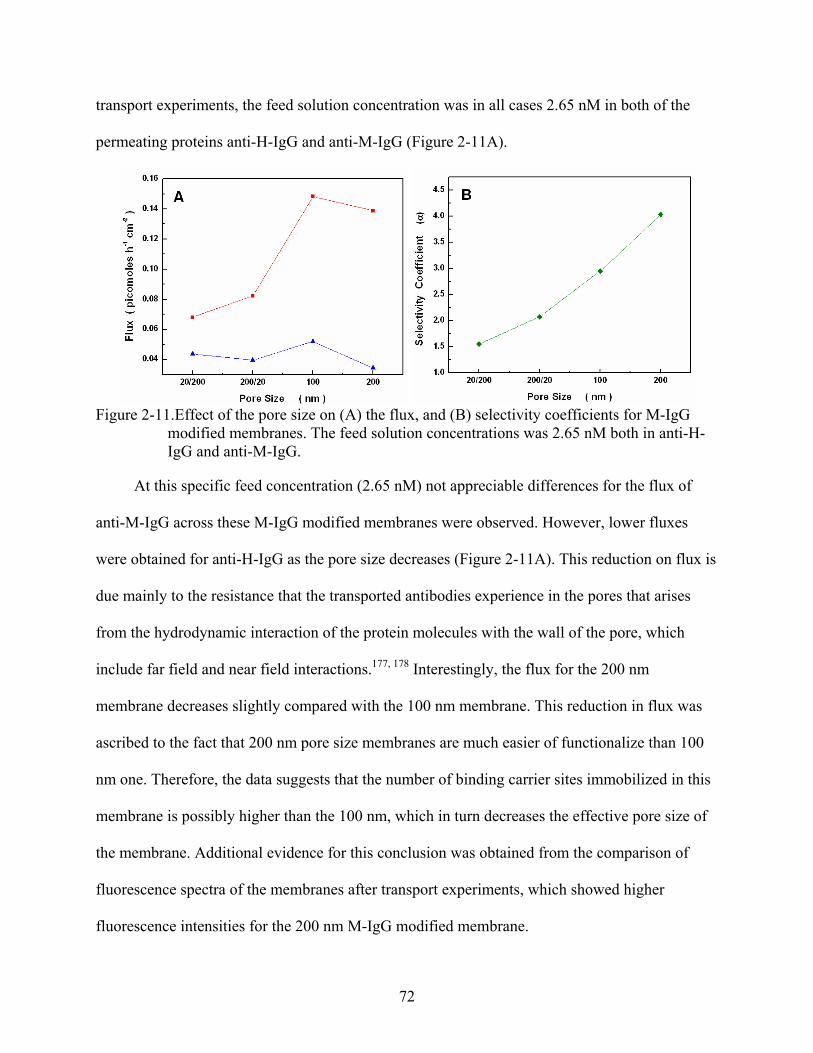
transport experiments, the feed solution concentration was in all cases 2.65 nM in both of the
permeating proteins anti-H-IgG and anti-M-IgG (Figure 2-11A).
Figure 2-11.Effect of the pore size on (A) the flux, and (B) selectivity coefficients for M-IgG
modified membranes. The feed solution concentrations was 2.65 nM both in anti-H-IgG and anti-M-IgG.
At this specific feed concentration (2.65 nM) not appreciable differences for the flux of
anti-M-IgG across these M-IgG modified membranes were observed. However, lower fluxes
were obtained for anti-H-IgG as the pore size decreases (Figure 2-11A). This reduction on flux is
due mainly to the resistance that the transported antibodies experience in the pores that arises
from the hydrodynamic interaction of the protein molecules with the wall of the pore, which
include far field and near field interactions.177, 178 Interestingly, the flux for the 200 nm
membrane decreases slightly compared with the 100 nm membrane. This reduction in flux was
ascribed to the fact that 200 nm pore size membranes are much easier of functionalize than 100
nm one. Therefore, the data suggests that the number of binding carrier sites immobilized in this
membrane is possibly higher than the 100 nm, which in turn decreases the effective pore size of
the membrane. Additional evidence for this conclusion was obtained from the comparison of
fluorescence spectra of the membranes after transport experiments, which showed higher
fluorescence intensities for the 200 nm M-IgG modified membrane.
72
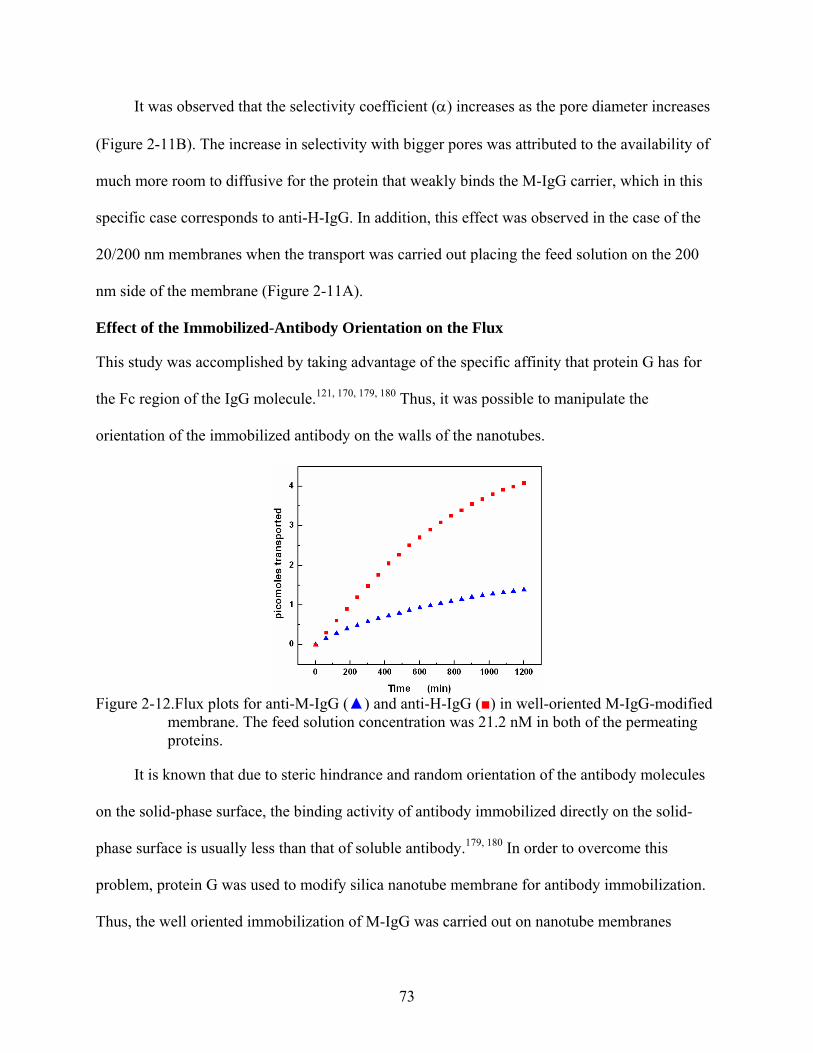
It was observed that the selectivity coefficient (α) increases as the pore diameter increases
(Figure 2-11B). The increase in selectivity with bigger pores was attributed to the availability of
much more room to diffusive for the protein that weakly binds the M-IgG carrier, which in this
specific case corresponds to anti-H-IgG. In addition, this effect was observed in the case of the
20/200 nm membranes when the transport was carried out placing the feed solution on the 200
nm side of the membrane (Figure 2-11A).
Effect of the Immobilized-Antibody Orientation on the Flux
This study was accomplished by taking advantage of the specific affinity that protein G has for
the Fc region of the IgG molecule.121, 170, 179, 180 Thus, it was possible to manipulate the
orientation of the immobilized antibody on the walls of the nanotubes.
Figure 2-12.Flux plots for anti-M-IgG () and anti-H-IgG () in well-oriented M-IgG-modified
membrane. The feed solution concentration was 21.2 nM in both of the permeating proteins.
It is known that due to steric hindrance and random orientation of the antibody molecules
on the solid-phase surface, the binding activity of antibody immobilized directly on the solid-
phase surface is usually less than that of soluble antibody.179, 180 In order to overcome this
problem, protein G was used to modify silica nanotube membrane for antibody immobilization.
Thus, the well oriented immobilization of M-IgG was carried out on nanotube membranes
73
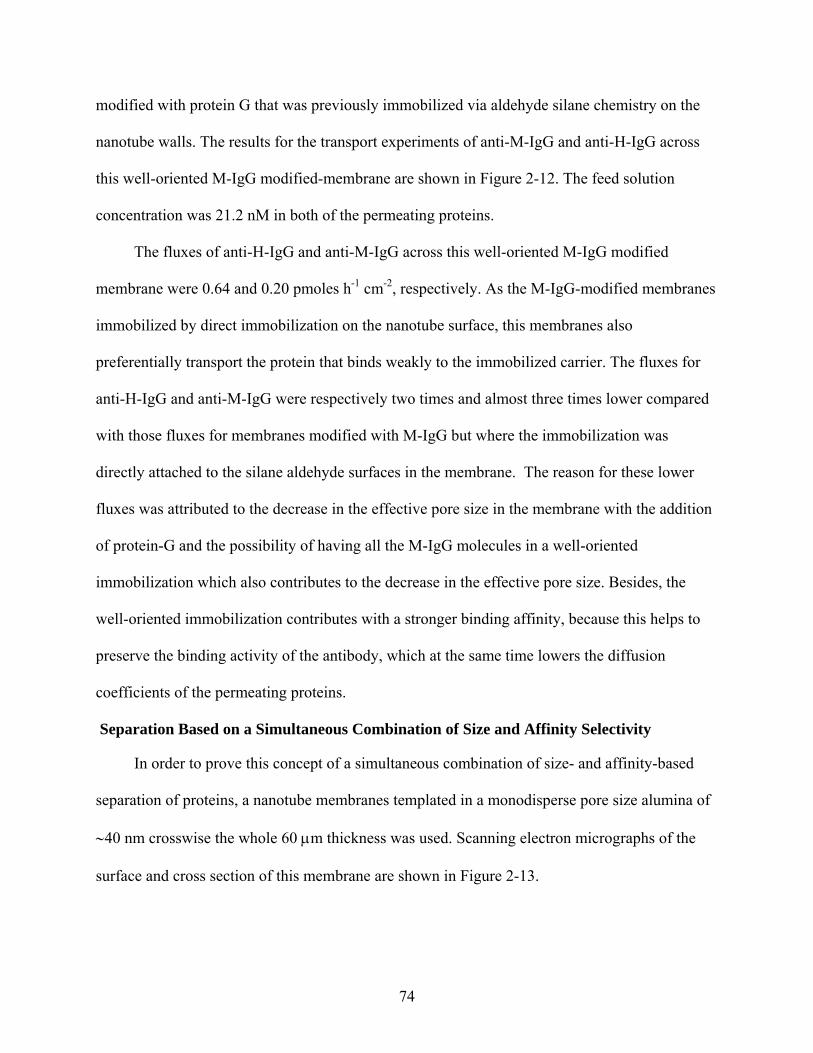
modified with protein G that was previously immobilized via aldehyde silane chemistry on the
nanotube walls. The results for the transport experiments of anti-M-IgG and anti-H-IgG across
this well-oriented M-IgG modified-membrane are shown in Figure 2-12. The feed solution
concentration was 21.2 nM in both of the permeating proteins.
The fluxes of anti-H-IgG and anti-M-IgG across this well-oriented M-IgG modified
membrane were 0.64 and 0.20 pmoles h-1 cm-2, respectively. As the M-IgG-modified membranes
immobilized by direct immobilization on the nanotube surface, this membranes also
preferentially transport the protein that binds weakly to the immobilized carrier. The fluxes for
anti-H-IgG and anti-M-IgG were respectively two times and almost three times lower compared
with those fluxes for membranes modified with M-IgG but where the immobilization was
directly attached to the silane aldehyde surfaces in the membrane. The reason for these lower
fluxes was attributed to the decrease in the effective pore size in the membrane with the addition
of protein-G and the possibility of having all the M-IgG molecules in a well-oriented
immobilization which also contributes to the decrease in the effective pore size. Besides, the
well-oriented immobilization contributes with a stronger binding affinity, because this helps to
preserve the binding activity of the antibody, which at the same time lowers the diffusion
coefficients of the permeating proteins.
Separation Based on a Simultaneous Combination of Size and Affinity Selectivity
In order to prove this concept of a simultaneous combination of size- and affinity-based
separation of proteins, a nanotube membranes templated in a monodisperse pore size alumina of
∼40 nm crosswise the whole 60 µm thickness was used. Scanning electron micrographs of the
surface and cross section of this membrane are shown in Figure 2-13.
74
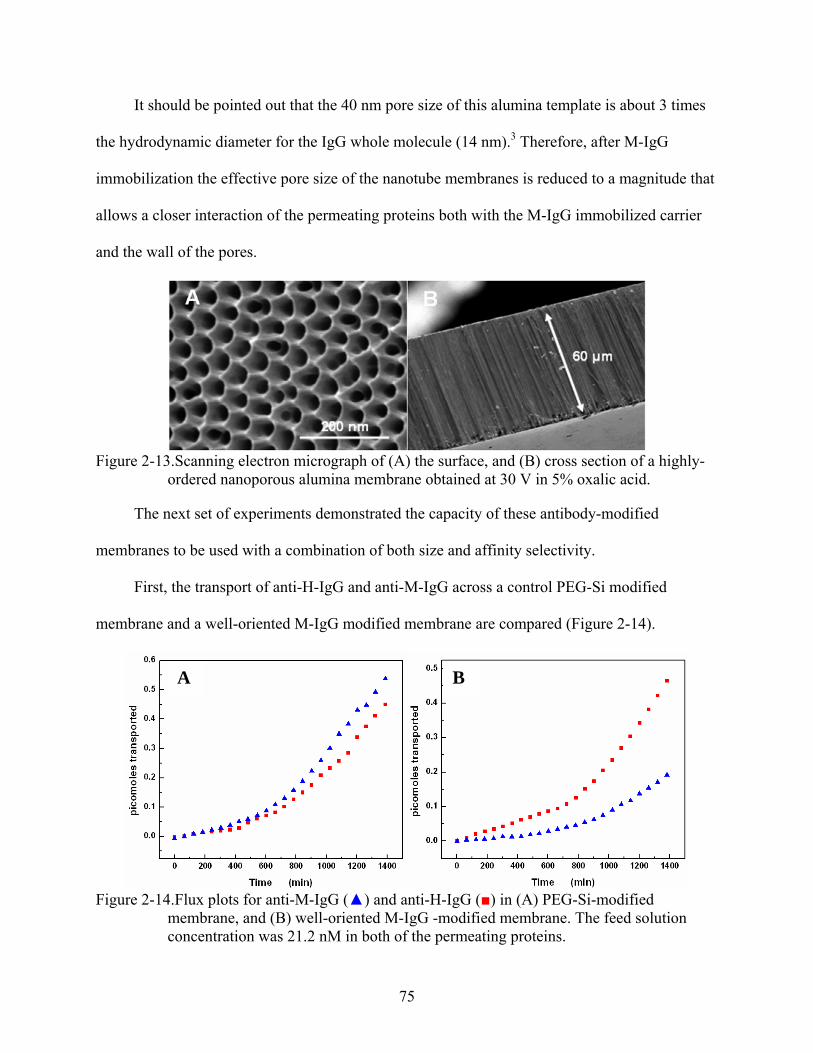
It should be pointed out that the 40 nm pore size of this alumina template is about 3 times
the hydrodynamic diameter for the IgG whole molecule (14 nm).3 Therefore, after M-IgG
immobilization the effective pore size of the nanotube membranes is reduced to a magnitude that
allows a closer interaction of the permeating proteins both with the M-IgG immobilized carrier
and the wall of the pores.
Figure 2-13.Scanning electron micrograph of (A) the surface, and (B) cross section of a highly-
ordered nanoporous alumina membrane obtained at 30 V in 5% oxalic acid.
The next set of experiments demonstrated the capacity of these antibody-modified
membranes to be used with a combination of both size and affinity selectivity.
First, the transport of anti-H-IgG and anti-M-IgG across a control PEG-Si modified
membrane and a well-oriented M-IgG modified membrane are compared (Figure 2-14).
A B
Figure 2-14.Flux plots for anti-M-IgG () and anti-H-IgG () in (A) PEG-Si-modified
membrane, and (B) well-oriented M-IgG -modified membrane. The feed solution concentration was 21.2 nM in both of the permeating proteins.
75
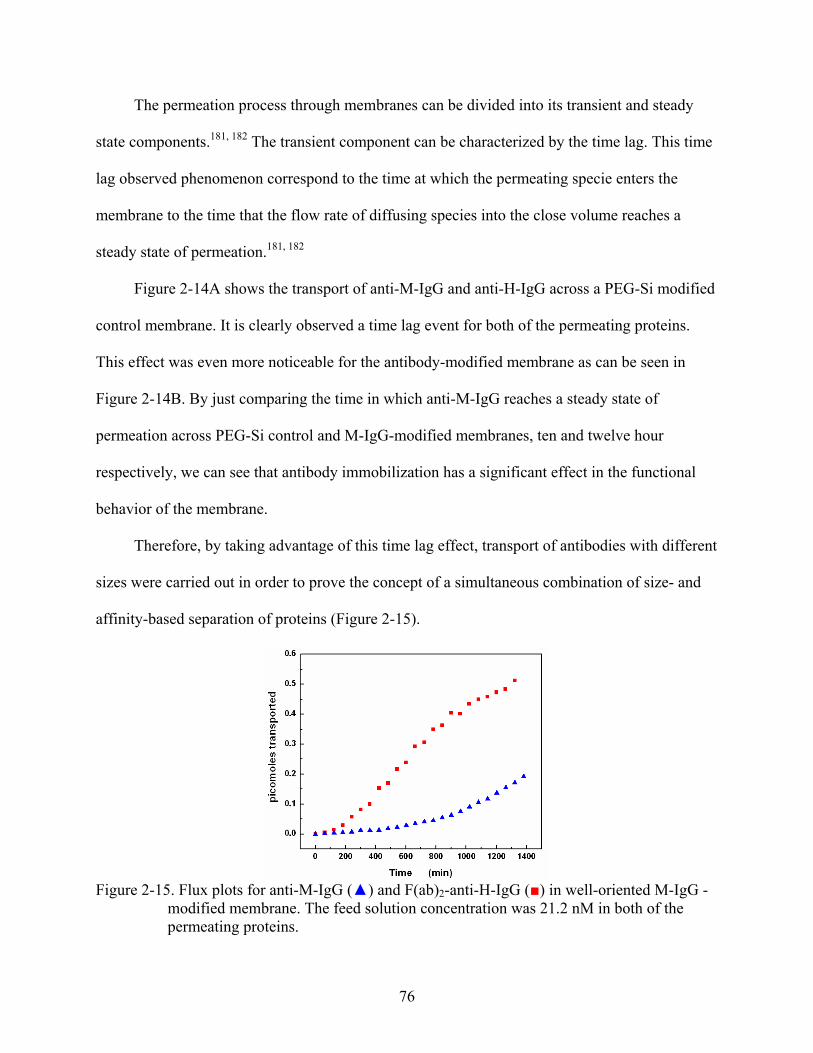
The permeation process through membranes can be divided into its transient and steady
state components.181, 182 The transient component can be characterized by the time lag. This time
lag observed phenomenon correspond to the time at which the permeating specie enters the
membrane to the time that the flow rate of diffusing species into the close volume reaches a
steady state of permeation.181, 182
Figure 2-14A shows the transport of anti-M-IgG and anti-H-IgG across a PEG-Si modified
control membrane. It is clearly observed a time lag event for both of the permeating proteins.
This effect was even more noticeable for the antibody-modified membrane as can be seen in
Figure 2-14B. By just comparing the time in which anti-M-IgG reaches a steady state of
permeation across PEG-Si control and M-IgG-modified membranes, ten and twelve hour
respectively, we can see that antibody immobilization has a significant effect in the functional
behavior of the membrane.
Therefore, by taking advantage of this time lag effect, transport of antibodies with different
sizes were carried out in order to prove the concept of a simultaneous combination of size- and
affinity-based separation of proteins (Figure 2-15).
Figure 2-15. Flux plots for anti-M-IgG () and F(ab)2-anti-H-IgG () in well-oriented M-IgG -
modified membrane. The feed solution concentration was 21.2 nM in both of the permeating proteins.
76
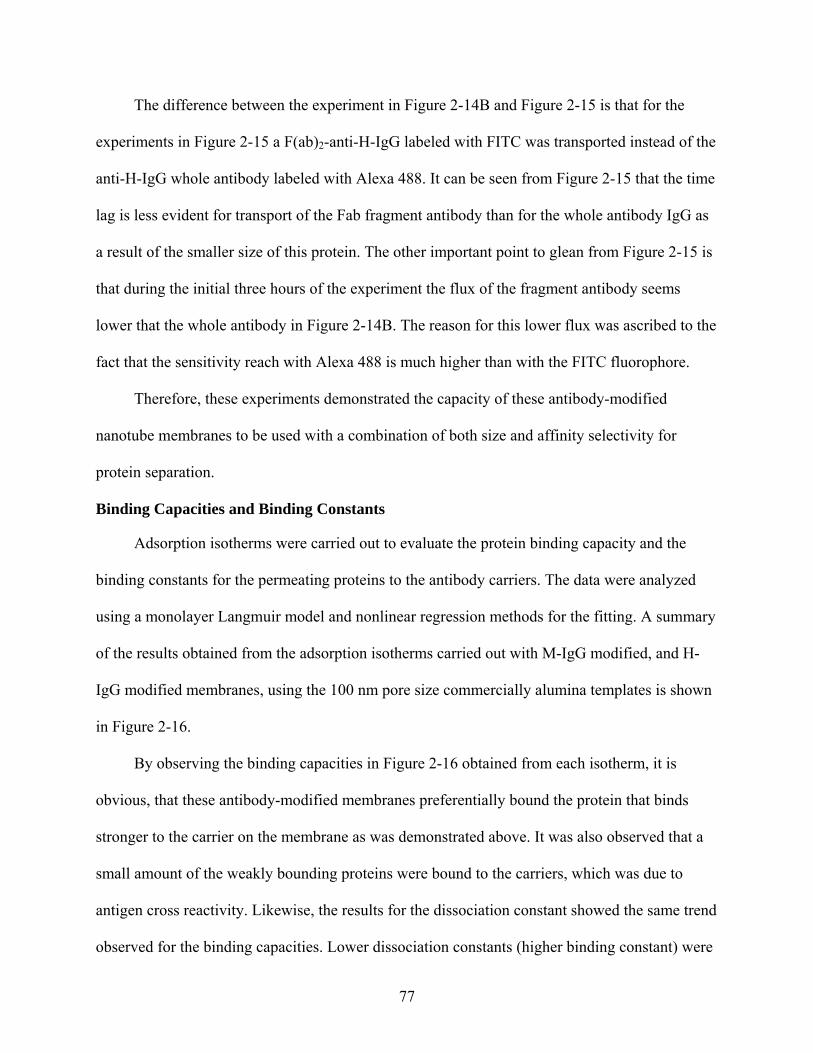
The difference between the experiment in Figure 2-14B and Figure 2-15 is that for the
experiments in Figure 2-15 a F(ab)2-anti-H-IgG labeled with FITC was transported instead of the
anti-H-IgG whole antibody labeled with Alexa 488. It can be seen from Figure 2-15 that the time
lag is less evident for transport of the Fab fragment antibody than for the whole antibody IgG as
a result of the smaller size of this protein. The other important point to glean from Figure 2-15 is
that during the initial three hours of the experiment the flux of the fragment antibody seems
lower that the whole antibody in Figure 2-14B. The reason for this lower flux was ascribed to the
fact that the sensitivity reach with Alexa 488 is much higher than with the FITC fluorophore.
Therefore, these experiments demonstrated the capacity of these antibody-modified
nanotube membranes to be used with a combination of both size and affinity selectivity for
protein separation.
Binding Capacities and Binding Constants
Adsorption isotherms were carried out to evaluate the protein binding capacity and the
binding constants for the permeating proteins to the antibody carriers. The data were analyzed
using a monolayer Langmuir model and nonlinear regression methods for the fitting. A summary
of the results obtained from the adsorption isotherms carried out with M-IgG modified, and H-
IgG modified membranes, using the 100 nm pore size commercially alumina templates is shown
in Figure 2-16.
By observing the binding capacities in Figure 2-16 obtained from each isotherm, it is
obvious, that these antibody-modified membranes preferentially bound the protein that binds
stronger to the carrier on the membrane as was demonstrated above. It was also observed that a
small amount of the weakly bounding proteins were bound to the carriers, which was due to
antigen cross reactivity. Likewise, the results for the dissociation constant showed the same trend
observed for the binding capacities. Lower dissociation constants (higher binding constant) were
77
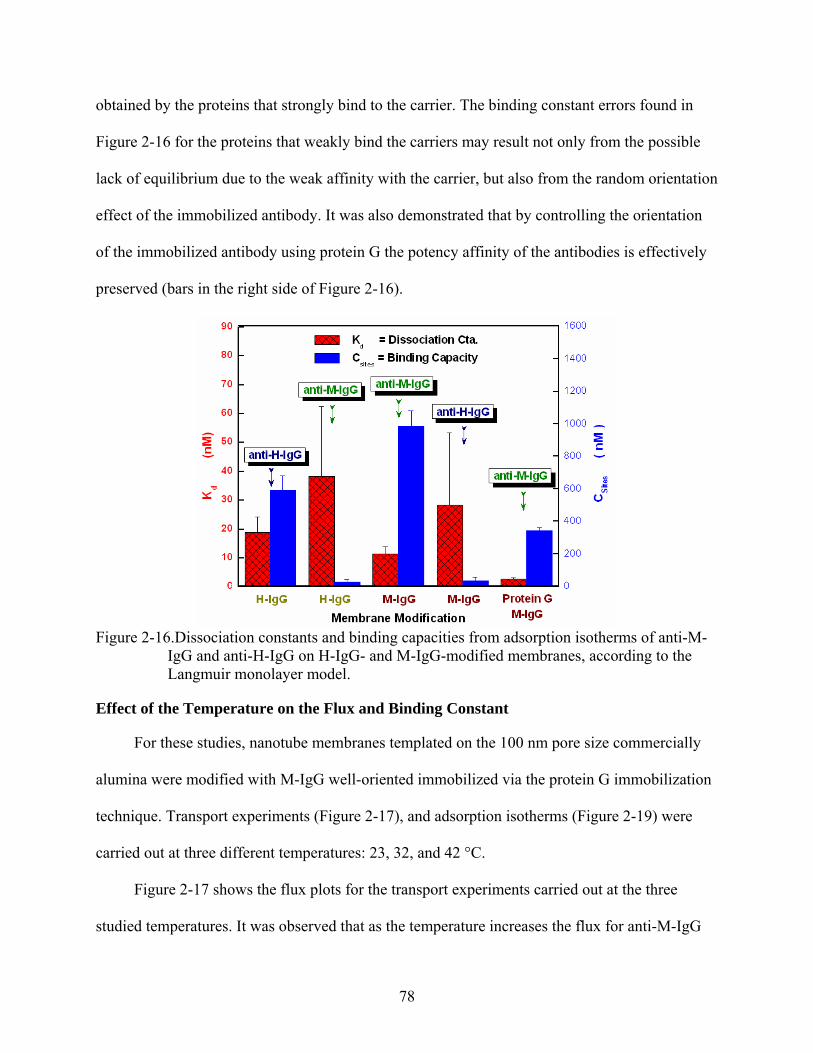
obtained by the proteins that strongly bind to the carrier. The binding constant errors found in
Figure 2-16 for the proteins that weakly bind the carriers may result not only from the possible
lack of equilibrium due to the weak affinity with the carrier, but also from the random orientation
effect of the immobilized antibody. It was also demonstrated that by controlling the orientation
of the immobilized antibody using protein G the potency affinity of the antibodies is effectively
preserved (bars in the right side of Figure 2-16).
Figure 2-16.Dissociation constants and binding capacities from adsorption isotherms of anti-M-
IgG and anti-H-IgG on H-IgG- and M-IgG-modified membranes, according to the Langmuir monolayer model.
Effect of the Temperature on the Flux and Binding Constant
For these studies, nanotube membranes templated on the 100 nm pore size commercially
alumina were modified with M-IgG well-oriented immobilized via the protein G immobilization
technique. Transport experiments (Figure 2-17), and adsorption isotherms (Figure 2-19) were
carried out at three different temperatures: 23, 32, and 42 °C.
Figure 2-17 shows the flux plots for the transport experiments carried out at the three
studied temperatures. It was observed that as the temperature increases the flux for anti-M-IgG
78
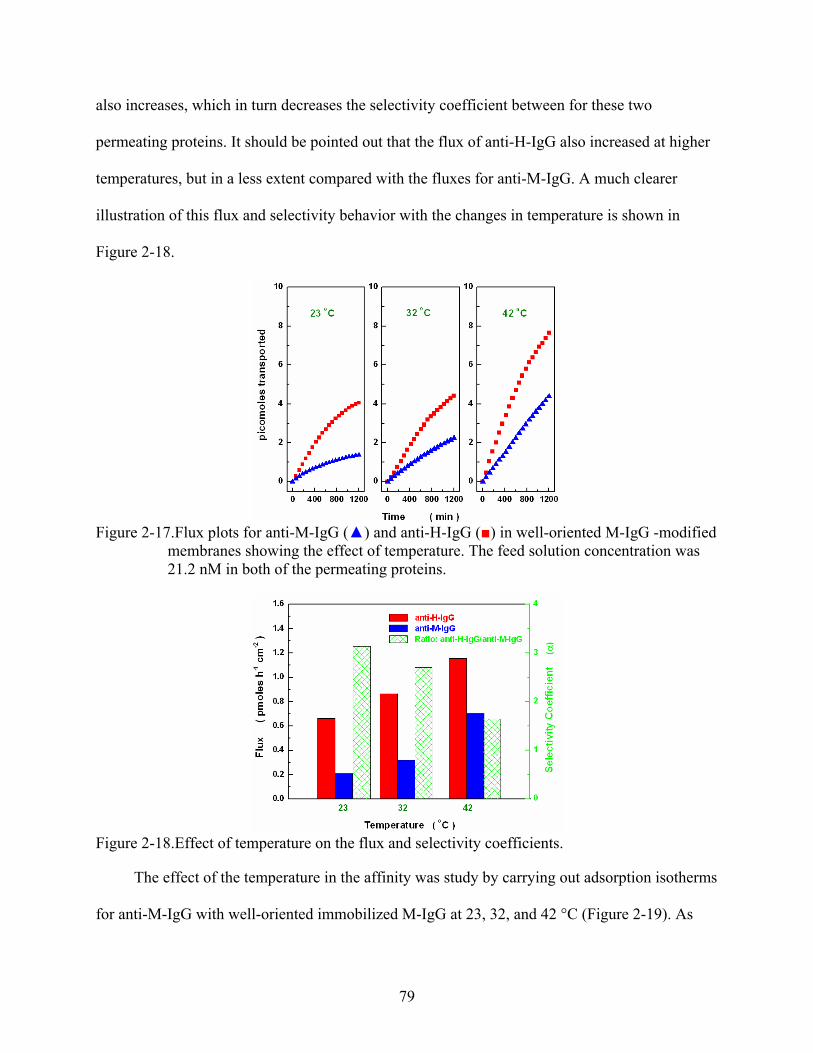
also increases, which in turn decreases the selectivity coefficient between for these two
permeating proteins. It should be pointed out that the flux of anti-H-IgG also increased at higher
temperatures, but in a less extent compared with the fluxes for anti-M-IgG. A much clearer
illustration of this flux and selectivity behavior with the changes in temperature is shown in
Figure 2-18.
Figure 2-17.Flux plots for anti-M-IgG () and anti-H-IgG () in well-oriented M-IgG -modified
membranes showing the effect of temperature. The feed solution concentration was 21.2 nM in both of the permeating proteins.
Figure 2-18.Effect of temperature on the flux and selectivity coefficients.
The effect of the temperature in the affinity was study by carrying out adsorption isotherms
for anti-M-IgG with well-oriented immobilized M-IgG at 23, 32, and 42 °C (Figure 2-19). As
79
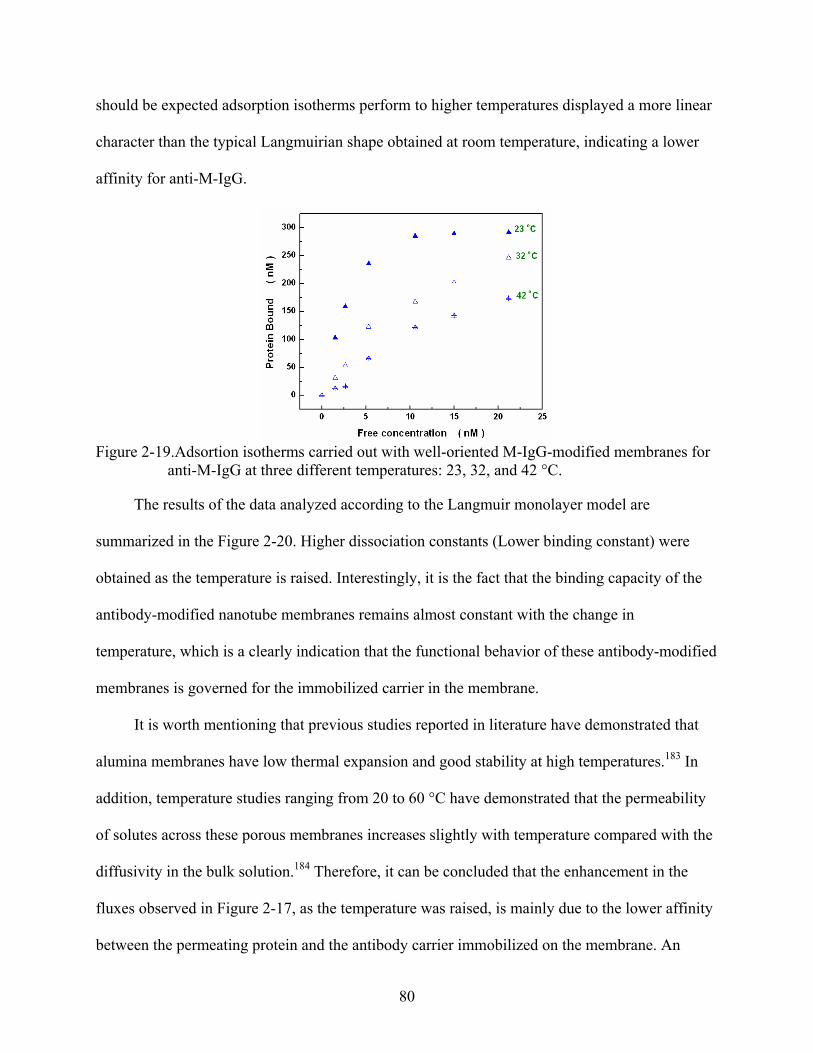
should be expected adsorption isotherms perform to higher temperatures displayed a more linear
character than the typical Langmuirian shape obtained at room temperature, indicating a lower
affinity for anti-M-IgG.
Figure 2-19.Adsortion isotherms carried out with well-oriented M-IgG-modified membranes for
anti-M-IgG at three different temperatures: 23, 32, and 42 °C.
The results of the data analyzed according to the Langmuir monolayer model are
summarized in the Figure 2-20. Higher dissociation constants (Lower binding constant) were
obtained as the temperature is raised. Interestingly, it is the fact that the binding capacity of the
antibody-modified nanotube membranes remains almost constant with the change in
temperature, which is a clearly indication that the functional behavior of these antibody-modified
membranes is governed for the immobilized carrier in the membrane.
It is worth mentioning that previous studies reported in literature have demonstrated that
alumina membranes have low thermal expansion and good stability at high temperatures.183 In
addition, temperature studies ranging from 20 to 60 °C have demonstrated that the permeability
of solutes across these porous membranes increases slightly with temperature compared with the
diffusivity in the bulk solution.184 Therefore, it can be concluded that the enhancement in the
fluxes observed in Figure 2-17, as the temperature was raised, is mainly due to the lower affinity
between the permeating protein and the antibody carrier immobilized on the membrane. An
80
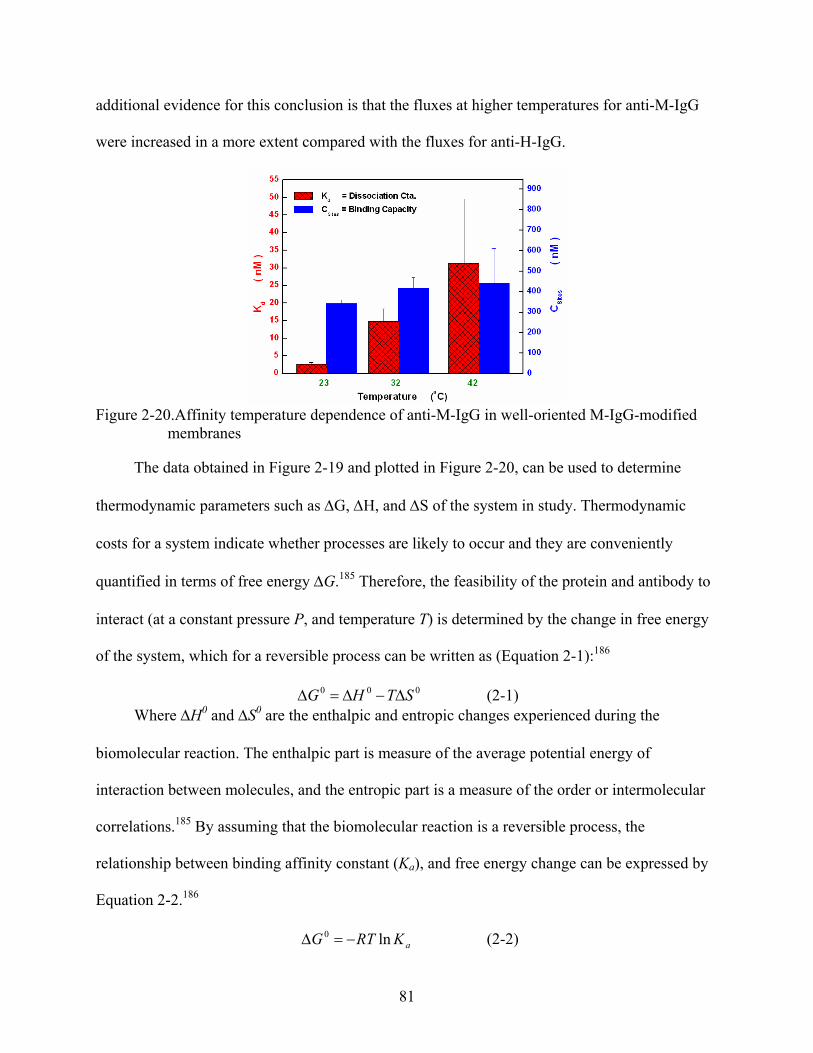
additional evidence for this conclusion is that the fluxes at higher temperatures for anti-M-IgG
were increased in a more extent compared with the fluxes for anti-H-IgG.
Figure 2-20.Affinity temperature dependence of anti-M-IgG in well-oriented M-IgG-modified
membranes
The data obtained in Figure 2-19 and plotted in Figure 2-20, can be used to determine
thermodynamic parameters such as ∆G, ∆H, and ∆S of the system in study. Thermodynamic
costs for a system indicate whether processes are likely to occur and they are conveniently
quantified in terms of free energy ∆G.185 Therefore, the feasibility of the protein and antibody to
interact (at a constant pressure P, and temperature T) is determined by the change in free energy
of the system, which for a reversible process can be written as (Equation 2-1):186
000 STHG ∆−∆=∆ (2-1) Where ∆H0 and ∆S0 are the enthalpic and entropic changes experienced during the
biomolecular reaction. The enthalpic part is measure of the average potential energy of
interaction between molecules, and the entropic part is a measure of the order or intermolecular
correlations.185 By assuming that the biomolecular reaction is a reversible process, the
relationship between binding affinity constant (Ka), and free energy change can be expressed by
Equation 2-2.186
(2-2) aKRTG ln0 −=∆
81
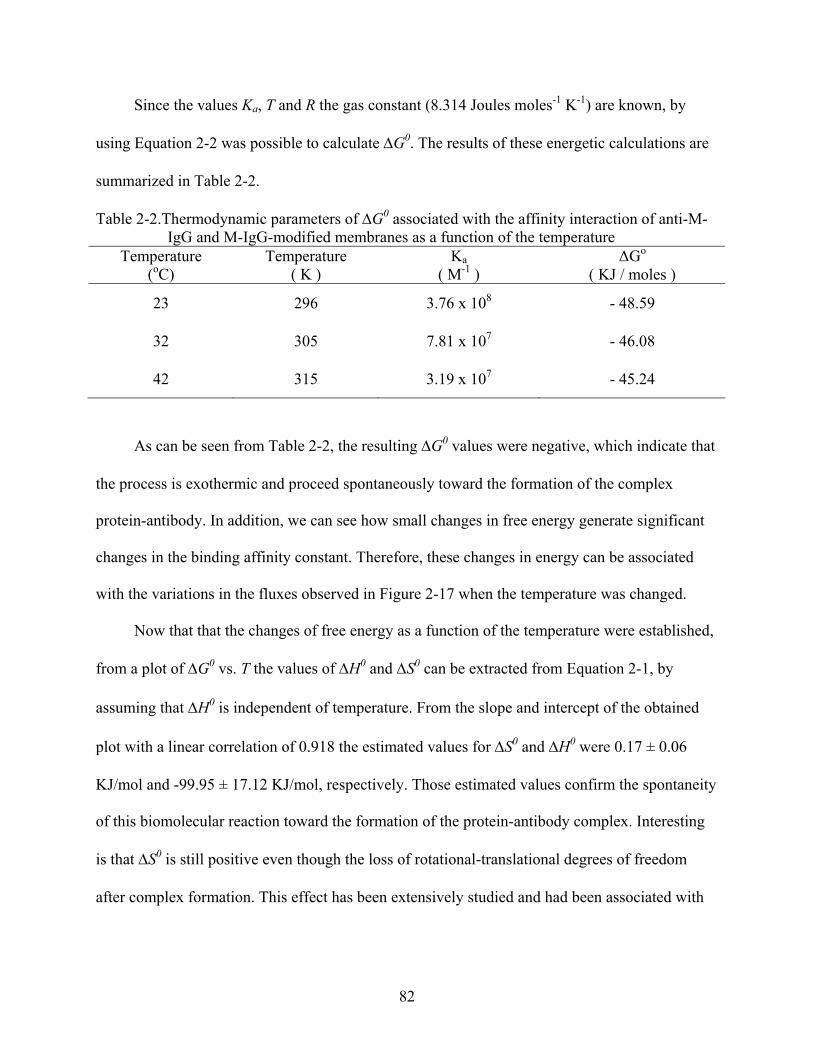
Since the values Ka, T and R the gas constant (8.314 Joules moles-1 K-1) are known, by
using Equation 2-2 was possible to calculate ∆G0. The results of these energetic calculations are
summarized in Table 2-2.
Table 2-2.Thermodynamic parameters of ∆G0 associated with the affinity interaction of anti-M-IgG and M-IgG-modified membranes as a function of the temperature
Temperature (oC)
Temperature ( K )
Ka ( M-1 )
∆Go
( KJ / moles )
23 296 3.76 x 10⁸ - 48.59
32 305 7.81 x 10⁷ - 46.08
42 315 3.19 x 10⁷ - 45.24
As can be seen from Table 2-2, the resulting ∆G0 values were negative, which indicate that
the process is exothermic and proceed spontaneously toward the formation of the complex
protein-antibody. In addition, we can see how small changes in free energy generate significant
changes in the binding affinity constant. Therefore, these changes in energy can be associated
with the variations in the fluxes observed in Figure 2-17 when the temperature was changed.
Now that that the changes of free energy as a function of the temperature were established,
from a plot of ∆G0 vs. T the values of ∆H0 and ∆S0 can be extracted from Equation 2-1, by
assuming that ∆H0 is independent of temperature. From the slope and intercept of the obtained
plot with a linear correlation of 0.918 the estimated values for ∆S0 and ∆H0 were 0.17 ± 0.06
KJ/mol and -99.95 ± 17.12 KJ/mol, respectively. Those estimated values confirm the spontaneity
of this biomolecular reaction toward the formation of the protein-antibody complex. Interesting
is that ∆S0 is still positive even though the loss of rotational-translational degrees of freedom
after complex formation. This effect has been extensively studied and had been associated with
82

partial desolvation and amount of water excluded during the formation of multiple
intermolecular noncovalent forces in the pocket of the binding site.187 -190
Thus, these studies confirm that the functional behavior of these antibody-modified
membranes is governed for the changes in free energy before and after interaction of the
permeating proteins with the carrier antibody, which can be attributed to the changes in enthalpy
and entropy of the system as was demonstrated here.
Effect of the Low Ionic Strength on the Selectivity
One method to improve selectivity in membrane-based separations is to shut down the
transport of one of the permeating species. It was found that by using transport solution with low
ionic strength it is possible to contemplate this option with antibody-modified membranes. To
test this option, we studied the rate and selectivity of transport of anti-H-IgG and anti-M-IgG in
only water solution across M-IgG modified nanotube membranes templated in commercial
alumina with 100-nm-diameter pores (Figure 2-21). It was observed that after two hours of
transport in low ionic strength conditions (only water), the fluxes of both the anti-H-IgG and
anti-M-IgG were depleted (Figure 2-21A). The selectivity for these two permeating proteins
through M-IgG membranes without equilibration was only 2.7. Alternatively, it was found that
transport across M-IgG-modified membranes that were previously equilibrated for six hours in a
water solution that was 2.65 nM in both of the permeating proteins (anti-H-IgG and anti-M-IgG),
the selectivity coefficient was increased to 17.3. This effect is shown in Figure 2-21B.
The effect of low ionic strength in the selectivity was attributed to the fact that IgG has no
unique isoelectric point, since each specific antibody molecule has its own variable region
containing different charged residues.191 Thus, for transport experiments carried out at low ionic
strength the thickness of the electric double-layer has a considerable influence in the mobility of
the permeating proteins across the antibody-modified membranes.186, 192 Consequently, for
83
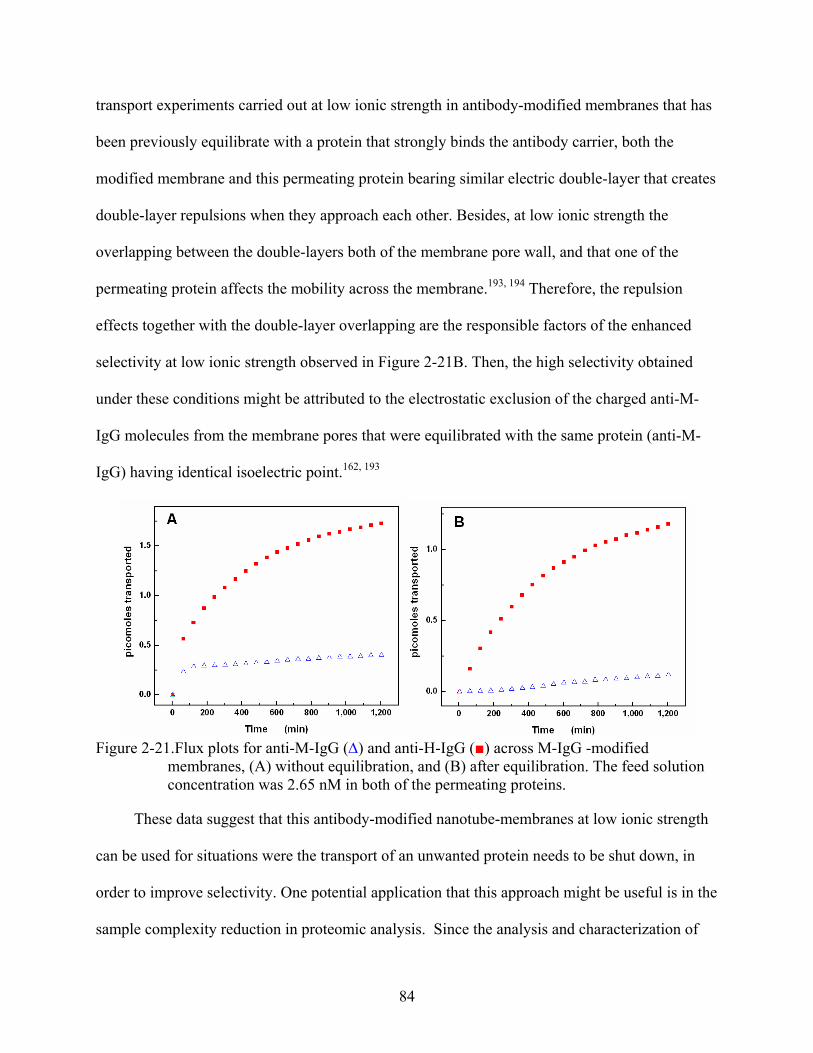
transport experiments carried out at low ionic strength in antibody-modified membranes that has
been previously equilibrate with a protein that strongly binds the antibody carrier, both the
modified membrane and this permeating protein bearing similar electric double-layer that creates
double-layer repulsions when they approach each other. Besides, at low ionic strength the
overlapping between the double-layers both of the membrane pore wall, and that one of the
permeating protein affects the mobility across the membrane.193, 194 Therefore, the repulsion
effects together with the double-layer overlapping are the responsible factors of the enhanced
selectivity at low ionic strength observed in Figure 2-21B. Then, the high selectivity obtained
under these conditions might be attributed to the electrostatic exclusion of the charged anti-M-
IgG molecules from the membrane pores that were equilibrated with the same protein (anti-M-
IgG) having identical isoelectric point.162, 193
Figure 2-21.Flux plots for anti-M-IgG (∆) and anti-H-IgG () across M-IgG -modified
membranes, (A) without equilibration, and (B) after equilibration. The feed solution concentration was 2.65 nM in both of the permeating proteins.
These data suggest that this antibody-modified nanotube-membranes at low ionic strength
can be used for situations were the transport of an unwanted protein needs to be shut down, in
order to improve selectivity. One potential application that this approach might be useful is in the
sample complexity reduction in proteomic analysis. Since the analysis and characterization of
84
complex mixtures of proteins are the central aims of proteomics.195 Thus, it would make possible
to deplete the flux of high abundance proteins across the antibody-modified membranes while at
the same time it would allow improving the separation and detection of low abundance proteins
by subsequent analytical techniques.
Conclusions
A detailed experimental study on antibody-functionalized nanotube membranes has been
carried out, including the effect of surface modification, pore size, feed concentration,
temperature, and ionic strength, both on the transport as on the functional behavior of the
membranes. It was demonstrated that the type of immobilized antibody changes the functional
behavior of the antibody-modified membranes and the transport properties of the permeating
proteins across them. These membranes showed a Langmuirian shape plot characteristic of a
typical behavior of facilitated transport membranes, when the effect of feed solution
concentration on the fluxes of the permeating proteins was investigated. Therefore, the antibody-
functionalized membranes showed here exhibit a type of behavior for facilitated-transport
membranes during protein separations. Important parameters such as the binding capacities of
the antibody-modified membranes and the binding constants for the permeating proteins to the
antibody carriers confirmed that the permeating protein anti-M-IgG binds strongly to the carrier
M-IgG and that the permeating protein anti-H-IgG binds weakly to this carrier, likewise, the
permeating protein anti-H-IgG binds strongly to the carrier H-IgG and that anti-M-IgG binds
weakly to this carrier. It was also demonstrated that by controlling the orientation of the
immobilized antibody using protein G the potency affinity of the antibodies is effectively
preserved. Through these studies was also demonstrated that by selecting a template membrane
with an appropriated pore size diameters these antibody-modified nanotube membranes have the
ability to be used with a combination of both size and affinity selectivity for protein separation.
85
Additional studies on the effect of temperature on the fluxes and the binding constant
demonstrated that the functional behavior of these antibody-modified membranes is governed for
the changes in free energy before and after interaction of the permeating proteins with the carrier
antibody, which was attributed to the changes in enthalpy and entropy of the system. Other
important finding during this investigation was that by controlling the ionic strength of the
transport solution, these antibody-modified nanotube membranes can be used for situations were
the transport of an unwanted protein needs to be shut down, in order to improve selectivity. This
latter approach might be useful in the sample complexity reduction in proteomic analysis. Since
the analysis and characterization of complex mixtures of proteins are the central aims of
proteomics. It is also noteworthy to mention the low pM detection limits achieved during these
studies. In general, the ability to alter the surface biochemistries and thus tailor the membrane
for specific analytes, promises the use of these membranes for the analysis of a wide range of
proteins.
86
CHAPTER 3 MODELING AND CHARACTERIZATION OF THE TRANSPORT PROPERTIES OF
PROTEINS ACROSS ANTIBODY-FUNCTIONALIZED NANOTUBE MEMBRANES BY USING THE DUAL-MODE MODEL
Introduction
In the design and development of more effective membranes for membrane-based
separations, the value of the transport mechanism must be considered in order to understand the
different interactions that govern transport through the pores of the membranes. In addition, the
transport mechanism, supported by mathematical models and experimental evidences provides a
grater understanding of the underlying transport phenomena.
The separation properties of molecules through membranes are based on the difference of
permeation. Therefore, it is important to understand permeation behavior, not only to understand
the permeation mechanism but also to elucidate the separation properties.
In order to elucidate the transport properties across selective membranes a wide variety of
models have been developed.196 - 202 However, a model that explains the sorption and permeation
mechanism is of fundamental importance to fully understand the transport properties in
membrane separation.
The well-known dual-mode model allows evaluation of both sorption and permeation
mechanism, for those cases where the model applies. The dual-mode model was initially
developed by Vieth and Sladek203 and later modified by Paul and Koros204 to describe the
sorption and permeation of gas molecules in glassy polymeric films. In literature there are
various modified dual-mode models that have also been explored.182, 205 - 208
The model assumes that the membrane contains two distinct regions in which sorption can
occur.204 One region exhibits solubility of the molecule based on Henry’s law and the second
87
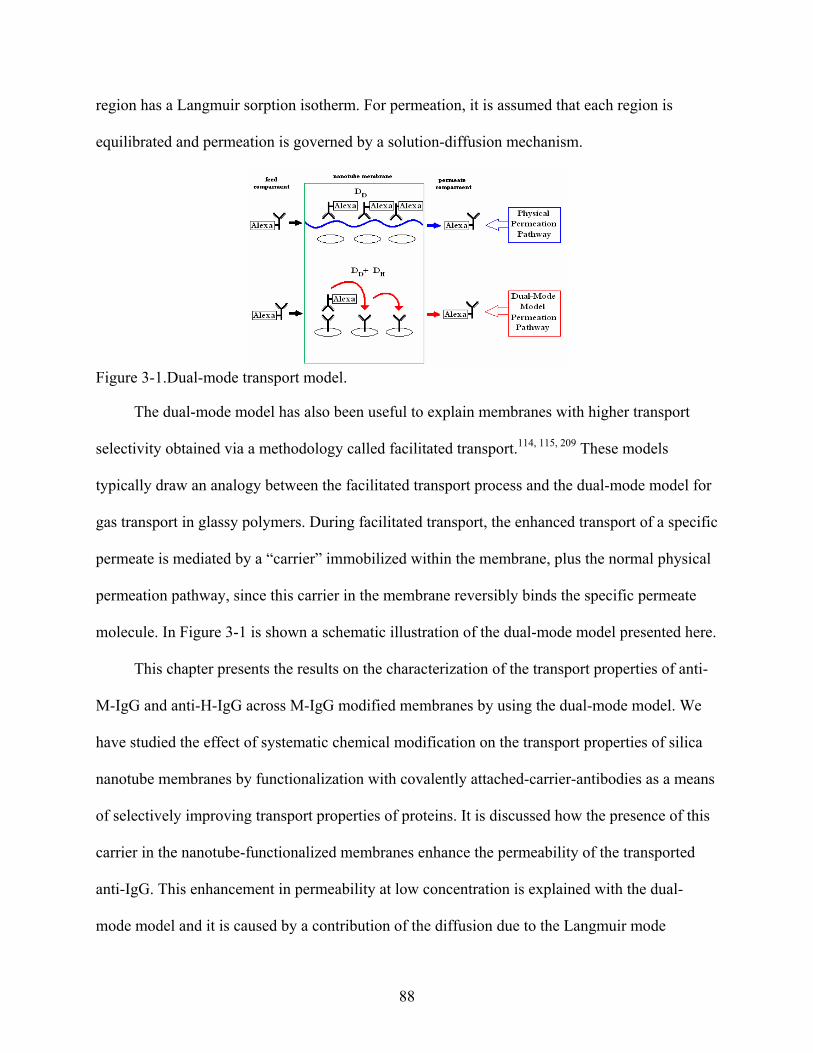
region has a Langmuir sorption isotherm. For permeation, it is assumed that each region is
equilibrated and permeation is governed by a solution-diffusion mechanism.
Figure 3-1.Dual-mode transport model.
The dual-mode model has also been useful to explain membranes with higher transport
selectivity obtained via a methodology called facilitated transport.114, 115, 209 These models
typically draw an analogy between the facilitated transport process and the dual-mode model for
gas transport in glassy polymers. During facilitated transport, the enhanced transport of a specific
permeate is mediated by a “carrier” immobilized within the membrane, plus the normal physical
permeation pathway, since this carrier in the membrane reversibly binds the specific permeate
molecule. In Figure 3-1 is shown a schematic illustration of the dual-mode model presented here.
This chapter presents the results on the characterization of the transport properties of anti-
M-IgG and anti-H-IgG across M-IgG modified membranes by using the dual-mode model. We
have studied the effect of systematic chemical modification on the transport properties of silica
nanotube membranes by functionalization with covalently attached-carrier-antibodies as a means
of selectively improving transport properties of proteins. It is discussed how the presence of this
carrier in the nanotube-functionalized membranes enhance the permeability of the transported
anti-IgG. This enhancement in permeability at low concentration is explained with the dual-
mode model and it is caused by a contribution of the diffusion due to the Langmuir mode
88
species. Based on these results, the concept of modulated facilitated transport using antibody-
modified nanotube membranes is proposed. Thus, depending on the affinity parameters, the
transport in the carrier situation can be modulated in comparison to the situation without carrier
modification where the rate of transport is only controlled by physical diffusion. The present
study test the dual-mode model under circumstance where is possible to have modulated
facilitated transport, and simulations and experimental results are discuses to validate this
concept.
Definition of Dual-Mode Model
The dual-mode model is widely used to describe the sorption of gas molecules on glassy
polymers210, 211. Depending on their internal structure, the polymers are characterized as either
glassy or rubbery. Sorption of gases to the rubbery state occurs by dissolution, while sorption to
glassy state occurs by concurrent dissolution and hole-filling mechanisms.212, 213 The sorption
mechanism of gas molecules in glassy polymers has been understood in term of the dual-mode
model.203 - 208 The model is based on two types of sorption sites. One obeys the Henry’s law
dissolution and the second a Langmuir-type sorption. According to the dual-mode model, total
sorption to surface membrane is the sum of sorption in the dissolution domain and sorption in the
Langmuir-type sorption domain (Equation 3-1): 214
bpbpC
pkCCC sitesDHD +
+=+=1
(3-1)
By analogy but making a couple of changes, we have used the dual-mode model used for
gas-transport to interpret transport of proteins in aqueous solution through antibody-modified
nanotube membranes. Instead of reporting the concentration of penetrant in the membrane for a
given gas pressure, the concentration is reported as a function of the feed protein concentration.
The Henry’s law coefficient, kD, was also adjusted and it was given in terms of partition
89
coefficient kp. Since, the sorption coefficient given in the Equation 3-1 is a gas-phase coefficient;
in solution therefore the sorption coefficient should be considered as a liquid-phase coefficient.
The adapted dual-mode model is shown in Equation 3-2.
feed
feedsitesfeedpHD bC
bCCCkCCC
++=+=
1 (3-2)
Where C is the total protein concentration in the membrane, CD is the protein concentration
based on Henry’s law sorption, CH is the protein concentration based on Langmuir sorption.
Whereas, kp is defined as the partition coefficient, b and Csites are the Langmuir affinity constant
and maximum capacity parameters, respectively.
The Langmuir affinity constant, b, characterizes the sorption affinity for a particular
protein-antibody membrane system, and Csites is used to measure the amount of antibody
immobilized in the membrane.
The three dual-mode sorption parameters, kp, CSites, and b, can be determined through the
experimental evaluation of protein-adsorption isotherms. The estimation for CSites, and b,
sorption parameters can be accomplished by analyzing the data according to the monolayer
Langmuir model (Equation 3-3):167
Free
FreeSitesBound bC
bCCC+
=1
(3-3)
Where CBound is the specific concentration of protein bound to the carriers in the
membrane, which is related to each specific concentration of free protein (Cfree) in the
equilibration solution.
The other of the three sorption parameters contained in the dual-mode model is the
partition coefficient. Through the analysis of the boundary conditions of the Langmuir-mode
model, an optimum parameter value for the partition coefficient could be estimated.
90
Thus, at the high concentration range, the Langmuir model approaches to a constant value
that is equal to CSites, so no more sorption will take place when all the sites are filled. On the
other hand, at very low concentrations, the Langmuir model obeys the correct thermodynamic
boundary condition of Henry’s law over infinitely dilute concentration range.215, 216
In the limit of zero concentration the Langmuir model leads to the following equation
which satisfies the condition of a linear isotherm (Equation 3-4):
FeedDFeedSitesCCkbCCC ≡=⋅
→0lim (3-4)
Hence, a good estimation of Henry’s law coefficient, kD, may be written as the product of
CSites and b. Consequently, this kD parameter can be used for the calculation of the partition
coefficient (kp), which is defined as the product of kD times the ratio of volumes between volume
inside the membrane (VMembrane) and volume in the free equilibration solution (VFree Solution)
(Equation 3-5).
⎟⎟⎠
⎞⎜⎜⎝
⎛=
⋅SolutionFree
MembraneDp V
Vkk (3-5)
It should be pointed out that for linear isotherms, the Henry’s law coefficient, kD, can be
determined from the slope, while for dual-mode adsorption isotherms, it can be determined from
the initial slope at infinite dilute concentration.
The partition coefficients can also be calculated using Equation 3-6, which expresses the
ratio of the intramembrane concentration to external concentration at equilibrium.
⎟⎟⎠
⎞⎜⎜⎝
⎛=
⋅⋅ SolutionFreeSolutionFree
MembraneMembranep CV
CVk (3-6)
All this dual-mode sorption model theory explained until here can be validated using
linearization methods for the Equation 3-2. Several linear plots of the dual-mode sorption
model have been studied,217 and for instance, the equation can be rearranged and transformed
into the Equation 3-7.
91
FeedSitesSitesFeedp
Feed CCbCCkC
C×+=
−11 (3-7)
A plot of CFeed / (C - kp CFeed) against CFeed is expected to be linear, where the Langmuir
sorption parameters, Csites and b, can be evaluated from the slope and intercept of the straight
line, respectively.217
Now, if the solute-adsorption isotherms are represented by the dual-mode model, as
shown above, the permeation mechanism can also be described in terms of the dual-mode model.
The permeation mechanism using the dual-mode model assumes partial immobilization of
the Langmuir-mode species.204 Therefore, independent dual diffusion coefficients are given for
each sorption mode. One diffusion coefficient (DD) is used for the fraction of the solute dissolved
in the membrane according to Henry’s law expression and a second (DH) for the fraction of the
solute contained in the Langmuir-type sorption mode. The expression for the permeation flux
through the membrane is derived by Fick’s law, and it can be written in the form given in
Equation 3-8.
( ) xC
CFKD
xC
Dx
CDJ D
DD
HH
DD ∂
∂⎥⎦
⎤⎢⎣
⎡
⋅++−=
∂∂
−∂∂
−= 211
α (3-8)
F corresponds to the mobile fraction of the Langmuir species (Equation 3-9).
D
H
DD
F ≡ (3-9)
Where α and K are constants that contain the three sorption parameters (Equation 3-10 and
Equation 3-11).
p
Sites
kbC
K ≡ (3-10); pk
b≡α (3-11)
The mathematical solution that Koros and Paul found for the Equation 3-8 is known as the
partial immobilization model.204 The model assumes that there is always local equilibrium
between the two sorption modes, thus, CH can be written in terms of CD. In addition, the
92
diffusion coefficient is assumed constant so it does not depend on concentration. Besides, the
model splits the total concentration into two parts, one a mobile part with a diffusion coefficient
DD and concentration Cm, and the second remainder part (C - Cm), corresponds to the part that is
totally immobilized. In other words, the concentration associated with CD as well as a fraction F
of that associated with CH has finite mobility while the remaining fraction, 1-F, of CH has zero
mobility. Therefore, the concentration for the mobile part can be written as (Equation 3-12):
HDm FCCC += (3-12) The flux for this mobile part may be written as is shown in Equation 3-13.
xC
DJ mD ∂∂
−= (3-13)
Whereas the equation of continuity (Fick’s second law), represented by the dual-mode
model for a solute transported through the membrane is given by the Equation 3-14.
xJ
tCC
tC HD
∂∂
−=∂+∂
=∂∂ )( (3-14)
The equation of continuity is nothing more that the mass balance for the system, which
relates the accumulation of solute in the porous membrane to the changes in flux at any time and
any direction of the flux. In other words it is the rate of solute balance. Thus, the difference
between the rate of solute that comes in to the membrane, and the rate of solute out, is equal to
the rate of solute accumulation. The insertion of the Equation 3-13 into the Equation 3-14, results
in Equation 3-15.
xxCD
tCC mDHD
∂∂∂−∂
−=∂+∂ )()( (3-15)
By assuming that the diffusion coefficient does not depend on concentration, and inserting
the Equation 3-12 into the mass balance equation given by the Equation 3-15, the equation
becomes (Equation 3-16)
2
2 )()(x
FCCD
tCC HD
DHD
∂+∂
=∂+∂ (3-16)
93
Finally, by setting all the assumptions and writing the concentration of CH in terms of CD,
(KCD / 1+αCD), a numerical solution of the partial immobilization model yields to an expression
for the permeability coefficient given by Equation 3-17.204
⎥⎦
⎤⎢⎣
⎡+
+=Feed
Dp bCFKDkP
11 (3-17)
The use of the model requires the determination of both DD and F. This can be
accomplished through the experimental evaluation of the permeability coefficients; so, optimum
parameters for the diffusion coefficients can be determined.
Throughout every experimental permeation, measurements of the flux per unit area, J,
(moles cm-2 sec-1), is obtained. Therefore, if a number of permeation experiments are carried out
at different feed concentration using membranes with homogeneous thickness, L, the steady-state
permeability coefficient for a specific feed concentration can be calculated using the following
relationship showed in Equation 3-18.218, 219
FeedCJLP ≡ (3-18)
This procedure would also allow comparing the experimental permeability plots with those
calculated obtained ones.
In order to explain permeation, the dual-mode model assumes that the permeation is
governed via a solution-diffusion mechanism. If the permeation of the protein in the membrane
is controlled by a solution-diffusion mechanism, the permeability can be expressed as the
product of diffusivity, D, and solubility, S as is shown in Equation 3-19.
DSP = (3-19) Although the solubility of a permeating protein in the membrane can be also expressed in
term of the dual-mode sorption parameters by (Equation 3-20):210, 211
Feed
SitespHD
Feed bCbC
kSSC
CS+
+=+=≡1
(3-20)
94
Where S is the solubility of permeating protein, and the terms SD and SH corresponds to the
solubility values based on Henry’s law and Langmuir-type sorption, respectively.
If the diffusion coefficient does not depend on concentration, a plot of permeability against
solubility is expected to be linear, with a slope equals to the diffusion coefficient (Equation 3-
19). Through this correlation between P and S experimentally the diffusion coefficients can be
estimated.
With the aim of determining the F parameter, the experimental permeability data can be
plotted against (1 + bCFeed)-1. A value for F can be estimated from the slope of this line.211
Additionally, the diffusion coefficient DD might be evaluated from the intercept as well, but only
if the plot is straight line with a very high linear correlation coefficient (Equation 3-21).
Feed
DSitesDp bC
bFDCDkP
++=
1 (3-21)
In fact, the dual-mode model makes feasible the evaluation of the sorption and permeation
mechanism. This is of fundamental importance to fully understand the transport properties in
membrane separation. Hence, using the dual-mode model, a comprehensible explanation of the
transport mechanism might be accomplished through a detailed elucidation of the transport
properties such as sorption, diffusion and permeability.
Results and Discussion
Simulations of Permeability vs. Feed Concentration Based on the Dual-Mode Model
The permeability is the product between diffusivity and solubility as is described in
Equation 3-19. The permeability dependence in terms of the dual-mode model is not only related
with the concentration of solute molecules in the feed solution, but also with the different
properties and interactions between solute-membrane. Thus, the permeation of solute molecules
95
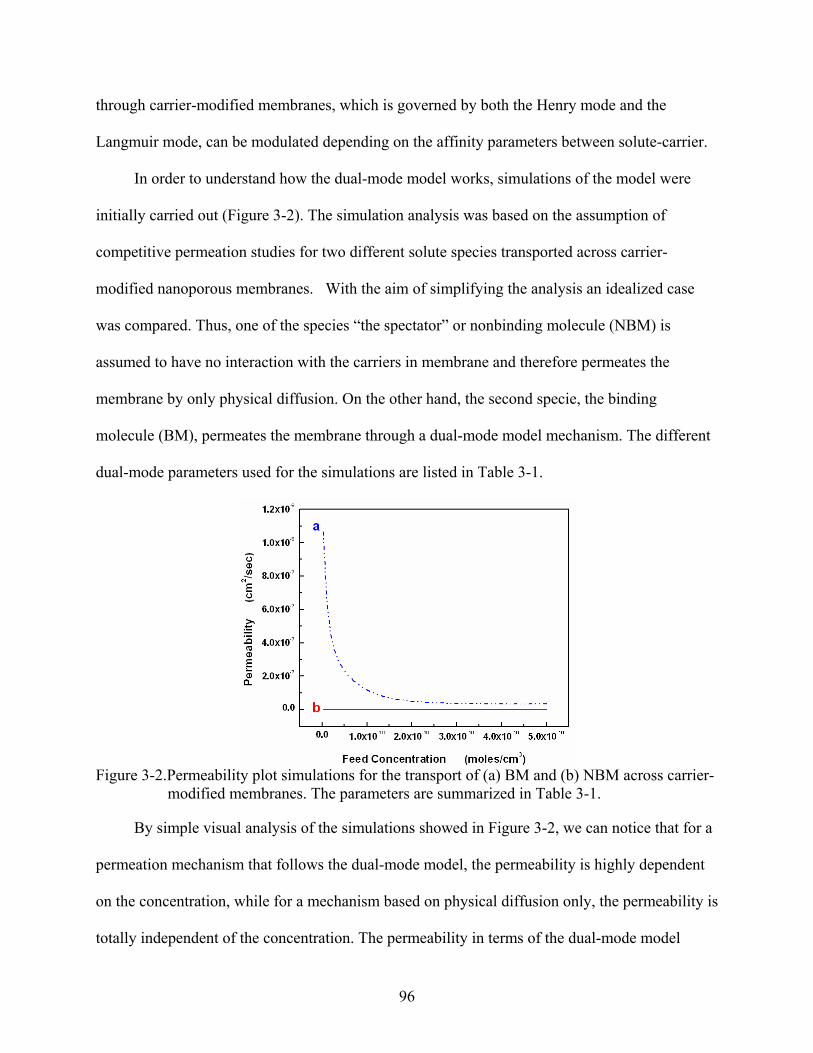
through carrier-modified membranes, which is governed by both the Henry mode and the
Langmuir mode, can be modulated depending on the affinity parameters between solute-carrier.
In order to understand how the dual-mode model works, simulations of the model were
initially carried out (Figure 3-2). The simulation analysis was based on the assumption of
competitive permeation studies for two different solute species transported across carrier-
modified nanoporous membranes. With the aim of simplifying the analysis an idealized case
was compared. Thus, one of the species “the spectator” or nonbinding molecule (NBM) is
assumed to have no interaction with the carriers in membrane and therefore permeates the
membrane by only physical diffusion. On the other hand, the second specie, the binding
molecule (BM), permeates the membrane through a dual-mode model mechanism. The different
dual-mode parameters used for the simulations are listed in Table 3-1.
Figure 3-2.Permeability plot simulations for the transport of (a) BM and (b) NBM across carrier-
modified membranes. The parameters are summarized in Table 3-1.
By simple visual analysis of the simulations showed in Figure 3-2, we can notice that for a
permeation mechanism that follows the dual-mode model, the permeability is highly dependent
on the concentration, while for a mechanism based on physical diffusion only, the permeability is
totally independent of the concentration. The permeability in terms of the dual-mode model
96
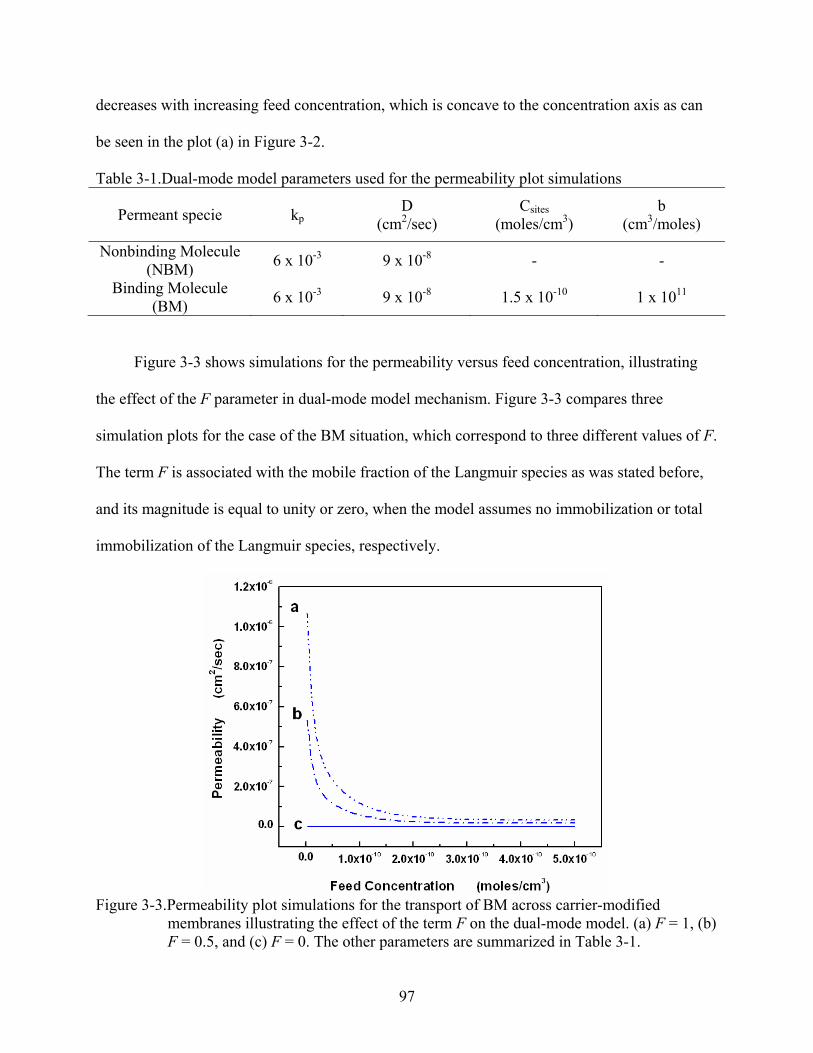
decreases with increasing feed concentration, which is concave to the concentration axis as can
be seen in the plot (a) in Figure 3-2.
Table 3-1.Dual-mode model parameters used for the permeability plot simulations
Permeant specie kpD
(cm2/sec) Csites
(moles/cm3) b
(cm3/moles)
Nonbinding Molecule (NBM) 6 x 10⁻³ 9 x 10⁻⁸ - -
Binding Molecule (BM) 6 x 10⁻³ 9 x 10⁻⁸ 1.5 x 10⁻¹⁰ 1 x 10¹¹
Figure 3-3 shows simulations for the permeability versus feed concentration, illustrating
the effect of the F parameter in dual-mode model mechanism. Figure 3-3 compares three
simulation plots for the case of the BM situation, which correspond to three different values of F.
The term F is associated with the mobile fraction of the Langmuir species as was stated before,
and its magnitude is equal to unity or zero, when the model assumes no immobilization or total
immobilization of the Langmuir species, respectively.
Figure 3-3.Permeability plot simulations for the transport of BM across carrier-modified
membranes illustrating the effect of the term F on the dual-mode model. (a) F = 1, (b) F = 0.5, and (c) F = 0. The other parameters are summarized in Table 3-1.
97
Hence, the permeability for a solute molecule that permeates a membrane through a dual-
mode mechanism depends also on the magnitude of F. For the BM situation, the permeability is
highly dependent on the feed concentration as F gets closer to unity (plot a, in Figure 3-3).
Consequently, as the value of F decreases or the degree of immobilization increases, the
permeability becomes less dependent on the feed concentration (plot b, in Figure 3-3). When
there is total immobilization, when F is equal to zero, the permeability is independent of the
concentration, and so the BM dissolves and diffuses through the membrane via Henry’s mode
dissolution only (plot c, in Figure 3-3). It should be pointed out that regardless of the value of F,
the permeability decreases gradually with the increase of feed concentration until a steady level
that reach the value of kpDD.
The above simulations in Figures 3-2 and 3-3 suggested that when no immobilization of
the Langmuir species is achieved, the permeability across carrier-modified membranes is always
enhanced compared with the physical diffusion case. Therefore, the transport through carrier-
modified membranes that fulfill the dual-mode model mechanism is always facilitated when the
Langmuir species no experience immobilization.
The concentration dependence of the permeability for the dual-mode model can also be
analyzed through the evaluation of the limit boundaries conditions in concentration for the
equation of permeability (Equation 3-17). At the high limit concentration range the equation for
permeability becomes equal to the product between kp times D, this is due to the behavior of the
factor [1 + FK / (1 + b CFeed)], which becomes closer to unity as the concentration increases. At
the low limit concentration, the highest permeability value is reached when the denominator
term, (1 + b CFeed), becomes unity. As the latter gets closer to one, there is a range in
concentrations where the variations in permeability are less noticeable, and the permeability
98
becomes less dependent on the concentration. This region resembles to the time lag region for
gases in glassy polymers.181, 182
In general, as stated by Koros and Paul the limits of the dual-mode model are confined to
two situations.204 One is the limit where total immobilization occurs, and only the Henry’s mode
species contributes to the permeability. The other limit is a situation with a nonlinear isotherm
with no distinctions for sorption mechanism or transport behavior between any of the adsorbed
solutes. However, the concentration-dependence of the permeability is a consequence of the
shape of the adsorption isotherm, and therefore a result of the binding affinity strength between
Langmuir permeating species and Langmuir binding sites.
In order to demonstrate the concentration dependence on the permeability as consequence
of the shape of the adsorption isotherm, permeability plot simulations were carried out
comparing two different sorption mechanisms via two different binding affinities (Figure 3-4).
The plot (a) in Figure 3-4 clearly indicates that a carrier-modified membrane with stronger
affinity for the solute molecules displays higher concentration-dependence as a result of the
sorption isotherm. So, the concentration dependence of permeability is determined by the
strength of the binding affinity for the solute-carrier complex in the membrane. However, the
total permeability is highly dependent on the diffusion coefficient.
It is worth mentioning that by using simulations was verified that the order of influence of
the dual-mode model parameters in the permeability was D > b > Csites >>> kp, respectively.
According to these results, the dual-mode model permeation analysis is a useful model to
explain transport across carrier-modified membranes. The analysis showed until here
demonstrated how the fluctuations in permeability are a result of the strength of the sorption
mechanism. Therefore, the differences in permeability and the differences in permeability
99

concentration-dependence can be used to elucidate the separation properties for the solute
molecules that permeate a carrier-modified membrane. For the reason that differences in
permeability are a consequence of the sorption mechanism, the separation properties of one
solute might differ from that of another, depending on the affinity solute-carrier interaction.
Figure 3-4.Permeability plot simulations for the transport of BM across carrier-modified
membranes showing the effect of the binding affinity on the permeability. (a) b = 1 x 1011 cm3/moles, and (b) b = 3 x 1010 cm3/moles. The other parameters are summarized in Table 3-1.
Experimental Description of the Dual-Mode Model
Effect of feed concentration on the flux
A number of competitive permeation experiments were carried out at different feed
concentration, ranging from 2.65 x 10⁻¹² to 5.0 x 10⁻¹⁰ moles cm-3 using M-IgG modified
membranes (Figure 3-5). Throughout every experimental permeation measurements, the flux per
unit area (moles cm-2 sec-1) was obtained, using 0.31 cm2 as the area of membrane exposed to the
contacting solution phases.
Figure 3-5 shows the studies of the effect of feed concentration on the flux during
competitive permeation experiments of anti-H-IgG and anti-M-IgG across M-IgG-modified
membranes. The flux for anti-H-IgG was at all times higher than the flux for anti-M-IgG. The
linear dynamic range for anti-M-IgG was 3 times lower than for anti-H-IgG, as a consequence of
100
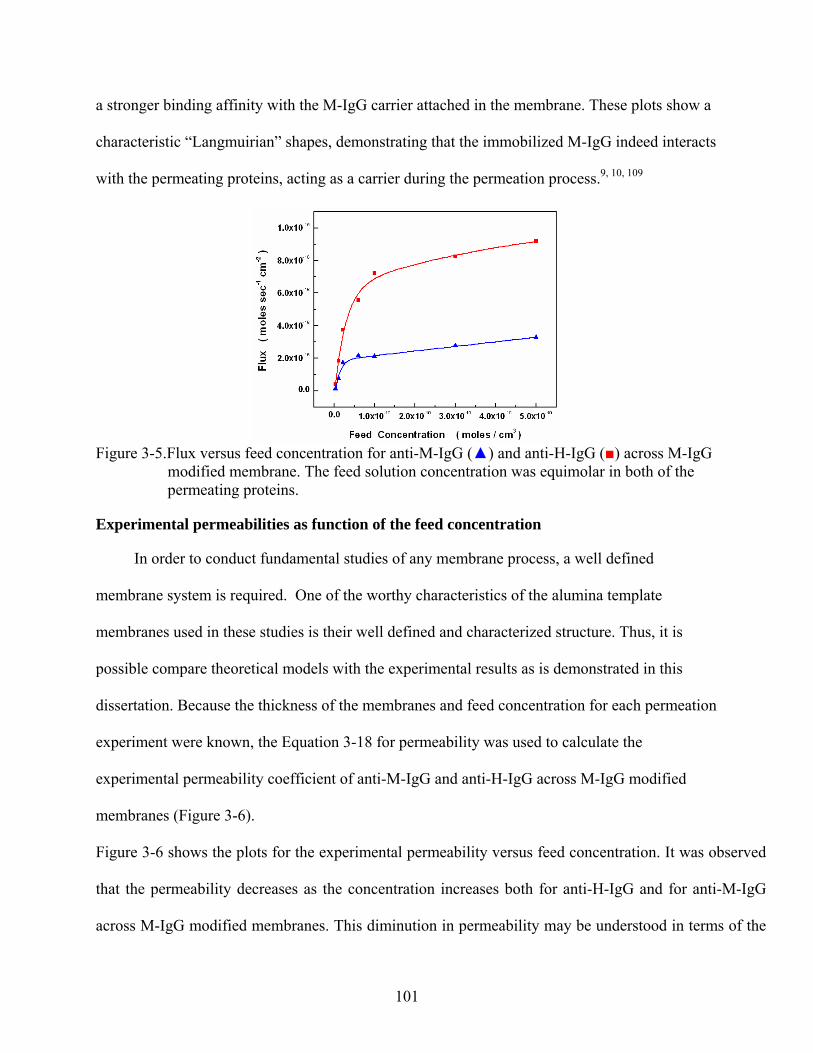
a stronger binding affinity with the M-IgG carrier attached in the membrane. These plots show a
characteristic “Langmuirian” shapes, demonstrating that the immobilized M-IgG indeed interacts
with the permeating proteins, acting as a carrier during the permeation process.9, 10, 109
Figure 3-5.Flux versus feed concentration for anti-M-IgG () and anti-H-IgG () across M-IgG
modified membrane. The feed solution concentration was equimolar in both of the permeating proteins.
Experimental permeabilities as function of the feed concentration
In order to conduct fundamental studies of any membrane process, a well defined
membrane system is required. One of the worthy characteristics of the alumina template
membranes used in these studies is their well defined and characterized structure. Thus, it is
possible compare theoretical models with the experimental results as is demonstrated in this
dissertation. Because the thickness of the membranes and feed concentration for each permeation
experiment were known, the Equation 3-18 for permeability was used to calculate the
experimental permeability coefficient of anti-M-IgG and anti-H-IgG across M-IgG modified
membranes (Figure 3-6).
Figure 3-6 shows the plots for the experimental permeability versus feed concentration. It was observed
that the permeability decreases as the concentration increases both for anti-H-IgG and for anti-M-IgG
across M-IgG modified membranes. This diminution in permeability may be understood in terms of the
101
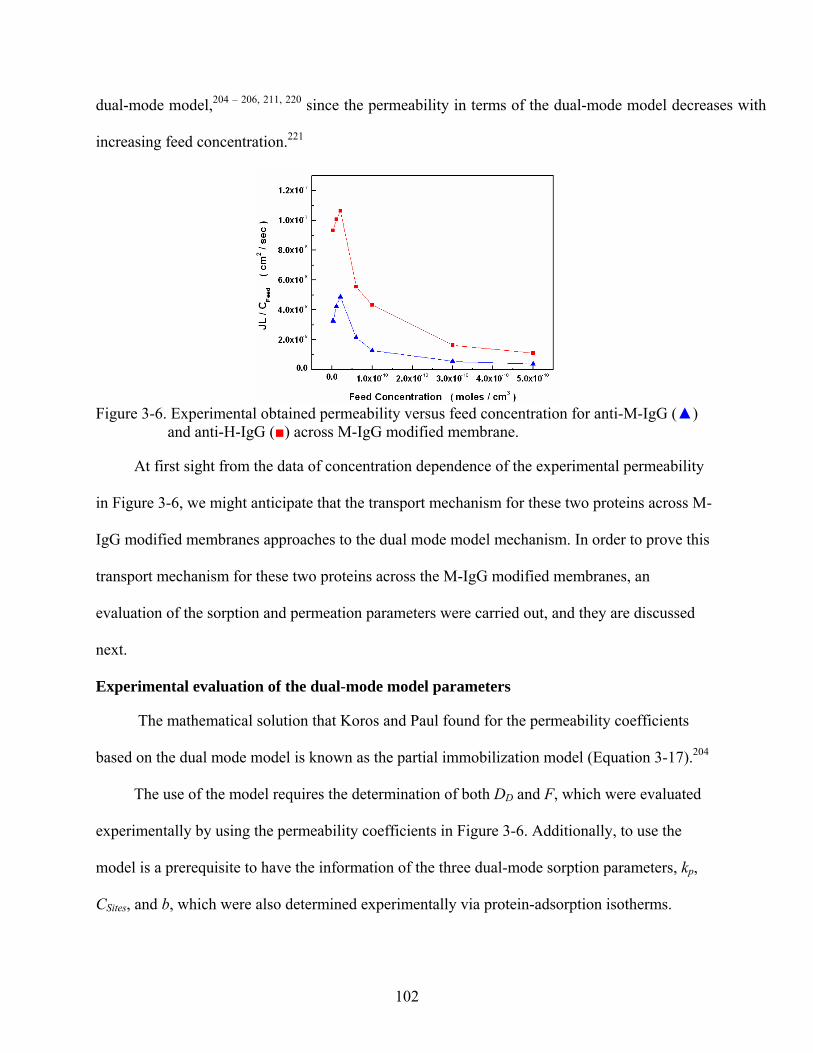
dual-mode model,204 – 206, 211, 220 since the permeability in terms of the dual-mode model decreases with
increasing feed concentration.221
Figure 3-6. Experimental obtained permeability versus feed concentration for anti-M-IgG ()
and anti-H-IgG () across M-IgG modified membrane.
At first sight from the data of concentration dependence of the experimental permeability
in Figure 3-6, we might anticipate that the transport mechanism for these two proteins across M-
IgG modified membranes approaches to the dual mode model mechanism. In order to prove this
transport mechanism for these two proteins across the M-IgG modified membranes, an
evaluation of the sorption and permeation parameters were carried out, and they are discussed
next.
Experimental evaluation of the dual-mode model parameters
The mathematical solution that Koros and Paul found for the permeability coefficients
based on the dual mode model is known as the partial immobilization model (Equation 3-17).204
The use of the model requires the determination of both DD and F, which were evaluated
experimentally by using the permeability coefficients in Figure 3-6. Additionally, to use the
model is a prerequisite to have the information of the three dual-mode sorption parameters, kp,
CSites, and b, which were also determined experimentally via protein-adsorption isotherms.
102
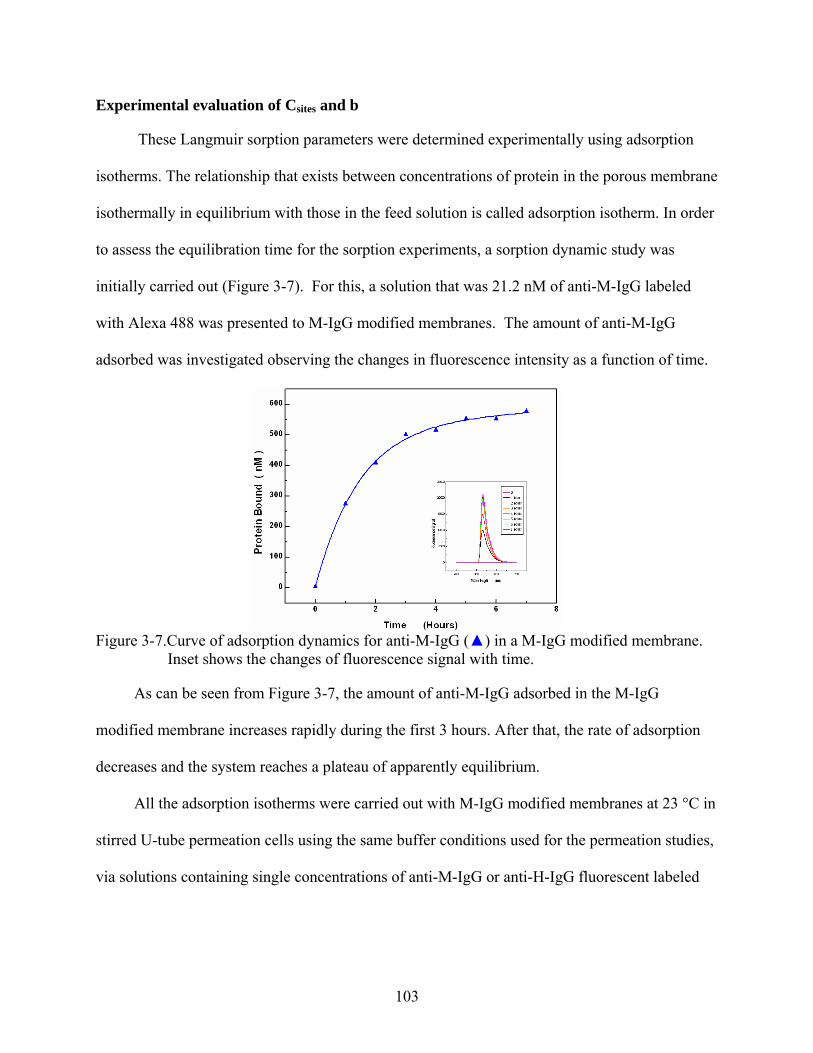
Experimental evaluation of Csites and b
These Langmuir sorption parameters were determined experimentally using adsorption
isotherms. The relationship that exists between concentrations of protein in the porous membrane
isothermally in equilibrium with those in the feed solution is called adsorption isotherm. In order
to assess the equilibration time for the sorption experiments, a sorption dynamic study was
initially carried out (Figure 3-7). For this, a solution that was 21.2 nM of anti-M-IgG labeled
with Alexa 488 was presented to M-IgG modified membranes. The amount of anti-M-IgG
adsorbed was investigated observing the changes in fluorescence intensity as a function of time.
Figure 3-7.Curve of adsorption dynamics for anti-M-IgG () in a M-IgG modified membrane.
Inset shows the changes of fluorescence signal with time.
As can be seen from Figure 3-7, the amount of anti-M-IgG adsorbed in the M-IgG
modified membrane increases rapidly during the first 3 hours. After that, the rate of adsorption
decreases and the system reaches a plateau of apparently equilibrium.
All the adsorption isotherms were carried out with M-IgG modified membranes at 23 °C in
stirred U-tube permeation cells using the same buffer conditions used for the permeation studies,
via solutions containing single concentrations of anti-M-IgG or anti-H-IgG fluorescent labeled
103
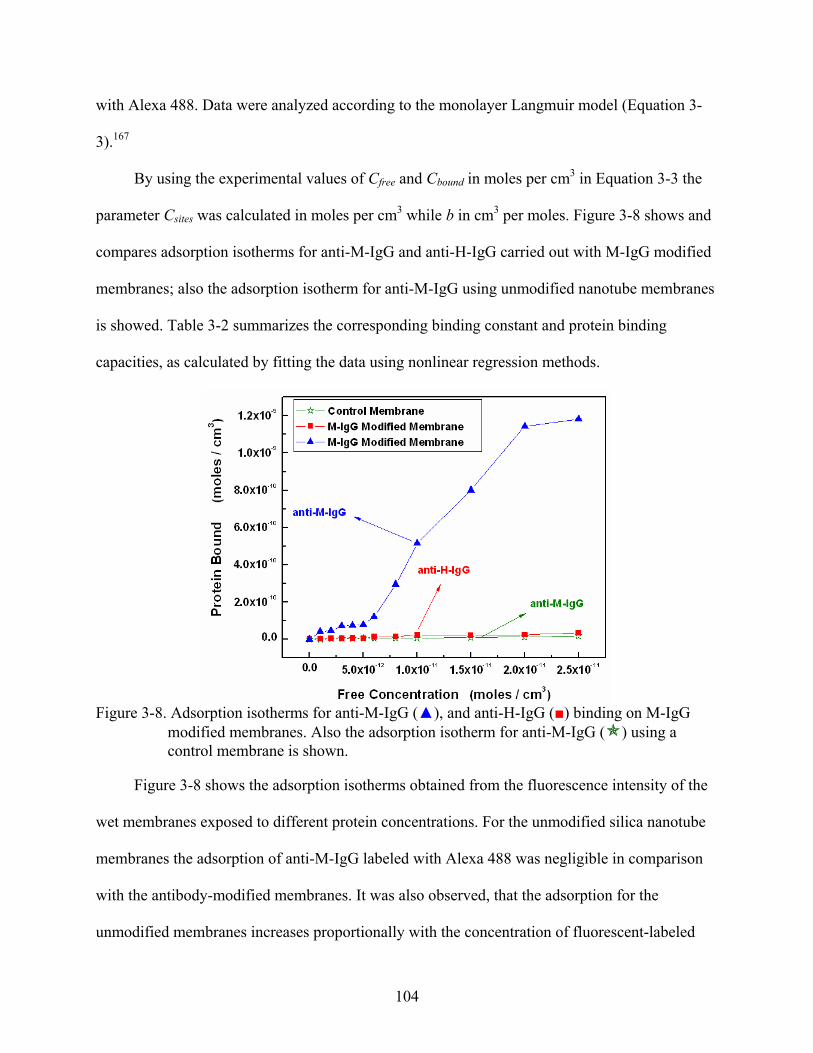
with Alexa 488. Data were analyzed according to the monolayer Langmuir model (Equation 3-
3).167
By using the experimental values of Cfree and Cbound in moles per cm3 in Equation 3-3 the
parameter Csites was calculated in moles per cm3 while b in cm3 per moles. Figure 3-8 shows and
compares adsorption isotherms for anti-M-IgG and anti-H-IgG carried out with M-IgG modified
membranes; also the adsorption isotherm for anti-M-IgG using unmodified nanotube membranes
is showed. Table 3-2 summarizes the corresponding binding constant and protein binding
capacities, as calculated by fitting the data using nonlinear regression methods.
Figure 3-8. Adsorption isotherms for anti-M-IgG (), and anti-H-IgG () binding on M-IgG
modified membranes. Also the adsorption isotherm for anti-M-IgG ( ) using a control membrane is shown.
Figure 3-8 shows the adsorption isotherms obtained from the fluorescence intensity of the
wet membranes exposed to different protein concentrations. For the unmodified silica nanotube
membranes the adsorption of anti-M-IgG labeled with Alexa 488 was negligible in comparison
with the antibody-modified membranes. It was also observed, that the adsorption for the
unmodified membranes increases proportionally with the concentration of fluorescent-labeled
104
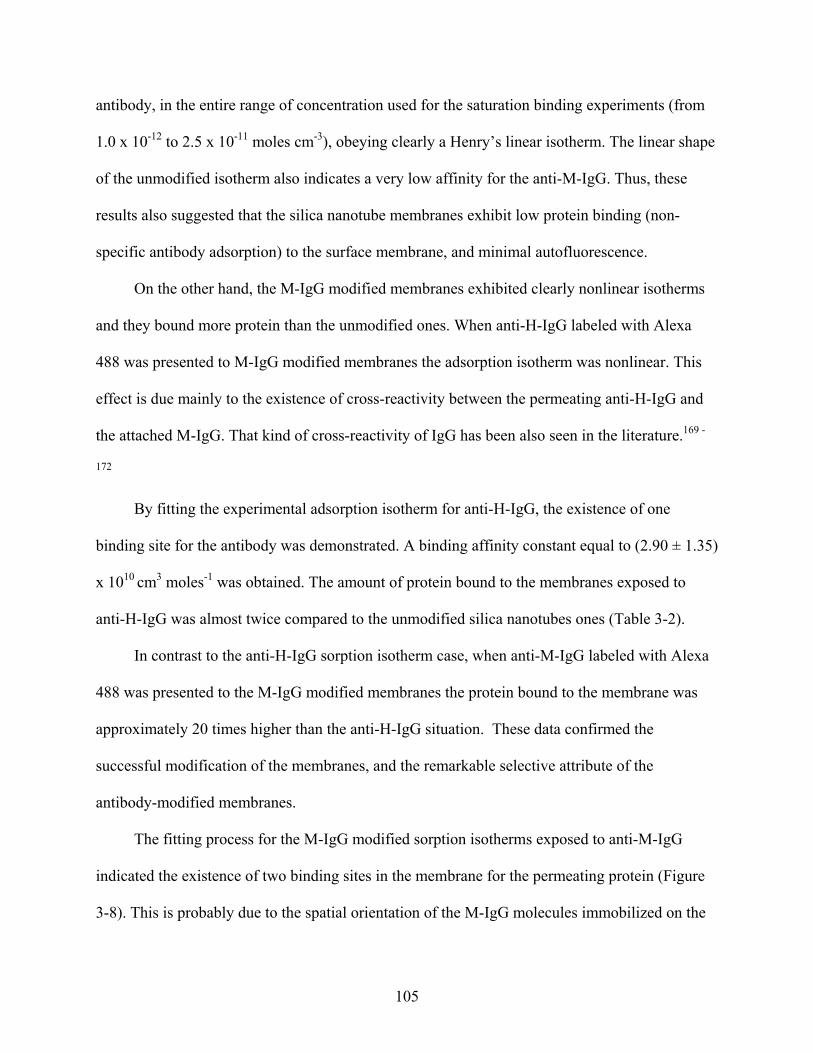
antibody, in the entire range of concentration used for the saturation binding experiments (from
1.0 x 10⁻¹² to 2.5 x 10⁻¹¹ moles cm-3), obeying clearly a Henry’s linear isotherm. The linear shape
of the unmodified isotherm also indicates a very low affinity for the anti-M-IgG. Thus, these
results also suggested that the silica nanotube membranes exhibit low protein binding (non-
specific antibody adsorption) to the surface membrane, and minimal autofluorescence.
On the other hand, the M-IgG modified membranes exhibited clearly nonlinear isotherms
and they bound more protein than the unmodified ones. When anti-H-IgG labeled with Alexa
488 was presented to M-IgG modified membranes the adsorption isotherm was nonlinear. This
effect is due mainly to the existence of cross-reactivity between the permeating anti-H-IgG and
the attached M-IgG. That kind of cross-reactivity of IgG has been also seen in the literature.169 -
172
By fitting the experimental adsorption isotherm for anti-H-IgG, the existence of one
binding site for the antibody was demonstrated. A binding affinity constant equal to (2.90 ± 1.35)
x 1010 cm3 moles-1 was obtained. The amount of protein bound to the membranes exposed to
anti-H-IgG was almost twice compared to the unmodified silica nanotubes ones (Table 3-2).
In contrast to the anti-H-IgG sorption isotherm case, when anti-M-IgG labeled with Alexa
488 was presented to the M-IgG modified membranes the protein bound to the membrane was
approximately 20 times higher than the anti-H-IgG situation. These data confirmed the
successful modification of the membranes, and the remarkable selective attribute of the
antibody-modified membranes.
The fitting process for the M-IgG modified sorption isotherms exposed to anti-M-IgG
indicated the existence of two binding sites in the membrane for the permeating protein (Figure
3-8). This is probably due to the spatial orientation of the M-IgG molecules immobilized on the
105
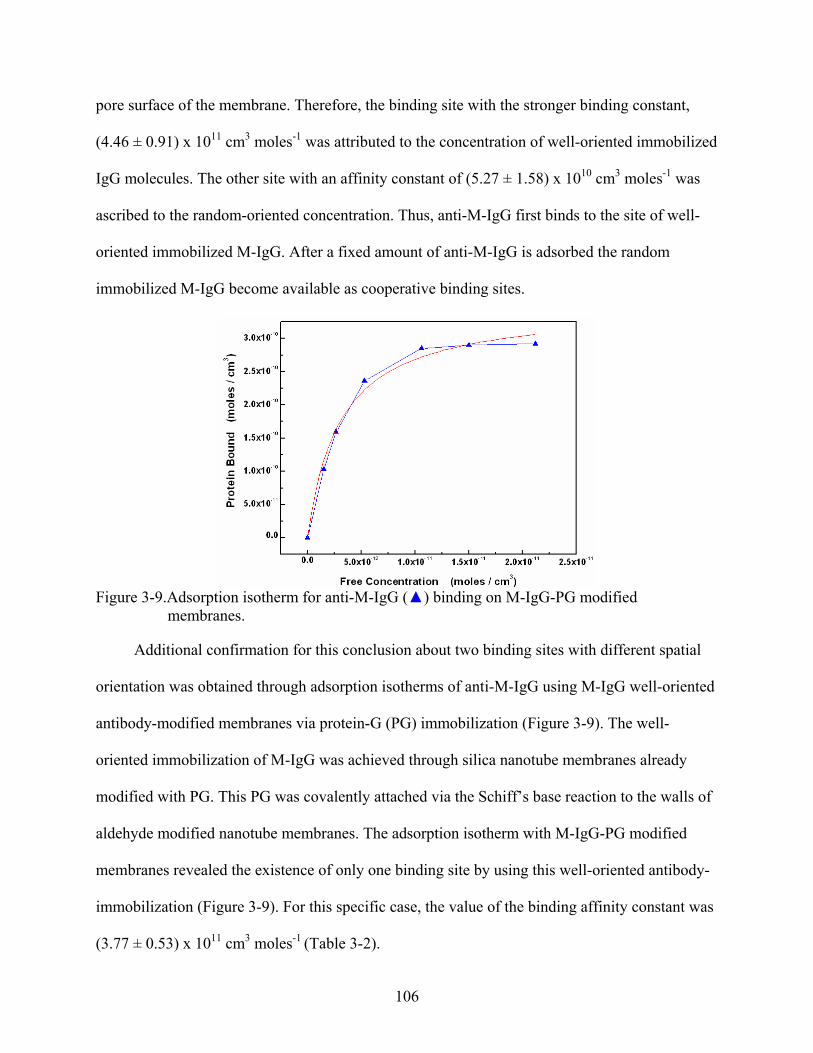
pore surface of the membrane. Therefore, the binding site with the stronger binding constant,
(4.46 ± 0.91) x 1011 cm3 moles-1 was attributed to the concentration of well-oriented immobilized
IgG molecules. The other site with an affinity constant of (5.27 ± 1.58) x 1010 cm3 moles-1 was
ascribed to the random-oriented concentration. Thus, anti-M-IgG first binds to the site of well-
oriented immobilized M-IgG. After a fixed amount of anti-M-IgG is adsorbed the random
immobilized M-IgG become available as cooperative binding sites.
Figure 3-9.Adsorption isotherm for anti-M-IgG () binding on M-IgG-PG modified
membranes.
Additional confirmation for this conclusion about two binding sites with different spatial
orientation was obtained through adsorption isotherms of anti-M-IgG using M-IgG well-oriented
antibody-modified membranes via protein-G (PG) immobilization (Figure 3-9). The well-
oriented immobilization of M-IgG was achieved through silica nanotube membranes already
modified with PG. This PG was covalently attached via the Schiff’s base reaction to the walls of
aldehyde modified nanotube membranes. The adsorption isotherm with M-IgG-PG modified
membranes revealed the existence of only one binding site by using this well-oriented antibody-
immobilization (Figure 3-9). For this specific case, the value of the binding affinity constant was
(3.77 ± 0.53) x 1011 cm3 moles-1 (Table 3-2).
106

It should be pointed out that the antibodies used in these studies were all polyclonal
antibodies. Therefore, the found binding affinity constants are indeed an average of the pool of
the different clonally related subpopulations of antibodies existing in the sample solution.222, 223
Table 3-2.Thermodynamic parameters from adsorption isotherms of anti-M-IgG and anti-H-IgG
on M-IgG modified membranes, according to the Langmuir monolayer model Adsorption Isotherms
Csites1
(moles/cm3)
b1
(cm3/moles)
Csites2
(moles/cm3)
b2
(cm3/moles) R
anti-H-IgG / M-IgG (7.24 ± 1.33) x 10-11 (2.90 ± 1.35) x 1010 - - 0.983
anti-M-IgG / M-IgG (1.16 ± 0.19) x 10-10 (4.46 ± 0.91) x 1011 (1.30 ± 0.39) x 10-9 (5.27 ± 1.58) x 1010 0.928
anti-M-IgG /M-IgG-PG (3.49 ± 0.14) x 10-10 (3.77 ± 0.53) x 1011 - - 0.992
Experimental evaluation of the partition coefficients kp
For definition, partition coefficients provide a thermodynamic measurement of the
solubility of the permeating proteins in the membrane. Therefore, considering this
thermodynamic fact, proteins with higher diffusion coefficient should have lower partition
coefficients. Contrarily, an increase of the partition coefficient increases the resident time of the
permeating proteins in the membrane.
The partition coefficient is one the other three sorption parameters contained in the dual-
mode model. The experimental evaluation of the partition coefficients across M-IgG modified
membranes for the proteins studied here were investigated using three different approaches.
Table 3-3 compiles the results for these studies.
The first approach for the analysis of kp was based on the examination of the boundary
conditions of the Langmuir-mode in the limit of zero concentration, that determine that the
Henry’s law coefficient (kD), may be written as the product of CSites times b (Equation 3-4).215, 216
107

Since the values of CSites and b were already estimated for both of the permeating proteins
studied here as was shown above. The partition coefficients calculated using the Equation 3-5
were 7.24 x 10⁻³ and 2.94 x 10⁻⁴ for anti-M-IgG and for anti-H-IgG, respectively.
Table 3-3.The kp determined by various approaches
Method anti-M-IgG Anti-H-IgG
Equations 3-4 and 3-5 7.24 x 10⁻³ 2.94 x 10⁻⁴
Slopes Figure 3-10 6.14 x 10⁻³ 2.77 x 10⁻⁴
Equation 3-6 (5.84 ± 1.06) x 10-3 (2.79 ± 0.69) x 10-4
It is important to mention that for linear isotherms, the Henry’s law coefficient, kD, can be
determined from the slope of the isotherm plot, while for dual-mode sorption isotherms, it can be
determined from the initial slope at infinite dilute concentration (Figure 3-10). To prove this
assertion the fitting plots of the adsorption isotherms for anti-M-IgG and anti-H-IgG were
extrapolated to a very dilute concentration range (from 0 to 6 x 10-13 moles cm-3), and the
respective slopes from the linear plots were estimated, these results are shown in Figure 3-10.
Figure 3-10. Extrapolations of the adsorption isotherms at infinite dilute concentration for anti-
M-IgG (), and anti-H-IgG () in M-IgG modified membranes.
108
The kD obtained for anti-M-IgG and anti-H-IgG from the slopes in Figure 3-10 were 43.85
and 1.98, respectively. Likewise, using Equation 3-5 a partition coefficient of 6.14 x 10⁻³ for
anti-M-IgG and 2.77 x 10⁻⁴ for anti-H-IgG were found.
The partition coefficients were also calculated using Equation 3-6, which expresses the
ratio of the intramembrane concentration to external concentration at equilibrium. The partition
coefficients estimated with this equation were comparable to those calculated by using the direct
method via kD. As is shown in Table 3-3, the partition coefficients in this case were (5.84 ± 1.06)
x 10-3 and (2.79 ± 0.69) x 10-4 for anti-M-IgG and anti-H-IgG, respectively.
In order to validate these partition coefficients, dual-mode model permeability plot
simulations were carried out (Figure 3-11). For these simulations, four different values for the
partition coefficients were assigned by keeping the rest of the dual-mode model parameters
constant. The results shown in Figure 3-11 demonstrated that variations in the partition
coefficients have a negligible effect in the permeability coefficients when the binding affinity is
fairly strong as the studies showed here.
Figure 3-11.Permeability plot simulations illustrating the effect of the partition coefficient on the
dual-mode model. Simulation parameters: D = 5 x 10⁻⁸ cm2/sec, b = 9 x 1010 cm3/moles, Csites = 3.5 x 10⁻⁸ moles/cm3, and kp were respectively, 1 (), 0.1 (), 0.01 (), and 0.001( ).
109
Experimental evaluation of the diffusion coefficients and solubility
The most direct method of experimental determination of S and D requires steady-state
permeation data, complemented with equilibrium sorption data.199 Therefore, effective values of
S, D, and hence P characterized for a membrane-penetrant system that has been restricted to
equilibrium sorption and steady-state permeation conditions represent appropriate averages of
the transport parameter of the system.224 To use the dual-mode model requires knowing D and S.
This was accomplished experimentally through an evaluation of the permeability and solubility
in terms of the dual-mode model as will be shown next.
As was state before, the solubility for a penetrant protein in the membrane can be
expressed in term of the dual-mode sorption parameters by the Equation 3-20.210 For the reason
that the three sorption parameters required for this calculation were already established, an
experimental study of the concentration dependence of the solubility was conducted (Figure 3-
12).
Figure 3-12 shows the concentration-dependence of the solubility in term of the dual-mode
model for anti-M-IgG and anti-H-IgG in M-IgG modified membranes. The concentration-
dependence of the solubility in term of the dual model is a consequence of the shape of the
adsorption isotherm. Hence, from Figure 3-12 M-IgG modified membranes possess higher
affinity for anti-M-IgG than for anti-H-IgG, as was demonstrated before (Table 3-2). These data
also indicate where a protein molecule prefers to dissolve, whether in the Langmuir binding sites
or in the membrane matrix based on Henry’s law. According to Figure 3-12, anti-M-IgG
molecules would rather dissolve in the Langmuir sorption mode (upper plot), while anti-H-IgG
molecules in the Henry’s mode (lower plot). It was also observed that regardless of the protein at
low concentrations the Langmuir mode contributes the most to the total solubility, which is
probably due to the strong affinity exerted for that fraction of well-oriented immobilized carriers
110
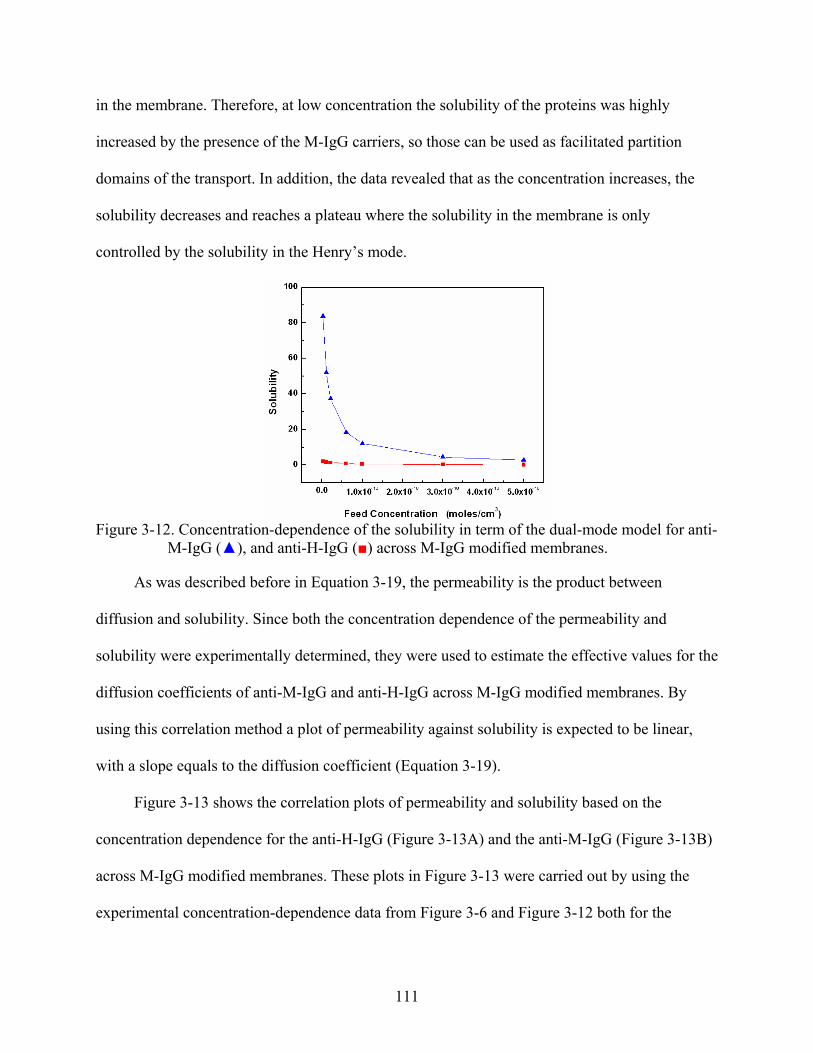
in the membrane. Therefore, at low concentration the solubility of the proteins was highly
increased by the presence of the M-IgG carriers, so those can be used as facilitated partition
domains of the transport. In addition, the data revealed that as the concentration increases, the
solubility decreases and reaches a plateau where the solubility in the membrane is only
controlled by the solubility in the Henry’s mode.
Figure 3-12. Concentration-dependence of the solubility in term of the dual-mode model for anti-
M-IgG (), and anti-H-IgG () across M-IgG modified membranes.
As was described before in Equation 3-19, the permeability is the product between
diffusion and solubility. Since both the concentration dependence of the permeability and
solubility were experimentally determined, they were used to estimate the effective values for the
diffusion coefficients of anti-M-IgG and anti-H-IgG across M-IgG modified membranes. By
using this correlation method a plot of permeability against solubility is expected to be linear,
with a slope equals to the diffusion coefficient (Equation 3-19).
Figure 3-13 shows the correlation plots of permeability and solubility based on the
concentration dependence for the anti-H-IgG (Figure 3-13A) and the anti-M-IgG (Figure 3-13B)
across M-IgG modified membranes. These plots in Figure 3-13 were carried out by using the
experimental concentration-dependence data from Figure 3-6 and Figure 3-12 both for the
111
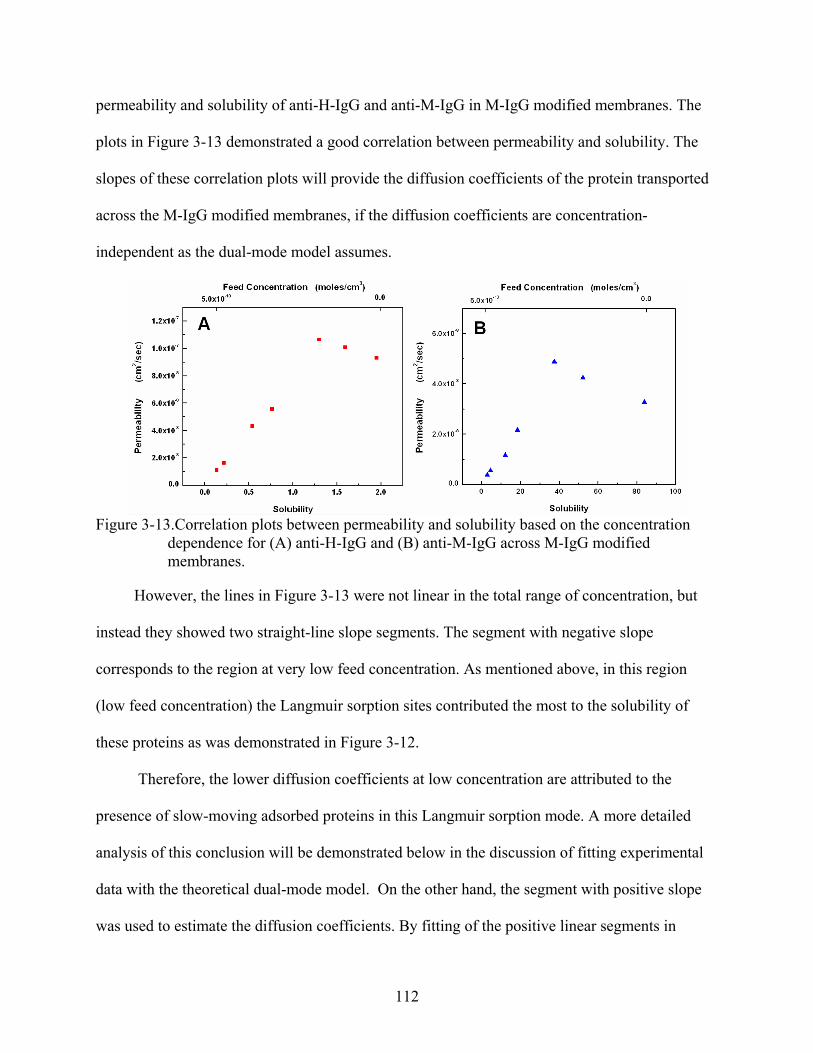
permeability and solubility of anti-H-IgG and anti-M-IgG in M-IgG modified membranes. The
plots in Figure 3-13 demonstrated a good correlation between permeability and solubility. The
slopes of these correlation plots will provide the diffusion coefficients of the protein transported
across the M-IgG modified membranes, if the diffusion coefficients are concentration-
independent as the dual-mode model assumes.
Figure 3-13.Correlation plots between permeability and solubility based on the concentration
dependence for (A) anti-H-IgG and (B) anti-M-IgG across M-IgG modified membranes.
However, the lines in Figure 3-13 were not linear in the total range of concentration, but
instead they showed two straight-line slope segments. The segment with negative slope
corresponds to the region at very low feed concentration. As mentioned above, in this region
(low feed concentration) the Langmuir sorption sites contributed the most to the solubility of
these proteins as was demonstrated in Figure 3-12.
Therefore, the lower diffusion coefficients at low concentration are attributed to the
presence of slow-moving adsorbed proteins in this Langmuir sorption mode. A more detailed
analysis of this conclusion will be demonstrated below in the discussion of fitting experimental
data with the theoretical dual-mode model. On the other hand, the segment with positive slope
was used to estimate the diffusion coefficients. By fitting of the positive linear segments in
112
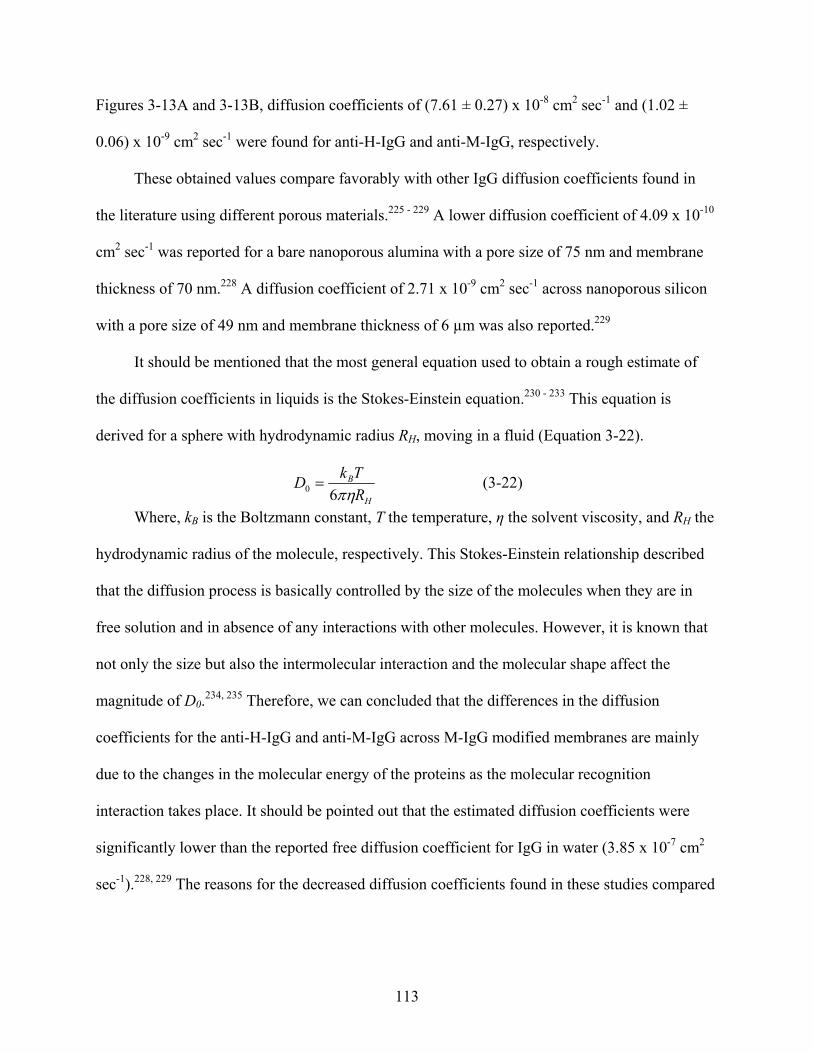
Figures 3-13A and 3-13B, diffusion coefficients of (7.61 ± 0.27) x 10-8 cm2 sec-1 and (1.02 ±
0.06) x 10-9 cm2 sec-1 were found for anti-H-IgG and anti-M-IgG, respectively.
These obtained values compare favorably with other IgG diffusion coefficients found in
the literature using different porous materials.225 - 229 A lower diffusion coefficient of 4.09 x 10⁻¹⁰
cm2 sec-1 was reported for a bare nanoporous alumina with a pore size of 75 nm and membrane
thickness of 70 nm.228 A diffusion coefficient of 2.71 x 10⁻⁹ cm2 sec-1 across nanoporous silicon
with a pore size of 49 nm and membrane thickness of 6 µm was also reported.229
It should be mentioned that the most general equation used to obtain a rough estimate of
the diffusion coefficients in liquids is the Stokes-Einstein equation.230 - 233 This equation is
derived for a sphere with hydrodynamic radius RH, moving in a fluid (Equation 3-22).
H
B
RTkD
πη60 = (3-22)
Where, kB is the Boltzmann constant, T the temperature, η the solvent viscosity, and RH the
hydrodynamic radius of the molecule, respectively. This Stokes-Einstein relationship described
that the diffusion process is basically controlled by the size of the molecules when they are in
free solution and in absence of any interactions with other molecules. However, it is known that
not only the size but also the intermolecular interaction and the molecular shape affect the
magnitude of D0.234, 235 Therefore, we can concluded that the differences in the diffusion
coefficients for the anti-H-IgG and anti-M-IgG across M-IgG modified membranes are mainly
due to the changes in the molecular energy of the proteins as the molecular recognition
interaction takes place. It should be pointed out that the estimated diffusion coefficients were
significantly lower than the reported free diffusion coefficient for IgG in water (3.85 x 10⁻⁷ cm2
sec-1).228, 229 The reasons for the decreased diffusion coefficients found in these studies compared
113
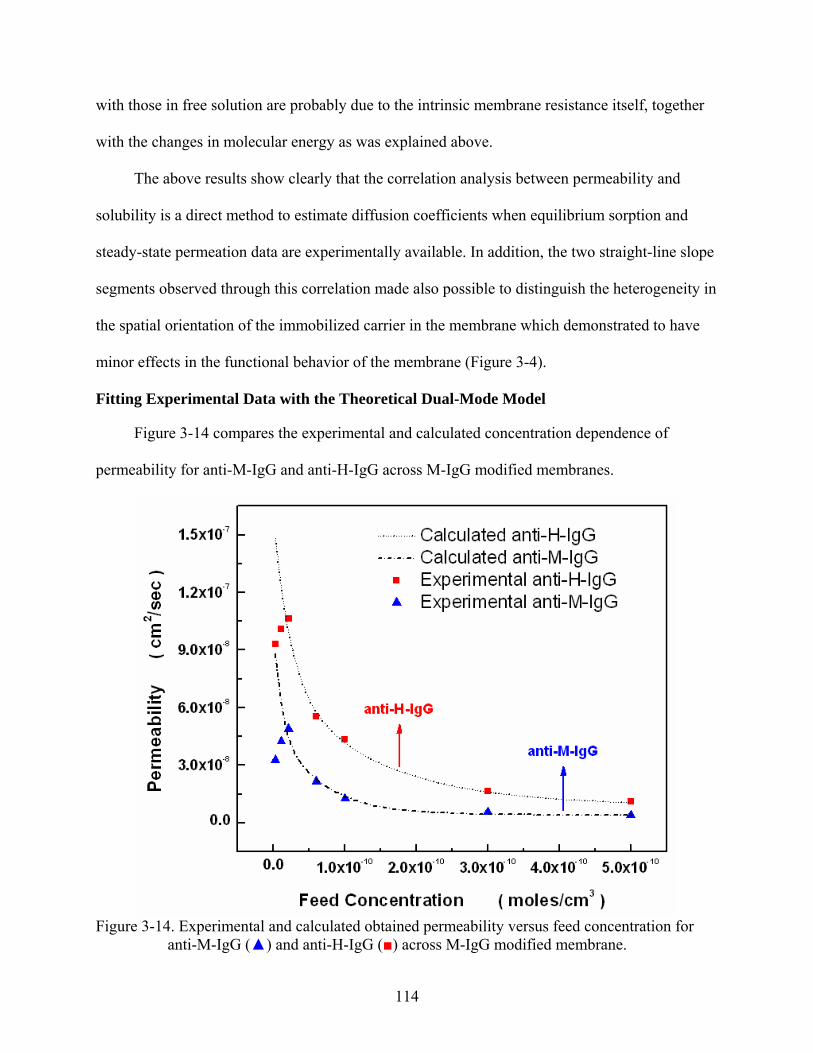
with those in free solution are probably due to the intrinsic membrane resistance itself, together
with the changes in molecular energy as was explained above.
The above results show clearly that the correlation analysis between permeability and
solubility is a direct method to estimate diffusion coefficients when equilibrium sorption and
steady-state permeation data are experimentally available. In addition, the two straight-line slope
segments observed through this correlation made also possible to distinguish the heterogeneity in
the spatial orientation of the immobilized carrier in the membrane which demonstrated to have
minor effects in the functional behavior of the membrane (Figure 3-4).
Fitting Experimental Data with the Theoretical Dual-Mode Model
Figure 3-14 compares the experimental and calculated concentration dependence of
permeability for anti-M-IgG and anti-H-IgG across M-IgG modified membranes.
Figure 3-14. Experimental and calculated obtained permeability versus feed concentration for
anti-M-IgG () and anti-H-IgG () across M-IgG modified membrane.
114
At first glance observing the plots in Figure 3-14, one can conclude that according to the
dual-mode model there is not total immobilization on the Langmuir-mode sites for these two
permeating proteins across M-IgG modified membranes. If total immobilization occurs in the
Langmuir-mode sites (F=0) as the dual-mode model explain, the permeability become
independent of the concentration. These studies demonstrated a high concentration dependence
on permeability both for anti-H-IgG and anti-M-IgG. These also demonstrated that the M-IgG
carriers in the membrane indeed enhance the permeability at low concentration for both of the
permeating proteins as shown in Figure 3-14.
It was found that the permeability enhancement for these two proteins was only up to a
certain threshold of the binding affinity and appeared to depend strongly on the concentration.
This enhancement in permeability at low concentration is caused by a contribution of the
diffusion due to the Langmuir mode species.204, 211
As a consequence of its lower binding affinity, the permeabilities for anti-H-IgG were
higher than those for anti-M-IgG. At the beginning we set a hypothesis that the differences in
permeation for anti-H-IgG and anti-M-IgG observed could be due to a sort of antifacilitated
transport. This was initially considered based on our previous works,9, 10 which showed that
higher fluxes were always observed for the molecule that binds stronger to the carrier in the
membrane. The mechanism for the facile kinetic conquered, in our previous works, was ascribed
by the sequential binding and unbinding events of the transported permeating species with the
carrier in the membrane. This behavior might be mathematically rationalized in a more detailed
manner by the model described here.
As indicated in Figure 3-14, the experimental and calculated data were in good agreement
at concentrations higher than 2.0 x 10⁻¹¹ moles per cm3. Nevertheless, at very low concentration
115
that agreement was missing. The explanation for this behavior was that the dual-mode model
assumes a constant diffusion coefficient, which in practice does not happen. Therefore, the
model is not able to discriminate a different regimen for the concentration dependence on the
diffusion coefficient as the case at low concentration observed here. As was said above, at low
concentration the adsorption of these two proteins in M-IgG modified membranes is dominated
basically for the binding sites with stronger binding affinity (Figure 3-12). Then, these
Langmuir-mode sites impart higher sorption rates for the permeating proteins, slowing down the
diffusion coefficients. Consequently this is also reflected in the permeability. Thus, at low
concentration the experimental permeabilities were lower than the calculated permeabilities. This
reduction in permeability is mostly due to a combined effect of both the lower diffusion
coefficients, and concentration-dependence of diffusion coefficients at this lower region in
concentration (Figure 3-14).
Additional evidence for this conclusion was also demonstrated by observing the
concentration dependence on the experimentally obtained diffusion coefficients in Figure 3-15.
As can be seen from Figure 3-15, lower diffusion coefficients were obtained at very low
concentration. Thus, these results demonstrate highly concentration-dependent diffusion
coefficients at low concentration as a result of the two types of binding sites present in the M-
IgG modified membranes (well-oriented and random).
Lower permeabilities were also observed for anti-H-IgG at the low concentration region
(Figure 3-14). This effect was explained taking into consideration the differences in diffusion
coefficients between anti-H-IgG and anti-M-IgG. Due to anti-H-IgG diffuses faster and thereby
reaches the binding sites inside the pores faster; the concentration of anti-H-IgG is initially
greater in the membrane than that of anti-M-IgG. Thus, anti-H-IgG initially at low concentration
116
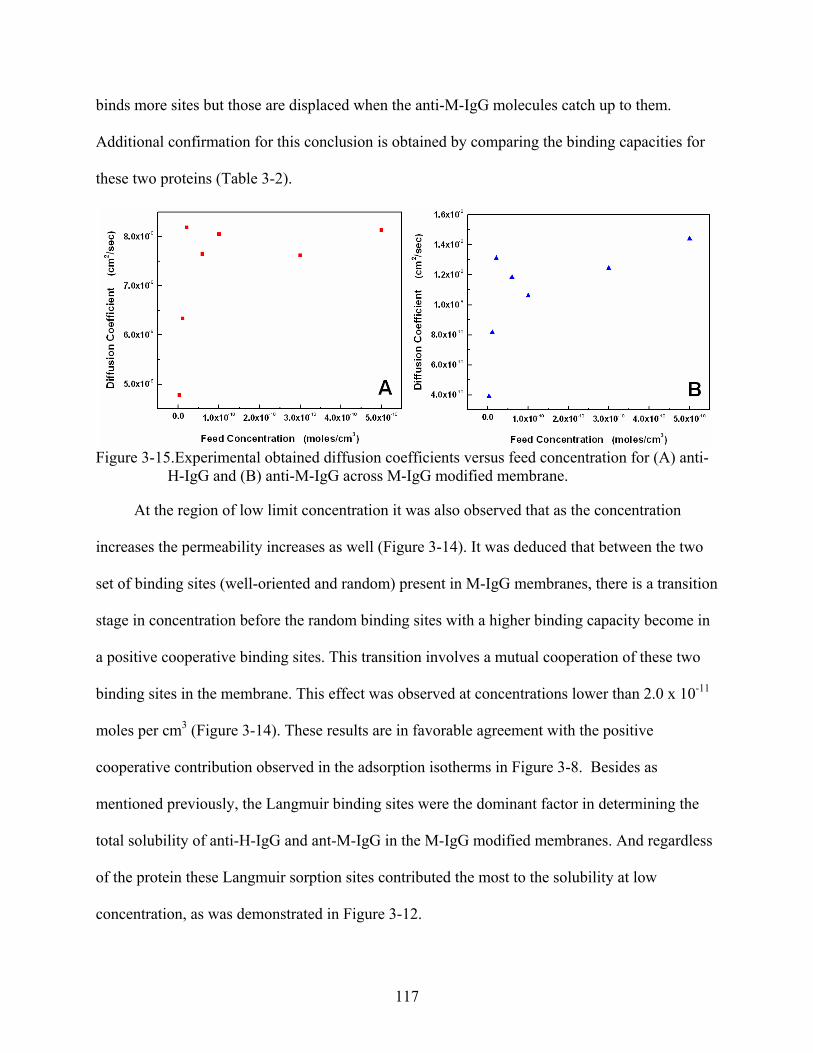
binds more sites but those are displaced when the anti-M-IgG molecules catch up to them.
Additional confirmation for this conclusion is obtained by comparing the binding capacities for
these two proteins (Table 3-2).
Figure 3-15.Experimental obtained diffusion coefficients versus feed concentration for (A) anti-
H-IgG and (B) anti-M-IgG across M-IgG modified membrane.
At the region of low limit concentration it was also observed that as the concentration
increases the permeability increases as well (Figure 3-14). It was deduced that between the two
set of binding sites (well-oriented and random) present in M-IgG membranes, there is a transition
stage in concentration before the random binding sites with a higher binding capacity become in
a positive cooperative binding sites. This transition involves a mutual cooperation of these two
binding sites in the membrane. This effect was observed at concentrations lower than 2.0 x 10⁻¹¹
moles per cm3 (Figure 3-14). These results are in favorable agreement with the positive
cooperative contribution observed in the adsorption isotherms in Figure 3-8. Besides as
mentioned previously, the Langmuir binding sites were the dominant factor in determining the
total solubility of anti-H-IgG and ant-M-IgG in the M-IgG modified membranes. And regardless
of the protein these Langmuir sorption sites contributed the most to the solubility at low
concentration, as was demonstrated in Figure 3-12.
117
The above results demonstrated an enhancement of permeability both for anti-H-IgG and
anti-M-IgG across M-IgG modified membranes. It was also confirmed that the extent of this
enhancement and the linear dynamic range for each system can be controlled by the strength of
the binding affinity between permeant-protein and the antibody-carrier immobilized in the
membrane. Thus, we have demonstrated that antibody-modified nanotube membranes can be
used for the transport of proteins at a rate determined by the affinity between carrier antibody
and transported protein. Hence, it demonstrated that it is possible to develop systems of
antibody-functionalized membranes with different dynamic range and controlled rate of
transport.
The result described herein clearly demonstrated a suitable principle for the concept of
controlled facilitated transport systems for proteins using antibody-modified nanotube
membranes. Of course, each system will require its own development of an appropriate affinity
for the carrier/protein complex, in order to reach the desired rate of diffusion. Since the useful
dynamic range of separation with these antibody-functionalized membranes depends on the
binding affinity, the gamma of affinity constants found with antibodies makes those as proper
elements for this principle.
Besides, with the current scientific development both in genetically engineered and cloned
binding proteins, the system proposed here may also be extended to other system by using
proteins different than antibodies as carriers. Additional research into redesigned proteins may
eventually permit the production of binding proteins against any desired analyte, just as
antibodies can be produced against any antigen.236 The concept of binding proteins genetically
fused as affinity tags to other proteins without the loss of their structural and functional
characteristics has been already demonstrated.237 It has been also demonstrated that a common
118
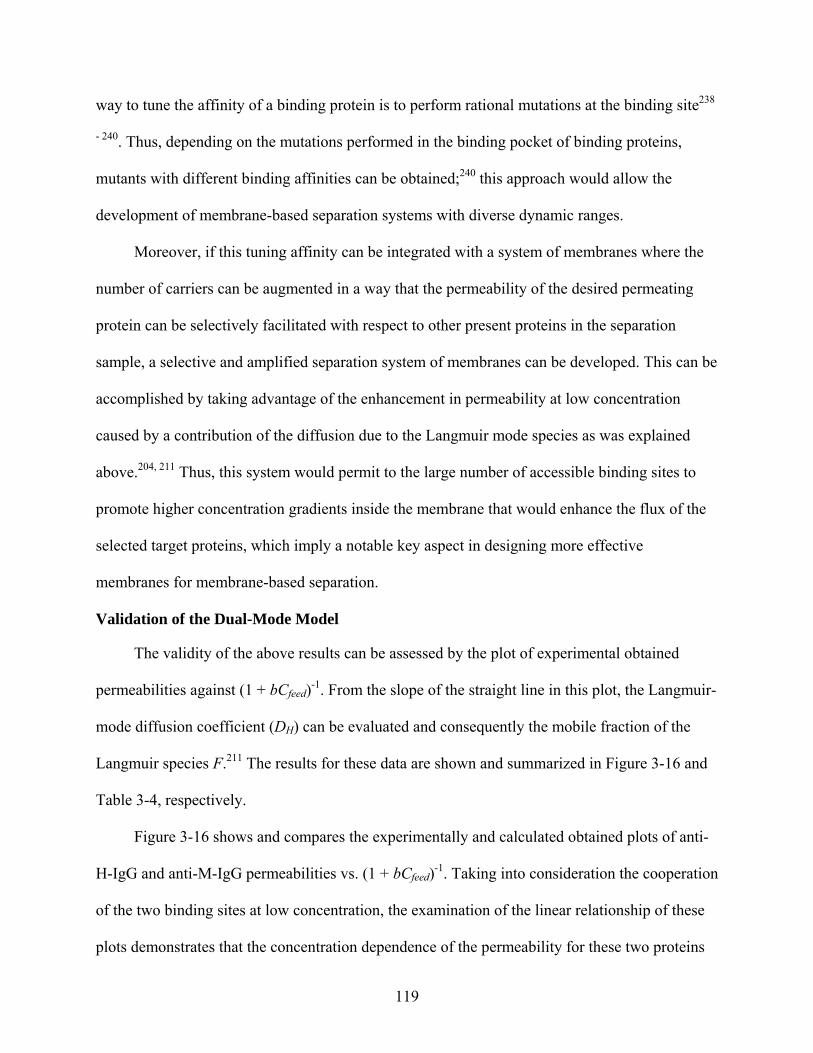
way to tune the affinity of a binding protein is to perform rational mutations at the binding site238
- 240. Thus, depending on the mutations performed in the binding pocket of binding proteins,
mutants with different binding affinities can be obtained;240 this approach would allow the
development of membrane-based separation systems with diverse dynamic ranges.
Moreover, if this tuning affinity can be integrated with a system of membranes where the
number of carriers can be augmented in a way that the permeability of the desired permeating
protein can be selectively facilitated with respect to other present proteins in the separation
sample, a selective and amplified separation system of membranes can be developed. This can be
accomplished by taking advantage of the enhancement in permeability at low concentration
caused by a contribution of the diffusion due to the Langmuir mode species as was explained
above.204, 211 Thus, this system would permit to the large number of accessible binding sites to
promote higher concentration gradients inside the membrane that would enhance the flux of the
selected target proteins, which imply a notable key aspect in designing more effective
membranes for membrane-based separation.
Validation of the Dual-Mode Model
The validity of the above results can be assessed by the plot of experimental obtained
permeabilities against (1 + bCfeed)-1. From the slope of the straight line in this plot, the Langmuir-
mode diffusion coefficient (DH) can be evaluated and consequently the mobile fraction of the
Langmuir species F.211 The results for these data are shown and summarized in Figure 3-16 and
Table 3-4, respectively.
Figure 3-16 shows and compares the experimentally and calculated obtained plots of anti-
H-IgG and anti-M-IgG permeabilities vs. (1 + bCfeed)-1. Taking into consideration the cooperation
of the two binding sites at low concentration, the examination of the linear relationship of these
plots demonstrates that the concentration dependence of the permeability for these two proteins
119
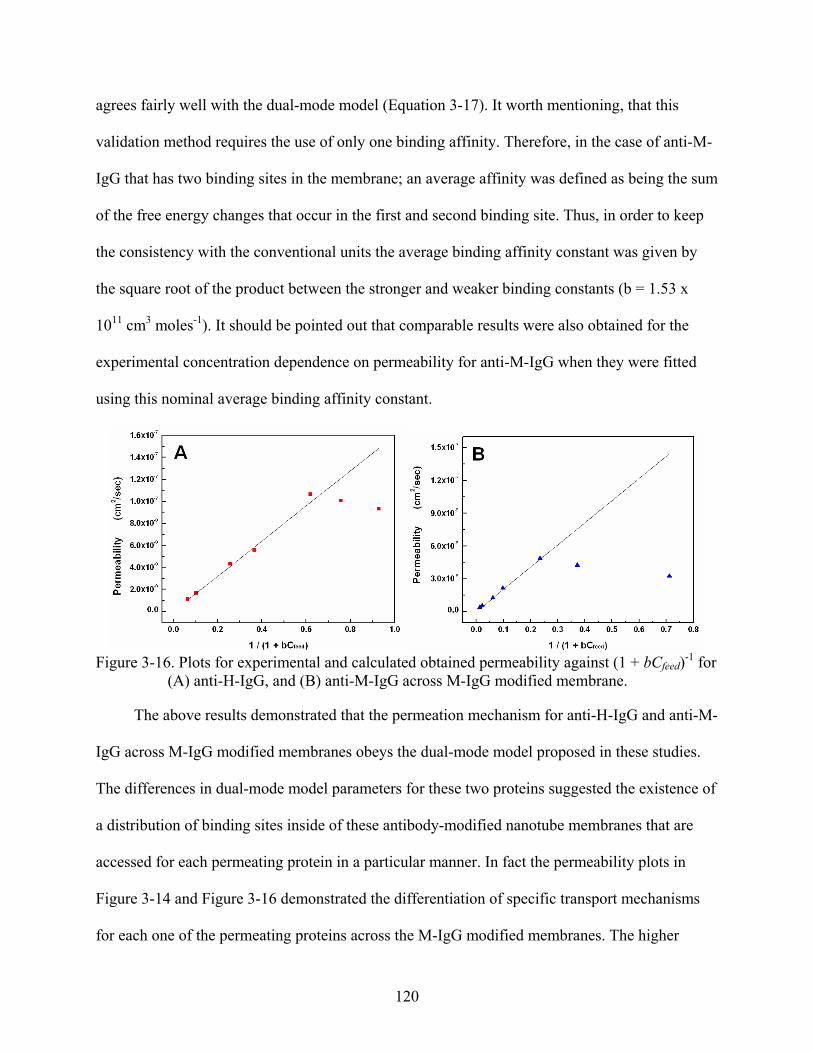
agrees fairly well with the dual-mode model (Equation 3-17). It worth mentioning, that this
validation method requires the use of only one binding affinity. Therefore, in the case of anti-M-
IgG that has two binding sites in the membrane; an average affinity was defined as being the sum
of the free energy changes that occur in the first and second binding site. Thus, in order to keep
the consistency with the conventional units the average binding affinity constant was given by
the square root of the product between the stronger and weaker binding constants (b = 1.53 x
1011 cm3 moles-1). It should be pointed out that comparable results were also obtained for the
experimental concentration dependence on permeability for anti-M-IgG when they were fitted
using this nominal average binding affinity constant.
Figure 3-16. Plots for experimental and calculated obtained permeability against (1 + bCfeed)-1 for
(A) anti-H-IgG, and (B) anti-M-IgG across M-IgG modified membrane.
The above results demonstrated that the permeation mechanism for anti-H-IgG and anti-M-
IgG across M-IgG modified membranes obeys the dual-mode model proposed in these studies.
The differences in dual-mode model parameters for these two proteins suggested the existence of
a distribution of binding sites inside of these antibody-modified nanotube membranes that are
accessed for each permeating protein in a particular manner. In fact the permeability plots in
Figure 3-14 and Figure 3-16 demonstrated the differentiation of specific transport mechanisms
for each one of the permeating proteins across the M-IgG modified membranes. The higher
120
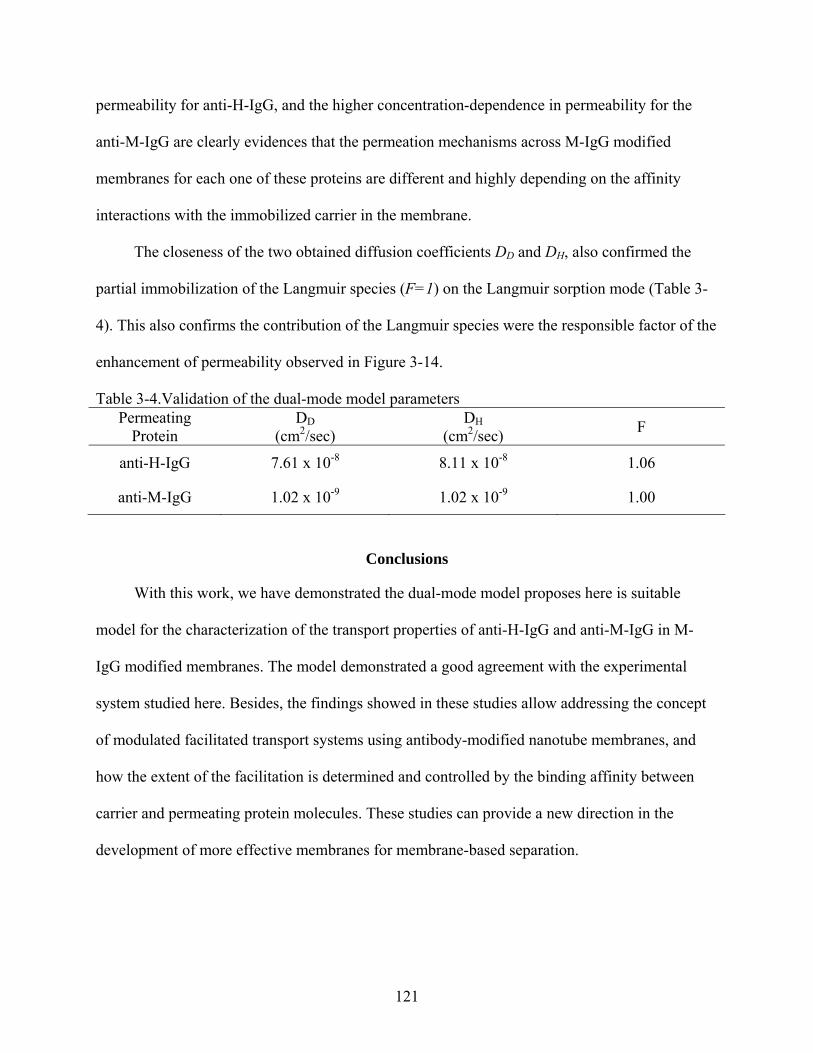
permeability for anti-H-IgG, and the higher concentration-dependence in permeability for the
anti-M-IgG are clearly evidences that the permeation mechanisms across M-IgG modified
membranes for each one of these proteins are different and highly depending on the affinity
interactions with the immobilized carrier in the membrane.
The closeness of the two obtained diffusion coefficients DD and DH, also confirmed the
partial immobilization of the Langmuir species (F=1) on the Langmuir sorption mode (Table 3-
4). This also confirms the contribution of the Langmuir species were the responsible factor of the
enhancement of permeability observed in Figure 3-14.
Table 3-4.Validation of the dual-mode model parameters Permeating
Protein DD
(cm2/sec) DH
(cm2/sec) F
anti-H-IgG 7.61 x 10⁻⁸ 8.11 x 10⁻⁸ 1.06
anti-M-IgG 1.02 x 10⁻⁹ 1.02 x 10⁻⁹ 1.00
Conclusions
With this work, we have demonstrated the dual-mode model proposes here is suitable
model for the characterization of the transport properties of anti-H-IgG and anti-M-IgG in M-
IgG modified membranes. The model demonstrated a good agreement with the experimental
system studied here. Besides, the findings showed in these studies allow addressing the concept
of modulated facilitated transport systems using antibody-modified nanotube membranes, and
how the extent of the facilitation is determined and controlled by the binding affinity between
carrier and permeating protein molecules. These studies can provide a new direction in the
development of more effective membranes for membrane-based separation.
121

CHAPTER 4
METAL ION AFFINITY NANOTUBE MEMBRANES: PREPARATION, CHARACTERIZATION, AND CONTROLLED TRANSPORT OF SIX-HISTIDINE-TAGGED
RECOMBINANT PROTEIN
Introduction
Since the introduction of Immobilized Metal Ion Affinity (IMAC) by Porath and
coworkers126 in 1975, IMAC has become in one of the most widely used methods for protein
purification.241 - 250 IMAC exploits the fact that many transition metal ions, such as, copper,
nickel, cobalt and zinc, can be coordinated to amino acid sites exposed on the surface of the
proteins. It has also been proposed that metal ions in IMAC can be classified into three groups:
hard, intermediate and soft.251, 252 This classification has been based on the preferred reactivity of
the metal ions toward their nucleophiles. Thus, metal ions such as Fe+3, Ca+2, and Al+3, which
show preference for oxygen belongs to the hard metal ion group. Those ions that prefer sulfur
(Cu+, Hg+2, Ag+, etc.) correspond to soft metal ions. Then, the Cu+2, Ni+2, Co+2, and Zn+2 ions,
which coordinate nitrogen, oxygen and sulfur, compose the intermediate ions. Given that the
number of cysteine residues on the surface of proteins is limited, makes the histidine residues the
main targets for intermediate metal ions. For example, a binding constant of 4.5 x 10³ M-1 has
been determined for an average protein with a single histidyl residue.253
Thus, multipoint histidyl interactions can be used to control the strength of binding of a
protein in IMAC applications. The advanced understanding of which aminoacid site chains on
the surface of proteins are responsible of the interaction with the metal ions, has been one of the
most important contributions for the development of tagged peptides containing multiple
histidine residues.254, 255 In particular, the hexahistidine tags attached to the 5’ or 3’ end of the
target gene that encodes the protein are usually used as purification tags in recombinant
proteins.256, 257
122
Today, recombinant protein purification represents one of the principal protein purification
markets, and many systems have been developed in recent years for the purification of these
proteins.241 – 250, 257 The system proposed here, exploits the advantages of IMAC separations, but
in a nanopore-membrane- platform. The use of imidazole-modified silica nanotube membranes
for the controlled transport of histidine-tagged recombinant proteins is described.
Imidazole is a functional aromatic nitrogen heterocycle important in ligand coordination
chemistry. The structure of imidazole is a five-membered ring with two different nitrogen atoms.
One of the nitrogen is bound to hydrogen, having two lone pair of electrons in an unhybridized
p-orbital donated to the aromatic ring, and it is structurally related with the pyrrole nitrogen. The
second nitrogen structurally related with the pyridine nitrogen, donates its single electron in an
unhybridized p-orbital to the ring, containing also a free lone pair of electrons in a hybrid
orbital.258 In aqueous solution imidazole behaves like a weak organic base with pKa = 6.99.259
Therefore, the lone pair of electrons in the pyridine-like nitrogen atom, are only involved in
coordination when the pH of aqueous solutions is close or higher than 6.99. It is worth
mentioning, that the mode of coordination of imidazole can be also influenced by the nature of
the metal.
In this investigation, the silica nanotube membrane was prepared by sol-gel template
synthesis of silica nanotubes within the pores of a nanopore alumina template. Imidazole was
attached to the inside walls of chloropropyl-modified silica nanotubes by nucleophilic
substitution reaction with 2-mercaptoimidazole in anhydrous tetrahydrofuran. The modified
membrane was then exposed to solutions of the desired divalent metal ion (copper, nickel, cobalt
or zinc) to attach the metal via coordination with the imidazole. The histidine-tag on the
123
recombinant protein reversibly coordinates with the metal ion sites, and via this chemistry the
flux of the protein across the membrane could be modulated.
In these studies the concept of IMAC separations was exploited in a nanopore-membrane-
platform. The transport of histidine-tagged recombinant proteins in metal ion affinity nanotube
membranes is described. It was demonstrated that transport of histidine-tagged recombinant
proteins across imidazole-modified silica nanotube membranes can be controlled by the nature of
the immobilized metal ions on the imidazole surface. The imidazole functionalized membrane
was extensively characterized using three different analytical techniques in order to identify how
the coordination chemistry with different divalent metal ions affects the functional behavior and
transport properties during the permeation of six-histidine recombinant proteins. Furthermore,
additional results shown that by the appropriate choice of the transition metal ion for
coordination with the imidazole ligand, the binding strength and optical properties within the
functional membrane can also be modified. These studies demonstrated an alternative way of
immobilized metal ion affinity by using nanotube membranes.
Experimental
Materials
Commercially available nanopore alumina membranes (60 µm thick, nominal pore
diameter 100 nm) were obtained from Whatman. Tetraethyl orthosilicate 99.999% (TEOS)
(Sigma Aldrich) was used to deposit the silica nanotubes within the pores of these membranes.
A 3-chloropropyltrimethoxysilane (United Chemical Technologies) was used for silane
modification of the silica nanotubes. 2-mercaptoimidazole from Sigma Aldrich was used as
attacking nucleophile to substitute the chlorine atoms in the 3-chloropropyl silica nanotube
functionalized membrane. As an aprotic solvent anhydrous tetrahydrofuran >99.9%, inhibitor
free from Sigma Aldrich was used. Divalent salts of copper, nickel, cobalt and zinc nitrate
124
obtained from Fulka, were used to attach the metal via coordination with the imidazole. A six-
histidine-tagged ubiquitin human recombinant protein (6His-UHRP) obtained from Sigma
Aldrich was used to investigate the transport properties of the imidazole-modified membranes.
All other chemicals were of reagent grade and used as received. Purified water, obtained by
passing house-distilled water through a Barnstead, E-pure water-purification system, was used to
prepare all solutions.
Preparation of the Silica Nanotube Membranes
Silica nanotubes were deposited in the pores of the alumina membrane using the sol-gel-
based template-synthesis method described previously. Briefly, a sol-gel precursor solution was
prepared by mixing absolute ethanol, TEOS and 1 M HCl (50:5:1 by volume), and this solution
was allowed to hydrolyze for 30 minutes. The alumina membranes were then immersed into this
solution for two minutes under sonication. The membranes were then removed and the surfaces
swabbed with ethanol to remove precursor from the alumina surface. The membranes were then
air dry for ten minutes at room temperature and cured in an oven for 12 hours at 150 ºC. This
yields silica nanotubes, with wall thickness of ~3 nm, embedded within the pores of the alumina
membrane.9
Preparation of Imidazole Functionalized Membranes
The 3-chloropropyltrimethoxysilane was first attached to the inside walls of the silica
nanotubes. A solution that was 2% (v/v) in 3-chloropropyltrimethoxysilane was prepared in
ethanol; to this solution was added acetate buffer (50 mM, pH=5.1) to make the solution 5%
(v/v) in this buffer. This ethanol-based solution was stirred for 20 minutes and the alumina
membranes were then immersed. The soak membranes were sonicated for 2 minutes, and after
20 minutes the membranes were removed from the solution and rinsed with ethanol. To make
sure that the loose silane was removed from the surface, the membranes were also sonicated for
125
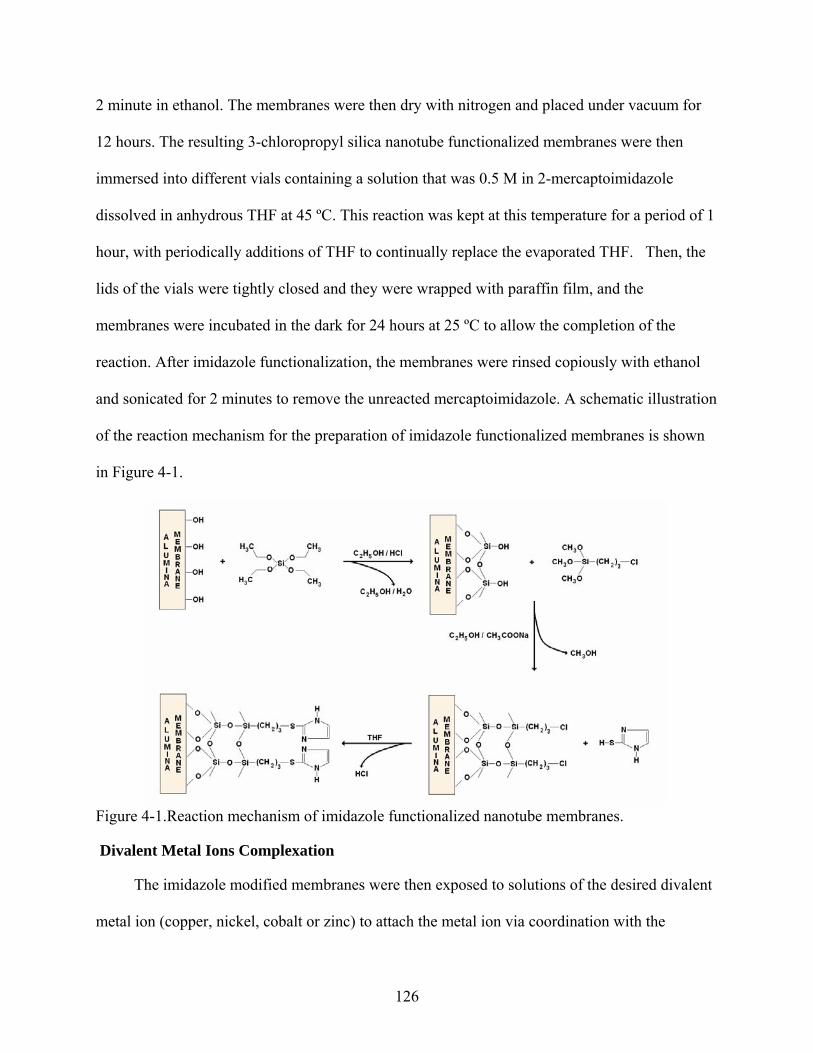
2 minute in ethanol. The membranes were then dry with nitrogen and placed under vacuum for
12 hours. The resulting 3-chloropropyl silica nanotube functionalized membranes were then
immersed into different vials containing a solution that was 0.5 M in 2-mercaptoimidazole
dissolved in anhydrous THF at 45 ºC. This reaction was kept at this temperature for a period of 1
hour, with periodically additions of THF to continually replace the evaporated THF. Then, the
lids of the vials were tightly closed and they were wrapped with paraffin film, and the
membranes were incubated in the dark for 24 hours at 25 ºC to allow the completion of the
reaction. After imidazole functionalization, the membranes were rinsed copiously with ethanol
and sonicated for 2 minutes to remove the unreacted mercaptoimidazole. A schematic illustration
of the reaction mechanism for the preparation of imidazole functionalized membranes is shown
in Figure 4-1.
Figure 4-1.Reaction mechanism of imidazole functionalized nanotube membranes.
Divalent Metal Ions Complexation
The imidazole modified membranes were then exposed to solutions of the desired divalent
metal ion (copper, nickel, cobalt or zinc) to attach the metal ion via coordination with the
126
imidazole. Briefly, the imidazole functionalized membranes were immersed in different vials
containing solutions prepared in ethanol that were 1 mM in Cu+2, Ni+2, Co+2, and Zn+2,
respectively. The vials were placed in an orbital shaker platform and the membranes were
equilibrated for 12 hours at 25 ºC to affirm the complexation of the metal ions on the membrane.
After equilibration the membranes were removed and rinsed copiously with ethanol.
Instrumental Characterization of the Imidazole Functionalized Membranes
To characterize the imidazole functionalized nanotube membranes fluorescence
microscopy, Fourier transformed infrared – attenuated total reflectance spectroscopy (FTIR-
ATR), and X-ray photoelectron spectroscopy (XPS) measurement were taken.
We discovered that the imidazole membranes are fluorescent after functionalization.
Therefore, the observation of these imidazole functionalized membranes under the fluorescence
microscope was used as the first control to confirm the success of the chemistry modification.
The fluorescence intensity was measured using a fluorescence microscope which was equipped
with both a fluorescence detector and CCD camera. This system combines an Axioplan 2
imaging microscope (Zeiss) with a J&M-PMT photometry system detector (SpectrAlliance), for
measuring the fluorescence intensity using a BP450-490 filter for excitation and a LP515 filter
for emission of light.
The FTIR-ATR was employed to examine the presence of characteristic bands for 2-
mercaptoimidazole in the functionalized membranes. The FTIR-ATR spectra were recorded on
a Thermo Nicolet Nexus 670 FTIR spectrometer equipped with a GATRTM as the ATR crystal.
All spectra were run at 4000cm-1 to 400cm-1, 512 scans, 4 cm-1 resolution, and gain equal to 1.
The spectrometer aperture was set to 100 for all runs. A background spectrum (air) was taken
prior to each sample spectrum, which was used for background subtraction using the OMNIC
ATR software for the ATR correction.
127
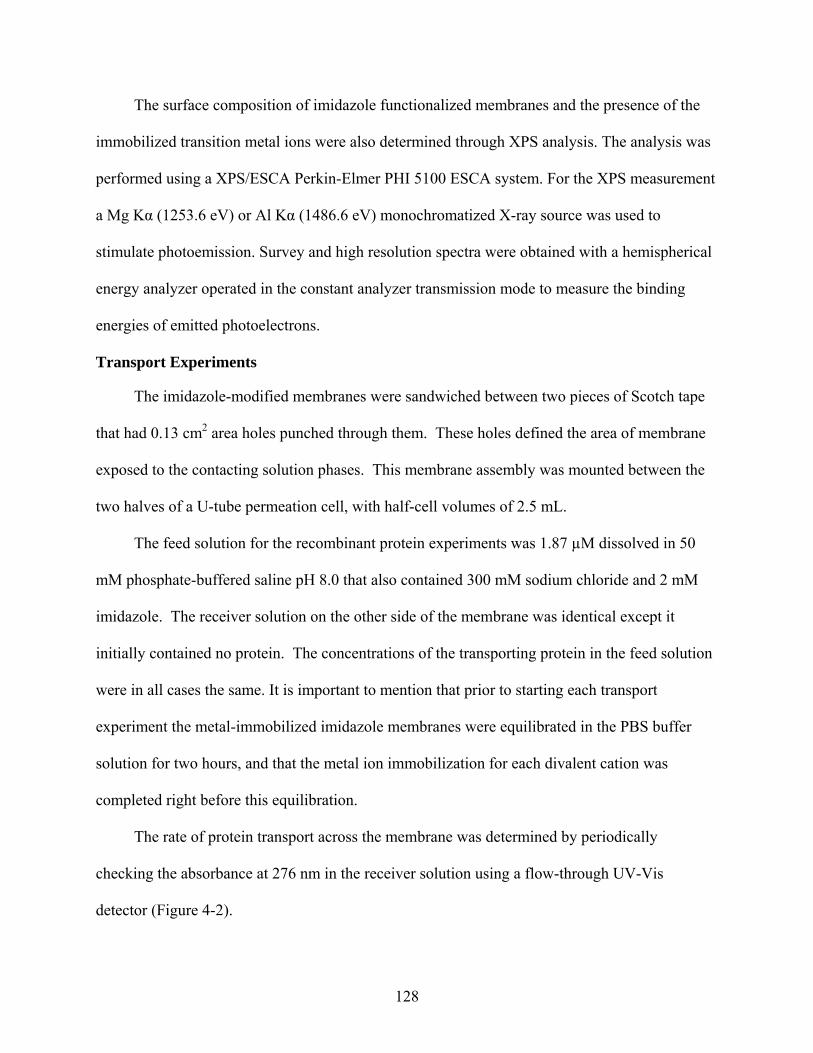
The surface composition of imidazole functionalized membranes and the presence of the
immobilized transition metal ions were also determined through XPS analysis. The analysis was
performed using a XPS/ESCA Perkin-Elmer PHI 5100 ESCA system. For the XPS measurement
a Mg Kα (1253.6 eV) or Al Kα (1486.6 eV) monochromatized X-ray source was used to
stimulate photoemission. Survey and high resolution spectra were obtained with a hemispherical
energy analyzer operated in the constant analyzer transmission mode to measure the binding
energies of emitted photoelectrons.
Transport Experiments
The imidazole-modified membranes were sandwiched between two pieces of Scotch tape
that had 0.13 cm2 area holes punched through them. These holes defined the area of membrane
exposed to the contacting solution phases. This membrane assembly was mounted between the
two halves of a U-tube permeation cell, with half-cell volumes of 2.5 mL.
The feed solution for the recombinant protein experiments was 1.87 µM dissolved in 50
mM phosphate-buffered saline pH 8.0 that also contained 300 mM sodium chloride and 2 mM
imidazole. The receiver solution on the other side of the membrane was identical except it
initially contained no protein. The concentrations of the transporting protein in the feed solution
were in all cases the same. It is important to mention that prior to starting each transport
experiment the metal-immobilized imidazole membranes were equilibrated in the PBS buffer
solution for two hours, and that the metal ion immobilization for each divalent cation was
completed right before this equilibration.
The rate of protein transport across the membrane was determined by periodically
checking the absorbance at 276 nm in the receiver solution using a flow-through UV-Vis
detector (Figure 4-2).
128
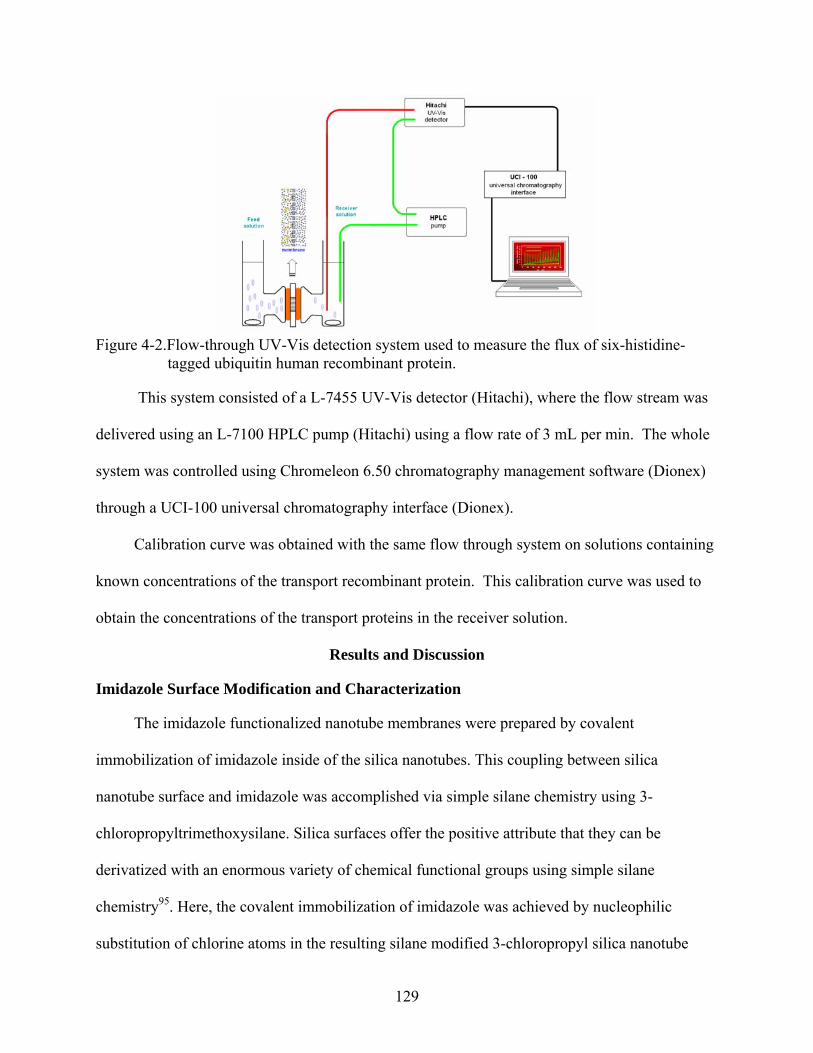
Figure 4-2.Flow-through UV-Vis detection system used to measure the flux of six-histidine-
tagged ubiquitin human recombinant protein.
This system consisted of a L-7455 UV-Vis detector (Hitachi), where the flow stream was
delivered using an L-7100 HPLC pump (Hitachi) using a flow rate of 3 mL per min. The whole
system was controlled using Chromeleon 6.50 chromatography management software (Dionex)
through a UCI-100 universal chromatography interface (Dionex).
Calibration curve was obtained with the same flow through system on solutions containing
known concentrations of the transport recombinant protein. This calibration curve was used to
obtain the concentrations of the transport proteins in the receiver solution.
Results and Discussion
Imidazole Surface Modification and Characterization
The imidazole functionalized nanotube membranes were prepared by covalent
immobilization of imidazole inside of the silica nanotubes. This coupling between silica
nanotube surface and imidazole was accomplished via simple silane chemistry using 3-
chloropropyltrimethoxysilane. Silica surfaces offer the positive attribute that they can be
derivatized with an enormous variety of chemical functional groups using simple silane
chemistry95. Here, the covalent immobilization of imidazole was achieved by nucleophilic
substitution of chlorine atoms in the resulting silane modified 3-chloropropyl silica nanotube
129
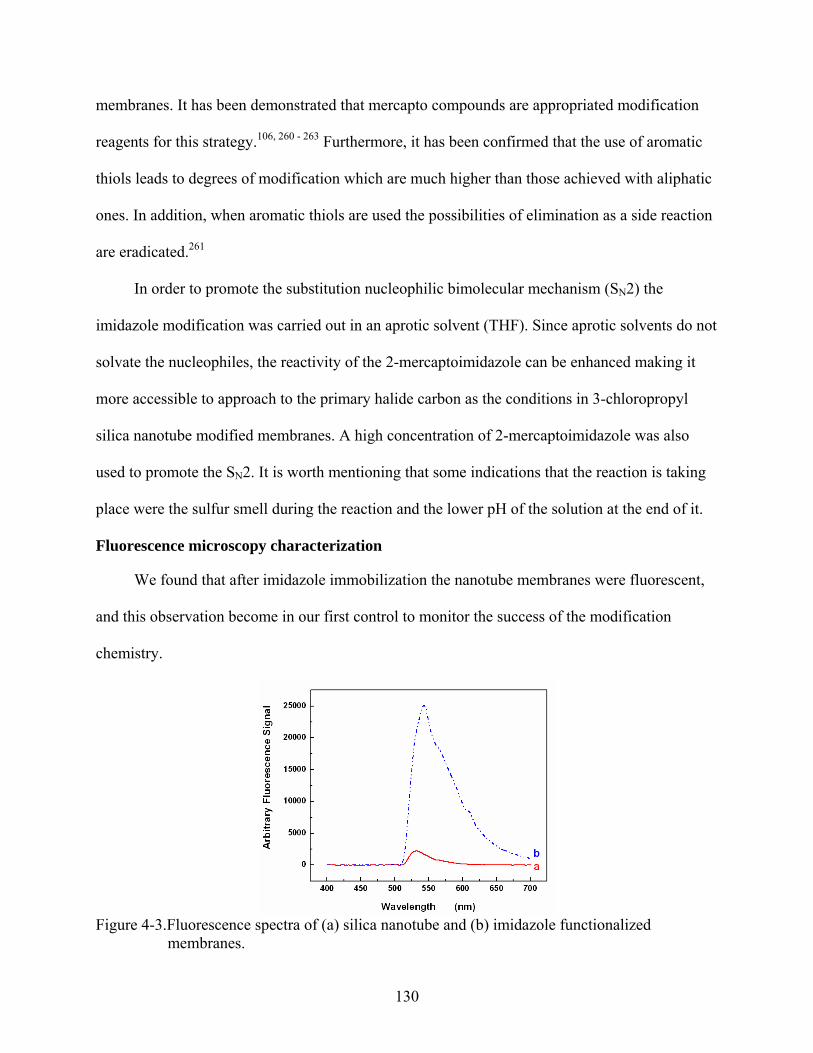
membranes. It has been demonstrated that mercapto compounds are appropriated modification
reagents for this strategy.106, 260 - 263 Furthermore, it has been confirmed that the use of aromatic
thiols leads to degrees of modification which are much higher than those achieved with aliphatic
ones. In addition, when aromatic thiols are used the possibilities of elimination as a side reaction
are eradicated.261
In order to promote the substitution nucleophilic bimolecular mechanism (SN2) the
imidazole modification was carried out in an aprotic solvent (THF). Since aprotic solvents do not
solvate the nucleophiles, the reactivity of the 2-mercaptoimidazole can be enhanced making it
more accessible to approach to the primary halide carbon as the conditions in 3-chloropropyl
silica nanotube modified membranes. A high concentration of 2-mercaptoimidazole was also
used to promote the SN2. It is worth mentioning that some indications that the reaction is taking
place were the sulfur smell during the reaction and the lower pH of the solution at the end of it.
Fluorescence microscopy characterization
We found that after imidazole immobilization the nanotube membranes were fluorescent,
and this observation become in our first control to monitor the success of the modification
chemistry.
Figure 4-3.Fluorescence spectra of (a) silica nanotube and (b) imidazole functionalized
membranes.
130
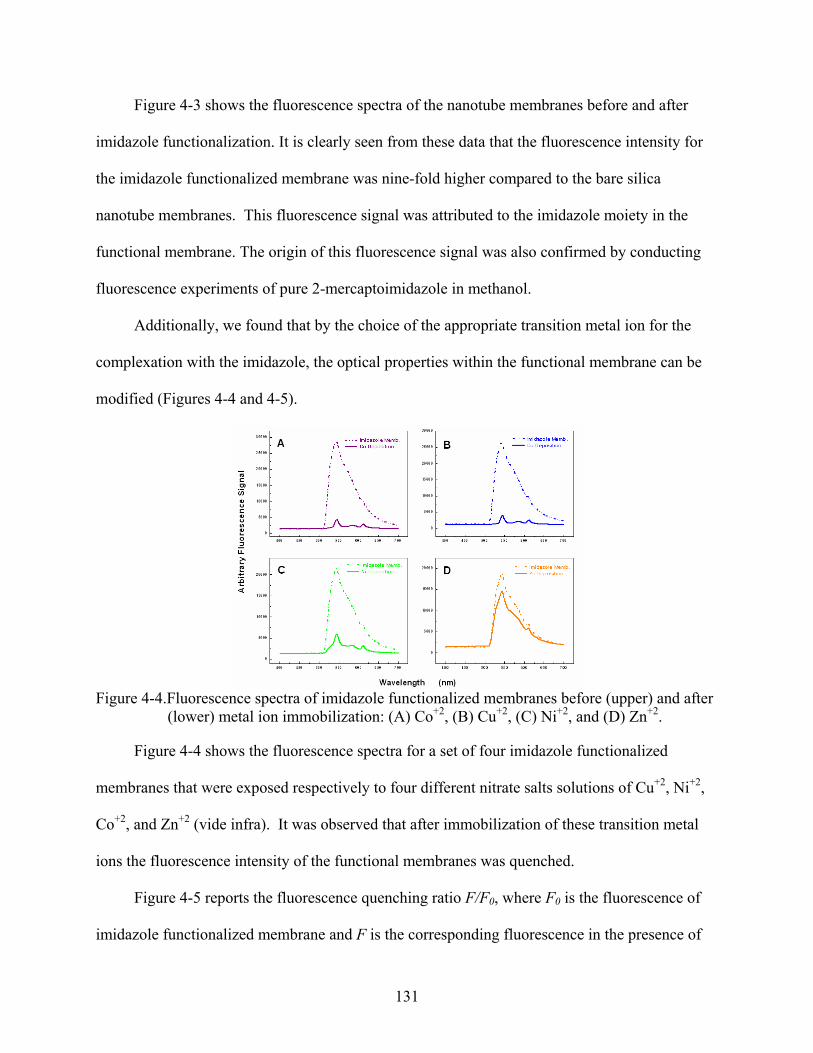
Figure 4-3 shows the fluorescence spectra of the nanotube membranes before and after
imidazole functionalization. It is clearly seen from these data that the fluorescence intensity for
the imidazole functionalized membrane was nine-fold higher compared to the bare silica
nanotube membranes. This fluorescence signal was attributed to the imidazole moiety in the
functional membrane. The origin of this fluorescence signal was also confirmed by conducting
fluorescence experiments of pure 2-mercaptoimidazole in methanol.
Additionally, we found that by the choice of the appropriate transition metal ion for the
complexation with the imidazole, the optical properties within the functional membrane can be
modified (Figures 4-4 and 4-5).
Figure 4-4.Fluorescence spectra of imidazole functionalized membranes before (upper) and after
(lower) metal ion immobilization: (A) Co+2, (B) Cu+2, (C) Ni+2, and (D) Zn+2.
Figure 4-4 shows the fluorescence spectra for a set of four imidazole functionalized
membranes that were exposed respectively to four different nitrate salts solutions of Cu+2, Ni+2,
Co+2, and Zn+2 (vide infra). It was observed that after immobilization of these transition metal
ions the fluorescence intensity of the functional membranes was quenched.
Figure 4-5 reports the fluorescence quenching ratio F/F0, where F0 is the fluorescence of
imidazole functionalized membrane and F is the corresponding fluorescence in the presence of
131

the metal ions. It is evident that fluorescence quenching was much higher for Cu+2 and Co+2 ions,
while it was weaker in the case of Ni+2 and very low for Zn+2.
Figure 4-5.Fluorescence quenching (F/F0) for imidazole functionalized membranes in the
presence of nitrate solutions prepared in ethanol that were 1 mM of the respective divalent metal ion.
Fluorescence quenching by transition metal ions is a common phenomenon.264 The
fluorescence quenching by transition-metal ions and their coordination complexes is a process
which has been known for a long time and is still the subject of intense investigations.265 - 267 It is
now well recognized that electron transfer and electronic energy transfer are considered as the
two main deactivation pathways responsible for efficient fluorescence inhibition.264 - 267
These metallosystems based on fluorescence detection have found applications in many
areas such as metal ion sensing,268, 269 artificial photosynthesis,270 and optical sensing of DNA.271
- 273
On the other hand, when the imidazole functionalized membrane was exposed to solutions
of CuCl2 instead of Cu(NO3)2, the optical behavior for this metal ion immobilized membrane
was different than in the case of nitrate salts. Under this condition, a fluorescence enhancement
instead of quenching was observed in the presence of the metal ion (Figure 4-6).
132
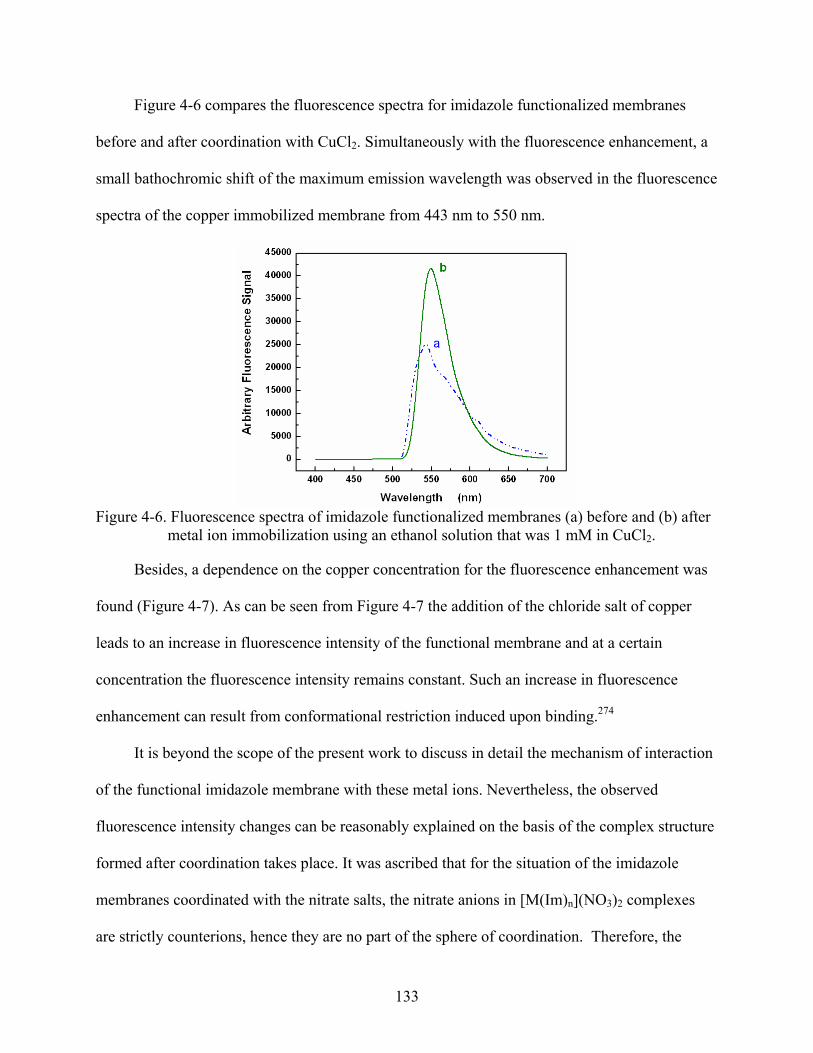
Figure 4-6 compares the fluorescence spectra for imidazole functionalized membranes
before and after coordination with CuCl2. Simultaneously with the fluorescence enhancement, a
small bathochromic shift of the maximum emission wavelength was observed in the fluorescence
spectra of the copper immobilized membrane from 443 nm to 550 nm.
Figure 4-6. Fluorescence spectra of imidazole functionalized membranes (a) before and (b) after
metal ion immobilization using an ethanol solution that was 1 mM in CuCl2.
Besides, a dependence on the copper concentration for the fluorescence enhancement was
found (Figure 4-7). As can be seen from Figure 4-7 the addition of the chloride salt of copper
leads to an increase in fluorescence intensity of the functional membrane and at a certain
concentration the fluorescence intensity remains constant. Such an increase in fluorescence
enhancement can result from conformational restriction induced upon binding.274
It is beyond the scope of the present work to discuss in detail the mechanism of interaction
of the functional imidazole membrane with these metal ions. Nevertheless, the observed
fluorescence intensity changes can be reasonably explained on the basis of the complex structure
formed after coordination takes place. It was ascribed that for the situation of the imidazole
membranes coordinated with the nitrate salts, the nitrate anions in [M(Im)n](NO3)2 complexes
are strictly counterions, hence they are no part of the sphere of coordination. Therefore, the
133
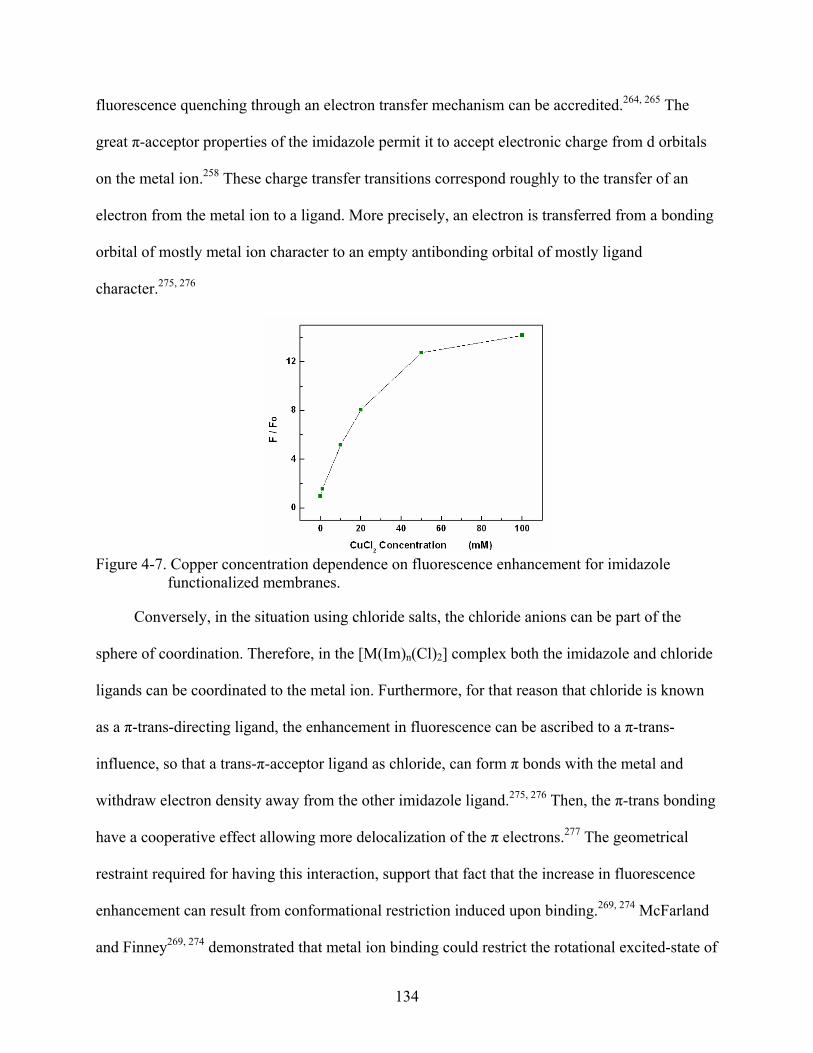
fluorescence quenching through an electron transfer mechanism can be accredited.264, 265 The
great π-acceptor properties of the imidazole permit it to accept electronic charge from d orbitals
on the metal ion.258 These charge transfer transitions correspond roughly to the transfer of an
electron from the metal ion to a ligand. More precisely, an electron is transferred from a bonding
orbital of mostly metal ion character to an empty antibonding orbital of mostly ligand
character.275, 276
Figure 4-7. Copper concentration dependence on fluorescence enhancement for imidazole
functionalized membranes.
Conversely, in the situation using chloride salts, the chloride anions can be part of the
sphere of coordination. Therefore, in the [M(Im)n(Cl)2] complex both the imidazole and chloride
ligands can be coordinated to the metal ion. Furthermore, for that reason that chloride is known
as a π-trans-directing ligand, the enhancement in fluorescence can be ascribed to a π-trans-
influence, so that a trans-π-acceptor ligand as chloride, can form π bonds with the metal and
withdraw electron density away from the other imidazole ligand.275, 276 Then, the π-trans bonding
have a cooperative effect allowing more delocalization of the π electrons.277 The geometrical
restraint required for having this interaction, support that fact that the increase in fluorescence
enhancement can result from conformational restriction induced upon binding.269, 274 McFarland
and Finney269, 274 demonstrated that metal ion binding could restrict the rotational excited-state of
134
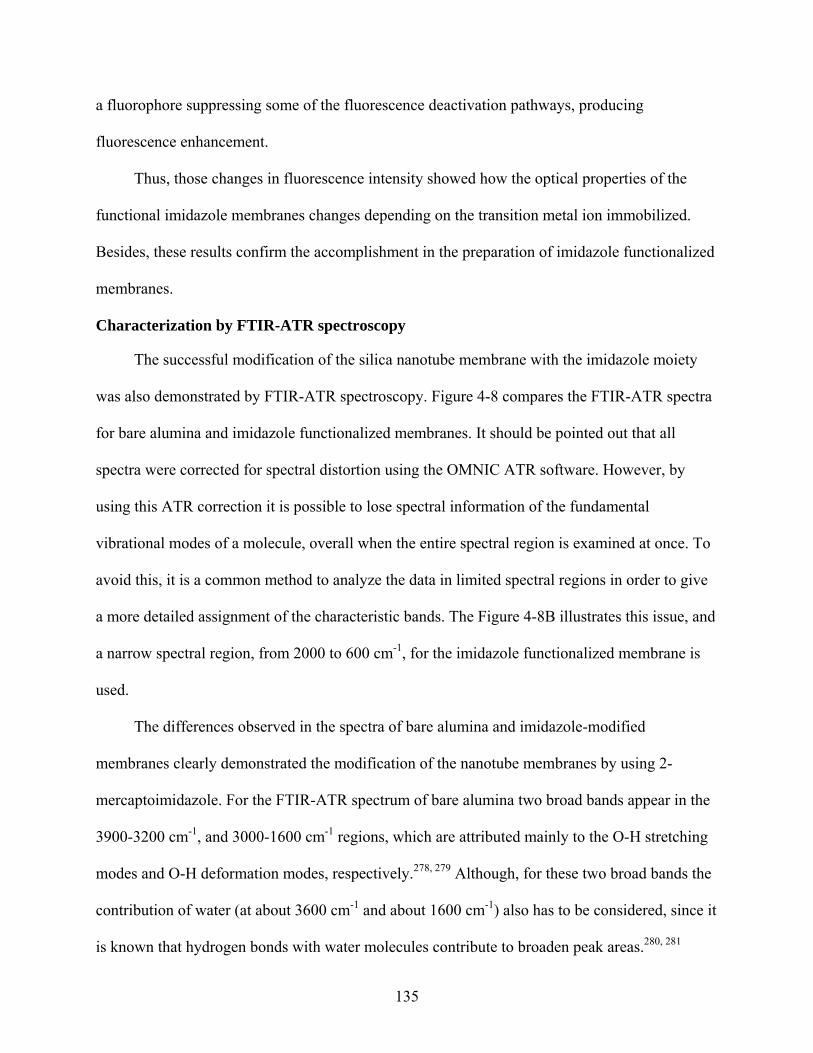
a fluorophore suppressing some of the fluorescence deactivation pathways, producing
fluorescence enhancement.
Thus, those changes in fluorescence intensity showed how the optical properties of the
functi
ed
tion by FTIR-ATR spectroscopy
ube membrane with the imidazole moiety
was a a
nce. To
he differences observed in the spectra of bare alumina and imidazole-modified
memb 2-
n the
is known that hydrogen bonds with water molecules contribute to broaden peak areas.280, 281
onal imidazole membranes changes depending on the transition metal ion immobilized.
Besides, these results confirm the accomplishment in the preparation of imidazole functionaliz
membranes.
Characteriza
The successful modification of the silica nanot
lso demonstrated by FTIR-ATR spectroscopy. Figure 4-8 compares the FTIR-ATR spectr
for bare alumina and imidazole functionalized membranes. It should be pointed out that all
spectra were corrected for spectral distortion using the OMNIC ATR software. However, by
using this ATR correction it is possible to lose spectral information of the fundamental
vibrational modes of a molecule, overall when the entire spectral region is examined at o
avoid this, it is a common method to analyze the data in limited spectral regions in order to give
a more detailed assignment of the characteristic bands. The Figure 4-8B illustrates this issue, and
a narrow spectral region, from 2000 to 600 cm-1, for the imidazole functionalized membrane is
used.
T
ranes clearly demonstrated the modification of the nanotube membranes by using
mercaptoimidazole. For the FTIR-ATR spectrum of bare alumina two broad bands appear i
3900-3200 cm-1, and 3000-1600 cm-1 regions, which are attributed mainly to the O-H stretching
modes and O-H deformation modes, respectively.278, 279 Although, for these two broad bands the
contribution of water (at about 3600 cm-1 and about 1600 cm-1) also has to be considered, since it
135
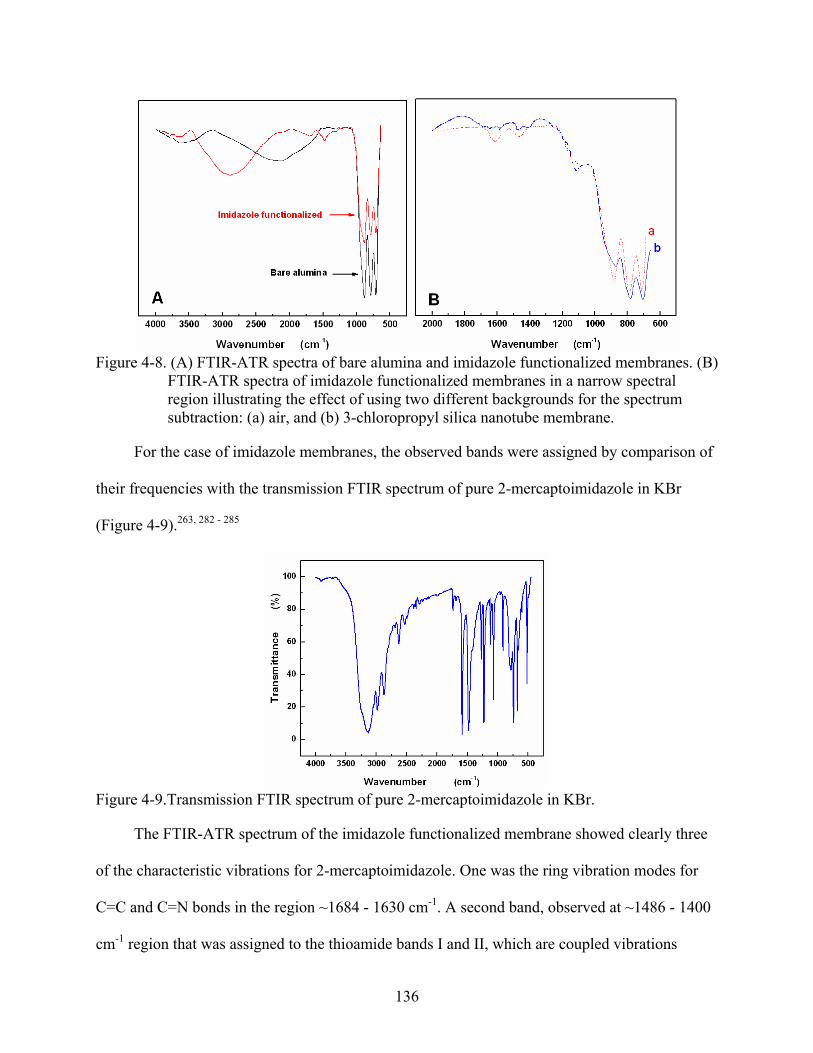
Figure 4-8. (A) FTIR-ATR spectra of bare alumina and imidazole functionalized membranes. (B)
FTIR-ATR spectra of imidazole functionalized membranes in a narrow spectral region illustrating the effect of using two different backgrounds for the spectrum subtraction: (a) air, and (b) 3-chloropropyl silica nanotube membrane.
For t n of
their frequ e in KBr
(Figu
Figure 4-9.Transm
The FTIR-ATR spectru rane showed clearly three
tion modes for
C=C
he case of imidazole membranes, the observed bands were assigned by compariso
encies with the transmission FTIR spectrum of pure 2-mercaptoimidazol
re 4-9).263, 282 - 285
ission FTIR spectrum of pure 2-mercaptoimidazole in KBr.
m of the imidazole functionalized memb
of the characteristic vibrations for 2-mercaptoimidazole. One was the ring vibra
and C=N bonds in the region ~1684 - 1630 cm-1. A second band, observed at ~1486 - 1400
cm-1 region that was assigned to the thioamide bands I and II, which are coupled vibrations
136
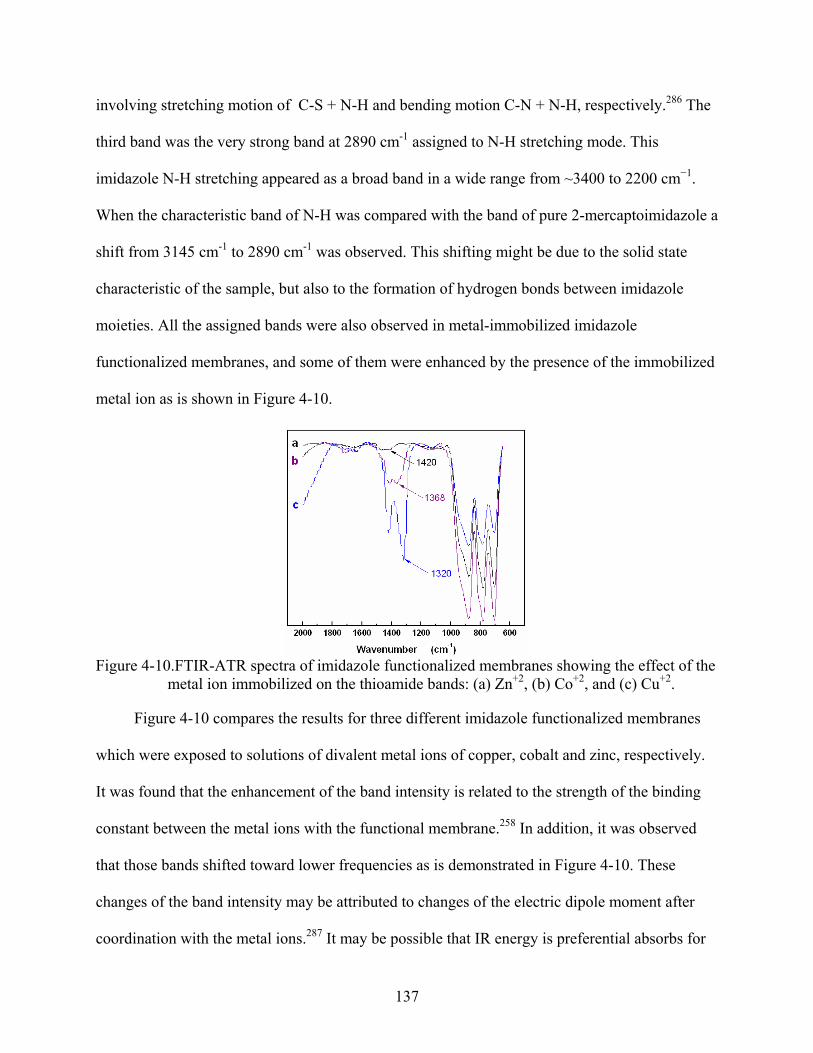
involving stretching motion of C-S + N-H and bending motion C-N + N-H, respectively.286 The
third band was the very strong band at 2890 cm-1 assigned to N-H stretching mode. This
imidazole N-H stretching appeared as a broad band in a wide range from ~3400 to 2200 cm−1.
When the characteristic band of N-H was compared with the band of pure 2-mercaptoimi
shift from 3145 cm
dazole a
zed
-1 to 2890 cm-1 was observed. This shifting might be due to the solid state
characteristic of the sample, but also to the formation of hydrogen bonds between imidazole
moieties. All the assigned bands were also observed in metal-immobilized imidazole
functionalized membranes, and some of them were enhanced by the presence of the immobili
metal ion as is shown in Figure 4-10.
Figure 4-10.FTIR-ATR spectra of imidazole functionalized membranes showing the effect of the
metal ion immobilized on the thioamide bands: (a) Zn+2, (b) Co+2, and (c) Cu+2.
Figure 4-10 compares the results for three different imidazole functionalized membranes
which wer ely.
It was
for
e exposed to solutions of divalent metal ions of copper, cobalt and zinc, respectiv
found that the enhancement of the band intensity is related to the strength of the binding
constant between the metal ions with the functional membrane.258 In addition, it was observed
that those bands shifted toward lower frequencies as is demonstrated in Figure 4-10. These
changes of the band intensity may be attributed to changes of the electric dipole moment after
coordination with the metal ions.287 It may be possible that IR energy is preferential absorbs
137
some favored orientations of the imidazole moiety in the functional membrane after
coordination.
The observed band at 1110 cm–1 was also assigned, and it is clearly illustrated i
8B. This band
n Figure 4-
was labeled to the asymmetric C-S-C stretching vibrations.284, 288 For the correct
assign
ne
embrane for
backg
nal mode
8 cm-1
branes
Frequency (cm-1)
ment of this band, the contribution of Si-O stretching vibration at this region was also
considered. In order to confer a proper assignment, the FTIR-ATR spectrum of imidazole
functionalized membrane was also acquired by using 3-chloropropyl silica nanotube membra
as background for the spectrum subtraction instead of air (Figure 4-8B).
Figure 4-8B compares the FTIR-ATR spectra of an imidazole functionalized membrane,
which were collected using both air and 3-chloropropyl silica nanotube m
round subtraction, respectively. It was clearly observed that when the chlorosilane-
modified membrane was used for the background subtraction, the fundamental vibratio
from the imidazole moiety at 1118 cm-1 was more clearly discriminated. Therefore, at 111
the contribution of both Si-O and asymmetric C-S-C stretching vibrations should be
considered.284, 288, 289
Table 4-1.FTIR-ATR characteristic bands of imidazole functionalized nanotube mem
Assignment
N-H stretching ~2900
N-H bending in the plane
ing vibration modes ~1684-1630
which are respectively coupled vibrations n of C-S + N-H, and bending motion C-N + N-H. ~1486 and 1412
hing vibrations. 1118
~1560
C=C and C=N r
Thioamide bands I and II, involving stretching motio C-S-C anti-symmetric and Si-O stretc
138
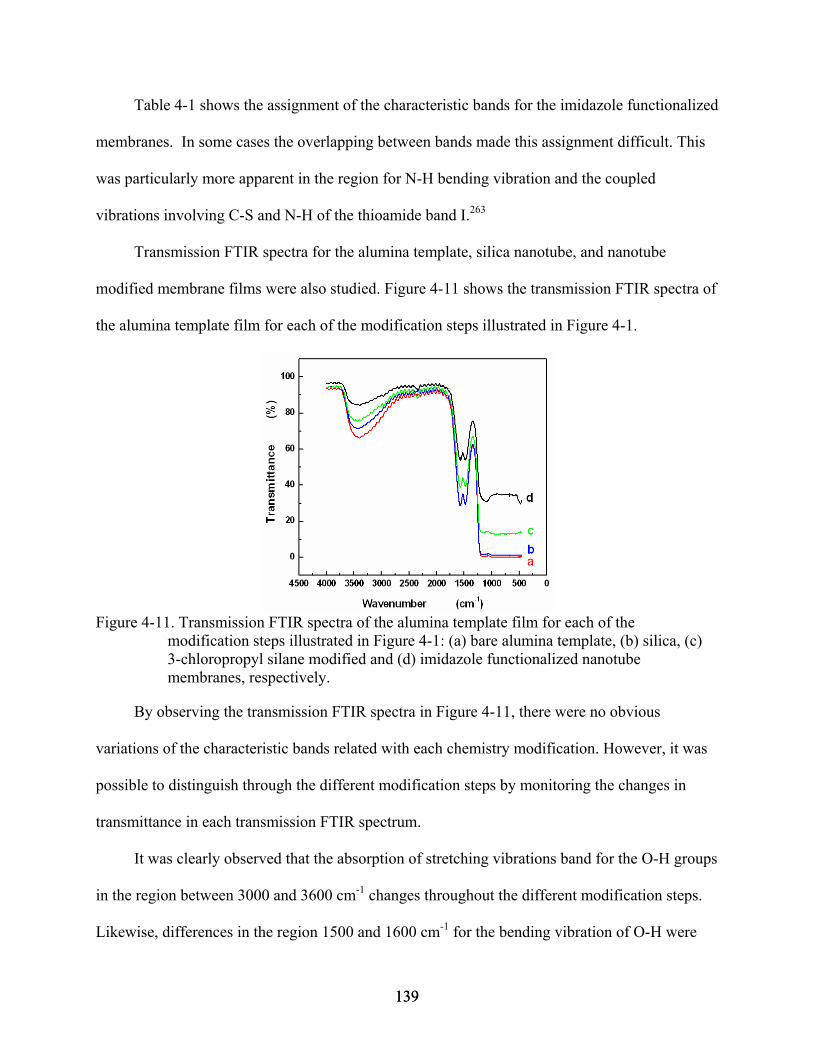
139
Table 4-1 shows the assignment of the characteristic bands for the imidazole functionalized
embranes. In some cases the overlapping between bands made this assignment difficult. This
was particularly more apparent in the region for N-H bending vibration and the coupled
vibrations involving C-S and N-H of the thioamide band I.
Transmission FTIR spectra for the alumina template, silica nanotube, and nanotube
modified membrane films were also studied. Figure 4-11 shows the transmission FTIR spectra of
the alumina template film for each of the modification steps illustrated in Figure 4-1.
Figure 4-11. Transm for each of the modification plate, (b) silica, (c)
By o
variations of ith each chemistry modification. However, it was
possible to distinguish through the different modification steps by monitoring the changes in
transmittance in each transmission FTIR spectrum.
It was clearly observed that the absorption of stretching vibrations band for the O-H groups
in the region between 3000 and 3600 cm changes throughout the different modification steps.
Likewise, differences in the region 1500 and 1600 cm-1 for the bending vibration of O-H were
m
263
ission FTIR spectra of the alumina template film
steps illustrated in Figure 4-1: (a) bare alumina tem3-chloropropyl silane modified and (d) imidazole functionalized nanotube membranes, respectively.
bserving the transmission FTIR spectra in Figure 4-11, there were no obvious
the characteristic bands related w
-1
139
also o
d
rmed the success of the silanization
reacti
ed
e
C-S s
f
om characteristic of
its co
hilic
the infrared absorption spectral region. Thus, the shorter wavelengths can penetrate less the
bserved. In the latter region, the differences between the bending vibrations of the O-H for
the alumina membrane and the silica nanotube membrane were not significant (spectra a, and b
in Figure 4-11). This was reasonable because part of the OH groups for the alumina are replace
for the silanols OH groups in silica; besides silica surface introduce higher silanol groups on
surface for further silane functionalization.30, 94, 99 - 102
In the case of chlorosilane modification (spectrum c in figure 4-11), lower absorption for
the silane-modified membrane was observed in the bending O-H region compared with alumina
and silica. This difference in transmittance clearly confi
on where the O-H free groups in the alumina matrix and the silanol groups in the silica
nanotubes were replaced by the condensation reaction with 3-chloropropyltrimethoxysilane.
The differences in transmittance were even more evident for the imidazole functionaliz
membrane (spectrum d in Figure 4-11). Additionally this exhibited two observable absorption
bands at 1118 cm-1 and 474 cm-1 assigned respectively to the anti-symmetric C-S-C, and to th
tretching vibrations, which confirmed the imidazole functionalization.
These differences in the intensity of the bands might be attributed once more to changes o
the electric dipole moment after each chemistry modification.287 Besides, each chemistry
modification introduces a variety of vibrational motions, and degrees of freed
mponent atoms that should produce a net change in the dipole moment. It should be also
considered the fact that may be after the modifications the membranes become less hydrop
than the bare alumina template, thereby the contribution of water on surface must be less
significant, even though all the membranes were dried at the same conditions.
These transmission FTIR data in Figure 4-11 may perhaps be interpreted on the basis of
140
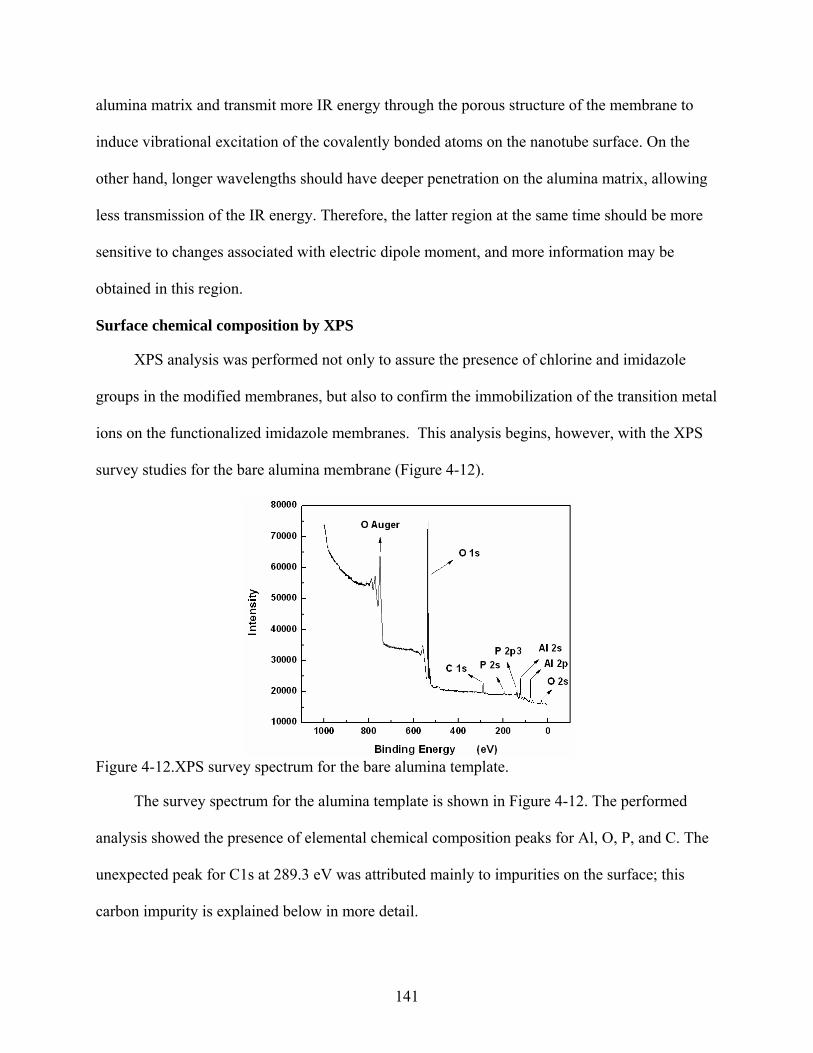
alumina matrix and transmit more IR energy through the porous structure of the membran
induce vibrational excitation of the covalently bonded atoms on the nanotube su
e to
rface. On the
other
re
metal
azole membranes. This analysis begins, however, with the XPS
rane (Figure 4-12).
Figure 4-12.
The survey sp ed
analysis showed the pres position peaks for Al, O, P, and C. The
the surface; this
hand, longer wavelengths should have deeper penetration on the alumina matrix, allowing
less transmission of the IR energy. Therefore, the latter region at the same time should be mo
sensitive to changes associated with electric dipole moment, and more information may be
obtained in this region.
Surface chemical composition by XPS
XPS analysis was performed not only to assure the presence of chlorine and imidazole
groups in the modified membranes, but also to confirm the immobilization of the transition
ions on the functionalized imid
survey studies for the bare alumina memb
XPS survey spectrum for the bare alumina template.
ectrum for the alumina template is shown in Figure 4-12. The perform
ence of elemental chemical com
unexpected peak for C1s at 289.3 eV was attributed mainly to impurities on
lained below in more detail. carbon impurity is exp
141
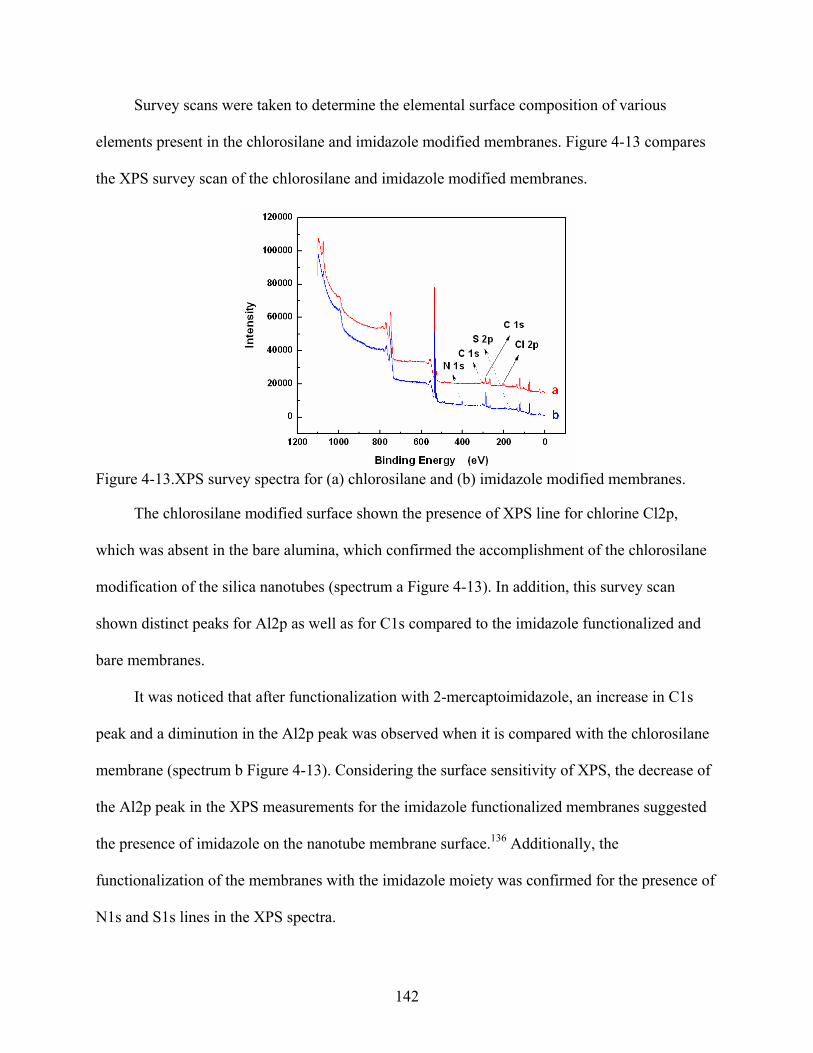
Survey scans were taken to determine the elemental surface composition of various
elements present in the chlorosilane and imidazole modified membranes. Figure 4-13 compares
the XPS survey scan of the chlorosilane and imidazole modified membranes.
XPS survey spectra for (a) chlorosilane and (b) imidazole modified m
odified surface shown the presence of XPS line for ch
ina, which confirmed the accomp
modification of the silica nanotubes (spectrum a Figure 4-13). In addition,
Figure 4-13. embranes.
The chlorosilane m lorine Cl2p,
which was absent in the bare alum lishment of the chlorosilane
this survey scan
d
bare m
lane
e XPS measurements for the imidazole functionalized membranes suggested
the pr
shown distinct peaks for Al2p as well as for C1s compared to the imidazole functionalized an
embranes.
It was noticed that after functionalization with 2-mercaptoimidazole, an increase in C1s
peak and a diminution in the Al2p peak was observed when it is compared with the chlorosi
membrane (spectrum b Figure 4-13). Considering the surface sensitivity of XPS, the decrease of
the Al2p peak in th
esence of imidazole on the nanotube membrane surface.136 Additionally, the
functionalization of the membranes with the imidazole moiety was confirmed for the presence of
N1s and S1s lines in the XPS spectra.
142
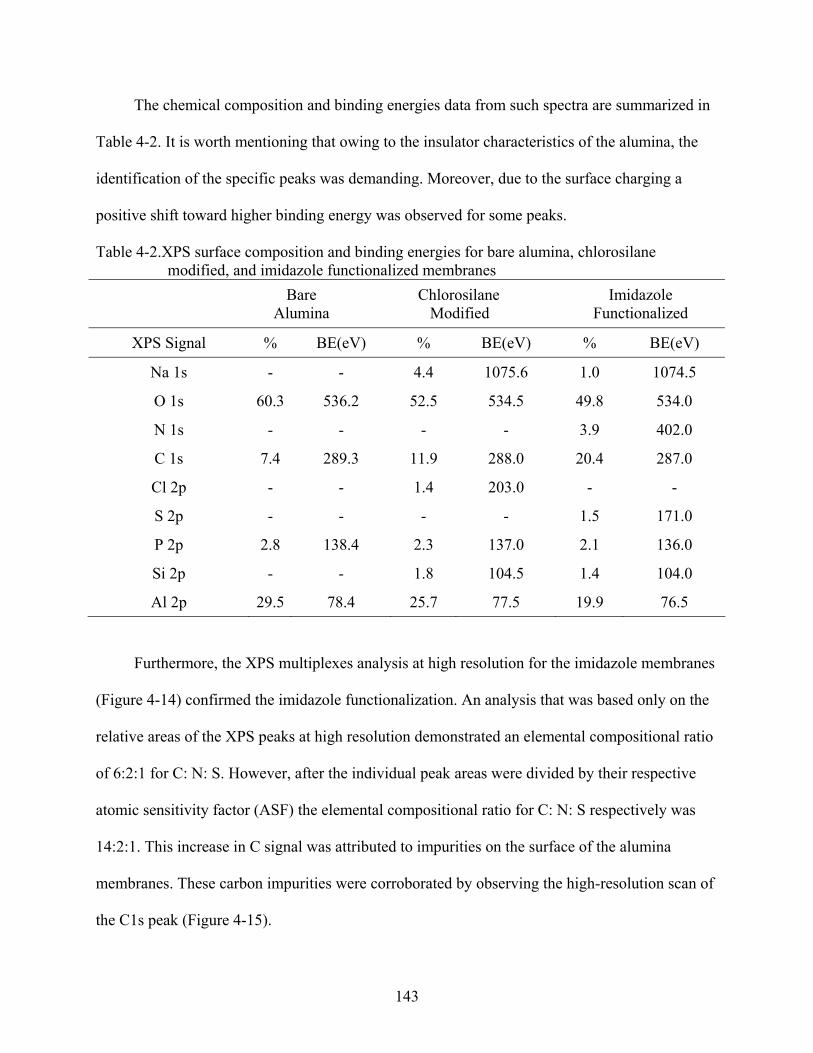
The chemical composition and binding energies data from such spectra are summarized in
Table 4-2. It is worth mentioning that owing to the insulator characteristics of the a
identification of the specific peaks was demanding. Moreover, due to the surface charging a
positive shift toward higher binding en
lumina, the
ergy was observed for some peaks.
Tablemodified, and imidazole functionalized membranes
4-2.XPS surface composition and binding energies for bare alumina, chlorosilane
Bare Alumina
Chlorosilane Modified
Imidazole Functionalized
XPS Signal % BE(eV) % BE(eV) % BE(eV)
Na 1s - - 4.4 1075.6 1.0 1074.5
O 1s 60.3 536.2 52.5 534.5 49.8 5
-
34.0
N 1s - 3.9
9.3 88.0 20
1.8 104.5
- - 402.0
C 1s 7.4 28 11.9 2 .4 287.0
Cl 2p - - 1.4 203.0 - -
S 2p - - - - 1.5 171.0
P 2p 2.8 138.4 2.3 137.0 2.1 136.0
Si 2p - - 1.4 104.0
Al 2p 29.5 78.4 25.7 77.5 19.9 76.5
Furthermore, the XPS multiplexes analysis a igh resolu or the i zole m es
(Figure 4-14) confirmed the imidaz ctional n. An that was based only on the
relative areas of the XPS peaks at hi tion demonstrated an elemental compositional ratio
f 6:2:1 for C: N: S. However, after the individual peak areas were divided by their respective
atomi
t h tion f mida embran
ole fun izatio analysis
gh resolu
o
c sensitivity factor (ASF) the elemental compositional ratio for C: N: S respectively was
14:2:1. This increase in C signal was attributed to impurities on the surface of the alumina
membranes. These carbon impurities were corroborated by observing the high-resolution scan of
the C1s peak (Figure 4-15).
143
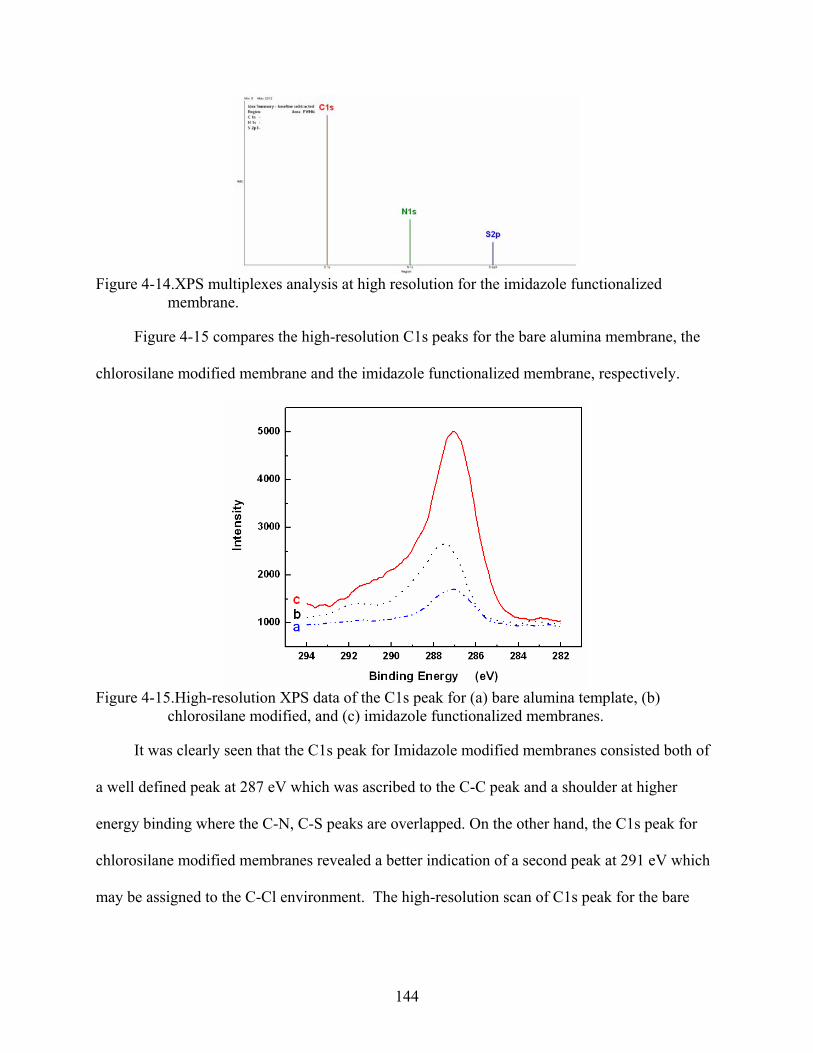
Figure 4-14.XPS multiplexes analysis at high resolution for the imidazole functionalized
membrane.
Figure 4-15 compares the high-resolution C1s peaks for the bare alumina membrane, the
chlorosilane modified membrane and the imidazole functionalized membrane, respectively.
plate, (b) chloros
mbranes consisted both of
energy binding where th nd, the C1s peak for
which
may b
Figure 4-15.High-resolution XPS data of the C1s peak for (a) bare alumina tem
ilane modified, and (c) imidazole functionalized membranes.
It was clearly seen that the C1s peak for Imidazole modified me
a well defined peak at 287 eV which was ascribed to the C-C peak and a shoulder at higher
e C-N, C-S peaks are overlapped. On the other ha
chlorosilane modified membranes revealed a better indication of a second peak at 291 eV
e assigned to the C-Cl environment. The high-resolution scan of C1s peak for the bare
144
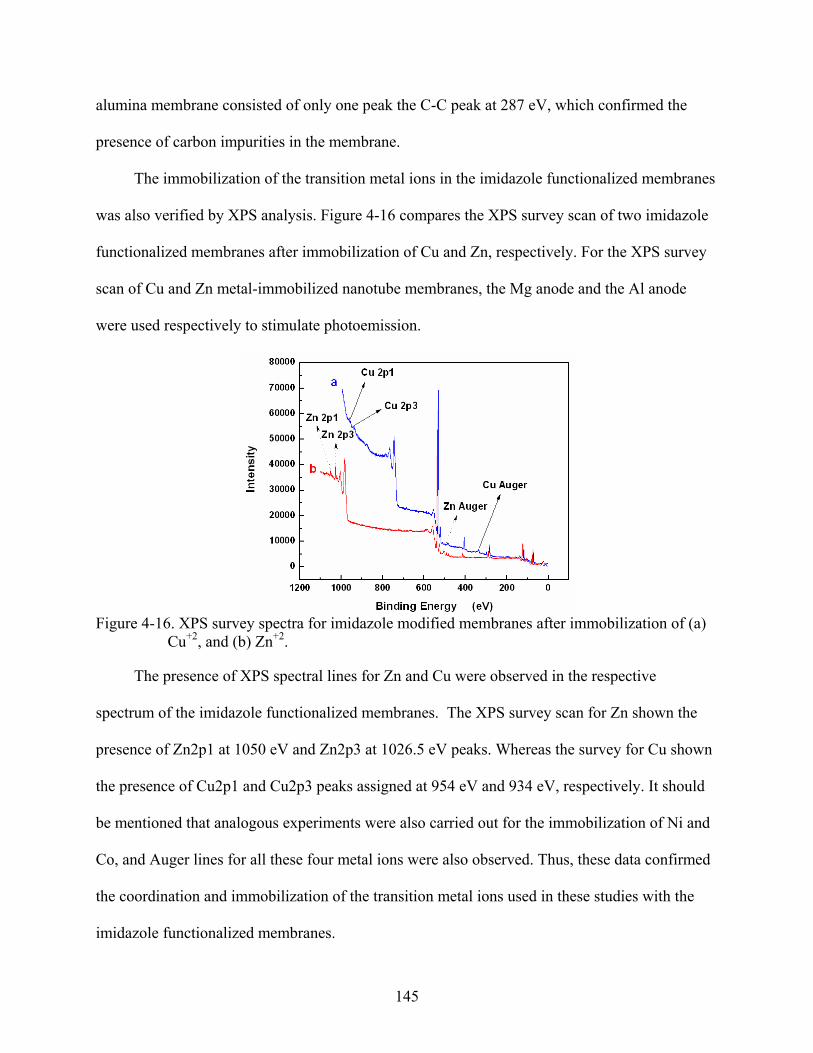
alumina membrane consisted of only one peak the C-C peak at 287 eV, which confirmed the
presence of carbon impurities in the membrane.
The immobilization of the transition metal ions in the imidazole functionalized membran
was also verified by XPS analysis. Figure 4-16 compares the XPS survey scan of two imidazo
functionalized membranes after immobilization o
es
le
f Cu and Zn, respectively. For the XPS survey
scan o
Figure 4-16. X mobilization of (a) Cu+2
spectrum of the im
presence of Zn2p1 at 1050 eV and Zn2p3 at 1026.5 eV peaks. Whereas the survey for Cu shown
the pr hould
f Cu and Zn metal-immobilized nanotube membranes, the Mg anode and the Al anode
were used respectively to stimulate photoemission.
PS survey spectra for imidazole modified membranes after im, and (b) Zn+2.
The presence of XPS spectral lines for Zn and Cu were observed in the respective
idazole functionalized membranes. The XPS survey scan for Zn shown the
esence of Cu2p1 and Cu2p3 peaks assigned at 954 eV and 934 eV, respectively. It s
be mentioned that analogous experiments were also carried out for the immobilization of Ni and
Co, and Auger lines for all these four metal ions were also observed. Thus, these data confirmed
the coordination and immobilization of the transition metal ions used in these studies with the
imidazole functionalized membranes.
145
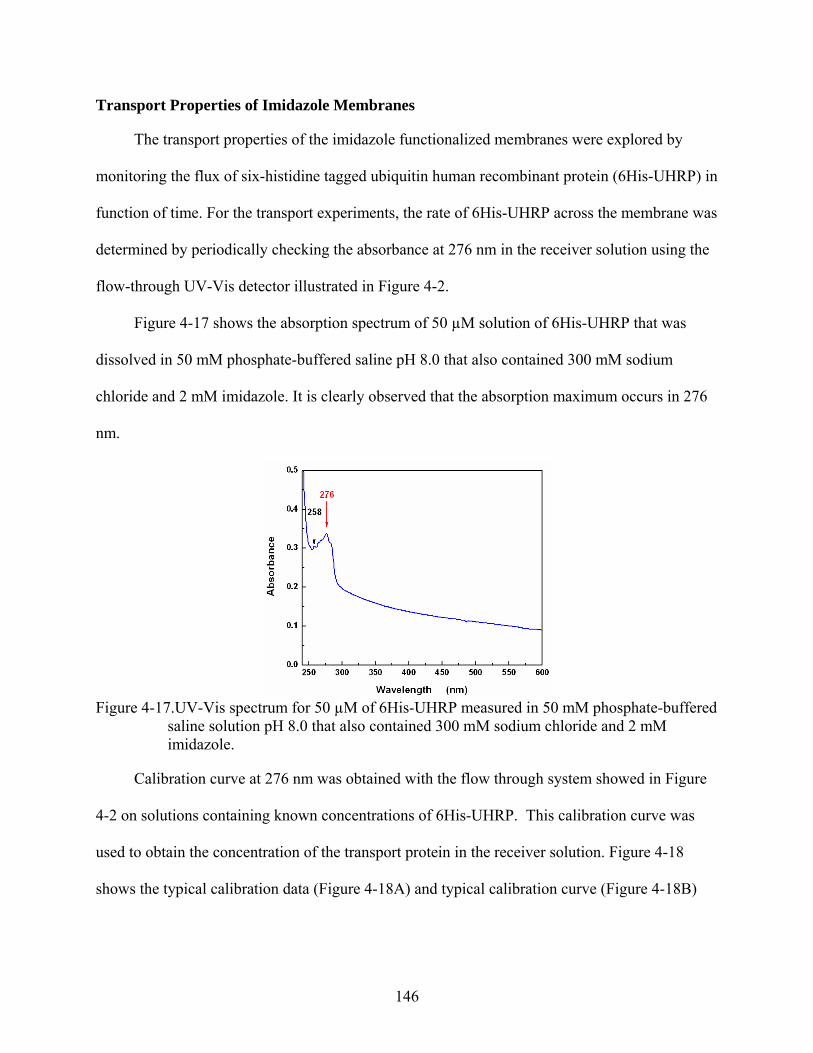
Transport Properties of Imidazole Membranes
The transport properties of the imidazole functionalized membranes were explored by
monitoring the flux of six-histidine tagged ubiquitin human recombinant protein (6His-UHRP) in
function of time. For the transport experiments, the rate of 6His-UHRP across the membrane was
determ the
he absorption maximum occurs in 276
nm.
Figure 4-17.UV-Vis spectrum mM phosphate-buffered loride and 2 mM
imidazole.
Calibration curve at 276 nm showed in Figure
used to obtain the concentration of the transport protein in the receiver solution. Figure 4-18
show
ined by periodically checking the absorbance at 276 nm in the receiver solution using
flow-through UV-Vis detector illustrated in Figure 4-2.
Figure 4-17 shows the absorption spectrum of 50 µM solution of 6His-UHRP that was
dissolved in 50 mM phosphate-buffered saline pH 8.0 that also contained 300 mM sodium
chloride and 2 mM imidazole. It is clearly observed that t
for 50 µM of 6His-UHRP measured in 50
saline solution pH 8.0 that also contained 300 mM sodium ch
was obtained with the flow through system
4-2 on solutions containing known concentrations of 6His-UHRP. This calibration curve was
s the typical calibration data (Figure 4-18A) and typical calibration curve (Figure 4-18B)
146
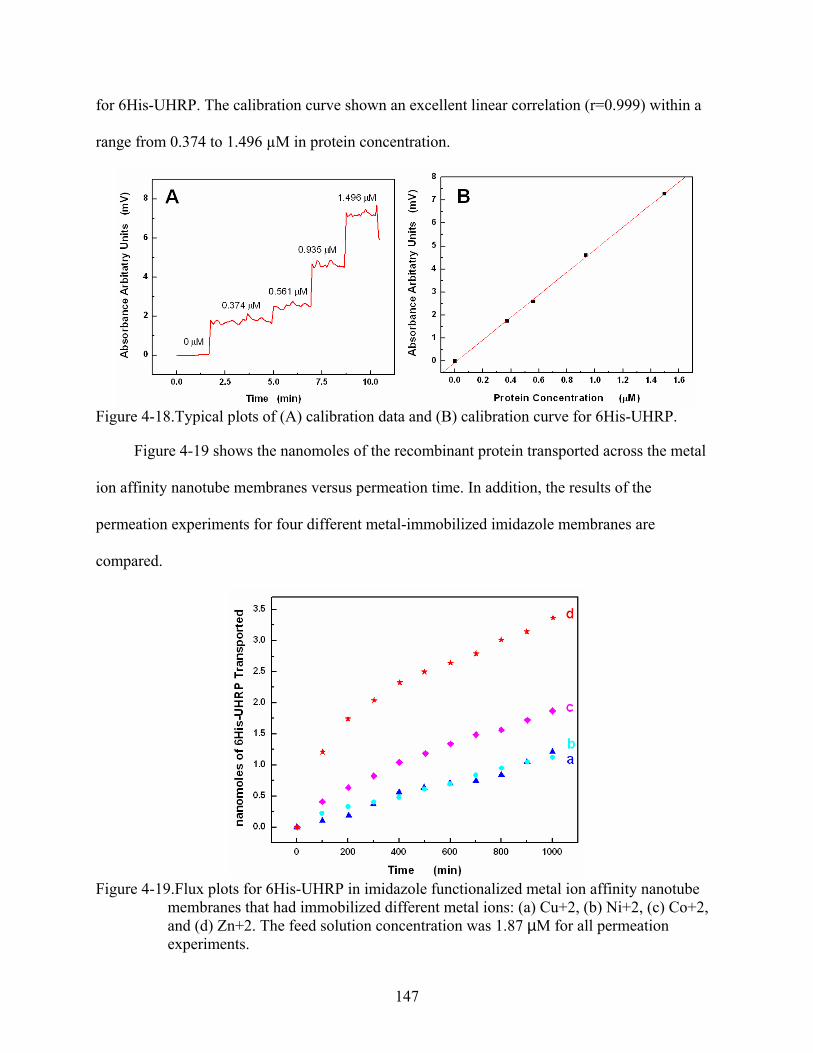
for 6His-UHRP. The calibration curve shown an excellent linear correlation (r=0.999) within
range from 0.374 to 1.496 µM in protein concentration.
a
and (B) calibration curve for 6His-UHRP.
binant protein transported across the metal
Figure 4-18.Typical plots of (A) calibration data
Figure 4-19 shows the nanomoles of the recom
perme
ion affinity nanotube membranes versus permeation time. In addition, the results of the
ation experiments for four different metal-immobilized imidazole membranes are
compared.
Figure 4-19.Flux plots for 6His-UHRP in imidazole functionalized metal ion affinity nanotube
membranes that had immobilized different metal ions: (a) Cu+2, (b) Ni+2, (c) Co+2, and (d) Zn+2. The feed solution concentration was 1.87 µM for all permeation experiments.
147
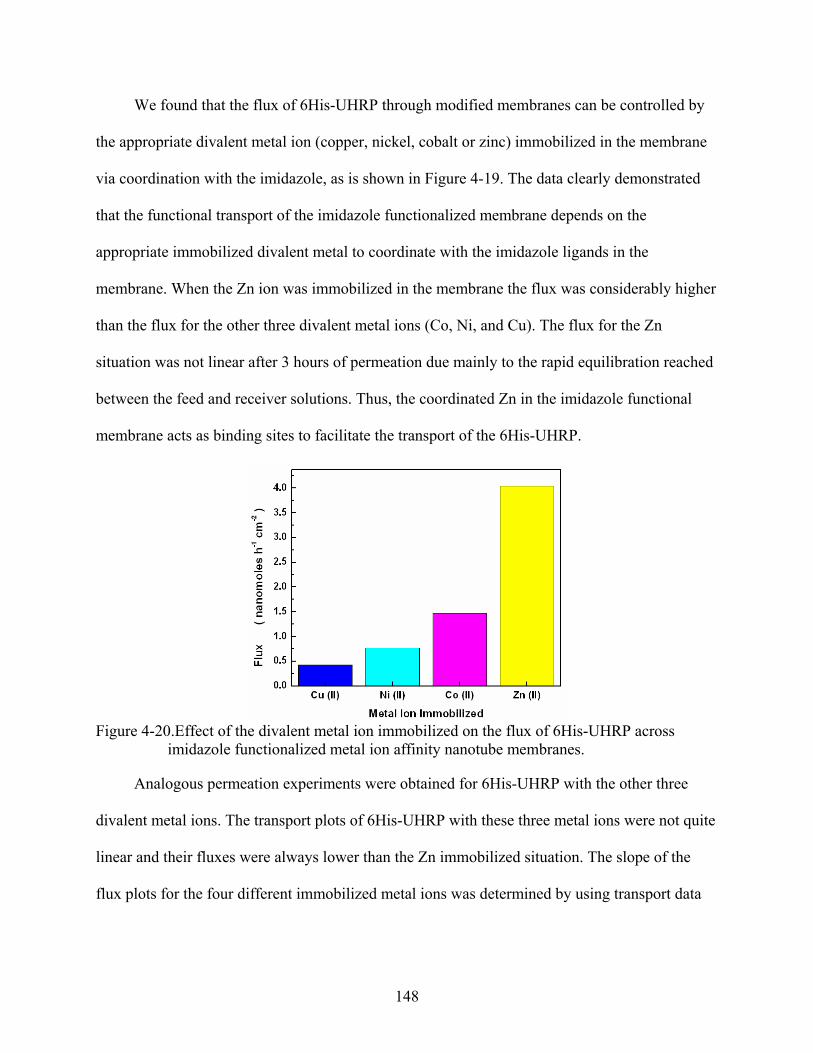
We found that the flux of 6His-UHRP through modified membranes can be controlled by
riate divalent metal ion (copper, nickel, cobalt or zinc) immobilized in the membthe approp rane
via coordination with the imidazole, as is shown in Figure 4-19. The data clearly demonstrated
that the functional transport of the imidazole functionalized membrane depends on the
appropriate immobilized divalent metal to coordinate with the imidazole ligands in the
membrane. When the Zn ion was immobilized in the membrane the flux was considerably higher
than the flux for the other three divalent metal ions (Co, Ni, and Cu). The flux for the Zn
situation was not linear after 3 hours of permeation due mainly to the rapid equilibration reached
between the feed and receiver solutions. Thus, the coordinated Zn in the imidazole functional
membrane acts as binding sites to facilitate the transport of the 6His-UHRP.
Figure 4-20.Effect of the divalent metal ion immobilized on the flux of 6His-UHRP across
imidazole functionalized metal ion affinity nanotube membranes.
Analogous permeation experiments were obtained for 6His-UHRP with the other three
quite
linear and their fluxes were always lower than the Zn immobilized situation. The slope of the
flux plots for the four different immobilized metal ions was determined by using transport data
divalent metal ions. The transport plots of 6His-UHRP with these three metal ions were not
148
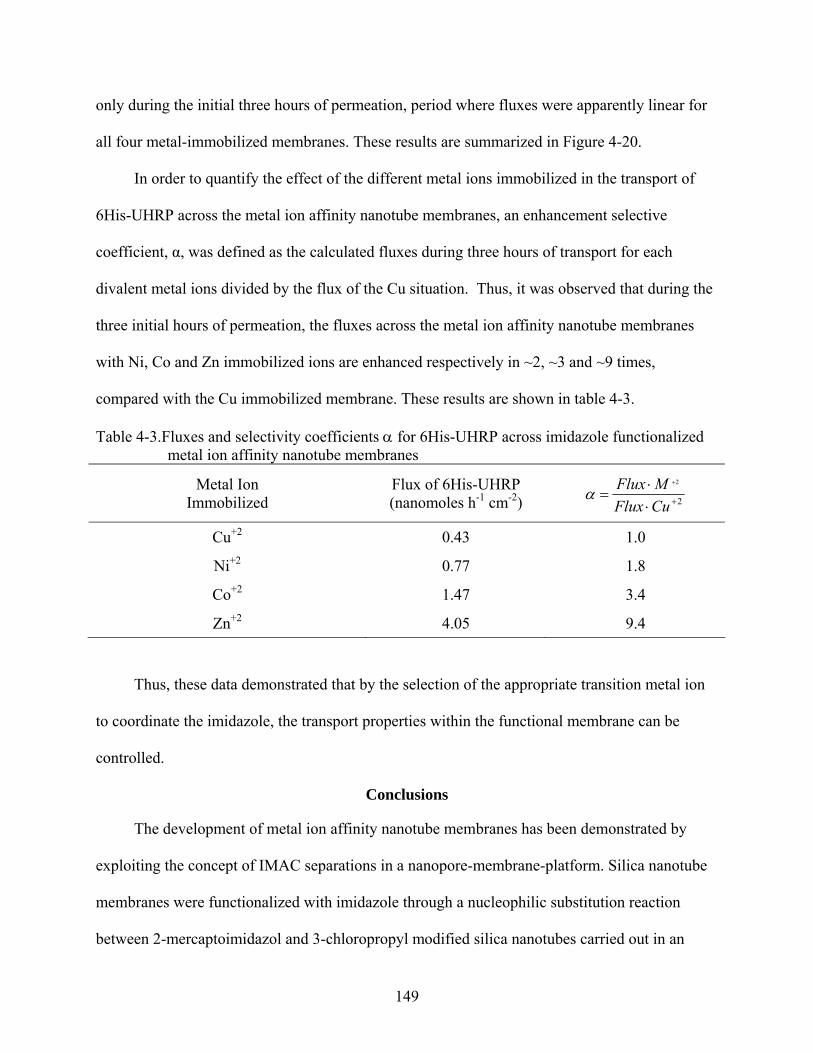
only during the initial three hours of permeation, period where fluxes were apparently linear for
all four metal-immobilized membranes. These results are summarized in Figure 4-20.
In order to quantify the effect of the different metal ions immobilized in the transport of
6His-
g the
ionalized metal ion affinity nanotube membranes
moles h-1 cm-2)
UHRP across the metal ion affinity nanotube membranes, an enhancement selective
coefficient, α, was defined as the calculated fluxes during three hours of transport for each
divalent metal ions divided by the flux of the Cu situation. Thus, it was observed that durin
three initial hours of permeation, the fluxes across the metal ion affinity nanotube membranes
with Ni, Co and Zn immobilized ions are enhanced respectively in ~2, ~3 and ~9 times,
compared with the Cu immobilized membrane. These results are shown in table 4-3.
Table 4-3.Fluxes and selectivity coefficients α for 6His-UHRP across imidazole funct
2⋅ +Metal Ion Immobilized
Flux of 6His-UHRP (nano 2+⋅
=CuFlux
α MFlux
Cu+2 0.43 1.0
Ni+2 0.77 1.8
Co+2 1.47 3.4
Zn+2 4.05 9.4
Thus, these data demonstrated that by the selection of the appropriate transition metal ion
to coo
Conclusions
The development of metal ion affin
explo e
rdinate the imidazole, the transport properties within the functional membrane can be
controlled.
ity nanotube membranes has been demonstrated by
iting the concept of IMAC separations in a nanopore-membrane-platform. Silica nanotub
membranes were functionalized with imidazole through a nucleophilic substitution reaction
between 2-mercaptoimidazol and 3-chloropropyl modified silica nanotubes carried out in an
149
aprotic medium. It was demonstrated that transport of histidine-tagged recombinant proteins
across these imidazole-modified silica nanotube membranes is controlled by the nature of
immobilized metal ion on the imidazole surface. Besides, the extensive characterization of
imidazole functionalized membrane allowed the understanding of how coordination chemistry
with different divalent metal ions affects the functional behavior of the membrane and transport
properties during the permeation of six-histidine recombinant proteins. Furthermore, additional
results shown that by the appropriate choice of the transition metal ion for coordination with the
imidazole ligand, the binding strength and optical properties within the functional membrane are
also modified. Hence, these studies revealed how the presence of the immobilized metal ion
affects the functionality of the imidazole membrane and its transport properties. The metal io
affinity nanotube membrane described here has the potential to be a versatile analytical platform
where different metal ions can be immobilized on the same prevailing conditions, additionally
offering the possibilities of regeneration without apparent loss of the metal coordination
properties of the functional membrane. These studies demonstrate an alternative way of
immobilized metal ion affinity by using nanotube membranes.
the
n
,
150
CHAPTER 5 TRANSPORT ANALYSIS OF PROTEINS ACROSS SILICA NANOTUBE MEMBRANES
THROUGH A FLUORESCENCE QUENCHING-BASED SENSING APPROACH
Introduction
Molecular recognition is a very important and commonly used tool in both clinical
diagnostics and pharmacology. The practical methods based on recognition depend
fundamentally on specific biomolecular recognition reactions. In some cases, these biomolecular
recognition reactions confer such extremely high specificity that it has allowed the development
of analytical assays for the determination of many chemicals and biochemicals at very low
concentrations.290 - 293 This is important because in this era of proteomics in particular, the
quantitative determination and identification of proteins at low concentrations are essential
requirements. Many very sensitive methods have been developed for the detection of proteins
and other biological molecules on the basis and capacity of fluorescent compounds to transfer
energy absorbed from photon radiation to close molecules by taking advantage of the molecular
recognition.294 - 297
This called fluorescence resonant energy transfer (FRET) phenomenon takes place when
the energy in the excited state of a donor fluorophore is transferred to a close acceptor molecule
via an appropriate orientation of the dipole-dipole interaction between these donor-acceptor
molecules.298, 299 One of the basic conditions for the FRET process to occur is that the emission
spectrum of the donor must overlap the absorption spectrum of the acceptor. Therefore, FRET
efficiency is a distance-dependent interaction process.131, 298 This distance dependence of FRET
has been extensively used to study both structure and dynamics of proteins and nucleic acids, as
well for the detection and visualization of intermolecular associations, and for the development
of biomolecular devices based on intermolecular binding interaction.298, 300, 301
151
If the donor and acceptor molecules are brought close together within the range of 20 to
100 Å, the fluorescence intensity of the donor fluorophore is reduced (quenched) as a result of
the FRET process. However, if the donor and acceptor molecules are brought within an intimate
distance, most of the absorbed energy is dissipated as heat and only a small amount of the energy
is emitted as fluorescence; this phenomenon is commonly referred to as static or contact
quenching.131 The rate of fluorescence quenching can be studied experimentally by calculating
the Stern-Volmer quench (KSV) constant.131
In the present study, a new approach is described to study the transport of proteins across
silica nanotube membranes by using a fluorescence quenching-based analytical method. This
analysis was accomplished by simply observing the fluorescence quenching of a donor-
fluorescent labeled protein through a ligand-receptor binding mechanism. Thus, the flux of anti-
Human IgG conjugated with the quencher QSY-7 (anti-H-IgG-QSY) was monitored by using a
known concentration of Human IgG FITC-labeled (H-IgG-FITC) as fluorescence emitter and
donor in the permeation compartment. In order to preserve the chemical potential as the actual
driving force for the flux, a much higher concentration of protein in the feed compartment (anti-
H-IgG-QSY) was intentionally kept with respect to the concentration of emitter-labeled protein
in the permeation compartment. It is described that the rate of fluorescence quenching depends
on the flux of anti-H-IgG-QSY across the nanotube membrane, and that the rate of fluorescence
quenching can be used to determine the concentration of the analyzed protein on the feed
solution. The results of this investigation are reported here.
Experimental
Materials
Commercially available nanopore alumina membranes (60 µm thick, nominal pore
diameter 100 nm) were obtained from Whatman. Tetraethyl orthosilicate 99.999% (TEOS)
152
(Sigma Aldrich) was used to deposit the silica nanotubes within the pores of these membranes.
The purified mouse immunoglobulin (M-IgG) immobilized within the silica nanotube
membranes was obtained from Sigma Aldrich. Membranes modified with purified human
immunoglobulin (H-IgG) obtained from Sigma Aldrich were also prepared. A trimethoxysilyl
propyl aldehyde (United Chemical Technologies) was used to attach the M-IgG or H-IgG to the
nanotubes. A purified human immunoglobulin conjugated with the FITC dye (H-IgG-FITC)
obtained from Sigma Aldrich was used as emitter during the fluorescence quenching detection. A
purified rabbit immunoglobulin conjugated with the FITC dye (R-IgG-FITC) obtained from
Sigma Aldrich was used as control emitter during the fluorescence quenching detection. To
investigate the transport properties across silica nanotube membranes the whole antibody raised
in goat against H-IgG was used was used as permeating protein. This anti-human IgG (anti-H-
IgG) with specific affinity for the Fab fragments of the H-IgG was obtained from Sigma Aldrich.
In order to observe the fluorescence quenching of the donor-fluorescent labeled protein through a
molecular recognition reaction, the anti-H-IgG permeating protein was conjugated with the
QSY-7 quencher. This protein labeling was accomplished via acylation reaction of an N-
Hydroxysuccinimidyl (NHS) ester of QSY-7 to the primary amine residues of the protein to form
a stable amide bond. This NHS ester of QSY-7 was purchased from Molecular Probes (Eugene,
OR). The BioGel P-30 resin provided in the amine-reactive protein labeling kit obtained from
Molecular Probes was used for purification of the anti-H-IgG conjugated with QSY-7.
SuperBlock® blocking buffer solution in phosphate-buffered saline was obtained from Pierce.
SuperBlock® solution contains a proprietary protein for blocking binding sites for non-specific
protein adsorption. Tween 20 was obtained from Sigma Aldrich. All other chemicals were of
153
reagent grade and used as received. Purified water, obtained by passing house-distilled water
through a Barnstead, E-pure water-purification system, was used to prepare all solutions.
Preparation of the Silica Nanotube Membranes
Silica nanotubes were deposited in the pores of the alumina membrane using the sol-gel-
based template-synthesis method described previously. Briefly, a sol-gel precursor solution was
prepared by mixing absolute ethanol, TEOS and 1 M HCl (50:5:1 by volume), and this solution
was allowed to hydrolyze for 30 minutes. The alumina membranes were then immersed into this
solution for two minutes under sonication. The membranes were then removed and the surfaces
swabbed with ethanol to remove precursor from the alumina surface. The membranes were then
air dry for ten minutes at room temperature and cured in an oven for 12 hours at 150 ºC. This
yields silica nanotubes, with wall thickness of ~3 nm, embedded within the pores of the alumina
membrane.9
Antibody Immobilization
The immobilization chemistry has also been described previously. The aldehyde silane
was first attached to the inside walls of the silica nanotubes. The membrane was then immersed
into a solution that was 1.0 mg per mL either in M-IgG or in H-IgG dissolved in 10 mM
phosphate-buffered saline with pH = 7.4 that also contained 150 mM sodium chloride and 5 mM
sodium azide. The membrane was incubated overnight at 4 ºC, which allowed free amino sites
on the antibody to attach via the Schiff’s base reaction to the nanotube-immobilized aldehyde
groups. After immobilization, the membranes were rinsed with buffer and then incubated for 5
hours in the SuperBlock® solution that also contained 0.05% Tween 20. It is worth mentioning
that the unmodified silica nanotube membranes were also incubated for 5 hours in the
SuperBlock® solution containing 0.05% Tween 20 before the transport experiments.
154
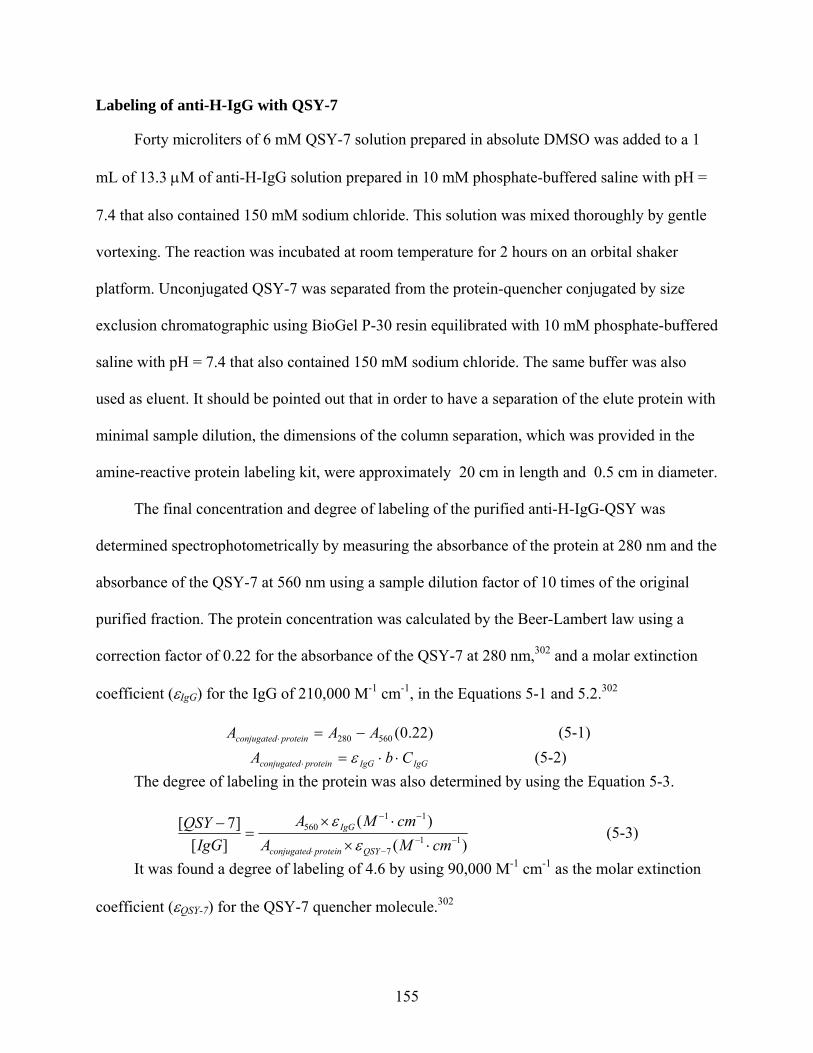
Labeling of anti-H-IgG with QSY-7
Forty microliters of 6 mM QSY-7 solution prepared in absolute DMSO was added to a 1
mL of 13.3 µM of anti-H-IgG solution prepared in 10 mM phosphate-buffered saline with pH =
7.4 that also contained 150 mM sodium chloride. This solution was mixed thoroughly by gentle
vortexing. The reaction was incubated at room temperature for 2 hours on an orbital shaker
platform. Unconjugated QSY-7 was separated from the protein-quencher conjugated by size
exclusion chromatographic using BioGel P-30 resin equilibrated with 10 mM phosphate-buffered
saline with pH = 7.4 that also contained 150 mM sodium chloride. The same buffer was also
used as eluent. It should be pointed out that in order to have a separation of the elute protein with
minimal sample dilution, the dimensions of the column separation, which was provided in the
amine-reactive protein labeling kit, were approximately 20 cm in length and 0.5 cm in diameter.
The final concentration and degree of labeling of the purified anti-H-IgG-QSY was
determined spectrophotometrically by measuring the absorbance of the protein at 280 nm and the
absorbance of the QSY-7 at 560 nm using a sample dilution factor of 10 times of the original
purified fraction. The protein concentration was calculated by the Beer-Lambert law using a
correction factor of 0.22 for the absorbance of the QSY-7 at 280 nm,302 and a molar extinction
coefficient (εIgG) for the IgG of 210,000 M-1 cm-1, in the Equations 5-1 and 5.2.302
)22.0(560280 AAA proteinconjugated −=⋅ (5-1)
IgGIgGproteinconjugated CbA ⋅⋅=⋅ ε (5-2) The degree of labeling in the protein was also determined by using the Equation 5-3.
)()(
][]7[
117
11560
−−−⋅
−−
⋅×⋅×
=−
cmMAcmMA
IgGQSY
QSYproteinconjugated
IgG
εε
(5-3)
It was found a degree of labeling of 4.6 by using 90,000 M-1 cm-1 as the molar extinction
coefficient (εQSY-7) for the QSY-7 quencher molecule.302
155
Transport Experiments
The bare silica nanotube membranes, M-IgG- or H-IgG-modified membranes were
sandwiched between two pieces of Scotch tape that had 0.31 cm2 area holes punched through
them. These holes defined the area of membrane exposed to the contacting solution phases.
This membrane assembly was mounted between the two halves of a U-tube permeation cell, with
half-cell volumes of 10 mL.
The feed solution contained the quencher conjugated antibody (anti-H-IgG-QSY)
dissolved in 10 mM phosphate-buffered saline pH 7.4 that also contained 150 mM sodium
chloride and 5 mM sodium azide (buffer used for all studies). The receiver solution on the other
side of the membrane contained the buffered solution of the fluorescence emitter labeled protein
the H-IgG-FITC. The concentration of the transporting protein in the feed solution was in all
cases higher than the emitter-donor-protein in the receiver side. Thus, the chemical potential was
preferentially preserved from the feed to receiver solutions as the actual driving force for the
flux. A protocol was established to carry out all the transport experiments.
First, the membrane mounted in the U-tube permeation cell was equilibrate for one hour in
the buffer solution, and the receiver solution were frequently measured using a flow-through
fluorescence detector until a stable base line for the fluorescence signal was reached. After that, a
known concentration of anti-H-IgG-QSY was placed in the feed solution, and it was permitted to
equilibrate for another fifteen minutes. Then, a known concentration of H-IgG-FITC was put in
the receiver solution, after five minutes when the fluorescence signal was stable the experimental
data for the transport experiment started being recorded.
The changes of fluorescence intensity in the receiver solution were periodically measured
using a flow-through fluorescence detector (Figure 5-1).
156
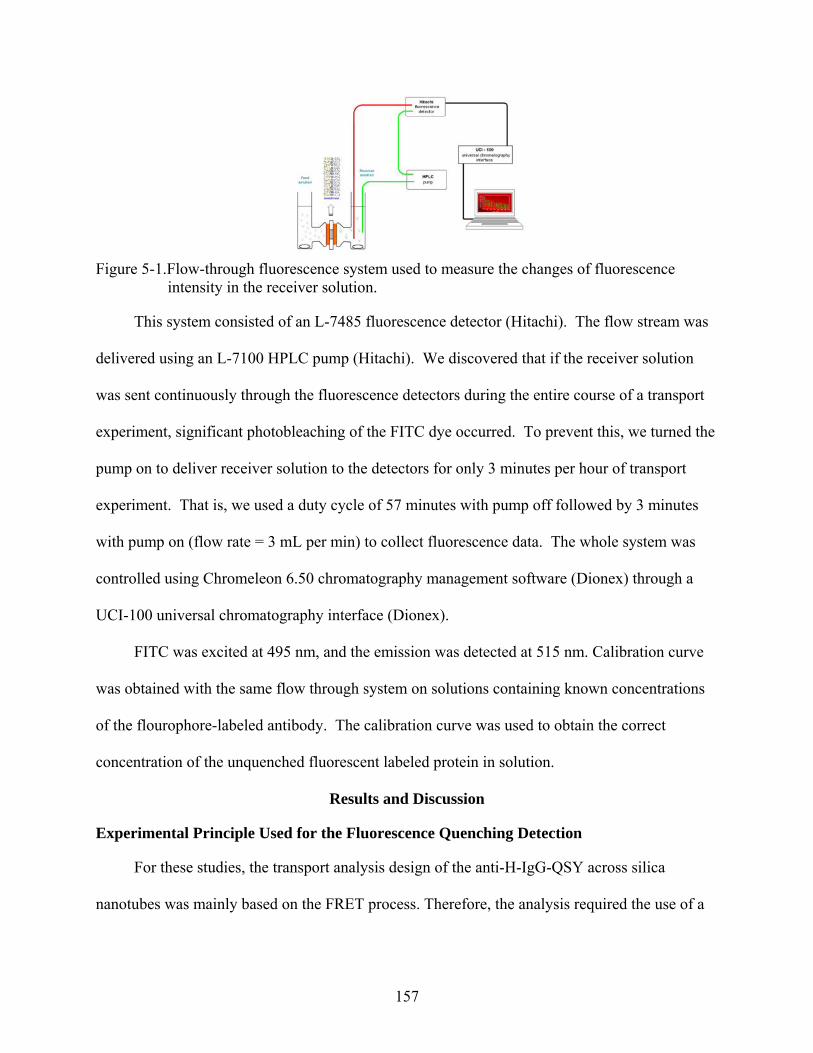
Figure 5-1.Flow-through fluorescence system used to measure the changes of fluorescence
intensity in the receiver solution.
This system consisted of an L-7485 fluorescence detector (Hitachi). The flow stream was
delivered using an L-7100 HPLC pump (Hitachi). We discovered that if the receiver solution
was sent continuously through the fluorescence detectors during the entire course of a transport
experiment, significant photobleaching of the FITC dye occurred. To prevent this, we turned the
pump on to deliver receiver solution to the detectors for only 3 minutes per hour of transport
experiment. That is, we used a duty cycle of 57 minutes with pump off followed by 3 minutes
with pump on (flow rate = 3 mL per min) to collect fluorescence data. The whole system was
controlled using Chromeleon 6.50 chromatography management software (Dionex) through a
UCI-100 universal chromatography interface (Dionex).
FITC was excited at 495 nm, and the emission was detected at 515 nm. Calibration curve
was obtained with the same flow through system on solutions containing known concentrations
of the flourophore-labeled antibody. The calibration curve was used to obtain the correct
concentration of the unquenched fluorescent labeled protein in solution.
Results and Discussion
Experimental Principle Used for the Fluorescence Quenching Detection
For these studies, the transport analysis design of the anti-H-IgG-QSY across silica
nanotubes was mainly based on the FRET process. Therefore, the analysis required the use of a
157
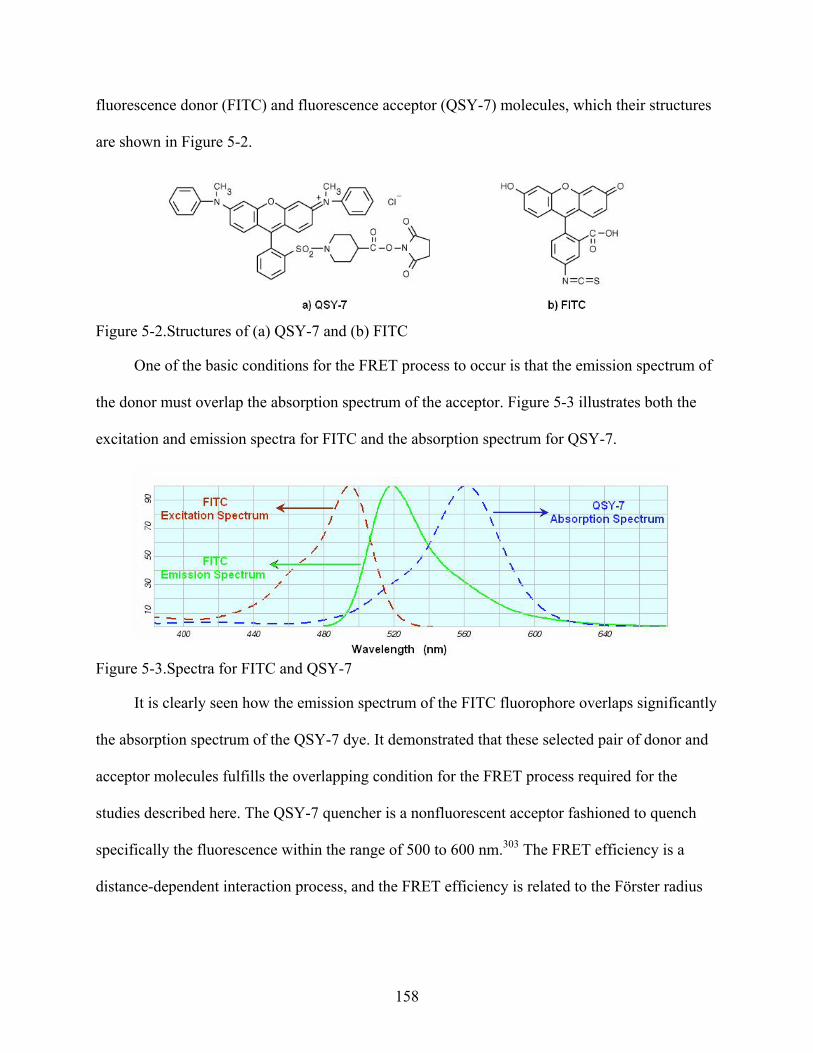
fluorescence donor (FITC) and fluorescence acceptor (QSY-7) molecules, which their structures
are shown in Figure 5-2.
Figure 5-2.Structures of (a) QSY-7 and (b) FITC
One of the basic conditions for the FRET process to occur is that the emission spectrum of
the donor must overlap the absorption spectrum of the acceptor. Figure 5-3 illustrates both the
excitation and emission spectra for FITC and the absorption spectrum for QSY-7.
Figure 5-3.Spectra for FITC and QSY-7
It is clearly seen how the emission spectrum of the FITC fluorophore overlaps significantly
the absorption spectrum of the QSY-7 dye. It demonstrated that these selected pair of donor and
acceptor molecules fulfills the overlapping condition for the FRET process required for the
studies described here. The QSY-7 quencher is a nonfluorescent acceptor fashioned to quench
specifically the fluorescence within the range of 500 to 600 nm.303 The FRET efficiency is a
distance-dependent interaction process, and the FRET efficiency is related to the Förster radius
158

(Ro), and this radius corresponds to the distance at which fluorescence resonance energy transfer
from the donor dye to the acceptor dye is 50% efficient (Equation 5-4).131, 298
quencher and efluorophorbetween distance r
1
16
0
=⇒
⎟⎟⎠
⎞⎜⎜⎝
⎛+
=
Rr
E (5-4)
The magnitude of Ro is dependent on the spectral properties of the donor and acceptor dyes
and the typical value reported for the FITC and QSY-7 pair is 61 Å.303
The suitable proximity for the fluorescence quenching process between these fluorescence
donor and acceptor molecules was accomplished through a molecular recognition reaction using
two antibodies with specific affinity for each other. This antigen-antibody immunoassay is
illustrated in Figure 5-4.
Figure 5-4.Molecular recognition reaction used to promote the fluorescence quenching.
Thus, the flux of anti-H-IgG-QSY was monitored by using a known concentration of H-
IgG-FITC as fluorescence emitter in the permeation compartment.
Verification of the Fluorescence Quenching System via H-IgG-FITC and anti-H-IgG-QSY Reaction in Solid State
In order to verify that the molecular recognition reaction between H-IgG-FITC and anti-H-
IgG-QSY leads to an inhibition of the fluorescence process, a silica nanotube membrane was
modified with H-IgG-FITC. The fluorescence signal for this modified membrane was observed
under microscope before and after six hours of exposure to a solution of anti-H-IgG-QSY that
159
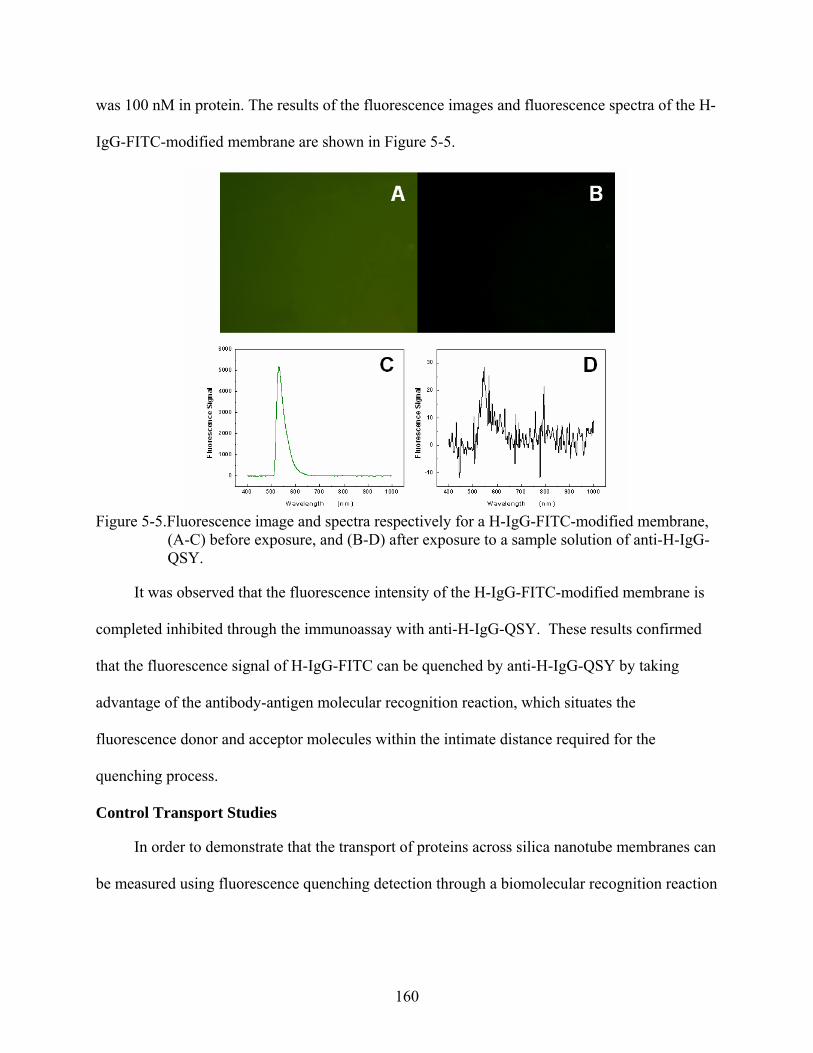
was 100 nM in protein. The results of the fluorescence images and fluorescence spectra of the H-
IgG-FITC-modified membrane are shown in Figure 5-5.
Figure 5-5.Fluorescence image and spectra respectively for a H-IgG-FITC-modified membrane,
(A-C) before exposure, and (B-D) after exposure to a sample solution of anti-H-IgG-QSY.
It was observed that the fluorescence intensity of the H-IgG-FITC-modified membrane is
completed inhibited through the immunoassay with anti-H-IgG-QSY. These results confirmed
that the fluorescence signal of H-IgG-FITC can be quenched by anti-H-IgG-QSY by taking
advantage of the antibody-antigen molecular recognition reaction, which situates the
fluorescence donor and acceptor molecules within the intimate distance required for the
quenching process.
Control Transport Studies
In order to demonstrate that the transport of proteins across silica nanotube membranes can
be measured using fluorescence quenching detection through a biomolecular recognition reaction
160
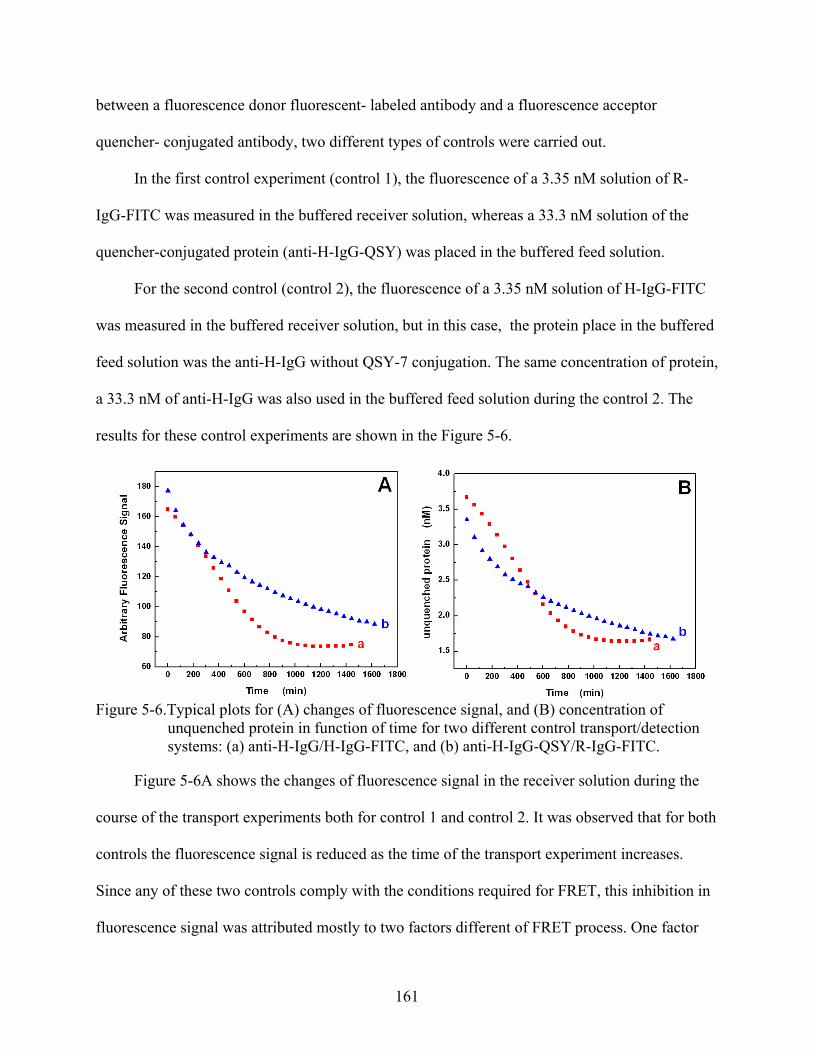
between a fluorescence donor fluorescent- labeled antibody and a fluorescence acceptor
quencher- conjugated antibody, two different types of controls were carried out.
In the first control experiment (control 1), the fluorescence of a 3.35 nM solution of R-
IgG-FITC was measured in the buffered receiver solution, whereas a 33.3 nM solution of the
quencher-conjugated protein (anti-H-IgG-QSY) was placed in the buffered feed solution.
For the second control (control 2), the fluorescence of a 3.35 nM solution of H-IgG-FITC
was measured in the buffered receiver solution, but in this case, the protein place in the buffered
feed solution was the anti-H-IgG without QSY-7 conjugation. The same concentration of protein,
a 33.3 nM of anti-H-IgG was also used in the buffered feed solution during the control 2. The
results for these control experiments are shown in the Figure 5-6.
Figure 5-6.Typical plots for (A) changes of fluorescence signal, and (B) concentration of
unquenched protein in function of time for two different control transport/detection systems: (a) anti-H-IgG/H-IgG-FITC, and (b) anti-H-IgG-QSY/R-IgG-FITC.
Figure 5-6A shows the changes of fluorescence signal in the receiver solution during the
course of the transport experiments both for control 1 and control 2. It was observed that for both
controls the fluorescence signal is reduced as the time of the transport experiment increases.
Since any of these two controls comply with the conditions required for FRET, this inhibition in
fluorescence signal was attributed mostly to two factors different of FRET process. One factor
161
was endorsed to photobleaching of the fluorophore, and the second to a partial diffusion of the
FITC-labeled proteins toward the direction of the feed solution.
By assuming that during the time of the transport experiment the degree of labeling (DL)
remains constant for the fluorescently protein, calibration data allowed us to convert these
fluorescence intensities to molar concentration of unquenched protein in the receiver solution
(Figure 5-6B). The observed variations in scale for the plots in Figure 6-6A and Figure 6-6B are
due to the difference in the DL between H-IgG-FITC and R-IgG-FITC proteins (sensitivity). The
DL for H-IgG-FITC was 4.2, whereas it was 4.7 for R-IgG-FITC.
The plots in Figure 6-6B give the impression that the deactivation of the fluorescence
intensity for these two controls was carried out via two different mechanisms. In the case of the
anti-H-IgG-QSY/R-IgG-FITC pair, it was observed that during the initial hour of the experiment
the rate of fluorescence quenching for this system was higher than for the anti-H-IgG/H-IgG-
FITC pair. Although, there is not a specific affinity for these two proteins (control 1), this effect
might be assigned to the possibility that the donor (FITC) and acceptor (QSY-7) fluorescence
label moieties in the proteins collided with each other to deactivate the fluorescence intensity
faster than the other control system, for which the presence of QSY-7 quencher is absence. The
anti-H-IgG-QSY/R-IgG-FITC pair (control 1) was chosen as the control for the transport
experiments performed through the specific molecular recognition reaction proposes in this
approach.
Effect of the Feed Solution Concentration on the Rate of Quenching
The experimental system demonstrated here, relies on the strength of the binding affinity
and interaction between the labeled antibodies to bring together the fluorophore and quencher to
an appropriated distance in order that the fluorescence quenching occurs. To study the flux
across silica nanotube membranes using this fluorescence quenching–mediated detection, we
162

carried out experiments to determine the effect of the feed solution concentration on the rate of
fluorescence quenching.
For these experiments, the concentration of H-IgG-FITC in the receiver solution was 3.35
nM in all cases, whereas three different concentrations for anti-H-IgG-QSY were used in the
feed solution. The three concentrations of anti-H-IgG-QSY were respectively, 16.6 nM, 33.3
nM, and 66.6 nM. These results are shown in Figure 5-7.
Figure 5-7.Typical plots for (A) changes of fluorescence signal and (B) concentration of
unquenched protein in function of time for three different feed solution concentrations: (a) 16.6 nM, (b) 33.3 nM, (c) 66.6 nM, and (d) 33.3 nM (control).
Figure 5-7 shows the influence of feed solution concentration on the rate of fluorescence
quenching in the receiver solution. As can be observed from Figure 6-7, transport experiments
with higher concentration of anti-H-IgG-QSY yields to a faster rate of the fluorescence
quenching. These results confirmed that the molecular recognition reaction between the labeled
antibodies generated the appropriate distance between the donor (FITC) and acceptor (QSY-7)
molecules necessary for this fluorescence quenching-mediated detection. This was also verified
by comparing this effect with the control experiment (plot d in Figure 5-7). The significant
differences in fluorescence intensity for the experiments shown in Figure 5-7were observed only
during the initial four hours of the transport experiments. After this period of time, the changes in
163
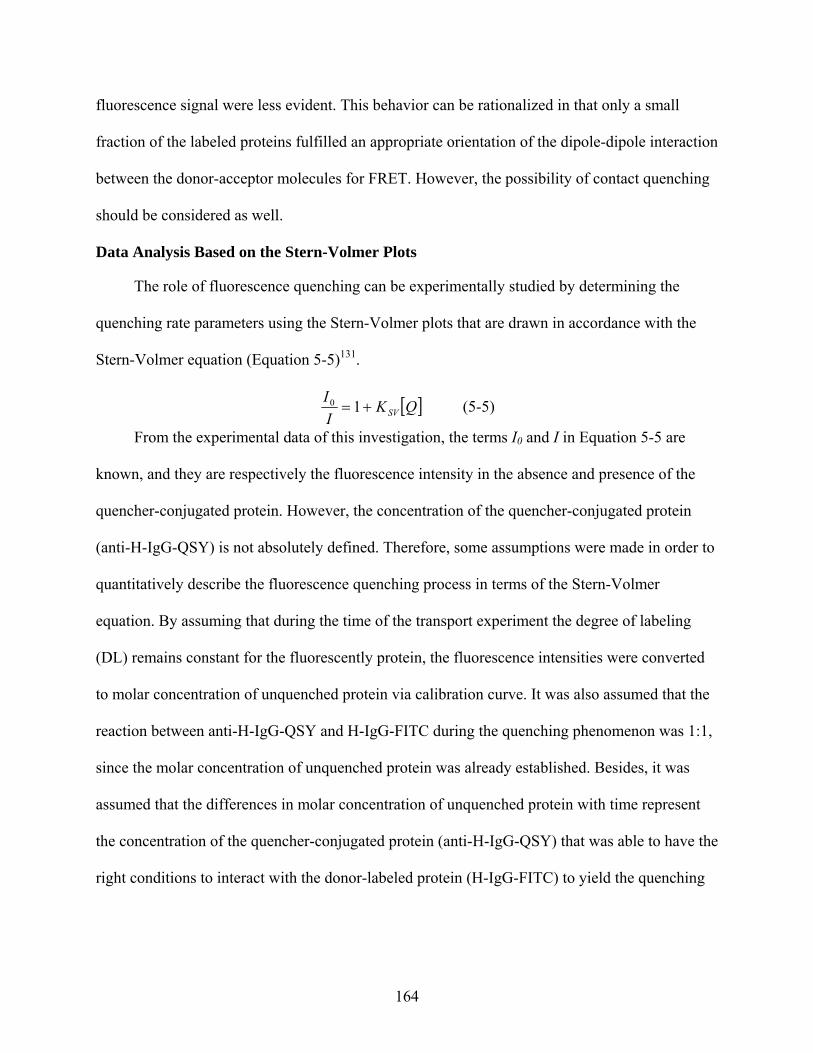
fluorescence signal were less evident. This behavior can be rationalized in that only a small
fraction of the labeled proteins fulfilled an appropriate orientation of the dipole-dipole interaction
between the donor-acceptor molecules for FRET. However, the possibility of contact quenching
should be considered as well.
Data Analysis Based on the Stern-Volmer Plots
The role of fluorescence quenching can be experimentally studied by determining the
quenching rate parameters using the Stern-Volmer plots that are drawn in accordance with the
Stern-Volmer equation (Equation 5-5)131.
[ ]QKII
SV+= 10 (5-5)
From the experimental data of this investigation, the terms I0 and I in Equation 5-5 are
known, and they are respectively the fluorescence intensity in the absence and presence of the
quencher-conjugated protein. However, the concentration of the quencher-conjugated protein
(anti-H-IgG-QSY) is not absolutely defined. Therefore, some assumptions were made in order to
quantitatively describe the fluorescence quenching process in terms of the Stern-Volmer
equation. By assuming that during the time of the transport experiment the degree of labeling
(DL) remains constant for the fluorescently protein, the fluorescence intensities were converted
to molar concentration of unquenched protein via calibration curve. It was also assumed that the
reaction between anti-H-IgG-QSY and H-IgG-FITC during the quenching phenomenon was 1:1,
since the molar concentration of unquenched protein was already established. Besides, it was
assumed that the differences in molar concentration of unquenched protein with time represent
the concentration of the quencher-conjugated protein (anti-H-IgG-QSY) that was able to have the
right conditions to interact with the donor-labeled protein (H-IgG-FITC) to yield the quenching
164
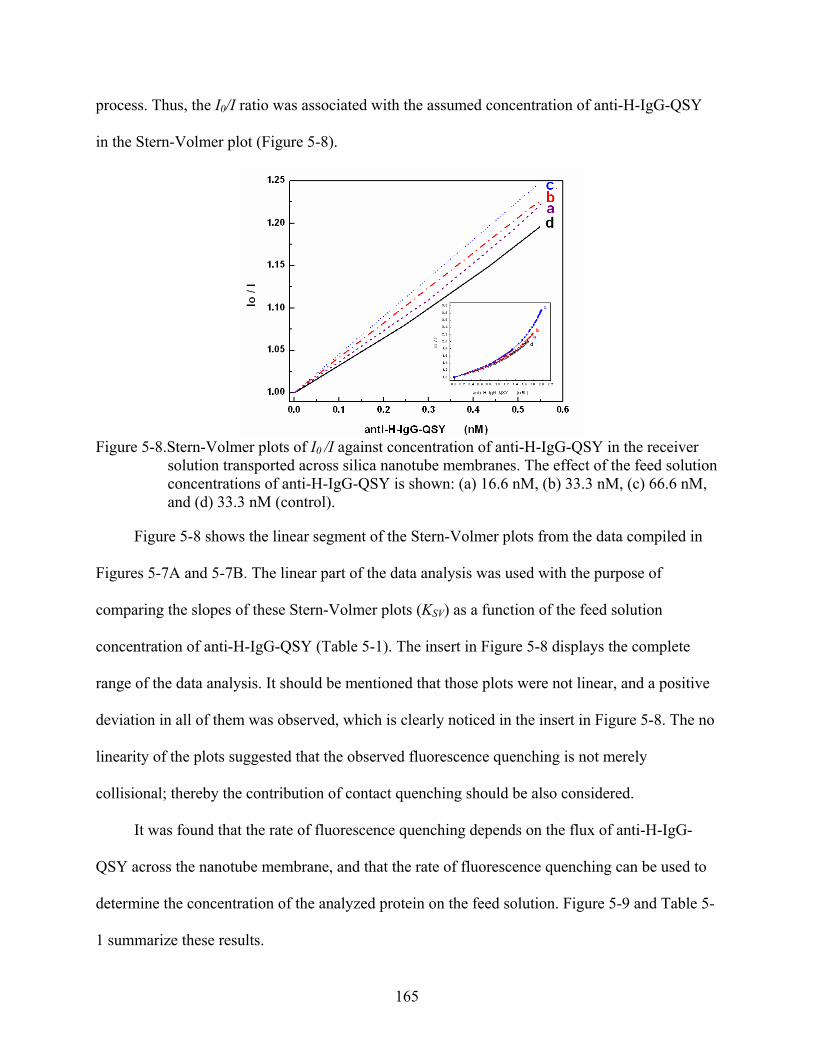
process. Thus, the I0/I ratio was associated with the assumed concentration of anti-H-IgG-QSY
in the Stern-Volmer plot (Figure 5-8).
Figure 5-8.Stern-Volmer plots of I0 /I against concentration of anti-H-IgG-QSY in the receiver
solution transported across silica nanotube membranes. The effect of the feed solution concentrations of anti-H-IgG-QSY is shown: (a) 16.6 nM, (b) 33.3 nM, (c) 66.6 nM, and (d) 33.3 nM (control).
Figure 5-8 shows the linear segment of the Stern-Volmer plots from the data compiled in
Figures 5-7A and 5-7B. The linear part of the data analysis was used with the purpose of
comparing the slopes of these Stern-Volmer plots (KSV) as a function of the feed solution
concentration of anti-H-IgG-QSY (Table 5-1). The insert in Figure 5-8 displays the complete
range of the data analysis. It should be mentioned that those plots were not linear, and a positive
deviation in all of them was observed, which is clearly noticed in the insert in Figure 5-8. The no
linearity of the plots suggested that the observed fluorescence quenching is not merely
collisional; thereby the contribution of contact quenching should be also considered.
It was found that the rate of fluorescence quenching depends on the flux of anti-H-IgG-
QSY across the nanotube membrane, and that the rate of fluorescence quenching can be used to
determine the concentration of the analyzed protein on the feed solution. Figure 5-9 and Table 5-
1 summarize these results.
165
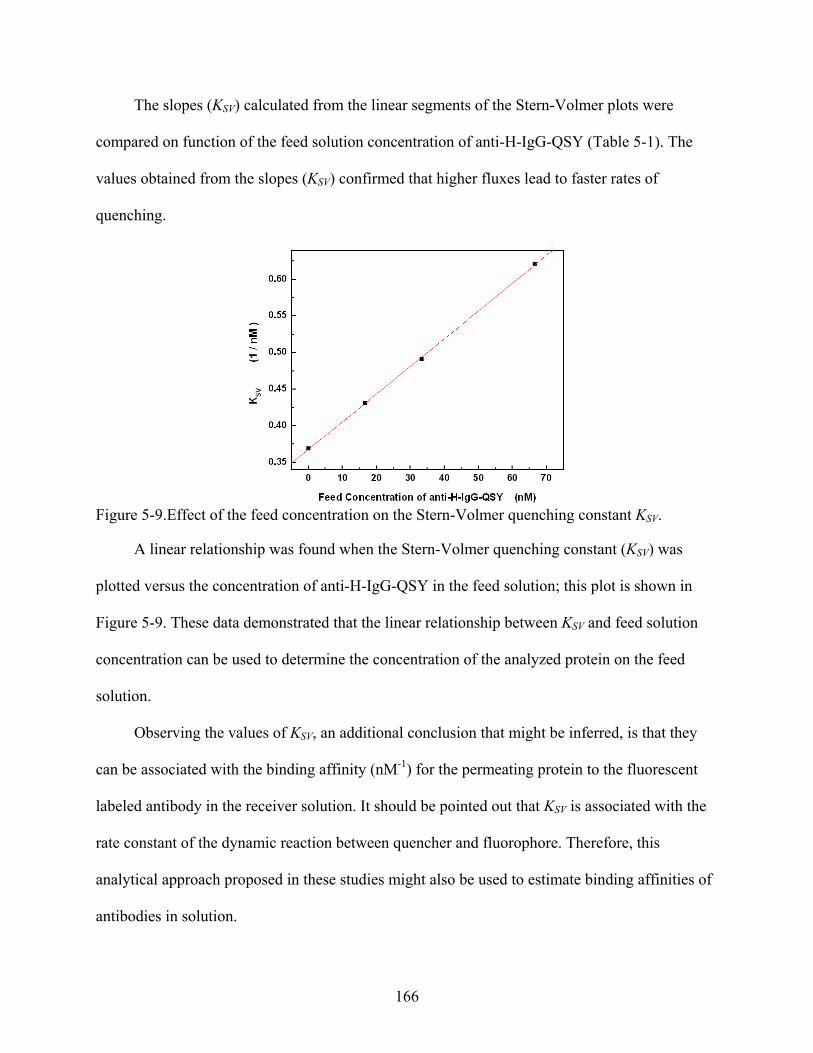
The slopes (KSV) calculated from the linear segments of the Stern-Volmer plots were
compared on function of the feed solution concentration of anti-H-IgG-QSY (Table 5-1). The
values obtained from the slopes (KSV) confirmed that higher fluxes lead to faster rates of
quenching.
Figure 5-9.Effect of the feed concentration on the Stern-Volmer quenching constant KSV.
A linear relationship was found when the Stern-Volmer quenching constant (KSV) was
plotted versus the concentration of anti-H-IgG-QSY in the feed solution; this plot is shown in
Figure 5-9. These data demonstrated that the linear relationship between KSV and feed solution
concentration can be used to determine the concentration of the analyzed protein on the feed
solution.
Observing the values of KSV, an additional conclusion that might be inferred, is that they
can be associated with the binding affinity (nM-1) for the permeating protein to the fluorescent
labeled antibody in the receiver solution. It should be pointed out that KSV is associated with the
rate constant of the dynamic reaction between quencher and fluorophore. Therefore, this
analytical approach proposed in these studies might also be used to estimate binding affinities of
antibodies in solution.
166

Table 5-1.Relationship between the Stern-Volmer quenching constant (KSV) with the feed solution concentration of anti-H-IgG-QSY
Feed Concentration of anti-H-IgG-QSY (nM) KSV (nM-1) 0 (control) 0.369
16.6 0.431 33.3 0.491 66.6 0.621
Data Analysis Based on log-log Plots of Fluorescence vs. Time
A second and much simpler analysis for the obtained data was based on the logarithmic
plots of the changes of fluorescence in function of time. The results for this analysis are shown in
Figure 5-10.
Figure 5-10.log-log plots of the of fluorescence signal vs. time showing the effect of feed
solution concentration of anti-H-IgG-QSY: (a) 16.6 nM, (b) 33.3 nM, (c) 66.6 nM, and (d) 33.3 nM (control).
The respective log-log plots of the Figure 5-7A is shown in Figure 5-10. After the
experimental data was represented in a logarithmic scale the relation between fluorescence and
time was almost linear, which confirmed that the relationship between these two physical
variables is described by a power law formula. It was observed that as the concentration of anti-
H-IgG-QSY in feed solution increases the slope of the log-log plot tends toward more negative
values as a result of faster rate of quenching. The trend observed with this simple analysis (log-
167
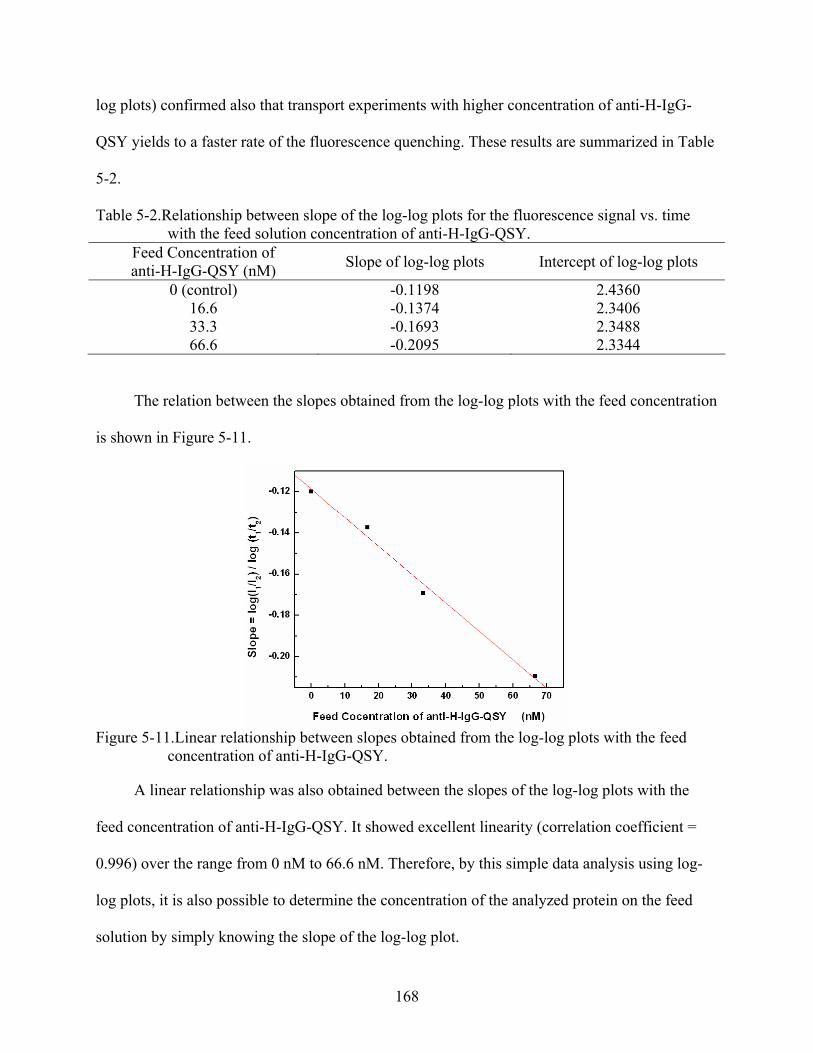
log plots) confirmed also that transport experiments with higher concentration of anti-H-IgG-
QSY yields to a faster rate of the fluorescence quenching. These results are summarized in Table
5-2.
Table 5-2.Relationship between slope of the log-log plots for the fluorescence signal vs. time with the feed solution concentration of anti-H-IgG-QSY.
Feed Concentration of anti-H-IgG-QSY (nM) Slope of log-log plots Intercept of log-log plots
0 (control) -0.1198 2.4360 16.6 -0.1374 2.3406 33.3 -0.1693 2.3488 66.6 -0.2095 2.3344
The relation between the slopes obtained from the log-log plots with the feed concentration
is shown in Figure 5-11.
Figure 5-11.Linear relationship between slopes obtained from the log-log plots with the feed
concentration of anti-H-IgG-QSY.
A linear relationship was also obtained between the slopes of the log-log plots with the
feed concentration of anti-H-IgG-QSY. It showed excellent linearity (correlation coefficient =
0.996) over the range from 0 nM to 66.6 nM. Therefore, by this simple data analysis using log-
log plots, it is also possible to determine the concentration of the analyzed protein on the feed
solution by simply knowing the slope of the log-log plot.
168
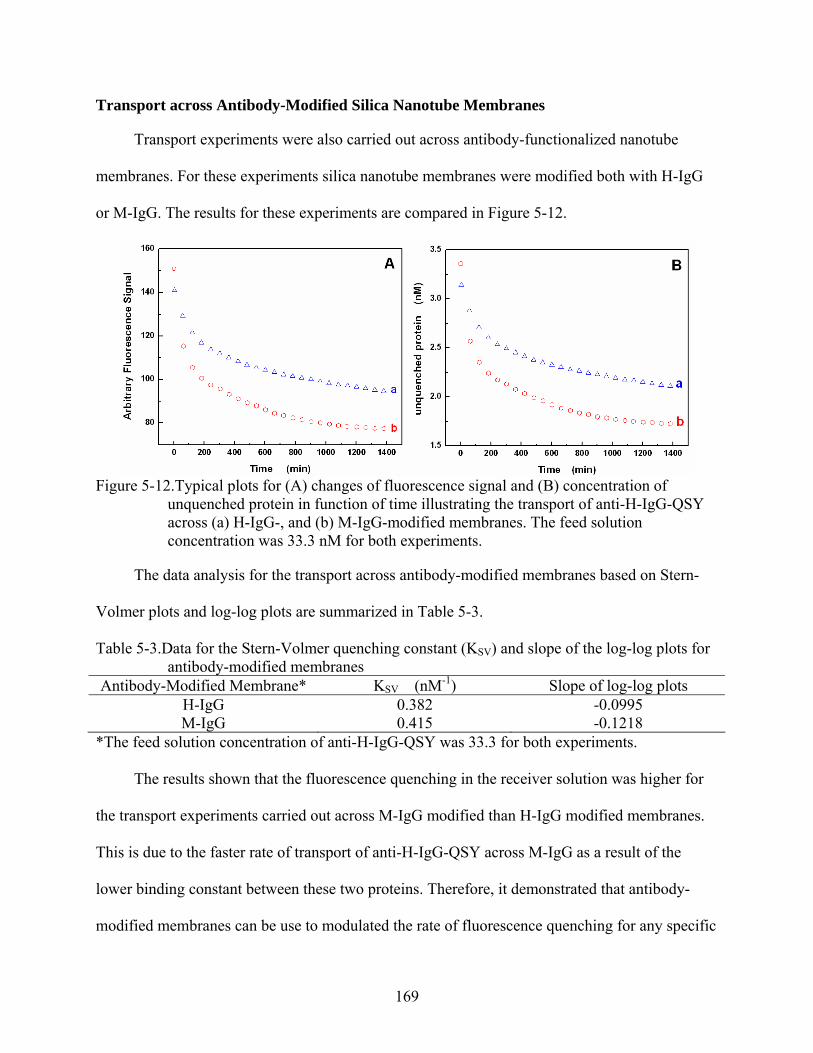
Transport across Antibody-Modified Silica Nanotube Membranes
Transport experiments were also carried out across antibody-functionalized nanotube
membranes. For these experiments silica nanotube membranes were modified both with H-IgG
or M-IgG. The results for these experiments are compared in Figure 5-12.
Figure 5-12.Typical plots for (A) changes of fluorescence signal and (B) concentration of
unquenched protein in function of time illustrating the transport of anti-H-IgG-QSY across (a) H-IgG-, and (b) M-IgG-modified membranes. The feed solution concentration was 33.3 nM for both experiments.
The data analysis for the transport across antibody-modified membranes based on Stern-
Volmer plots and log-log plots are summarized in Table 5-3.
Table 5-3.Data for the Stern-Volmer quenching constant (KSV) and slope of the log-log plots for antibody-modified membranes
Antibody-Modified Membrane* KSV (nM-1) Slope of log-log plots H-IgG 0.382 -0.0995 M-IgG 0.415 -0.1218
*The feed solution concentration of anti-H-IgG-QSY was 33.3 for both experiments.
The results shown that the fluorescence quenching in the receiver solution was higher for
the transport experiments carried out across M-IgG modified than H-IgG modified membranes.
This is due to the faster rate of transport of anti-H-IgG-QSY across M-IgG as a result of the
lower binding constant between these two proteins. Therefore, it demonstrated that antibody-
modified membranes can be use to modulated the rate of fluorescence quenching for any specific
169
pair of quencher-fluorophore labeled antibodies. These results confirmed that the observed
fluorescence quenching phenomenon is a result of the biomolecular recognition reaction between
anti-H-IgG-QSY and H-IgG-FITC in the receiver solution.
Conclusions
It was described a new method to study transport of proteins across silica nanotube
membranes by using a fluorescence quenching-based sensing approach. This analysis was
accomplished by simply observing the fluorescence quenching of a donor-fluorescent labeled
protein (H-IgG-FITC) in the receiver solution after immunoassay reaction with the transported
acceptor-fluorescent conjugated protein (anti-H-IgG-QSY). The flux of anti-Human IgG
conjugated with the quencher QSY-7 (anti-H-IgG-QSY) was monitored by observing the
changes in fluorescence of a known concentration of Human IgG FITC-labeled (H-IgG-FITC) in
the receiver solution. The rate of fluorescence quenching was studied both in the absence and the
presence of quencher labeled protein transported across of bare silica nanotube membranes and
antibody-modified membranes. It was demonstrated that the rate of fluorescence quenching
depends on the flux of anti-H-IgG-QSY across the nanotube membrane, and that the rate of
fluorescence quenching can be used to determine the concentration of the analyzed protein on the
feed solution.
170
CHAPTER 6 HYBRIDIZATION STUDIES OF DNA IN A PNA-MODIFIED NANOTUBE MEMBRANE
PLATFORM
Introduction
The development of DNA-sensors devices have attracted substantial research efforts
directed to gene analysis, detection of genetic disorders, analysis of single nucleotide
polymorphism in genes, tissue matching and forensic applications among others.304 - 307 Various
techniques, including quartz crystal microbalance,308 electrochemical,309 fluorescence,310
electrophoretic,311 electrochemiluminescence,312 enzymatic,313 surface plasmon resonance,314 and
atomic force microscopy,315 have been developed to detect DNA hybridization. However, the
label-free detection methods have attracted more interest than other methods because they can be
simple, rapid, highly sensitive, and inexpensive.307
In 1953, Watson and Crick proposed a model for the structure of DNA.316 This model
predicted that DNA would exist as a helix of two complementary anti-parallel strands.
Soon after the first description of the double helix by Watson and Crick, it was shown, that
the two strands could be separated by heat or treatment with alkali. The reverse process, which
underlies all the methods based on DNA renaturation or molecular hybridization, was first
described by Marmur and Doty.317 It was quickly established that the two sequences involved in
duplex formation must have some degree of sequence complementarity and that the stability of
the duplex formed depends on the extent of complementarity. These remarkable properties
suggested ways to analyze relationships between nucleic acid sequences, and analytical methods
based on molecular hybridization. Since then, these methods have been rapidly developed and
applied to a variety of biological malfunctions.
Base-pairing (A-T and G-C) or hybridization is the underlying principle of DNA-sensors,
namely the strong interaction between two complementary strands. Accordingly, such devices
171
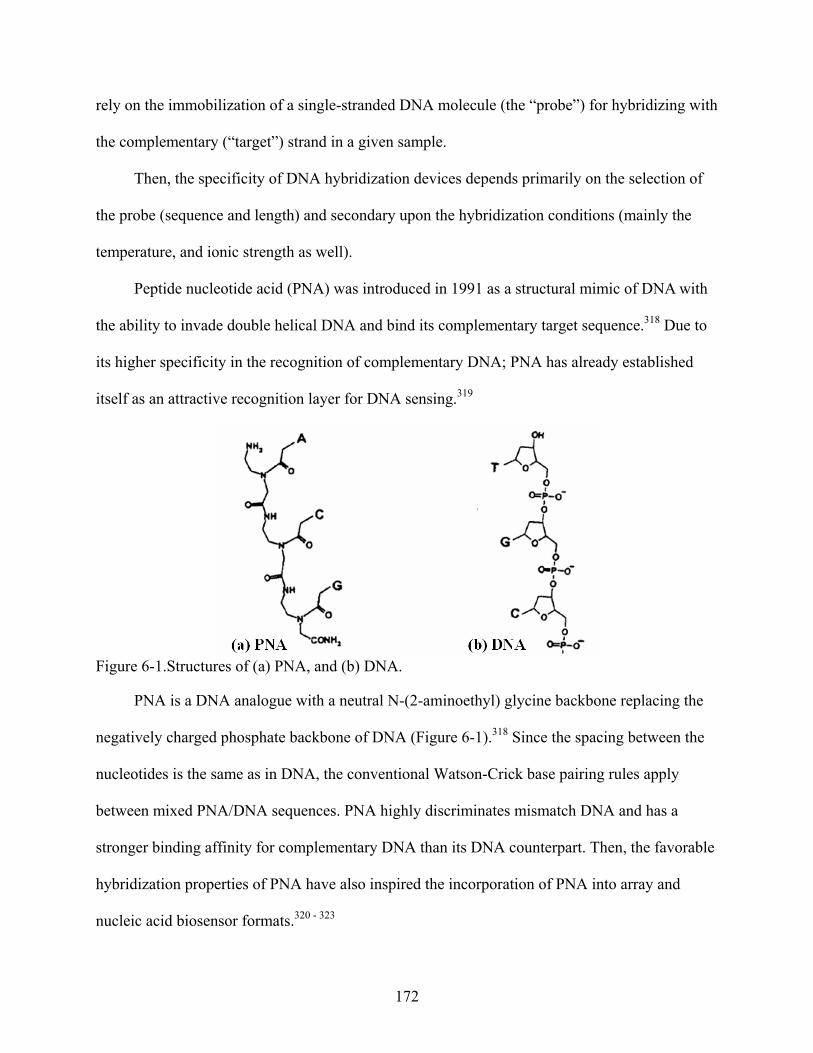
rely on the immobilization of a single-stranded DNA molecule (the “probe”) for hybridizing with
the complementary (“target”) strand in a given sample.
Then, the specificity of DNA hybridization devices depends primarily on the selection of
the probe (sequence and length) and secondary upon the hybridization conditions (mainly the
temperature, and ionic strength as well).
Peptide nucleotide acid (PNA) was introduced in 1991 as a structural mimic of DNA with
the ability to invade double helical DNA and bind its complementary target sequence.318 Due to
its higher specificity in the recognition of complementary DNA; PNA has already established
itself as an attractive recognition layer for DNA sensing.319
Figure 6-1.Structures of (a) PNA, and (b) DNA.
PNA is a DNA analogue with a neutral N-(2-aminoethyl) glycine backbone replacing the
negatively charged phosphate backbone of DNA (Figure 6-1).318 Since the spacing between the
nucleotides is the same as in DNA, the conventional Watson-Crick base pairing rules apply
between mixed PNA/DNA sequences. PNA highly discriminates mismatch DNA and has a
stronger binding affinity for complementary DNA than its DNA counterpart. Then, the favorable
hybridization properties of PNA have also inspired the incorporation of PNA into array and
nucleic acid biosensor formats.320 - 323
172
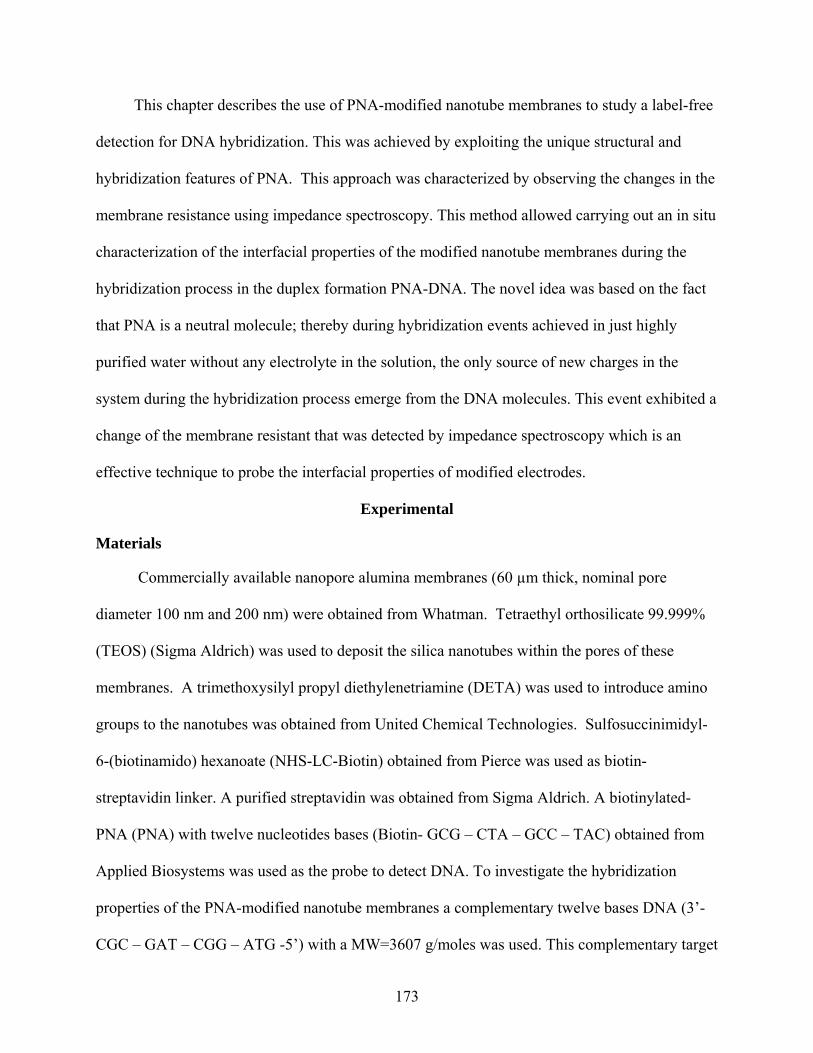
This chapter describes the use of PNA-modified nanotube membranes to study a label-free
detection for DNA hybridization. This was achieved by exploiting the unique structural and
hybridization features of PNA. This approach was characterized by observing the changes in the
membrane resistance using impedance spectroscopy. This method allowed carrying out an in situ
characterization of the interfacial properties of the modified nanotube membranes during the
hybridization process in the duplex formation PNA-DNA. The novel idea was based on the fact
that PNA is a neutral molecule; thereby during hybridization events achieved in just highly
purified water without any electrolyte in the solution, the only source of new charges in the
system during the hybridization process emerge from the DNA molecules. This event exhibited a
change of the membrane resistant that was detected by impedance spectroscopy which is an
effective technique to probe the interfacial properties of modified electrodes.
Experimental
Materials
Commercially available nanopore alumina membranes (60 µm thick, nominal pore
diameter 100 nm and 200 nm) were obtained from Whatman. Tetraethyl orthosilicate 99.999%
(TEOS) (Sigma Aldrich) was used to deposit the silica nanotubes within the pores of these
membranes. A trimethoxysilyl propyl diethylenetriamine (DETA) was used to introduce amino
groups to the nanotubes was obtained from United Chemical Technologies. Sulfosuccinimidyl-
6-(biotinamido) hexanoate (NHS-LC-Biotin) obtained from Pierce was used as biotin-
streptavidin linker. A purified streptavidin was obtained from Sigma Aldrich. A biotinylated-
PNA (PNA) with twelve nucleotides bases (Biotin- GCG – CTA – GCC – TAC) obtained from
Applied Biosystems was used as the probe to detect DNA. To investigate the hybridization
properties of the PNA-modified nanotube membranes a complementary twelve bases DNA (3’-
CGC – GAT – CGG – ATG -5’) with a MW=3607 g/moles was used. This complementary target
173
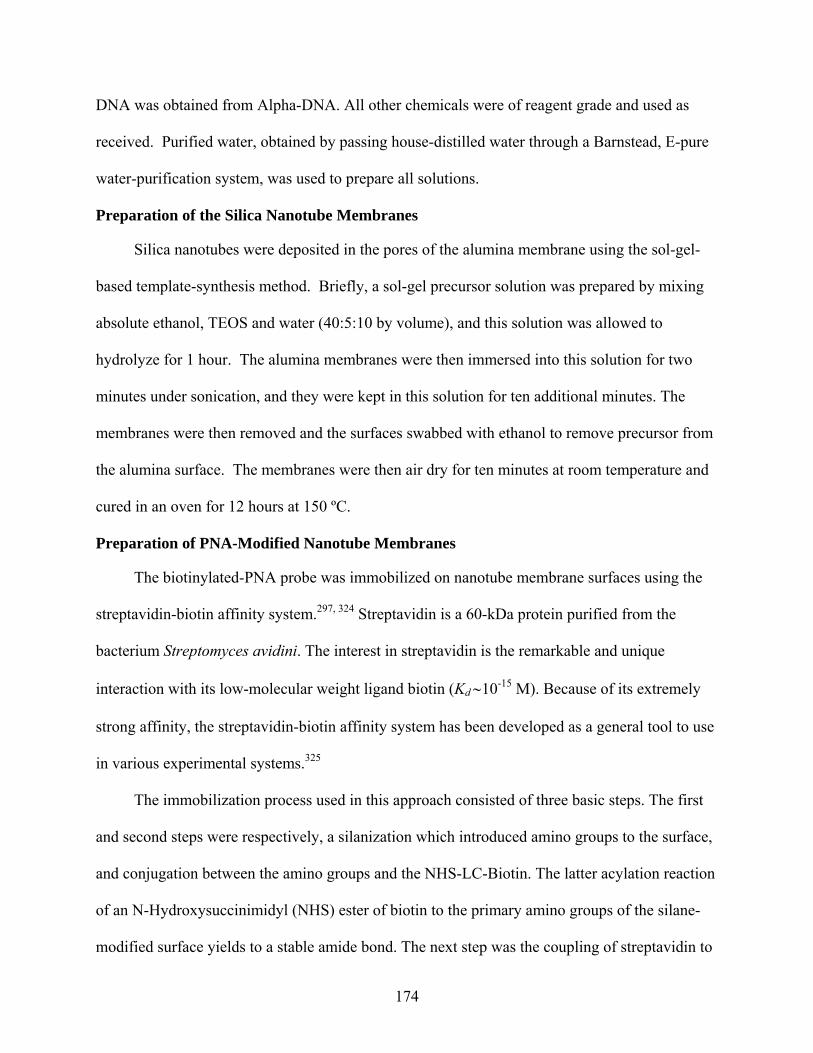
DNA was obtained from Alpha-DNA. All other chemicals were of reagent grade and used as
received. Purified water, obtained by passing house-distilled water through a Barnstead, E-pure
water-purification system, was used to prepare all solutions.
Preparation of the Silica Nanotube Membranes
Silica nanotubes were deposited in the pores of the alumina membrane using the sol-gel-
based template-synthesis method. Briefly, a sol-gel precursor solution was prepared by mixing
absolute ethanol, TEOS and water (40:5:10 by volume), and this solution was allowed to
hydrolyze for 1 hour. The alumina membranes were then immersed into this solution for two
minutes under sonication, and they were kept in this solution for ten additional minutes. The
membranes were then removed and the surfaces swabbed with ethanol to remove precursor from
the alumina surface. The membranes were then air dry for ten minutes at room temperature and
cured in an oven for 12 hours at 150 ºC.
Preparation of PNA-Modified Nanotube Membranes
The biotinylated-PNA probe was immobilized on nanotube membrane surfaces using the
streptavidin-biotin affinity system.297, 324 Streptavidin is a 60-kDa protein purified from the
bacterium Streptomyces avidini. The interest in streptavidin is the remarkable and unique
interaction with its low-molecular weight ligand biotin (Kd ∼10-15 M). Because of its extremely
strong affinity, the streptavidin-biotin affinity system has been developed as a general tool to use
in various experimental systems.325
The immobilization process used in this approach consisted of three basic steps. The first
and second steps were respectively, a silanization which introduced amino groups to the surface,
and conjugation between the amino groups and the NHS-LC-Biotin. The latter acylation reaction
of an N-Hydroxysuccinimidyl (NHS) ester of biotin to the primary amino groups of the silane-
modified surface yields to a stable amide bond. The next step was the coupling of streptavidin to
174
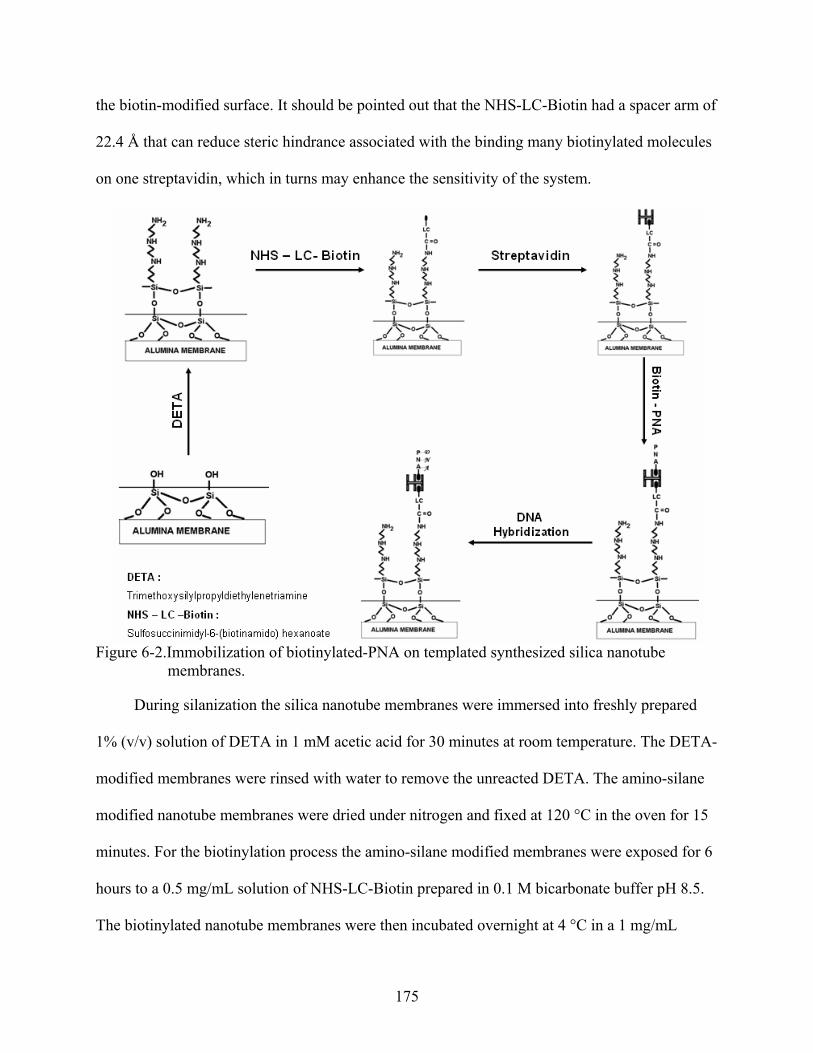
the biotin-modified surface. It should be pointed out that the NHS-LC-Biotin had a spacer arm of
22.4 Å that can reduce steric hindrance associated with the binding many biotinylated molecules
on one streptavidin, which in turns may enhance the sensitivity of the system.
Figure 6-2.Immobilization of biotinylated-PNA on templated synthesized silica nanotube
membranes.
During silanization the silica nanotube membranes were immersed into freshly prepared
1% (v/v) solution of DETA in 1 mM acetic acid for 30 minutes at room temperature. The DETA-
modified membranes were rinsed with water to remove the unreacted DETA. The amino-silane
modified nanotube membranes were dried under nitrogen and fixed at 120 °C in the oven for 15
minutes. For the biotinylation process the amino-silane modified membranes were exposed for 6
hours to a 0.5 mg/mL solution of NHS-LC-Biotin prepared in 0.1 M bicarbonate buffer pH 8.5.
The biotinylated nanotube membranes were then incubated overnight at 4 °C in a 1 mg/mL
175
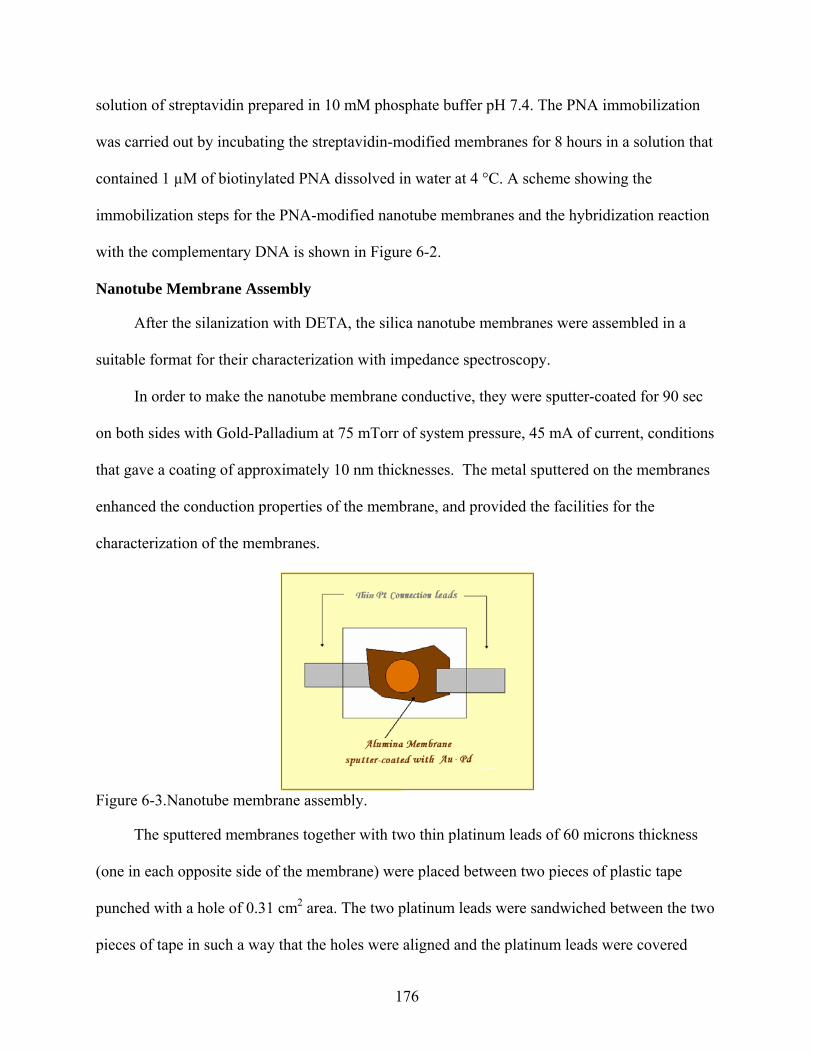
solution of streptavidin prepared in 10 mM phosphate buffer pH 7.4. The PNA immobilization
was carried out by incubating the streptavidin-modified membranes for 8 hours in a solution that
contained 1 µM of biotinylated PNA dissolved in water at 4 °C. A scheme showing the
immobilization steps for the PNA-modified nanotube membranes and the hybridization reaction
with the complementary DNA is shown in Figure 6-2.
Nanotube Membrane Assembly
After the silanization with DETA, the silica nanotube membranes were assembled in a
suitable format for their characterization with impedance spectroscopy.
In order to make the nanotube membrane conductive, they were sputter-coated for 90 sec
on both sides with Gold-Palladium at 75 mTorr of system pressure, 45 mA of current, conditions
that gave a coating of approximately 10 nm thicknesses. The metal sputtered on the membranes
enhanced the conduction properties of the membrane, and provided the facilities for the
characterization of the membranes.
Figure 6-3.Nanotube membrane assembly.
The sputtered membranes together with two thin platinum leads of 60 microns thickness
(one in each opposite side of the membrane) were placed between two pieces of plastic tape
punched with a hole of 0.31 cm2 area. The two platinum leads were sandwiched between the two
pieces of tape in such a way that the holes were aligned and the platinum leads were covered
176
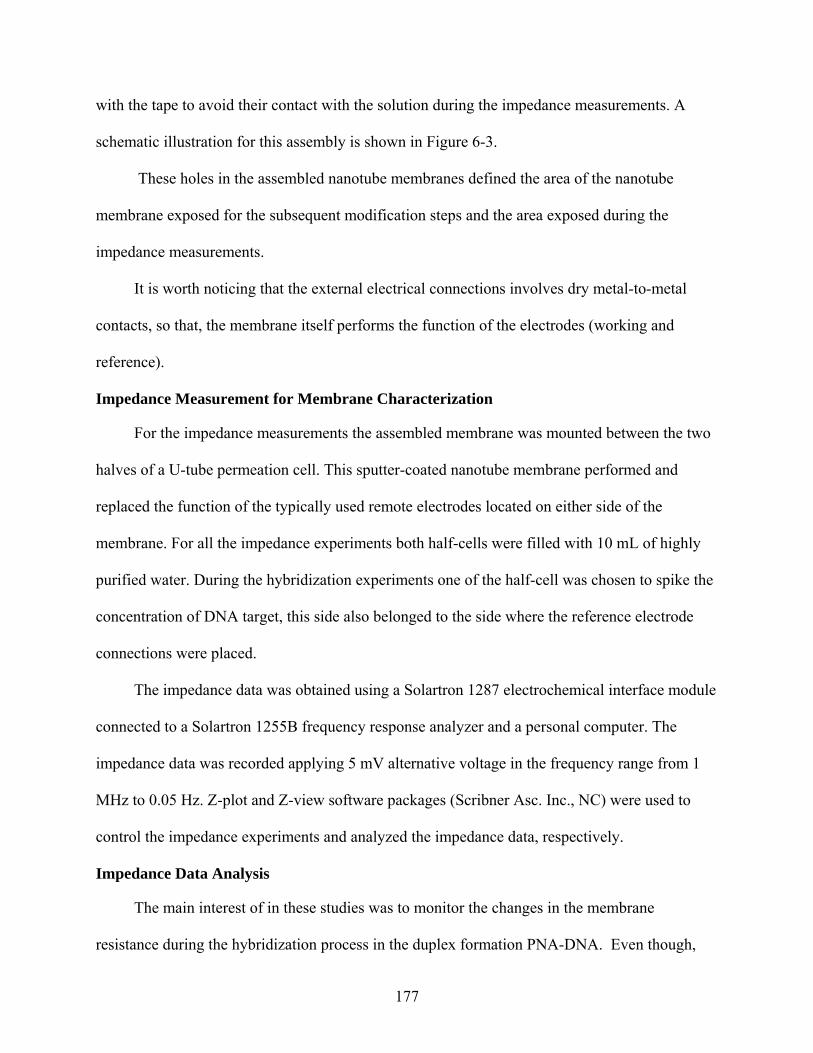
with the tape to avoid their contact with the solution during the impedance measurements. A
schematic illustration for this assembly is shown in Figure 6-3.
These holes in the assembled nanotube membranes defined the area of the nanotube
membrane exposed for the subsequent modification steps and the area exposed during the
impedance measurements.
It is worth noticing that the external electrical connections involves dry metal-to-metal
contacts, so that, the membrane itself performs the function of the electrodes (working and
reference).
Impedance Measurement for Membrane Characterization
For the impedance measurements the assembled membrane was mounted between the two
halves of a U-tube permeation cell. This sputter-coated nanotube membrane performed and
replaced the function of the typically used remote electrodes located on either side of the
membrane. For all the impedance experiments both half-cells were filled with 10 mL of highly
purified water. During the hybridization experiments one of the half-cell was chosen to spike the
concentration of DNA target, this side also belonged to the side where the reference electrode
connections were placed.
The impedance data was obtained using a Solartron 1287 electrochemical interface module
connected to a Solartron 1255B frequency response analyzer and a personal computer. The
impedance data was recorded applying 5 mV alternative voltage in the frequency range from 1
MHz to 0.05 Hz. Z-plot and Z-view software packages (Scribner Asc. Inc., NC) were used to
control the impedance experiments and analyzed the impedance data, respectively.
Impedance Data Analysis
The main interest of in these studies was to monitor the changes in the membrane
resistance during the hybridization process in the duplex formation PNA-DNA. Even though,
177
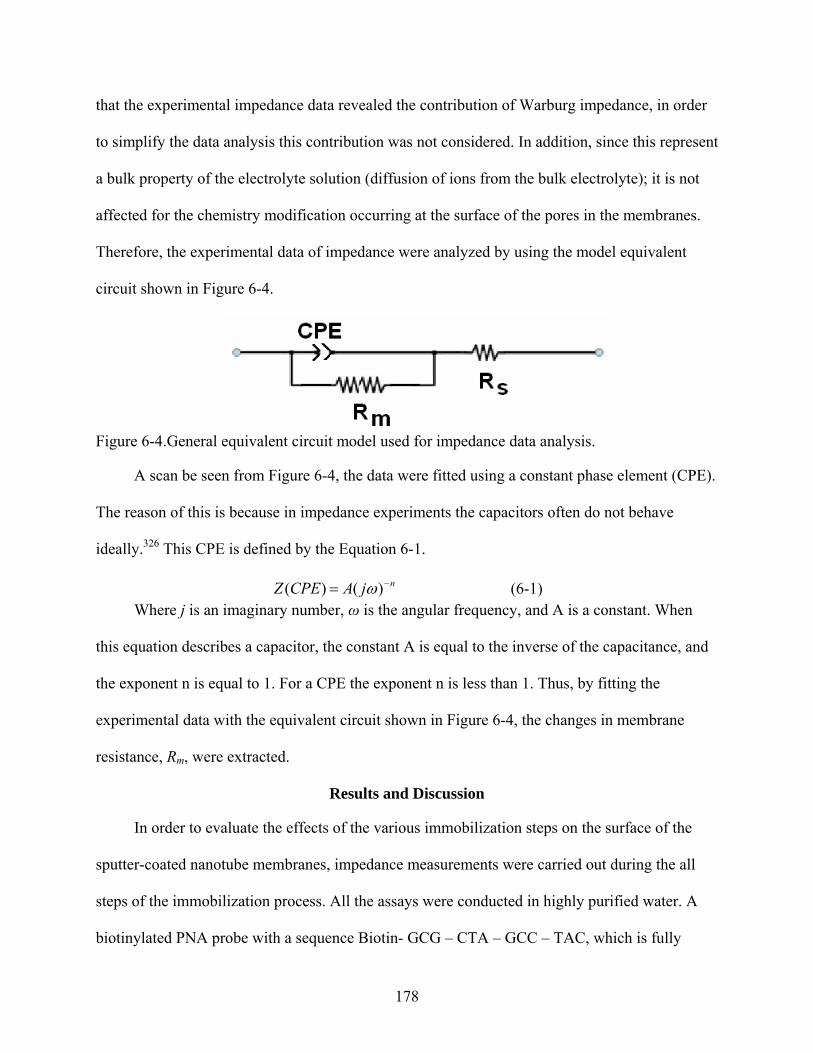
that the experimental impedance data revealed the contribution of Warburg impedance, in order
to simplify the data analysis this contribution was not considered. In addition, since this represent
a bulk property of the electrolyte solution (diffusion of ions from the bulk electrolyte); it is not
affected for the chemistry modification occurring at the surface of the pores in the membranes.
Therefore, the experimental data of impedance were analyzed by using the model equivalent
circuit shown in Figure 6-4.
Figure 6-4.General equivalent circuit model used for impedance data analysis.
A scan be seen from Figure 6-4, the data were fitted using a constant phase element (CPE).
The reason of this is because in impedance experiments the capacitors often do not behave
ideally.326 This CPE is defined by the Equation 6-1.
njACPEZ −= )()( ω (6-1) Where j is an imaginary number, ω is the angular frequency, and A is a constant. When
this equation describes a capacitor, the constant A is equal to the inverse of the capacitance, and
the exponent n is equal to 1. For a CPE the exponent n is less than 1. Thus, by fitting the
experimental data with the equivalent circuit shown in Figure 6-4, the changes in membrane
resistance, Rm, were extracted.
Results and Discussion
In order to evaluate the effects of the various immobilization steps on the surface of the
sputter-coated nanotube membranes, impedance measurements were carried out during the all
steps of the immobilization process. All the assays were conducted in highly purified water. A
biotinylated PNA probe with a sequence Biotin- GCG – CTA – GCC – TAC, which is fully
178

complementary to the DNA target with a sequence 3’- CGC – GAT – CGG – ATG -5’, was used
as receptor in the nanotube membrane sensing-platform. These studies begin, however, with the
impedance measurements for the alumina template, and silica nanotube membranes and
investigations of the equilibration times required for the impedance measurements.
Impedance Characterization of the Unmodified Membranes
The Nyquist plots for bare alumina template (200 nm nominal pore size) and silica
nanotube membranes are shown in Figure 6-5. The x-axis and y-axis in this plot corresponds to
real impedance, Zre, and imaginary impedance, Zim, respectively. Zre and Zim are mainly
originated from the resistance and capacitance of the cell system, respectively.
Figure 6-5.Nyquist plots (Zim vs. Zre) for impedance measurement of (a) alumina and (b) silica-
nanotube assembled membranes in highly purified water.
As shown in Figure 6-5, changes after the deposition of the silica nanotubes in the alumina
template were observed in semicircle part at high frequency region (usually associated with
kinetic controlled process), whereas the linear tail at lower frequencies (usually associated with
mass transfer process) maintained almost the same slope. The variations in the high frequency
region were probably due to a change in the isoelectric point (pI) of the nanotube membrane.
Since it is known that the pI of the alumina membranes range from 6.9 to 10.5, while the pI for
179
silica has been ranged from 1.9 to 4.5.327 Because of the different electrical characteristics of
these materials, a change in the surface characteristics of the membranes should be expected
when silica nanotubes are synthesized within the alumina membrane, as was observed in the
Nyquist plots in Figure 6-5.
In order to assess the stability of the impedance measurements a study of the wettability of
the bare alumina membrane was carried out by monitoring the changes in resistance with the
time. These results are summarized in Figure 6-7.
Figure 6-7.Effect of the wetting time on the resistance impedance measurement for an assembled
unmodified alumina membrane 200 nm pore diameter.
As can be seen from Figure 6-7, the changes in resistance from impedance measurements
of alumina membrane were pretty stable with the time. These results confirmed the stability of
the sputter-coated membranes and the stability itself of the impedance measurements.
Functionalization of the Silica nanotube Membranes
The differences in membrane resistance before and after each modification step during the
immobilization process were analyzed in order to characterize the accomplishment of the various
modifications (Figure 6-8). The obtained values of Rm from the Nyquist plots in Figure 6-8 are
compiled in Table 6-1.
180

The results revealed that the different immobilization steps introduced significant changes
in the membrane resistance. The most significant change was found in the membrane resistance
associated with the hybridization process of DNA with the PNA-modified nanotube membrane.
This decrease in resistance was associated with the increase of negative surface charge density
due to the duplex formation PNA-DNA on the surface.
Figure 6-8. Nyquist plots (Zim vs. Zre) of impedance measurement in highly purified water: (a)
alumina, (b) after synthesis of silica-nanotube, (c) after silanization, (d) after biotinylation, (e) after streptavidin immobilization, (f) after PNA immobilization, and (g) after DNA hybridization. The plots were recorded applying 5 mV alternative voltage in the frequency range from 1 MHz to 0.05 Hz.
The increase of Rm after the deposition of silica nanotubes was consistent with the fact that
after deposition smaller effective pore size in the membrane might be reached. Conversely, the
decrease in membrane resistance after silanization was explained through the formation of
protonated amino groups on the surface at the pH of the experiment (highly purified water).
However, part of this amino protonated groups were neutralized by the conjugation reaction with
the biotin linker, which was confirmed for the increase in resistance after the biotinylation. The
181
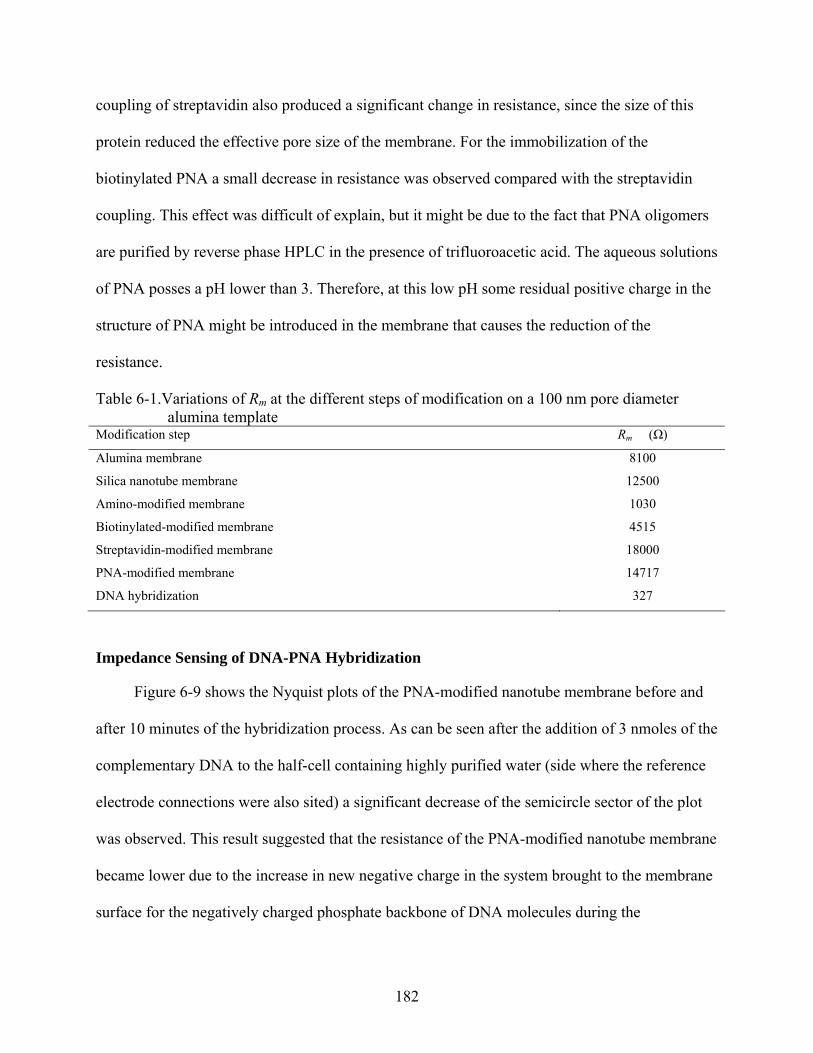
coupling of streptavidin also produced a significant change in resistance, since the size of this
protein reduced the effective pore size of the membrane. For the immobilization of the
biotinylated PNA a small decrease in resistance was observed compared with the streptavidin
coupling. This effect was difficult of explain, but it might be due to the fact that PNA oligomers
are purified by reverse phase HPLC in the presence of trifluoroacetic acid. The aqueous solutions
of PNA posses a pH lower than 3. Therefore, at this low pH some residual positive charge in the
structure of PNA might be introduced in the membrane that causes the reduction of the
resistance.
Table 6-1.Variations of Rm at the different steps of modification on a 100 nm pore diameter alumina template
Modification step Rm (Ω)
Alumina membrane 8100
Silica nanotube membrane 12500
Amino-modified membrane 1030
Biotinylated-modified membrane 4515
Streptavidin-modified membrane 18000
PNA-modified membrane 14717
DNA hybridization 327
Impedance Sensing of DNA-PNA Hybridization
Figure 6-9 shows the Nyquist plots of the PNA-modified nanotube membrane before and
after 10 minutes of the hybridization process. As can be seen after the addition of 3 nmoles of the
complementary DNA to the half-cell containing highly purified water (side where the reference
electrode connections were also sited) a significant decrease of the semicircle sector of the plot
was observed. This result suggested that the resistance of the PNA-modified nanotube membrane
became lower due to the increase in new negative charge in the system brought to the membrane
surface for the negatively charged phosphate backbone of DNA molecules during the
182
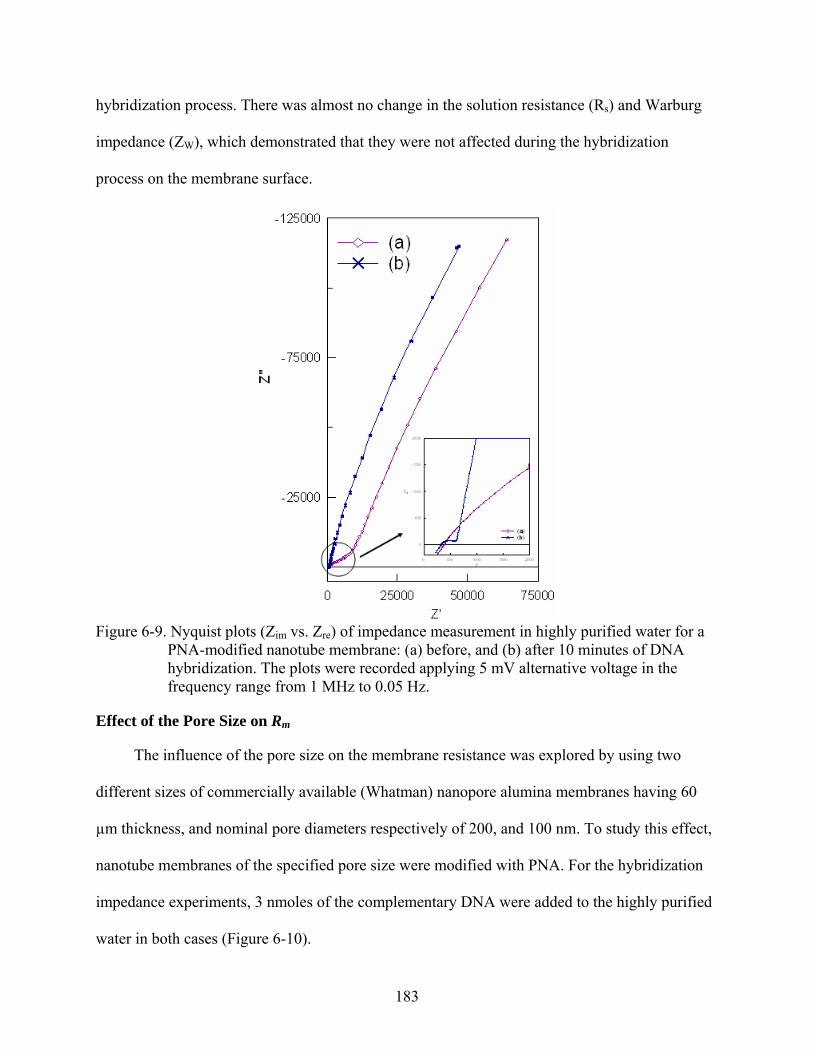
hybridization process. There was almost no change in the solution resistance (Rs) and Warburg
impedance (ZW), which demonstrated that they were not affected during the hybridization
process on the membrane surface.
Figure 6-9. Nyquist plots (Zim vs. Zre) of impedance measurement in highly purified water for a
PNA-modified nanotube membrane: (a) before, and (b) after 10 minutes of DNA hybridization. The plots were recorded applying 5 mV alternative voltage in the frequency range from 1 MHz to 0.05 Hz.
Effect of the Pore Size on Rm
The influence of the pore size on the membrane resistance was explored by using two
different sizes of commercially available (Whatman) nanopore alumina membranes having 60
µm thickness, and nominal pore diameters respectively of 200, and 100 nm. To study this effect,
nanotube membranes of the specified pore size were modified with PNA. For the hybridization
impedance experiments, 3 nmoles of the complementary DNA were added to the highly purified
water in both cases (Figure 6-10).
183
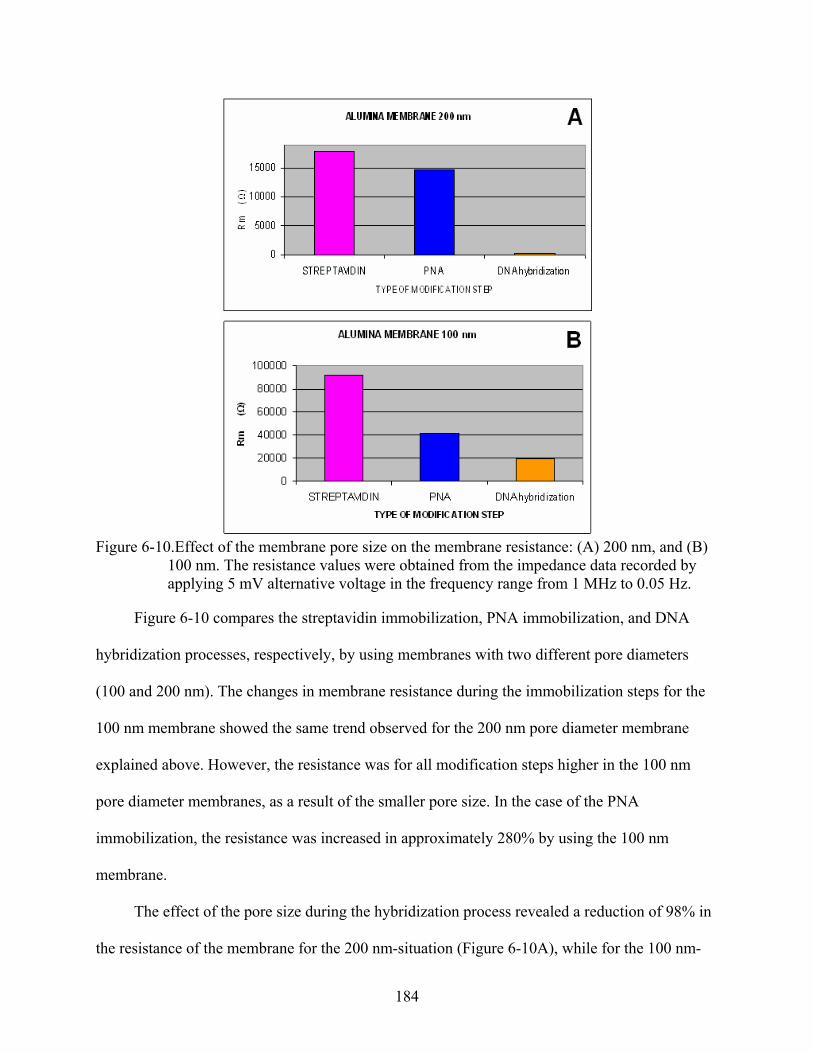
Figure 6-10.Effect of the membrane pore size on the membrane resistance: (A) 200 nm, and (B)
100 nm. The resistance values were obtained from the impedance data recorded by applying 5 mV alternative voltage in the frequency range from 1 MHz to 0.05 Hz.
Figure 6-10 compares the streptavidin immobilization, PNA immobilization, and DNA
hybridization processes, respectively, by using membranes with two different pore diameters
(100 and 200 nm). The changes in membrane resistance during the immobilization steps for the
100 nm membrane showed the same trend observed for the 200 nm pore diameter membrane
explained above. However, the resistance was for all modification steps higher in the 100 nm
pore diameter membranes, as a result of the smaller pore size. In the case of the PNA
immobilization, the resistance was increased in approximately 280% by using the 100 nm
membrane.
The effect of the pore size during the hybridization process revealed a reduction of 98% in
the resistance of the membrane for the 200 nm-situation (Figure 6-10A), while for the 100 nm-
184
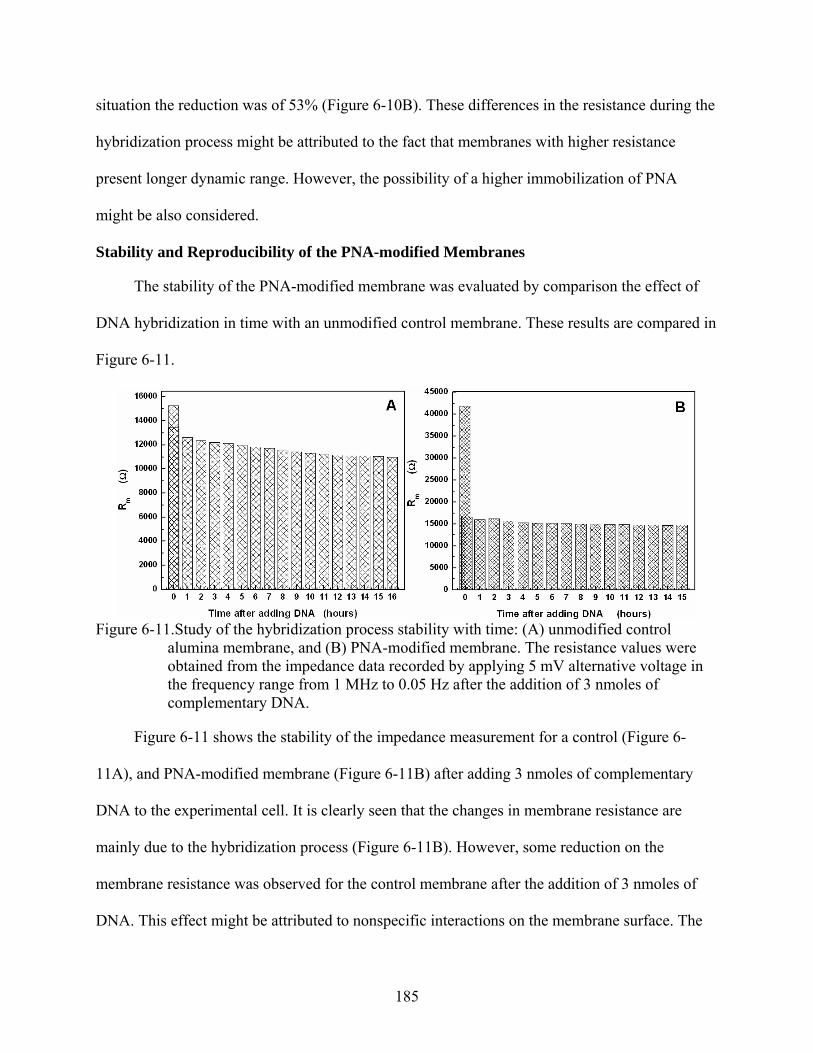
situation the reduction was of 53% (Figure 6-10B). These differences in the resistance during the
hybridization process might be attributed to the fact that membranes with higher resistance
present longer dynamic range. However, the possibility of a higher immobilization of PNA
might be also considered.
Stability and Reproducibility of the PNA-modified Membranes
The stability of the PNA-modified membrane was evaluated by comparison the effect of
DNA hybridization in time with an unmodified control membrane. These results are compared in
Figure 6-11.
Figure 6-11.Study of the hybridization process stability with time: (A) unmodified control
alumina membrane, and (B) PNA-modified membrane. The resistance values were obtained from the impedance data recorded by applying 5 mV alternative voltage in the frequency range from 1 MHz to 0.05 Hz after the addition of 3 nmoles of complementary DNA.
Figure 6-11 shows the stability of the impedance measurement for a control (Figure 6-
11A), and PNA-modified membrane (Figure 6-11B) after adding 3 nmoles of complementary
DNA to the experimental cell. It is clearly seen that the changes in membrane resistance are
mainly due to the hybridization process (Figure 6-11B). However, some reduction on the
membrane resistance was observed for the control membrane after the addition of 3 nmoles of
DNA. This effect might be attributed to nonspecific interactions on the membrane surface. The
185
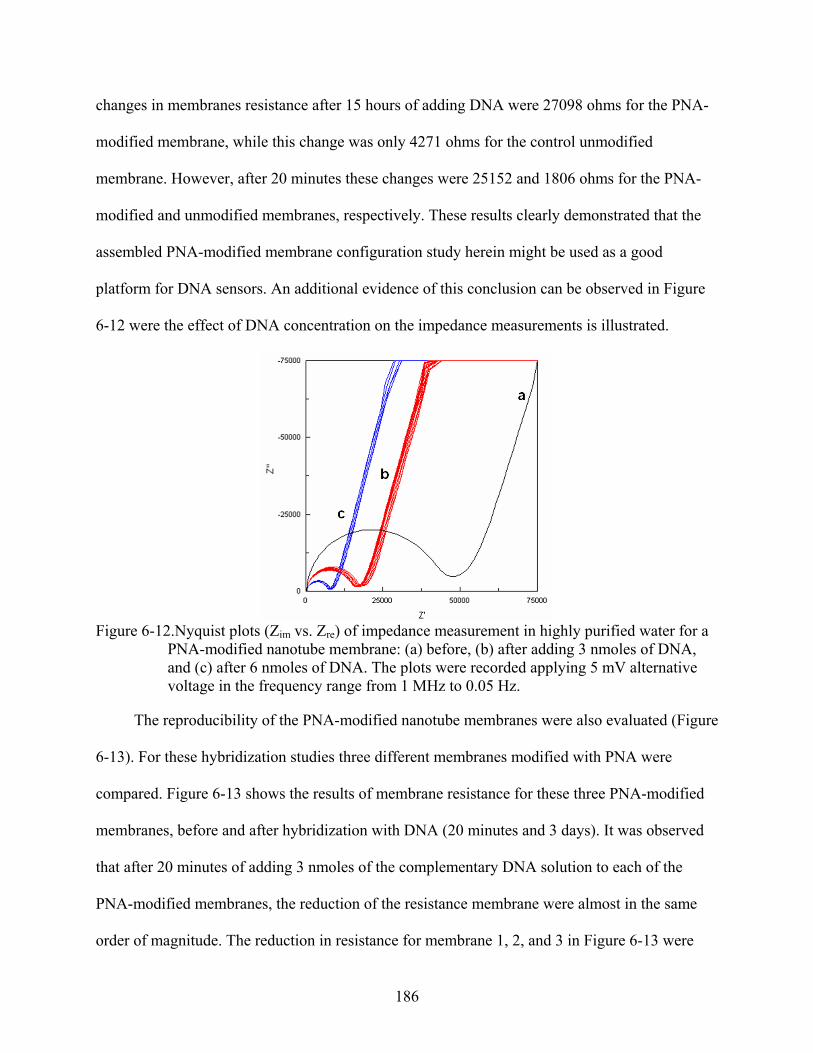
changes in membranes resistance after 15 hours of adding DNA were 27098 ohms for the PNA-
modified membrane, while this change was only 4271 ohms for the control unmodified
membrane. However, after 20 minutes these changes were 25152 and 1806 ohms for the PNA-
modified and unmodified membranes, respectively. These results clearly demonstrated that the
assembled PNA-modified membrane configuration study herein might be used as a good
platform for DNA sensors. An additional evidence of this conclusion can be observed in Figure
6-12 were the effect of DNA concentration on the impedance measurements is illustrated.
Figure 6-12.Nyquist plots (Zim vs. Zre) of impedance measurement in highly purified water for a
PNA-modified nanotube membrane: (a) before, (b) after adding 3 nmoles of DNA, and (c) after 6 nmoles of DNA. The plots were recorded applying 5 mV alternative voltage in the frequency range from 1 MHz to 0.05 Hz.
The reproducibility of the PNA-modified nanotube membranes were also evaluated (Figure
6-13). For these hybridization studies three different membranes modified with PNA were
compared. Figure 6-13 shows the results of membrane resistance for these three PNA-modified
membranes, before and after hybridization with DNA (20 minutes and 3 days). It was observed
that after 20 minutes of adding 3 nmoles of the complementary DNA solution to each of the
PNA-modified membranes, the reduction of the resistance membrane were almost in the same
order of magnitude. The reduction in resistance for membrane 1, 2, and 3 in Figure 6-13 were
186
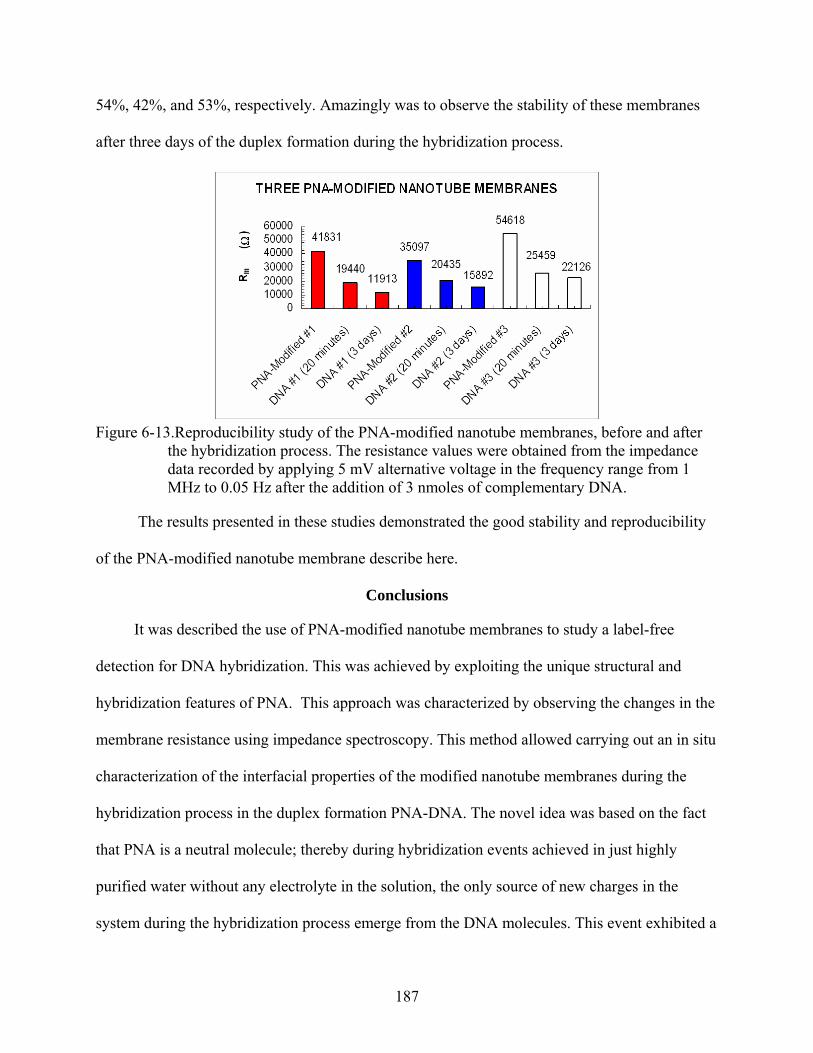
54%, 42%, and 53%, respectively. Amazingly was to observe the stability of these membranes
after three days of the duplex formation during the hybridization process.
Figure 6-13.Reproducibility study of the PNA-modified nanotube membranes, before and after
the hybridization process. The resistance values were obtained from the impedance data recorded by applying 5 mV alternative voltage in the frequency range from 1 MHz to 0.05 Hz after the addition of 3 nmoles of complementary DNA.
The results presented in these studies demonstrated the good stability and reproducibility
of the PNA-modified nanotube membrane describe here.
Conclusions
It was described the use of PNA-modified nanotube membranes to study a label-free
detection for DNA hybridization. This was achieved by exploiting the unique structural and
hybridization features of PNA. This approach was characterized by observing the changes in the
membrane resistance using impedance spectroscopy. This method allowed carrying out an in situ
characterization of the interfacial properties of the modified nanotube membranes during the
hybridization process in the duplex formation PNA-DNA. The novel idea was based on the fact
that PNA is a neutral molecule; thereby during hybridization events achieved in just highly
purified water without any electrolyte in the solution, the only source of new charges in the
system during the hybridization process emerge from the DNA molecules. This event exhibited a
187
change of the membrane resistant that was detected by impedance spectroscopy which is an
effective technique to probe the interfacial properties of modified electrodes. These results
showed the feasibility of using PNA-modified nanotube membranes as a sensing-platform for
DNA hybridization methods. This assembled nanotube membrane platform present the special
characteristic that the membrane itself performed the function of the electrodes (working and
reference respectively). It was demonstrated that PNA immobilized on the nanotube membranes
function as a good probe to detect the DNA targets in condition where no electrolyte is present
during the hybridization process. It was also demonstrated the good reproducibility obtained
during the fabrication and detection with this novel sensing-platform.
188
CHAPTER 7 CONCLUSIONS
The main goal of the research presented in this dissertation has been to develop selective
nanotube membranes based on affinity molecular recognition with interesting applications in
biological analysis. The unique property of biomolecules and metal ions to recognized specific
molecules was exploited to elaborate functional nanotube membranes with potential application
in sensing and separations of proteins and DNA. The template synthesis method was use to
obtain the silica nanotube within the pores of alumina membranes. The walls of these nanotubes
were functionalized via silane chemistry to couple molecular recognition agents onto the
modified surfaces. Chapter 1 introduce the background information for this dissertation including
the template synthesis method, the description of the alumina template membranes, sol-gel and
silane chemistry, the inspiration of living transport in the development of membrane-based
separations, fundamental about proteins, and a synopsis of the instrumental techniques used
during the development and characterization of the applications describe in this dissertation.
In chapter 2, a detailed experimental study on antibody-functionalized nanotube
membranes was carried out, including the effect of surface modification, pore size, feed
concentration, temperature, and ionic strength, both on the transport as on the functional
behavior of the membranes. It was demonstrated that the type of immobilized antibody changes
the functional behavior of the antibody-modified membranes and the transport properties of the
permeating proteins across them. These membranes showed a Langmuirian shape plot
characteristic of a typical behavior of facilitated transport membranes, when the effect of feed
solution concentration on the fluxes of the permeating proteins was investigated. Therefore, the
antibody-functionalized membranes showed here exhibit a type of behavior for facilitated-
transport membranes during protein separations. Important parameters such as the binding
189
capacities of the antibody-modified membranes and the binding constants for the permeating
proteins to the antibody carriers confirmed that the permeating protein anti-M-IgG binds strongly
to the carrier M-IgG and that the permeating protein anti-H-IgG binds weakly to this carrier,
likewise, the permeating protein anti-H-IgG binds strongly to the carrier H-IgG and that anti-M-
IgG binds weakly to this carrier. It was also demonstrated that by controlling the orientation of
the immobilized antibody using protein G the potency affinity of the antibodies is effectively
preserved. Through these studies was also demonstrated that by selecting a template membrane
with an appropriated pore size diameters these antibody-modified nanotube membranes have the
ability to be used with a combination of both size and affinity selectivity for protein separation.
Additional studies on the effect of temperature on the fluxes and the binding constant
demonstrated that the functional behavior of these antibody-modified membranes is governed for
the changes in free energy before and after interaction of the permeating proteins with the carrier
antibody, which was attributed to the changes in enthalpy and entropy of the system. Other
important finding during this investigation was that by controlling the ionic strength of the
transport solution, these antibody-modified nanotube membranes can be used for situations were
the transport of an unwanted protein needs to be shut down, in order to improve selectivity. This
latter approach might be useful in the sample complexity reduction in proteomic analysis. Since
the analysis and characterization of complex mixtures of proteins are the central aims of
proteomics. It is also noteworthy to mention the low pM detection limits achieved during these
studies. In general, the ability to alter the surface biochemistries and thus tailor the membrane
for specific analytes, promises the use of these membranes for the analysis of a wide range of
proteins.
190
Chapter 3 describes the modeling and characterization of the transport properties of
proteins across antibody-functionalized nanotube membranes by using the dual-mode model.
This work demonstrated that the dual-mode model proposes here was a suitable model for the
characterization of the transport properties of anti-H-IgG and anti-M-IgG in M-IgG modified
membranes. The model demonstrated a good agreement with the experimental system studied
here. Besides, the findings showed in these studies allow addressing the concept of modulated
facilitated transport systems using antibody-modified nanotube membranes, and how the extent
of the facilitation is determined and controlled by the binding affinity between carrier and
permeating protein molecules. These studies can provide a new direction in the development of
more effective membranes for membrane-based separation.
In chapter 4, the development of metal ion affinity nanotube membranes was demonstrated
by exploiting the concept of IMAC separations in a nanopore-membrane-platform. Silica
nanotube membranes were functionalized with imidazole through a nucleophilic substitution
reaction between 2-mercaptoimidazol and 3-chloropropyl modified silica nanotubes carried out
in an aprotic medium. It was demonstrated that transport of histidine-tagged recombinant
proteins across these imidazole-modified silica nanotube membranes is controlled by the nature
of immobilized metal ion on the imidazole surface. Besides, the extensive characterization of the
imidazole functionalized membrane allowed the understanding of how coordination chemistry
with different divalent metal ions affects the functional behavior of the membrane and transport
properties during the permeation of six-histidine recombinant proteins. Furthermore, additional
results shown that by the appropriate choice of the transition metal ion for coordination with the
imidazole ligand, the binding strength and optical properties within the functional membrane are
also modified. Hence, these studies revealed how the presence of the immobilized metal ion
191
affects the functionality of the imidazole membrane and its transport properties. The metal ion
affinity nanotube membrane described here has the potential to be a versatile analytical platform,
where different metal ions can be immobilized on the same prevailing conditions, additionally
offering the possibilities of regeneration without apparent loss of the metal coordination
properties of the functional membrane. These studies demonstrate an alternative way of
immobilized metal ion affinity by using nanotube membranes.
Chapter 5 described a new method to study transport of proteins across silica nanotube
membranes by using a fluorescence quenching-based sensing approach. This analysis was
accomplished by simply observing the fluorescence quenching of a donor-fluorescent labeled
protein (H-IgG-FITC) in the receiver solution after immunoassay reaction with the transported
acceptor-fluorescent conjugated protein (anti-H-IgG-QSY). The flux of anti-Human IgG
conjugated with the quencher QSY-7 (anti-H-IgG-QSY) was monitored by observing the
changes in fluorescence of a known concentration of Human IgG FITC-labeled (H-IgG-FITC) in
the receiver solution. The rate of fluorescence quenching was studied both in the absence and the
presence of quencher labeled protein transported across of bare silica nanotube membranes and
antibody-modified membranes. It was demonstrated that the rate of fluorescence quenching
depends on the flux of anti-H-IgG-QSY across the nanotube membrane, and that the rate of
fluorescence quenching can be used to determine the concentration of the analyzed protein on the
feed solution.
In chapter 6, the use of PNA-modified nanotube membranes to study a label-free detection
for DNA hybridization was demonstrated. This was achieved by exploiting the unique structural
and hybridization features of PNA. This approach was characterized by observing the changes
in the membrane resistance using impedance spectroscopy. This method allowed carrying out an
192
in situ characterization of the interfacial properties of the modified nanotube membranes during
the hybridization process in the duplex formation PNA-DNA. The novel idea was based on the
fact that PNA is a neutral molecule; thereby during hybridization events achieved in just highly
purified water without any electrolyte in the solution, the only source of new charges in the
system during the hybridization process emerge from the DNA molecules. This event exhibited a
change of the membrane resistant that was detected by impedance spectroscopy which is an
effective technique to probe the interfacial properties of modified electrodes. These results
showed the feasibility of using PNA-modified nanotube membranes as a sensing-platform for
DNA hybridization methods. This assembled nanotube membrane platform present the special
characteristic that the membrane itself performed the function of the electrodes (working and
reference respectively). It was demonstrated that PNA immobilized on the nanotube membranes
function as a good probe to detect the DNA targets in condition where no electrolyte is present
during the hybridization process. It was also demonstrated the good reproducibility obtained
during the fabrication and detection with this novel sensing-platform.
193
LIST OF REFERENCES
[1] Hagg, M.-B. Separation and Purification Methods 1998, 27, 51-168. [2] Baker, R. W. Membrane Technology and Applications, 2nd ed.; John Wiley & Sons, Ltd.,
2004. [3] Striemer, C. C.; Gaborski, T. R.; McGrath, J. L.; Fauchet, P. M. Nature 2007, 445, 749-
753.
[4] Jirage, K. B.; Hulteen, J. C.; Martin, C. R. Science 1997, 278, 655-658.
[5] Yu, S.; Lee, S. B.; Martin, C. R. Analytical Chemistry 2003, 75, 1239-1244.
[6] Yu, S.; Lee, S. B.; Kang, M.; Martin, C. R. Nano Letters 2001, 1, 495-498.
[7] Chun, K.-Y.; Stroeve, P. Langmuir 2002, 18, 4653-4658.
[8] Van Reis, R.; Zydney, A. Current Opinion in Biotechnology 2001, 12, 208-211.
[9] Lee, S. B.; Mitchell, D. T.; Trofin, L.; Nevanen, T. K.; Soederlund, H.; Martin, C. R. Science 2002, 296, 2198-2200.
[10] Kohli, P.; Harrell, C. C.; Cao, Z.; Gasparac, R.; Tan, W.; Martin, C. R. Science 2004,
305, 984-986.
[11] Giorno, L.; De Bartolo, L.; Drioli, E. Membrane Science and Technology Series 2003, 8, 187-217.
[12] Gavalas, V. G.; Wang, J.; Bachas, L. G. Membrane Science and Technology Series 2003,
8, 379-392.
[13] Sexton, L. T.; Horne, L. P.; Sherrill, S. A.; Bishop, G. W.; Baker, L. A.; Martin, C. R. Journal of the American Chemical Society 2007, 129, 13144-13152.
[14] Baker, L. A.; Choi, Y.; Martin, C. R. Current Nanoscience 2006, 2, 243-255.
[15] Choi, Y.; Baker, L. A.; Hillebrenner, H.; Martin, C. R. Physical Chemistry Chemical
Physics 2006, 8, 4976-4988.
[16] Siwy, Z.; Trofin, L.; Kohli, P.; Baker, L. A.; Trautmann, C.; Martin, C. R. Journal of the American Chemical Society 2005, 127, 5000-5001.
[17] Harrell, C. C.; Choi, Y.; Horne, L. P.; Baker, L. A.; Siwy, Z. S.; Martin, C. R. Langmuir
2006, 22, 10837-10843.
[18] Kohli, P.; Wirtz, M.; Martin, C. R. Electroanalysis 2004, 16, 9-18.
194
[19] Harrell, C. C.; Kohli, P.; Siwy, Z.; Martin, C. R. Journal of the American Chemical Society 2004, 126, 15646-15647.
[20] Steinle, E. D.; Mitchell, D. T.; Wirtz, M.; Lee, S. B.; Young, V. Y.; Martin, C. R.
Analytical Chemistry 2002, 74, 2416-2422.
[21] Lee, S. B.; Martin, C. R. Journal of the American Chemical Society 2002, 124, 11850-11851.
[22] Wirtz, M.; Yu, S.; Martin, C. R. Analyst 2002, 127, 871-879.
[23] Martin, C. R.; Nishizawa, M.; Jirage, K.; Kang, M. Journal of Physical Chemistry B
2001, 105, 1925-1934.
[24] Lee, S. B.; Martin, C. R. Chemistry of Materials 2001, 13, 3236-3244.
[25] Martin, C. R. Science 1994, 266, 1961-1966.
[26] Martin, C. R.; Mitchell, D. T. Analytical Chemistry 1998, 70, 322A-327A.
[27] Hulteen, J. C.; Martin, C. R. Journal of Materials Chemistry 1997, 7, 1075-1087.
[28] Cepak, V. M.; Hulteen, J. C.; Che, G.; Jirage, K. B.; Lakshmi, B. B.; Fisher, E. R.; Martin, C. R. Journal of Materials Research 1998, 13, 3070-3080.
[29] Miller, S. A.; Young, V. Y.; Martin, C. R. Journal of the American Chemical Society
2001, 123, 12335-12342.
[30] Kang, M.; Trofin, L.; Mota, M. O.; Martin, C. R. Analytical Chemistry 2005, 77, 6243-6249.
[31] Xu, F.; Wharton, J. E.; Martin, C. R. Small 2007, 3, 1718-1722.
[32] Liang, W.; Martin, C. R. Journal of the American Chemical Society 1990, 112, 9666-
9668.
[33] Van Dyke, L. S.; Martin, C. R. Langmuir 1990, 6, 1118-1123.
[34] Yamada, K.; Gasparac, R.; Martin, C. R. Journal of the Electrochemical Society 2004, 151, E14-E19.
[35] Nishizawa, M.; Menon, V. P.; Martin, C. R. Science 1995, 268, 700-702.
[36] Brumlik, C. J.; Menon, V. P.; Martin, C. R. Journal of Materials Research 1994, 9, 1174-
1183.
195
[37] Harrell, C. C.; Lee, S. B.; Martin, C. R. Analytical Chemistry 2003, 75, 6861-6867.
[38] Mitchell, D. T.; Lee, S. B.; Trofin, L.; Li, N.; Nevanen, T. K.; Soederlund, H.; Martin, C. R. Journal of the American Chemical Society 2002, 124, 11864-11865.
[39] Klein, J. D.; Herrick, R. D., II; Palmer, D.; Sailor, M. J.; Brumlik, C. J.; Martin, C. R.
Chemistry of Materials 1993, 5, 902-904.
[40] Hou, S.; Harrell, C. C.; Trofin, L.; Kohli, P.; Martin, C. R. Journal of the American Chemical Society 2004, 126, 5674-5675.
[41] Hou, S.; Wang, J.; Martin, C. R. Journal of the American Chemical Society 2005, 127,
8586-8587.
[42] Cai, Z.; Lei, J.; Liang, W.; Menon, V.; Martin, C. R. Chemistry of Materials 1991, 3, 960-967.
[43] Parthasarathy, R.; Martin, C. R. Nature 1994, 369, 298-301.
[44] Hornyak, G. L.; Patrissi, C. J.; Martin, C. R. Journal of Physical Chemistry B 1997, 101,
1548-1555.
[45] Foss, C. A., Jr.; Hornyak, G. L.; Stockert, J. A.; Martin, C. R. Journal of Physical Chemistry 1994, 98, 2963-2971.
[46] Scopece, P.; Baker, L. A.; Ugo, P.; Martin, C. R. Nanotechnology 2006, 17, 3951-3956.
[47] Jirage, K. B.; Hulteen, J. C.; Martin, C. R. Science 1997, 278, 655-658.
[48] Hulteen, J. C.; Jirage, K. B.; Martin, C. R. Journal of the American Chemical Society
1998, 120, 6603-6604.
[49] Jirage, K. B.; Hulteen, J. C.; Martin, C. R. Analytical Chemistry 1999, 71, 4913-4918.
[50] Martin, C. R.; Kohli, P. Nature Reviews Drug Discovery 2003, 2, 29-37.
[51] Gasparac, R.; Kohli, P.; Paulino, M. O. M.; Trofin, L.; Martin, C. R. Nano Letters 2004, 4, 513-516.
[52] Hillebrenner, H.; Buyukserin, F.; Kang, M.; Mota, M. O.; Stewart, J. D.; Martin, C. R.
Journal of the American Chemical Society 2006, 128, 4236-4237.
[53] Hillebrenner, H.; Buyukserin, F.; Stewart, J. D.; Martin, C. R. Journal of Nanoscience and Nanotechnology 2007, 7, 2211-2221.
[54] Buyukserin, F.; Kang, M.; Martin, C. R. Small 2007, 3, 106-110.
196
[55] Ai, S.; Lu, G.; He, Q.; Li, J. Journal of the American Chemical Society 2003, 125, 11140-11141.
[56] Kovtyukhova, N. I.; Mallouk, T. E.; Mayer, T. S. Advanced Materials 2003, 15, 780-785.
[57] Li, F.; Zhang, L.; Metzger, R. M. Chemistry of Materials 1998, 10, 2470-2480.
[58] Masuda, H.; Fukuda, K. Science 1995, 268, 1466-1468.
[59] Wood, G. C.; O'Sullivan, J. P. Electrochimica Acta 1970, 15, 1865-1876.
[60] Shingubara, S.; Morimoto, K.; Sakaue, H.; Takahagi, T. Electrochemical and Solid-State
Letters 2003, 7, E15-E17.
[61] Masuda, H.; Hasegwa, F.; Ono, S. Journal of the Electrochemical Society 1997, 144, L127-L130.
[62] Masuda, H.; Yada, K.; Osaka, A. Japanese Journal of Applied Physics, Part 2: Letters
1998, 37, L 1340-L 1342.
[63] Li, A. P.; Muller, F.; Birner, A.; Nielsch, K.; Gosele, U. Journal of Applied Physics 1998, 84, 6023-6026.
[64] Che, G.; Lakshmi, B. B.; Fisher, E. R.; Martin, C. R. Nature 1998, 393, 346-349.
[65] Hurst Sarah, J.; Payne Emma, K.; Qin, L.; Mirkin Chad, A. Angewandte Chemie,
International Edition 2006, 45, 2672-2692.
[66] Huber, C. A.; Huber, T. E.; Sadoqi, M.; Lubin, J. A.; Manalis, S.; Prater, C. B. Science 1994, 263, 800-802.
[67] Kovtyukhova, N. I.; Mallouk, T. E. Advanced Materials 2005, 17, 187-192.
[68] Park, S.; Lim, J.-H.; Chung, S.-W.; Mirkin, C. A. Science 2004, 303, 348-351.
[69] Lee, W.; Scholz, R.; Nielsch, K.; Goesele, U. Angewandte Chemie, International Edition
2005, 44, 6050-6054.
[70] Zhi, L.; Wu, J.; Li, J.; Kolb, U.; Muellen, K. Angewandte Chemie, International Edition 2005, 44, 2120-2123.
[71] Wood, G. C.; O'Sullivan, J. P.; Vaszko, B. Journal of the Electrochemical Society 1968,
115, 618-620.
[72] Masuda, H.; Satoh, M. Japanese Journal of Applied Physics, Part 2: Letters 1996, 35, L126-L129.
197
[73] Masuda, H.; Yamada, H.; Satoh, M.; Asoh, H.; Nakao, M.; Tamamura, T. Applied Physics Letters 1997, 71, 2770-2772.
[74] Asoh, H.; Nishio, K.; Nakao, M.; Tamamura, T.; Masuda, H. Journal of the
Electrochemical Society 2001, 148, B152-B156.
[75] Diggle, J. W.; Downie, T. C.; Goulding, C. W. Chemical Reviews 1969, 69, 365-405.
[76] Jessensky, O.; Muller, F.; Gosele, U. Applied Physics Letters 1998, 72, 1173-1175.
[77] O'Sullivan, J. P.; Wood, G. C. Proceedings of the Royal Society of London, Series A: Mathematical, Physical and Engineering Sciences 1970, 317, 511-543.
[78] Parkhutik, V. P.; Shershul'skii, V. I. Journal of Physics D: Applied Physics 1992, 25,
1258-1263.
[79] Siejka, J.; Ortega, C. Journal of the Electrochemical Society 1977, 124, 883-891.
[80] Hench, L. L.; West, J. K. Chemical Reviews 1990, 90, 33-72.
[81] Livage, J.; Henry, M.; Sanchez, C. Progress in Solid State Chemistry 1988, 18, 259-341.
[82] Patrissi, C. J.; Martin, C. R. Journal of the Electrochemical Society 1999, 146, 3176-3180.
[83] Sides, C. R.; Martin, C. R. Modern Aspects of Electrochemistry 2007, 40, 75-126.
[84] Sides, C. R.; Li, N.; Patrissi, C. J.; Scrosati, B.; Martin, C. R. MRS Bulletin 2002, 27,
604-607.
[85] Lakshmi, B. B.; Patrissi, C. J.; Martin, C. R. Chemistry of Materials 1997, 9, 2544-2550.
[86] Lin, J.; Brown, C. W. TrAC, Trends in Analytical Chemistry 1997, 16, 200-211.
[87] Collinson, M. M. Mikrochimica Acta 1998, 129, 149-165.
[88] Avnir, D. Accounts of Chemical Research 1995, 28, 328-334.
[89] Walcarius, A. Electroanalysis 1998, 10, 1217-1235.
[90] Brinker, C. J. Current Opinion in Colloid & Interface Science 1998, 3, 166-173.
[91] Walcarius, A. Electroanalysis 2001, 13, 701-718.
[92] Stoeber, W.; Fink, A.; Bohn, E. Journal of Colloid and Interface Science 1968, 26, 62-69.
198
[93] Hench, L. L. Sol-Gel Silica-Properties, Processing and Technology Transfer; Noyes Publications: New Jersey, USA, 1998.
[94] Iler, R. K. The Chemistry of Silica: Solubility, Polymerization, Colloid and Surface
Properties and Biochemistry, John Wiley & Sons, 1979.
[95] Pyell, U.; Stork, G. Fresenius' Journal of Analytical Chemistry 1992, 343, 576-581.
[96] Jal, P. K.; Patel, S.; Mishra, B. K. Talanta 2004, 62, 1005-1028.
[97] Kiselev, A. V.; Lygin, V. I. Infrared Spectra of Surface Compounds; Wiley: New York, 1975.
[98] Kiselev, A. V. Kolloidnyi Zhurnal 1936, 2, 17-26.
[99] Chuang, I. S.; Maciel, G. E. Journal of Physical Chemistry B 1997, 101, 3052-3064.
[100] Grushka, E.; Kikta, E. J., Jr. Analytical Chemistry 1977, 49, 1004A-1008A, 1010A,
1012A, 1014A.
[101] Van der Voort, P.; Gillis-D'Hamers, I.; Vansant, E. F. Journal of the Chemical Society, Faraday Transactions 1990, 86, 3751-3755.
[102] Tundo, P.; Venturello, P.; Angeletti, E. Journal of the American Chemical Society 1982,
104, 6551-6555.
[103] Plueddemann, E. P. Silane Coupling Agents, 2nd ed.; Plenum Publishing Corporation: New York, 1991.
[104] Loy, D. A.; Baugher, B. M.; Baugher, C. R.; Schneider, D. A.; Rahimian, K. Chemistry
of Materials 2000, 12, 3624-3632.
[105] Arkles, B. Chemtech 1977, 7, 766-778.
[106] Dias Filho, N. L.; Gushikem, Y. Separation Science and Technology 1997, 32, 2535-2545.
[107] Lehninger, A. L. Principles of Biochemistry, 2nd ed.; Worth Inc.: New York, 1993.
[108] Kemp, N. J.; Noble, R. D. Separation Science and Technology 1983, 18, 1147-1165.
[109] Lakshmi, B. B.; Martin, C. R. Nature 1997, 388, 758-760.
[110] Noble, R. D.; Koval, C. A. Materials Science of Membranes for Gas and Vapor
Separation 2006, 411-435.
199
[111] Wirgau, J. I.; Crumbliss, A. L. Dalton Transactions 2003, 3680-3685.
[112] Zaghbani, A.; Tayeb, R.; Bonnamour, I.; Felix, C.; Vocanson, F.; Lamartine, R.; Dhahbi, M.; Seta, P. Journal of Membrane Science 2005, 258, 5-7.
[113] Villamo, O.; Barboiu, C.; Barboiu, M.; Yau-Chun-Wan, W.; Hovnanian, N. Journal of
Membrane Science 2002, 204, 97-110.
[114] Shentu, B.; Nishide, H. Industrial & Engineering Chemistry Research 2003, 42, 5954-5958.
[115] Tsuchida, E.; Nishide, H.; Ohyanagi, M. Journal of Macromolecular Science, Chemistry
1988, A25, 1327-1338.
[116] Barboiu, M.; Guizard, C.; Hovnanian, N.; Palmeri, J.; Reibel, C.; Cot, L.; Luca, C. Journal of Membrane Science 2000, 172, 91-103.
[117] Gherrou, A.; Kerdjoudj, H.; Molinari, R.; Drioli, E. Separation Science and Technology
2002, 37, 2317-2336.
[118] Choi, H. W.; Kim, D. B.; Choi, D. K.; Ahn, B. S.; Kim, H. G.; Kim, H. S.; Lee, C. H.; Sung, J. Y. Journal of Membrane Science 2006, 279, 403-409.
[119] Kaucher, M. S.; Peterca, M.; Dulcey, A. E.; Kim, A. J.; Vinogradov, S. A.; Hammer, D.
A.; Heiney, P. A.; Percec, V. Journal of the American Chemical Society 2007, 129, 11698-11699.
[120] Janeway, C. A., Travers, P.,Walport, M., Capra, J. D. Immunobiology: The Immune
System in Health and Disease, 5th ed.; Garland Publishing Inc.: New York, 2001.
[121] Burton, D. R. Trends in Biochemical Sciences 1990, 15, 64-69.
[122] Gellissen, G. Production of Recombinant Proteins : Novel Microbial and Eukaryotic Expression Systems; Wiley-VCH: Weinheim, Germany, 2004.
[123] Merten, O.-W., Mattanovich, D., Lang, C., Larsson, G., Neubauer, P., Porro, D., Postma,
P., Teixeira de Mattos, J., Cole, J.A. Recombinant Protein Production With Prokaryotic and Eukaryotic Cells : A Comparative View on Host Physiology; Kluwer Academic Pub.: Semmering, Austria, 2001.
[124] Hochuli, E.; Doebeli, H.; Schacher, A. Journal of Chromatography 1987, 411, 177-184.
[125] Smith, M. C.; Furman, T. C.; Ingolia, T. D.; Pidgeon, C. Journal of Biological Chemistry
1988, 263, 7211-7215.
[126] Porath, J.; Carlsson, J.; Olsson, I.; Belfrage, G. Nature 1975, 258, 598-599.
200
[127] Porath, J. Trends in Analytical Chemistry 1988, 7, 254-259. [128] Eftink, M. R. Biophysical Journal 1994, 66, 482-501.
[129] Eftink, M. R. Methods in Enzymology 2000, 323, 459-473.
[130] Methods in Enzymology: Fluorescence Spectroscopy, 1997, 278, 1-628.
[131] Lakowicz, J. R. Principles of Fluorescence Spectroscopy, 2nd ed.; Plenum Publishers,
Inc.: New York, 1999.
[132] Guilbault, G. G. Practical Fluorescence. Modern Monographs in Analytical Chemistry, 2nd ed.; Marcel Dekker, Inc.: New York, 1990.
[133] Mirabella, F. M. Principles, Theory, and Practice of Internal Reflection Spectroscopy, in
"Internal Reflection Spectroscopy Theory and Applications"; Marcel Dekker, Inc.: New York, 1993.
[134] Skourlis, T. P.; McCullough, R. L. Journal of Applied Polymer Science 1994, 52, 1241-
1248.
[135] Harrick, N. J.; duPre, F. K. Applied Optics 1966, 5, 1739-1742.
[136] Tan, S., Belanger, D. Journal of Physical Chemistry B 2005, 109, 23480-23490.
[137] Watts, J. F., Wolstenholme, J. An Introduction to Surface Analysis by XPS and AES; John Wiley & Sons Inc., 2003.
[138] Goldstein, J., Newbury, D. E., Joy, D. C., Lyman, C. E., Echlin, P., Lifshin, E., Sawyer,
L., Michael, J. Scanning Electron Microscopy and X-ray Microanalysis, 3rd ed.; Springer Science + Business Media, Inc.: New York, 2003.
[139] Chilcott, T. C.; Chan, M.; Gaedt, L.; Nantawisarakul, T.; Fane, A. G.; Coster, H. G. L.
Journal of Membrane Science 2002, 195, 153-167.
[140] Gaedt, L.; Chilcott, T. C.; Chan, M.; Nantawisarakul, T.; Fane, A. G.; Coster, H. G. L. Journal of Membrane Science 2002, 195, 169-180.
[141] Park, S.-M.; Yoo, J.-S. Analytical Chemistry 2003, 75, 455A-461A.
[142] Kharitonov, A. B.; Alfonta, L.; Katz, E.; Willner, I. Journal of Electroanalytical
Chemistry 2000, 487, 133-141.
[143] Bilitewski, U. Analytica Chimica Acta 2006, 568, 232-247.
201
[144] Ye, M.; Jiang, X.; Feng, S.; Tian, R.; Zou, H. TrAC, Trends in Analytical Chemistry 2007, 26, 80-84.
[145] Domon, B.; Aebersold, R. Science 2006, 312, 212-217.
[146] Domon, B.; Broder, S. Journal of Proteome Research 2004, 3, 253-260.
[147] Marengo, E.; Leardi, R.; Robotti, E.; Righetti, P. G.; Antonucci, F.; Cecconi, D. Journal
of Proteome Research 2003, 2, 351-360.
[148] Barroso, B.; Lubda, D.; Bischoff, R. Journal of Proteome Research 2003, 2, 633-642.
[149] Masselon, C.; Pasa-Tolic, L.; Tolic, N.; Anderson, G. A.; Bogdanov, B.; Vilkov, A. N.; Shen, Y.; Zhao, R.; Qian, W.-J.; Lipton, M. S.; Camp, D. G., II; Smith, R. D. Analytical Chemistry 2005, 77, 400-406.
[150] Nedelkov, D.; Tubbs, K. A.; Niederkofler, E. E.; Kiernan, U. A.; Nelson, R. W.
Analytical Chemistry 2004, 76, 1733-1737.
[151] Zilberstein, G.; Korol, L.; Antonioli, P.; Righetti, P. G.; Bukshpan, S. Analytical Chemistry 2007, 79, 821-827.
[152] Iritani, E.; Mukai, Y.; Murase, T. Filtration & Separation 1997, 34, 967-973.
[153] Ghosh, R.; Cui, Z. F. Journal of Membrane Science 2000, 167, 47-53.
[154] Harkensee, D.; Kokpinar, O.; Walter, J.; Kasper, C.; Beutel, S.; Reif, O. W.; Scheper, T.;
Ulber, R. Engineering in Life Sciences 2007, 7, 388-394.
[155] Guo, W.; Ruckenstein, E. Journal of Membrane Science 2003, 211, 101-111.
[156] Ramamoorthy, M.; Raju, M. D. Industrial & Engineering Chemistry Research 2001, 40, 4815-4820.
[157] Suen, S.-Y.; Liu, Y.-C.; Chang, C.-S. Journal of Chromatography, B 2003, 797, 305-319.
[158] O'Connor, A. J.; Pratt, H. R. C.; Stevens, G. W. Chemical Engineering Science 1996, 51,
3459-3477.
[159] Ho, A. K.; Perera, J. M.; Dunstan, D. E.; Stevens, G. W.; Nystrom, M. AIChE Journal 1999, 45, 1434-1450.
[160] Li, Q. Y.; Pepper, D. S. Journal of Membrane Science 1997, 136, 181-190.
[161] Nystrom, M.; Aimar, P.; Luque, S.; Kulovaara, M.; Metsamuuronen, S. Colloids and
Surfaces, A: Physicochemical and Engineering Aspects 1998, 138, 185-205.
202
[162] Nakatsuka, S.; Michaels, A. S. Journal of Membrane Science 1992, 69, 189-211.
[163] Saxena, A.; Shahi, V. K. Journal of Membrane Science 2007, 299, 211-221.
[164] Aravind, U. K.; Mathew, J.; Aravindakumar, C. T. Journal of Membrane Science 2007, 299, 146-155.
[165] Poetz, O.; Schwenk, J. M.; Kramer, S.; Stoll, D.; Templin, M. F.; Joos, T. O. Mechanisms
of Ageing and Development 2005, 126, 161-170.
[166] Poetz, O.; Ostendorp, R.; Brocks, B.; Schwenk, J. M.; Stoll, D.; Joos, T. O.; Templin, M. F. Proteomics 2005, 5, 2402-2411.
[167] Langmuir, I. Journal of the American Chemical Society 1918, 40, 1361-1402.
[168] Yang, L.; Chen, P. Journal of Membrane Science 2002, 205, 141-153.
[169] Weiss, M.; Welsch, W.; Schickfus, M. v.; Hunklinger, S. Analytical Chemistry 1998, 70,
2881-2887.
[170] Saha, K.; Bender, F.; Gizeli, E. Analytical Chemistry 2003, 75, 835-842.
[171] Igarashi, T.; Ishigatsubo, Y.; Ohno, S.; Shirai, A.; Aoki, I.; Okubo, T.; Klinman, D. M. Clinical Immunology and Immunopathology 1994, 72, 307-311.
[172] Klinman, D. M. ; Banks, S.; Hartman, A.; Steinberg, A. D. Journal of Clinical
Investigations 1988, 82, 652-657.
[173] Gueell, C.; Davis, R. H. Journal of Membrane Science 1996, 119, 269-284.
[174] Mueller, J.; Davis, R. H. Journal of Membrane Science 1996, 116, 47-60.
[175] Ho, C.-C.; Zydney, A. L. Journal of Membrane Science 1999, 155, 261-275.
[176] Jones, K. L.; O'Melia, C. R. Journal of Membrane Science 2000, 165, 31-46.
[177] Dechadilok, P.; Deen, W. M. Industrial & Engineering Chemistry Research 2006, 45, 6953-6959.
[178] Bhattacharjee, S.; Sharma, A.; Bhattacharya, P. K. Industrial & Engineering Chemistry
Research 1996, 35, 3108-3121.
[179] Johnson, C. P.; Jensen, I. E.; Prakasam, A.; Vijayendran, R.; Leckband, D. Bioconjugate Chemistry 2003, 14, 974-978.
203
[180] Dancette, O. P.; Taboureau, J.-L.; Tournier, E.; Charcosset, C.; Blond, P. Journal of Chromatography, B: Biomedical Sciences and Applications 1999, 723, 61-68.
[181] Rutherford, S. W.; Do, D. D. Adsorption 1997, 3, 283-312.
[182] Paul, D. R. Journal of Polymer Science, Polymer Physics Edition 1969, 7, 1811-1818.
[183] Tsuru, T.; Izumi, S.; Yoshioka, T.; Asaeda, M. AIChE Journal 2000, 46, 565-574.
[184] Nomura, T.; Nakao, S.; Kimura, S. Kagaku Kogaku Ronbunshu 1987, 13, 811-817.
[185] Chandler, D. Nature 2005, 437, 640-647.
[186] Lin, F.-Y.; Chen, W.-Y.; Hearn, M. T. W. Journal of Molecular Recognition 2002, 15,
55-93.
[187] Palma, E.; Klapper, D. G.; Cho, M. J. Pharmaceutical Research 2005, 22, 122-127.
[188] Norde, W.; Lyklema, J. Journal of Colloid and Interface Science 1979, 71, 350-366.
[189] Norde, W. Advances in colloid and interface science 1986, 25, 267-340.
[190] Norde, W.; MacRitchie, F.; Nowicka, G.; Lyklema, J. Journal of Colloid and Interface Science 1986, 112, 447-456.
[191] Hamilton, R. G. Production and epitope location of monoclonal antibodies to the human
IgG subclasses. In Molecular Aspects of Immunoglobulin Subclasses; Pergamon Press: Oxford, 1990, pp 79-91.
[192] Schmuhl, R.; Keizer, K.; van den Berg, A.; ten Elshof, J. E.; Blank, D. H. A. Journal of
Colloid and Interface Science 2004, 273, 331-338.
[193] Saksena, S.; Zydney, A. L. Biotechnology and Bioengineering 1994, 43, 960-968.
[194] Zydney, A. L.; Pujar, N. S. Colloids and Surfaces, A: Physicochemical and Engineering Aspects 1998, 138, 133-143.
[195] Lopez, M. F.; Melov, S. Circulation Research 2002, 90, 380-389.
[196] Sun, L.; Crooks, R. M. Langmuir 1999, 15, 738-741.
[197] Bath, B. D.; Lee, R. D.; White, H. S.; Scott, E. R. Analytical Chemistry 1998, 70, 1047-
1058.
[198] Baltus, R. E. Journal of Membrane Science 1997, 130, 157-172.
204
[199] Galiatsatou, P.; Kanellopoulos, N. K.; Petropoulos, J. H. Journal of Membrane Science 2006, 280, 634-642.
[200] Funke, H. H.; Noble, R. D.; Koval, C. A. Journal of Membrane Science 1993, 82, 229-
236.
[201] Smith, K. A.; Meldon, J. H.; Colton, C. K. AIChE Journal 1973, 19, 102-109.
[202] Teramoto, M. Industrial & Engineering Chemistry Research 1994, 33, 2161-2171.
[203] Vieth, W. R.; Sladek, K. J. Journal of Colloid Science 1965, 20, 1014-1033.
[204] Paul, D. R.; Koros, W. J. Journal of Polymer Science, Polymer Physics Edition 1976, 14, 675-685.
[205] Vieth, W. R.; Howell, J. M.; Hsieh, J. H. Journal of Membrane Science 1976, 1, 177-220.
[206] Petropoulos, J. H. Journal of Polymer Science, Polymer Physics Edition 1970, 8, 1797-
1801.
[207] Mauze, G. R.; Stern, S. A. Journal of Membrane Science 1984, 18, 99-109.
[208] Riedl, C. M.; Spencer, H. G. Journal of Applied Polymer Science 1990, 41, 1685-1693.
[209] Noble, R. D. Journal of Membrane Science 1990, 50, 207-214.
[210] Kanehashi, S.; Nagai, K. Journal of Membrane Science 2005, 253, 117-138.
[211] Tsujita, Y. Progress in Polymer Science 2003, 28, 1377-1401.
[212] Barrer, R. M.; Barrie, J. A.; Slater, J. Journal of Polymer Science 1958, 27, 177-197.
[213] Stern, S. A.; Zhou, S.; Araux-Lara, J. L.; Ware, B. R. Journal of Polymer Science, Part C: Polymer Letters 1989, 27, 427-431.
[214] Koros, W. J.; Paul, D. R. Journal of Polymer Science, Polymer Physics Edition 1978, 16,
1947-1963.
[215] Huh, J.-K.; Song, D.-I.; Jeon, Y.-W. Separation Science and Technology 1999, 34, 571-586.
[216] Huh, J.-K.; Song, D.-I.; Jeon, Y.-W. Separation Science and Technology 2000, 35, 243-
259.
[217] Wang, J.-S.; Kamiya, Y. Journal of Membrane Science 1999, 154, 25-32.
205
[218] Dixon-Garrett, S. V.; Nagai, K.; Freeman, B. D. Journal of Polymer Science, Part B: Polymer Physics 2000, 38, 1078-1089.
[219] Dixon-Garrett, S. V.; Nagai, K.; Freeman, B. D. Journal of Polymer Science, Part B:
Polymer Physics 2000, 38, 1461-1473.
[220] Meares, P. Journal of the American Chemical Society 1954, 76, 3415-3422.
[221] Budd, P. M.; McKeown, N. B.; Fritsch, D. Journal of Materials Chemistry 2005, 15, 1977-1986.
[222] Huang, S. H.; Margolies, M. N.; Rothstein, A. M.; Siekevitz, M.; Gefter, M. L.
Pharmacology Reviews 1982, 34, 43–49.
[223] Sem, D. S.; McNeeley, P. A.; Linnik, M. D. Archives of Biochemistry and Biophysics 1999, 372, 62-68.
[224] Petropoulos, J. H. Advances in Polymer Science 1985, 64, 93-142.
[225] Kempe, H.; Persson, P.; Axelsson, A.; Nilsson,B.; Zacchi, G. Biotechnology Bioengineer
2006, 93, 656-664.
[226] Bosma, J. C.; Wesselingh, J. A. Journal of Chromatography B 2000, 743, 169–180.
[227] Burczak, K.; Fujisato, T.; Hatada, M.; Ikada, Y. Biomaterials 1994, 15, 231-238.
[228] La Flamme, K. E.; Mor, G.; Gong, D.; La Tempa, T.; Fusaro, V. A.; Grimes, C. A.; Desai, T. A. Diabetes Technology & Therapeutics 2005, 7, 684-694.
[229] Leoni, L.; Boiarski, A.; Desai, T. A. Biomedice Microdevices 2002, 4, 131-139.
[230] Bird, R. B.; Steward, W. E.; Lightfoot, E. N. Transport Phenomena, John Wiley, New
York, NY, 1960.
[231] Cussler, E. L. Diffusion. Mass Transfer in Fluid systems. Cambridge University Press, Cambridge, UK, 1997.
[232] Edward, J. T. Journal of Chemical Education 1970, 47, 261-270.
[233] Pluen, A.; Netti, P. A.; Jain, R. K.; Berk, D. A. Biophysical Journal 1999, 77, 542-552.
[234] Terazima, M. Physical Chemistry Chemical Physics 2006, 8, 545-557.
[235] Nishida, S.; Nada, T.; Terazima, M. Biophysical Journal 2004, 87, 2663-2675.
[236] Moschou, E. A.; Bachas, L. G.; Deo, S. K. Analytical Chemistry 2006, 78, 6692-6700.
206
[237] Hentz, N. G.; Daunert, S. Analytical chemistry 1996, 68, 3939-3944. [238] Lager, I.; Looger, L. L.; Hilpert, M.; Lalonde, S.; Frommer, W. B. Journal of Biological
Chemistry 2006, 281, 30875-30883.
[239] Dwyer, M. A.; Hellinga, H. W. Current Opinion in Structural Biology 2004, 14, 495-504.
[240] Lager, I.; Fehr, M.; Frommer, W. B.; Lalonde, S. FEBS Letters 2003, 553, 85-89.
[241] Nilsson, B.; Forsberg, G.; Moks, T.; Hartmanis, M.; Uhlen, M. Current Opinion in Structural Biology 1992, 2, 569-575.
[242] Seidler, A. Protein Engineering 1994, 7, 1277-1280.
[243] Zhang, Z.; Tong, K. T.; Belew, M.; Pettersson, T.; Janson, J. C. Journal of
chromatography 1992, 604, 143-155.
[244] Carlsson, J.; Porath, J.; Lonnerdal, B. FEBS letters 1977, 75, 89-92.
[245] Chadha, K. C.; Grob, P. M.; Mikulski, A. J.; Davis, L. R.; Sulkowski, E. Journal of General Virology 1979, 43, 701-706.
[246] Chaga, G.; Andersson, L.; Ersson, B.; Porath, J. Biotechnology and applied biochemistry
1989, 11, 424-431.
[247] McCluskey, A. J.; Poon, G. M. K.; Gariepy, J. Protein Science 2007, 16, 2726-2732.
[248] Lee, K.-M.; Ma, K.-W.; Shaw, P.-C.; Wong, K.-B. Analytical Biochemistry 2006, 358, 152-154.
[249] Cantin, G. T.; Yi, W.; Lu, B.; Park, S. K.; Xu, T.; Lee, J.-D.; Yates, J. R. Journal of
Proteome Research 2008, 7, 1346-1351.
[250] Kermani, B. G.; Kozlov, I.; Melnyk, P.; Zhao, C.; Hachmann, J.; Barker, D.; Lebl, M. Sensors and Actuators, B: Chemical 2007, B125, 149-157.
[251] Ueda, E. K. M.; Gout, P. W.; Morganti, L. Journal of Chromatography, A 2003, 988, 1-
23.
[252] Pearson, R. G. Journal of Chemical Education 1968, 45, 581-587.
[253] Arnold, F. H. Biotechnology 1991, 9, 151-156.
[254] Sulkowski, E. BioEssays 1989, 10, 170-175.
[255] Min, C.; Verdine, G. L. Nucleic Acids Research 1996, 24, 3806-3810.
207
[256] Hochuli, E.; Doebeli, H.; Schacher, A. Journal of Chromatography 1987, 411, 177-184. [257] Gaberc-Porekar, V.; Menart, V. Chemical Engineering & Technology 2005, 28, 1306-
1314.
[258] Sundberg, R. J.; Martin, R. B. Chemical Reviews 1974, 74, 471-517.
[259] Gasparac, R.; Martin, C. R.; Stupnisek-Lisac, E.; Mandic, Z. Journal of the Electrochemical Society 2000, 147, 991-998.
[260] Meier, M. A. R.; Schubert, U. S. Journal of Polymer Science, Part A: Polymer Chemistry
2003, 41, 2964-2973.
[261] Herrero, M.; Tiemblo, P.; Reyes-Labarta, J.; Mijangos, C.; Reinecke, H. Polymer 2002, 43, 2631-2636.
[262] Tiemblo, P.; Guzman, J.; Riande, E.; Mijangos, C.; Reinecke, H. Macromolecules 2002,
35, 420-424.
[263] Dias Filho, N. L. Mikrochimica Acta 1999, 130, 233-240.
[264] Kemlo, J. A.; Shepherd, T. M. Chemical Physics Letters 1977, 47, 158-162.
[265] Varnes, A. W.; Dodson, R. B.; Wehry, E. L. Journal of the American Chemical Society 1972, 94, 946-950.
[266] de Silva, A. P.; Gunaratne, H. Q. N.; Gunnlaugsson, T.; Huxley, A. J. M.; McCoy, C. P.;
Rademacher, J. T.; Rice, T. E. Chemical Reviews 1997, 97, 1515-1566.
[267] Fabbrizzi, L.; Licchelli, M.; Pallavicini, P.; Sacchi, D.; Taglietti, A. Analyst 1996, 121, 1763-1768.
[268] Huang, F.; Tian, Y.; Chen, C.-Y.; Cheng, Y.-J.; Young, A. C.; Jen, A. K. Y. Journal of
Physical Chemistry C 2007, 111, 10673-10681.
[269] McFarland, S. A.; Finney, N. S. Journal of the American Chemical Society 2001, 123, 1260-1261.
[270] You, C.-C.; Hippius, C.; Gruene, M.; Wuerthner, F. Chemistry--A European Journal
2006, 12, 7510-7519.
[271] Shen, Y.; Mackey, G.; Rupcich, N.; Gloster, D.; Chiuman, W.; Li, Y.; Brennan, J. D. Analytical Chemistry 2007, 79, 3494-3503.
[272] Hartwig, J. F.; Pil, P. M.; Lippard, S. J. Journal of the American Chemical Society 1992,
114, 8292-8293.
208
[273] Thornton, N. B.; Schanze, K. S. New Journal of Chemistry 1996, 20, 791-800. [274] McFarland, S. A.; Finney, N. S. Journal of the American Chemical Society 2002, 124,
1178-1179.
[275] Cotton, F. A., Wilkinson, G. Advanced Inorganic Chemistry, 5th ed.; John Wiley & Sons: NY, 1987.
[276] Housecroft, C. E., Sharpe, A. G. Inorganic Chemistry; Prentice Hall: NY, 2001.
[277] Silva, H. A. S.; Carlos, R. M.; Camargo, A. J.; Picchi, C. M. C.; Santos, R. H. d. A.;
McGarvey, B. R.; Franco, D. W. Inorganica Chimica Acta 2004, 357, 3147-3154.
[278] O'Sullivan, J. P.; Hockey, J. A.; Wood, G. C. Transactions of the Faraday Society 1969, 65, 535-541.
[279] Kimura, Y.; Shiraki, H.; Ishibashi, K.-i.; Ishii, H.; Itaya, K.; Niwano, M. Journal of the
Electrochemical Society 2006, 153, C296-C300.
[280] Abbott, T. P.; Nabetani, H.; Sessa, D. J.; Wolf, W. J.; Liebman, M. N.; Dukor, R. K. Journal of Agricultural and Food Chemistry 1996, 44, 2220-2224.
[281] Malhotra, V. M.; Jasty, S.; Mu, R. Applied Spectroscopy 1989, 43, 638-645.
[282] Spinner, E. Journal of the Chemical Society 1960, 1237-1242.
[283] Spinner, E. Spectrochimica Acta 1959, 95-109.
[284] Spinner, E. Journal of the Chemical Society 1962, 3127-3128.
[285] Katritzky, A. R.; Witek, R. M.; Rodriguez-Garcia, V.; Mohapatra, P. P.; Rogers, J. W.;
Cusido, J.; Abdel-Fattah, A. A. A.; Steel, P. J. Journal of Organic Chemistry 2005, 70, 7866-7881.
[286] Hayashi, T.; Mukamel, S. Journal of Physical Chemistry B 2007, 111, 11032-11046.
[287] Waldron, R. D. Physical Review 1955, 99, 1727-1735.
[288] Feenan, K.; Fowles, G. W. A. Journal of the Chemical Society 1965, 2449-2451.
[289] Kyotani, T.; Sato, K.; Mizuno, T.; Kakui, S.; Aizawa, M.; Saito, J.; Ikeda, S.; Ichikawa,
S.; Nakane, T. Analytical Sciences 2005, 21, 321-325.
[290] Do, J.; Ahn, C. H. Lab on a Chip 2008, 8, 542-549.
209
[291] VanWiggeren, G. D.; Bynum, M. A.; Ertel, J. P.; Jefferson, S.; Robotti, K. M.; Thrush, E. P.; Baney, D. M.; Killeen, K. P. Sensors and Actuators, B: Chemical 2007, B127, 341-349.
[292] Medyantseva, E. P.; Varlamova, R. M.; Gimaletdinova, D. A.; Fattakhova, A. N.;
Budnikov, G. K. Journal of Analytical Chemistry 2008, 63, 275-279.
[293] Borisov, S. M.; Wolfbeis, O. S. Chemical Reviews 2008, 108, 423-461.
[294] Goel, G.; Kumar, A.; Puniya, A. K.; Chen, W.; Singh, K. Journal of Applied Microbiology 2005, 99, 435-442.
[295] Zeineldin, R.; Piyasena, M. E.; Sklar, L. A.; Whitten, D.; Lopez, G. P. Langmuir 2008,
24, 4125-4131.
[296] Ko, S.; Grant, S. A. Biosensors & Bioelectronics 2006, 21, 1283-1290.
[297] Liu, X.; Tan, W. Analytical Chemistry 1999, 71, 5054-5059.
[298] Wu, P.; Brand, L. Analytical Biochemistry 1994, 218, 1-13.
[299] Kagan, C. R.; Murray, C. B.; Nirmal, M.; Bawendi, M. G. Physical Review Letters 1996, 76, 3043.
[300] Cheung, H. C.; Dong, W.-J. Reviews in Fluorescence 2006, 3, 445-462.
[301] Schuler, B. Chemphyschem 2005, 6, 1206-1220.
[302] Invitrogen. Amine-Reactive Probes, MP00143, Molecular Probes: Eugene, OR, 2007.
http://probes.invitrogen.com/media/pis/mp00143.pdf [303] http://probes.invitrogen.com/handbook/boxes/0422.html
[304] Piunno, P. A. E.; Krull, U. J.; Hudson, R. H. E.; Damha, M. J.; Cohen, H. Analytical
Chemistry 1995, 67, 2635-2643.
[305] Wang, J.; Xu, D.; Kawde, A. N.; Polsky, R. Analytical chemistry 2001, 73, 5576-5581.
[306] Taton, T. A.; Mirkin, C. A.; Letsinger, R. L. Science 2000, 289, 1757-1760.
[307] Drummond, T. G.; Hill, M. G.; Barton, J. K. Nature Biotechnology 2003, 21, 1192-1199.
[308] Su, X.; Robelek, R.; Wu, Y.; Wang, G.; Knoll, W. Analytical Chemistry 2004, 76, 489-494.
210
[309] Maruyama, K.; Mishima, Y.; Minagawa, K.; Motonaka, J. Analytical Chemistry 2002, 74, 3698-3703.
[310] Zhao, X.; Tapec-Dytioco, R.; Tan, W. Journal of the American Chemical Society 2003,
125, 11474-11475.
[311] Landers, J. P. Analytical Chemistry 2003, 75, 2919-2927.
[312] Miao, W.; Bard, A. J. Analytical Chemistry 2004, 76, 5379-5386.
[313] Castro, A.; Dalvit, D. A. R.; Paz-Matos, L. Analytical Chemistry 2004, 76, 4169-4174.
[314] Wang, R.; Minunni, M.; Tombelli, S.; Mascini, M. Biosensors & Bioelectronics 2004, 20, 598-605.
[315] Bui, M.-P. N.; Baek, T. J.; Seong, G. H. Analytical and Bioanalytical Chemistry 2007,
388, 1185-1190.
[316] Watson, J. D.; Crick, F. H. C. Nature 1953, 171, 737-738.
[317] Marmur, J.; Doty, P. Journal of molecular biology 1961, 3, 585-594.
[318] Nielsen, P. E.; Egholm, M.; Berg, R. H.; Buchardt, O. Science 1991, 254, 1497-1500.
[319] Nielsen, P. E. Current opinion in biotechnology 1999, 10, 71-75.
[320] Wang, J. Biosensors & Bioelectronics 1998, 13, 757-762.
[321] Arlinghaus, H. F.; Kwoka, M. N.; Jacobson, K. B. Analytical Chemistry 1997, 69, 3747-3753.
[322] Wang, J.; Palecek, E.; Nielsen, P. E.; Rivas, G.; Cai, X.; Shiraishi, H.; Dontha, N.; Luo,
D.; Farias, P. A. M. Journal of the American Chemical Society 1996, 118, 7667-7670.
[323] Aoki, H.; Umezawa, Y. Analyst 2003, 128, 681-685.
[324] Abel, A. P.; Weller, M. G.; Duveneck, G. L.; Ehrat, M.; Widmer, H. M. Analytical Chemistry 1996, 68, 2905-2912.
[325] Methods in Enzymology: Aviding-Biotin Technology, 1990, 184, 1-617.
[326] Macdonald, J. R. Impedance Spectroscopy; Emphasizing Solid Materials and Systems;
Wiley Interscience publications: NY, 1987.
[327] Winkler, B. H.; Baltus, R. E. Journal of Membrane Science 2003, 226, 75-84.
211
BIOGRAPHICAL SKETCH
Héctor Mario Caicedo was born in Cali, Colombia. He graduated with a B.S. in chemistry
from the Universidad del Valle, in Cali. For his bachelor’s thesis he conducted research in
analytical chemistry focusing on environmental pollutants under the direction of Dr. Nelly de
Palacios (his mentor in chemistry), developing an analytical methodology for the evaluation of
chromium in urine and blood by using electrothermal atomic absorption spectroscopy (ETAAS).
After that, he worked as a chemist in the industrial field, for a combined time of almost four
years, for both a biotechnology and pharmaceutical company. Then, he decided to go back to
academia to conduct his Master of Science in analytical chemistry at the Universidad del Valle.
In the summer of 2000, he visited the University of Florida as an international exchange student,
conducting research in electrochemistry, as a part of his master’s research work, using carbon
fiber ultramicroelectrodes under the direction of Dr. Anna Brajter-Toth. After returning to the
Universidad del Valle, he conducted research in electroanalysis of xanthine by using carbon fiber
ultramicroelectrodes with surfaces electrochemically activated and polymer-modified, in the
group of Dr. Alonso Jaramillo. Once he graduated with a M.S. in chemistry from the University
del Valle, he continued his graduate studies in the Department of Chemistry at the University of
Florida to pursue his Ph.D. He worked under the supervision of Dr. Charles R. Martin, where he
conducted research in bioanalytical applications of affinity-based nanotube membranes for
sensing and separations. He completed his final work in April 2008, when he received a Doctor
of Philosophy degree.
212


![Bioanalytical Methods I · Institute of Analytical and Bioanalytical Chemistry Faculty of Natural Sciences Ulm University. Modulinhalt 2 1 Modulinhalt Bioanalytical Methods [59]](https://img.pdfslide.us/doc/110x75/5f7e22e1de3c6028f1353020/bioanalytical-methods-i-institute-of-analytical-and-bioanalytical-chemistry-faculty.jpg)