Embed Size (px)
Citation preview
1SCiEnTifiC REPORTS | 7: 16999 | DOI:10.1038/s41598-017-15462-x
www.nature.com/scientificreports
Bioaccumulation of pharmaceuticals and personal care product chemicals in fish exposed to wastewater effluent in an urban wetlandDerek Muir , Denina Simmons, Xiaowa Wang, Tom Peart, Maria Villella, Jason Miller & Jim Sherry
The bioaccumulation of a broad range of pharmaceuticals and personal care product chemicals (PPCPs) was studied in Cootes Paradise Marsh (CPM), an urban wetland that receives tertiary treated municipal waste waters as well as urban storm runoff. We measured PPCPs in caged and wild goldfish, as well as wild carp, and compared observed bioaccumulation factors (BAFP) using concentrations in surface waters and fish blood plasma, with modeled BAFs. Thirty-two PPCPs were detected in water from the central CPM site (CPM3) while 64 PPCPs were found at higher concentrations at a site immediately downstream of the effluent outflow (CPM1). Following a 3-week deployment, 15 PPCPs were detected in the plasma of caged goldfish at CPM1, and 14 at CPM3, compared to only 3 in goldfish caged at a reference site. The highest BAFP in goldfish were for the antidepressant Σfluoxetine averaging 386 L/kg in caged and 906 L/kg in wild goldfish, respectively. In carp, ΣDiazepam (diazepam and oxazepam) had the highest BAFP (927 L/kg). This study identified a broader range of PPCPs in fish and surface waters than previously reported. However, modeled BAFs did not show good agreement with observed whole body or plasma BAFs, demonstrating that more work is needed to better explain bioaccumulation of PPCPs.
Pharmaceuticals and personal care products (PPCPs) and endocrine disrupting compounds (EDCs) have been measured in municipal wastewater effluents and in receiving waters in southern Ontario (Canada) including in Hamilton Harbour1–5 and the adjoining Cootes Paradise Marsh (CPM)6,7. Chemicals in some personal care prod-ucts such as musks, triclosan, UV filters, and alkyl phenols have been widely determined in wild fish8,9 including in fish from rivers and harbours in the North American Great Lakes region10–14. Many of these latter compounds are relatively hydrophobic and predicted to bioaccumulate in fish15. However, there have been fewer measure-ments of pharmaceuticals in wild fish possibly because these substances are more polar and assumed to be less bioaccumulative and more readily metabolised11,16,17. However, Howard and Muir18 evaluated the pharmaceuti-cals in active production/use and concluded that about 20% of the high production volume active ingredients, that had not yet been detected in environmental media, were potentially persistent and bioaccumulative in fish. Chu and Metcalfe19 detected the antidepressants paroxetine and fluoxetine as well as the active metabolite, nor-fluoxetine, in fish from Hamilton Harbour using whole fish tissue. Huerta et al.9 reviewed the literature on meas-urements of pharmaceuticals in tissues of wild fish to 2012 and found about 40 compounds had been reported. Since then larger numbers have been measured, in either whole fish or muscle20–24 and in various other tissues including plasma25–28. Nevertheless the number analysed to date is far smaller than the number of active pharma-ceutical ingredients9. Given that pharmaceuticals are biologically active chemicals, further exposure information, particularly for internal tissue doses, would be useful so that the risks to fish are better understood29–31.
Our objective was to measure PPCPs in caged and wild goldfish, as well as in wild carp, from Cootes Paradise Marsh (CPM), in addition to a reference site (Jordan Harbour, JH), in order to help interpret proteomic, metab-olomic, and behavioral effects data being generated in companion studies on the same fish32,33. CPM is a 250-ha wetland, within the 850 ha conservation area owned and managed by the Royal Botanical Gardens and is located
Aquatic Contaminants Research Division, Water and Science Technology Directorate, Environment & Climate Change Canada, Burlington, ON L7S 1A1, Canada. Correspondence and requests for materials should be addressed to D.M. (email: [email protected])
Received: 7 June 2017
Accepted: 18 October 2017
Published: xx xx xxxx
OPEN

www.nature.com/scientificreports/
2SCiEnTifiC REPORTS | 7: 16999 | DOI:10.1038/s41598-017-15462-x
at the western tip of Hamilton Harbour (Supplementary Information Figure S1). It receives water from 3 urban creeks as well as a wastewater treatment plant which uses tertiary treatment. The nutrient and organic contami-nant inputs and distribution in the marsh are described in detail by Kelton et al.34 and Mayer et al.7.
Measurement of pharmaceuticals in fish has been proposed as a way of assessing potential hazards by com-paring observed levels in fish blood plasma to human therapeutic plasma doses35. An increasing number of stud-ies have included measurements of pharmaceuticals in fish plasma25,26,36,37. Therefore plasma was chosen as the matrix for PPCP analysis. We were also interested to determine bioaccumulation factors for PPCPs in fish by comparing concentrations in waters and in fish plasma from the same sites. Previous studies of bioaccumulation of pharmaceuticals in fish tissues have generally targeted limited numbers of compounds9,16,38,39, however the recent availability of methodology for quantitative analysis of over 120 analytes has enabled broader suites to be determined in invertebrates and fishes20,40. By addressing a larger suite of PPCPs than has previously been determined and doing so in fish plasma we hoped to help to prioritize which compounds represent the greatest exposure risk for wild fish near municipal wastewater outfalls.
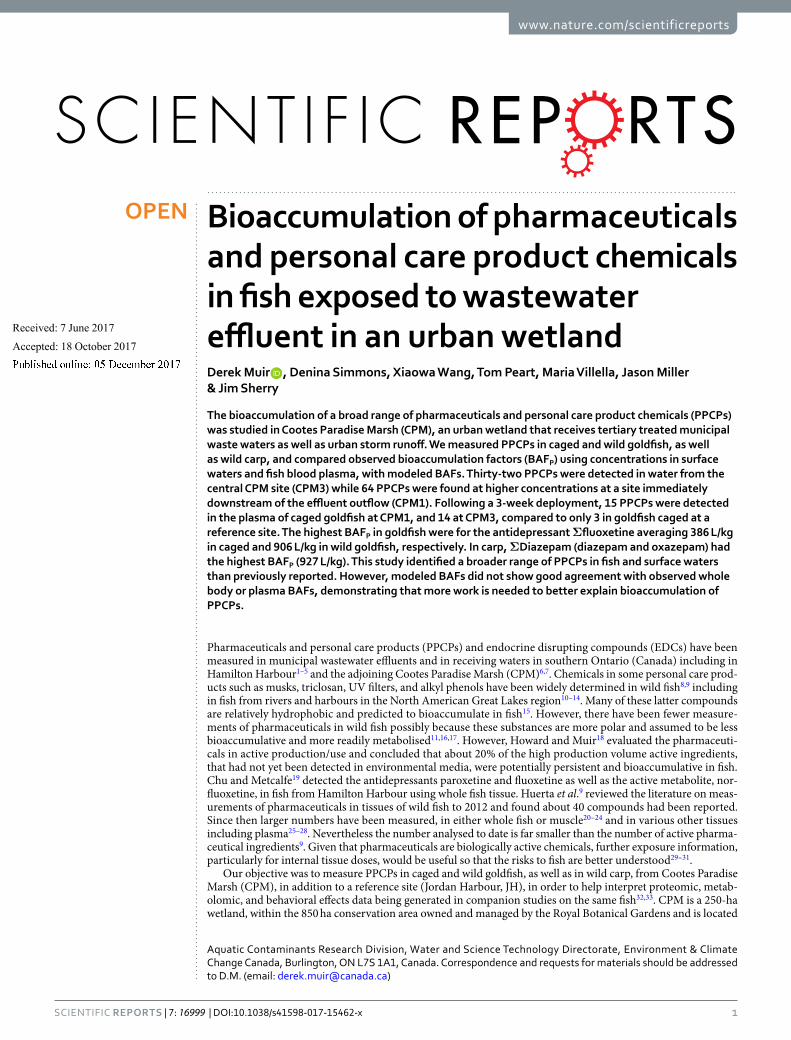
Results and DiscussionPPCPs in water. A large number of compounds (64/127) at relatively high concentrations were found at CPM1, at the outlet of the Desjardins Canal, which contains mainly the tertiary treated effluent of the Dundas Wastewater Treatment Plant (Fig. 1; SI Table S2). At site CPM2, which is about 450 m downstream of CPM1, the number of PPCPs detected was lower (39/127) than at CPM1, indicating degradation and dilution was occurring. Thirty-two of 127 PPCP target analytes were detected in water from the central CPM site (CPM3) in samples col-lected in January and July 2014 (SI Table S2; Fig. 1). PPCPs were detected at the same frequency and generally at a similar range of concentrations in samples collected at CPM3 in August 2012. This latter sample had been stored at −20 °C until analysed in 2014 while the January and July sample holding times (4 °C) were approximately 40 and 190 days, respectively. Thus despite different holding times, samples from three different time periods had the same PPCP detection frequency and range of concentrations. The effect of holding times is discussed further in Supplementary Information Detection frequency was considerably lower at the reference site (JH), with 17 and 16 of 127 analytes detected in January and July, respectively (SI Table S2).
Considering all sampling times and sites, altogether a total of 69 individual analytes (62 with transforma-tion products combined with parents) were detectable in water and fish plasma. The major PPCPs present in Desjardins Canal outflowing waters with concentrations in the range of 1000 to 11800 ng/L were ibuprofen (including its hydroxyl degradation product), caffeine (and its degradation product 1,7-dimethylxanthine), naproxen, valsartan, theophylline, azithromycin and bisphenol A. Figure 1 compares the concentration profiles of the detected PPCPs in January 2014 from the Desjardins Canal outflow (CPM1), at CPM2, CPM3, and JH, the reference site. With the exception of iopamidol (a contrast agent), which had higher concentrations at CPM3 in January sampling, concentrations were 1.3 to 12000-times higher closer to the wastewater outfall (CPM1) com-pared to the central marsh site (CPM3). Concentrations of iopamidol were also higher at CPM3 compared to the CPM1 in July 2014 (SI Table S2). The source of iopamidol is therefore unlikely to be the WWTP effluent. CPM3 waters are influenced by inflows from 3 streams (Borer’s Creek, Chedoke Creek, Spencer’s Creek). The Chedoke Creek catchment is a possible source because it is heavily urbanized and the stream consists mainly of under-ground channels as well as a combined sewer overflows7,34. Concentrations of PPCPs in JH were generally much lower than at CPM3, however, several compounds including iopamidol, as well as antidepressants diazepam and meprobamate, the lipid regulator gemfibrozil and the antibiotic lincomycin were present at similar concentra-tions as those at CPM3 (Fig. 1). The source of these compounds for JH is probably leakage from domestic septic systems within the catchment of Twenty Mile Creek, the main inflowing stream; municipal wastewater from the town of Jordan does not enter the harbour41.
Concentrations of PPCPs in surface waters were generally higher in January than in July at CPM1, CPM2 and JH (SI Figure S1). Higher water temperatures in July (20–22 °C) than in January (0–5 °C), as well as greater sun-light irradiation of the surface waters in summer, likely led to more rapid transformation42. Seasonal differences in use of pharmaceuticals could also be important. The longer storage time for the July 2014 samples could also have led to lower measured concentrations as discussed further in the Supplementary Information. A relatively high day to day variation of PPCP concentrations was observed in the 4 sampling times from January 21 to February 3 at CPM1 (SI Table S1). For example iopamidol increased steadily from 68 to 783 ng/L over this period while others (penicillin G, melphalan, diltiazem, and ibuprofen) declined. Overall about 40% of the 63 compounds had relative standard deviations of >50% in the January sampling at CPM1. This variation was not due to changes in water flow. Detailed basic water chemistry parameters are given in SI Table S6. Basic water chemistry parameters remained relatively constant over the January sampling period at CPM 1 (Canal outlet) and CPM3 (SI Table S3).
PPCPs in fish plasma. The detection frequency of the PPCPs in pooled plasma of caged goldfish was much lower than in surface waters collected during the 3 week deployment period (Fig. 2) with only 16 of 127 analytes detectable at CPM1, and 15 at CPM2 and CPM3 (SI Table S4). The compounds detected were the same at all 3 CPM sites except that anhydrochlortetracyclin, a chlorotetracycline analog, was detected at CPM1 but not in samples from CPM2 and CPM3 (SI Table S4). Nine of the 16 PPCPs were antidepressants; sertraline, venlafax-ine, citalopram, ΣAmitriptyline (amitriptyline +10-hydroxy-amitriptyline, ΣDiazepam (diazepam + oxazepam) and ΣFluoxetine (fluoxetine + norfluoxetine). Concentrations in goldfish plasma were 1.3 to 4-fold higher in the caged goldfish at the site with high wastewater exposure (CPM1) compared to fish found at the far-field site in the marsh (CPM3) with two exceptions; the antibiotic erythromycin was two-fold higher at CPM3 (0.50 ng/g vs 0.22 ng/g), and the lipid regulator gemfibrozil, which showed no difference in concentration (0.15 ng/g; Fig. 2). Goldfish caged at JH had a much lower frequency of detection with just 3 of 127 analytes detected (oxazepam, erythromycin and DEET). Plasma concentrations of oxazepam (0.91 ng/g) and erythromycin (0.23 ng/g) in the
www.nature.com/scientificreports/
3SCiEnTifiC REPORTS | 7: 16999 | DOI:10.1038/s41598-017-15462-x
JH goldfish were within 10% to those at CPM1 (SI Table S4), despite this reference site not having the direct influ-ence of municipal wastewater.
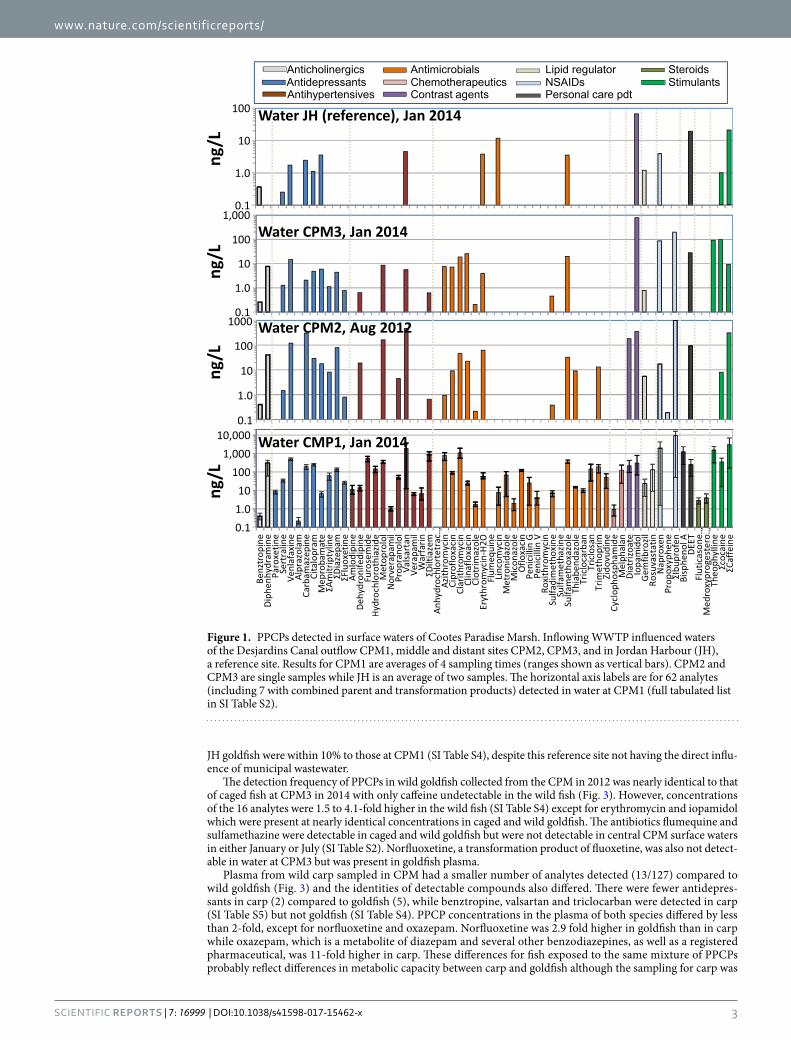
The detection frequency of PPCPs in wild goldfish collected from the CPM in 2012 was nearly identical to that of caged fish at CPM3 in 2014 with only caffeine undetectable in the wild fish (Fig. 3). However, concentrations of the 16 analytes were 1.5 to 4.1-fold higher in the wild fish (SI Table S4) except for erythromycin and iopamidol which were present at nearly identical concentrations in caged and wild goldfish. The antibiotics flumequine and sulfamethazine were detectable in caged and wild goldfish but were not detectable in central CPM surface waters in either January or July (SI Table S2). Norfluoxetine, a transformation product of fluoxetine, was also not detect-able in water at CPM3 but was present in goldfish plasma.
Plasma from wild carp sampled in CPM had a smaller number of analytes detected (13/127) compared to wild goldfish (Fig. 3) and the identities of detectable compounds also differed. There were fewer antidepres-sants in carp (2) compared to goldfish (5), while benztropine, valsartan and triclocarban were detected in carp (SI Table S5) but not goldfish (SI Table S4). PPCP concentrations in the plasma of both species differed by less than 2-fold, except for norfluoxetine and oxazepam. Norfluoxetine was 2.9 fold higher in goldfish than in carp while oxazepam, which is a metabolite of diazepam and several other benzodiazepines, as well as a registered pharmaceutical, was 11-fold higher in carp. These differences for fish exposed to the same mixture of PPCPs probably reflect differences in metabolic capacity between carp and goldfish although the sampling for carp was
Figure 1. PPCPs detected in surface waters of Cootes Paradise Marsh. Inflowing WWTP influenced waters of the Desjardins Canal outflow CPM1, middle and distant sites CPM2, CPM3, and in Jordan Harbour (JH), a reference site. Results for CPM1 are averages of 4 sampling times (ranges shown as vertical bars). CPM2 and CPM3 are single samples while JH is an average of two samples. The horizontal axis labels are for 62 analytes (including 7 with combined parent and transformation products) detected in water at CPM1 (full tabulated list in SI Table S2).

www.nature.com/scientificreports/
4SCiEnTifiC REPORTS | 7: 16999 | DOI:10.1038/s41598-017-15462-x
one year earlier (2011 vs 2012) and therefore differences in exposure may also be influenced by temporal changes in prevailing water concentrations. Carp from JH also had a different set of PPCPs compared to caged goldfish (SI Figure S3) with benzotropine and flumequine detected in carp but not goldfish. Concentrations of erythro-mycin and DEET were about 2-fold higher in carp plasma than in goldfish. Brown bullhead plasma from Jordan Harbour had a low PPCP detection frequency (3/127) (SI Table S5).
Comparison with other studies of PPCPs in water and fish. The average concentrations of PPCPs at the central marsh site (furthest from the WWTP outfall, CPM3) were generally lower than the average of mean values from other studies on pharmaceuticals in global rivers and streams (SI Table S6) summarized in the review by aus der Beek et al.43. The exceptions were for clinafloxacin, iopamidol, and theophylline which were higher than average global concentrations and clarithromycin and naproxen, which had maximum concentrations at CPM3 that exceeded average global concentrations. As noted previously, central CPM waters are influenced by inflows from 3 streams with urban sources (e.g. from combined sewer overflows) to the south, suburban develop-ment to the west, and forested parkland to the north, as well as by the Desjardin Canal WWTP inflow (Figure S1). Thus it is similar to other effluent-dominated rivers and streams that have been studied extensively in the USA, Western Europe, Japan, and China for simultaneous measurements of PPCPs in water and fish tissues8,22,24–27,44.
While over 600 pharmaceuticals were identified in aquatic matrices (not including biota) in the review by aus der Beek et al.43, until recently only a limited number of measurements have been made with fish plasma or indeed in tissues of wild fish in general9. Meador et al.20 substantially increased the detected number of pharma-ceuticals detected in fish when they analysed for about 74 PPCPs and found 31 in sculpin (Leptocottus armatus) and 23 in juvenile chinook salmon (Oncorhynchus tshawytscha) (in whole body composites). Meador et al. used the same analytical lab as this study and a similar analytical list; a side by side comparison of the results is given in SI Table S7. Analytes present at higher concentrations in goldfish and carp plasma (amitriptyline, caffeine, DEET,
Figure 2. PPCPs detected in plasma of caged goldfish at the same sampling locations in Cootes Paradise Marsh (July 2014). Bars represent concentrations in a single pooled sample from 25 fish. Cage deployment sites are the same as those for water. See SI Table S1 for a tabulated list of the analytes on the horizontal axis.
www.nature.com/scientificreports/
5SCiEnTifiC REPORTS | 7: 16999 | DOI:10.1038/s41598-017-15462-x
diphenhydramine, erythromycin, fluoxetine/norfluoxetine, gemfibrozil and sertraline) also were prominent in salmon and sculpin tissue (SI Table S7). Other studies that have determined pharmaceuticals in fish tissues (mus-cle, brain or liver) and results for the compounds detected in this study are summarized in SI Table S8. Similar to the results from the study by Meador et al.20, diphenhydramine, fluoxetine, gemfibrozil, and sertraline have been widely reported in fish tissues9. Approximately 50 pharmaceuticals have been targeted for analysis either in plasma of wild fish26,27,44 or in plasma of fish exposed to final municipal wastewater effluent in the lab36,37. Fick et al.37 showed that rainbow trout exposed in the lab to WWTP effluent had pharmaceuticals in plasma at con-centrations similar to human therapeutic doses and also demonstrated the suitability of plasma as a matrix for pharmaceuticals with a wide range of hydrophobicity and pKa. In laboratory bioconcentration tests, fish plasma has also been shown to generally have similar or higher concentrations of pharmaceuticals and their metabolites compared to muscle45–47. Tanoue et al.25 determined four PPCPs in common with this study (flumequine, diphen-hydramine, triclocarban and sertraline) in plasma and other tissues of carp from wastewater-impacted streams and reported a similar range of concentrations in plasma (SI Table S8). Zhao et al.27 determined 9 antibiotics in fish plasma including two (sulfamethazine and erythromycin) that were included in the present study. However, concentrations were about 50-fold higher (SI Table S8).
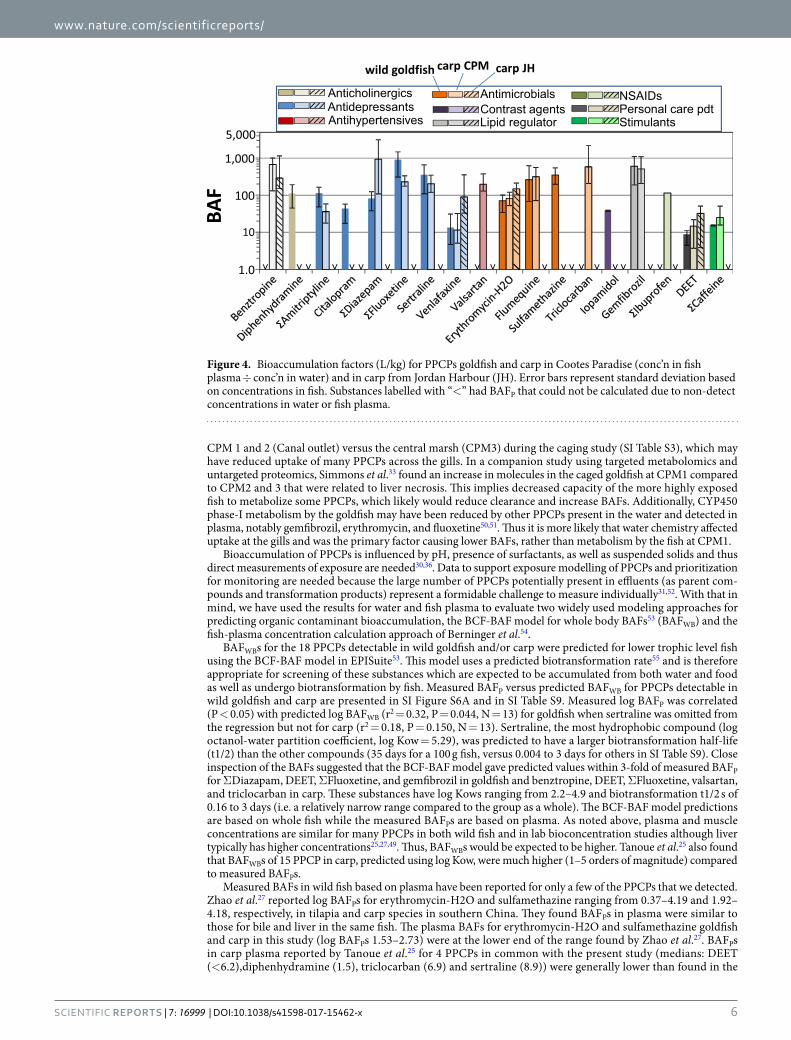
Bioaccumulation factors. The highest plasma BAF (BAFP) in goldfish was found for the antidepressant ΣFluoxetine, ranging from 906 L/kg in wild goldfish, and from 207–689 in caged goldfish (Fig. 4, SI Table S9). In carp, ΣDiazepam had the highest BAFP (927 L/kg) mainly due to its metabolite oxazepam (Fig. 4, SI Table S9). Three compounds, carbamazepine, metoprolol and sulfamethoxazole, which were consistently detected in water from sites CPM1–3, and have been reported in other studies43,48, were not detected in fish plasma suggesting rapid biotransformation. BAFPs for the PPCPs detected in caged goldfish varied among locations in CPM (SI Table S9; Figure S4) with highest values generally at CPM3. It should be noted, however, that the BAFP for goldfish at CPM2 was based on water concentrations from a sample taken in August 2012 while all others are from the deployment period in July 2014, and are therefore less certain. Combining results for caged goldfish from all 3 sites showed that BAFPs declined significantly (R2 = 0.51; P < 0.001) with increasing water concentrations (Figure S5). Liu et al.49 also reported a significant inverse relationship between the brain and liver BAFs of several antibiotics in fish and the log concentration in water. Our results for caged goldfish with identical exposure period, size and sex confirm Liu et al.’s observations. The lower BAFP with higher water concentrations could be due to a number of factors including lower bioavailability of PPCPs at sites closer to the effluent as well as physiological impacts on the fish. In the present study pH was lower (0.4 units) and dissolved and particulate organic carbon 2-fold higher near
Figure 3. Mean concentrations and range of PPCPs detected in plasma of wild goldfish and wild carp collected in Cootes Paradise Marsh and the reference site (JH). Error bars represent standard deviations. See SI Table S1 for a tabulated list of the analytes on the horizontal axis and SI Table S4 and S5 for concentrations in individual sample pools.
www.nature.com/scientificreports/
6SCiEnTifiC REPORTS | 7: 16999 | DOI:10.1038/s41598-017-15462-x
CPM 1 and 2 (Canal outlet) versus the central marsh (CPM3) during the caging study (SI Table S3), which may have reduced uptake of many PPCPs across the gills. In a companion study using targeted metabolomics and untargeted proteomics, Simmons et al.33 found an increase in molecules in the caged goldfish at CPM1 compared to CPM2 and 3 that were related to liver necrosis. This implies decreased capacity of the more highly exposed fish to metabolize some PPCPs, which likely would reduce clearance and increase BAFs. Additionally, CYP450 phase-I metabolism by the goldfish may have been reduced by other PPCPs present in the water and detected in plasma, notably gemfibrozil, erythromycin, and fluoxetine50,51. Thus it is more likely that water chemistry affected uptake at the gills and was the primary factor causing lower BAFs, rather than metabolism by the fish at CPM1.
Bioaccumulation of PPCPs is influenced by pH, presence of surfactants, as well as suspended solids and thus direct measurements of exposure are needed30,36. Data to support exposure modelling of PPCPs and prioritization for monitoring are needed because the large number of PPCPs potentially present in effluents (as parent com-pounds and transformation products) represent a formidable challenge to measure individually31,52. With that in mind, we have used the results for water and fish plasma to evaluate two widely used modeling approaches for predicting organic contaminant bioaccumulation, the BCF-BAF model for whole body BAFs53 (BAFWB) and the fish-plasma concentration calculation approach of Berninger et al.54.
BAFWBs for the 18 PPCPs detectable in wild goldfish and/or carp were predicted for lower trophic level fish using the BCF-BAF model in EPISuite53. This model uses a predicted biotransformation rate55 and is therefore appropriate for screening of these substances which are expected to be accumulated from both water and food as well as undergo biotransformation by fish. Measured BAFP versus predicted BAFWB for PPCPs detectable in wild goldfish and carp are presented in SI Figure S6A and in SI Table S9. Measured log BAFP was correlated (P < 0.05) with predicted log BAFWB (r2 = 0.32, P = 0.044, N = 13) for goldfish when sertraline was omitted from the regression but not for carp (r2 = 0.18, P = 0.150, N = 13). Sertraline, the most hydrophobic compound (log octanol-water partition coefficient, log Kow = 5.29), was predicted to have a larger biotransformation half-life (t1/2) than the other compounds (35 days for a 100 g fish, versus 0.004 to 3 days for others in SI Table S9). Close inspection of the BAFs suggested that the BCF-BAF model gave predicted values within 3-fold of measured BAFP for ΣDiazapam, DEET, ΣFluoxetine, and gemfibrozil in goldfish and benztropine, DEET, ΣFluoxetine, valsartan, and triclocarban in carp. These substances have log Kows ranging from 2.2–4.9 and biotransformation t1/2 s of 0.16 to 3 days (i.e. a relatively narrow range compared to the group as a whole). The BCF-BAF model predictions are based on whole fish while the measured BAFPs are based on plasma. As noted above, plasma and muscle concentrations are similar for many PPCPs in both wild fish and in lab bioconcentration studies although liver typically has higher concentrations25,27,49. Thus, BAFWBs would be expected to be higher. Tanoue et al.25 also found that BAFWBs of 15 PPCP in carp, predicted using log Kow, were much higher (1–5 orders of magnitude) compared to measured BAFPs.
Measured BAFs in wild fish based on plasma have been reported for only a few of the PPCPs that we detected. Zhao et al.27 reported log BAFPs for erythromycin-H2O and sulfamethazine ranging from 0.37–4.19 and 1.92–4.18, respectively, in tilapia and carp species in southern China. They found BAFPs in plasma were similar to those for bile and liver in the same fish. The plasma BAFs for erythromycin-H2O and sulfamethazine goldfish and carp in this study (log BAFPs 1.53–2.73) were at the lower end of the range found by Zhao et al.27. BAFPs in carp plasma reported by Tanoue et al.25 for 4 PPCPs in common with the present study (medians: DEET (<6.2),diphenhydramine (1.5), triclocarban (6.9) and sertraline (8.9)) were generally lower than found in the
Figure 4. Bioaccumulation factors (L/kg) for PPCPs goldfish and carp in Cootes Paradise (conc’n in fish plasma ÷ conc’n in water) and in carp from Jordan Harbour (JH). Error bars represent standard deviation based on concentrations in fish. Substances labelled with “<” had BAFP that could not be calculated due to non-detect concentrations in water or fish plasma.

www.nature.com/scientificreports/
7SCiEnTifiC REPORTS | 7: 16999 | DOI:10.1038/s41598-017-15462-x
present study (SI Table S9). While plasma concentrations were similar (SI Table S8) water concentrations in their waste water impacted streams where higher compared to our central marsh (CPM3) site (eg diphenhydramine ~200x; sertraline ~20x). Du et al.28 observed a log BAFP of 2.2 ± 2.0 for diphenhydramine in longear sunfish (Lepomis megalotis) in a wastewater influenced stream, which is within the range found in goldfish in the present study. Fick et al.37 calculated a BAFP of 138–240 for sertraline in rainbow trout (Oncorhynchus mykiss) exposed to treated WWTP effluent from two Swedish cities. Those BAFPs were at the low end of the range in this study (gold-fish and carp BAFPs of 109–659). Fick et al.37 also found much lower BAFPs for ibuprofen (21–58) and oxazepam (diazepam) (0.7–3.6) than observed for goldfish and carp in this study (SI Table S9).
Fish blood-water partitioning. Bioaccumulation was also assessed by calculating fish blood-water parti-tion coefficients (PBW). These were estimated using the pKa value to adjust log Kow to a log D54 taking into account the pH of 7.7 of the central CPM waters (Table 1). Several of the detected pharmaceuticals (erythromycin-H2O, diphenhydramine, venlafaxine, sertraline) had basic or acidic pKa’s within about 2 log units of the prevailing pH which resulted in log D having lower values than Log Kow (Table 1). Predicted PBWs fell within a narrower range of values (SI Figure S6B) than predicted BAFs but were not correlated with measured BAFPs. PBW values for DEET, sertraline, and triclocarban in carp as well as citalopram and DEET in goldfish were within a factor 3 of observed BAFPs. However, measured BAFPs were under-predicted by over 100-fold for flumequine, sulfamet-hazine, gemfibrozil and ΣFluoxetine, while ΣAmitriptyline was over-predicted, in both species (SI Figure S6). Similarly predicted plasma concentrations (PBW x water conc (ng/mL)) were within a factor 5 of measured values for DEET, sertraline, venlafaxine and ΣDiazepam; ΣAmitriptyline was over predicted while all others were under predicted (SI Figure S7). Tanoue et al.25 also compared measured BAFP and predicted plasma BAFs for 15 PPCPs using log D values and the same fish-plasma concentration model35,54 used in the present study. Their predicted BAFPs were generally larger than measured BAFP , with about half of the compounds within 1 order of magnitude of measured values.
Table 1 compares the blood plasma levels of PPCPs in goldfish and carp and concentrations associated with human therapeutic and toxic doses reported by Schultz et al.56. All concentrations of individual PPCPs were lower by 50-fold or more than the range of concentrations of normal human therapeutic plasma (HTP) concentrations.
caged goldfish plasma
wild goldfish Cootes carp
log D (pH 7.7)
Predicted plasma bioaccumulation parameters
Therapeuticc “normal” ng/mL
toxic dosed ng/mL Cmax ng/mLe
ng/gb ng/g ng/g PBW FPC ng/mL Schulz et al.56 Schulz et al.56Berninger & Brooks60
Erythromycin-H2O Antibiotic 0.23–0.66 0.22–0.5 0.35–0.79 2.93 22.9 0.150 500–6000 12000–15000
Sulfamethazine Antibiotic 0.06–0.17 — — 0.19 1.06 0.0003
Flumequine Antibiotic 0.16–1.37 0.15–1.1 0.16–1.23 −0.40 0.92 0.002
Triclocarban Antimicrobial — — 0.32–3.35 4.90 605 0.909
Valsartan Antihypertensive — — 0.42–1.23 −0.49 0.91 0.003 ~800–6000
Diphenhydramine Anticholinergic 0.06–0.25 0.06–0.23 — 2.17 7.02 0.009 50–100 1000–2000 50
Benztropine Anticholinergic — — 0.05–0.41 1.48 2.76 0.001 10–180 50
Iopamidol Contrast agent 7.85–8.35 8.2–20.9 — −2.42 0.84 0.178
ΣCaffeine Stimulant 1.47–1.57 1.46–3.38 1.58–5.05 −0.07 0.98 0.097 4000–10000 15000–20000
DEET Repellent 0.23–0.58 0.31–0.42 0.19–1.15 2.18 7.08 0.369
Gemfibrozil Lipid regulator 0.15–0.86 0.15–0.15 0.16–0.83 1.83 4.30 0.003 ~25000
ΣIbuprofen NSAID — — 4.67–4.67 0.68 1.34 0.054 15000–30000 200000
ΣDiazepam Antidepressant 0.41–1.34 0.39–0.81 1.18–33.7 2.82 19.2 0.207 100–2000 3000–5000
Venlafaxine Antidepressant 0.04–0.26 0.04–0.17 0.04–0.27 1.70 3.62 0.030 100–400 1000–1500
Citalopram Antidepressant 0.04–0.13 0.04–0.16 — 3.28 86.8 0.194 50–110 220
ΣFluoxetine Antidepressant 0.31–1.5 0.32–1.18 0.18–0.34 1.42 2.58 0.002 120–500 1000 330
ΣAmitriptyline Antidepressant 0.04–0.15 0.05–0.07 0.02–0.05 4.92 626 0.566 50–300 500–600
Sertraline Antidepressant 0.04–0.24 0.04–0.11 0.04–0.13 3.51 59.5 0.021 50–250 290 290
Σantidepressants 0.89–3.61 0.87–2.49 1.46–34.5
Table 1. Range of concentrations of PPCPs detected in blood plasma of goldfish and carp along with predicted blood-water partitioning (PBW) and plasma concentrations (FPC). The range of human therapeutic and toxic doses is presented where availablea. aNote that results from Schultz et al. and Berninger & Brooks are converted from µg/mL in the original publications to ng/mL, for comparison with the fish plasma data. bConcentrations are expressed as ng/g plasma as reported by the analytical laboratory but are equivalent to ng/mL assuming a density of 1 g/mL. cTherapeutic: blood-plasma/serum concentrations (in general, trough at steady state) observed following therapeutically effective doses; no or only minimal side effects (drugs); “normal”: concentrations associated with no or only minimal toxic effects (other xenobiotics)56. dToxic: blood-plasma/serum concentrations which produce toxicity/clinically relevant side effects/symptoms. eCmax = human therapeutic dose.
www.nature.com/scientificreports/
8SCiEnTifiC REPORTS | 7: 16999 | DOI:10.1038/s41598-017-15462-x
However, the range of concentrations of the sum of all antidepressants concentrations in carp (1.46–34.5 ng/mL) was within 1.5x of the low end of the range of HTP concentrations for several antidepressants (Table 1).
ConclusionsThis study has identified a broader range of PPCPs in fish and surface waters downstream of urban waste water treatment facilities than have been reported in most previous studies of pharmaceuticals. The major compounds detected (amitriptyline, caffeine, DEET, diphenhydramine, erythromycin, fluoxetine/norfluoxetine, gemfibrozil and sertraline) were also predominant in the study by Meador et al.20 (SI Table S7) who used the same analytical methodology and analysed whole fish homogenates. As summarized in SI Table S8, many of these substances have been detected previously in fish in other studies although less frequently in fish plasma. The data for PPCPs detected in water but not in caged or wild fish plasma, as well as comparison of goldfish versus carp, is also of interest and could be investigated further to determine whether there are molecular features that make these PPCPs more readily transformed. In particular, we suspect that the presence of gemfibrozil, erythromycin, and sulfamethazine may have inhibited cytochrome P450 (CYP450) phase-I metabolism50,51. This is discussed further in a companion manuscript33.
Although non-detectable in plasma, other PPCPs may have been detectable in liver which has been shown to have higher concentrations of some pharmaceuticals than plasma or muscle. Nevertheless, analysis of plasma provided data which could be compared directly with HTP concentrations as well as with companion studies on biological effects in caged goldfish from CPM32,33. BAFWBs estimated using the BCF-BAF model did not show good agreement with observed BAFPs even when including biotransformation, illustrating that models that are driven by hydrophobicity are not effective for predicting moderately polar compounds many of which are ionisa-ble at ambient pH. On the other hand the BCF-BAF model is designed to predict BCF and BAF data for whole fish rather than plasma. Modelled PBW and predicted fish plasma concentrations using log D values also did not show good agreement with measured values except for several neutral PPCPs eg triclocarban. However, this approach assumed a simple partitioning between water and plasma based on a log Kow adjusted for ionized species. More complex models, taking into account acidification of the gill surface57 may be needed to better explain bioaccu-mulation of the ionisable PPCPs.
MethodsCaging and sample collection. The caged goldfish (Carassius auratus) were deployed in CPM for 21 days from June 25/26 – July 16/17 2014. Cages were visited weekly, and fish (13/cage) were fed during the visits (20 g/cage). All animal experiments were in accordance with CCAC guidance and approved by the GLLFAS-WSTD Animal Care Committee (Government of Canada). Further details on the caging and preparation of the fish and animal care protocols are provided in Simmons et al.32. Cages were placed in 3 locations representing a gradient of exposure along the plume of the Dundas waste water treatment plant (WWTP) outfall, in the Desjardins Canal (530 m from the WWTP outfall), West Pond (975 m from the WWTP outfall), and McMaster Landing (3850 m from the outfall). A fourth site, Jordan Harbour (JH), a widening of 20 Mile Creek adjacent to Lake Ontario near Jordan ON, served as a reference site. Mass and fork length were measured and recorded. Plasma collection and storage is described in the SI. Plasma of caged goldfish was divided for proteome, metabolome and PPCP analysis. Due to limited volumes, pooled samples of plasma from 25 individual fish (50 µL/individual) was pooled to yield one sample from at each location for PPCP analysis.
Wild fish collections: Goldfish were collected in September 2012 in CPM central marsh using electro fishing and seine nets. Plasma from 9 individual male fish (500 µL/individual) was pooled to yield 3 samples for PPCP analysis. Wild carp (Cyprinus carpio) were collected in September 2011 in CPM and in November 2011 from JH. Plasma from 6 individual carp (2.3–3.5 g) from each location was selected for PPCP analysis. A single sample of plasma from a Brown Bullhead (Ameiurus nebulosus) collected in JH (April 2013) was also included for a compar-ison of the PPCP profile among species. Plasma samples were frozen (−80 °C) until analysis.
Water samples (1 L unfiltered; collected by filling bottles at about 10 cm below the surface) were collected from the CPM and JH in late January/early February 2014 and again in July 2014 coinciding with the goldfish caging study. Samples (N = 4) were collected at the mouth of the Desjardin Canal (CPM1) which includes the effluent from the Dundas municipal WWTP in January-February (N = 4) and in July 2014 (N = 1). Collections in the center of the marsh (site CPM3) were made in January and July 2014. Water samples were also collected in August 2012 from CPM3 and site CPM2 (See SI Information Figure S1 and Table S1). In JH, the water sampling was near the outlet to Lake Ontario (SI Figure S2). Samples collected in August 2012 were frozen (−20 °C) and then defrosted before being shipped to the analytical lab. All samples collected in 2014 were held at 4 °C in the dark until analysed. Samples collected in January 2014 were analysed within 40 days of collection while samples collected in July 2014 were analysed in February 2015, approximately 190 days after collection.
A separate set of water samples was collected at the same time for determination of particulate organic carbon (POC) and dissolved organic carbon (DOC) as well as other basic water chemistry parameters (SI Table S3). Water pH, conductivity, temperature and dissolved oxygen were measured during July field sampling using a YSI multimeter (YSI Inc., Yellow Springs, OH). All samples were kept at 4 °C and in the dark prior to analysis by the National Laboratory for Environmental Testing (Environment Canada, Burlington, ON) following standard protocols58.
PPCP analysis of water and plasma. A total of 20 fish plasma samples from the pooled caged fish (7) and the wild fish (13) along with 12 water samples were selected for analysis. Samples were analysed by SGS AXYS Analytical Services (Sidney BC) using their method MLA-075 (version 6)59 which is a modifica-tion of US EPA Method 169438. This method targeted 127 PPCPs including antibiotics, beta-blockers, anti-depressants, anti-inflammatories, anticonvulsants, and personal care products such as the insect repellent,

www.nature.com/scientificreports/
9SCiEnTifiC REPORTS | 7: 16999 | DOI:10.1038/s41598-017-15462-x
N,N-Diethyl-m-toluamide (DEET), and the antimicrobial, triclocarban. A full list of analytes is provided in Supplementary Information. Mass labelled13C-, or deuterated surrogate internal standards were used for quanti-fication of all analytes via the isotope dilution/surrogate standard quantitation method. Prior to extraction and/or clean-up procedures, aqueous samples were adjusted to pH 2.0, spiked with extraction surrogate standards, then adjusted to pH 4 using tetrasodium ethylenediamine-tetraacetate dihydrate. Plasma samples (2.3–2.5 g) were spiked with extraction surrogate standards, sonicated with 20 mL acetonitrile, then diluted with ultra-pure water to 200 mL. The extracts were cleaned up by solid phase extraction using Oasis HLB cartridges (Waters Ltd. Mississauga ON), filtered, and analyzed by liquid chromatography-electrospray ionization-tandem mass spec-trometry (LC/ESI-MS/MS) in positive or negative ionization mode. The analysis of the complete list of analytes (SI Table S1) required a total of five instrumental runs.
Quality assurance steps included analysis of lab blanks for water and plasma along with matrix recovery spikes. Lab blanks for plasma (N = 2) were all less that detection limits except for 2 compounds. DEET was detected at 0.3–1.6 ng/g and venlafaxine was detected in 1 of 2 at 0.16 ng/g. In water blanks (N = 2) DEET (0.87 ng/L) and erythromycin (2.5 ng/L) were both detected in 1 of 2 blank samples. Detections in blanks were close to the detection limits (SI Table S2). Detection limits (DLs) were defined as lowest calibration level adjusted to the maximal sample size or 3 times the signal of the noise in the target channel converted to an equivalent sample, whichever was greater. DLs ranged from 0.08 ng/L to 500 ng/L (median 3 ng/L) for water and 0.016 to 100 ng/g (median 0.6 ng/g) for plasma. Where analytes were detected in two or more samples of the same species or series of water samples, non-detect values were converted to ½ the DL value for reporting purposes. Concentrations for the series of water samples collected at CPM1, CPM2 and JH in January 2014, as well as for individual wild goldfish and carp were averaged using the ½ the DL values. For 6 compounds, ibuprofen, caffeine, diltiazem, diazepam, amitriptyline, and fluoxetine, parent compounds and transformation products (2-hydroxy-ibuprofen, 1,7-dimethylxanthine, desmethyldiltiazem, oxazepam, 10-hydroxy-amitriptyline, norfluoxetine) were summed for graphical presentation but are tabulated individually in Supplementary Information.
Recoveries of unlabeled standards spiked at 15–300 ng/sample in plasma ranged from 56 to 135% for 117 of 127 compounds; unusually high recoveries (150–259% were seen for 4 compounds and low recoveries (15–50%) for 6. In water samples recoveries ranged from 57 to 119% for 119 of 127 compounds; unusually high recoveries (164–222%) were seen for 2 compounds and low recoveries (24–50%) for 6. Further results for DLs, blanks and matrix recoveries are provided in SI Table S2.
Bioaccumulation calculations. Bioaccumulation factor (BAFP) was calculated as concentration in fish plasma (ng/g × 1000) divided by concentration in water (ng/L). Two widely used modeling approaches for pre-dicting organic contaminant bioaccumulation were assessed: the BCF-BAF model for whole body BAFs53 and the fish-plasma concentration calculation of Huggett et al.35 modified by Berninger et al.54. The latter involves estimating an octanol-water partition coefficient (Kow) adjusted for fraction ionized (log D), using the pKa value to adjust log Kow54 taking into account the pH of CPM waters. Further information on the calculation of log D, blood-water partitioning (PBW), and plasma concentrations (FPC) is given in the SI.
Data availability. All data generated or analysed during this study are included in this published article and in Supplementary Information.
References 1. Andresen, J. A. et al. Emerging pollutants in the north sea in comparison to Lake Ontario, Canada, data. Environ. Toxicol. Chem. 26,
1081–1089 (2007). 2. Metcalfe, C. D., Miao, X. S., Koenig, B. G. & Struger, J. Distribution of acidic and neutral drugs in surface waters near sewage
treatment plants in the lower Great Lakes, Canada. Environ. Toxicol. Chem. 22, 2881–2889 (2003). 3. Lee, H. B., Peart, T. E., Svoboda, M. L. & Backus, S. Occurrence and fate of rosuvastatin, rosuvastatin lactone, and atorvastatin in
Canadian sewage and surface water samples. Chemosphere 77, 1285–1291 (2009). 4. Lee, H. B., Peart, T. E. & Svoboda, M. L. Determination of endocrine-disrupting phenols, acidic pharmaceuticals, and personal-care
products in sewage by solid-phase extraction and gas chromatography-mass spectrometry. Journal of Chromatography A 1094, 122–129 (2005).
5. Li, H., Helm, P. A. & Metcalfe, C. D. Sampling in the great lakes for pharmaceuticals, personal care products, and endocrine-disrupting substances using the passive polar organic chemical integrative sampler. Environ. Toxicol. Chem. 29, 751–762 (2010).
6. Mayer, T. et al. Occurrence of alkylphenolic substances in a Great Lakes coastal marsh, Cootes Paradise, ON, Canada. Environ Pollut 147, 683–690 (2007).
7. Mayer, T. et al. Dispersal of contaminants from municipal discharges as evidenced from sedimentary records in a great lakes coastal wetland, Cootes Paradise, Ontario. Journal of Great Lakes Research 34, 544–558 (2008).
8. Ramirez, A. J. et al. Occurrence of pharmaceuticals and personal care products in fish: Results of a national pilot study in the United States. Environ. Toxicol. Chem. 28, 2587–2597 (2009).
9. Huerta, B., Rodríguez-Mozaz, S. & Barceló, D. Pharmaceuticals in biota in the aquatic environment: Analytical methods and environmental implications. Analytical and Bioanalytical Chemistry 404, 2611–2624 (2012).
10. O’Toole, S. & Metcalfe, C. Synthetic musks in fish from urbanized areas of the lower Great Lakes, Canada. Journal of Great Lakes Research 32, 361–369 (2006).
11. Uslu, M. O., Biswas, N. & Jasim, S. Chemicals of emerging concern In the Great Lakes region. ID696., 73 pp (International Joint Commission, Windsor, ON, 2012).
12. Klečka, G., Persoon, C. & Currie, R. Chemicals of Emerging Concern in the Great Lakes Basin: An Analysis of Environmental Exposures. Reviews of Environmental Contamination and Toxicology 207, 1–92 (2010).
13. Gilroy, È. A. M. et al. Halogenated phenolic compounds in wild fish from Canadian Areas of Concern. Environ. Toxicol. Chem. (2017).
14. Metcalfe, C. D. et al. Antidepressants and their metabolites in municipal wastewater, and downstream exposure in an urban watershed. Environ. Toxicol. Chem. 29, 79–89 (2010).
15. Daughton, C. G. & Ternes, T. A. Pharmaceuticals and personal care products in the environment: Agents of subtle change? Environmental Health Perspectives 107, 907–938 (1999).

www.nature.com/scientificreports/
1 0SCiEnTifiC REPORTS | 7: 16999 | DOI:10.1038/s41598-017-15462-x
16. Du, B., Perez-Hurtado, P., Brooks, B. W. & Chambliss, C. K. Evaluation of an isotope dilution liquid chromatography tandem mass spectrometry method for pharmaceuticals in fish. Journal of Chromatography A 1253, 177–183 (2012).
17. Daughton, C. & Brooks, B. In In: Environmental contaminants in biota. 2nd edn. (eds W. Nelson Beyer & James P. Meador) pp. 286–347 (CRC Press, 2011).
18. Howard, P. H. & Muir, D. C. G. Identifying New Persistent and Bioaccumulative Organics Among Chemicals in Commerce II: Pharmaceuticals. Environmental Science & Technology 45, 6938–6946 (2011).
19. Chu, S. & Metcalfe, C. D. Analysis of paroxetine, fluoxetine and norfluoxetine in fish tissues using pressurized liquid extraction, mixed mode solid phase extraction cleanup and liquid chromatography-tandem mass spectrometry. Journal of Chromatography A 1163, 112–118 (2007).
20. Meador, J. P., Yeh, A., Young, G. & Gallagher, E. P. Contaminants of emerging concern in a large temperate estuary. Environmental Pollution 213, 254–267 (2016).
21. Moreno-González, R., Rodríguez-Mozaz, S., Huerta, B., Barceló, D. & León, V. M. Do pharmaceuticals bioaccumulate in marine molluscs and fish from a coastal lagoon? Environmental Research 146, 282–298 (2016).
22. Álvarez-Muñoz, D. et al. Occurrence of pharmaceuticals and endocrine disrupting compounds in macroalgaes, bivalves, and fish from coastal areas in Europe. Environmental Research 143, 56–64 (2015).
23. Xie, Z. et al. Occurrence, bioaccumulation, and trophic magnification of pharmaceutically active compounds in Taihu Lake, China. Chemosphere 138, 140–147 (2015).
24. Gao, L., Shi, Y., Li, W., Liu, J. & Cai, Y. Occurrence, distribution and bioaccumulation of antibiotics in the Haihe River in China. Journal of Environmental Monitoring 14, 1247–1254 (2012).
25. Tanoue, R. et al. Uptake and Tissue Distribution of Pharmaceuticals and Personal Care Products in Wild Fish from Treated-Wastewater-Impacted Streams. Environmental Science & Technology 49, 11649–11658 (2015).
26. Scott, W. C. et al. Predicted and observed therapeutic dose exceedances of ionizable pharmaceuticals in fish plasma from urban coastal systems. Environ. Toxicol. Chem. 35, 983–995 (2016).
27. Zhao, J.-L. et al. Tissue-specific bioaccumulation of human and veterinary antibiotics in bile, plasma, liver and muscle tissues of wild fish from a highly urbanized region. Environmental Pollution 198, 15–24 (2015).
28. Du, B. et al. Bioaccumulation and trophic dilution of human pharmaceuticals across trophic positions of an effluent-dependent wadeable stream. Philosophical Transactions of the Royal Society B: Biological Sciences 369 (2014).
29. Brooks, B. W. Fish on Prozac (and Zoloft): Ten years later. Aquatic Toxicology 151, 61–67 (2014). 30. Brooks, B. W., Huggett, D. B. & Boxall, A. B. A. Pharmaceuticals and personal care products: Research needs for the next decade.
Environ. Toxicol. Chem. 28, 2469–2472 (2009). 31. Caldwell, D. J., Mastrocco, F., Margiotta-Casaluci, L. & Brooks, B. W. An integrated approach for prioritizing pharmaceuticals found
in the environment for risk assessment, monitoring and advanced research. Chemosphere 115, 4–12 (2014). 32. Simmons, D. et al. Reduced anxiety is associated with the accumulation of six serotonin reuptake inhibitors in wastewater treatment
effluent exposed, goldfish Carassius auratus. Scientific Reports doi:10.1038/s41598-017-15989-z (2017). 33. Simmons, D. et al. Altered expression of metabolites and proteins in wild and caged fish exposed to wastewater effluents in situ.
Scientific Reports, doi:10.1038/s41598-017-12473-6 (2017). 34. Kelton, N., Chow-Fraser, P. & Jordan, I. Relationship between sediment phosphorus release rates and characteristics of the benthic
microbial community in a hypereutrophic marsh. Aquatic Ecosystem Health & Management 7, 31–41 (2004). 35. Huggett, D. B., Cook, J. C., Ericson, J. F. & Williams, R. T. A Theoretical Model for Utilizing Mammalian Pharmacology and Safety
Data to Prioritize Potential Impacts of Human Pharmaceuticals to Fish. Human and Ecological Risk Assessment: An International Journal 9, 1789–1799 (2003).
36. Brown, J. N., Paxéus, N., Förlin, L. & Larsson, D. G. J. Variations in bioconcentration of human pharmaceuticals from sewage effluents into fish blood plasma. Environmental Toxicology and Pharmacology 24, 267–274 (2007).
37. Fick, J. et al. Therapeutic levels of levonorgestrel detected in blood plasma of fish: results from screening rainbow trout exposed to treated sewage effluents. Environmental Science and Technology 44, 2661–2666 (2010).
38. US EPA. Method 1694: Pharmaceuticals and Personal Care Products in Water, Soil, Sediment, and Biosolids by HPLC/MS/MS. EPA-821-R-08-002. (US Environmental Protection Agency, Office of Science and Technology, Engineering and Analysis Division (4303T), Washington, DC, 2007).
39. Chu, S. & Metcalfe, C. D. Simultaneous determination of triclocarban and triclosan in municipal biosolids by liquid chromatography tandem mass spectrometry. Journal of Chromatography A 1164, 212–218 (2007).
40. de Solla, S. R. et al. Bioaccumulation of pharmaceuticals and personal care products in the unionid mussel Lasmigona costata in a river receiving wastewater effluent. Chemosphere 146, 486–496 (2016).
41. Niagara Region. Grimsby Water Treatment Plant System http://www.regional.niagara.on.ca/2041/master-servicing-plan/default.aspx., 2016).
42. Lindholm-Lehto, P. C., Ahkola, H. S. J., Knuutinen, J. S. & Herve, S. H. Widespread occurrence and seasonal variation of pharmaceuticals in surface waters and municipal wastewater treatment plants in central Finland. Environmental Science and Pollution Research 23, 7985–7997 (2016).
43. aus der Beek, T. et al. Pharmaceuticals in the environment—Global occurrences and perspectives. Environmental Toxicology and Chemistry 35, 823–835 (2016).
44. Du, B. et al. Bioaccumulation of human pharmaceuticals in fish across habitats of a tidally influenced urban bayou. Environ. Toxicol. Chem. 35, 966–974 (2016).
45. Overturf, C. L., Overturf, M. D. & Huggett, D. B. Bioconcentration and endocrine disruption effects of diazepam in channel catfish, Ictalurus punctatus. Comp Biochem Physiol C Toxicol Pharmacol 183-184, 46–52 (2016).
46. Zhao, J.-L. et al. Uptake and Disposition of Select Pharmaceuticals by Bluegill Exposed at Constant Concentrations in a Flow-Through Aquatic Exposure System. Environmental Science & Technology 51, 4434–4444 (2017).
47. Nallani, G. C., Paulos, P. M., Constantine, L. A., Venables, B. J. & Huggett, D. B. Bioconcentration of ibuprofen in fathead minnow (Pimephales promelas) and channel catfish (Ictalurus punctatus). Chemosphere 84, 1371–1377 (2011).
48. Hughes, S. R., Kay, P. & Brown, L. E. Global synthesis and critical evaluation of pharmaceutical data sets collected from river systems. Environmental Science and Technology 47, 661–677 (2013).
49. Liu, J. et al. Occurrence, bioaccumulation and risk assessment of lipophilic pharmaceutically active compounds in the downstream rivers of sewage treatment plants. Science of The Total Environment 511, 54–62 (2015).
50. Smith, E. M. et al. In vitro inhibition of cytochrome P450-mediated reactions by gemfibrozil, erythromycin, ciprofloxacin and fluoxetine in fish liver microsomes. Aquatic Toxicology 109, 259–266 (2012).
51. Lyssimachou, A., Thibaut, R., Gisbert, E. & Porte, C. Gemfibrozil modulates cytochrome P450 and peroxisome proliferation-inducible enzymes in the liver of the yellow European eel (Anguilla anguilla). Environmental Science and Pollution Research 21, 862–871 (2014).
52. Donnachie, R. L., Johnson, A. C. & Sumpter, J. P. A rational approach to selecting and ranking some pharmaceuticals of concern for the aquatic environment and their relative importance compared with other chemicals. Environ. Toxicol. Chem. (2015).
53. US EPA. Exposure Assessment Tools and Models, Estimation Program Interface (EPI) Suite Ver 4.1. (US Environmental Protection Agency, Office of Pollution Prevention and Toxics, Washington, DC, 2011).

www.nature.com/scientificreports/
1 1SCiEnTifiC REPORTS | 7: 16999 | DOI:10.1038/s41598-017-15462-x
54. Berninger, J. P. et al. Effects of the antihistamine diphenhydramine on selected aquatic organisms. Environ. Toxicol. Chem. 30, 2065–2072 (2011).
55. Arnot, J. A. et al. A quantitative structure-activity relationship for predicting metabolic biotransformation rates for organic chemicals in fish. Environ. Toxicol. Chem. 28, 1168–1177 (2009).
56. Schulz, M., Iwersen-Bergmann, S., Andresen, H. & Schmoldt, A. Therapeutic and toxic blood concentrations of nearly 1,000 drugs and other xenobiotics. Critical Care 16, 1–4 (2012).
57. Nichols, J. W. et al. Observed and modeled effects of pH on bioconcentration of diphenhydramine, a weakly basic pharmaceutical, in fathead minnows. Environ. Toxicol. Chem. 34, 1425–1435 (2015).
58. Environment Canada. Major Ions and Nutrients, vol. 1. (National Laboratory for Environmental Testing, Burlington, ON, Canada, 1994).
59. AXYS. Method MLA-075: Analysis of pharmaceutical and personal care products and hormones in solid, aqueous, tissue and POCISs samples by LC-MS/MS. (AXYS Analytical Services Ltd, Sidney, BC, 2015).
60. Berninger, J. P. & Brooks, B. W. Leveraging mammalian pharmaceutical toxicology and pharmacology data to predict chronic fish responses to pharmaceuticals. Toxicology Letters 193, 69–78 (2010).
AcknowledgementsFunding for this study was provided in part by the Government of Canada’s Great Lakes Action Plan. We thank the Royal Botanical Gardens for permission to work in Cootes Paradise. We thank Natural Resources Canada, Atlas of Canada, for permission to use map information for Cootes Paradise and Jordan Harbour under the Open Government Licence – Canada (Figs S1 and S2).
Author ContributionsDCGM arranged for chemical analyses and prepared the manuscript. J.S. and D.S. designed the study. T.P., M.V. and J.M. conducted field work. X.W. coordinated PPCP analysis and water chemistry.
Additional InformationSupplementary information accompanies this paper at https://doi.org/10.1038/s41598-017-15462-x.Competing Interests: The authors declare that they have no competing interests.Publisher's note: Springer Nature remains neutral with regard to jurisdictional claims in published maps and institutional affiliations.
Open Access This article is licensed under a Creative Commons Attribution 4.0 International License, which permits use, sharing, adaptation, distribution and reproduction in any medium or
format, as long as you give appropriate credit to the original author(s) and the source, provide a link to the Cre-ative Commons license, and indicate if changes were made. The images or other third party material in this article are included in the article’s Creative Commons license, unless indicated otherwise in a credit line to the material. If material is not included in the article’s Creative Commons license and your intended use is not per-mitted by statutory regulation or exceeds the permitted use, you will need to obtain permission directly from the copyright holder. To view a copy of this license, visit http://creativecommons.org/licenses/by/4.0/. © The Author(s) 2017

Reproduced with permission of copyright owner. Further reproductionprohibited without permission.


![Laboratory-Based Bioaccumulation Essay for Elements ... · in aquatic environment, including bioaccumulation [10]. Thus, this laboratory-based study assessed the bioaccumulation of](https://img.pdfslide.us/doc/110x75/5f0813d47e708231d42038a6/laboratory-based-bioaccumulation-essay-for-elements-in-aquatic-environment.jpg)


![Residues of some organic pollutants, their bioaccumulation ......Bioaccumulation is the net result of competing processes of absorption, ingestion, digestion, and excretion [22]. Bioaccumulation](https://img.pdfslide.us/doc/110x75/60fbc786322fe552715ef131/residues-of-some-organic-pollutants-their-bioaccumulation-bioaccumulation.jpg)